Zip Codes with the Highest Percentage of Households with Income Above $100,000 in Delaware
RELATED REPORTS & OPTIONS
Household Income | $100k+
Delaware
Compare Zip Codes
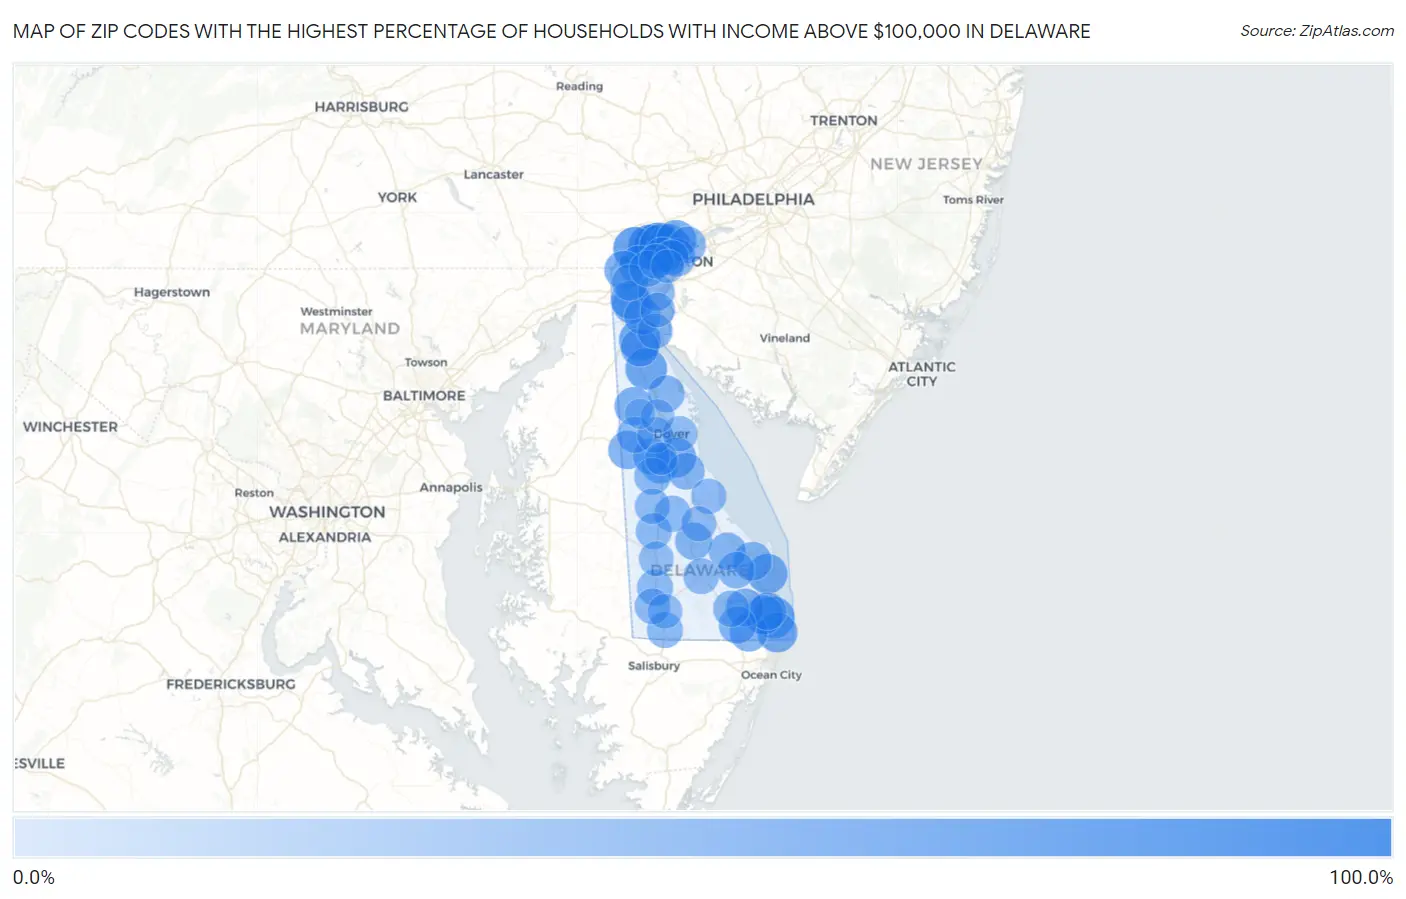
Map of Zip Codes with the Highest Percentage of Households with Income Above $100,000 in Delaware
0.0%
100.0%
Zip Codes with the Highest Percentage of Households with Income Above $100,000 in Delaware
| Zip Code | Households with Income > $100k | vs State | vs National | |
| 1. | 19710 | 100.0% | 38.6%(+61.4)#1 | 37.3%(+62.7)#111 |
| 2. | 19807 | 68.3% | 38.6%(+29.7)#2 | 37.3%(+31.0)#1,132 |
| 3. | 19707 | 68.2% | 38.6%(+29.6)#3 | 37.3%(+30.9)#1,139 |
| 4. | 19930 | 60.4% | 38.6%(+21.8)#4 | 37.3%(+23.1)#2,295 |
| 5. | 19709 | 60.3% | 38.6%(+21.7)#5 | 37.3%(+23.0)#2,301 |
| 6. | 19803 | 59.8% | 38.6%(+21.2)#6 | 37.3%(+22.5)#2,408 |
| 7. | 19734 | 59.3% | 38.6%(+20.7)#7 | 37.3%(+22.0)#2,506 |
| 8. | 19732 | 59.0% | 38.6%(+20.4)#8 | 37.3%(+21.7)#2,577 |
| 9. | 19701 | 51.7% | 38.6%(+13.1)#9 | 37.3%(+14.4)#4,327 |
| 10. | 19810 | 51.1% | 38.6%(+12.5)#10 | 37.3%(+13.8)#4,507 |
| 11. | 19971 | 50.6% | 38.6%(+12.0)#11 | 37.3%(+13.3)#4,661 |
| 12. | 19944 | 50.3% | 38.6%(+11.7)#12 | 37.3%(+13.0)#4,761 |
| 13. | 19962 | 49.6% | 38.6%(+11.0)#13 | 37.3%(+12.3)#4,986 |
| 14. | 19808 | 45.3% | 38.6%(+6.70)#14 | 37.3%(+8.00)#6,493 |
| 15. | 19958 | 44.4% | 38.6%(+5.80)#15 | 37.3%(+7.10)#6,848 |
| 16. | 19967 | 44.4% | 38.6%(+5.80)#16 | 37.3%(+7.10)#6,867 |
| 17. | 19711 | 44.1% | 38.6%(+5.50)#17 | 37.3%(+6.80)#6,954 |
| 18. | 19702 | 43.4% | 38.6%(+4.80)#18 | 37.3%(+6.10)#7,237 |
| 19. | 19964 | 42.8% | 38.6%(+4.20)#19 | 37.3%(+5.50)#7,543 |
| 20. | 19809 | 42.7% | 38.6%(+4.10)#20 | 37.3%(+5.40)#7,579 |
| 21. | 19938 | 42.5% | 38.6%(+3.90)#21 | 37.3%(+5.20)#7,682 |
| 22. | 19730 | 41.9% | 38.6%(+3.30)#22 | 37.3%(+4.60)#7,973 |
| 23. | 19806 | 40.5% | 38.6%(+1.90)#23 | 37.3%(+3.20)#8,669 |
| 24. | 19975 | 40.5% | 38.6%(+1.90)#24 | 37.3%(+3.20)#8,670 |
| 25. | 19939 | 39.7% | 38.6%(+1.10)#25 | 37.3%(+2.40)#9,077 |
| 26. | 19970 | 38.9% | 38.6%(+0.300)#26 | 37.3%(+1.60)#9,474 |
| 27. | 19945 | 37.8% | 38.6%(-0.800)#27 | 37.3%(+0.500)#10,106 |
| 28. | 19968 | 37.1% | 38.6%(-1.50)#28 | 37.3%(-0.200)#10,488 |
| 29. | 19941 | 36.2% | 38.6%(-2.40)#29 | 37.3%(-1.10)#11,046 |
| 30. | 19979 | 35.9% | 38.6%(-2.70)#30 | 37.3%(-1.40)#11,237 |
| 31. | 19703 | 35.3% | 38.6%(-3.30)#31 | 37.3%(-2.00)#11,594 |
| 32. | 19946 | 34.8% | 38.6%(-3.80)#32 | 37.3%(-2.50)#11,906 |
| 33. | 19733 | 34.7% | 38.6%(-3.90)#33 | 37.3%(-2.60)#12,000 |
| 34. | 19977 | 34.6% | 38.6%(-4.00)#34 | 37.3%(-2.70)#12,016 |
| 35. | 19951 | 34.0% | 38.6%(-4.60)#35 | 37.3%(-3.30)#12,453 |
| 36. | 19720 | 33.9% | 38.6%(-4.70)#36 | 37.3%(-3.40)#12,486 |
| 37. | 19934 | 33.9% | 38.6%(-4.70)#37 | 37.3%(-3.40)#12,503 |
| 38. | 19943 | 33.7% | 38.6%(-4.90)#38 | 37.3%(-3.60)#12,644 |
| 39. | 19713 | 32.4% | 38.6%(-6.20)#39 | 37.3%(-4.90)#13,531 |
| 40. | 19966 | 31.8% | 38.6%(-6.80)#40 | 37.3%(-5.50)#14,012 |
| 41. | 19953 | 31.3% | 38.6%(-7.30)#41 | 37.3%(-6.00)#14,399 |
| 42. | 19954 | 31.3% | 38.6%(-7.30)#42 | 37.3%(-6.00)#14,423 |
| 43. | 19804 | 30.9% | 38.6%(-7.70)#43 | 37.3%(-6.40)#14,724 |
| 44. | 19973 | 30.1% | 38.6%(-8.50)#44 | 37.3%(-7.20)#15,367 |
| 45. | 19950 | 30.1% | 38.6%(-8.50)#45 | 37.3%(-7.20)#15,386 |
| 46. | 19940 | 30.0% | 38.6%(-8.60)#46 | 37.3%(-7.30)#15,462 |
| 47. | 19947 | 29.2% | 38.6%(-9.40)#47 | 37.3%(-8.10)#16,067 |
| 48. | 19904 | 29.1% | 38.6%(-9.50)#48 | 37.3%(-8.20)#16,152 |
| 49. | 19931 | 28.1% | 38.6%(-10.5)#49 | 37.3%(-9.20)#17,091 |
| 50. | 19952 | 26.9% | 38.6%(-11.7)#50 | 37.3%(-10.4)#18,073 |
| 51. | 19963 | 26.4% | 38.6%(-12.2)#51 | 37.3%(-10.9)#18,507 |
| 52. | 19731 | 26.3% | 38.6%(-12.3)#52 | 37.3%(-11.0)#18,685 |
| 53. | 19960 | 26.2% | 38.6%(-12.4)#53 | 37.3%(-11.1)#18,716 |
| 54. | 19901 | 25.8% | 38.6%(-12.8)#54 | 37.3%(-11.5)#19,042 |
| 55. | 19802 | 25.4% | 38.6%(-13.2)#55 | 37.3%(-11.9)#19,390 |
| 56. | 19933 | 24.2% | 38.6%(-14.4)#56 | 37.3%(-13.1)#20,497 |
| 57. | 19805 | 24.0% | 38.6%(-14.6)#57 | 37.3%(-13.3)#20,644 |
| 58. | 19706 | 23.8% | 38.6%(-14.8)#58 | 37.3%(-13.5)#20,865 |
| 59. | 19956 | 23.0% | 38.6%(-15.6)#59 | 37.3%(-14.3)#21,569 |
| 60. | 19936 | 19.4% | 38.6%(-19.2)#60 | 37.3%(-17.9)#24,579 |
| 61. | 19801 | 17.1% | 38.6%(-21.5)#61 | 37.3%(-20.2)#26,159 |
| 62. | 19980 | 12.3% | 38.6%(-26.3)#62 | 37.3%(-25.0)#28,930 |
| 63. | 19955 | 1.1% | 38.6%(-37.5)#63 | 37.3%(-36.2)#31,492 |
1
Common Questions
What are the Top 10 Zip Codes with the Highest Percentage of Households with Income Above $100,000 in Delaware?
Top 10 Zip Codes with the Highest Percentage of Households with Income Above $100,000 in Delaware are:
What zip code has the Highest Percentage of Households with Income Above $100,000 in Delaware?
19710 has the Highest Percentage of Households with Income Above $100,000 in Delaware with 100.0%.
What is the Percentage of Households with Income Above $100,000 in the State of Delaware?
Percentage of Households with Income Above $100,000 in Delaware is 38.6%.
What is the Percentage of Households with Income Above $100,000 in the United States?
Percentage of Households with Income Above $100,000 in the United States is 37.3%.