Zip Codes with the Highest Percentage of Population Taking Taxi / Cab to Work in Delaware
RELATED REPORTS & OPTIONS
Taxi / Cab
Delaware
Compare Zip Codes
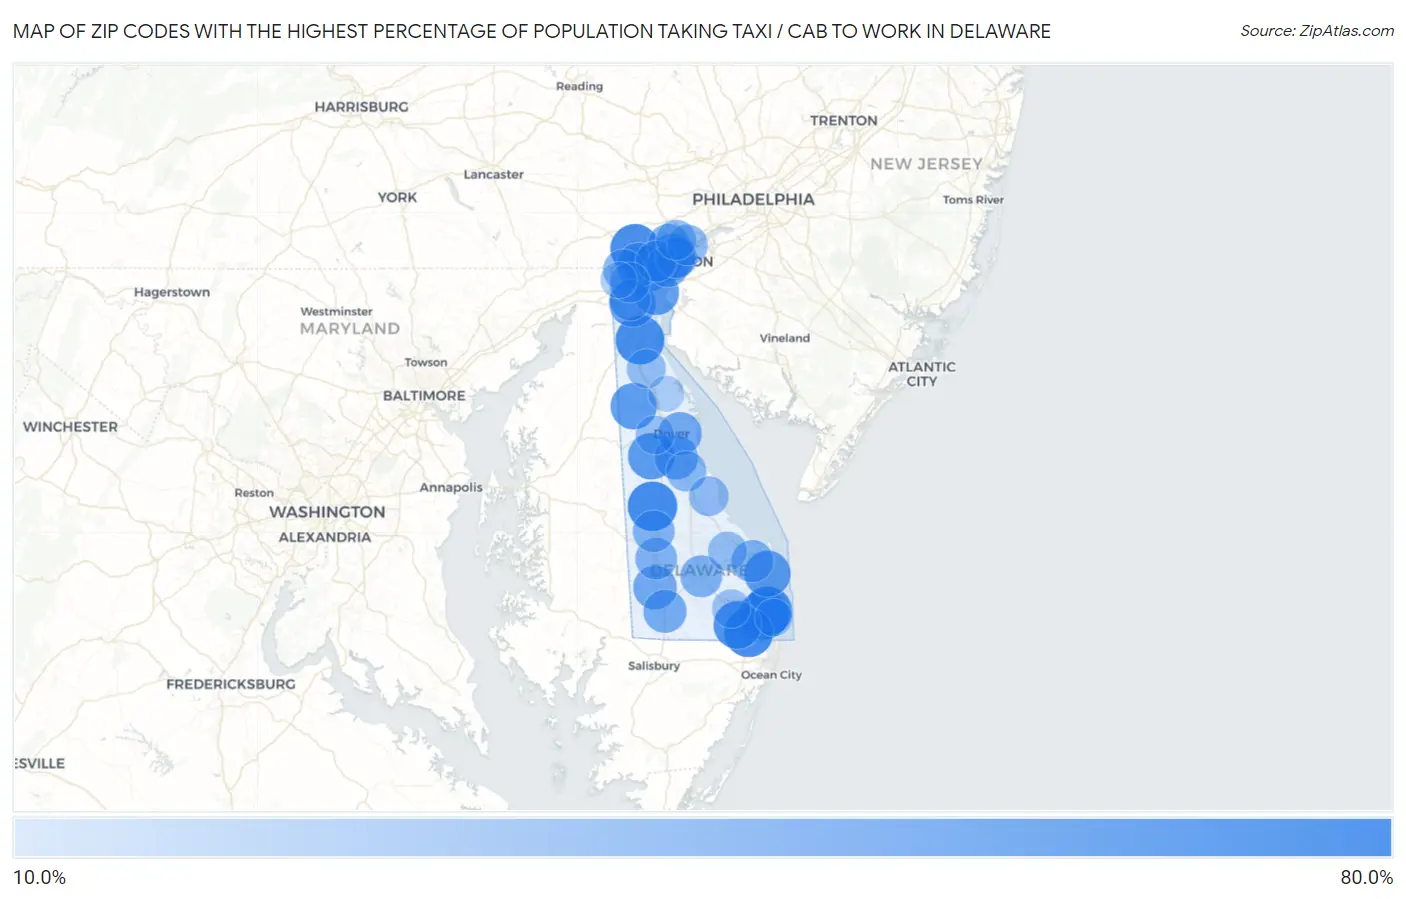
Map of Zip Codes with the Highest Percentage of Population Taking Taxi / Cab to Work in Delaware
10.0%
80.0%
Zip Codes with the Highest Percentage of Population Taking Taxi / Cab to Work in Delaware
| Zip Code | % Take Taxi / Cab | vs State | vs National | |
| 1. | 19952 | 60.1% | 38.4%(+21.7)#1 | 38.2%(+21.9)#660 |
| 2. | 19967 | 59.7% | 38.4%(+21.3)#2 | 38.2%(+21.5)#701 |
| 3. | 19970 | 59.5% | 38.4%(+21.1)#3 | 38.2%(+21.3)#733 |
| 4. | 19707 | 59.4% | 38.4%(+21.0)#4 | 38.2%(+21.2)#753 |
| 5. | 19975 | 58.9% | 38.4%(+20.5)#5 | 38.2%(+20.7)#856 |
| 6. | 19709 | 58.2% | 38.4%(+19.8)#6 | 38.2%(+20.0)#957 |
| 7. | 19945 | 55.0% | 38.4%(+16.6)#7 | 38.2%(+16.8)#1,616 |
| 8. | 19802 | 51.3% | 38.4%(+12.9)#8 | 38.2%(+13.1)#2,572 |
| 9. | 19804 | 50.4% | 38.4%(+12.0)#9 | 38.2%(+12.2)#2,828 |
| 10. | 19934 | 50.4% | 38.4%(+12.0)#10 | 38.2%(+12.2)#2,833 |
| 11. | 19701 | 50.1% | 38.4%(+11.7)#11 | 38.2%(+11.9)#2,937 |
| 12. | 19971 | 50.0% | 38.4%(+11.6)#12 | 38.2%(+11.8)#2,976 |
| 13. | 19938 | 50.0% | 38.4%(+11.6)#13 | 38.2%(+11.8)#2,980 |
| 14. | 19720 | 47.9% | 38.4%(+9.50)#14 | 38.2%(+9.70)#3,641 |
| 15. | 19808 | 44.5% | 38.4%(+6.10)#15 | 38.2%(+6.30)#4,810 |
| 16. | 19962 | 41.8% | 38.4%(+3.40)#16 | 38.2%(+3.60)#5,818 |
| 17. | 19973 | 41.6% | 38.4%(+3.20)#17 | 38.2%(+3.40)#5,906 |
| 18. | 19901 | 41.1% | 38.4%(+2.70)#18 | 38.2%(+2.90)#6,104 |
| 19. | 19956 | 40.1% | 38.4%(+1.70)#19 | 38.2%(+1.90)#6,590 |
| 20. | 19803 | 37.5% | 38.4%(-0.900)#20 | 38.2%(-0.700)#7,728 |
| 21. | 19958 | 37.1% | 38.4%(-1.30)#21 | 38.2%(-1.10)#7,899 |
| 22. | 19801 | 36.3% | 38.4%(-2.10)#22 | 38.2%(-1.90)#8,322 |
| 23. | 19947 | 36.1% | 38.4%(-2.30)#23 | 38.2%(-2.10)#8,392 |
| 24. | 19933 | 35.9% | 38.4%(-2.50)#24 | 38.2%(-2.30)#8,479 |
| 25. | 19950 | 35.9% | 38.4%(-2.50)#25 | 38.2%(-2.30)#8,482 |
| 26. | 19711 | 34.8% | 38.4%(-3.60)#26 | 38.2%(-3.40)#8,957 |
| 27. | 19809 | 34.5% | 38.4%(-3.90)#27 | 38.2%(-3.70)#9,141 |
| 28. | 19702 | 34.4% | 38.4%(-4.00)#28 | 38.2%(-3.80)#9,168 |
| 29. | 19805 | 33.7% | 38.4%(-4.70)#29 | 38.2%(-4.50)#9,474 |
| 30. | 19703 | 32.6% | 38.4%(-5.80)#30 | 38.2%(-5.60)#9,964 |
| 31. | 19713 | 31.5% | 38.4%(-6.90)#31 | 38.2%(-6.70)#10,364 |
| 32. | 19810 | 31.3% | 38.4%(-7.10)#32 | 38.2%(-6.90)#10,437 |
| 33. | 19946 | 31.2% | 38.4%(-7.20)#33 | 38.2%(-7.00)#10,477 |
| 34. | 19963 | 29.3% | 38.4%(-9.10)#34 | 38.2%(-8.90)#11,185 |
| 35. | 19968 | 27.7% | 38.4%(-10.7)#35 | 38.2%(-10.5)#11,645 |
| 36. | 19734 | 27.7% | 38.4%(-10.7)#36 | 38.2%(-10.5)#11,648 |
| 37. | 19904 | 26.6% | 38.4%(-11.8)#37 | 38.2%(-11.6)#11,928 |
| 38. | 19966 | 25.8% | 38.4%(-12.6)#38 | 38.2%(-12.4)#12,066 |
| 39. | 19930 | 23.1% | 38.4%(-15.3)#39 | 38.2%(-15.1)#12,605 |
| 40. | 19717 | 19.3% | 38.4%(-19.1)#40 | 38.2%(-18.9)#13,126 |
| 41. | 19977 | 17.8% | 38.4%(-20.6)#41 | 38.2%(-20.4)#13,210 |
1
Common Questions
What are the Top 10 Zip Codes with the Highest Percentage of Population Taking Taxi / Cab to Work in Delaware?
Top 10 Zip Codes with the Highest Percentage of Population Taking Taxi / Cab to Work in Delaware are:
What zip code has the Highest Percentage of Population Taking Taxi / Cab to Work in Delaware?
19952 has the Highest Percentage of Population Taking Taxi / Cab to Work in Delaware with 60.1%.
What is the Percentage of Population Taking Taxi / Cab to Work in the State of Delaware?
Percentage of Population Taking Taxi / Cab to Work in Delaware is 38.4%.
What is the Percentage of Population Taking Taxi / Cab to Work in the United States?
Percentage of Population Taking Taxi / Cab to Work in the United States is 38.2%.