Zip Codes with the Highest Percentage of Population Employed in Agriculture, Fishing & Hunting in Delaware
RELATED REPORTS & OPTIONS
Agriculture, Fishing & Hunting
Delaware
Compare Zip Codes
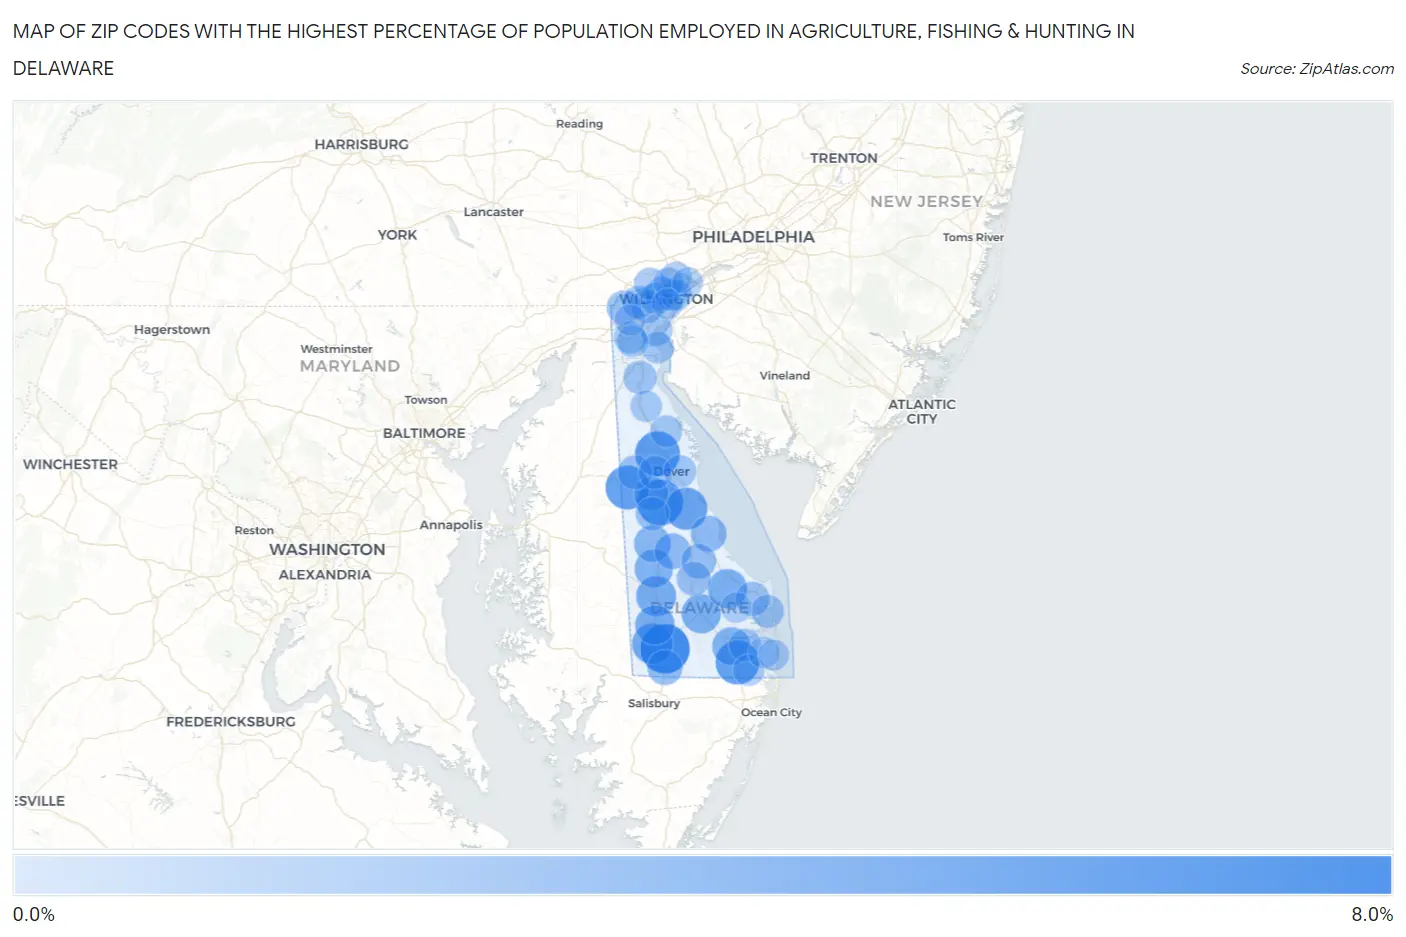
Map of Zip Codes with the Highest Percentage of Population Employed in Agriculture, Fishing & Hunting in Delaware
0.0%
8.0%
Zip Codes with the Highest Percentage of Population Employed in Agriculture, Fishing & Hunting in Delaware
| Zip Code | % Employed | vs State | vs National | |
| 1. | 19956 | 6.2% | 1.0%(+5.17)#1 | 1.2%(+5.01)#6,731 |
| 2. | 19979 | 5.1% | 1.0%(+4.06)#2 | 1.2%(+3.90)#7,721 |
| 3. | 19936 | 4.7% | 1.0%(+3.63)#3 | 1.2%(+3.47)#8,220 |
| 4. | 19964 | 4.4% | 1.0%(+3.33)#4 | 1.2%(+3.17)#8,559 |
| 5. | 19945 | 4.4% | 1.0%(+3.32)#5 | 1.2%(+3.16)#8,571 |
| 6. | 19946 | 3.8% | 1.0%(+2.80)#6 | 1.2%(+2.64)#9,238 |
| 7. | 19931 | 3.4% | 1.0%(+2.32)#7 | 1.2%(+2.16)#9,957 |
| 8. | 19933 | 3.1% | 1.0%(+2.06)#8 | 1.2%(+1.90)#10,377 |
| 9. | 19973 | 3.0% | 1.0%(+1.92)#9 | 1.2%(+1.76)#10,648 |
| 10. | 19947 | 2.9% | 1.0%(+1.82)#10 | 1.2%(+1.66)#10,826 |
| 11. | 19968 | 2.8% | 1.0%(+1.81)#11 | 1.2%(+1.65)#10,849 |
| 12. | 19950 | 2.6% | 1.0%(+1.53)#12 | 1.2%(+1.37)#11,435 |
| 13. | 19966 | 2.5% | 1.0%(+1.43)#13 | 1.2%(+1.27)#11,647 |
| 14. | 19952 | 2.1% | 1.0%(+1.06)#14 | 1.2%(+0.902)#12,500 |
| 15. | 19963 | 1.8% | 1.0%(+0.746)#15 | 1.2%(+0.585)#13,382 |
| 16. | 19954 | 1.8% | 1.0%(+0.735)#16 | 1.2%(+0.574)#13,417 |
| 17. | 19940 | 1.5% | 1.0%(+0.497)#17 | 1.2%(+0.336)#14,183 |
| 18. | 19960 | 1.4% | 1.0%(+0.370)#18 | 1.2%(+0.209)#14,606 |
| 19. | 19934 | 1.3% | 1.0%(+0.269)#19 | 1.2%(+0.108)#14,997 |
| 20. | 19953 | 1.2% | 1.0%(+0.174)#20 | 1.2%(+0.014)#15,349 |
| 21. | 19941 | 1.2% | 1.0%(+0.153)#21 | 1.2%(-0.008)#15,421 |
| 22. | 19958 | 1.2% | 1.0%(+0.145)#22 | 1.2%(-0.016)#15,453 |
| 23. | 19711 | 1.2% | 1.0%(+0.124)#23 | 1.2%(-0.037)#15,551 |
| 24. | 19943 | 1.1% | 1.0%(+0.055)#24 | 1.2%(-0.106)#15,817 |
| 25. | 19806 | 1.00% | 1.0%(-0.043)#25 | 1.2%(-0.204)#16,242 |
| 26. | 19709 | 0.96% | 1.0%(-0.074)#26 | 1.2%(-0.235)#16,384 |
| 27. | 19804 | 0.94% | 1.0%(-0.099)#27 | 1.2%(-0.260)#16,500 |
| 28. | 19904 | 0.92% | 1.0%(-0.123)#28 | 1.2%(-0.284)#16,634 |
| 29. | 19808 | 0.89% | 1.0%(-0.150)#29 | 1.2%(-0.310)#16,773 |
| 30. | 19971 | 0.85% | 1.0%(-0.184)#30 | 1.2%(-0.345)#16,952 |
| 31. | 19939 | 0.72% | 1.0%(-0.319)#31 | 1.2%(-0.480)#17,732 |
| 32. | 19901 | 0.70% | 1.0%(-0.335)#32 | 1.2%(-0.496)#17,832 |
| 33. | 19805 | 0.62% | 1.0%(-0.421)#33 | 1.2%(-0.581)#18,364 |
| 34. | 19720 | 0.60% | 1.0%(-0.443)#34 | 1.2%(-0.604)#18,516 |
| 35. | 19702 | 0.57% | 1.0%(-0.472)#35 | 1.2%(-0.633)#18,723 |
| 36. | 19807 | 0.56% | 1.0%(-0.476)#36 | 1.2%(-0.637)#18,751 |
| 37. | 19706 | 0.56% | 1.0%(-0.482)#37 | 1.2%(-0.643)#18,800 |
| 38. | 19977 | 0.53% | 1.0%(-0.507)#38 | 1.2%(-0.667)#18,993 |
| 39. | 19802 | 0.43% | 1.0%(-0.605)#39 | 1.2%(-0.766)#19,862 |
| 40. | 19701 | 0.43% | 1.0%(-0.610)#40 | 1.2%(-0.771)#19,913 |
| 41. | 19809 | 0.40% | 1.0%(-0.642)#41 | 1.2%(-0.803)#20,195 |
| 42. | 19734 | 0.39% | 1.0%(-0.650)#42 | 1.2%(-0.810)#20,259 |
| 43. | 19975 | 0.34% | 1.0%(-0.695)#43 | 1.2%(-0.856)#20,710 |
| 44. | 19810 | 0.33% | 1.0%(-0.707)#44 | 1.2%(-0.868)#20,837 |
| 45. | 19967 | 0.31% | 1.0%(-0.728)#45 | 1.2%(-0.888)#21,047 |
| 46. | 19713 | 0.23% | 1.0%(-0.806)#46 | 1.2%(-0.967)#21,967 |
| 47. | 19930 | 0.21% | 1.0%(-0.830)#47 | 1.2%(-0.991)#22,253 |
| 48. | 19803 | 0.15% | 1.0%(-0.892)#48 | 1.2%(-1.05)#23,059 |
| 49. | 19951 | 0.11% | 1.0%(-0.928)#49 | 1.2%(-1.09)#23,531 |
| 50. | 19703 | 0.082% | 1.0%(-0.957)#50 | 1.2%(-1.12)#23,936 |
| 51. | 19801 | 0.078% | 1.0%(-0.961)#51 | 1.2%(-1.12)#23,989 |
1
Common Questions
What are the Top 10 Zip Codes with the Highest Percentage of Population Employed in Agriculture, Fishing & Hunting in Delaware?
Top 10 Zip Codes with the Highest Percentage of Population Employed in Agriculture, Fishing & Hunting in Delaware are:
What zip code has the Highest Percentage of Population Employed in Agriculture, Fishing & Hunting in Delaware?
19956 has the Highest Percentage of Population Employed in Agriculture, Fishing & Hunting in Delaware with 6.2%.
What is the Percentage of Population Employed in Agriculture, Fishing & Hunting in the State of Delaware?
Percentage of Population Employed in Agriculture, Fishing & Hunting in Delaware is 1.0%.
What is the Percentage of Population Employed in Agriculture, Fishing & Hunting in the United States?
Percentage of Population Employed in Agriculture, Fishing & Hunting in the United States is 1.2%.