Zip Codes with the Highest Percentage of Population Employed in Administrative & Support Services in San Jose, CA
RELATED REPORTS & OPTIONS
Administrative & Support Services
San Jose
Compare Zip Codes
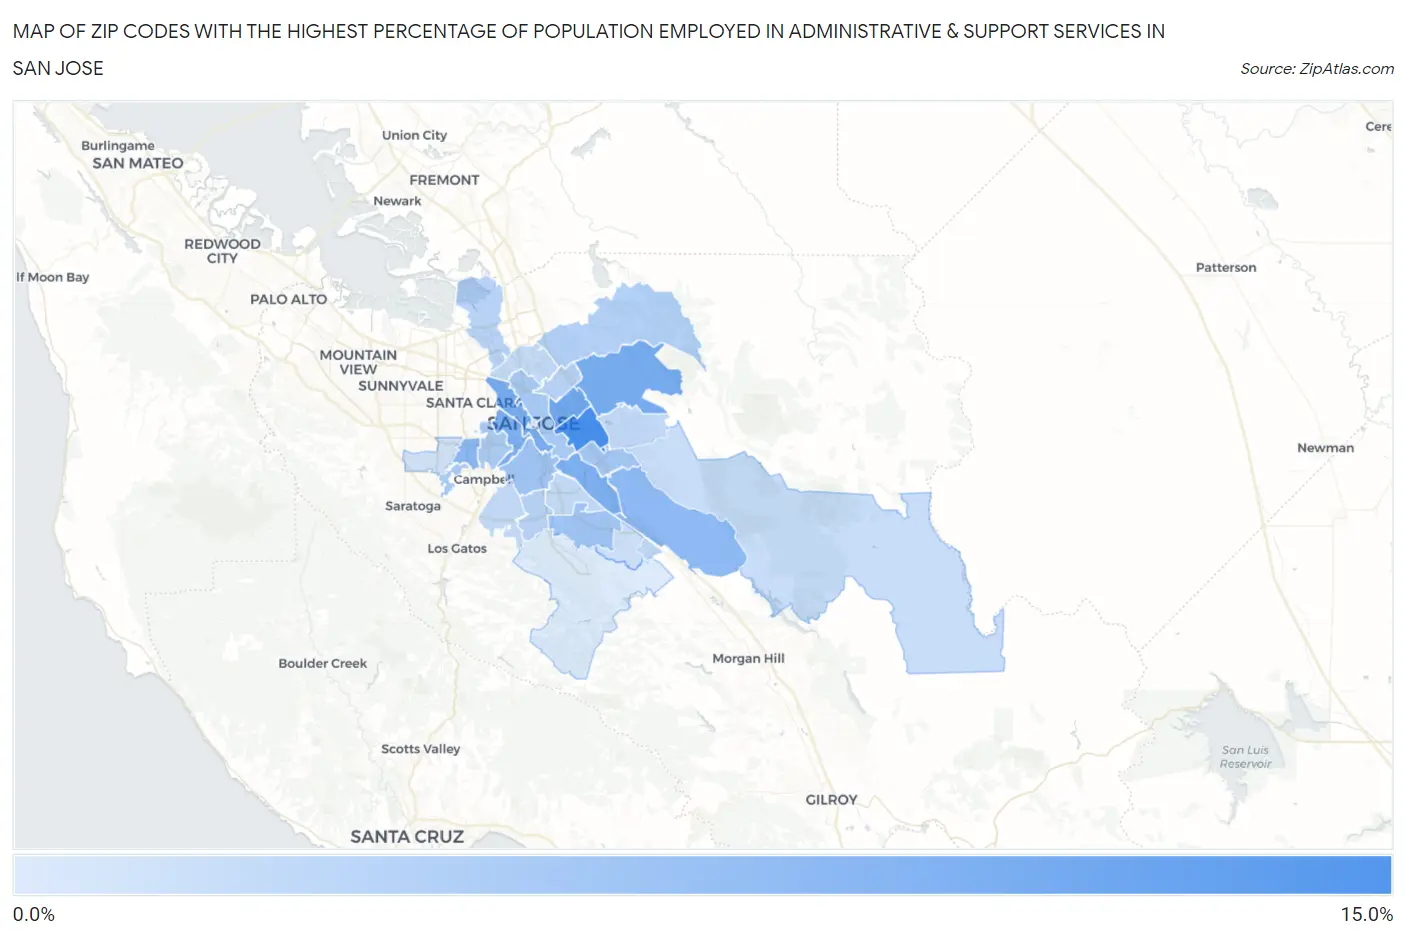
Map of Zip Codes with the Highest Percentage of Population Employed in Administrative & Support Services in San Jose
1.7%
10.3%
Zip Codes with the Highest Percentage of Population Employed in Administrative & Support Services in San Jose, CA
| Zip Code | % Employed | vs State | vs National | |
| 1. | 95122 | 10.3% | 4.6%(+5.74)#81 | 4.1%(+6.16)#1,196 |
| 2. | 95116 | 7.9% | 4.6%(+3.35)#157 | 4.1%(+3.77)#2,334 |
| 3. | 95127 | 7.4% | 4.6%(+2.84)#191 | 4.1%(+3.26)#2,783 |
| 4. | 95110 | 7.3% | 4.6%(+2.69)#201 | 4.1%(+3.11)#2,918 |
| 5. | 95126 | 7.1% | 4.6%(+2.54)#217 | 4.1%(+2.96)#3,077 |
| 6. | 95111 | 7.1% | 4.6%(+2.54)#219 | 4.1%(+2.96)#3,087 |
| 7. | 95117 | 6.2% | 4.6%(+1.62)#318 | 4.1%(+2.04)#4,429 |
| 8. | 95138 | 6.1% | 4.6%(+1.50)#334 | 4.1%(+1.91)#4,655 |
| 9. | 95123 | 5.1% | 4.6%(+0.519)#505 | 4.1%(+0.938)#6,881 |
| 10. | 95125 | 5.1% | 4.6%(+0.502)#509 | 4.1%(+0.922)#6,918 |
| 11. | 95121 | 4.8% | 4.6%(+0.243)#583 | 4.1%(+0.663)#7,685 |
| 12. | 95112 | 4.6% | 4.6%(+0.055)#626 | 4.1%(+0.474)#8,290 |
| 13. | 95130 | 4.5% | 4.6%(-0.118)#666 | 4.1%(+0.301)#8,875 |
| 14. | 95128 | 4.4% | 4.6%(-0.208)#693 | 4.1%(+0.211)#9,237 |
| 15. | 95132 | 4.0% | 4.6%(-0.561)#781 | 4.1%(-0.142)#10,659 |
| 16. | 95134 | 3.8% | 4.6%(-0.764)#836 | 4.1%(-0.345)#11,509 |
| 17. | 95133 | 3.8% | 4.6%(-0.799)#845 | 4.1%(-0.379)#11,676 |
| 18. | 95118 | 3.7% | 4.6%(-0.838)#851 | 4.1%(-0.419)#11,864 |
| 19. | 95139 | 3.4% | 4.6%(-1.18)#957 | 4.1%(-0.758)#13,479 |
| 20. | 95148 | 3.2% | 4.6%(-1.35)#1,005 | 4.1%(-0.926)#14,359 |
| 21. | 95131 | 3.2% | 4.6%(-1.40)#1,022 | 4.1%(-0.981)#14,634 |
| 22. | 95136 | 3.1% | 4.6%(-1.42)#1,028 | 4.1%(-1.00)#14,752 |
| 23. | 95124 | 3.1% | 4.6%(-1.46)#1,036 | 4.1%(-1.04)#14,955 |
| 24. | 95135 | 2.9% | 4.6%(-1.69)#1,119 | 4.1%(-1.27)#16,077 |
| 25. | 95119 | 2.6% | 4.6%(-2.02)#1,190 | 4.1%(-1.60)#17,865 |
| 26. | 95129 | 2.4% | 4.6%(-2.18)#1,236 | 4.1%(-1.76)#18,705 |
| 27. | 95113 | 1.8% | 4.6%(-2.78)#1,365 | 4.1%(-2.36)#21,580 |
| 28. | 95120 | 1.7% | 4.6%(-2.87)#1,378 | 4.1%(-2.45)#21,982 |
1
Common Questions
What are the Top 10 Zip Codes with the Highest Percentage of Population Employed in Administrative & Support Services in San Jose, CA?
Top 10 Zip Codes with the Highest Percentage of Population Employed in Administrative & Support Services in San Jose, CA are:
What zip code has the Highest Percentage of Population Employed in Administrative & Support Services in San Jose, CA?
95122 has the Highest Percentage of Population Employed in Administrative & Support Services in San Jose, CA with 10.3%.
What is the Percentage of Population Employed in Administrative & Support Services in San Jose, CA?
Percentage of Population Employed in Administrative & Support Services in San Jose is 5.0%.
What is the Percentage of Population Employed in Administrative & Support Services in California?
Percentage of Population Employed in Administrative & Support Services in California is 4.6%.
What is the Percentage of Population Employed in Administrative & Support Services in the United States?
Percentage of Population Employed in Administrative & Support Services in the United States is 4.1%.