Zip Codes with the Most Immigrants from Asia in San Jose, CA
RELATED REPORTS & OPTIONS
Asia
San Jose
Compare Zip Codes
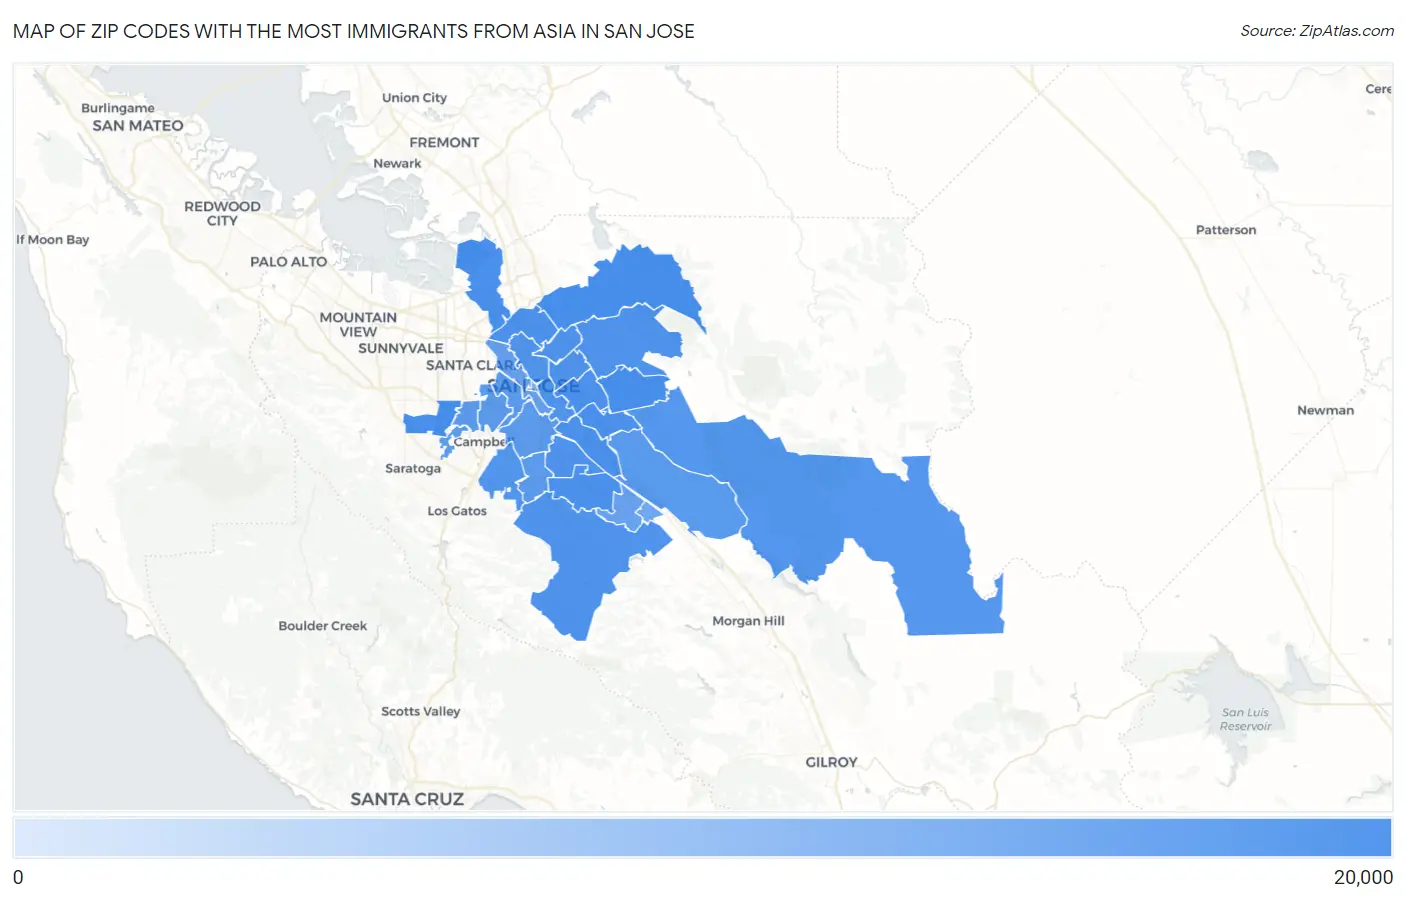
Map of Zip Codes with the Most Immigrants from Asia in San Jose
560
18,978
Zip Codes with the Most Immigrants from Asia in San Jose, CA
| Zip Code | Asia | vs State | vs National | |
| 1. | 95129 | 18,978 | 4,197,463(0.45%)#21 | 14,105,933(0.13%)#40 |
| 2. | 95132 | 18,710 | 4,197,463(0.45%)#22 | 14,105,933(0.13%)#42 |
| 3. | 95148 | 17,697 | 4,197,463(0.42%)#27 | 14,105,933(0.13%)#50 |
| 4. | 95134 | 16,144 | 4,197,463(0.38%)#35 | 14,105,933(0.11%)#64 |
| 5. | 95131 | 14,810 | 4,197,463(0.35%)#41 | 14,105,933(0.10%)#73 |
| 6. | 95121 | 14,541 | 4,197,463(0.35%)#42 | 14,105,933(0.10%)#76 |
| 7. | 95111 | 14,535 | 4,197,463(0.35%)#43 | 14,105,933(0.10%)#77 |
| 8. | 95122 | 13,508 | 4,197,463(0.32%)#51 | 14,105,933(0.10%)#94 |
| 9. | 95123 | 13,148 | 4,197,463(0.31%)#55 | 14,105,933(0.09%)#101 |
| 10. | 95136 | 12,491 | 4,197,463(0.30%)#60 | 14,105,933(0.09%)#113 |
| 11. | 95133 | 12,146 | 4,197,463(0.29%)#63 | 14,105,933(0.09%)#118 |
| 12. | 95127 | 11,774 | 4,197,463(0.28%)#68 | 14,105,933(0.08%)#124 |
| 13. | 95120 | 11,583 | 4,197,463(0.28%)#70 | 14,105,933(0.08%)#127 |
| 14. | 95116 | 10,575 | 4,197,463(0.25%)#88 | 14,105,933(0.07%)#161 |
| 15. | 95112 | 10,526 | 4,197,463(0.25%)#90 | 14,105,933(0.07%)#163 |
| 16. | 95124 | 8,724 | 4,197,463(0.21%)#126 | 14,105,933(0.06%)#237 |
| 17. | 95135 | 7,513 | 4,197,463(0.18%)#165 | 14,105,933(0.05%)#308 |
| 18. | 95138 | 6,134 | 4,197,463(0.15%)#216 | 14,105,933(0.04%)#434 |
| 19. | 95125 | 5,878 | 4,197,463(0.14%)#231 | 14,105,933(0.04%)#476 |
| 20. | 95118 | 5,716 | 4,197,463(0.14%)#237 | 14,105,933(0.04%)#492 |
| 21. | 95117 | 5,486 | 4,197,463(0.13%)#246 | 14,105,933(0.04%)#528 |
| 22. | 95128 | 5,370 | 4,197,463(0.13%)#254 | 14,105,933(0.04%)#545 |
| 23. | 95126 | 5,331 | 4,197,463(0.13%)#260 | 14,105,933(0.04%)#554 |
| 24. | 95130 | 3,559 | 4,197,463(0.08%)#395 | 14,105,933(0.03%)#983 |
| 25. | 95119 | 2,313 | 4,197,463(0.06%)#533 | 14,105,933(0.02%)#1,568 |
| 26. | 95110 | 2,256 | 4,197,463(0.05%)#538 | 14,105,933(0.02%)#1,601 |
| 27. | 95139 | 1,205 | 4,197,463(0.03%)#716 | 14,105,933(0.01%)#2,787 |
| 28. | 95113 | 560 | 4,197,463(0.01%)#874 | 14,105,933(0.00%)#4,720 |
1
Common Questions
What are the Top 10 Zip Codes with the Most Immigrants from Asia in San Jose, CA?
Top 10 Zip Codes with the Most Immigrants from Asia in San Jose, CA are:
What zip code has the Most Immigrants from Asia in San Jose, CA?
95129 has the Most Immigrants from Asia in San Jose, CA with 18,978.
What is the Total Immigrants from Asia in San Jose, CA?
Total Immigrants from Asia in San Jose is 268,777.
What is the Total Immigrants from Asia in California?
Total Immigrants from Asia in California is 4,197,463.
What is the Total Immigrants from Asia in the United States?
Total Immigrants from Asia in the United States is 14,105,933.