Zip Codes with the Fewest Births per 1,000 Women Receiving Public Assitance in San Jose, CA
RELATED REPORTS & OPTIONS
Lowest Birth Rate | Public Income
San Jose
Compare Zip Codes
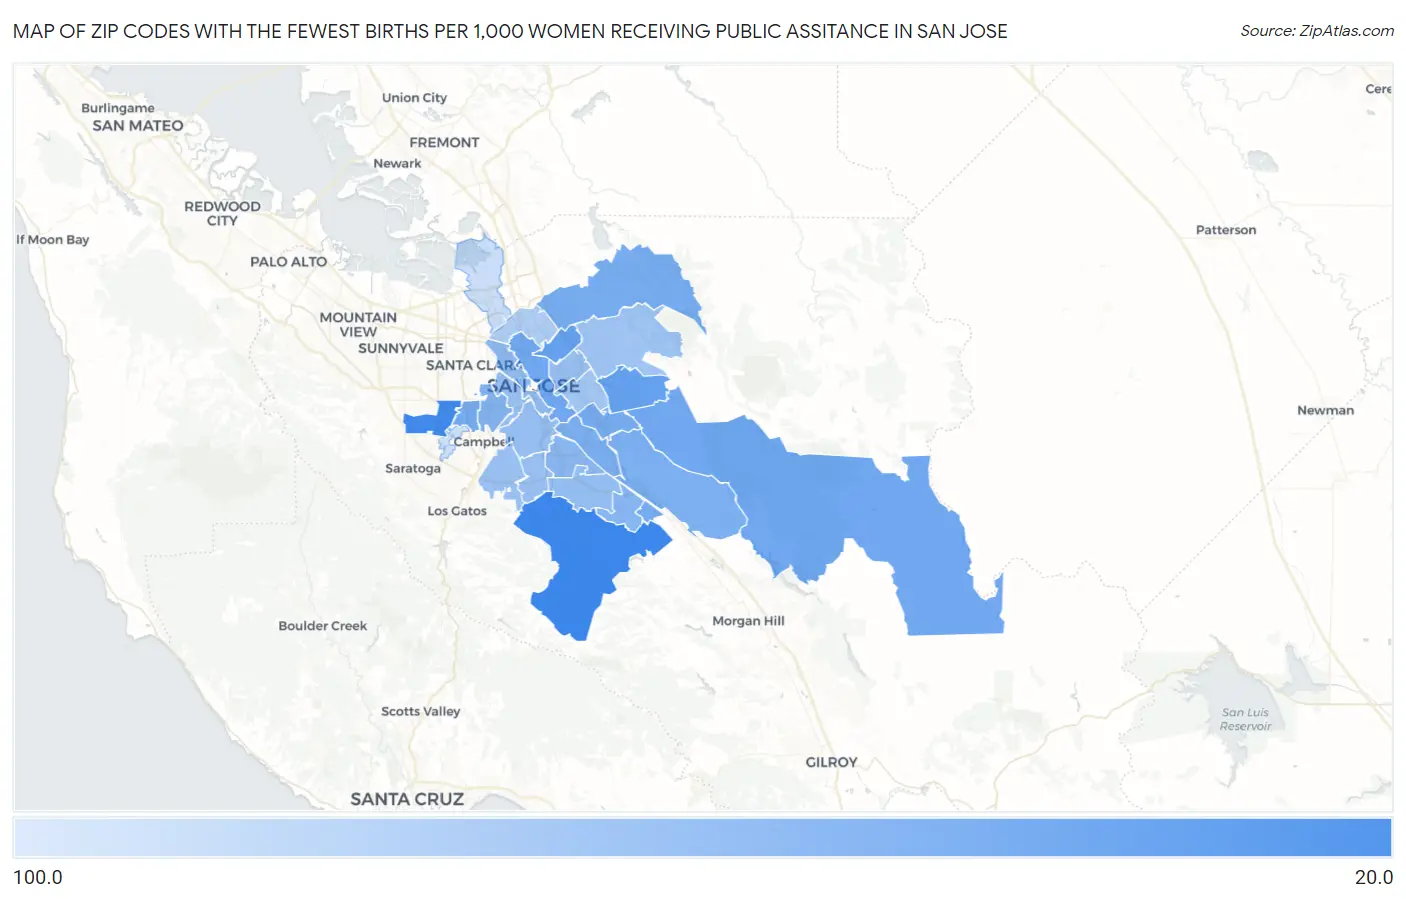
Map of Zip Codes with the Fewest Births per 1,000 Women Receiving Public Assitance in San Jose
81.0
23.0
Zip Codes with the Fewest Births per 1,000 Women Receiving Public Assitance in San Jose, CA
| Zip Code | Births / 1,000 Women | vs State | vs National | |
| 1. | 95120 | 23.0 | 48.0(-25.0)#136 | 52.0(-29.0)#3,055 |
| 2. | 95129 | 24.0 | 48.0(-24.0)#145 | 52.0(-28.0)#3,308 |
| 3. | 95148 | 33.0 | 48.0(-15.0)#289 | 52.0(-19.0)#5,837 |
| 4. | 95133 | 33.0 | 48.0(-15.0)#300 | 52.0(-19.0)#5,880 |
| 5. | 95112 | 36.0 | 48.0(-12.0)#368 | 52.0(-16.0)#6,781 |
| 6. | 95135 | 36.0 | 48.0(-12.0)#382 | 52.0(-16.0)#6,872 |
| 7. | 95132 | 38.0 | 48.0(-10.00)#424 | 52.0(-14.0)#7,479 |
| 8. | 95121 | 38.0 | 48.0(-10.00)#426 | 52.0(-14.0)#7,493 |
| 9. | 95117 | 38.0 | 48.0(-10.00)#432 | 52.0(-14.0)#7,526 |
| 10. | 95139 | 38.0 | 48.0(-10.00)#445 | 52.0(-14.0)#7,643 |
| 11. | 95111 | 40.0 | 48.0(-8.00)#470 | 52.0(-12.0)#8,180 |
| 12. | 95138 | 40.0 | 48.0(-8.00)#492 | 52.0(-12.0)#8,304 |
| 13. | 95128 | 42.0 | 48.0(-6.00)#538 | 52.0(-10.00)#8,926 |
| 14. | 95119 | 44.0 | 48.0(-4.00)#600 | 52.0(-8.00)#9,764 |
| 15. | 95136 | 45.0 | 48.0(-3.00)#611 | 52.0(-7.00)#9,971 |
| 16. | 95110 | 47.0 | 48.0(-1.000)#682 | 52.0(-5.00)#10,801 |
| 17. | 95123 | 49.0 | 48.0(+1.000)#718 | 52.0(-3.00)#11,349 |
| 18. | 95125 | 50.0 | 48.0(+2.00)#746 | 52.0(-2.00)#11,720 |
| 19. | 95116 | 50.0 | 48.0(+2.00)#749 | 52.0(-2.00)#11,725 |
| 20. | 95126 | 51.0 | 48.0(+3.00)#786 | 52.0(-1.000)#12,098 |
| 21. | 95118 | 51.0 | 48.0(+3.00)#788 | 52.0(-1.000)#12,113 |
| 22. | 95124 | 52.0 | 48.0(+4.00)#808 | 52.0(=0.000)#12,418 |
| 23. | 95127 | 54.0 | 48.0(+6.00)#853 | 52.0(+2.00)#13,061 |
| 24. | 95122 | 55.0 | 48.0(+7.00)#868 | 52.0(+3.00)#13,375 |
| 25. | 95131 | 61.0 | 48.0(+13.0)#1,000 | 52.0(+9.00)#15,268 |
| 26. | 95134 | 76.0 | 48.0(+28.0)#1,178 | 52.0(+24.0)#18,676 |
| 27. | 95130 | 81.0 | 48.0(+33.0)#1,218 | 52.0(+29.0)#19,512 |
1
Common Questions
What are the Top 10 Zip Codes with the Fewest Births per 1,000 Women Receiving Public Assitance in San Jose, CA?
Top 10 Zip Codes with the Fewest Births per 1,000 Women Receiving Public Assitance in San Jose, CA are:
What zip code has the Fewest Births per 1,000 Women Receiving Public Assitance in San Jose, CA?
95120 has the Fewest Births per 1,000 Women Receiving Public Assitance in San Jose, CA with 23.0.
What is the Number of Births per 1,000 Women Receiving Public Assitance in San Jose, CA?
Number of Births per 1,000 Women Receiving Public Assitance in San Jose is 45.0.
What is the Number of Births per 1,000 Women Receiving Public Assitance in California?
Number of Births per 1,000 Women Receiving Public Assitance in California is 48.0.
What is the Number of Births per 1,000 Women Receiving Public Assitance in the United States?
Number of Births per 1,000 Women Receiving Public Assitance in the United States is 52.0.