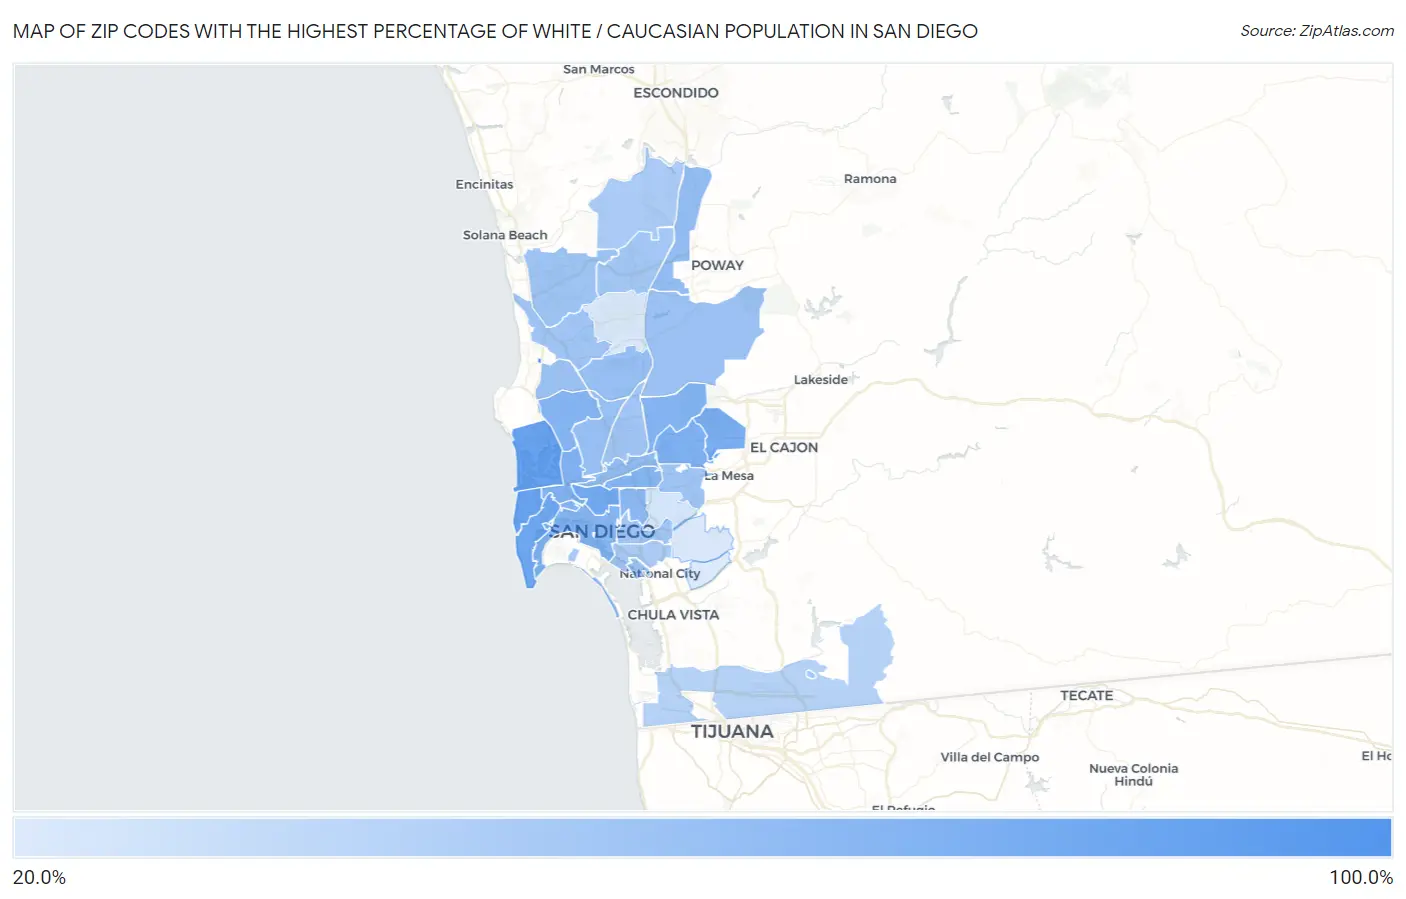
Zip Codes with the Highest Percentage of White / Caucasian Population in San Diego, CA
RELATED REPORTS & OPTIONS
White / Caucasian
San Diego
Compare Zip Codes
Map of Zip Codes with the Highest Percentage of White / Caucasian Population in San Diego
27.4%
100.0%

Zip Codes with the Highest Percentage of White / Caucasian Population in San Diego, CA
| Zip Code | White / Caucasian | vs State | vs National | |
| 1. | 92161 | 100.0% | 48.1%(+51.9)#63 | 65.9%(+34.1)#2,541 |
| 2. | 92107 | 81.3% | 48.1%(+33.1)#345 | 65.9%(+15.4)#20,376 |
| 3. | 92109 | 80.9% | 48.1%(+32.8)#351 | 65.9%(+15.1)#20,534 |
| 4. | 92106 | 77.4% | 48.1%(+29.2)#457 | 65.9%(+11.5)#22,125 |
| 5. | 92103 | 75.3% | 48.1%(+27.1)#523 | 65.9%(+9.40)#22,970 |
| 6. | 92119 | 71.1% | 48.1%(+23.0)#646 | 65.9%(+5.25)#24,385 |
| 7. | 92120 | 69.7% | 48.1%(+21.6)#668 | 65.9%(+3.83)#24,807 |
| 8. | 92140 | 68.4% | 48.1%(+20.3)#707 | 65.9%(+2.52)#25,160 |
| 9. | 92110 | 67.8% | 48.1%(+19.6)#727 | 65.9%(+1.88)#25,347 |
| 10. | 92116 | 67.3% | 48.1%(+19.2)#740 | 65.9%(+1.43)#25,482 |
| 11. | 92124 | 66.4% | 48.1%(+18.2)#764 | 65.9%(+0.494)#25,746 |
| 12. | 92117 | 65.9% | 48.1%(+17.8)#775 | 65.9%(+0.060)#25,848 |
| 13. | 92101 | 65.0% | 48.1%(+16.8)#795 | 65.9%(-0.914)#26,132 |
| 14. | 92104 | 62.1% | 48.1%(+13.9)#866 | 65.9%(-3.81)#26,812 |
| 15. | 92155 | 59.7% | 48.1%(+11.6)#922 | 65.9%(-6.19)#27,366 |
| 16. | 92128 | 58.6% | 48.1%(+10.5)#947 | 65.9%(-7.27)#27,569 |
| 17. | 92108 | 58.6% | 48.1%(+10.4)#951 | 65.9%(-7.32)#27,581 |
| 18. | 92145 | 57.0% | 48.1%(+8.88)#986 | 65.9%(-8.87)#27,892 |
| 19. | 92111 | 56.5% | 48.1%(+8.38)#1,000 | 65.9%(-9.36)#28,009 |
| 20. | 92122 | 55.7% | 48.1%(+7.61)#1,026 | 65.9%(-10.1)#28,163 |
| 21. | 92134 | 55.6% | 48.1%(+7.47)#1,030 | 65.9%(-10.3)#28,195 |
| 22. | 92131 | 54.9% | 48.1%(+6.78)#1,045 | 65.9%(-11.0)#28,318 |
| 23. | 92136 | 54.9% | 48.1%(+6.77)#1,047 | 65.9%(-11.0)#28,324 |
| 24. | 92115 | 53.9% | 48.1%(+5.78)#1,072 | 65.9%(-12.0)#28,502 |
| 25. | 92130 | 53.9% | 48.1%(+5.78)#1,073 | 65.9%(-12.0)#28,503 |
| 26. | 92147 | 53.3% | 48.1%(+5.20)#1,086 | 65.9%(-12.5)#28,615 |
| 27. | 92102 | 52.6% | 48.1%(+4.51)#1,106 | 65.9%(-13.2)#28,733 |
| 28. | 92123 | 52.3% | 48.1%(+4.12)#1,118 | 65.9%(-13.6)#28,802 |
| 29. | 92121 | 52.2% | 48.1%(+4.06)#1,119 | 65.9%(-13.7)#28,808 |
| 30. | 92129 | 51.8% | 48.1%(+3.65)#1,129 | 65.9%(-14.1)#28,876 |
| 31. | 92179 | 51.2% | 48.1%(+3.04)#1,137 | 65.9%(-14.7)#28,970 |
| 32. | 92127 | 48.9% | 48.1%(+0.775)#1,185 | 65.9%(-17.0)#29,358 |
| 33. | 92113 | 48.3% | 48.1%(+0.117)#1,201 | 65.9%(-17.6)#29,446 |
| 34. | 92135 | 47.9% | 48.1%(-0.189)#1,207 | 65.9%(-17.9)#29,482 |
| 35. | 92154 | 43.8% | 48.1%(-4.35)#1,294 | 65.9%(-22.1)#30,069 |
| 36. | 92105 | 30.8% | 48.1%(-17.4)#1,544 | 65.9%(-35.1)#31,426 |
| 37. | 92126 | 29.5% | 48.1%(-18.7)#1,569 | 65.9%(-36.4)#31,540 |
| 38. | 92114 | 28.6% | 48.1%(-19.6)#1,578 | 65.9%(-37.3)#31,603 |
| 39. | 92139 | 27.4% | 48.1%(-20.7)#1,596 | 65.9%(-38.5)#31,671 |
1
Common Questions
What are the Top 10 Zip Codes with the Highest Percentage of White / Caucasian Population in San Diego, CA?
Top 10 Zip Codes with the Highest Percentage of White / Caucasian Population in San Diego, CA are:
What zip code has the Highest Percentage of White / Caucasian Population in San Diego, CA?
92161 has the Highest Percentage of White / Caucasian Population in San Diego, CA with 100.0%.
What is the Percentage of White / Caucasian Population in San Diego, CA?
Percentage of White / Caucasian Population in San Diego is 54.5%.
What is the Percentage of White / Caucasian Population in California?
Percentage of White / Caucasian Population in California is 48.1%.
What is the Percentage of White / Caucasian Population in the United States?
Percentage of White / Caucasian Population in the United States is 65.9%.