Zip Codes with the Highest Percentage of Population Employed in Arts, Entertainment & Recreation in San Diego, CA
RELATED REPORTS & OPTIONS
Arts, Entertainment & Recreation
San Diego
Compare Zip Codes
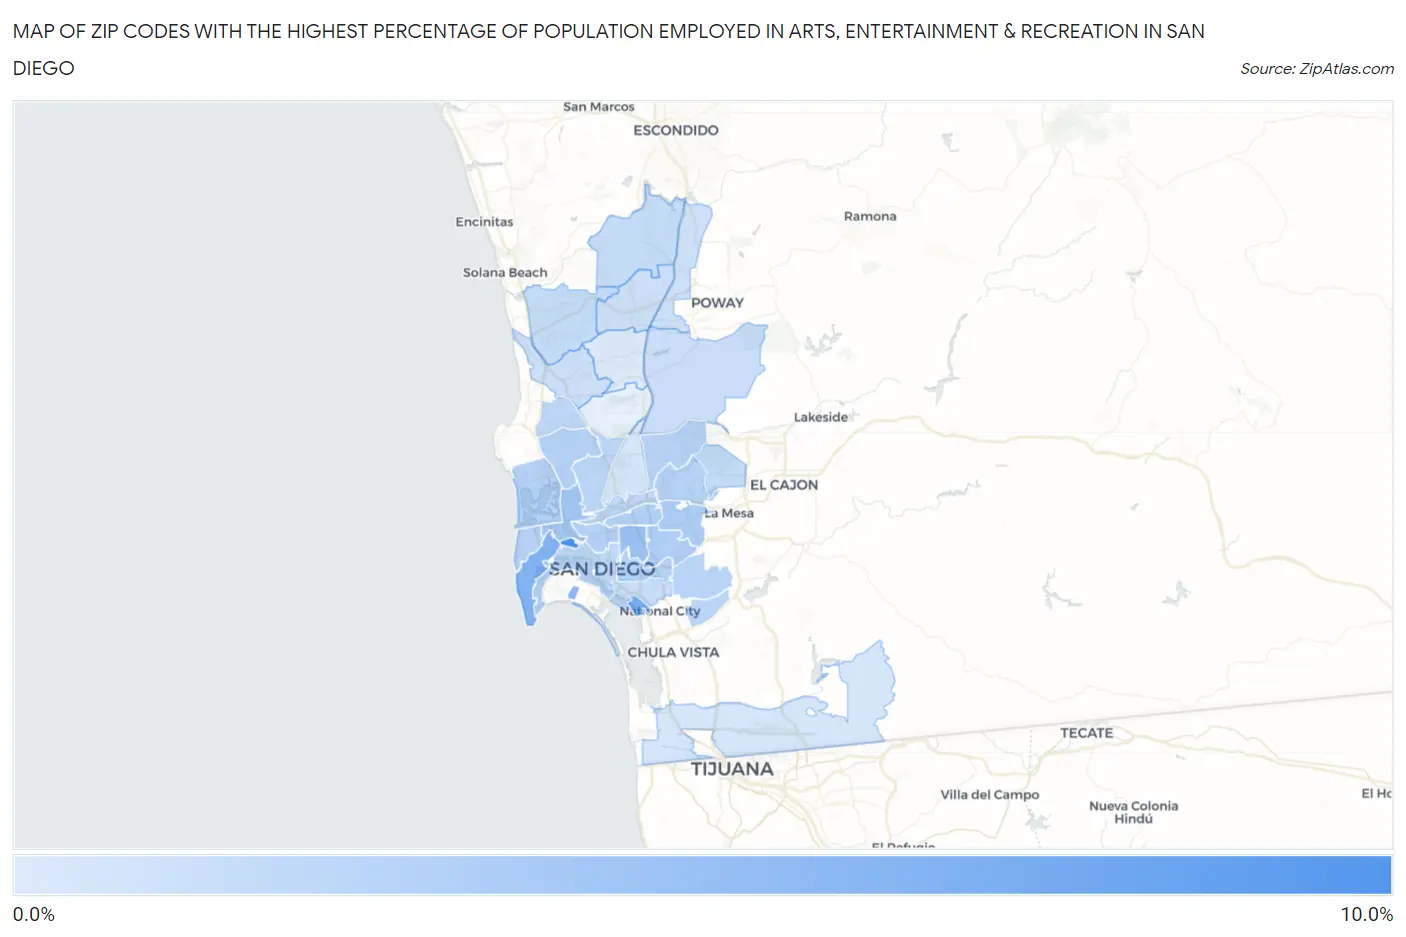
Map of Zip Codes with the Highest Percentage of Population Employed in Arts, Entertainment & Recreation in San Diego
0.86%
8.7%
Zip Codes with the Highest Percentage of Population Employed in Arts, Entertainment & Recreation in San Diego, CA
| Zip Code | % Employed | vs State | vs National | |
| 1. | 92140 | 8.7% | 2.6%(+6.14)#87 | 2.1%(+6.61)#910 |
| 2. | 92136 | 6.1% | 2.6%(+3.52)#156 | 2.1%(+3.99)#1,665 |
| 3. | 92106 | 5.6% | 2.6%(+3.05)#176 | 2.1%(+3.52)#1,906 |
| 4. | 92135 | 5.3% | 2.6%(+2.71)#199 | 2.1%(+3.18)#2,103 |
| 5. | 92104 | 4.1% | 2.6%(+1.59)#300 | 2.1%(+2.06)#3,152 |
| 6. | 92110 | 3.8% | 2.6%(+1.21)#366 | 2.1%(+1.68)#3,682 |
| 7. | 92115 | 3.3% | 2.6%(+0.723)#459 | 2.1%(+1.19)#4,621 |
| 8. | 92105 | 3.2% | 2.6%(+0.692)#465 | 2.1%(+1.16)#4,693 |
| 9. | 92116 | 3.1% | 2.6%(+0.586)#485 | 2.1%(+1.06)#4,957 |
| 10. | 92103 | 3.0% | 2.6%(+0.450)#523 | 2.1%(+0.922)#5,346 |
| 11. | 92117 | 2.9% | 2.6%(+0.347)#547 | 2.1%(+0.818)#5,641 |
| 12. | 92120 | 2.9% | 2.6%(+0.323)#554 | 2.1%(+0.794)#5,723 |
| 13. | 92102 | 2.9% | 2.6%(+0.306)#558 | 2.1%(+0.777)#5,772 |
| 14. | 92109 | 2.9% | 2.6%(+0.303)#559 | 2.1%(+0.774)#5,792 |
| 15. | 92107 | 2.8% | 2.6%(+0.242)#575 | 2.1%(+0.713)#6,014 |
| 16. | 92124 | 2.7% | 2.6%(+0.162)#599 | 2.1%(+0.633)#6,301 |
| 17. | 92114 | 2.6% | 2.6%(+0.037)#640 | 2.1%(+0.508)#6,792 |
| 18. | 92139 | 2.6% | 2.6%(+0.018)#648 | 2.1%(+0.489)#6,868 |
| 19. | 92111 | 2.5% | 2.6%(-0.052)#684 | 2.1%(+0.420)#7,159 |
| 20. | 92101 | 2.4% | 2.6%(-0.144)#723 | 2.1%(+0.328)#7,593 |
| 21. | 92122 | 2.4% | 2.6%(-0.153)#728 | 2.1%(+0.318)#7,646 |
| 22. | 92108 | 2.4% | 2.6%(-0.179)#741 | 2.1%(+0.293)#7,766 |
| 23. | 92127 | 2.1% | 2.6%(-0.477)#886 | 2.1%(-0.006)#9,337 |
| 24. | 92119 | 2.0% | 2.6%(-0.527)#909 | 2.1%(-0.055)#9,612 |
| 25. | 92130 | 2.0% | 2.6%(-0.541)#914 | 2.1%(-0.069)#9,692 |
| 26. | 92113 | 1.9% | 2.6%(-0.622)#940 | 2.1%(-0.151)#10,181 |
| 27. | 92131 | 1.8% | 2.6%(-0.763)#1,005 | 2.1%(-0.292)#11,077 |
| 28. | 92121 | 1.7% | 2.6%(-0.858)#1,045 | 2.1%(-0.387)#11,769 |
| 29. | 92129 | 1.7% | 2.6%(-0.881)#1,057 | 2.1%(-0.410)#11,923 |
| 30. | 92128 | 1.5% | 2.6%(-1.04)#1,124 | 2.1%(-0.574)#13,184 |
| 31. | 92154 | 1.2% | 2.6%(-1.37)#1,242 | 2.1%(-0.897)#15,586 |
| 32. | 92123 | 1.2% | 2.6%(-1.39)#1,250 | 2.1%(-0.919)#15,764 |
| 33. | 92126 | 0.86% | 2.6%(-1.69)#1,319 | 2.1%(-1.22)#17,963 |
1
Common Questions
What are the Top 10 Zip Codes with the Highest Percentage of Population Employed in Arts, Entertainment & Recreation in San Diego, CA?
Top 10 Zip Codes with the Highest Percentage of Population Employed in Arts, Entertainment & Recreation in San Diego, CA are:
What zip code has the Highest Percentage of Population Employed in Arts, Entertainment & Recreation in San Diego, CA?
92140 has the Highest Percentage of Population Employed in Arts, Entertainment & Recreation in San Diego, CA with 8.7%.
What is the Percentage of Population Employed in Arts, Entertainment & Recreation in San Diego, CA?
Percentage of Population Employed in Arts, Entertainment & Recreation in San Diego is 2.5%.
What is the Percentage of Population Employed in Arts, Entertainment & Recreation in California?
Percentage of Population Employed in Arts, Entertainment & Recreation in California is 2.6%.
What is the Percentage of Population Employed in Arts, Entertainment & Recreation in the United States?
Percentage of Population Employed in Arts, Entertainment & Recreation in the United States is 2.1%.