Zip Codes with the Highest Percentage of Households Heated by Bottled Gas / Liquid Propane in San Diego, CA
RELATED REPORTS & OPTIONS
Bottled Gas / LP Heating
San Diego
Compare Zip Codes
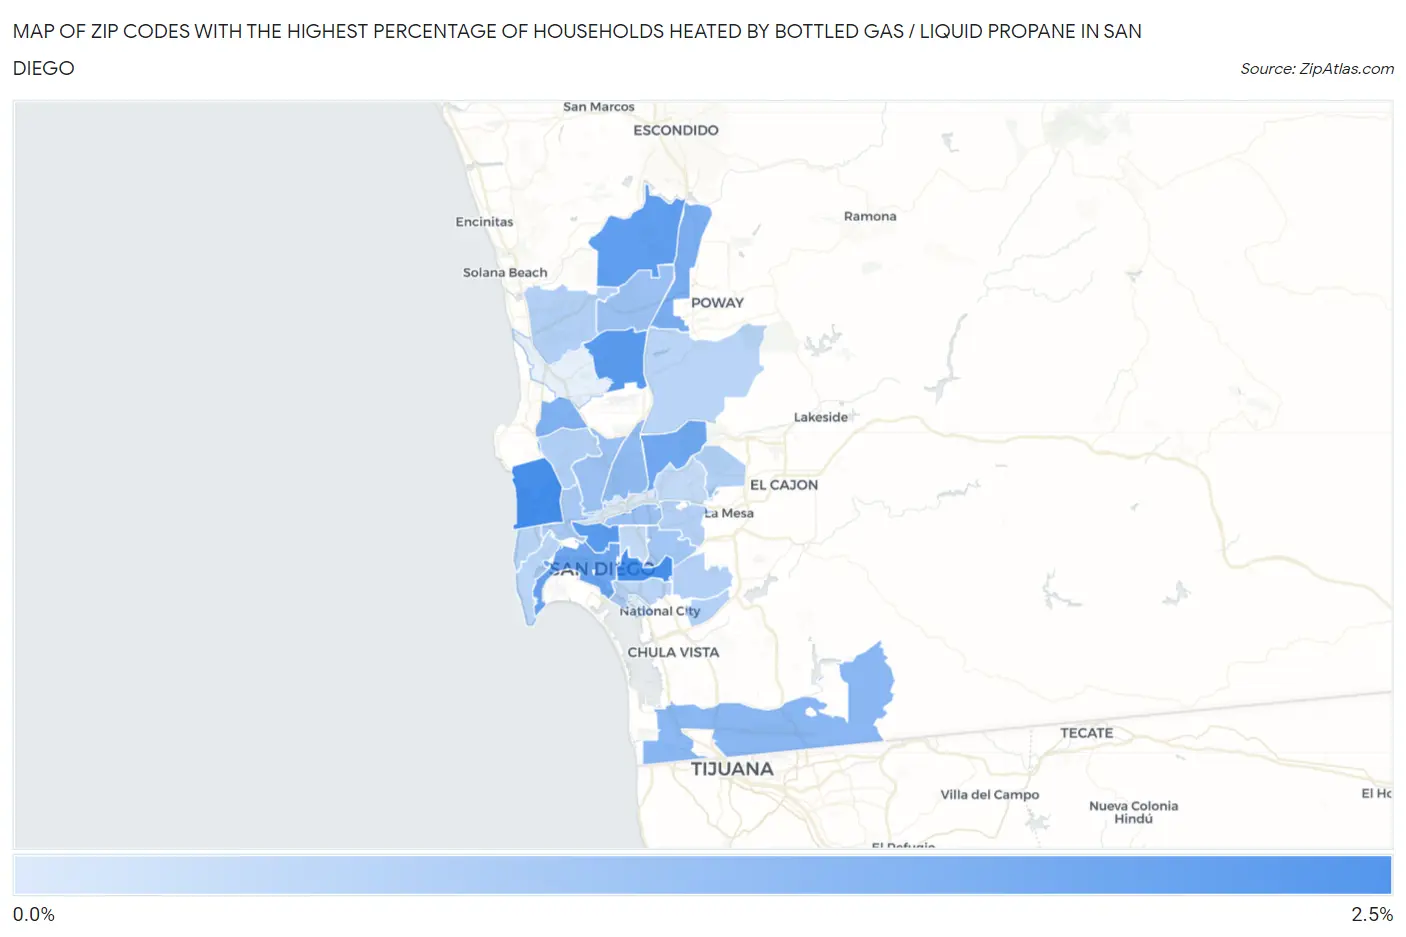
Map of Zip Codes with the Highest Percentage of Households Heated by Bottled Gas / Liquid Propane in San Diego
0.40%
2.2%
Zip Codes with the Highest Percentage of Households Heated by Bottled Gas / Liquid Propane in San Diego, CA
| Zip Code | Bottled Gas / LP Heating | vs State | vs National | |
| 1. | 92109 | 2.2% | 3.5%(-1.30)#862 | 4.9%(-2.70)#22,587 |
| 2. | 92102 | 2.2% | 3.5%(-1.30)#864 | 4.9%(-2.70)#22,594 |
| 3. | 92126 | 2.0% | 3.5%(-1.50)#918 | 4.9%(-2.90)#23,087 |
| 4. | 92103 | 2.0% | 3.5%(-1.50)#938 | 4.9%(-2.90)#23,155 |
| 5. | 92127 | 1.9% | 3.5%(-1.60)#966 | 4.9%(-3.00)#23,381 |
| 6. | 92101 | 1.7% | 3.5%(-1.80)#1,047 | 4.9%(-3.20)#23,963 |
| 7. | 92124 | 1.7% | 3.5%(-1.80)#1,056 | 4.9%(-3.20)#24,035 |
| 8. | 92128 | 1.6% | 3.5%(-1.90)#1,094 | 4.9%(-3.30)#24,291 |
| 9. | 92122 | 1.5% | 3.5%(-2.00)#1,145 | 4.9%(-3.40)#24,642 |
| 10. | 92154 | 1.4% | 3.5%(-2.10)#1,182 | 4.9%(-3.50)#24,954 |
| 11. | 92123 | 1.3% | 3.5%(-2.20)#1,256 | 4.9%(-3.60)#25,441 |
| 12. | 92129 | 1.2% | 3.5%(-2.30)#1,288 | 4.9%(-3.70)#25,749 |
| 13. | 92111 | 1.2% | 3.5%(-2.30)#1,294 | 4.9%(-3.70)#25,768 |
| 14. | 92116 | 1.2% | 3.5%(-2.30)#1,305 | 4.9%(-3.70)#25,848 |
| 15. | 92105 | 1.1% | 3.5%(-2.40)#1,325 | 4.9%(-3.80)#26,101 |
| 16. | 92110 | 1.0% | 3.5%(-2.50)#1,403 | 4.9%(-3.90)#26,653 |
| 17. | 92114 | 0.90% | 3.5%(-2.60)#1,426 | 4.9%(-4.00)#26,929 |
| 18. | 92115 | 0.90% | 3.5%(-2.60)#1,429 | 4.9%(-4.00)#26,939 |
| 19. | 92130 | 0.90% | 3.5%(-2.60)#1,432 | 4.9%(-4.00)#26,947 |
| 20. | 92117 | 0.90% | 3.5%(-2.60)#1,434 | 4.9%(-4.00)#26,953 |
| 21. | 92139 | 0.90% | 3.5%(-2.60)#1,445 | 4.9%(-4.00)#27,051 |
| 22. | 92119 | 0.90% | 3.5%(-2.60)#1,453 | 4.9%(-4.00)#27,139 |
| 23. | 92113 | 0.80% | 3.5%(-2.70)#1,476 | 4.9%(-4.10)#27,370 |
| 24. | 92131 | 0.80% | 3.5%(-2.70)#1,481 | 4.9%(-4.10)#27,438 |
| 25. | 92107 | 0.80% | 3.5%(-2.70)#1,489 | 4.9%(-4.10)#27,492 |
| 26. | 92106 | 0.80% | 3.5%(-2.70)#1,493 | 4.9%(-4.10)#27,567 |
| 27. | 92104 | 0.70% | 3.5%(-2.80)#1,513 | 4.9%(-4.20)#27,777 |
| 28. | 92120 | 0.70% | 3.5%(-2.80)#1,519 | 4.9%(-4.20)#27,854 |
| 29. | 92108 | 0.40% | 3.5%(-3.10)#1,580 | 4.9%(-4.50)#28,930 |
1
Common Questions
What are the Top 10 Zip Codes with the Highest Percentage of Households Heated by Bottled Gas / Liquid Propane in San Diego, CA?
Top 10 Zip Codes with the Highest Percentage of Households Heated by Bottled Gas / Liquid Propane in San Diego, CA are:
What zip code has the Highest Percentage of Households Heated by Bottled Gas / Liquid Propane in San Diego, CA?
92109 has the Highest Percentage of Households Heated by Bottled Gas / Liquid Propane in San Diego, CA with 2.2%.
What is the Percentage of Households Heated by Bottled Gas / Liquid Propane in San Diego, CA?
Percentage of Households Heated by Bottled Gas / Liquid Propane in San Diego is 1.2%.
What is the Percentage of Households Heated by Bottled Gas / Liquid Propane in California?
Percentage of Households Heated by Bottled Gas / Liquid Propane in California is 3.5%.
What is the Percentage of Households Heated by Bottled Gas / Liquid Propane in the United States?
Percentage of Households Heated by Bottled Gas / Liquid Propane in the United States is 4.9%.