Zip Codes with the Highest Percentage of Population Employed in Sales & Related in San Diego, CA
RELATED REPORTS & OPTIONS
Sales & Related
San Diego
Compare Zip Codes
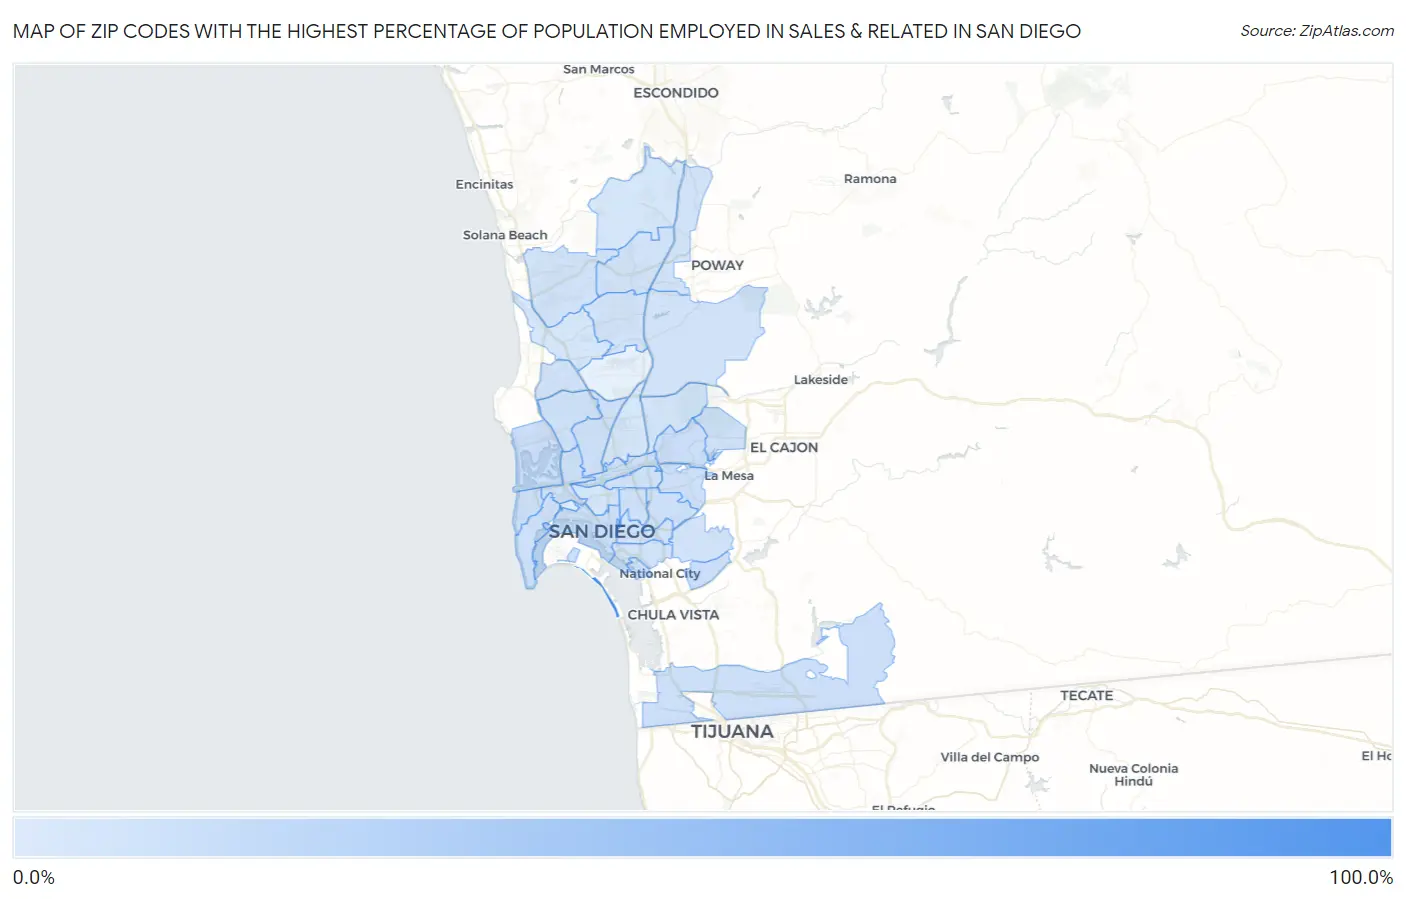
Map of Zip Codes with the Highest Percentage of Population Employed in Sales & Related in San Diego
2.5%
100.0%
Zip Codes with the Highest Percentage of Population Employed in Sales & Related in San Diego, CA
| Zip Code | % Employed | vs State | vs National | |
| 1. | 92155 | 100.0% | 9.4%(+90.6)#2 | 9.6%(+90.4)#10 |
| 2. | 92139 | 11.1% | 9.4%(+1.64)#392 | 9.6%(+1.49)#7,984 |
| 3. | 92109 | 10.9% | 9.4%(+1.44)#430 | 9.6%(+1.29)#8,485 |
| 4. | 92120 | 10.8% | 9.4%(+1.33)#458 | 9.6%(+1.18)#8,784 |
| 5. | 92101 | 10.6% | 9.4%(+1.18)#492 | 9.6%(+1.03)#9,207 |
| 6. | 92111 | 10.6% | 9.4%(+1.15)#500 | 9.6%(+0.999)#9,290 |
| 7. | 92135 | 10.5% | 9.4%(+1.08)#517 | 9.6%(+0.931)#9,462 |
| 8. | 92110 | 10.5% | 9.4%(+1.05)#519 | 9.6%(+0.902)#9,536 |
| 9. | 92154 | 10.3% | 9.4%(+0.861)#565 | 9.6%(+0.714)#10,084 |
| 10. | 92136 | 10.2% | 9.4%(+0.776)#581 | 9.6%(+0.629)#10,344 |
| 11. | 92107 | 10.1% | 9.4%(+0.665)#605 | 9.6%(+0.518)#10,681 |
| 12. | 92108 | 10.1% | 9.4%(+0.642)#609 | 9.6%(+0.495)#10,740 |
| 13. | 92106 | 10.0% | 9.4%(+0.557)#627 | 9.6%(+0.409)#10,985 |
| 14. | 92115 | 9.9% | 9.4%(+0.485)#639 | 9.6%(+0.337)#11,225 |
| 15. | 92105 | 9.6% | 9.4%(+0.190)#704 | 9.6%(+0.042)#12,257 |
| 16. | 92119 | 9.2% | 9.4%(-0.241)#826 | 9.6%(-0.389)#13,769 |
| 17. | 92117 | 8.9% | 9.4%(-0.528)#909 | 9.6%(-0.675)#14,826 |
| 18. | 92116 | 8.6% | 9.4%(-0.836)#980 | 9.6%(-0.984)#15,938 |
| 19. | 92104 | 8.6% | 9.4%(-0.854)#984 | 9.6%(-1.00)#16,003 |
| 20. | 92126 | 8.4% | 9.4%(-1.03)#1,038 | 9.6%(-1.18)#16,641 |
| 21. | 92128 | 8.4% | 9.4%(-1.09)#1,047 | 9.6%(-1.23)#16,819 |
| 22. | 92113 | 8.3% | 9.4%(-1.16)#1,063 | 9.6%(-1.31)#17,100 |
| 23. | 92130 | 8.2% | 9.4%(-1.25)#1,083 | 9.6%(-1.39)#17,405 |
| 24. | 92122 | 8.1% | 9.4%(-1.36)#1,104 | 9.6%(-1.51)#17,762 |
| 25. | 92129 | 8.0% | 9.4%(-1.43)#1,110 | 9.6%(-1.58)#18,003 |
| 26. | 92131 | 7.9% | 9.4%(-1.60)#1,136 | 9.6%(-1.74)#18,507 |
| 27. | 92114 | 7.8% | 9.4%(-1.61)#1,142 | 9.6%(-1.76)#18,569 |
| 28. | 92102 | 7.7% | 9.4%(-1.77)#1,177 | 9.6%(-1.92)#19,081 |
| 29. | 92103 | 7.2% | 9.4%(-2.22)#1,242 | 9.6%(-2.37)#20,556 |
| 30. | 92124 | 7.0% | 9.4%(-2.47)#1,269 | 9.6%(-2.62)#21,243 |
| 31. | 92123 | 6.3% | 9.4%(-3.17)#1,346 | 9.6%(-3.32)#23,016 |
| 32. | 92121 | 6.0% | 9.4%(-3.47)#1,383 | 9.6%(-3.62)#23,705 |
| 33. | 92127 | 5.8% | 9.4%(-3.65)#1,397 | 9.6%(-3.80)#24,076 |
| 34. | 92140 | 2.5% | 9.4%(-6.91)#1,534 | 9.6%(-7.06)#28,560 |
1
Common Questions
What are the Top 10 Zip Codes with the Highest Percentage of Population Employed in Sales & Related in San Diego, CA?
Top 10 Zip Codes with the Highest Percentage of Population Employed in Sales & Related in San Diego, CA are:
What zip code has the Highest Percentage of Population Employed in Sales & Related in San Diego, CA?
92155 has the Highest Percentage of Population Employed in Sales & Related in San Diego, CA with 100.0%.
What is the Percentage of Population Employed in Sales & Related in San Diego, CA?
Percentage of Population Employed in Sales & Related in San Diego is 9.1%.
What is the Percentage of Population Employed in Sales & Related in California?
Percentage of Population Employed in Sales & Related in California is 9.4%.
What is the Percentage of Population Employed in Sales & Related in the United States?
Percentage of Population Employed in Sales & Related in the United States is 9.6%.