Zip Codes with the Highest Percentage of Population Employed in Business & Financial in San Diego, CA
RELATED REPORTS & OPTIONS
Business & Financial
San Diego
Compare Zip Codes
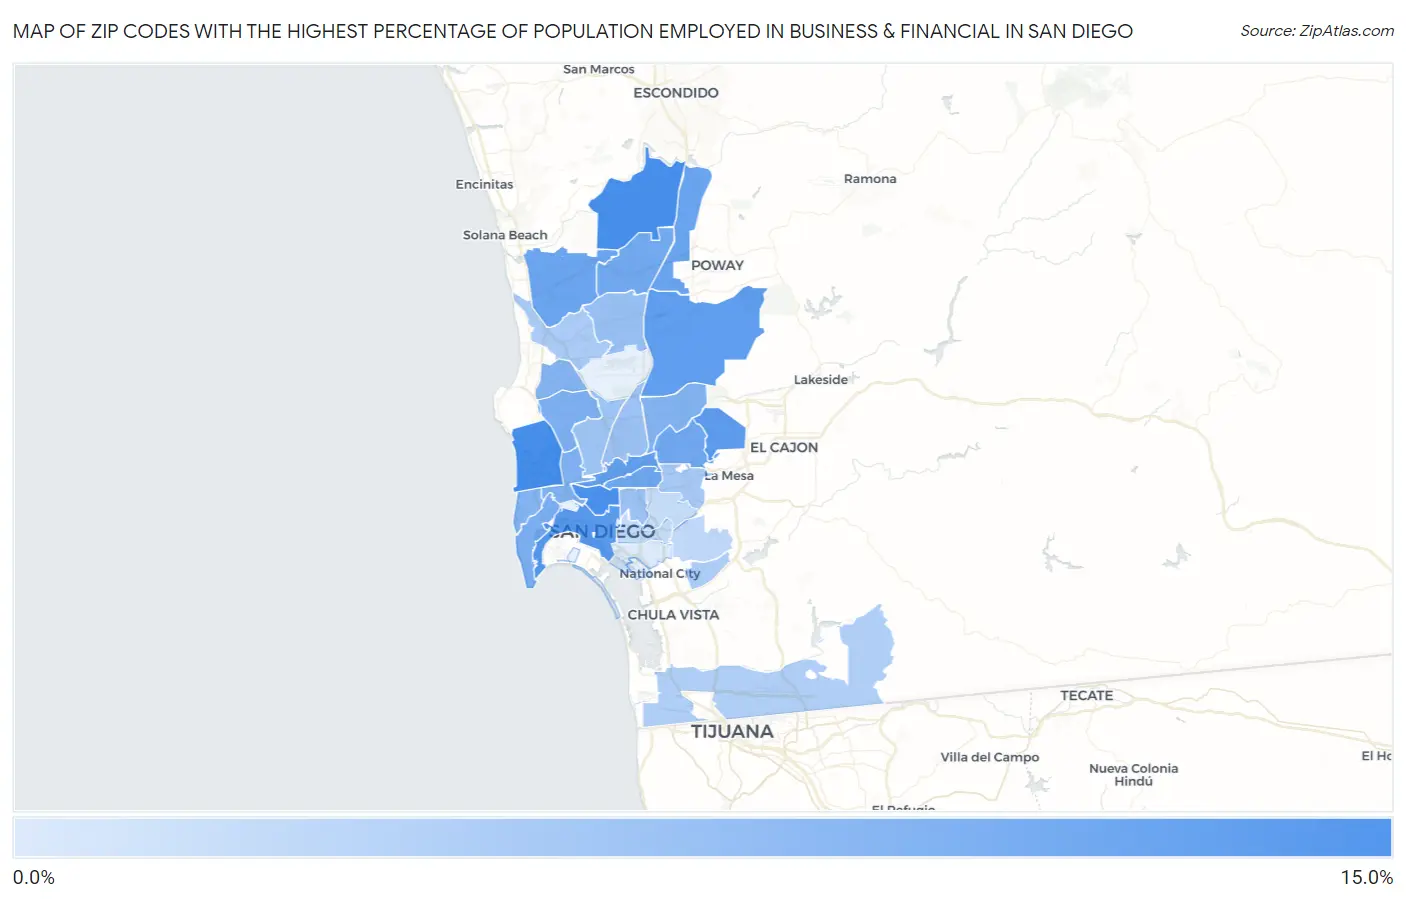
Map of Zip Codes with the Highest Percentage of Population Employed in Business & Financial in San Diego
1.7%
13.0%
Zip Codes with the Highest Percentage of Population Employed in Business & Financial in San Diego, CA
| Zip Code | % Employed | vs State | vs National | |
| 1. | 92109 | 13.0% | 5.8%(+7.19)#57 | 5.8%(+7.22)#945 |
| 2. | 92127 | 13.0% | 5.8%(+7.16)#58 | 5.8%(+7.20)#953 |
| 3. | 92103 | 12.8% | 5.8%(+7.05)#62 | 5.8%(+7.08)#972 |
| 4. | 92101 | 11.4% | 5.8%(+5.60)#103 | 5.8%(+5.64)#1,469 |
| 5. | 92119 | 11.1% | 5.8%(+5.29)#114 | 5.8%(+5.32)#1,610 |
| 6. | 92131 | 11.1% | 5.8%(+5.27)#117 | 5.8%(+5.30)#1,619 |
| 7. | 92108 | 10.7% | 5.8%(+4.92)#136 | 5.8%(+4.96)#1,786 |
| 8. | 92128 | 10.2% | 5.8%(+4.43)#160 | 5.8%(+4.46)#2,051 |
| 9. | 92130 | 10.0% | 5.8%(+4.24)#165 | 5.8%(+4.28)#2,167 |
| 10. | 92116 | 10.0% | 5.8%(+4.17)#169 | 5.8%(+4.20)#2,229 |
| 11. | 92120 | 9.6% | 5.8%(+3.84)#196 | 5.8%(+3.88)#2,505 |
| 12. | 92129 | 9.5% | 5.8%(+3.69)#207 | 5.8%(+3.72)#2,635 |
| 13. | 92106 | 9.0% | 5.8%(+3.23)#249 | 5.8%(+3.26)#3,059 |
| 14. | 92117 | 8.6% | 5.8%(+2.83)#289 | 5.8%(+2.86)#3,469 |
| 15. | 92110 | 8.6% | 5.8%(+2.77)#293 | 5.8%(+2.80)#3,524 |
| 16. | 92124 | 8.4% | 5.8%(+2.59)#307 | 5.8%(+2.62)#3,747 |
| 17. | 92122 | 8.3% | 5.8%(+2.53)#310 | 5.8%(+2.56)#3,832 |
| 18. | 92107 | 8.2% | 5.8%(+2.36)#325 | 5.8%(+2.40)#4,032 |
| 19. | 92126 | 6.8% | 5.8%(+1.02)#484 | 5.8%(+1.05)#6,145 |
| 20. | 92123 | 6.6% | 5.8%(+0.790)#512 | 5.8%(+0.824)#6,599 |
| 21. | 92104 | 6.3% | 5.8%(+0.510)#548 | 5.8%(+0.544)#7,139 |
| 22. | 92111 | 6.2% | 5.8%(+0.448)#561 | 5.8%(+0.482)#7,281 |
| 23. | 92115 | 5.7% | 5.8%(-0.121)#656 | 5.8%(-0.086)#8,588 |
| 24. | 92121 | 5.3% | 5.8%(-0.468)#709 | 5.8%(-0.434)#9,496 |
| 25. | 92139 | 5.2% | 5.8%(-0.576)#726 | 5.8%(-0.542)#9,800 |
| 26. | 92154 | 4.8% | 5.8%(-0.963)#798 | 5.8%(-0.928)#10,955 |
| 27. | 92114 | 3.8% | 5.8%(-1.97)#985 | 5.8%(-1.94)#14,507 |
| 28. | 92102 | 3.5% | 5.8%(-2.33)#1,066 | 5.8%(-2.30)#15,954 |
| 29. | 92105 | 3.2% | 5.8%(-2.55)#1,113 | 5.8%(-2.52)#16,879 |
| 30. | 92113 | 1.7% | 5.8%(-4.15)#1,347 | 5.8%(-4.11)#23,040 |
1
Common Questions
What are the Top 10 Zip Codes with the Highest Percentage of Population Employed in Business & Financial in San Diego, CA?
Top 10 Zip Codes with the Highest Percentage of Population Employed in Business & Financial in San Diego, CA are:
What zip code has the Highest Percentage of Population Employed in Business & Financial in San Diego, CA?
92109 has the Highest Percentage of Population Employed in Business & Financial in San Diego, CA with 13.0%.
What is the Percentage of Population Employed in Business & Financial in San Diego, CA?
Percentage of Population Employed in Business & Financial in San Diego is 7.7%.
What is the Percentage of Population Employed in Business & Financial in California?
Percentage of Population Employed in Business & Financial in California is 5.8%.
What is the Percentage of Population Employed in Business & Financial in the United States?
Percentage of Population Employed in Business & Financial in the United States is 5.8%.