Blevins, AR Map & Demographics
Blevins Map
Blevins Overview
$20,147
PER CAPITA INCOME
$68,750
AVG FAMILY INCOME
$57,500
AVG HOUSEHOLD INCOME
5.7%
WAGE / INCOME GAP [ % ]
94.3¢/ $1
WAGE / INCOME GAP [ $ ]
0.38
INEQUALITY / GINI INDEX
331
TOTAL POPULATION
166
MALE POPULATION
165
FEMALE POPULATION
100.61
MALES / 100 FEMALES
99.40
FEMALES / 100 MALES
30.8
MEDIAN AGE
3.8
AVG FAMILY SIZE
3.2
AVG HOUSEHOLD SIZE
128
LABOR FORCE [ PEOPLE ]
59.8%
PERCENT IN LABOR FORCE
10.9%
UNEMPLOYMENT RATE
Blevins Zip Codes
Blevins Area Codes
Income in Blevins
Income Overview in Blevins
Per Capita Income in Blevins is $20,147, while median incomes of families and households are $68,750 and $57,500 respectively.
| Characteristic | Number | Measure |
| Per Capita Income | 331 | $20,147 |
| Median Family Income | 80 | $68,750 |
| Mean Family Income | 80 | $74,688 |
| Median Household Income | 104 | $57,500 |
| Mean Household Income | 104 | $64,577 |
| Income Deficit | 80 | $0 |
| Wage / Income Gap (%) | 331 | 5.74% |
| Wage / Income Gap ($) | 331 | 94.26¢ per $1 |
| Gini / Inequality Index | 331 | 0.38 |
Earnings by Sex in Blevins
Average Earnings in Blevins are $45,000, $43,125 for men and $45,750 for women, a difference of 5.7%.
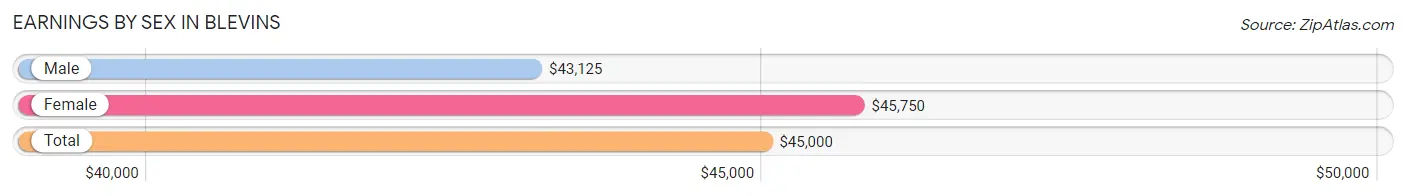
| Sex | Number | Average Earnings |
| Male | 61 (50.8%) | $43,125 |
| Female | 59 (49.2%) | $45,750 |
| Total | 120 (100.0%) | $45,000 |
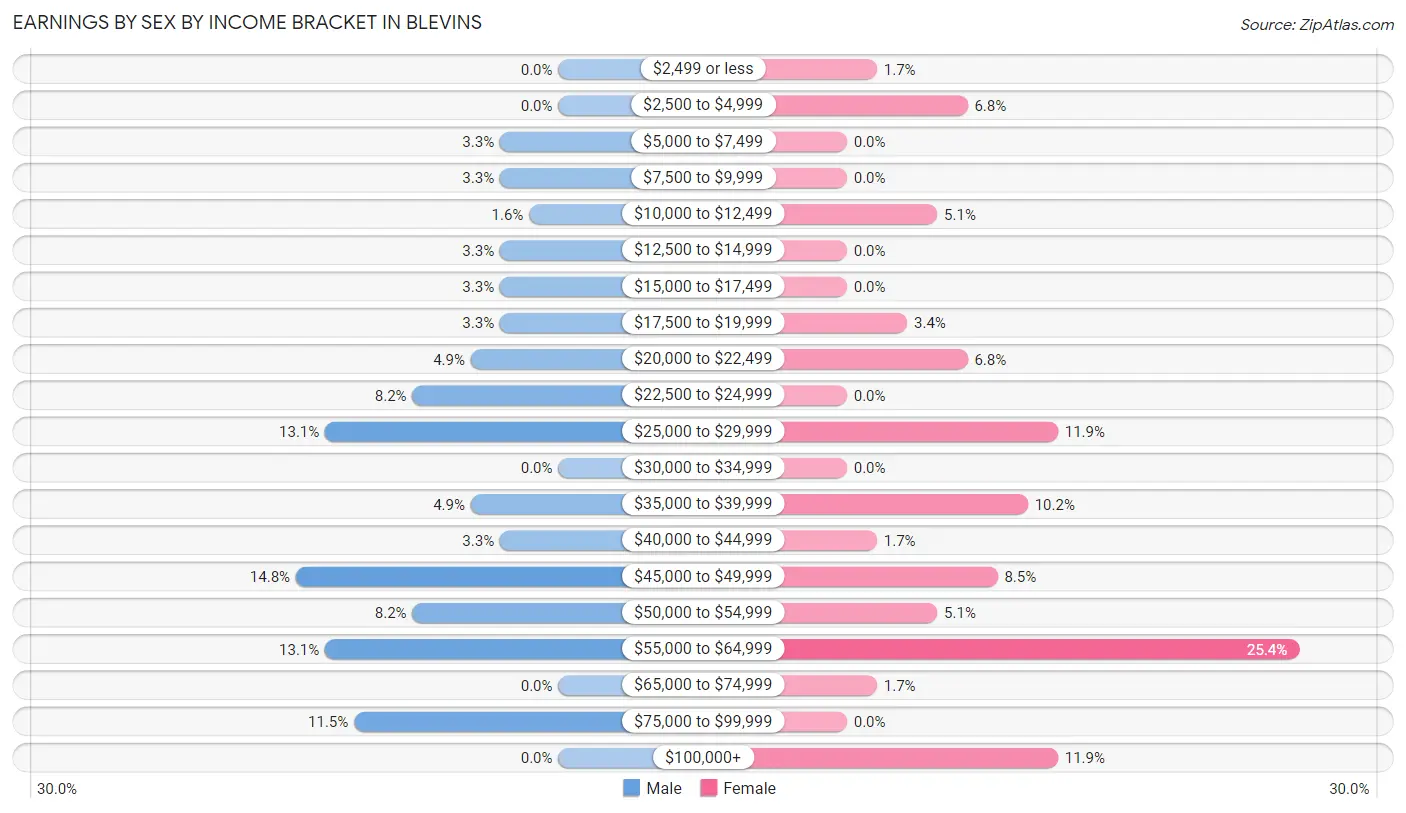
Earnings by Sex by Income Bracket in Blevins
The most common earnings brackets in Blevins are $45,000 to $49,999 for men (9 | 14.7%) and $55,000 to $64,999 for women (15 | 25.4%).
| Income | Male | Female |
| $2,499 or less | 0 (0.0%) | 1 (1.7%) |
| $2,500 to $4,999 | 0 (0.0%) | 4 (6.8%) |
| $5,000 to $7,499 | 2 (3.3%) | 0 (0.0%) |
| $7,500 to $9,999 | 2 (3.3%) | 0 (0.0%) |
| $10,000 to $12,499 | 1 (1.6%) | 3 (5.1%) |
| $12,500 to $14,999 | 2 (3.3%) | 0 (0.0%) |
| $15,000 to $17,499 | 2 (3.3%) | 0 (0.0%) |
| $17,500 to $19,999 | 2 (3.3%) | 2 (3.4%) |
| $20,000 to $22,499 | 3 (4.9%) | 4 (6.8%) |
| $22,500 to $24,999 | 5 (8.2%) | 0 (0.0%) |
| $25,000 to $29,999 | 8 (13.1%) | 7 (11.9%) |
| $30,000 to $34,999 | 0 (0.0%) | 0 (0.0%) |
| $35,000 to $39,999 | 3 (4.9%) | 6 (10.2%) |
| $40,000 to $44,999 | 2 (3.3%) | 1 (1.7%) |
| $45,000 to $49,999 | 9 (14.7%) | 5 (8.5%) |
| $50,000 to $54,999 | 5 (8.2%) | 3 (5.1%) |
| $55,000 to $64,999 | 8 (13.1%) | 15 (25.4%) |
| $65,000 to $74,999 | 0 (0.0%) | 1 (1.7%) |
| $75,000 to $99,999 | 7 (11.5%) | 0 (0.0%) |
| $100,000+ | 0 (0.0%) | 7 (11.9%) |
| Total | 61 (100.0%) | 59 (100.0%) |
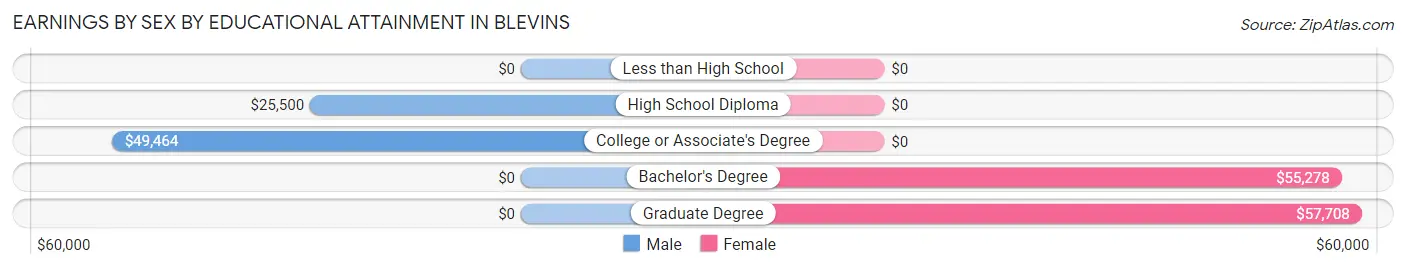
Earnings by Sex by Educational Attainment in Blevins
Average earnings in Blevins are $43,125 for men and $46,000 for women, a difference of 6.2%. Men with an educational attainment of college or associate's degree enjoy the highest average annual earnings of $49,464, while those with high school diploma education earn the least with $25,500. Women with an educational attainment of graduate degree earn the most with the average annual earnings of $57,708, while those with bachelor's degree education have the smallest earnings of $55,278.
| Educational Attainment | Male Income | Female Income |
| Less than High School | - | - |
| High School Diploma | $25,500 | $0 |
| College or Associate's Degree | $49,464 | $0 |
| Bachelor's Degree | - | - |
| Graduate Degree | - | - |
| Total | $43,125 | $46,000 |
Family Income in Blevins
Family Income Brackets in Blevins
According to the Blevins family income data, there are 21 families falling into the $100,000 to $149,999 income range, which is the most common income bracket and makes up 26.3% of all families.
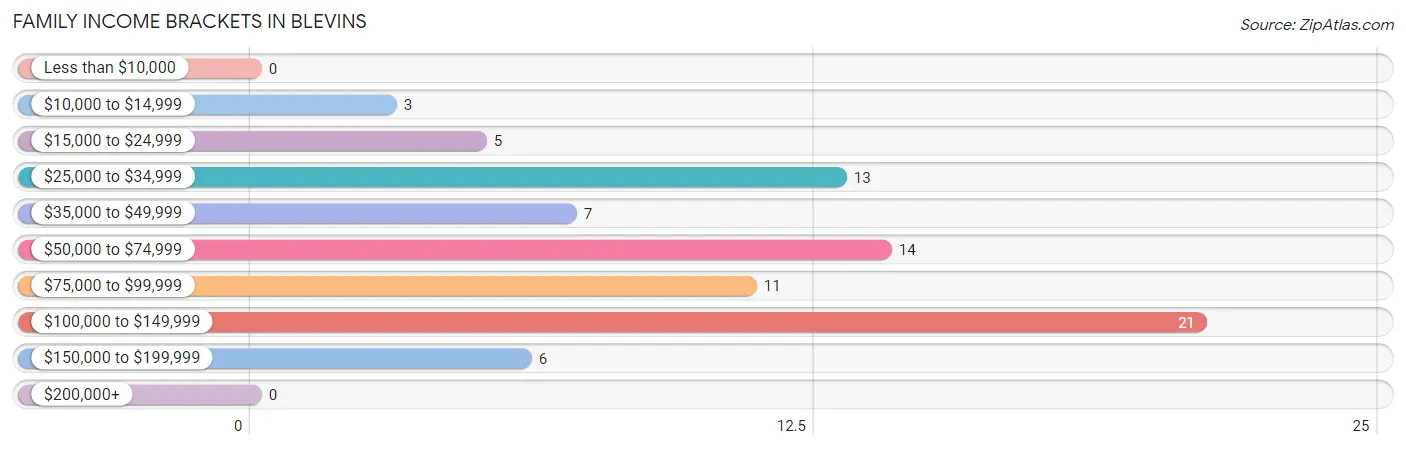
| Income Bracket | # Families | % Families |
| Less than $10,000 | 0 | 0.0% |
| $10,000 to $14,999 | 3 | 3.8% |
| $15,000 to $24,999 | 5 | 6.3% |
| $25,000 to $34,999 | 13 | 16.3% |
| $35,000 to $49,999 | 7 | 8.8% |
| $50,000 to $74,999 | 14 | 17.5% |
| $75,000 to $99,999 | 11 | 13.8% |
| $100,000 to $149,999 | 21 | 26.3% |
| $150,000 to $199,999 | 6 | 7.5% |
| $200,000+ | 0 | 0.0% |
Family Income by Famaliy Size in Blevins
3-person families (15 | 18.8%) account for the highest median family income in Blevins with $109,375 per family, while 3-person families (15 | 18.8%) have the highest median income of $36,458 per family member.
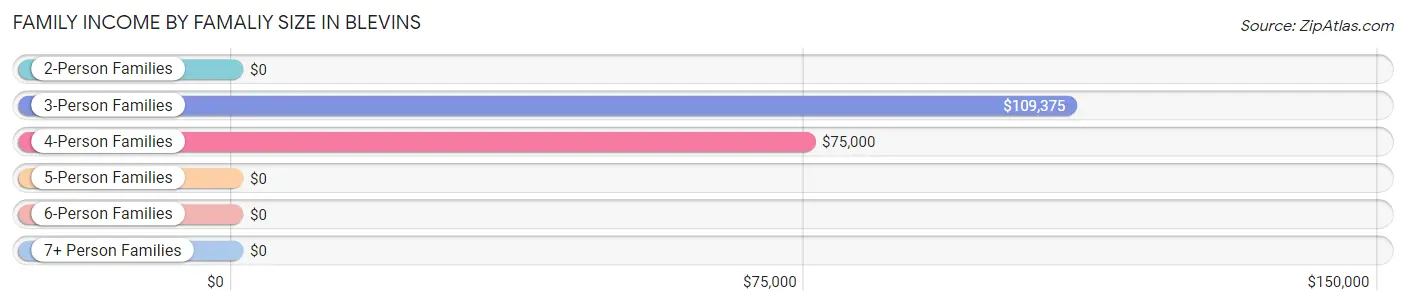
| Income Bracket | # Families | Median Income |
| 2-Person Families | 29 (36.2%) | $0 |
| 3-Person Families | 15 (18.8%) | $109,375 |
| 4-Person Families | 24 (30.0%) | $75,000 |
| 5-Person Families | 7 (8.7%) | $0 |
| 6-Person Families | 0 (0.0%) | $0 |
| 7+ Person Families | 5 (6.2%) | $0 |
| Total | 80 (100.0%) | $68,750 |
Family Income by Number of Earners in Blevins
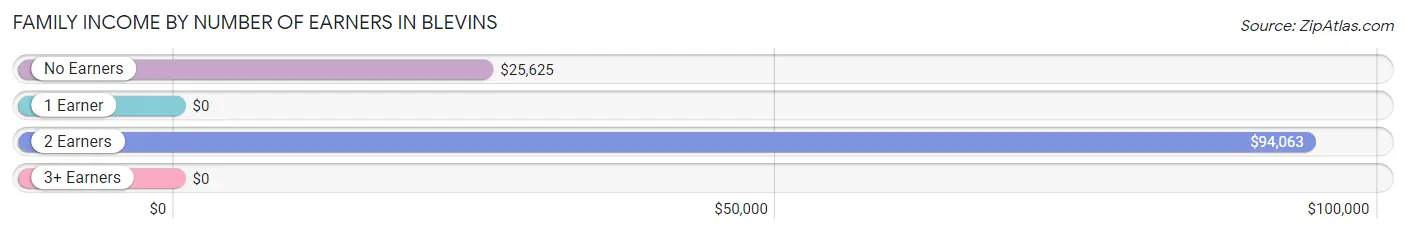
| Number of Earners | # Families | Median Income |
| No Earners | 18 (22.5%) | $25,625 |
| 1 Earner | 19 (23.7%) | $0 |
| 2 Earners | 43 (53.7%) | $94,063 |
| 3+ Earners | 0 (0.0%) | $0 |
| Total | 80 (100.0%) | $68,750 |
Household Income in Blevins
Household Income Brackets in Blevins
With 23 households falling in the category, the $100,000 to $149,999 income range is the most frequent in Blevins, accounting for 22.1% of all households.
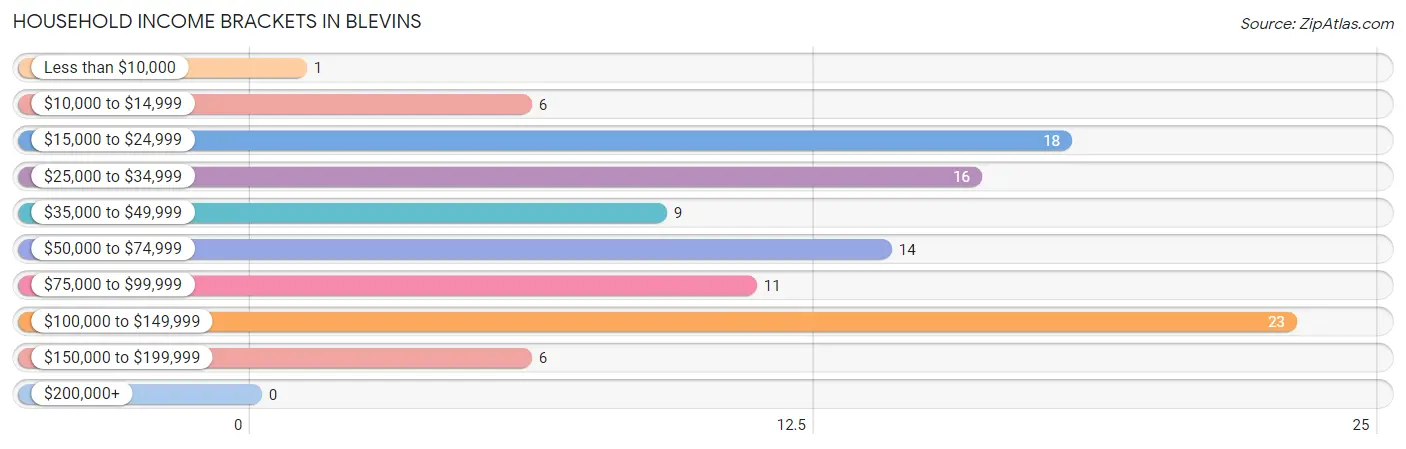
| Income Bracket | # Households | % Households |
| Less than $10,000 | 1 | 1.0% |
| $10,000 to $14,999 | 6 | 5.8% |
| $15,000 to $24,999 | 18 | 17.3% |
| $25,000 to $34,999 | 16 | 15.4% |
| $35,000 to $49,999 | 9 | 8.7% |
| $50,000 to $74,999 | 14 | 13.5% |
| $75,000 to $99,999 | 11 | 10.6% |
| $100,000 to $149,999 | 23 | 22.1% |
| $150,000 to $199,999 | 6 | 5.8% |
| $200,000+ | 0 | 0.0% |
Household Income by Householder Age in Blevins
The median household income in Blevins is $57,500, with the highest median household income of $91,250 found in the 45 to 64 years age bracket for the primary householder. A total of 23 households (22.1%) fall into this category.
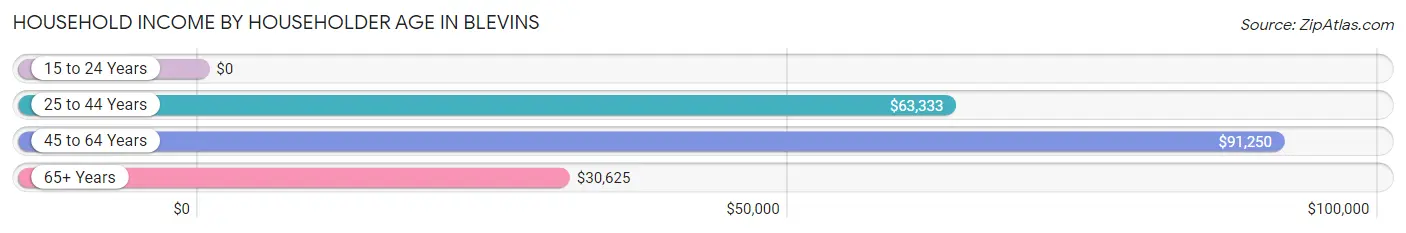
| Income Bracket | # Households | Median Income |
| 15 to 24 Years | 0 (0.0%) | $0 |
| 25 to 44 Years | 42 (40.4%) | $63,333 |
| 45 to 64 Years | 23 (22.1%) | $91,250 |
| 65+ Years | 39 (37.5%) | $30,625 |
| Total | 104 (100.0%) | $57,500 |
Poverty in Blevins
Income Below Poverty by Sex and Age in Blevins
With 29.5% poverty level for males and 18.2% for females among the residents of Blevins, 16 and 17 year old males and 12 to 14 year old females are the most vulnerable to poverty, with 8 males (61.5%) and 12 females (52.2%) in their respective age groups living below the poverty level.
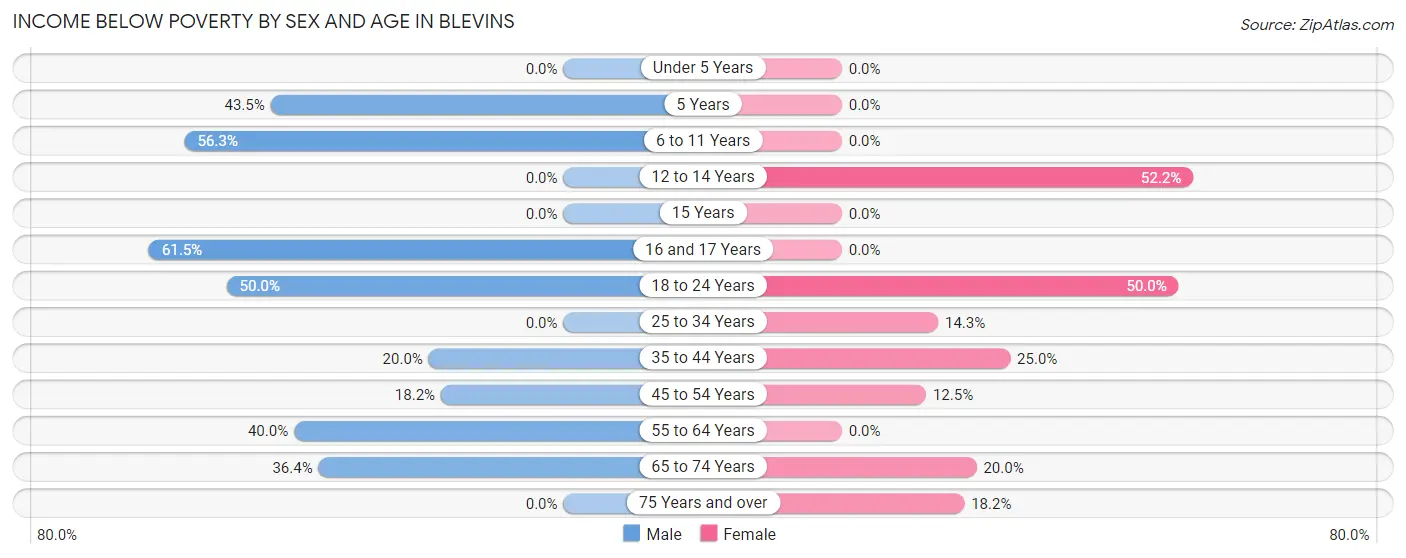
| Age Bracket | Male | Female |
| Under 5 Years | 0 (0.0%) | 0 (0.0%) |
| 5 Years | 10 (43.5%) | 0 (0.0%) |
| 6 to 11 Years | 9 (56.2%) | 0 (0.0%) |
| 12 to 14 Years | 0 (0.0%) | 12 (52.2%) |
| 15 Years | 0 (0.0%) | 0 (0.0%) |
| 16 and 17 Years | 8 (61.5%) | 0 (0.0%) |
| 18 to 24 Years | 3 (50.0%) | 1 (50.0%) |
| 25 to 34 Years | 0 (0.0%) | 5 (14.3%) |
| 35 to 44 Years | 5 (20.0%) | 4 (25.0%) |
| 45 to 54 Years | 2 (18.2%) | 2 (12.5%) |
| 55 to 64 Years | 4 (40.0%) | 0 (0.0%) |
| 65 to 74 Years | 8 (36.4%) | 4 (20.0%) |
| 75 Years and over | 0 (0.0%) | 2 (18.2%) |
| Total | 49 (29.5%) | 30 (18.2%) |
Income Above Poverty by Sex and Age in Blevins
According to the poverty statistics in Blevins, males aged under 5 years and females aged under 5 years are the age groups that are most secure financially, with 100.0% of males and 100.0% of females in these age groups living above the poverty line.
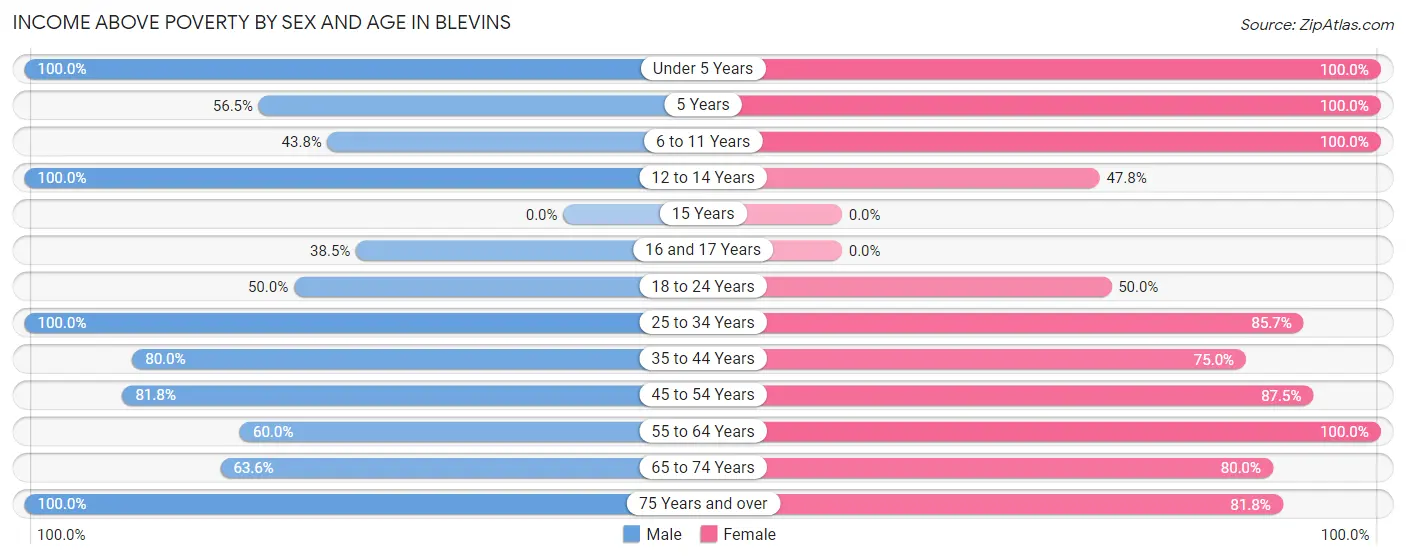
| Age Bracket | Male | Female |
| Under 5 Years | 14 (100.0%) | 12 (100.0%) |
| 5 Years | 13 (56.5%) | 4 (100.0%) |
| 6 to 11 Years | 7 (43.8%) | 21 (100.0%) |
| 12 to 14 Years | 4 (100.0%) | 11 (47.8%) |
| 15 Years | 0 (0.0%) | 0 (0.0%) |
| 16 and 17 Years | 5 (38.5%) | 0 (0.0%) |
| 18 to 24 Years | 3 (50.0%) | 1 (50.0%) |
| 25 to 34 Years | 17 (100.0%) | 30 (85.7%) |
| 35 to 44 Years | 20 (80.0%) | 12 (75.0%) |
| 45 to 54 Years | 9 (81.8%) | 14 (87.5%) |
| 55 to 64 Years | 6 (60.0%) | 5 (100.0%) |
| 65 to 74 Years | 14 (63.6%) | 16 (80.0%) |
| 75 Years and over | 5 (100.0%) | 9 (81.8%) |
| Total | 117 (70.5%) | 135 (81.8%) |
Income Below Poverty Among Married-Couple Families in Blevins
The poverty statistics for married-couple families in Blevins show that 17.6% or 12 of the total 68 families live below the poverty line. Families with 5 or more children have the highest poverty rate of 100.0%, comprising of 5 families. On the other hand, families with 3 or 4 children have the lowest poverty rate of 0.0%, which includes 0 families.
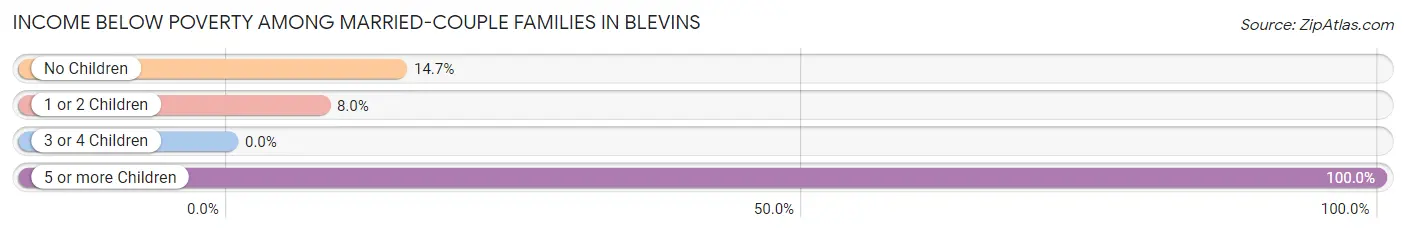
| Children | Above Poverty | Below Poverty |
| No Children | 29 (85.3%) | 5 (14.7%) |
| 1 or 2 Children | 23 (92.0%) | 2 (8.0%) |
| 3 or 4 Children | 4 (100.0%) | 0 (0.0%) |
| 5 or more Children | 0 (0.0%) | 5 (100.0%) |
| Total | 56 (82.4%) | 12 (17.6%) |
Income Below Poverty Among Single-Parent Households in Blevins
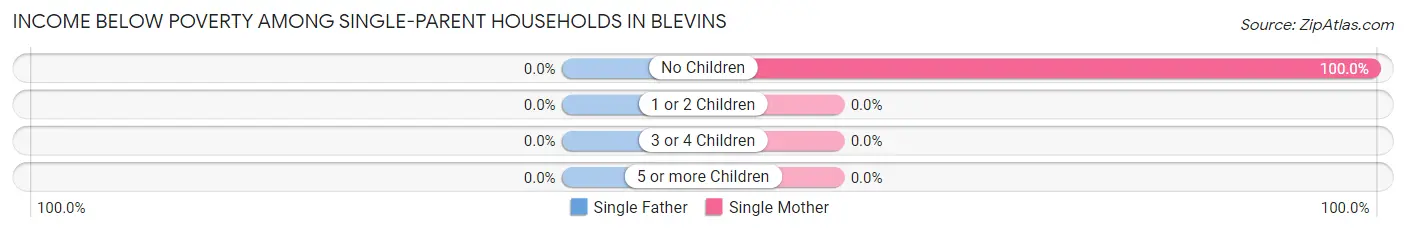
| Children | Single Father | Single Mother |
| No Children | 0 (0.0%) | 1 (100.0%) |
| 1 or 2 Children | 0 (0.0%) | 0 (0.0%) |
| 3 or 4 Children | 0 (0.0%) | 0 (0.0%) |
| 5 or more Children | 0 (0.0%) | 0 (0.0%) |
| Total | 0 (0.0%) | 1 (8.3%) |
Income Below Poverty Among Married-Couple vs Single-Parent Households in Blevins
The poverty data for Blevins shows that 12 of the married-couple family households (17.6%) and 1 of the single-parent households (8.3%) are living below the poverty level. Within the married-couple family households, those with 5 or more children have the highest poverty rate, with 5 households (100.0%) falling below the poverty line. Among the single-parent households, those with no children have the highest poverty rate, with 1 household (100.0%) living below poverty.
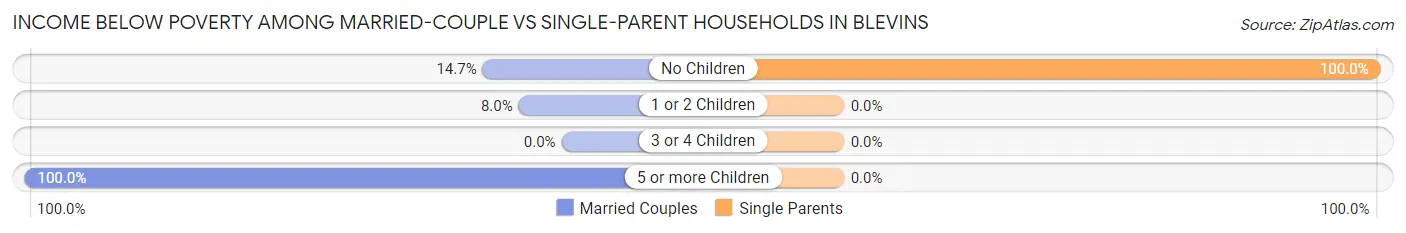
| Children | Married-Couple Families | Single-Parent Households |
| No Children | 5 (14.7%) | 1 (100.0%) |
| 1 or 2 Children | 2 (8.0%) | 0 (0.0%) |
| 3 or 4 Children | 0 (0.0%) | 0 (0.0%) |
| 5 or more Children | 5 (100.0%) | 0 (0.0%) |
| Total | 12 (17.6%) | 1 (8.3%) |
Race in Blevins
The most populous races in Blevins are White / Caucasian (228 | 68.9%), Black / African American (54 | 16.3%), and Hispanic or Latino (51 | 15.4%).
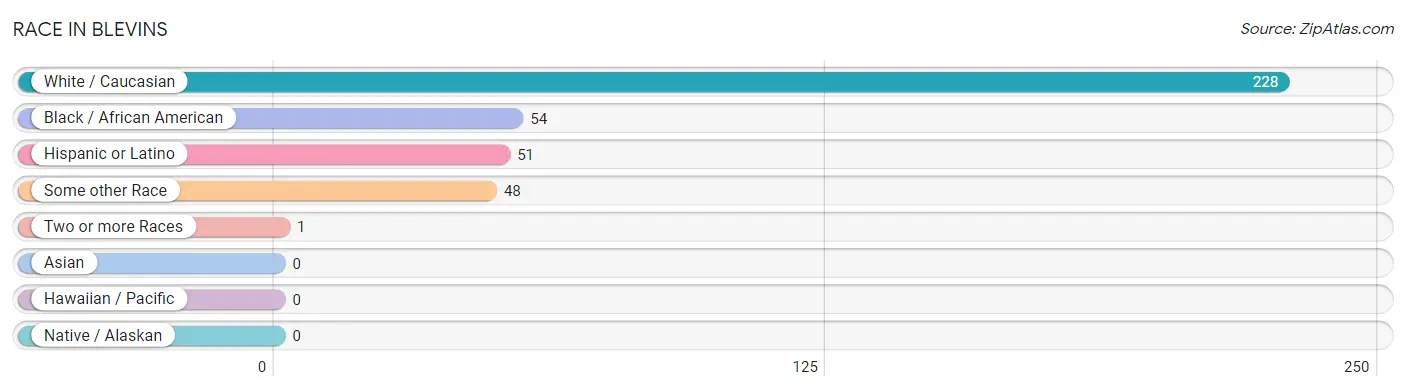
| Race | # Population | % Population |
| Asian | 0 | 0.0% |
| Black / African American | 54 | 16.3% |
| Hawaiian / Pacific | 0 | 0.0% |
| Hispanic or Latino | 51 | 15.4% |
| Native / Alaskan | 0 | 0.0% |
| White / Caucasian | 228 | 68.9% |
| Two or more Races | 1 | 0.3% |
| Some other Race | 48 | 14.5% |
| Total | 331 | 100.0% |
Ancestry in Blevins
The most populous ancestries reported in Blevins are Mexican (50 | 15.1%), Irish (41 | 12.4%), German (19 | 5.7%), European (18 | 5.4%), and English (17 | 5.1%), together accounting for 43.8% of all Blevins residents.
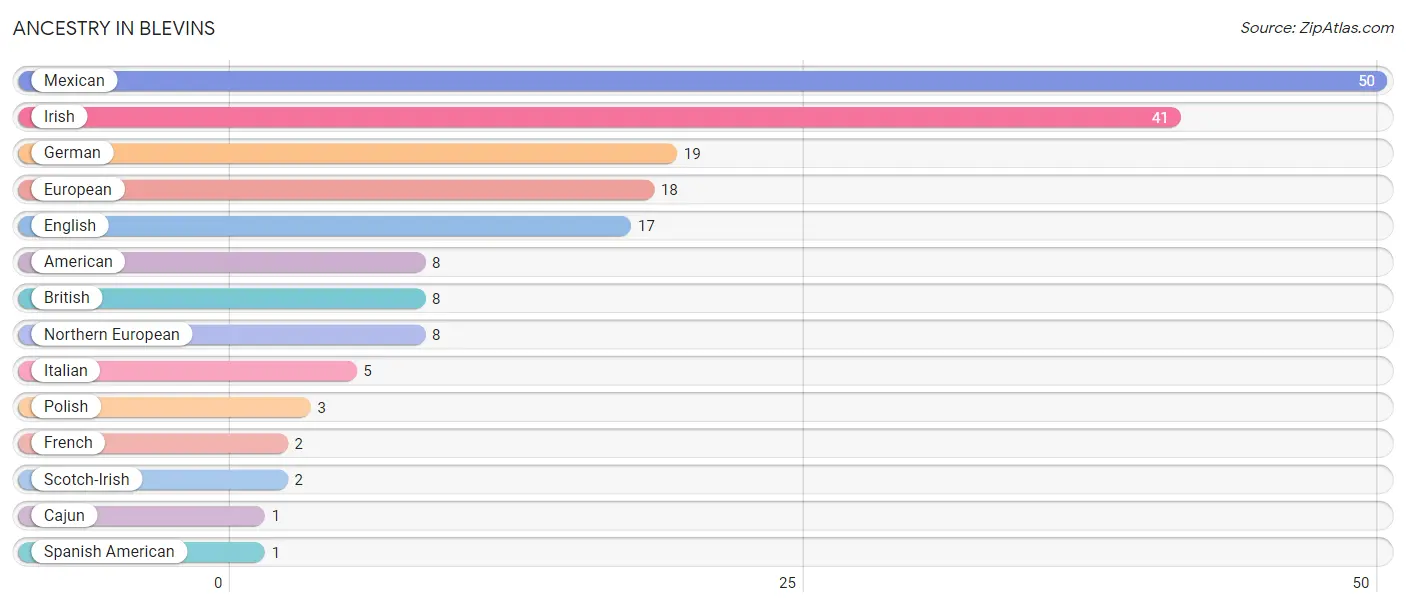
| Ancestry | # Population | % Population |
| American | 8 | 2.4% |
| British | 8 | 2.4% |
| Cajun | 1 | 0.3% |
| English | 17 | 5.1% |
| European | 18 | 5.4% |
| French | 2 | 0.6% |
| German | 19 | 5.7% |
| Irish | 41 | 12.4% |
| Italian | 5 | 1.5% |
| Mexican | 50 | 15.1% |
| Northern European | 8 | 2.4% |
| Polish | 3 | 0.9% |
| Scotch-Irish | 2 | 0.6% |
| Spanish American | 1 | 0.3% | View All 14 Rows |
Immigrants in Blevins
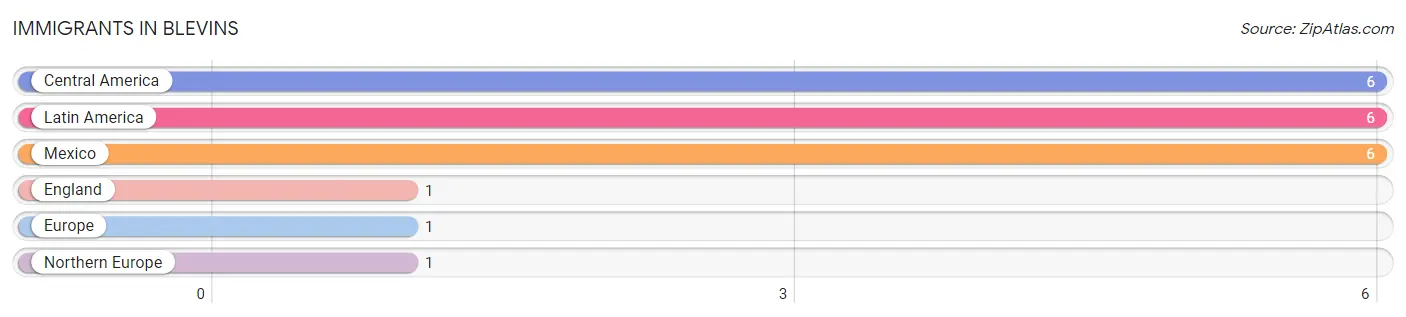
The most numerous immigrant groups reported in Blevins came from Central America (6 | 1.8%), Latin America (6 | 1.8%), Mexico (6 | 1.8%), England (1 | 0.3%), and Europe (1 | 0.3%), together accounting for 6.0% of all Blevins residents.
| Immigration Origin | # Population | % Population |
| Central America | 6 | 1.8% |
| England | 1 | 0.3% |
| Europe | 1 | 0.3% |
| Latin America | 6 | 1.8% |
| Mexico | 6 | 1.8% |
| Northern Europe | 1 | 0.3% | View All 6 Rows |
Sex and Age in Blevins
Sex and Age in Blevins
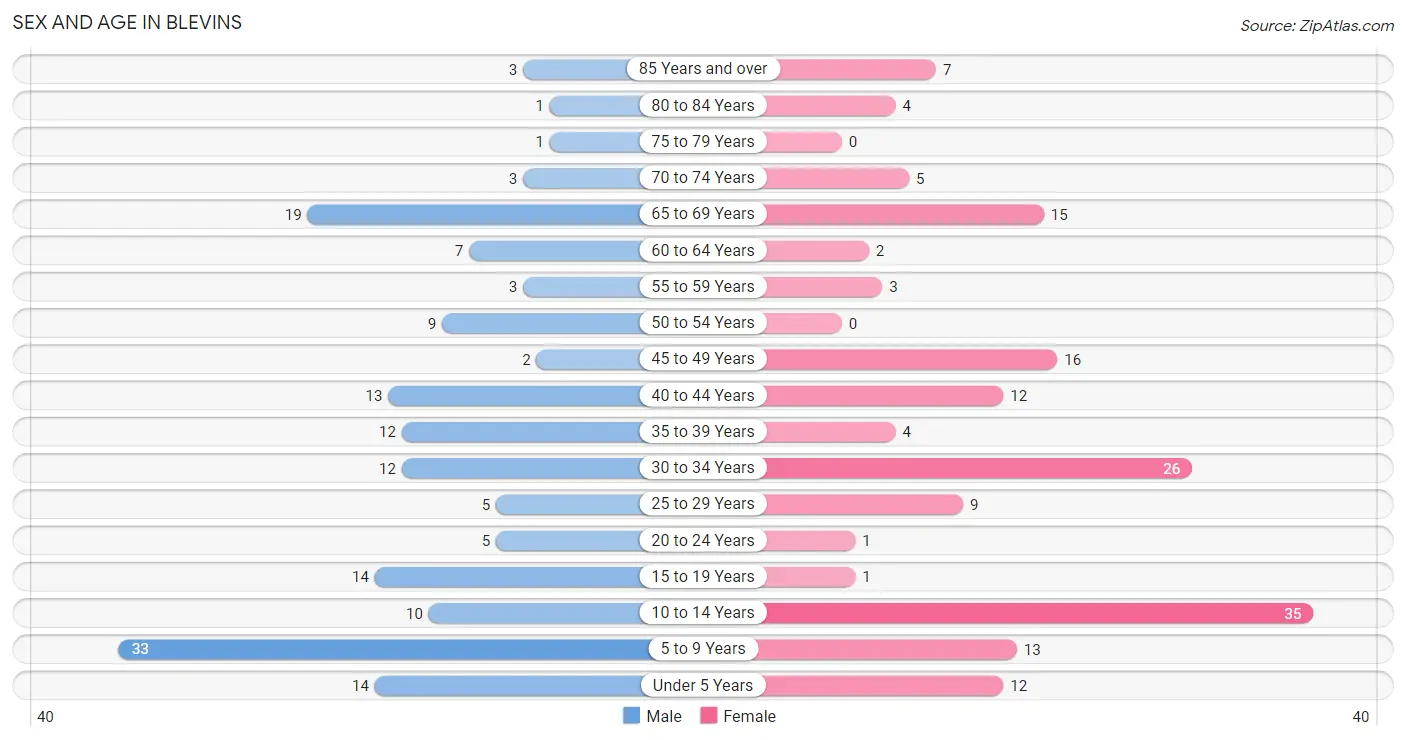
The most populous age groups in Blevins are 5 to 9 Years (33 | 19.9%) for men and 10 to 14 Years (35 | 21.2%) for women.
| Age Bracket | Male | Female |
| Under 5 Years | 14 (8.4%) | 12 (7.3%) |
| 5 to 9 Years | 33 (19.9%) | 13 (7.9%) |
| 10 to 14 Years | 10 (6.0%) | 35 (21.2%) |
| 15 to 19 Years | 14 (8.4%) | 1 (0.6%) |
| 20 to 24 Years | 5 (3.0%) | 1 (0.6%) |
| 25 to 29 Years | 5 (3.0%) | 9 (5.4%) |
| 30 to 34 Years | 12 (7.2%) | 26 (15.8%) |
| 35 to 39 Years | 12 (7.2%) | 4 (2.4%) |
| 40 to 44 Years | 13 (7.8%) | 12 (7.3%) |
| 45 to 49 Years | 2 (1.2%) | 16 (9.7%) |
| 50 to 54 Years | 9 (5.4%) | 0 (0.0%) |
| 55 to 59 Years | 3 (1.8%) | 3 (1.8%) |
| 60 to 64 Years | 7 (4.2%) | 2 (1.2%) |
| 65 to 69 Years | 19 (11.5%) | 15 (9.1%) |
| 70 to 74 Years | 3 (1.8%) | 5 (3.0%) |
| 75 to 79 Years | 1 (0.6%) | 0 (0.0%) |
| 80 to 84 Years | 1 (0.6%) | 4 (2.4%) |
| 85 Years and over | 3 (1.8%) | 7 (4.2%) |
| Total | 166 (100.0%) | 165 (100.0%) |
Families and Households in Blevins
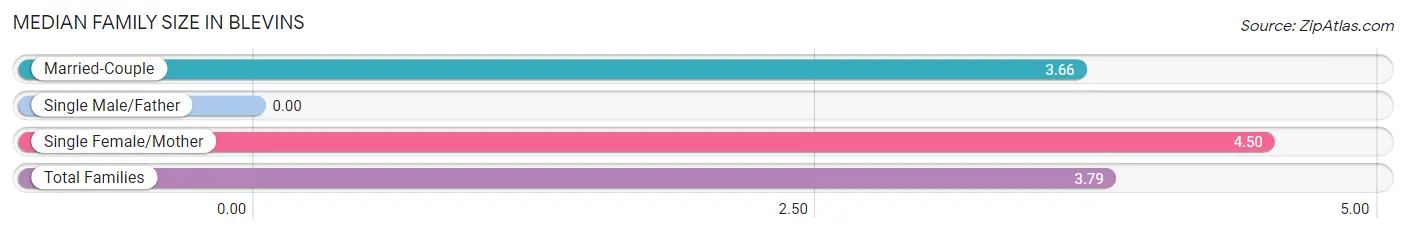
Median Family Size in Blevins
| Family Type | # Families | Family Size |
| Married-Couple | 68 (85.0%) | 3.66 |
| Single Male/Father | 0 (0.0%) | - |
| Single Female/Mother | 12 (15.0%) | 4.50 |
| Total Families | 80 (100.0%) | 3.79 |
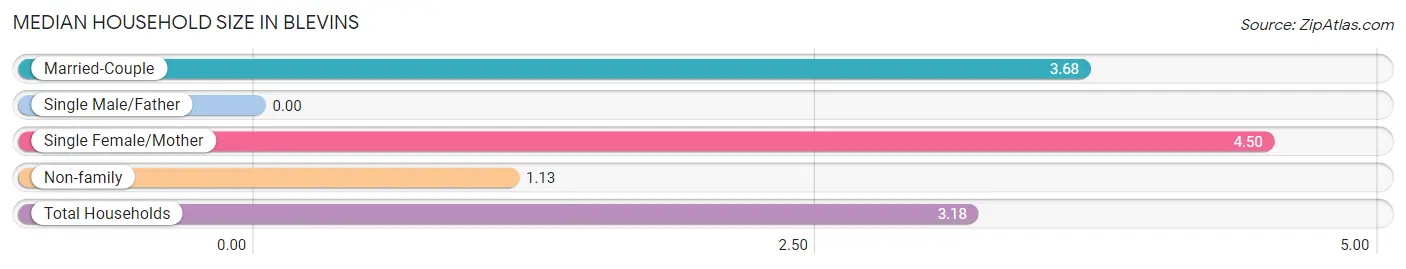
Median Household Size in Blevins
| Household Type | # Households | Household Size |
| Married-Couple | 68 (65.4%) | 3.68 |
| Single Male/Father | 0 (0.0%) | - |
| Single Female/Mother | 12 (11.5%) | 4.50 |
| Non-family | 24 (23.1%) | 1.13 |
| Total Households | 104 (100.0%) | 3.18 |
Household Size by Marriage Status in Blevins
Out of a total of 104 households in Blevins, 80 (76.9%) are family households, while 24 (23.1%) are nonfamily households. The most numerous type of family households are 2-person households, comprising 29, and the most common type of nonfamily households are 1-person households, comprising 21.
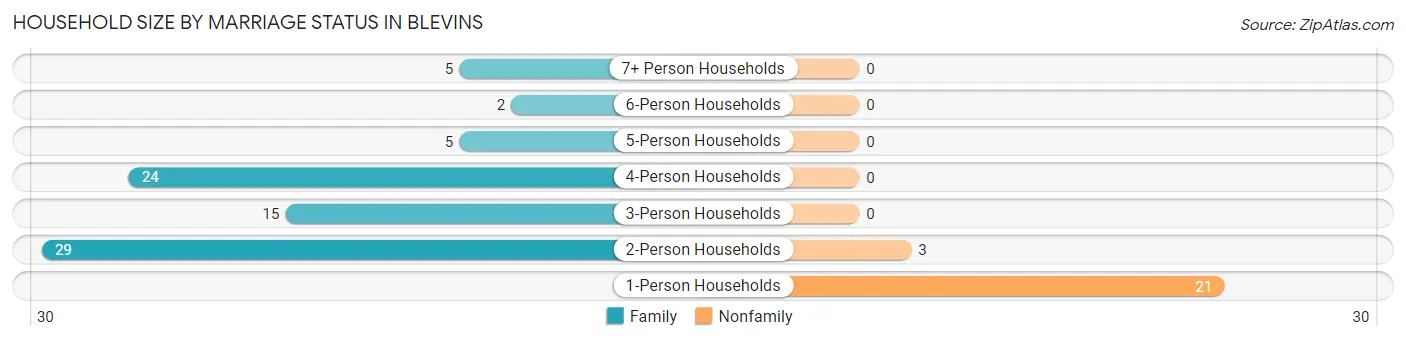
| Household Size | Family Households | Nonfamily Households |
| 1-Person Households | - | 21 (20.2%) |
| 2-Person Households | 29 (27.9%) | 3 (2.9%) |
| 3-Person Households | 15 (14.4%) | 0 (0.0%) |
| 4-Person Households | 24 (23.1%) | 0 (0.0%) |
| 5-Person Households | 5 (4.8%) | 0 (0.0%) |
| 6-Person Households | 2 (1.9%) | 0 (0.0%) |
| 7+ Person Households | 5 (4.8%) | 0 (0.0%) |
| Total | 80 (76.9%) | 24 (23.1%) |
Female Fertility in Blevins
Fertility by Age in Blevins
Average fertility rate in Blevins is 130.0 births per 1,000 women. Women in the age bracket of 20 to 34 years have the highest fertility rate with 250.0 births per 1,000 women. Women in the age bracket of 20 to 34 years acount for 100.0% of all women with births.
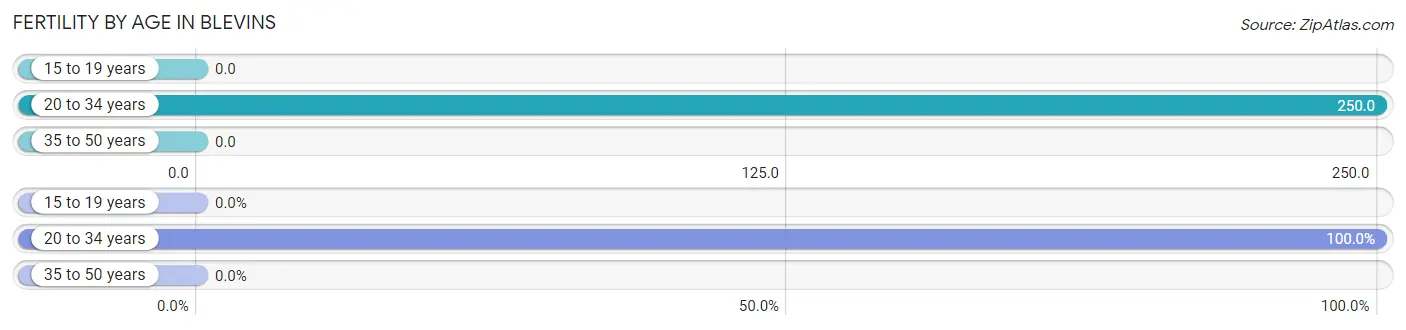
| Age Bracket | Women with Births | Births / 1,000 Women |
| 15 to 19 years | 0 (0.0%) | 0.0 |
| 20 to 34 years | 9 (100.0%) | 250.0 |
| 35 to 50 years | 0 (0.0%) | 0.0 |
| Total | 9 (100.0%) | 130.0 |
Fertility by Age by Marriage Status in Blevins
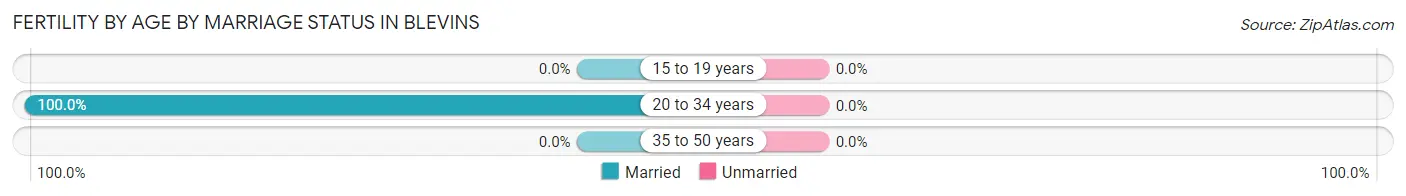
| Age Bracket | Married | Unmarried |
| 15 to 19 years | 0 (0.0%) | 0 (0.0%) |
| 20 to 34 years | 9 (100.0%) | 0 (0.0%) |
| 35 to 50 years | 0 (0.0%) | 0 (0.0%) |
| Total | 9 (100.0%) | 0 (0.0%) |
Fertility by Education in Blevins
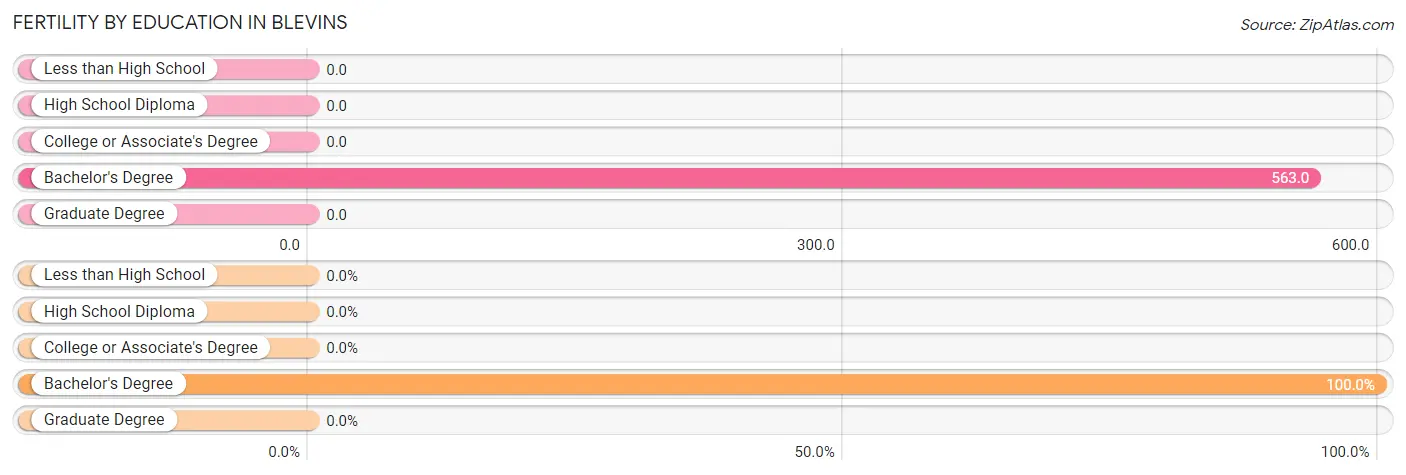
| Educational Attainment | Women with Births | Births / 1,000 Women |
| Less than High School | 0 (0.0%) | 0.0 |
| High School Diploma | 0 (0.0%) | 0.0 |
| College or Associate's Degree | 0 (0.0%) | 0.0 |
| Bachelor's Degree | 9 (100.0%) | 563.0 |
| Graduate Degree | 0 (0.0%) | 0.0 |
| Total | 9 (100.0%) | 130.0 |
Fertility by Education by Marriage Status in Blevins
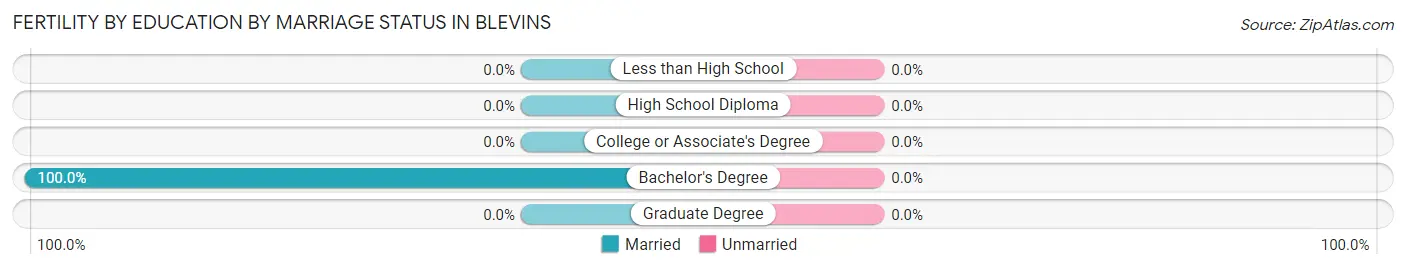
| Educational Attainment | Married | Unmarried |
| Less than High School | 0 (0.0%) | 0 (0.0%) |
| High School Diploma | 0 (0.0%) | 0 (0.0%) |
| College or Associate's Degree | 0 (0.0%) | 0 (0.0%) |
| Bachelor's Degree | 9 (100.0%) | 0 (0.0%) |
| Graduate Degree | 0 (0.0%) | 0 (0.0%) |
| Total | 9 (100.0%) | 0 (0.0%) |
Employment Characteristics in Blevins
Employment by Class of Employer in Blevins
Among the 110 employed individuals in Blevins, private company employees (54 | 49.1%), local government employees (33 | 30.0%), and state government employees (14 | 12.7%) make up the most common classes of employment.
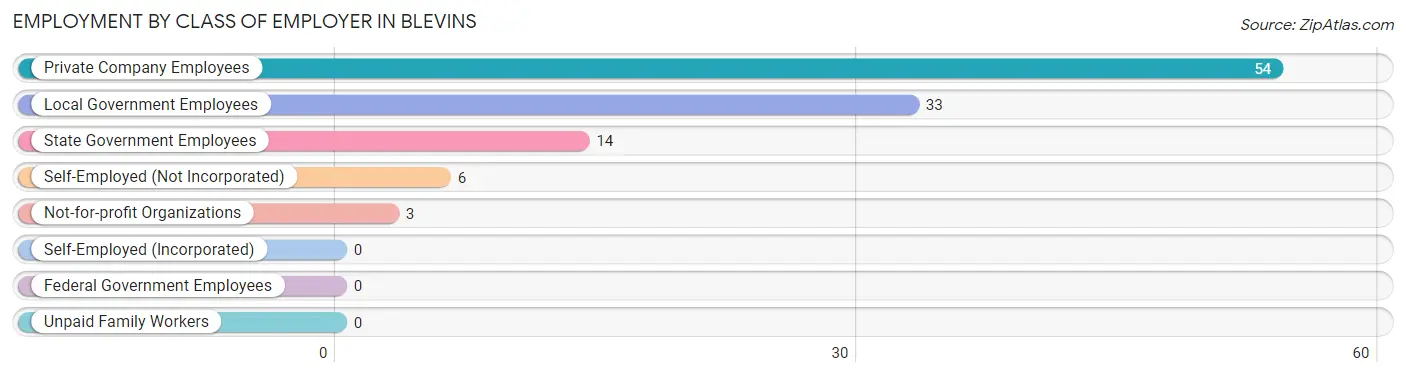
| Employer Class | # Employees | % Employees |
| Private Company Employees | 54 | 49.1% |
| Self-Employed (Incorporated) | 0 | 0.0% |
| Self-Employed (Not Incorporated) | 6 | 5.4% |
| Not-for-profit Organizations | 3 | 2.7% |
| Local Government Employees | 33 | 30.0% |
| State Government Employees | 14 | 12.7% |
| Federal Government Employees | 0 | 0.0% |
| Unpaid Family Workers | 0 | 0.0% |
| Total | 110 | 100.0% |
Employment Status by Age in Blevins
According to the labor force statistics for Blevins, out of the total population over 16 years of age (214), 59.8% or 128 individuals are in the labor force, with 10.9% or 14 of them unemployed. The age group with the highest labor force participation rate is 45 to 54 years, with 100.0% or 27 individuals in the labor force. Within the labor force, the 16 to 19 years age range has the highest percentage of unemployed individuals, with 100.0% or 2 of them being unemployed.
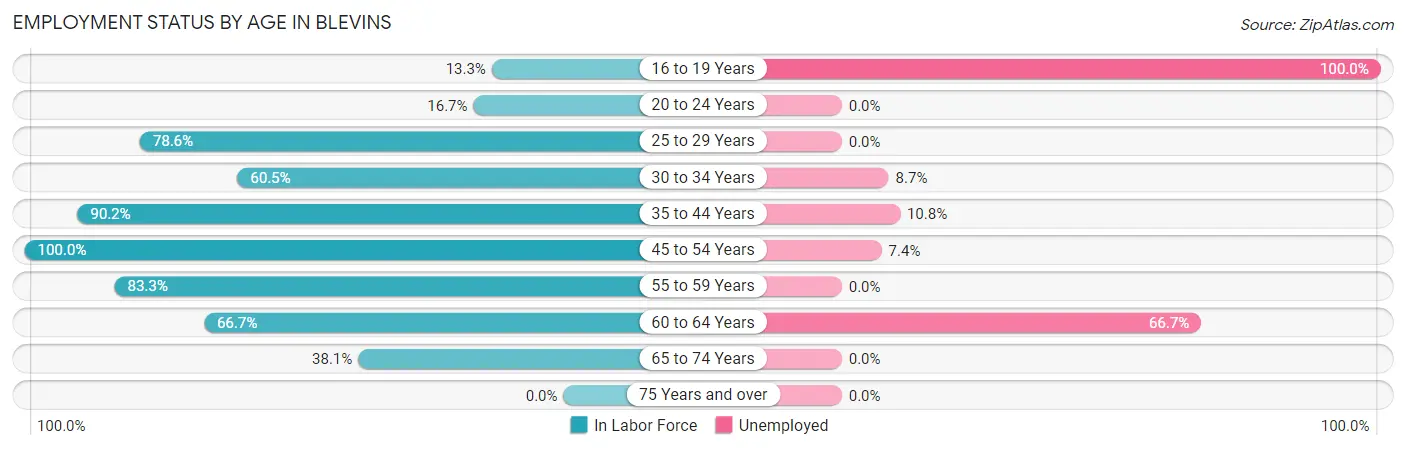
| Age Bracket | In Labor Force | Unemployed |
| 16 to 19 Years | 2 (13.3%) | 2 (100.0%) |
| 20 to 24 Years | 1 (16.7%) | 0 (0.0%) |
| 25 to 29 Years | 11 (78.6%) | 0 (0.0%) |
| 30 to 34 Years | 23 (60.5%) | 2 (8.7%) |
| 35 to 44 Years | 37 (90.2%) | 4 (10.8%) |
| 45 to 54 Years | 27 (100.0%) | 2 (7.4%) |
| 55 to 59 Years | 5 (83.3%) | 0 (0.0%) |
| 60 to 64 Years | 6 (66.7%) | 4 (66.7%) |
| 65 to 74 Years | 16 (38.1%) | 0 (0.0%) |
| 75 Years and over | 0 (0.0%) | 0 (0.0%) |
| Total | 128 (59.8%) | 14 (10.9%) |
Employment Status by Educational Attainment in Blevins
According to labor force statistics for Blevins, 80.7% of individuals (109) out of the total population between 25 and 64 years of age (135) are in the labor force, with 11.0% or 12 of them being unemployed. The group with the highest labor force participation rate are those with the educational attainment of bachelor's degree or higher, with 100.0% or 29 individuals in the labor force. Within the labor force, individuals with high school diploma education have the highest percentage of unemployment, with 28.6% or 6 of them being unemployed.
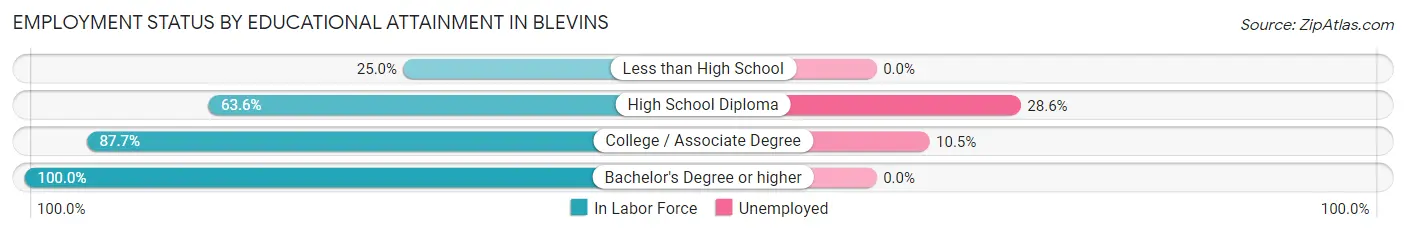
| Educational Attainment | In Labor Force | Unemployed |
| Less than High School | 2 (25.0%) | 0 (0.0%) |
| High School Diploma | 21 (63.6%) | 9 (28.6%) |
| College / Associate Degree | 57 (87.7%) | 7 (10.5%) |
| Bachelor's Degree or higher | 29 (100.0%) | 0 (0.0%) |
| Total | 109 (80.7%) | 15 (11.0%) |
Employment Occupations by Sex in Blevins
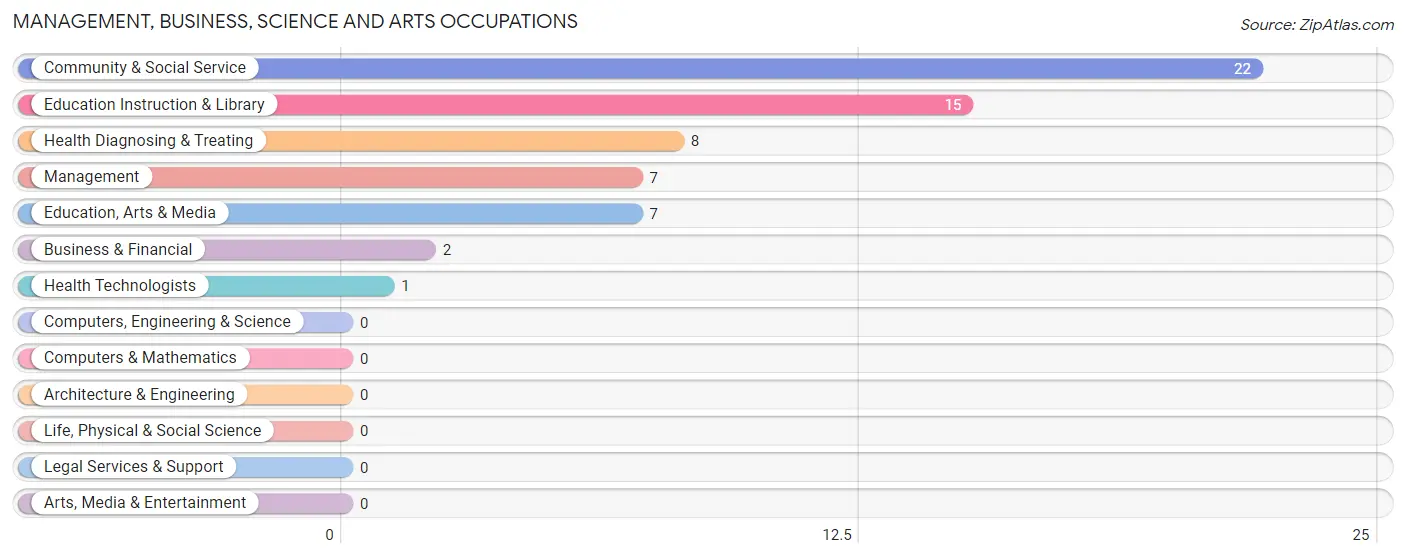
Management, Business, Science and Arts Occupations
The most common Management, Business, Science and Arts occupations in Blevins are Community & Social Service (22 | 19.3%), Education Instruction & Library (15 | 13.2%), Health Diagnosing & Treating (8 | 7.0%), Management (7 | 6.1%), and Education, Arts & Media (7 | 6.1%).
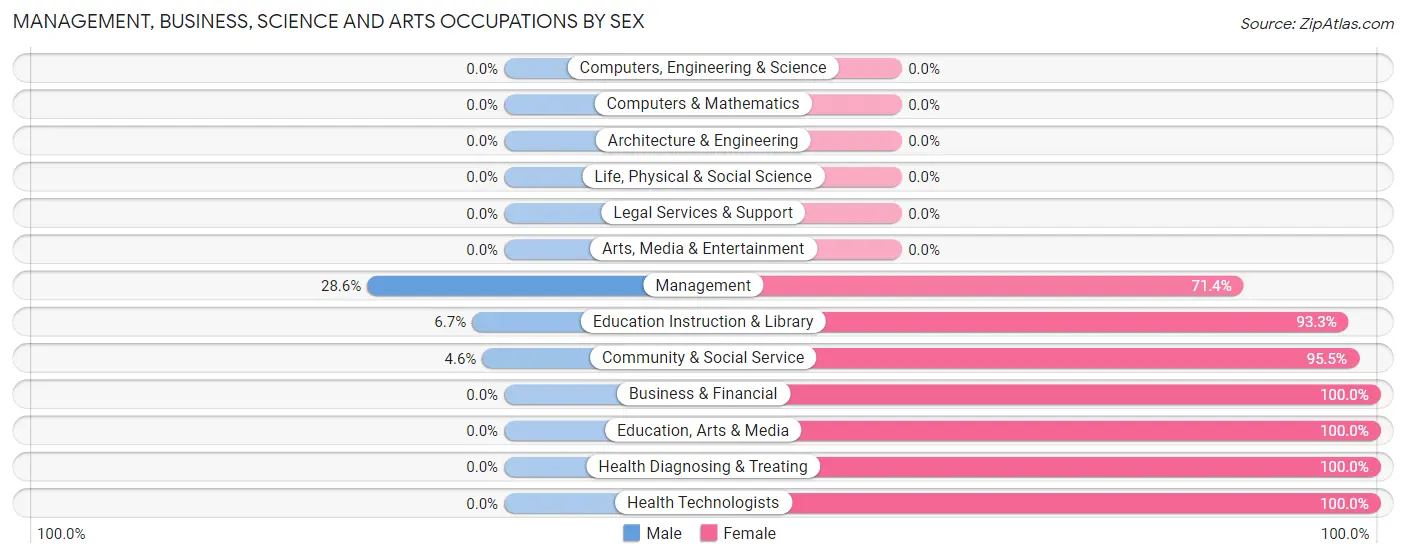
Management, Business, Science and Arts Occupations by Sex
Within the Management, Business, Science and Arts occupations in Blevins, the most male-oriented occupations are Management (28.6%), Education Instruction & Library (6.7%), and Community & Social Service (4.5%), while the most female-oriented occupations are Business & Financial (100.0%), Education, Arts & Media (100.0%), and Health Diagnosing & Treating (100.0%).
| Occupation | Male | Female |
| Management | 2 (28.6%) | 5 (71.4%) |
| Business & Financial | 0 (0.0%) | 2 (100.0%) |
| Computers, Engineering & Science | 0 (0.0%) | 0 (0.0%) |
| Computers & Mathematics | 0 (0.0%) | 0 (0.0%) |
| Architecture & Engineering | 0 (0.0%) | 0 (0.0%) |
| Life, Physical & Social Science | 0 (0.0%) | 0 (0.0%) |
| Community & Social Service | 1 (4.5%) | 21 (95.5%) |
| Education, Arts & Media | 0 (0.0%) | 7 (100.0%) |
| Legal Services & Support | 0 (0.0%) | 0 (0.0%) |
| Education Instruction & Library | 1 (6.7%) | 14 (93.3%) |
| Arts, Media & Entertainment | 0 (0.0%) | 0 (0.0%) |
| Health Diagnosing & Treating | 0 (0.0%) | 8 (100.0%) |
| Health Technologists | 0 (0.0%) | 1 (100.0%) |
| Total (Category) | 3 (7.7%) | 36 (92.3%) |
| Total (Overall) | 55 (48.2%) | 59 (51.7%) |
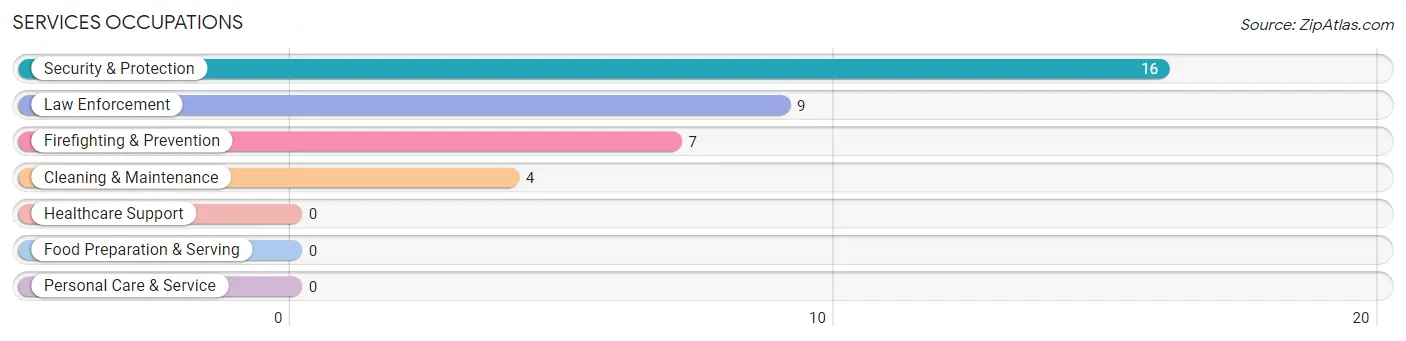
Services Occupations
The most common Services occupations in Blevins are Security & Protection (16 | 14.0%), Law Enforcement (9 | 7.9%), Firefighting & Prevention (7 | 6.1%), and Cleaning & Maintenance (4 | 3.5%).
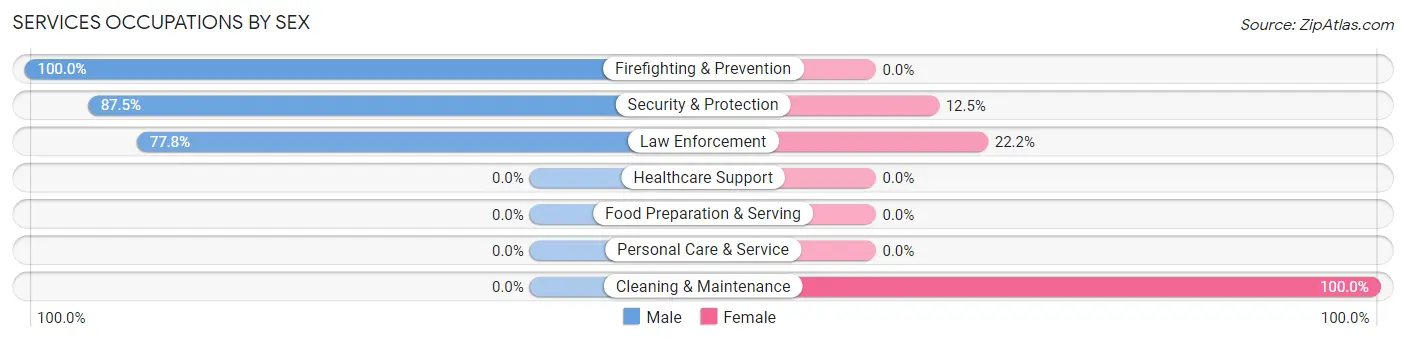
Services Occupations by Sex
Within the Services occupations in Blevins, the most male-oriented occupations are Firefighting & Prevention (100.0%), Security & Protection (87.5%), and Law Enforcement (77.8%), while the most female-oriented occupations are Cleaning & Maintenance (100.0%), Law Enforcement (22.2%), and Security & Protection (12.5%).
| Occupation | Male | Female |
| Healthcare Support | 0 (0.0%) | 0 (0.0%) |
| Security & Protection | 14 (87.5%) | 2 (12.5%) |
| Firefighting & Prevention | 7 (100.0%) | 0 (0.0%) |
| Law Enforcement | 7 (77.8%) | 2 (22.2%) |
| Food Preparation & Serving | 0 (0.0%) | 0 (0.0%) |
| Cleaning & Maintenance | 0 (0.0%) | 4 (100.0%) |
| Personal Care & Service | 0 (0.0%) | 0 (0.0%) |
| Total (Category) | 14 (70.0%) | 6 (30.0%) |
| Total (Overall) | 55 (48.2%) | 59 (51.7%) |
Sales and Office Occupations
The most common Sales and Office occupations in Blevins are Office & Administration (15 | 13.2%), and Sales & Related (11 | 9.7%).
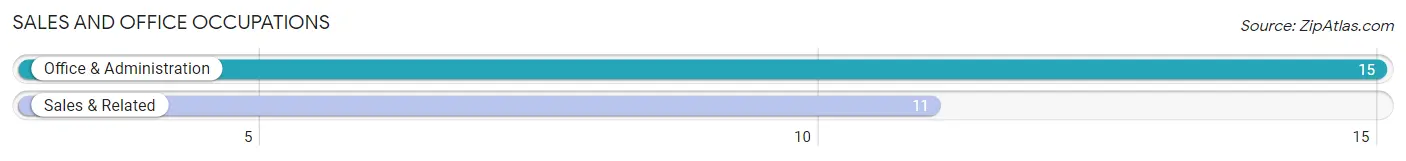
Sales and Office Occupations by Sex
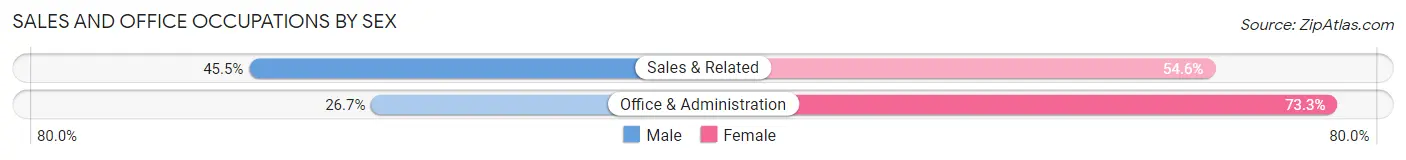
| Occupation | Male | Female |
| Sales & Related | 5 (45.5%) | 6 (54.5%) |
| Office & Administration | 4 (26.7%) | 11 (73.3%) |
| Total (Category) | 9 (34.6%) | 17 (65.4%) |
| Total (Overall) | 55 (48.2%) | 59 (51.7%) |
Natural Resources, Construction and Maintenance Occupations
The most common Natural Resources, Construction and Maintenance occupations in Blevins are Farming, Fishing & Forestry (5 | 4.4%), and Installation, Maintenance & Repair (4 | 3.5%).
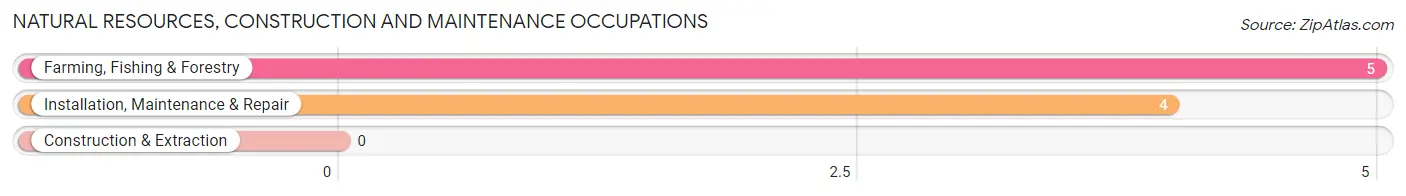
Natural Resources, Construction and Maintenance Occupations by Sex
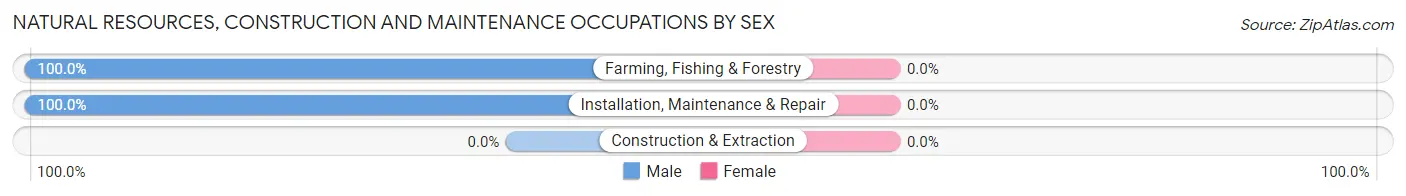
| Occupation | Male | Female |
| Farming, Fishing & Forestry | 5 (100.0%) | 0 (0.0%) |
| Construction & Extraction | 0 (0.0%) | 0 (0.0%) |
| Installation, Maintenance & Repair | 4 (100.0%) | 0 (0.0%) |
| Total (Category) | 9 (100.0%) | 0 (0.0%) |
| Total (Overall) | 55 (48.2%) | 59 (51.7%) |
Production, Transportation and Moving Occupations
The most common Production, Transportation and Moving occupations in Blevins are Transportation (10 | 8.8%), Production (5 | 4.4%), and Material Moving (5 | 4.4%).
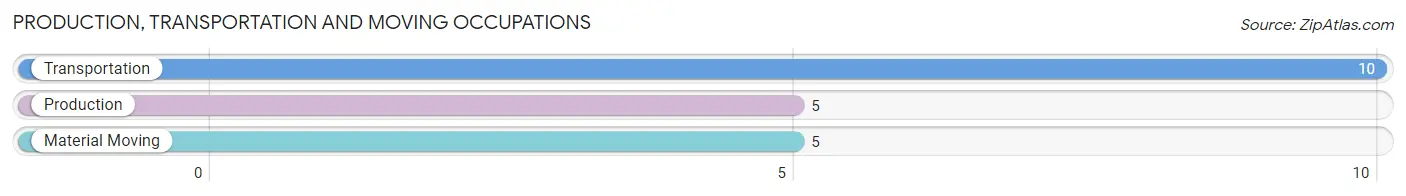
Production, Transportation and Moving Occupations by Sex
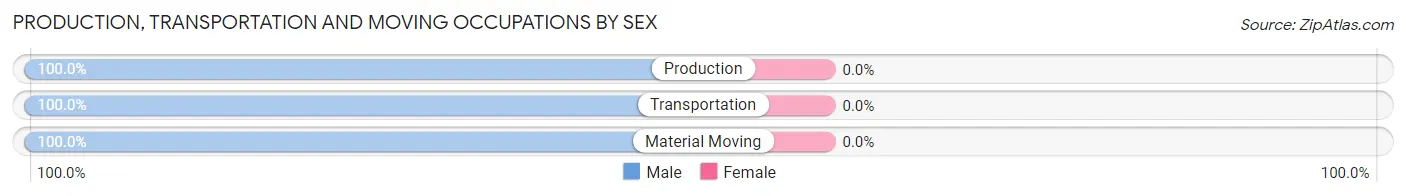
| Occupation | Male | Female |
| Production | 5 (100.0%) | 0 (0.0%) |
| Transportation | 10 (100.0%) | 0 (0.0%) |
| Material Moving | 5 (100.0%) | 0 (0.0%) |
| Total (Category) | 20 (100.0%) | 0 (0.0%) |
| Total (Overall) | 55 (48.2%) | 59 (51.7%) |
Employment Industries by Sex in Blevins
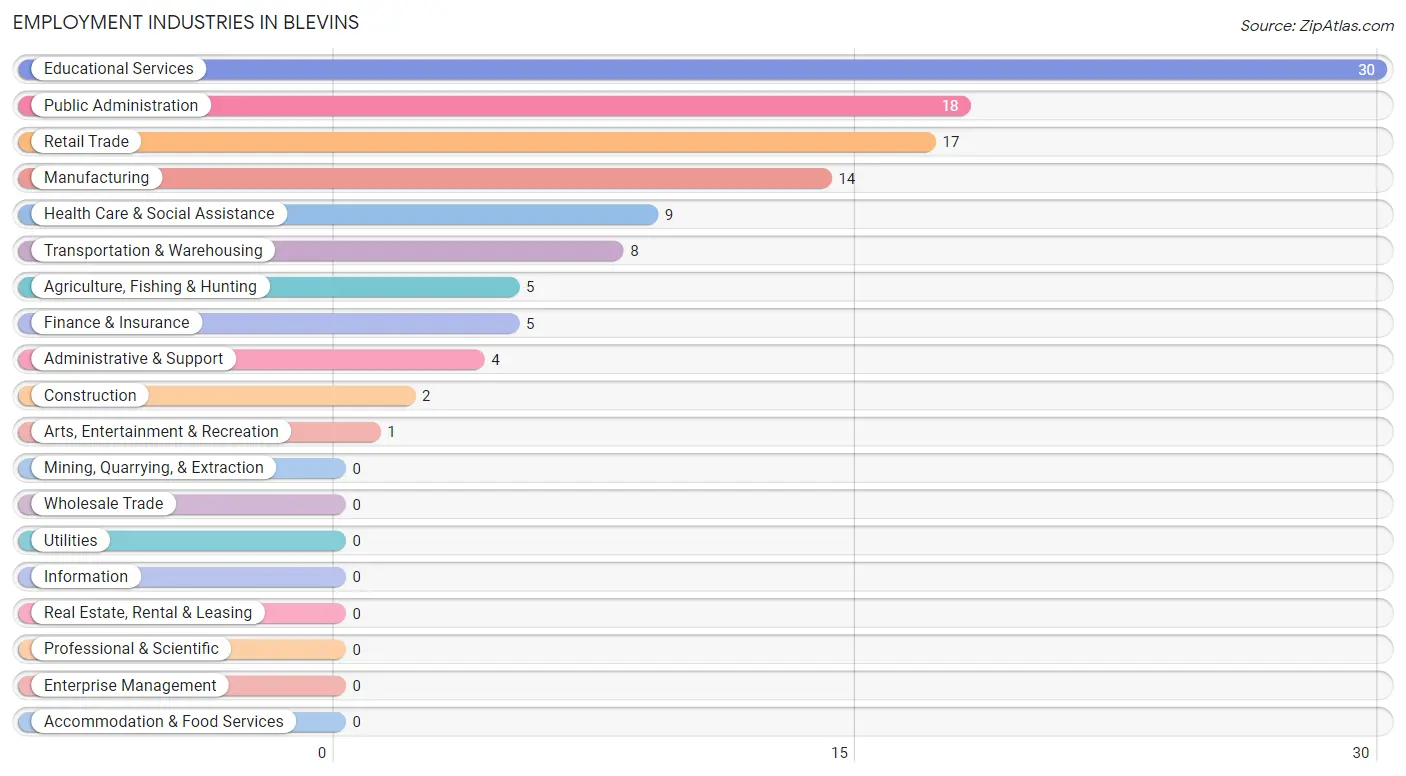
Employment Industries in Blevins
The major employment industries in Blevins include Educational Services (30 | 26.3%), Public Administration (18 | 15.8%), Retail Trade (17 | 14.9%), Manufacturing (14 | 12.3%), and Health Care & Social Assistance (9 | 7.9%).
Employment Industries by Sex in Blevins
The Blevins industries that see more men than women are Agriculture, Fishing & Hunting (100.0%), Construction (100.0%), and Transportation & Warehousing (100.0%), whereas the industries that tend to have a higher number of women are Finance & Insurance (100.0%), Administrative & Support (100.0%), and Health Care & Social Assistance (100.0%).
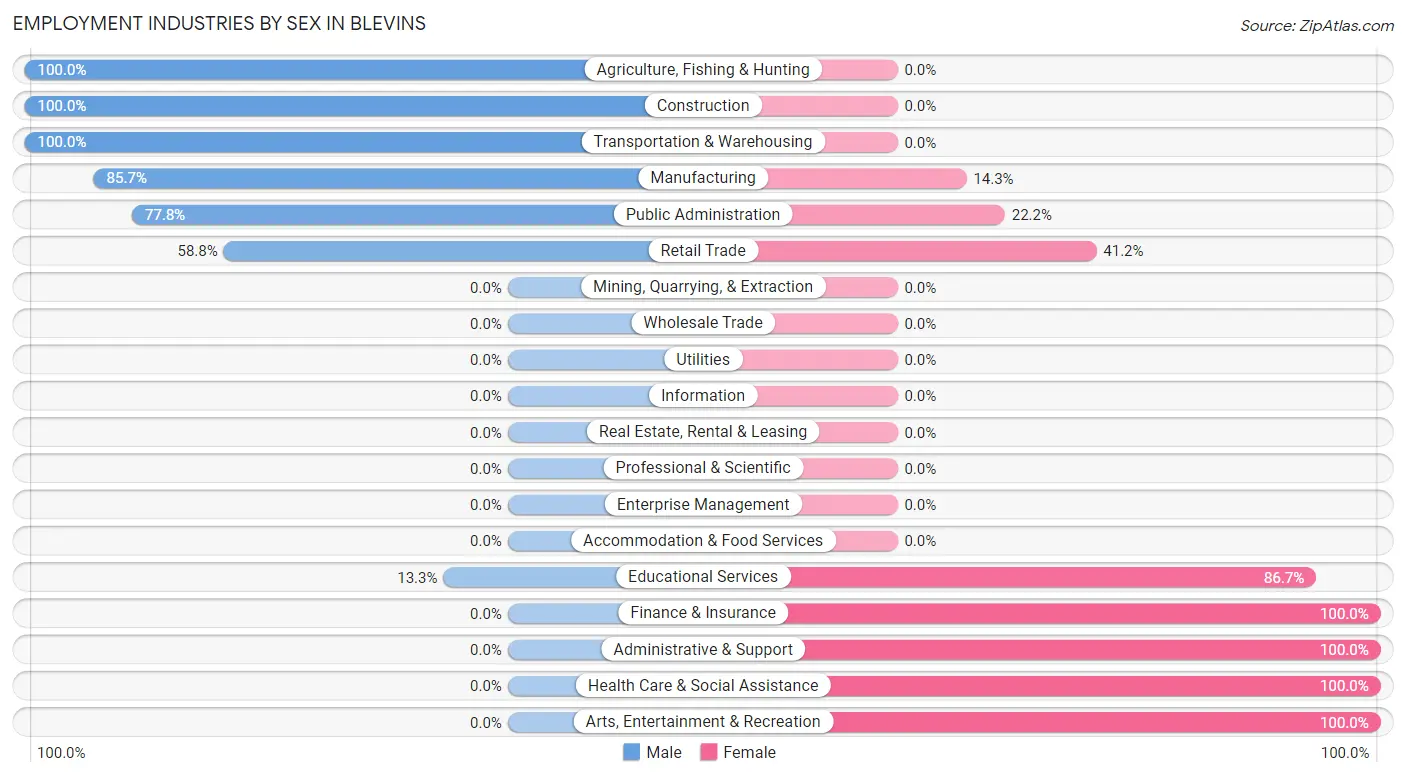
| Industry | Male | Female |
| Agriculture, Fishing & Hunting | 5 (100.0%) | 0 (0.0%) |
| Mining, Quarrying, & Extraction | 0 (0.0%) | 0 (0.0%) |
| Construction | 2 (100.0%) | 0 (0.0%) |
| Manufacturing | 12 (85.7%) | 2 (14.3%) |
| Wholesale Trade | 0 (0.0%) | 0 (0.0%) |
| Retail Trade | 10 (58.8%) | 7 (41.2%) |
| Transportation & Warehousing | 8 (100.0%) | 0 (0.0%) |
| Utilities | 0 (0.0%) | 0 (0.0%) |
| Information | 0 (0.0%) | 0 (0.0%) |
| Finance & Insurance | 0 (0.0%) | 5 (100.0%) |
| Real Estate, Rental & Leasing | 0 (0.0%) | 0 (0.0%) |
| Professional & Scientific | 0 (0.0%) | 0 (0.0%) |
| Enterprise Management | 0 (0.0%) | 0 (0.0%) |
| Administrative & Support | 0 (0.0%) | 4 (100.0%) |
| Educational Services | 4 (13.3%) | 26 (86.7%) |
| Health Care & Social Assistance | 0 (0.0%) | 9 (100.0%) |
| Arts, Entertainment & Recreation | 0 (0.0%) | 1 (100.0%) |
| Accommodation & Food Services | 0 (0.0%) | 0 (0.0%) |
| Public Administration | 14 (77.8%) | 4 (22.2%) |
| Total | 55 (48.2%) | 59 (51.7%) |
Education in Blevins
School Enrollment in Blevins
The most common levels of schooling among the 119 students in Blevins are middle school (37 | 31.1%), elementary school (25 | 21.0%), and kindergarten (23 | 19.3%).
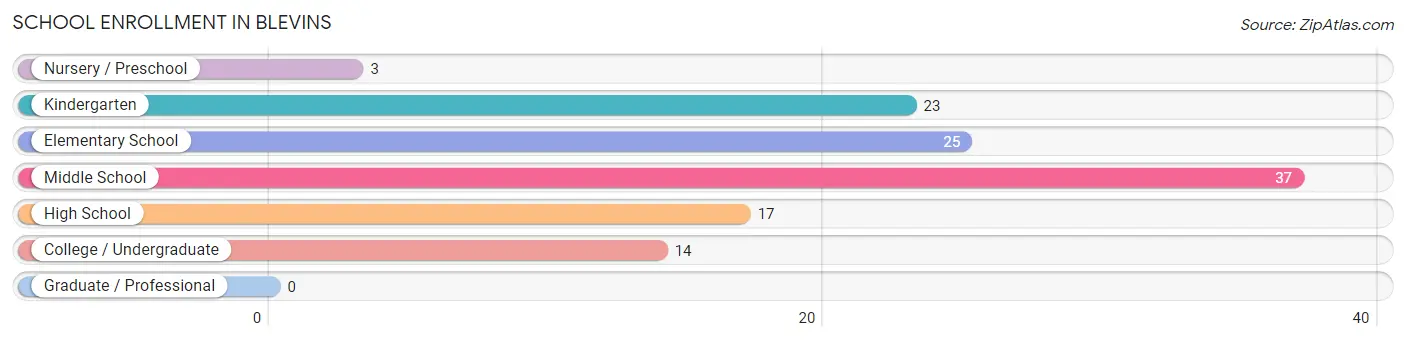
| School Level | # Students | % Students |
| Nursery / Preschool | 3 | 2.5% |
| Kindergarten | 23 | 19.3% |
| Elementary School | 25 | 21.0% |
| Middle School | 37 | 31.1% |
| High School | 17 | 14.3% |
| College / Undergraduate | 14 | 11.8% |
| Graduate / Professional | 0 | 0.0% |
| Total | 119 | 100.0% |
School Enrollment by Age by Funding Source in Blevins
Out of a total of 119 students who are enrolled in schools in Blevins, 1 (0.8%) attend a private institution, while the remaining 118 (99.2%) are enrolled in public schools. The age group of 10 to 14 year olds has the highest likelihood of being enrolled in private schools, with 1 (2.2% in the age bracket) enrolled. Conversely, the age group of 5 to 9 year old has the lowest likelihood of being enrolled in a private school, with 45 (100.0% in the age bracket) attending a public institution.
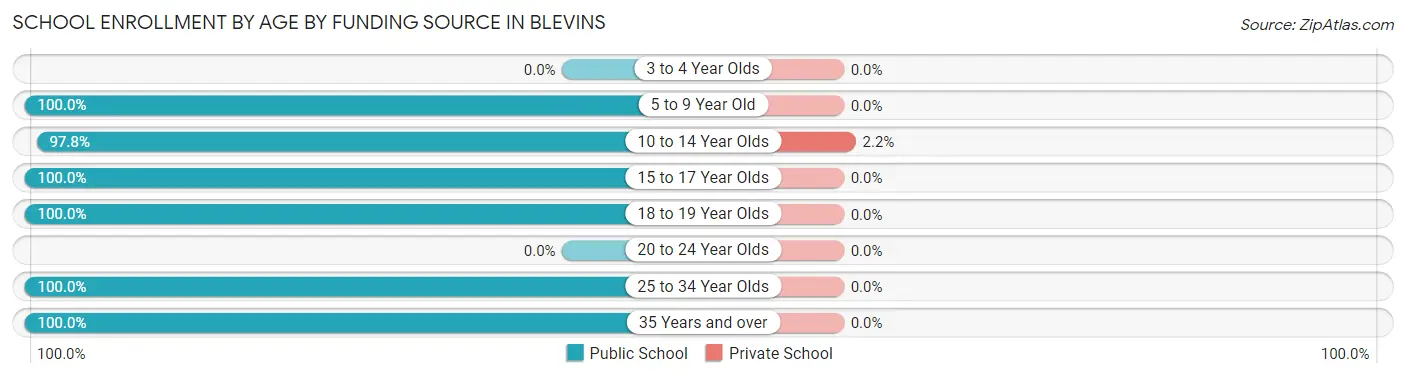
| Age Bracket | Public School | Private School |
| 3 to 4 Year Olds | 0 (0.0%) | 0 (0.0%) |
| 5 to 9 Year Old | 45 (100.0%) | 0 (0.0%) |
| 10 to 14 Year Olds | 44 (97.8%) | 1 (2.2%) |
| 15 to 17 Year Olds | 13 (100.0%) | 0 (0.0%) |
| 18 to 19 Year Olds | 1 (100.0%) | 0 (0.0%) |
| 20 to 24 Year Olds | 0 (0.0%) | 0 (0.0%) |
| 25 to 34 Year Olds | 10 (100.0%) | 0 (0.0%) |
| 35 Years and over | 5 (100.0%) | 0 (0.0%) |
| Total | 118 (99.2%) | 1 (0.8%) |
Educational Attainment by Field of Study in Blevins
Education (18 | 48.6%), psychology (6 | 16.2%), physical & health sciences (3 | 8.1%), business (3 | 8.1%), and visual & performing arts (3 | 8.1%) are the most common fields of study among 37 individuals in Blevins who have obtained a bachelor's degree or higher.
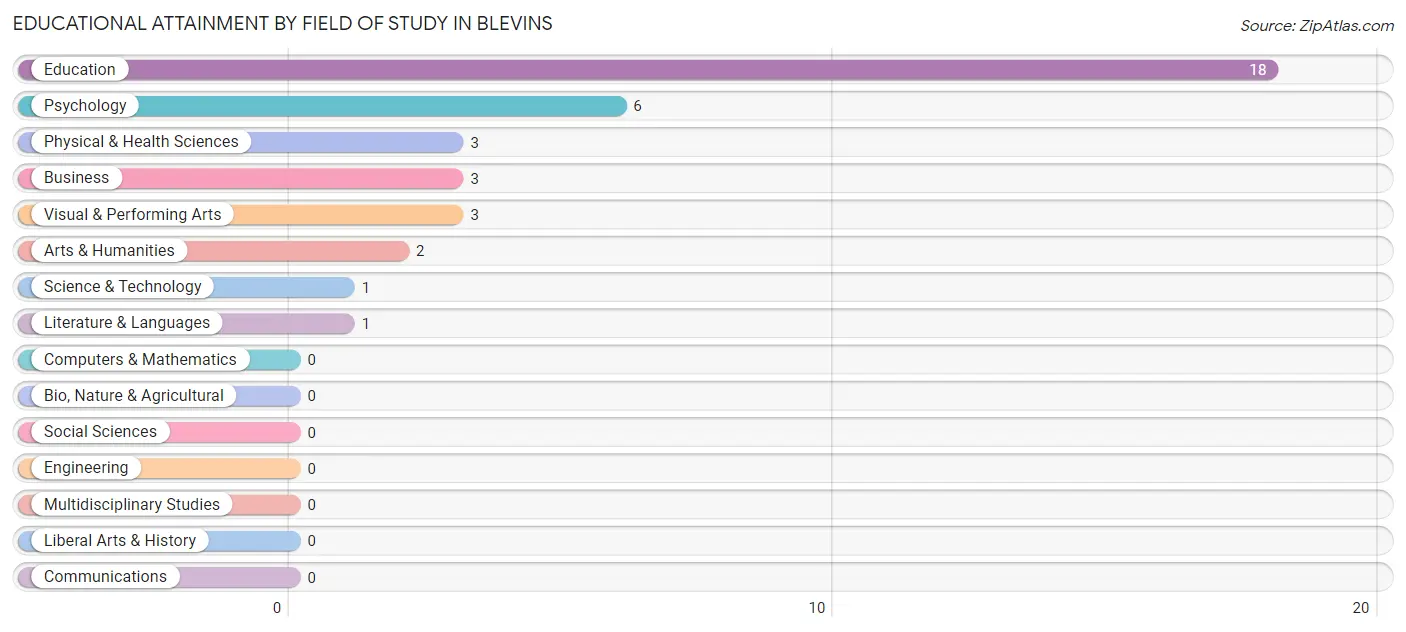
| Field of Study | # Graduates | % Graduates |
| Computers & Mathematics | 0 | 0.0% |
| Bio, Nature & Agricultural | 0 | 0.0% |
| Physical & Health Sciences | 3 | 8.1% |
| Psychology | 6 | 16.2% |
| Social Sciences | 0 | 0.0% |
| Engineering | 0 | 0.0% |
| Multidisciplinary Studies | 0 | 0.0% |
| Science & Technology | 1 | 2.7% |
| Business | 3 | 8.1% |
| Education | 18 | 48.6% |
| Literature & Languages | 1 | 2.7% |
| Liberal Arts & History | 0 | 0.0% |
| Visual & Performing Arts | 3 | 8.1% |
| Communications | 0 | 0.0% |
| Arts & Humanities | 2 | 5.4% |
| Total | 37 | 100.0% |
Transportation & Commute in Blevins
Vehicle Availability by Sex in Blevins
The most prevalent vehicle ownership categories in Blevins are males with 2 vehicles (32, accounting for 60.4%) and females with 2 vehicles (31, making up 56.1%).
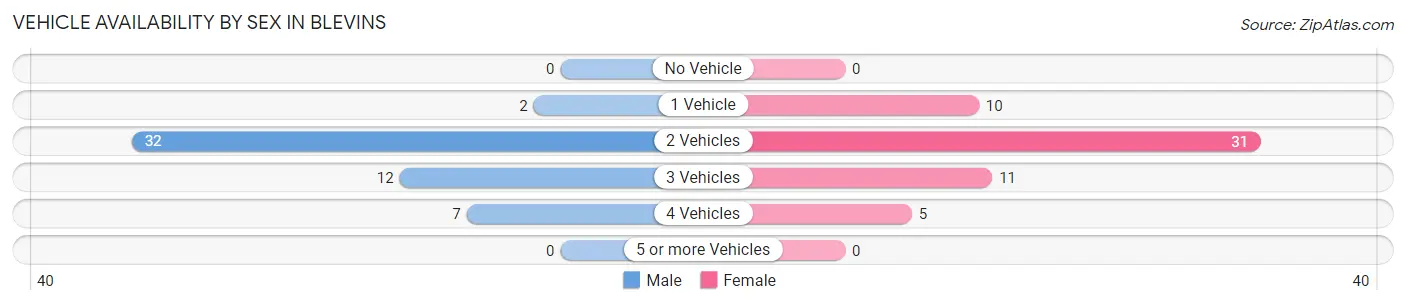
| Vehicles Available | Male | Female |
| No Vehicle | 0 (0.0%) | 0 (0.0%) |
| 1 Vehicle | 2 (3.8%) | 10 (17.5%) |
| 2 Vehicles | 32 (60.4%) | 31 (54.4%) |
| 3 Vehicles | 12 (22.6%) | 11 (19.3%) |
| 4 Vehicles | 7 (13.2%) | 5 (8.8%) |
| 5 or more Vehicles | 0 (0.0%) | 0 (0.0%) |
| Total | 53 (100.0%) | 57 (100.0%) |
Commute Time in Blevins
The most frequently occuring commute durations in Blevins are 30 to 34 minutes (27 commuters, 25.2%), 20 to 24 minutes (24 commuters, 22.4%), and 10 to 14 minutes (13 commuters, 12.1%).
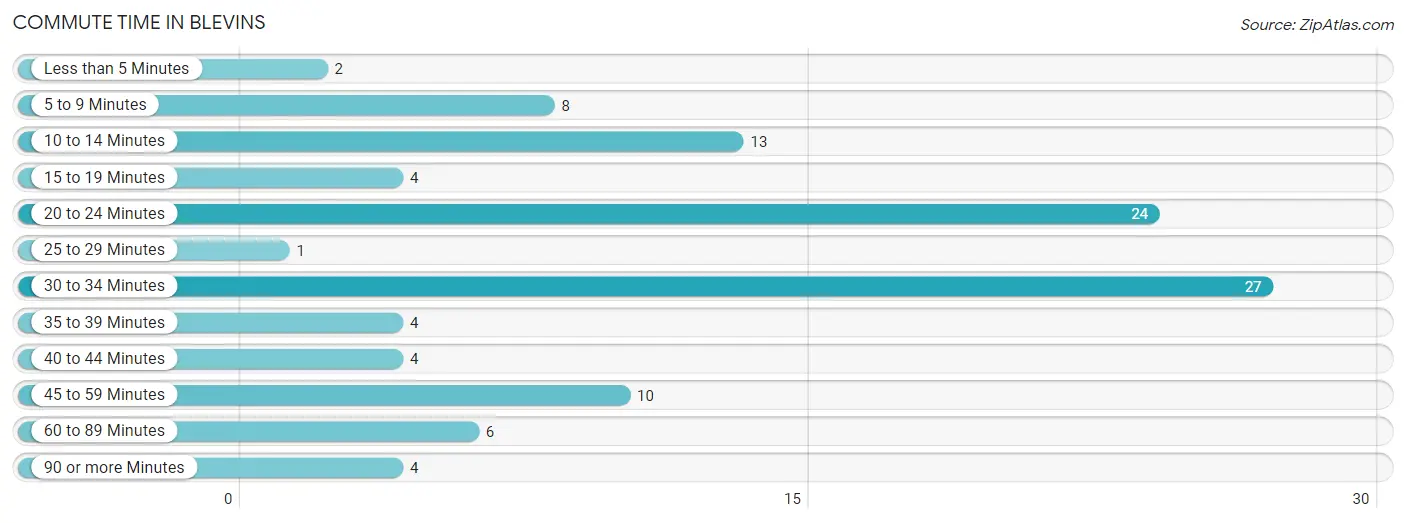
| Commute Time | # Commuters | % Commuters |
| Less than 5 Minutes | 2 | 1.9% |
| 5 to 9 Minutes | 8 | 7.5% |
| 10 to 14 Minutes | 13 | 12.1% |
| 15 to 19 Minutes | 4 | 3.7% |
| 20 to 24 Minutes | 24 | 22.4% |
| 25 to 29 Minutes | 1 | 0.9% |
| 30 to 34 Minutes | 27 | 25.2% |
| 35 to 39 Minutes | 4 | 3.7% |
| 40 to 44 Minutes | 4 | 3.7% |
| 45 to 59 Minutes | 10 | 9.3% |
| 60 to 89 Minutes | 6 | 5.6% |
| 90 or more Minutes | 4 | 3.7% |
Commute Time by Sex in Blevins
The most common commute times in Blevins are 20 to 24 minutes (16 commuters, 30.2%) for males and 30 to 34 minutes (15 commuters, 27.8%) for females.
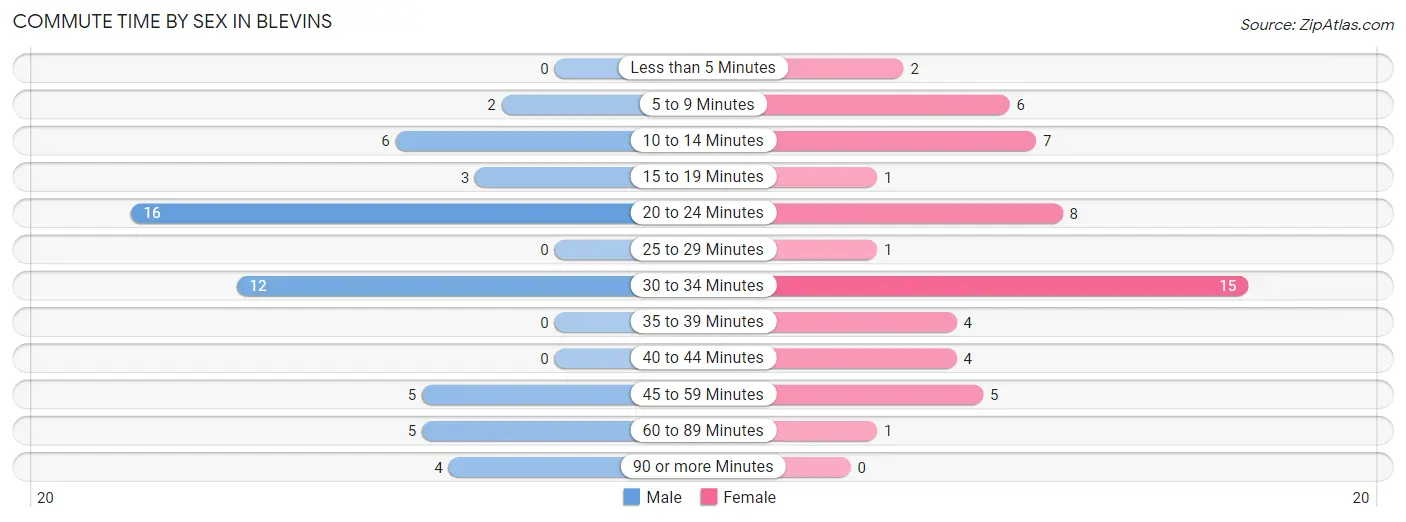
| Commute Time | Male | Female |
| Less than 5 Minutes | 0 (0.0%) | 2 (3.7%) |
| 5 to 9 Minutes | 2 (3.8%) | 6 (11.1%) |
| 10 to 14 Minutes | 6 (11.3%) | 7 (13.0%) |
| 15 to 19 Minutes | 3 (5.7%) | 1 (1.8%) |
| 20 to 24 Minutes | 16 (30.2%) | 8 (14.8%) |
| 25 to 29 Minutes | 0 (0.0%) | 1 (1.8%) |
| 30 to 34 Minutes | 12 (22.6%) | 15 (27.8%) |
| 35 to 39 Minutes | 0 (0.0%) | 4 (7.4%) |
| 40 to 44 Minutes | 0 (0.0%) | 4 (7.4%) |
| 45 to 59 Minutes | 5 (9.4%) | 5 (9.3%) |
| 60 to 89 Minutes | 5 (9.4%) | 1 (1.8%) |
| 90 or more Minutes | 4 (7.5%) | 0 (0.0%) |
Time of Departure to Work by Sex in Blevins
The most frequent times of departure to work in Blevins are 6:00 AM to 6:29 AM (25, 47.2%) for males and 5:30 AM to 5:59 AM (19, 35.2%) for females.
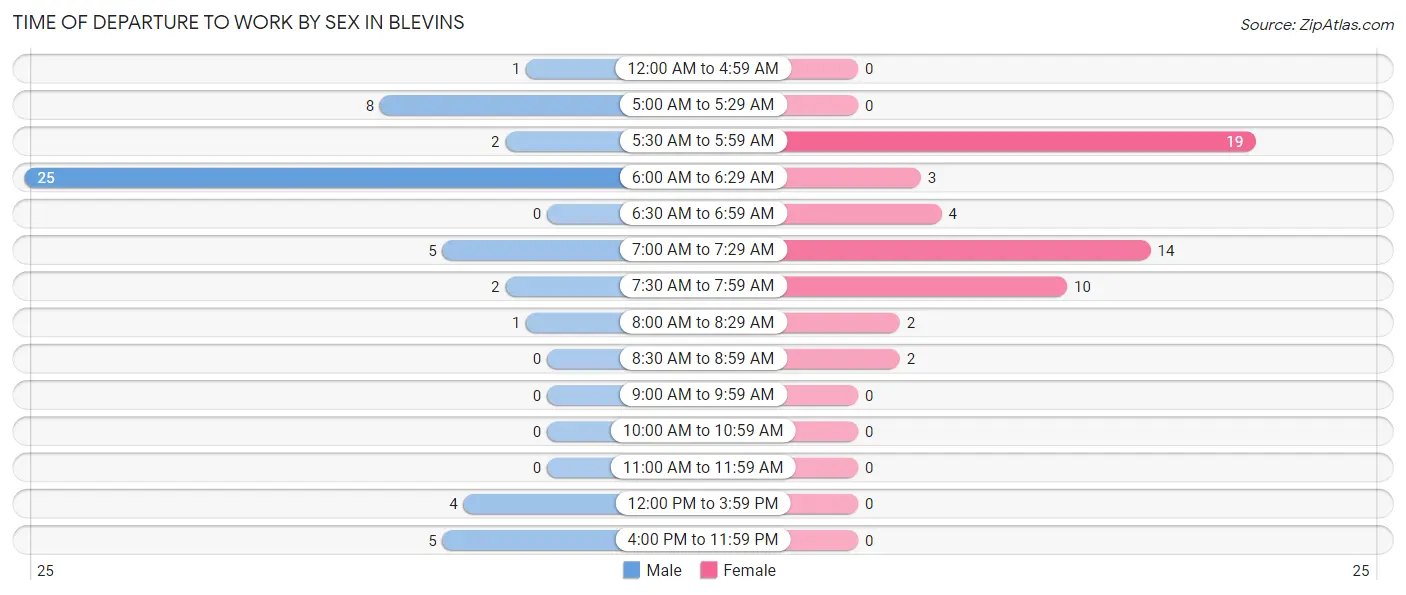
| Time of Departure | Male | Female |
| 12:00 AM to 4:59 AM | 1 (1.9%) | 0 (0.0%) |
| 5:00 AM to 5:29 AM | 8 (15.1%) | 0 (0.0%) |
| 5:30 AM to 5:59 AM | 2 (3.8%) | 19 (35.2%) |
| 6:00 AM to 6:29 AM | 25 (47.2%) | 3 (5.6%) |
| 6:30 AM to 6:59 AM | 0 (0.0%) | 4 (7.4%) |
| 7:00 AM to 7:29 AM | 5 (9.4%) | 14 (25.9%) |
| 7:30 AM to 7:59 AM | 2 (3.8%) | 10 (18.5%) |
| 8:00 AM to 8:29 AM | 1 (1.9%) | 2 (3.7%) |
| 8:30 AM to 8:59 AM | 0 (0.0%) | 2 (3.7%) |
| 9:00 AM to 9:59 AM | 0 (0.0%) | 0 (0.0%) |
| 10:00 AM to 10:59 AM | 0 (0.0%) | 0 (0.0%) |
| 11:00 AM to 11:59 AM | 0 (0.0%) | 0 (0.0%) |
| 12:00 PM to 3:59 PM | 4 (7.5%) | 0 (0.0%) |
| 4:00 PM to 11:59 PM | 5 (9.4%) | 0 (0.0%) |
| Total | 53 (100.0%) | 54 (100.0%) |
Housing Occupancy in Blevins
Occupancy by Ownership in Blevins
Of the total 104 dwellings in Blevins, owner-occupied units account for 85 (81.7%), while renter-occupied units make up 19 (18.3%).
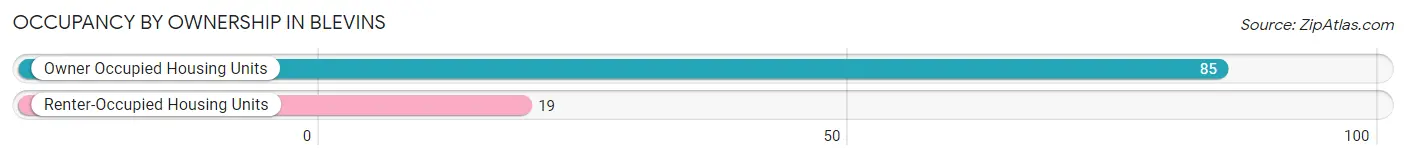
| Occupancy | # Housing Units | % Housing Units |
| Owner Occupied Housing Units | 85 | 81.7% |
| Renter-Occupied Housing Units | 19 | 18.3% |
| Total Occupied Housing Units | 104 | 100.0% |
Occupancy by Household Size in Blevins
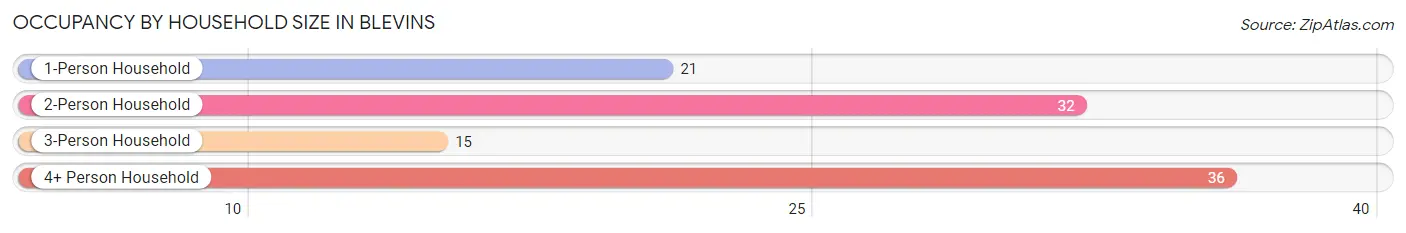
| Household Size | # Housing Units | % Housing Units |
| 1-Person Household | 21 | 20.2% |
| 2-Person Household | 32 | 30.8% |
| 3-Person Household | 15 | 14.4% |
| 4+ Person Household | 36 | 34.6% |
| Total Housing Units | 104 | 100.0% |
Occupancy by Ownership by Household Size in Blevins
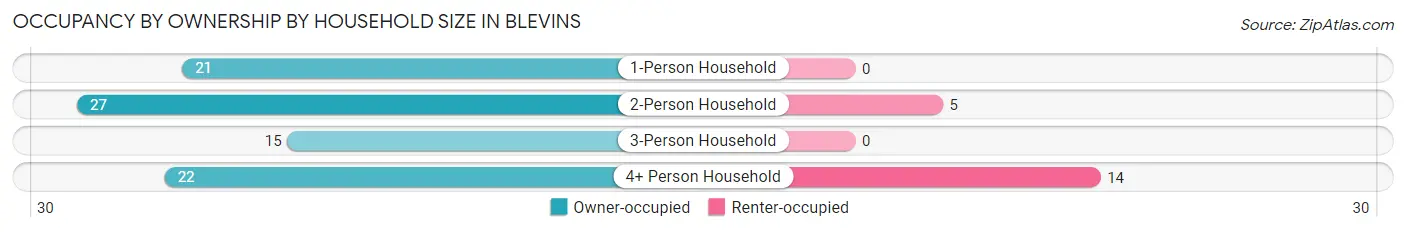
| Household Size | Owner-occupied | Renter-occupied |
| 1-Person Household | 21 (100.0%) | 0 (0.0%) |
| 2-Person Household | 27 (84.4%) | 5 (15.6%) |
| 3-Person Household | 15 (100.0%) | 0 (0.0%) |
| 4+ Person Household | 22 (61.1%) | 14 (38.9%) |
| Total Housing Units | 85 (81.7%) | 19 (18.3%) |
Occupancy by Educational Attainment in Blevins
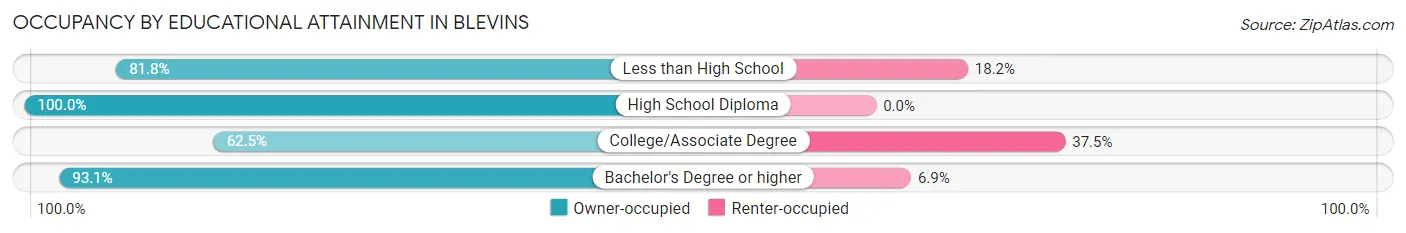
| Household Size | Owner-occupied | Renter-occupied |
| Less than High School | 9 (81.8%) | 2 (18.2%) |
| High School Diploma | 24 (100.0%) | 0 (0.0%) |
| College/Associate Degree | 25 (62.5%) | 15 (37.5%) |
| Bachelor's Degree or higher | 27 (93.1%) | 2 (6.9%) |
Occupancy by Age of Householder in Blevins
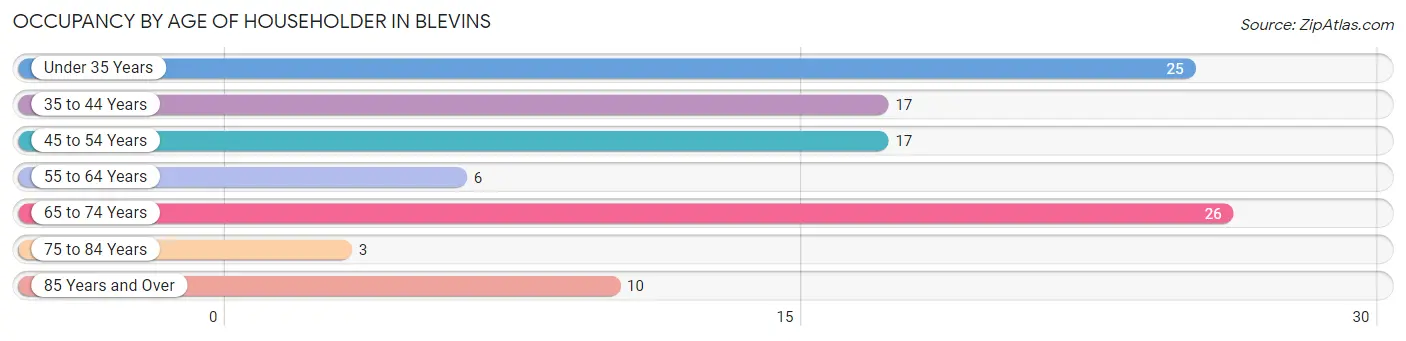
| Age Bracket | # Households | % Households |
| Under 35 Years | 25 | 24.0% |
| 35 to 44 Years | 17 | 16.4% |
| 45 to 54 Years | 17 | 16.4% |
| 55 to 64 Years | 6 | 5.8% |
| 65 to 74 Years | 26 | 25.0% |
| 75 to 84 Years | 3 | 2.9% |
| 85 Years and Over | 10 | 9.6% |
| Total | 104 | 100.0% |
Housing Finances in Blevins
Median Income by Occupancy in Blevins
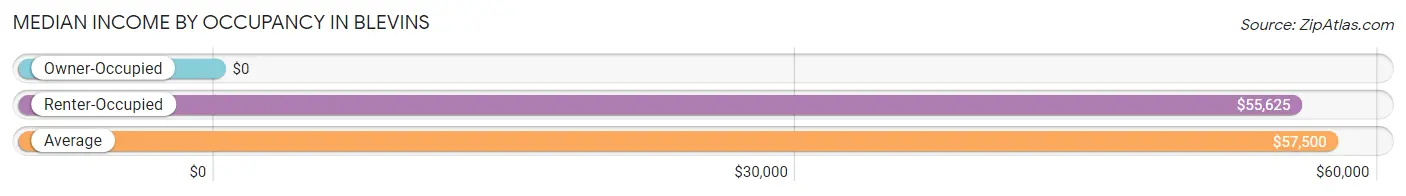
| Occupancy Type | # Households | Median Income |
| Owner-Occupied | 85 (81.7%) | $0 |
| Renter-Occupied | 19 (18.3%) | $55,625 |
| Average | 104 (100.0%) | $57,500 |
Occupancy by Householder Income Bracket in Blevins
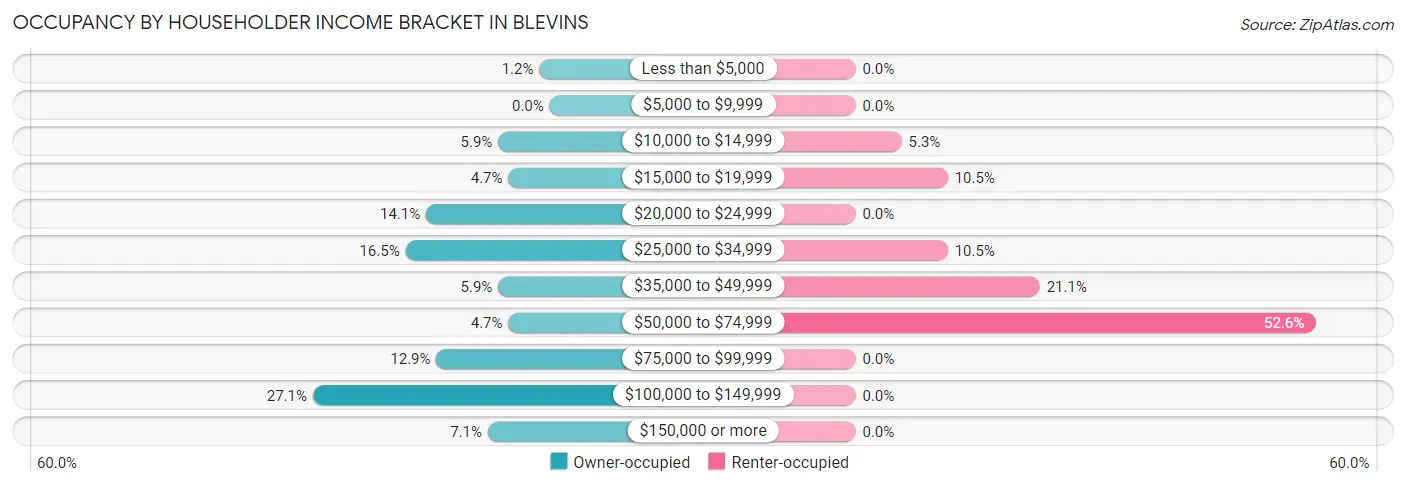
| Income Bracket | Owner-occupied | Renter-occupied |
| Less than $5,000 | 1 (1.2%) | 0 (0.0%) |
| $5,000 to $9,999 | 0 (0.0%) | 0 (0.0%) |
| $10,000 to $14,999 | 5 (5.9%) | 1 (5.3%) |
| $15,000 to $19,999 | 4 (4.7%) | 2 (10.5%) |
| $20,000 to $24,999 | 12 (14.1%) | 0 (0.0%) |
| $25,000 to $34,999 | 14 (16.5%) | 2 (10.5%) |
| $35,000 to $49,999 | 5 (5.9%) | 4 (21.0%) |
| $50,000 to $74,999 | 4 (4.7%) | 10 (52.6%) |
| $75,000 to $99,999 | 11 (12.9%) | 0 (0.0%) |
| $100,000 to $149,999 | 23 (27.1%) | 0 (0.0%) |
| $150,000 or more | 6 (7.1%) | 0 (0.0%) |
| Total | 85 (100.0%) | 19 (100.0%) |
Monthly Housing Cost Tiers in Blevins
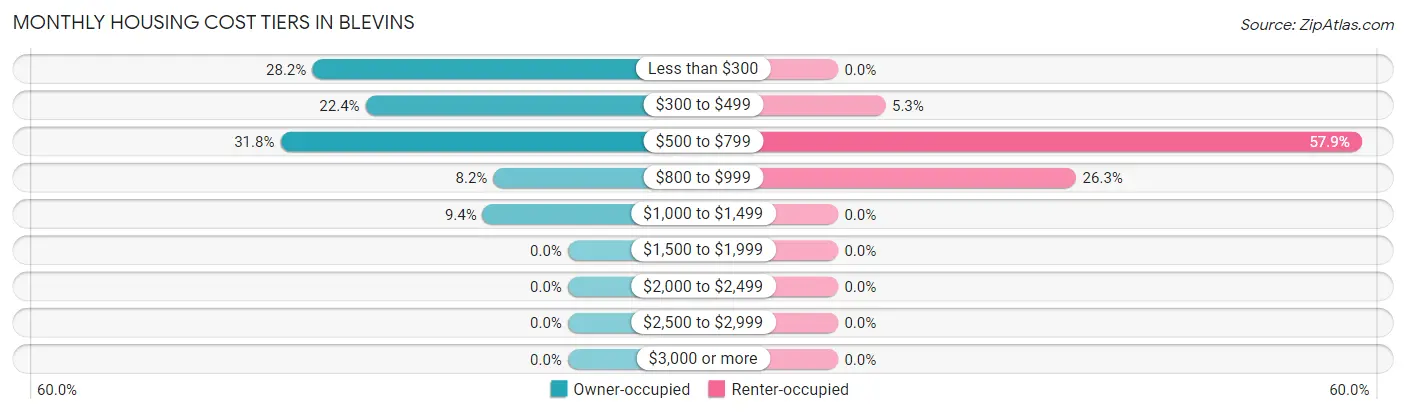
| Monthly Cost | Owner-occupied | Renter-occupied |
| Less than $300 | 24 (28.2%) | 0 (0.0%) |
| $300 to $499 | 19 (22.4%) | 1 (5.3%) |
| $500 to $799 | 27 (31.8%) | 11 (57.9%) |
| $800 to $999 | 7 (8.2%) | 5 (26.3%) |
| $1,000 to $1,499 | 8 (9.4%) | 0 (0.0%) |
| $1,500 to $1,999 | 0 (0.0%) | 0 (0.0%) |
| $2,000 to $2,499 | 0 (0.0%) | 0 (0.0%) |
| $2,500 to $2,999 | 0 (0.0%) | 0 (0.0%) |
| $3,000 or more | 0 (0.0%) | 0 (0.0%) |
| Total | 85 (100.0%) | 19 (100.0%) |
Physical Housing Characteristics in Blevins
Housing Structures in Blevins
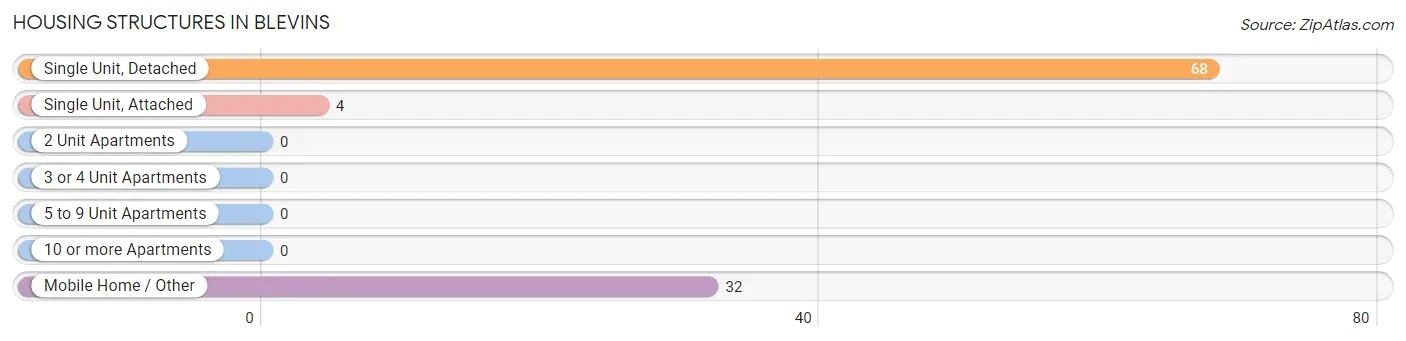
| Structure Type | # Housing Units | % Housing Units |
| Single Unit, Detached | 68 | 65.4% |
| Single Unit, Attached | 4 | 3.8% |
| 2 Unit Apartments | 0 | 0.0% |
| 3 or 4 Unit Apartments | 0 | 0.0% |
| 5 to 9 Unit Apartments | 0 | 0.0% |
| 10 or more Apartments | 0 | 0.0% |
| Mobile Home / Other | 32 | 30.8% |
| Total | 104 | 100.0% |
Housing Structures by Occupancy in Blevins
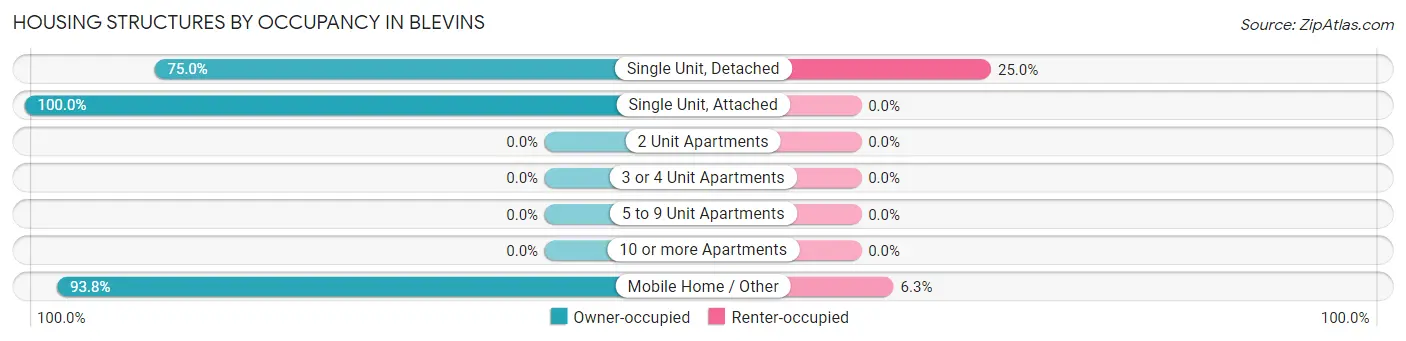
| Structure Type | Owner-occupied | Renter-occupied |
| Single Unit, Detached | 51 (75.0%) | 17 (25.0%) |
| Single Unit, Attached | 4 (100.0%) | 0 (0.0%) |
| 2 Unit Apartments | 0 (0.0%) | 0 (0.0%) |
| 3 or 4 Unit Apartments | 0 (0.0%) | 0 (0.0%) |
| 5 to 9 Unit Apartments | 0 (0.0%) | 0 (0.0%) |
| 10 or more Apartments | 0 (0.0%) | 0 (0.0%) |
| Mobile Home / Other | 30 (93.8%) | 2 (6.2%) |
| Total | 85 (81.7%) | 19 (18.3%) |
Housing Structures by Number of Rooms in Blevins
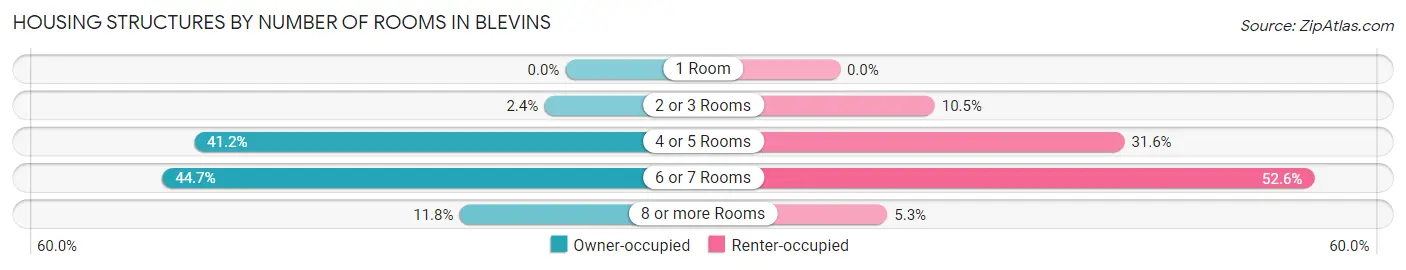
| Number of Rooms | Owner-occupied | Renter-occupied |
| 1 Room | 0 (0.0%) | 0 (0.0%) |
| 2 or 3 Rooms | 2 (2.4%) | 2 (10.5%) |
| 4 or 5 Rooms | 35 (41.2%) | 6 (31.6%) |
| 6 or 7 Rooms | 38 (44.7%) | 10 (52.6%) |
| 8 or more Rooms | 10 (11.8%) | 1 (5.3%) |
| Total | 85 (100.0%) | 19 (100.0%) |
Housing Structure by Heating Type in Blevins
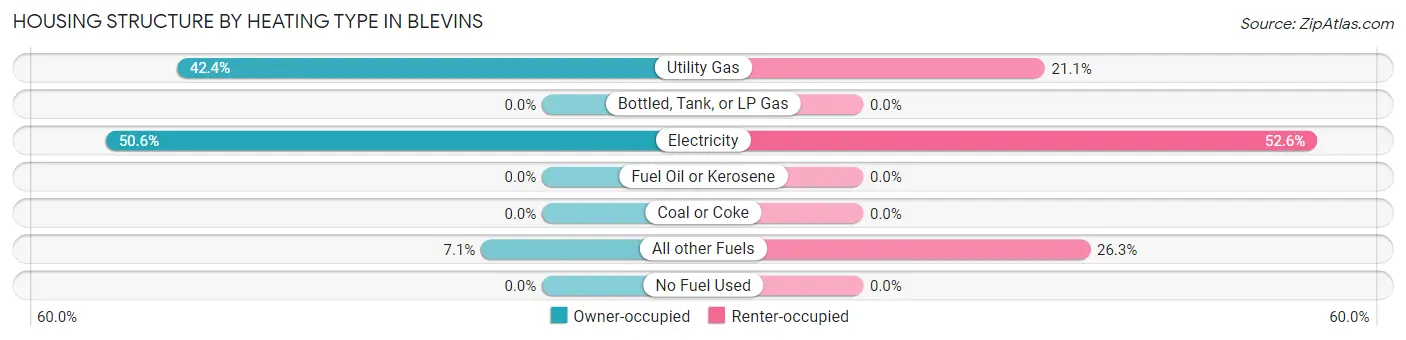
| Heating Type | Owner-occupied | Renter-occupied |
| Utility Gas | 36 (42.3%) | 4 (21.0%) |
| Bottled, Tank, or LP Gas | 0 (0.0%) | 0 (0.0%) |
| Electricity | 43 (50.6%) | 10 (52.6%) |
| Fuel Oil or Kerosene | 0 (0.0%) | 0 (0.0%) |
| Coal or Coke | 0 (0.0%) | 0 (0.0%) |
| All other Fuels | 6 (7.1%) | 5 (26.3%) |
| No Fuel Used | 0 (0.0%) | 0 (0.0%) |
| Total | 85 (100.0%) | 19 (100.0%) |
Household Vehicle Usage in Blevins
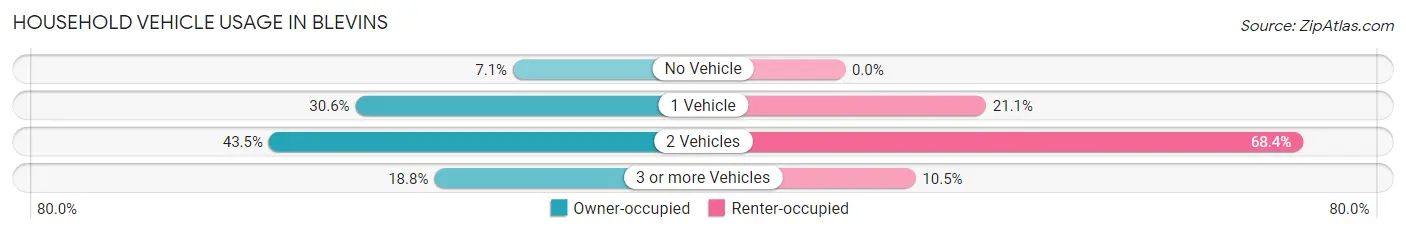
| Vehicles per Household | Owner-occupied | Renter-occupied |
| No Vehicle | 6 (7.1%) | 0 (0.0%) |
| 1 Vehicle | 26 (30.6%) | 4 (21.0%) |
| 2 Vehicles | 37 (43.5%) | 13 (68.4%) |
| 3 or more Vehicles | 16 (18.8%) | 2 (10.5%) |
| Total | 85 (100.0%) | 19 (100.0%) |
Real Estate & Mortgages in Blevins
Real Estate and Mortgage Overview in Blevins
| Characteristic | Without Mortgage | With Mortgage |
| Housing Units | 44 | 41 |
| Median Property Value | $66,700 | $93,200 |
| Median Household Income | $25,000 | $6 |
| Monthly Housing Costs | $283 | $0 |
| Real Estate Taxes | $199 | $7 |
Property Value by Mortgage Status in Blevins
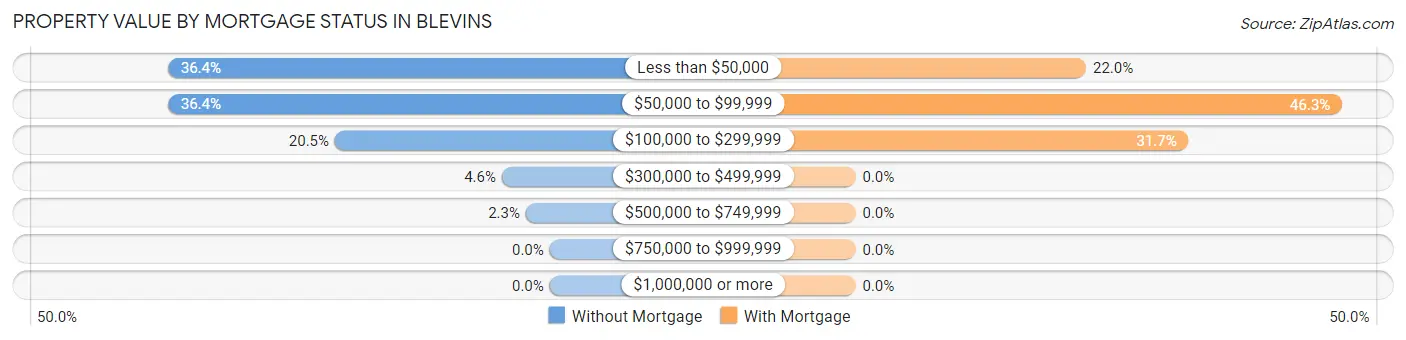
| Property Value | Without Mortgage | With Mortgage |
| Less than $50,000 | 16 (36.4%) | 9 (22.0%) |
| $50,000 to $99,999 | 16 (36.4%) | 19 (46.3%) |
| $100,000 to $299,999 | 9 (20.4%) | 13 (31.7%) |
| $300,000 to $499,999 | 2 (4.5%) | 0 (0.0%) |
| $500,000 to $749,999 | 1 (2.3%) | 0 (0.0%) |
| $750,000 to $999,999 | 0 (0.0%) | 0 (0.0%) |
| $1,000,000 or more | 0 (0.0%) | 0 (0.0%) |
| Total | 44 (100.0%) | 41 (100.0%) |
Household Income by Mortgage Status in Blevins
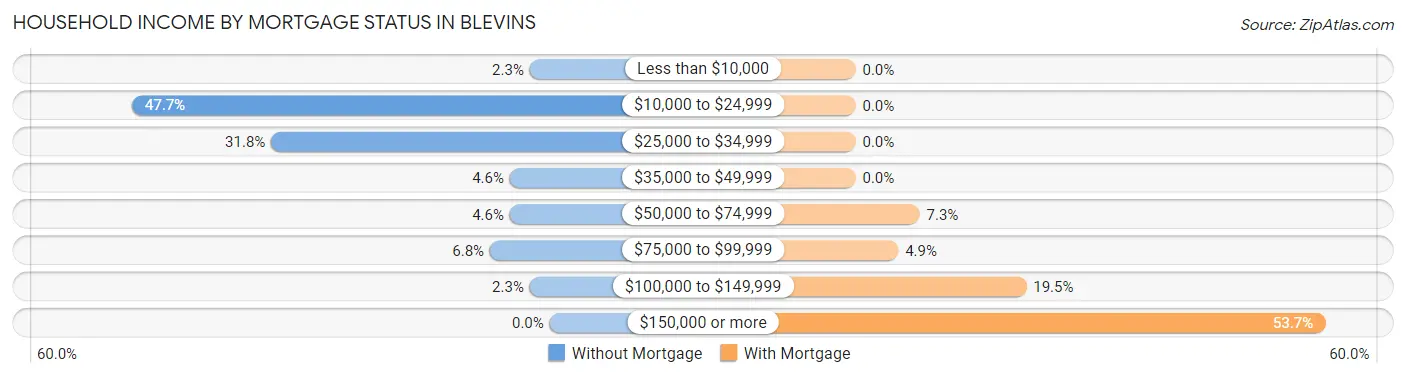
| Household Income | Without Mortgage | With Mortgage |
| Less than $10,000 | 1 (2.3%) | 0 (0.0%) |
| $10,000 to $24,999 | 21 (47.7%) | 0 (0.0%) |
| $25,000 to $34,999 | 14 (31.8%) | 0 (0.0%) |
| $35,000 to $49,999 | 2 (4.5%) | 0 (0.0%) |
| $50,000 to $74,999 | 2 (4.5%) | 3 (7.3%) |
| $75,000 to $99,999 | 3 (6.8%) | 2 (4.9%) |
| $100,000 to $149,999 | 1 (2.3%) | 8 (19.5%) |
| $150,000 or more | 0 (0.0%) | 22 (53.7%) |
| Total | 44 (100.0%) | 41 (100.0%) |
Property Value to Household Income Ratio in Blevins
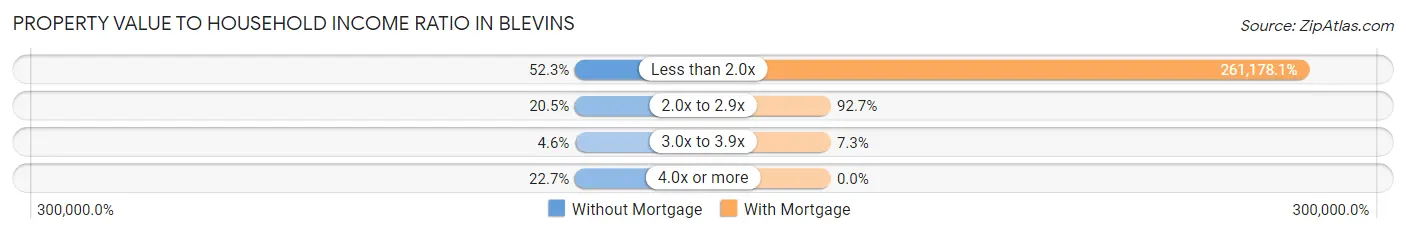
| Value-to-Income Ratio | Without Mortgage | With Mortgage |
| Less than 2.0x | 23 (52.3%) | 107,083 (261,178.0%) |
| 2.0x to 2.9x | 9 (20.4%) | 38 (92.7%) |
| 3.0x to 3.9x | 2 (4.5%) | 3 (7.3%) |
| 4.0x or more | 10 (22.7%) | 0 (0.0%) |
| Total | 44 (100.0%) | 41 (100.0%) |
Real Estate Taxes by Mortgage Status in Blevins
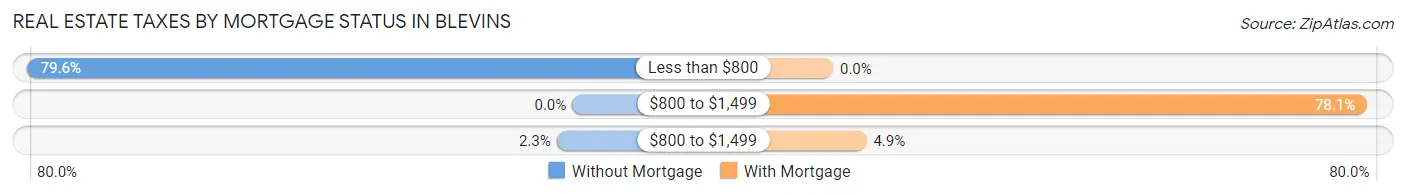
| Property Taxes | Without Mortgage | With Mortgage |
| Less than $800 | 35 (79.5%) | 0 (0.0%) |
| $800 to $1,499 | 0 (0.0%) | 32 (78.0%) |
| $800 to $1,499 | 1 (2.3%) | 2 (4.9%) |
| Total | 44 (100.0%) | 41 (100.0%) |
Health & Disability in Blevins
Health Insurance Coverage by Age in Blevins
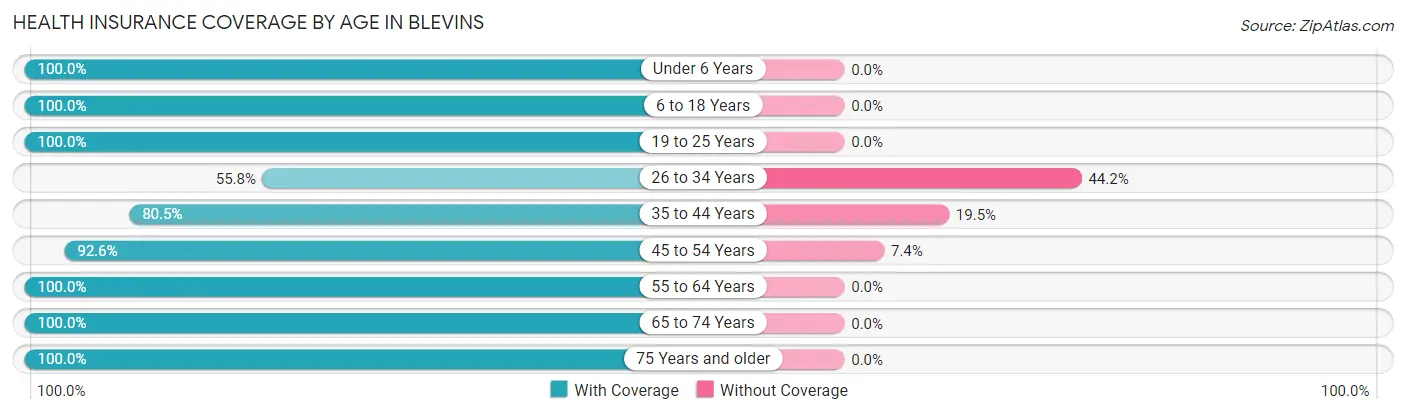
| Age Bracket | With Coverage | Without Coverage |
| Under 6 Years | 53 (100.0%) | 0 (0.0%) |
| 6 to 18 Years | 78 (100.0%) | 0 (0.0%) |
| 19 to 25 Years | 7 (100.0%) | 0 (0.0%) |
| 26 to 34 Years | 29 (55.8%) | 23 (44.2%) |
| 35 to 44 Years | 33 (80.5%) | 8 (19.5%) |
| 45 to 54 Years | 25 (92.6%) | 2 (7.4%) |
| 55 to 64 Years | 15 (100.0%) | 0 (0.0%) |
| 65 to 74 Years | 42 (100.0%) | 0 (0.0%) |
| 75 Years and older | 16 (100.0%) | 0 (0.0%) |
| Total | 298 (90.0%) | 33 (10.0%) |
Health Insurance Coverage by Citizenship Status in Blevins
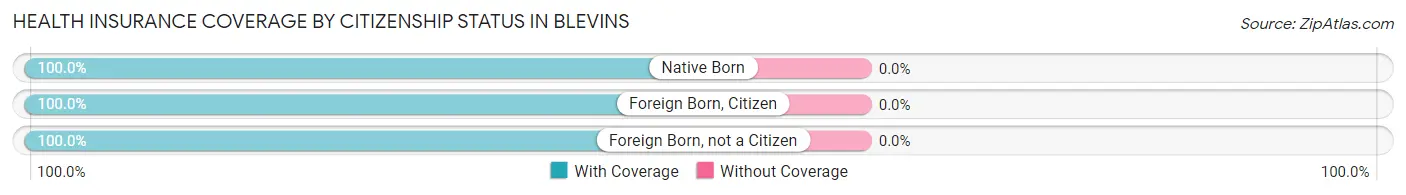
| Citizenship Status | With Coverage | Without Coverage |
| Native Born | 53 (100.0%) | 0 (0.0%) |
| Foreign Born, Citizen | 78 (100.0%) | 0 (0.0%) |
| Foreign Born, not a Citizen | 7 (100.0%) | 0 (0.0%) |
Health Insurance Coverage by Household Income in Blevins
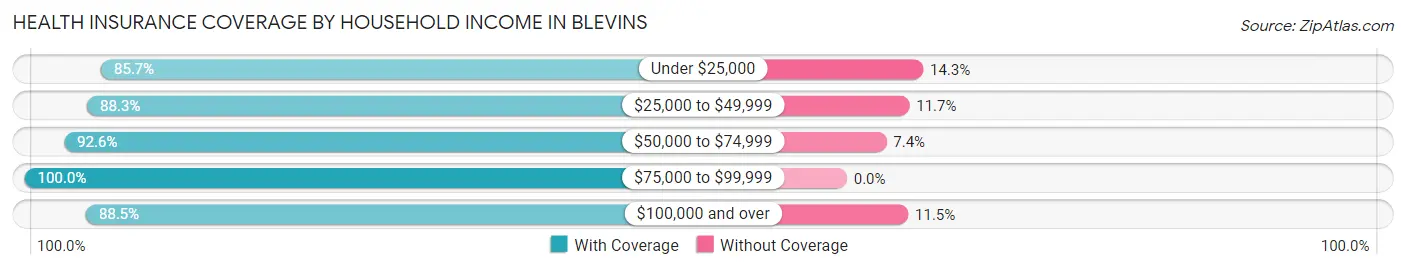
| Household Income | With Coverage | Without Coverage |
| Under $25,000 | 36 (85.7%) | 6 (14.3%) |
| $25,000 to $49,999 | 98 (88.3%) | 13 (11.7%) |
| $50,000 to $74,999 | 50 (92.6%) | 4 (7.4%) |
| $75,000 to $99,999 | 37 (100.0%) | 0 (0.0%) |
| $100,000 and over | 77 (88.5%) | 10 (11.5%) |
Public vs Private Health Insurance Coverage by Age in Blevins
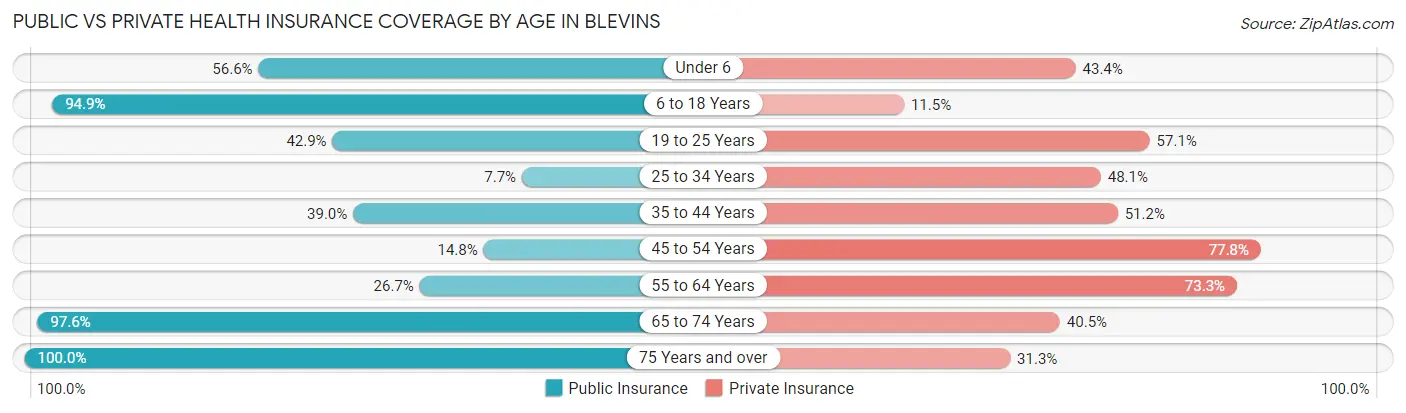
| Age Bracket | Public Insurance | Private Insurance |
| Under 6 | 30 (56.6%) | 23 (43.4%) |
| 6 to 18 Years | 74 (94.9%) | 9 (11.5%) |
| 19 to 25 Years | 3 (42.9%) | 4 (57.1%) |
| 25 to 34 Years | 4 (7.7%) | 25 (48.1%) |
| 35 to 44 Years | 16 (39.0%) | 21 (51.2%) |
| 45 to 54 Years | 4 (14.8%) | 21 (77.8%) |
| 55 to 64 Years | 4 (26.7%) | 11 (73.3%) |
| 65 to 74 Years | 41 (97.6%) | 17 (40.5%) |
| 75 Years and over | 16 (100.0%) | 5 (31.2%) |
| Total | 192 (58.0%) | 136 (41.1%) |
Disability Status by Sex by Age in Blevins
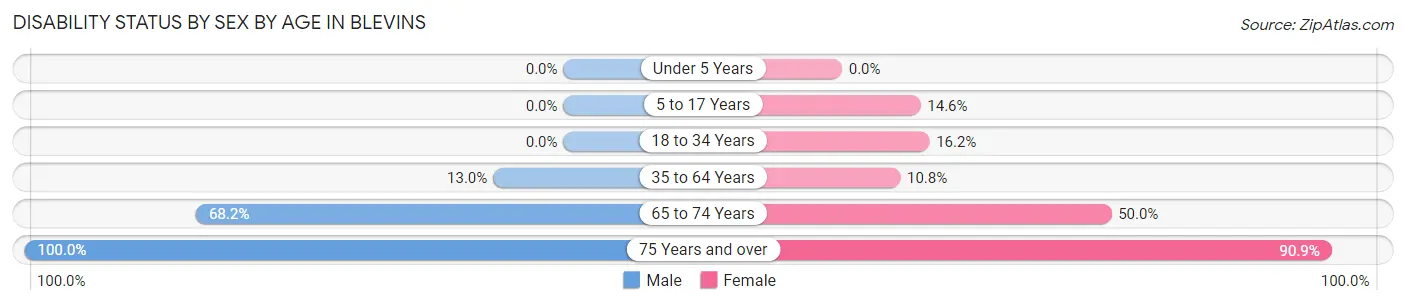
| Age Bracket | Male | Female |
| Under 5 Years | 0 (0.0%) | 0 (0.0%) |
| 5 to 17 Years | 0 (0.0%) | 7 (14.6%) |
| 18 to 34 Years | 0 (0.0%) | 6 (16.2%) |
| 35 to 64 Years | 6 (13.0%) | 4 (10.8%) |
| 65 to 74 Years | 15 (68.2%) | 10 (50.0%) |
| 75 Years and over | 5 (100.0%) | 10 (90.9%) |
Disability Class by Sex by Age in Blevins
Disability Class: Hearing Difficulty
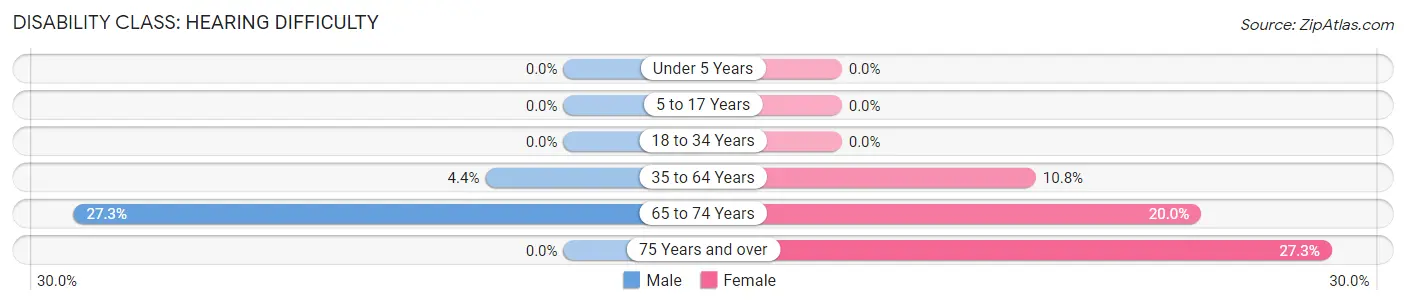
| Age Bracket | Male | Female |
| Under 5 Years | 0 (0.0%) | 0 (0.0%) |
| 5 to 17 Years | 0 (0.0%) | 0 (0.0%) |
| 18 to 34 Years | 0 (0.0%) | 0 (0.0%) |
| 35 to 64 Years | 2 (4.3%) | 4 (10.8%) |
| 65 to 74 Years | 6 (27.3%) | 4 (20.0%) |
| 75 Years and over | 0 (0.0%) | 3 (27.3%) |
Disability Class: Vision Difficulty
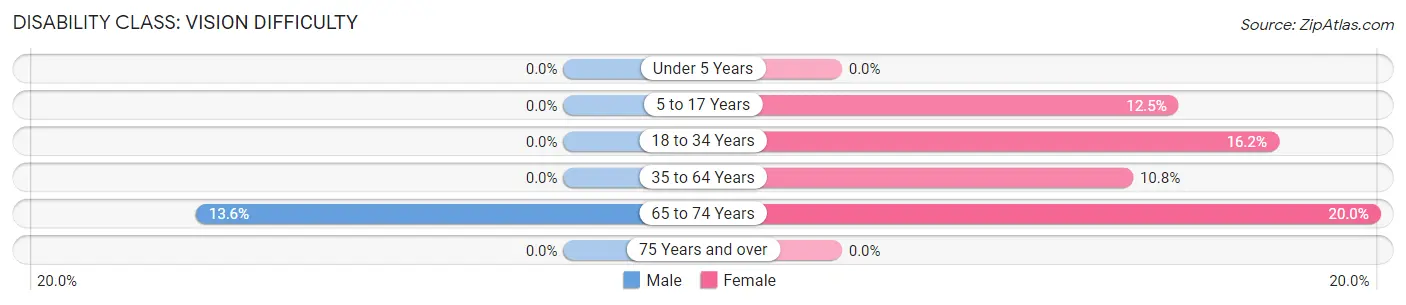
| Age Bracket | Male | Female |
| Under 5 Years | 0 (0.0%) | 0 (0.0%) |
| 5 to 17 Years | 0 (0.0%) | 6 (12.5%) |
| 18 to 34 Years | 0 (0.0%) | 6 (16.2%) |
| 35 to 64 Years | 0 (0.0%) | 4 (10.8%) |
| 65 to 74 Years | 3 (13.6%) | 4 (20.0%) |
| 75 Years and over | 0 (0.0%) | 0 (0.0%) |
Disability Class: Cognitive Difficulty
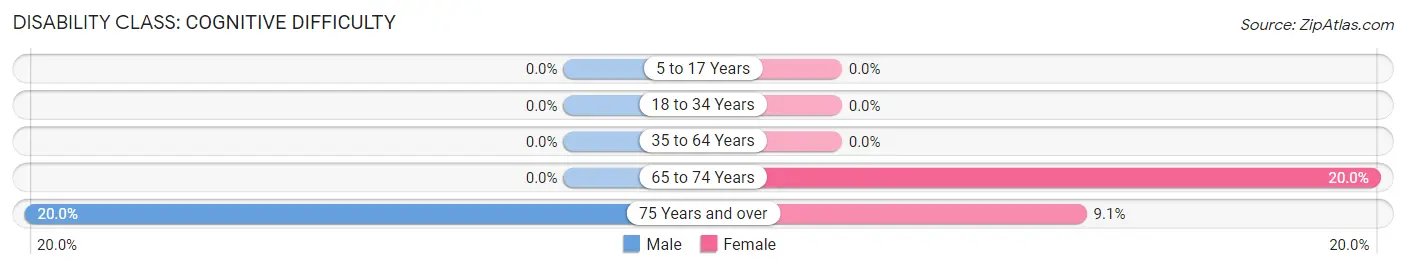
| Age Bracket | Male | Female |
| 5 to 17 Years | 0 (0.0%) | 0 (0.0%) |
| 18 to 34 Years | 0 (0.0%) | 0 (0.0%) |
| 35 to 64 Years | 0 (0.0%) | 0 (0.0%) |
| 65 to 74 Years | 0 (0.0%) | 4 (20.0%) |
| 75 Years and over | 1 (20.0%) | 1 (9.1%) |
Disability Class: Ambulatory Difficulty
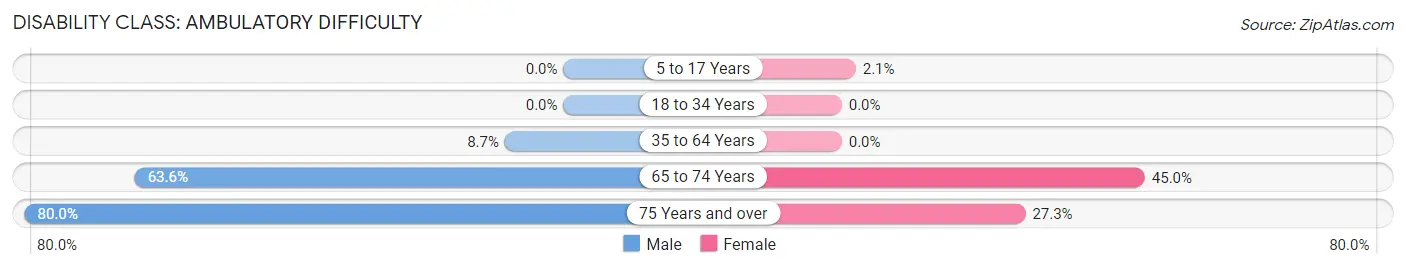
| Age Bracket | Male | Female |
| 5 to 17 Years | 0 (0.0%) | 1 (2.1%) |
| 18 to 34 Years | 0 (0.0%) | 0 (0.0%) |
| 35 to 64 Years | 4 (8.7%) | 0 (0.0%) |
| 65 to 74 Years | 14 (63.6%) | 9 (45.0%) |
| 75 Years and over | 4 (80.0%) | 3 (27.3%) |
Disability Class: Self-Care Difficulty
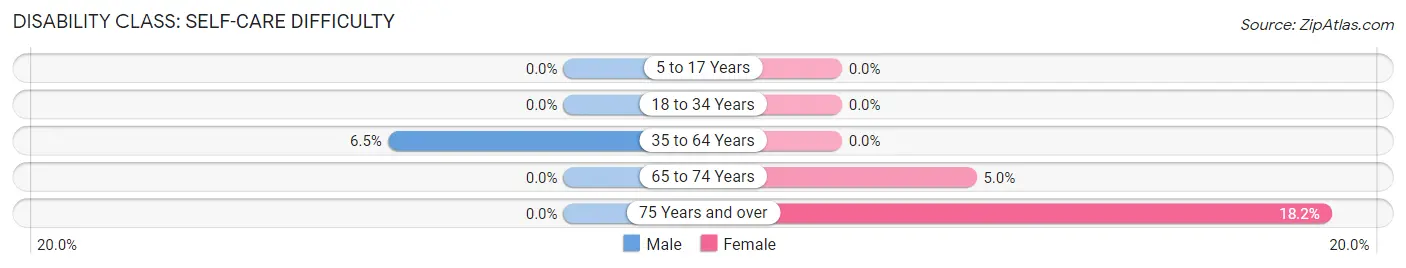
| Age Bracket | Male | Female |
| 5 to 17 Years | 0 (0.0%) | 0 (0.0%) |
| 18 to 34 Years | 0 (0.0%) | 0 (0.0%) |
| 35 to 64 Years | 3 (6.5%) | 0 (0.0%) |
| 65 to 74 Years | 0 (0.0%) | 1 (5.0%) |
| 75 Years and over | 0 (0.0%) | 2 (18.2%) |
Technology Access in Blevins
Computing Device Access in Blevins
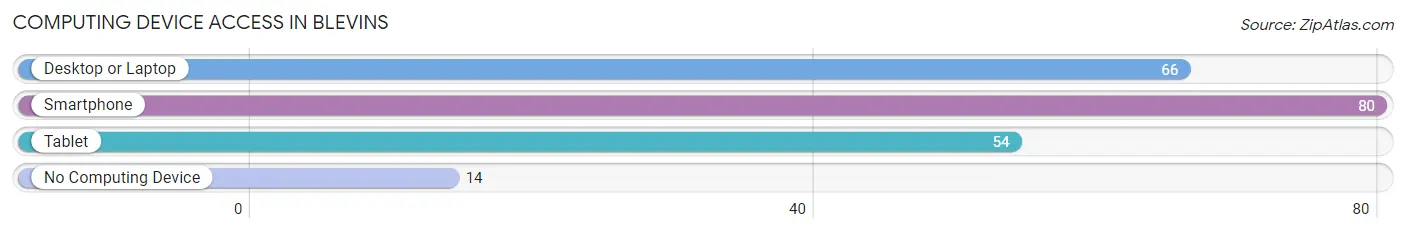
| Device Type | # Households | % Households |
| Desktop or Laptop | 66 | 63.5% |
| Smartphone | 80 | 76.9% |
| Tablet | 54 | 51.9% |
| No Computing Device | 14 | 13.5% |
| Total | 104 | 100.0% |
Internet Access in Blevins
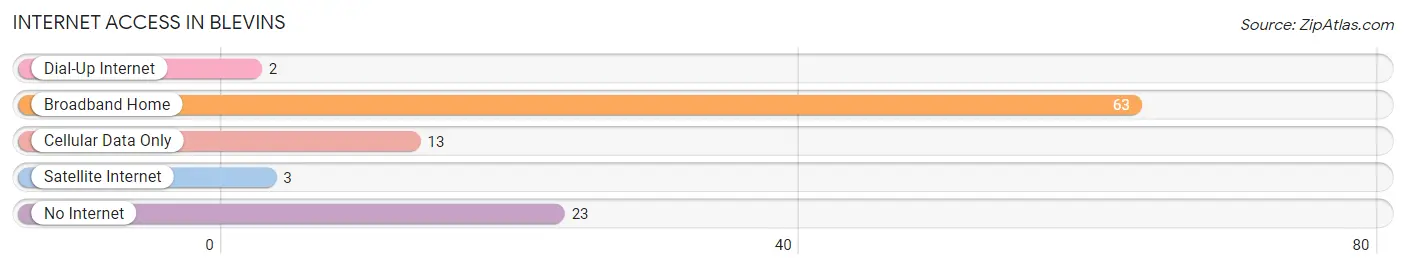
| Internet Type | # Households | % Households |
| Dial-Up Internet | 2 | 1.9% |
| Broadband Home | 63 | 60.6% |
| Cellular Data Only | 13 | 12.5% |
| Satellite Internet | 3 | 2.9% |
| No Internet | 23 | 22.1% |
| Total | 104 | 100.0% |
Blevins Summary
Blevins is a small town located in Hempstead County, Arkansas. It is situated in the southwestern part of the state, about 20 miles from the Texas border. The town was founded in 1883 and has a population of approximately 500 people.
History
The town of Blevins was founded in 1883 by a group of settlers from Tennessee. The town was named after the first postmaster, William Blevins. The town was originally a farming community, but it soon became a center for timber production. The timber industry was the main source of income for the town until the early 1900s, when the railroad came to town. The railroad brought new businesses and industries to the area, and the town began to grow.
In the early 1900s, the town was home to several sawmills, a cotton gin, and a grist mill. The town also had a hotel, a bank, and several stores. The town was also home to a school, which was established in 1891.
Geography
Blevins is located in the southwestern part of Arkansas, about 20 miles from the Texas border. The town is situated in the Ouachita Mountains, which are part of the Ozark Plateau. The town is surrounded by rolling hills and forests. The town is located near the Little Missouri River, which is a tributary of the Red River.
The climate in Blevins is humid subtropical, with hot summers and mild winters. The average annual temperature is around 65 degrees Fahrenheit. The average annual precipitation is around 45 inches.
Economy
The economy of Blevins is largely based on agriculture. The town is home to several farms, which produce a variety of crops, including cotton, soybeans, corn, and wheat. The town is also home to several timber companies, which harvest timber from the surrounding forests.
The town is also home to several small businesses, including restaurants, stores, and service providers. The town is also home to a few manufacturing companies, which produce a variety of products, including furniture and clothing.
Demographics
As of the 2010 census, the population of Blevins was 498. The racial makeup of the town was 97.2% White, 0.2% African American, 0.2% Native American, 0.2% Asian, 0.2% from other races, and 1.8% from two or more races. Hispanic or Latino of any race were 1.2% of the population.
The median household income in Blevins was $30,000, and the median family income was $35,000. The per capita income in Blevins was $14,000. About 17.2% of the population was below the poverty line.
Blevins is a small town with a rich history and a diverse economy. The town is home to several farms, timber companies, and small businesses. The town is also home to a few manufacturing companies, which produce a variety of products. The town has a population of approximately 500 people, and the median household income is around $30,000.
Common Questions
What is Per Capita Income in Blevins?
Per Capita income in Blevins is $20,147.
What is the Median Family Income in Blevins?
Median Family Income in Blevins is $68,750.
What is the Median Household income in Blevins?
Median Household Income in Blevins is $57,500.
What is Income or Wage Gap in Blevins?
Income or Wage Gap in Blevins is 5.7%.
Women in Blevins earn 94.3 cents for every dollar earned by a man.
What is Inequality or Gini Index in Blevins?
Inequality or Gini Index in Blevins is 0.38.
What is the Total Population of Blevins?
Total Population of Blevins is 331.
What is the Total Male Population of Blevins?
Total Male Population of Blevins is 166.
What is the Total Female Population of Blevins?
Total Female Population of Blevins is 165.
What is the Ratio of Males per 100 Females in Blevins?
There are 100.61 Males per 100 Females in Blevins.
What is the Ratio of Females per 100 Males in Blevins?
There are 99.40 Females per 100 Males in Blevins.
What is the Median Population Age in Blevins?
Median Population Age in Blevins is 30.8 Years.
What is the Average Family Size in Blevins
Average Family Size in Blevins is 3.8 People.
What is the Average Household Size in Blevins
Average Household Size in Blevins is 3.2 People.
How Large is the Labor Force in Blevins?
There are 128 People in the Labor Forcein in Blevins.
What is the Percentage of People in the Labor Force in Blevins?
59.8% of People are in the Labor Force in Blevins.
What is the Unemployment Rate in Blevins?
Unemployment Rate in Blevins is 10.9%.