Magnet Cove, AR Map & Demographics
Magnet Cove Map
Magnet Cove Overview
$23,185
PER CAPITA INCOME
$82,411
AVG HOUSEHOLD INCOME
0.33
INEQUALITY / GINI INDEX
1,205
TOTAL POPULATION
568
MALE POPULATION
637
FEMALE POPULATION
89.17
MALES / 100 FEMALES
112.15
FEMALES / 100 MALES
31.3
MEDIAN AGE
4.1
AVG FAMILY SIZE
3.8
AVG HOUSEHOLD SIZE
620
LABOR FORCE [ PEOPLE ]
59.9%
PERCENT IN LABOR FORCE
22.3%
UNEMPLOYMENT RATE
Income in Magnet Cove
Income Overview in Magnet Cove
| Characteristic | Number | Measure |
| Per Capita Income | 1,205 | $23,185 |
| Median Family Income | 291 | $0 |
| Mean Family Income | 291 | $90,055 |
| Median Household Income | 315 | $82,411 |
| Mean Household Income | 315 | $85,603 |
| Income Deficit | 291 | $0 |
| Wage / Income Gap (%) | 1,205 | 0.00% |
| Wage / Income Gap ($) | 1,205 | 100.00¢ per $1 |
| Gini / Inequality Index | 1,205 | 0.33 |
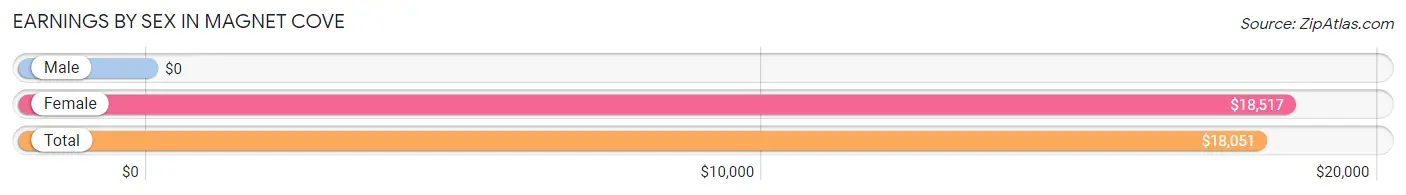
Earnings by Sex in Magnet Cove
| Sex | Number | Average Earnings |
| Male | 400 (48.9%) | $0 |
| Female | 418 (51.1%) | $18,517 |
| Total | 818 (100.0%) | $18,051 |
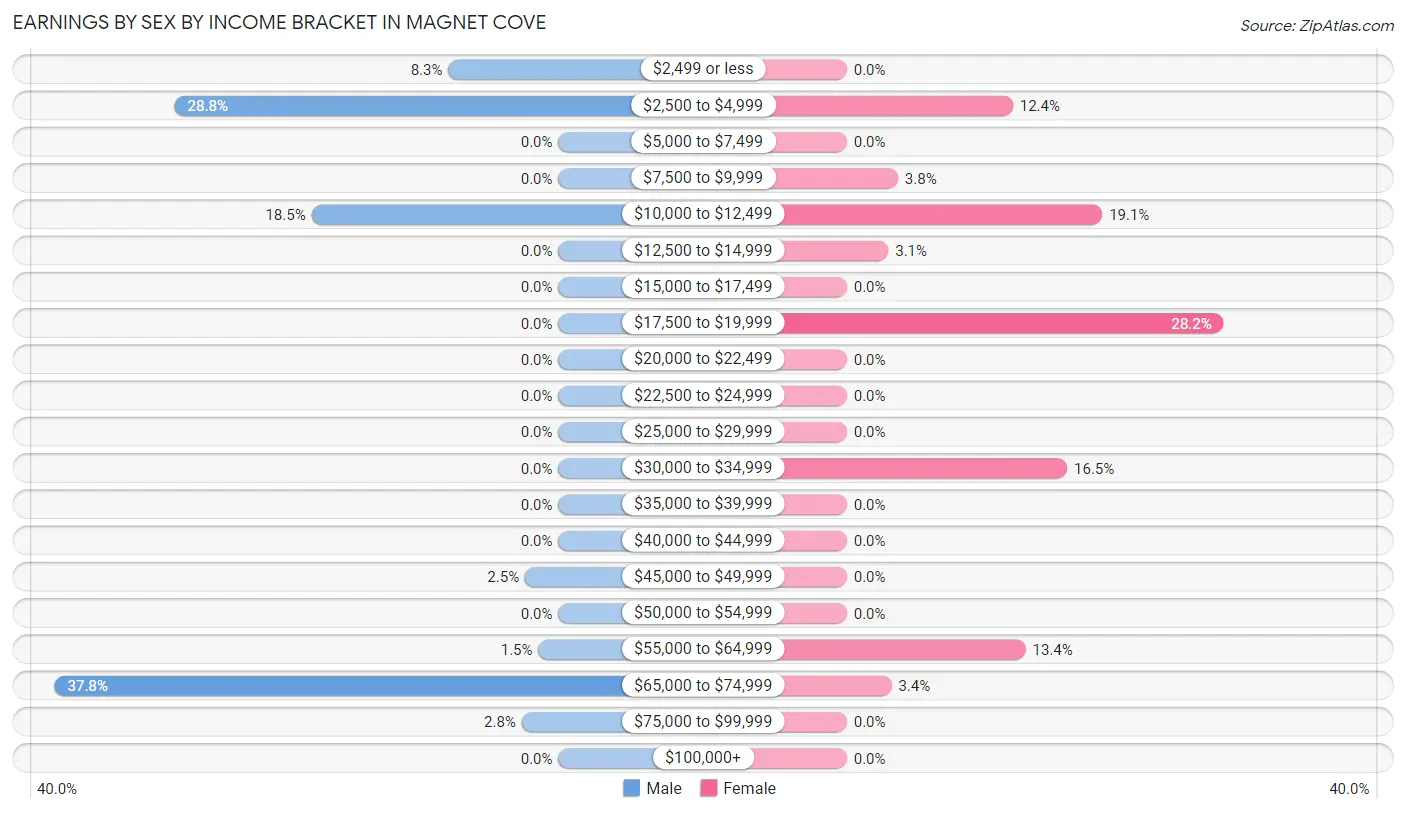
Earnings by Sex by Income Bracket in Magnet Cove
The most common earnings brackets in Magnet Cove are $65,000 to $74,999 for men (151 | 37.8%) and $17,500 to $19,999 for women (118 | 28.2%).
| Income | Male | Female |
| $2,499 or less | 33 (8.3%) | 0 (0.0%) |
| $2,500 to $4,999 | 115 (28.7%) | 52 (12.4%) |
| $5,000 to $7,499 | 0 (0.0%) | 0 (0.0%) |
| $7,500 to $9,999 | 0 (0.0%) | 16 (3.8%) |
| $10,000 to $12,499 | 74 (18.5%) | 80 (19.1%) |
| $12,500 to $14,999 | 0 (0.0%) | 13 (3.1%) |
| $15,000 to $17,499 | 0 (0.0%) | 0 (0.0%) |
| $17,500 to $19,999 | 0 (0.0%) | 118 (28.2%) |
| $20,000 to $22,499 | 0 (0.0%) | 0 (0.0%) |
| $22,500 to $24,999 | 0 (0.0%) | 0 (0.0%) |
| $25,000 to $29,999 | 0 (0.0%) | 0 (0.0%) |
| $30,000 to $34,999 | 0 (0.0%) | 69 (16.5%) |
| $35,000 to $39,999 | 0 (0.0%) | 0 (0.0%) |
| $40,000 to $44,999 | 0 (0.0%) | 0 (0.0%) |
| $45,000 to $49,999 | 10 (2.5%) | 0 (0.0%) |
| $50,000 to $54,999 | 0 (0.0%) | 0 (0.0%) |
| $55,000 to $64,999 | 6 (1.5%) | 56 (13.4%) |
| $65,000 to $74,999 | 151 (37.8%) | 14 (3.4%) |
| $75,000 to $99,999 | 11 (2.8%) | 0 (0.0%) |
| $100,000+ | 0 (0.0%) | 0 (0.0%) |
| Total | 400 (100.0%) | 418 (100.0%) |
Earnings by Sex by Educational Attainment in Magnet Cove
| Educational Attainment | Male Income | Female Income |
| Less than High School | - | - |
| High School Diploma | - | - |
| College or Associate's Degree | - | - |
| Bachelor's Degree | - | - |
| Graduate Degree | - | - |
| Total | $65,650 | $0 |
Family Income in Magnet Cove
Family Income Brackets in Magnet Cove
According to the Magnet Cove family income data, there are 125 families falling into the $100,000 to $149,999 income range, which is the most common income bracket and makes up 43.0% of all families.
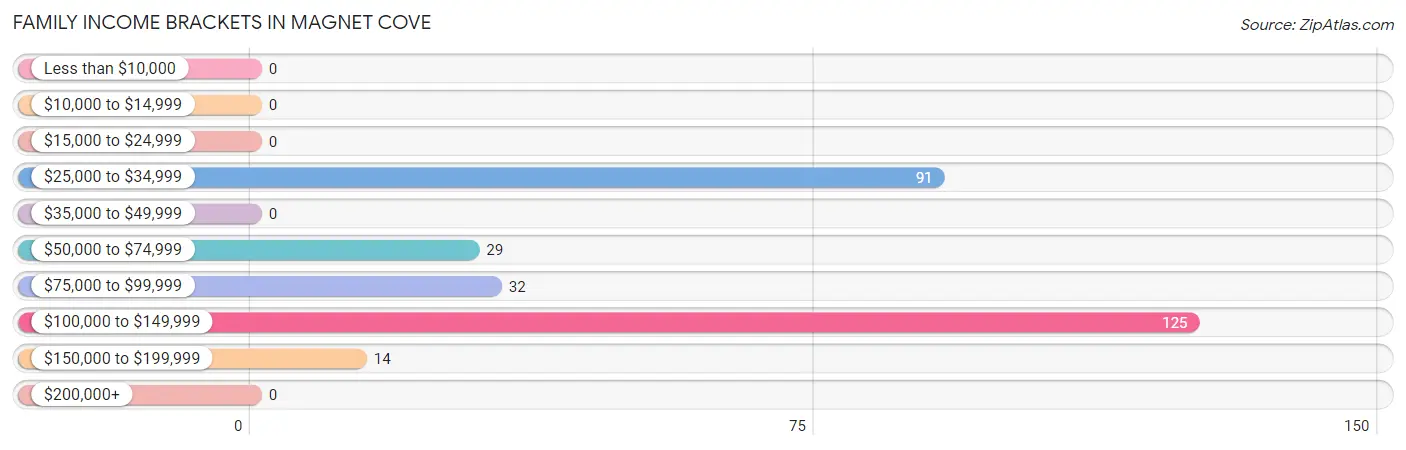
| Income Bracket | # Families | % Families |
| Less than $10,000 | 0 | 0.0% |
| $10,000 to $14,999 | 0 | 0.0% |
| $15,000 to $24,999 | 0 | 0.0% |
| $25,000 to $34,999 | 91 | 31.3% |
| $35,000 to $49,999 | 0 | 0.0% |
| $50,000 to $74,999 | 29 | 10.0% |
| $75,000 to $99,999 | 32 | 11.0% |
| $100,000 to $149,999 | 125 | 43.0% |
| $150,000 to $199,999 | 14 | 4.8% |
| $200,000+ | 0 | 0.0% |
Family Income by Famaliy Size in Magnet Cove
4-person families (148 | 50.9%) account for the highest median family income in Magnet Cove with $134,348 per family, while 4-person families (148 | 50.9%) have the highest median income of $33,587 per family member.
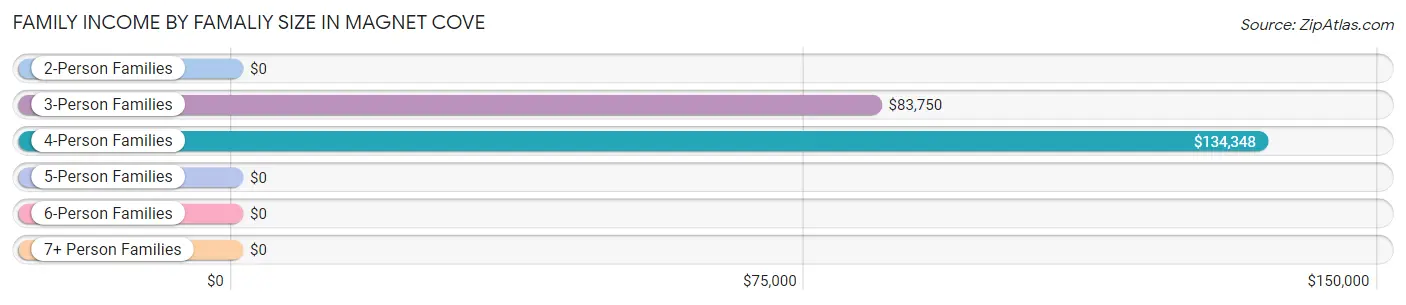
| Income Bracket | # Families | Median Income |
| 2-Person Families | 17 (5.8%) | $0 |
| 3-Person Families | 46 (15.8%) | $83,750 |
| 4-Person Families | 148 (50.9%) | $134,348 |
| 5-Person Families | 80 (27.5%) | $0 |
| 6-Person Families | 0 (0.0%) | $0 |
| 7+ Person Families | 0 (0.0%) | $0 |
| Total | 291 (100.0%) | $0 |
Family Income by Number of Earners in Magnet Cove
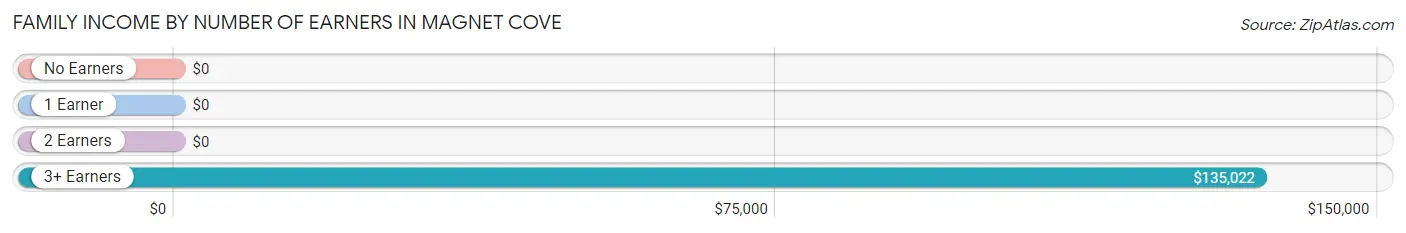
| Number of Earners | # Families | Median Income |
| No Earners | 14 (4.8%) | $0 |
| 1 Earner | 6 (2.1%) | $0 |
| 2 Earners | 132 (45.4%) | $0 |
| 3+ Earners | 139 (47.8%) | $135,022 |
| Total | 291 (100.0%) | $0 |
Household Income in Magnet Cove
Household Income Brackets in Magnet Cove
With 125 households falling in the category, the $100,000 to $149,999 income range is the most frequent in Magnet Cove, accounting for 39.7% of all households.
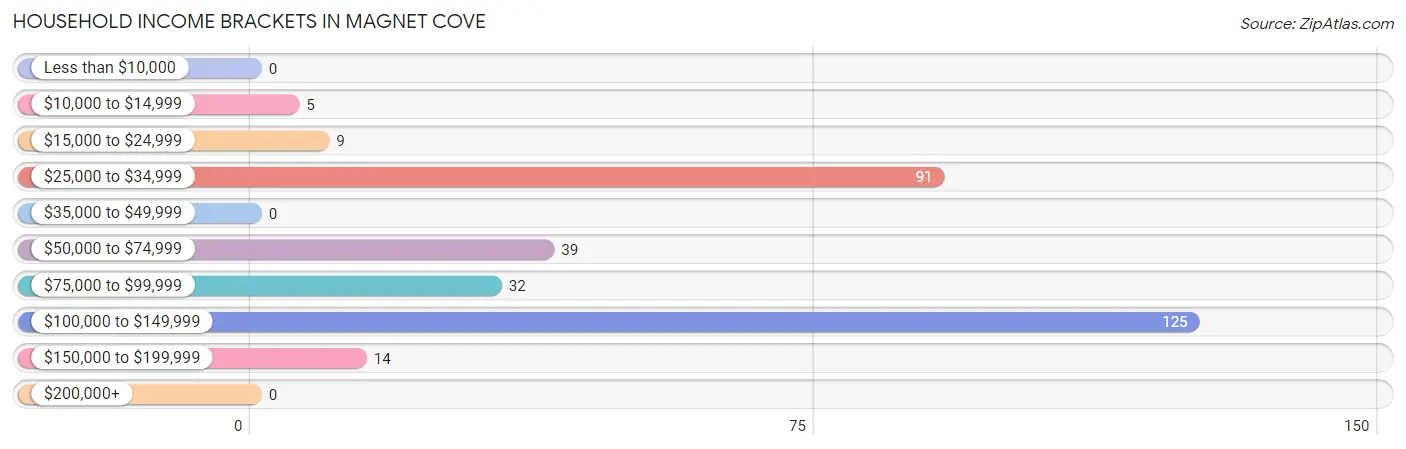
| Income Bracket | # Households | % Households |
| Less than $10,000 | 0 | 0.0% |
| $10,000 to $14,999 | 5 | 1.6% |
| $15,000 to $24,999 | 9 | 2.9% |
| $25,000 to $34,999 | 91 | 28.9% |
| $35,000 to $49,999 | 0 | 0.0% |
| $50,000 to $74,999 | 39 | 12.4% |
| $75,000 to $99,999 | 32 | 10.2% |
| $100,000 to $149,999 | 125 | 39.7% |
| $150,000 to $199,999 | 14 | 4.4% |
| $200,000+ | 0 | 0.0% |
Household Income by Householder Age in Magnet Cove
The median household income in Magnet Cove is $82,411, with the highest median household income of $134,149 found in the 45 to 64 years age bracket for the primary householder. A total of 187 households (59.4%) fall into this category.
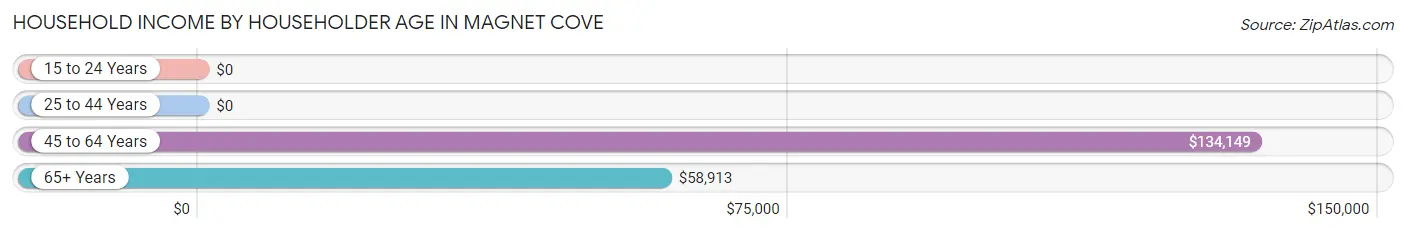
| Income Bracket | # Households | Median Income |
| 15 to 24 Years | 0 (0.0%) | $0 |
| 25 to 44 Years | 80 (25.4%) | $0 |
| 45 to 64 Years | 187 (59.4%) | $134,149 |
| 65+ Years | 48 (15.2%) | $58,913 |
| Total | 315 (100.0%) | $82,411 |
Poverty in Magnet Cove
Income Below Poverty by Sex and Age in Magnet Cove
With 33.1% poverty level for males and 22.6% for females among the residents of Magnet Cove, 12 to 14 year old males and 25 to 34 year old females are the most vulnerable to poverty, with 71 males (100.0%) and 80 females (100.0%) in their respective age groups living below the poverty level.
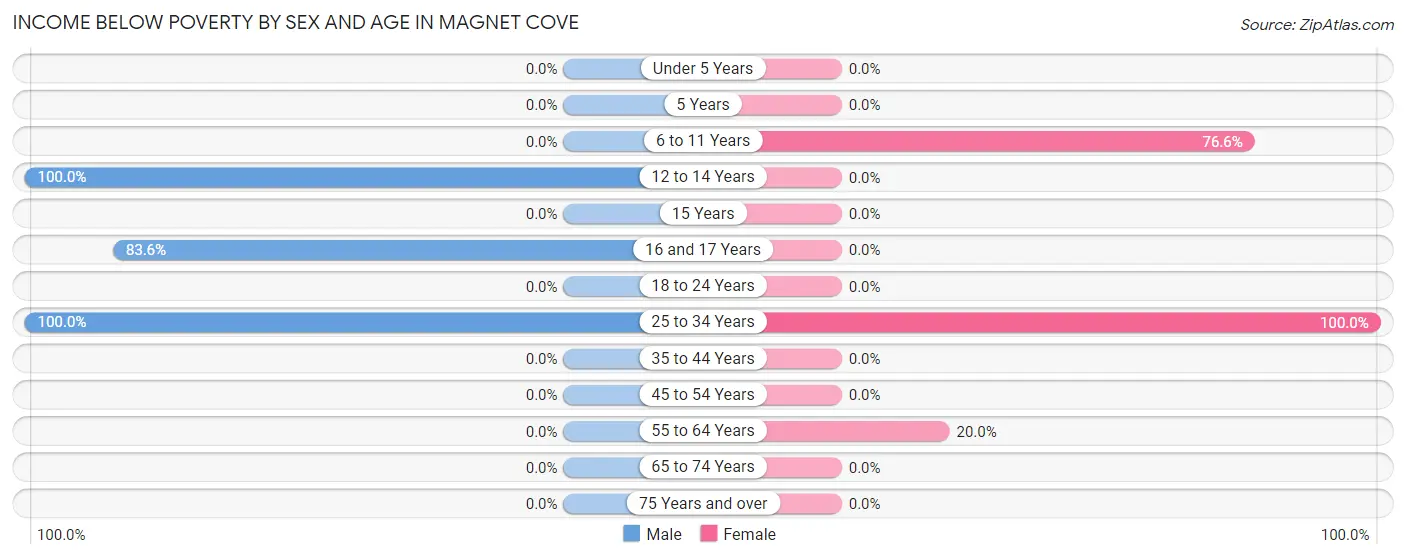
| Age Bracket | Male | Female |
| Under 5 Years | 0 (0.0%) | 0 (0.0%) |
| 5 Years | 0 (0.0%) | 0 (0.0%) |
| 6 to 11 Years | 0 (0.0%) | 59 (76.6%) |
| 12 to 14 Years | 71 (100.0%) | 0 (0.0%) |
| 15 Years | 0 (0.0%) | 0 (0.0%) |
| 16 and 17 Years | 51 (83.6%) | 0 (0.0%) |
| 18 to 24 Years | 0 (0.0%) | 0 (0.0%) |
| 25 to 34 Years | 66 (100.0%) | 80 (100.0%) |
| 35 to 44 Years | 0 (0.0%) | 0 (0.0%) |
| 45 to 54 Years | 0 (0.0%) | 0 (0.0%) |
| 55 to 64 Years | 0 (0.0%) | 5 (20.0%) |
| 65 to 74 Years | 0 (0.0%) | 0 (0.0%) |
| 75 Years and over | 0 (0.0%) | 0 (0.0%) |
| Total | 188 (33.1%) | 144 (22.6%) |
Income Above Poverty by Sex and Age in Magnet Cove
According to the poverty statistics in Magnet Cove, males aged 18 to 24 years and females aged 12 to 14 years are the age groups that are most secure financially, with 100.0% of males and 100.0% of females in these age groups living above the poverty line.
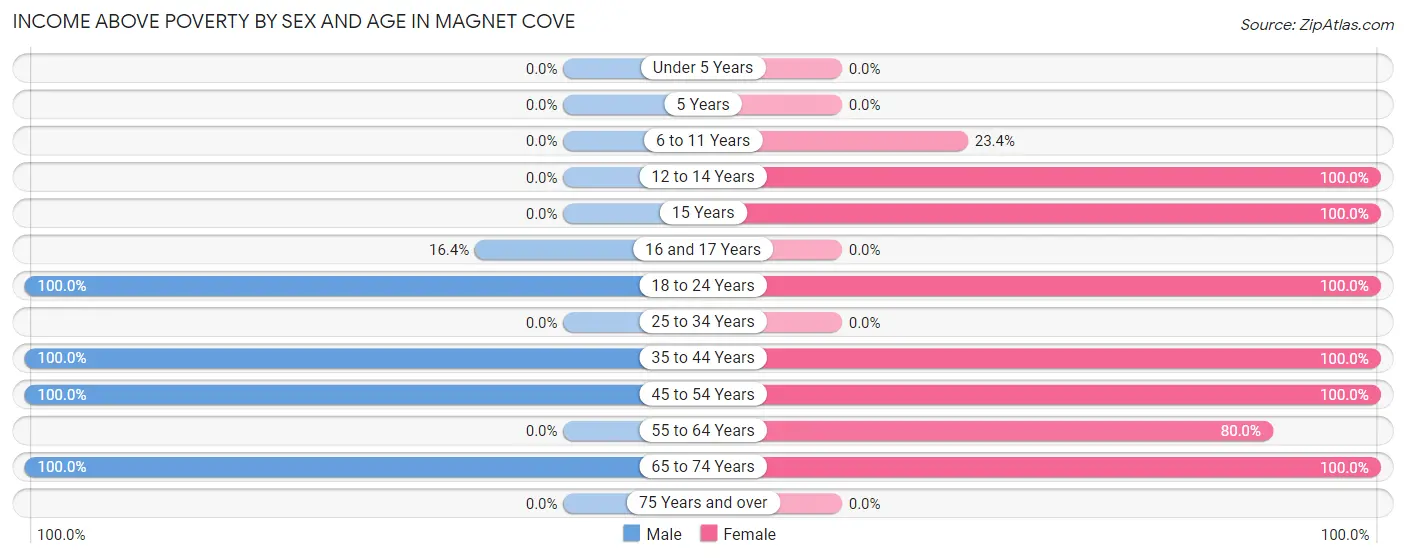
| Age Bracket | Male | Female |
| Under 5 Years | 0 (0.0%) | 0 (0.0%) |
| 5 Years | 0 (0.0%) | 0 (0.0%) |
| 6 to 11 Years | 0 (0.0%) | 18 (23.4%) |
| 12 to 14 Years | 0 (0.0%) | 11 (100.0%) |
| 15 Years | 0 (0.0%) | 11 (100.0%) |
| 16 and 17 Years | 10 (16.4%) | 0 (0.0%) |
| 18 to 24 Years | 105 (100.0%) | 248 (100.0%) |
| 25 to 34 Years | 0 (0.0%) | 0 (0.0%) |
| 35 to 44 Years | 44 (100.0%) | 13 (100.0%) |
| 45 to 54 Years | 184 (100.0%) | 146 (100.0%) |
| 55 to 64 Years | 0 (0.0%) | 20 (80.0%) |
| 65 to 74 Years | 37 (100.0%) | 26 (100.0%) |
| 75 Years and over | 0 (0.0%) | 0 (0.0%) |
| Total | 380 (66.9%) | 493 (77.4%) |
Income Below Poverty Among Married-Couple Families in Magnet Cove
The poverty statistics for married-couple families in Magnet Cove show that 27.5% or 80 of the total 291 families live below the poverty line. Families with 3 or 4 children have the highest poverty rate of 100.0%, comprising of 80 families. On the other hand, families with no children have the lowest poverty rate of 0.0%, which includes 0 families.
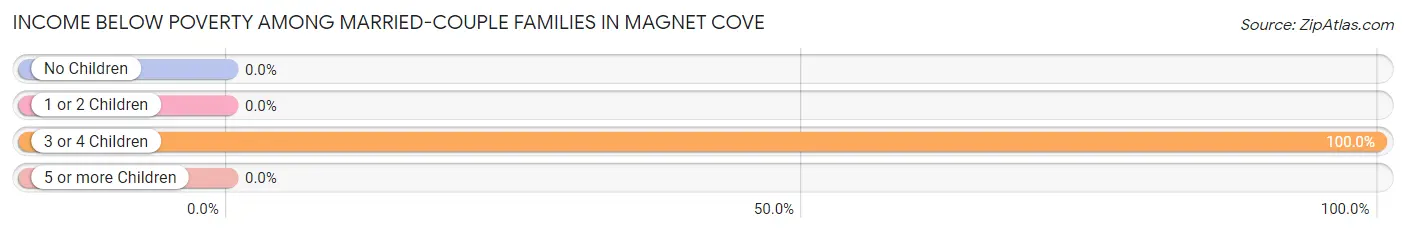
| Children | Above Poverty | Below Poverty |
| No Children | 142 (100.0%) | 0 (0.0%) |
| 1 or 2 Children | 69 (100.0%) | 0 (0.0%) |
| 3 or 4 Children | 0 (0.0%) | 80 (100.0%) |
| 5 or more Children | 0 (0.0%) | 0 (0.0%) |
| Total | 211 (72.5%) | 80 (27.5%) |
Income Below Poverty Among Single-Parent Households in Magnet Cove
| Children | Single Father | Single Mother |
| No Children | 0 (0.0%) | 0 (0.0%) |
| 1 or 2 Children | 0 (0.0%) | 0 (0.0%) |
| 3 or 4 Children | 0 (0.0%) | 0 (0.0%) |
| 5 or more Children | 0 (0.0%) | 0 (0.0%) |
| Total | 0 (0.0%) | 0 (0.0%) |
Income Below Poverty Among Married-Couple vs Single-Parent Households in Magnet Cove
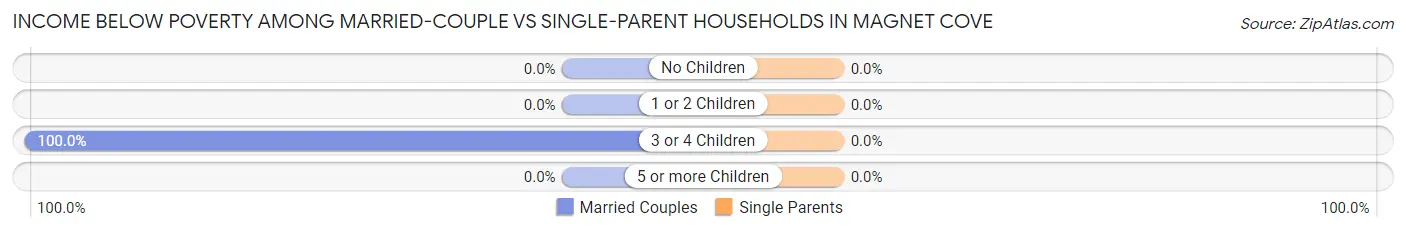
| Children | Married-Couple Families | Single-Parent Households |
| No Children | 0 (0.0%) | 0 (0.0%) |
| 1 or 2 Children | 0 (0.0%) | 0 (0.0%) |
| 3 or 4 Children | 80 (100.0%) | 0 (0.0%) |
| 5 or more Children | 0 (0.0%) | 0 (0.0%) |
| Total | 80 (27.5%) | 0 (0.0%) |
Race in Magnet Cove
The most populous races in Magnet Cove are , and White / Caucasian (1,205 | 100.0%).
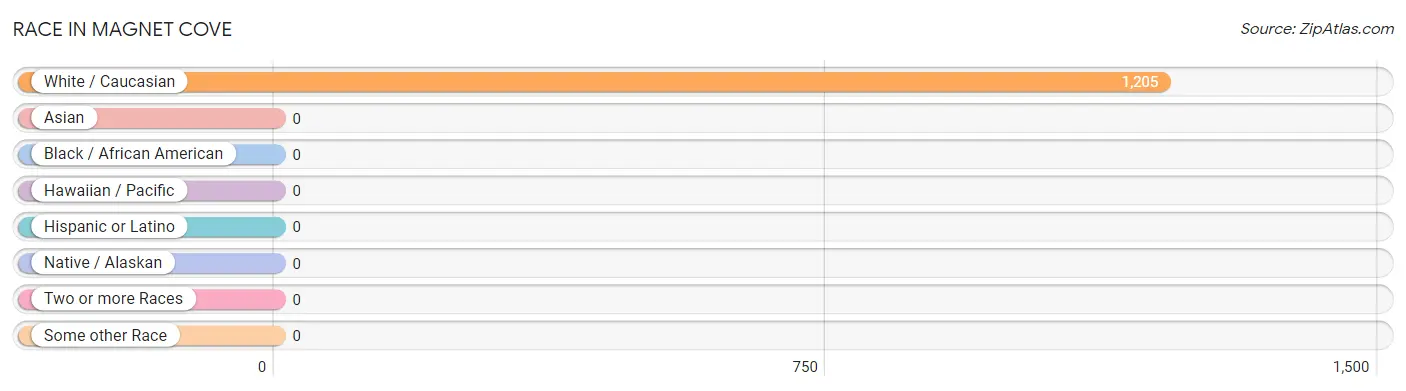
| Race | # Population | % Population |
| Asian | 0 | 0.0% |
| Black / African American | 0 | 0.0% |
| Hawaiian / Pacific | 0 | 0.0% |
| Hispanic or Latino | 0 | 0.0% |
| Native / Alaskan | 0 | 0.0% |
| White / Caucasian | 1,205 | 100.0% |
| Two or more Races | 0 | 0.0% |
| Some other Race | 0 | 0.0% |
| Total | 1,205 | 100.0% |
Ancestry in Magnet Cove
The most populous ancestries reported in Magnet Cove are American (304 | 25.2%), English (35 | 2.9%), German (35 | 2.9%), Scandinavian (26 | 2.2%), and Irish (25 | 2.1%), together accounting for 35.3% of all Magnet Cove residents.
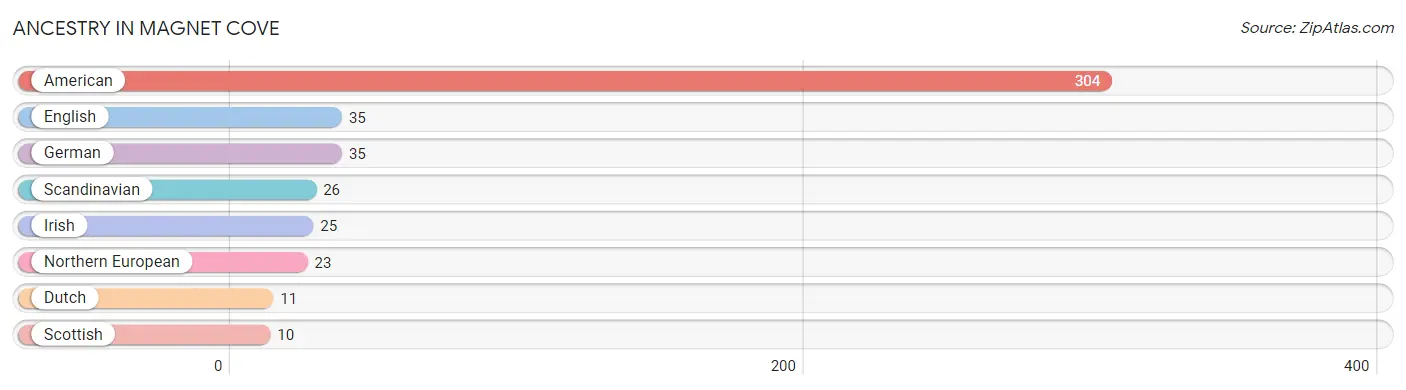
| Ancestry | # Population | % Population |
| American | 304 | 25.2% |
| Dutch | 11 | 0.9% |
| English | 35 | 2.9% |
| German | 35 | 2.9% |
| Irish | 25 | 2.1% |
| Northern European | 23 | 1.9% |
| Scandinavian | 26 | 2.2% |
| Scottish | 10 | 0.8% | View All 8 Rows |
Immigrants in Magnet Cove

| Immigration Origin | # Population | % Population | View All 0 Rows |
Sex and Age in Magnet Cove
Sex and Age in Magnet Cove
The most populous age groups in Magnet Cove are 50 to 54 Years (166 | 29.2%) for men and 20 to 24 Years (196 | 30.8%) for women.
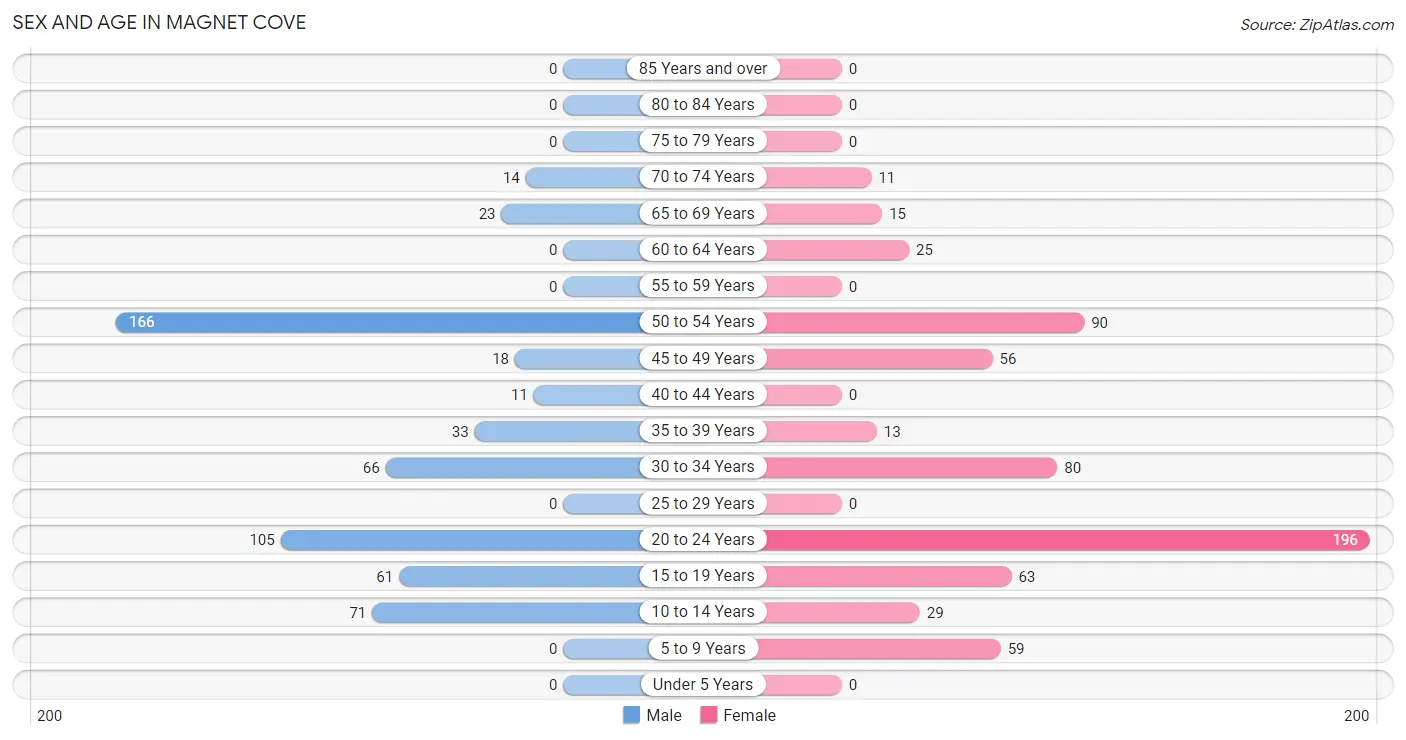
| Age Bracket | Male | Female |
| Under 5 Years | 0 (0.0%) | 0 (0.0%) |
| 5 to 9 Years | 0 (0.0%) | 59 (9.3%) |
| 10 to 14 Years | 71 (12.5%) | 29 (4.5%) |
| 15 to 19 Years | 61 (10.7%) | 63 (9.9%) |
| 20 to 24 Years | 105 (18.5%) | 196 (30.8%) |
| 25 to 29 Years | 0 (0.0%) | 0 (0.0%) |
| 30 to 34 Years | 66 (11.6%) | 80 (12.6%) |
| 35 to 39 Years | 33 (5.8%) | 13 (2.0%) |
| 40 to 44 Years | 11 (1.9%) | 0 (0.0%) |
| 45 to 49 Years | 18 (3.2%) | 56 (8.8%) |
| 50 to 54 Years | 166 (29.2%) | 90 (14.1%) |
| 55 to 59 Years | 0 (0.0%) | 0 (0.0%) |
| 60 to 64 Years | 0 (0.0%) | 25 (3.9%) |
| 65 to 69 Years | 23 (4.1%) | 15 (2.4%) |
| 70 to 74 Years | 14 (2.5%) | 11 (1.7%) |
| 75 to 79 Years | 0 (0.0%) | 0 (0.0%) |
| 80 to 84 Years | 0 (0.0%) | 0 (0.0%) |
| 85 Years and over | 0 (0.0%) | 0 (0.0%) |
| Total | 568 (100.0%) | 637 (100.0%) |
Families and Households in Magnet Cove
Median Family Size in Magnet Cove
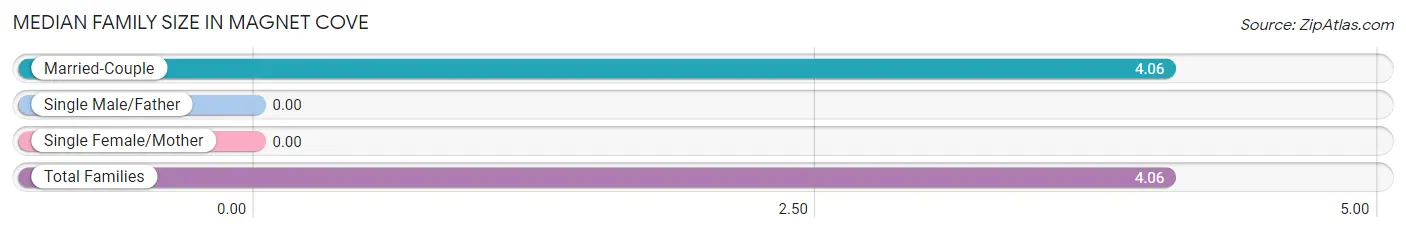
| Family Type | # Families | Family Size |
| Married-Couple | 291 (100.0%) | 4.06 |
| Single Male/Father | 0 (0.0%) | - |
| Single Female/Mother | 0 (0.0%) | - |
| Total Families | 291 (100.0%) | 4.06 |
Median Household Size in Magnet Cove
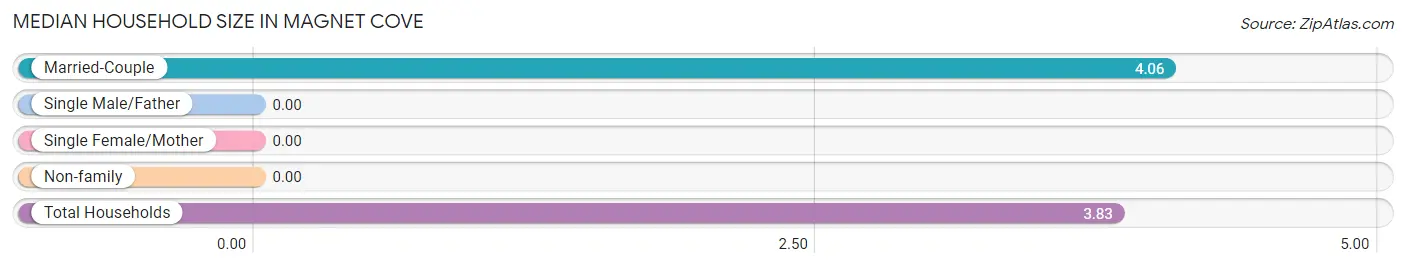
| Household Type | # Households | Household Size |
| Married-Couple | 291 (92.4%) | 4.06 |
| Single Male/Father | 0 (0.0%) | - |
| Single Female/Mother | 0 (0.0%) | - |
| Non-family | 24 (7.6%) | - |
| Total Households | 315 (100.0%) | 3.83 |
Household Size by Marriage Status in Magnet Cove
Out of a total of 315 households in Magnet Cove, 291 (92.4%) are family households, while 24 (7.6%) are nonfamily households. The most numerous type of family households are 4-person households, comprising 148, and the most common type of nonfamily households are 1-person households, comprising 24.
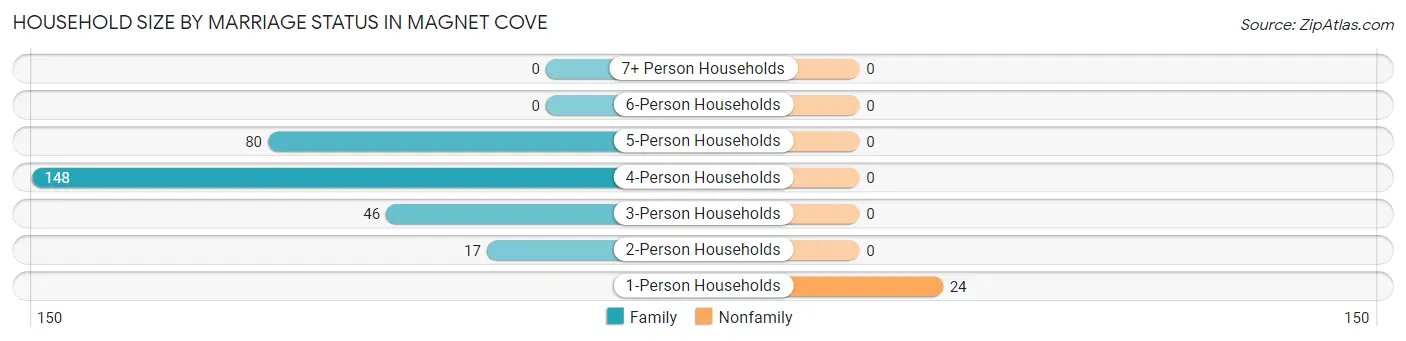
| Household Size | Family Households | Nonfamily Households |
| 1-Person Households | - | 24 (7.6%) |
| 2-Person Households | 17 (5.4%) | 0 (0.0%) |
| 3-Person Households | 46 (14.6%) | 0 (0.0%) |
| 4-Person Households | 148 (47.0%) | 0 (0.0%) |
| 5-Person Households | 80 (25.4%) | 0 (0.0%) |
| 6-Person Households | 0 (0.0%) | 0 (0.0%) |
| 7+ Person Households | 0 (0.0%) | 0 (0.0%) |
| Total | 291 (92.4%) | 24 (7.6%) |
Female Fertility in Magnet Cove
Fertility by Age in Magnet Cove
| Age Bracket | Women with Births | Births / 1,000 Women |
| 15 to 19 years | 0 (0.0%) | 0.0 |
| 20 to 34 years | 0 (0.0%) | 0.0 |
| 35 to 50 years | 0 (0.0%) | 0.0 |
| Total | 0 (0.0%) | 0.0 |
Fertility by Age by Marriage Status in Magnet Cove
| Age Bracket | Married | Unmarried |
| 15 to 19 years | 0 (0.0%) | 0 (0.0%) |
| 20 to 34 years | 0 (0.0%) | 0 (0.0%) |
| 35 to 50 years | 0 (0.0%) | 0 (0.0%) |
| Total | 0 (0.0%) | 0 (0.0%) |
Fertility by Education in Magnet Cove
| Educational Attainment | Women with Births | Births / 1,000 Women |
| Less than High School | 0 (0.0%) | 0.0 |
| High School Diploma | 0 (0.0%) | 0.0 |
| College or Associate's Degree | 0 (0.0%) | 0.0 |
| Bachelor's Degree | 0 (0.0%) | 0.0 |
| Graduate Degree | 0 (0.0%) | 0.0 |
| Total | 0 (0.0%) | 0.0 |
Fertility by Education by Marriage Status in Magnet Cove
| Educational Attainment | Married | Unmarried |
| Less than High School | 0 (0.0%) | 0 (0.0%) |
| High School Diploma | 0 (0.0%) | 0 (0.0%) |
| College or Associate's Degree | 0 (0.0%) | 0 (0.0%) |
| Bachelor's Degree | 0 (0.0%) | 0 (0.0%) |
| Graduate Degree | 0 (0.0%) | 0 (0.0%) |
| Total | 0 (0.0%) | 0 (0.0%) |
Employment Characteristics in Magnet Cove
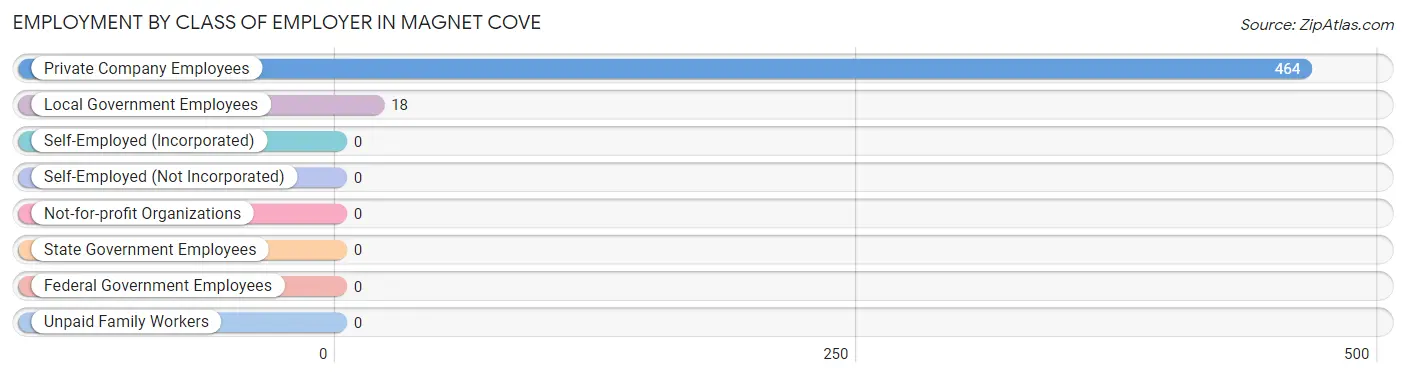
Employment by Class of Employer in Magnet Cove
Among the 482 employed individuals in Magnet Cove, private company employees (464 | 96.3%), and local government employees (18 | 3.7%) make up the most common classes of employment.
| Employer Class | # Employees | % Employees |
| Private Company Employees | 464 | 96.3% |
| Self-Employed (Incorporated) | 0 | 0.0% |
| Self-Employed (Not Incorporated) | 0 | 0.0% |
| Not-for-profit Organizations | 0 | 0.0% |
| Local Government Employees | 18 | 3.7% |
| State Government Employees | 0 | 0.0% |
| Federal Government Employees | 0 | 0.0% |
| Unpaid Family Workers | 0 | 0.0% |
| Total | 482 | 100.0% |
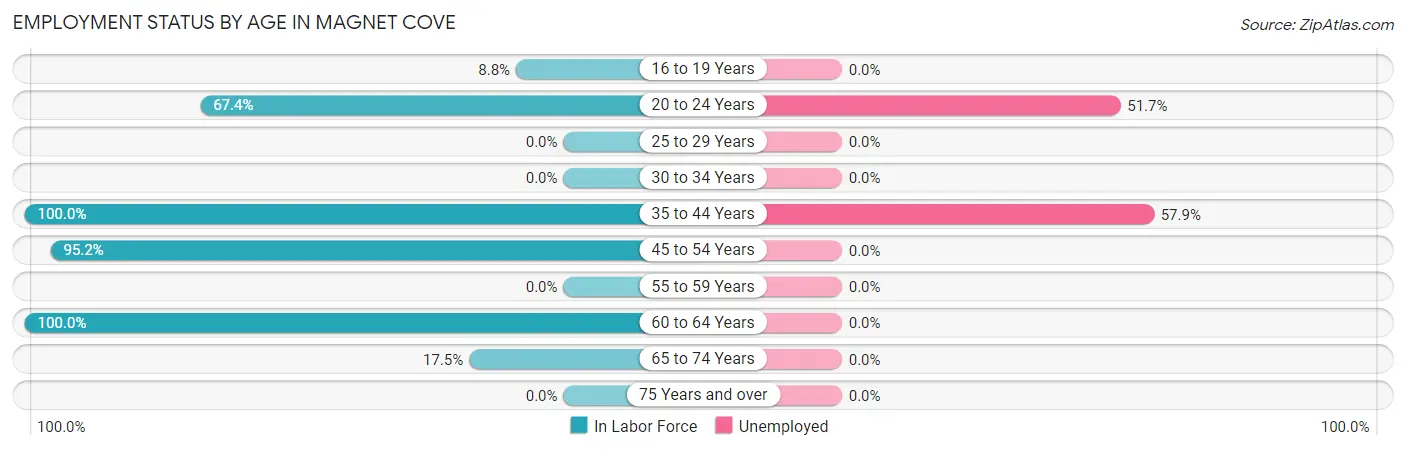
Employment Status by Age in Magnet Cove
According to the labor force statistics for Magnet Cove, out of the total population over 16 years of age (1,035), 59.9% or 620 individuals are in the labor force, with 22.3% or 138 of them unemployed. The age group with the highest labor force participation rate is 35 to 44 years, with 100.0% or 57 individuals in the labor force. Within the labor force, the 35 to 44 years age range has the highest percentage of unemployed individuals, with 57.9% or 33 of them being unemployed.
| Age Bracket | In Labor Force | Unemployed |
| 16 to 19 Years | 10 (8.8%) | 0 (0.0%) |
| 20 to 24 Years | 203 (67.4%) | 105 (51.7%) |
| 25 to 29 Years | 0 (0.0%) | 0 (0.0%) |
| 30 to 34 Years | 0 (0.0%) | 0 (0.0%) |
| 35 to 44 Years | 57 (100.0%) | 33 (57.9%) |
| 45 to 54 Years | 314 (95.2%) | 0 (0.0%) |
| 55 to 59 Years | 0 (0.0%) | 0 (0.0%) |
| 60 to 64 Years | 25 (100.0%) | 0 (0.0%) |
| 65 to 74 Years | 11 (17.5%) | 0 (0.0%) |
| 75 Years and over | 0 (0.0%) | 0 (0.0%) |
| Total | 620 (59.9%) | 138 (22.3%) |
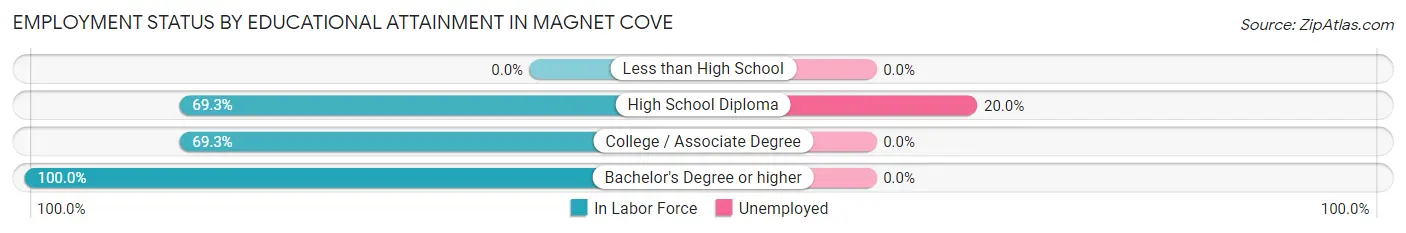
Employment Status by Educational Attainment in Magnet Cove
According to labor force statistics for Magnet Cove, 71.0% of individuals (396) out of the total population between 25 and 64 years of age (558) are in the labor force, with 8.3% or 33 of them being unemployed. The group with the highest labor force participation rate are those with the educational attainment of bachelor's degree or higher, with 100.0% or 30 individuals in the labor force. Within the labor force, individuals with high school diploma education have the highest percentage of unemployment, with 20.0% or 33 of them being unemployed.
| Educational Attainment | In Labor Force | Unemployed |
| Less than High School | 0 (0.0%) | 0 (0.0%) |
| High School Diploma | 165 (69.3%) | 48 (20.0%) |
| College / Associate Degree | 201 (69.3%) | 0 (0.0%) |
| Bachelor's Degree or higher | 30 (100.0%) | 0 (0.0%) |
| Total | 396 (71.0%) | 46 (8.3%) |
Employment Occupations by Sex in Magnet Cove
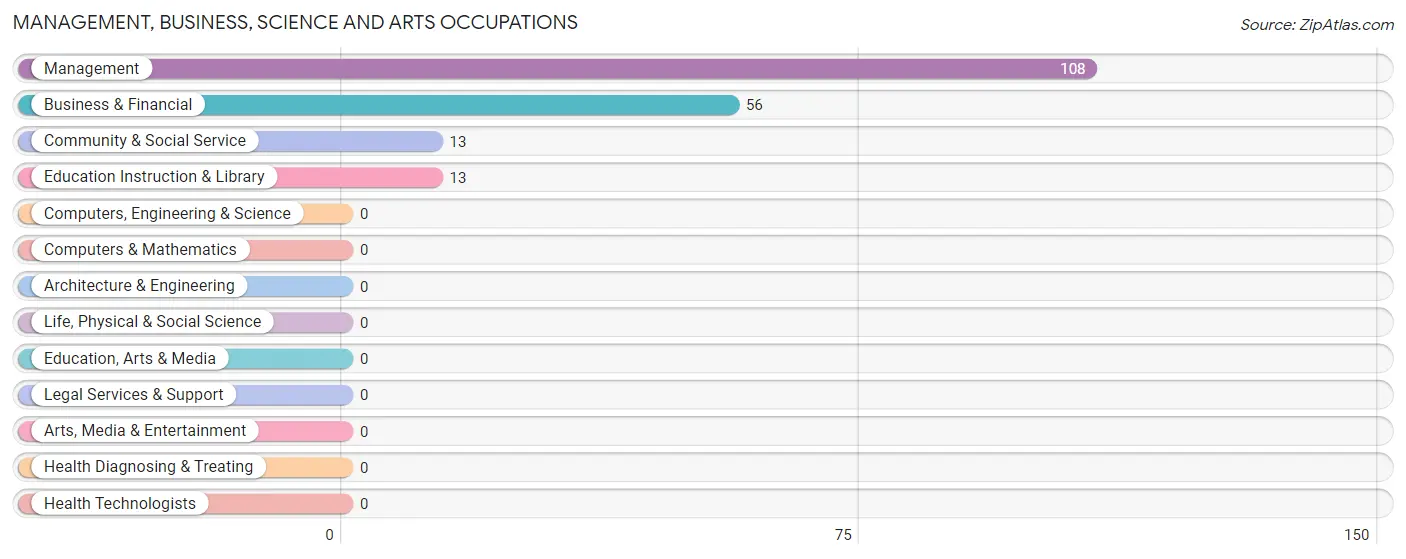
Management, Business, Science and Arts Occupations
The most common Management, Business, Science and Arts occupations in Magnet Cove are Management (108 | 22.4%), Business & Financial (56 | 11.6%), Community & Social Service (13 | 2.7%), and Education Instruction & Library (13 | 2.7%).
Management, Business, Science and Arts Occupations by Sex
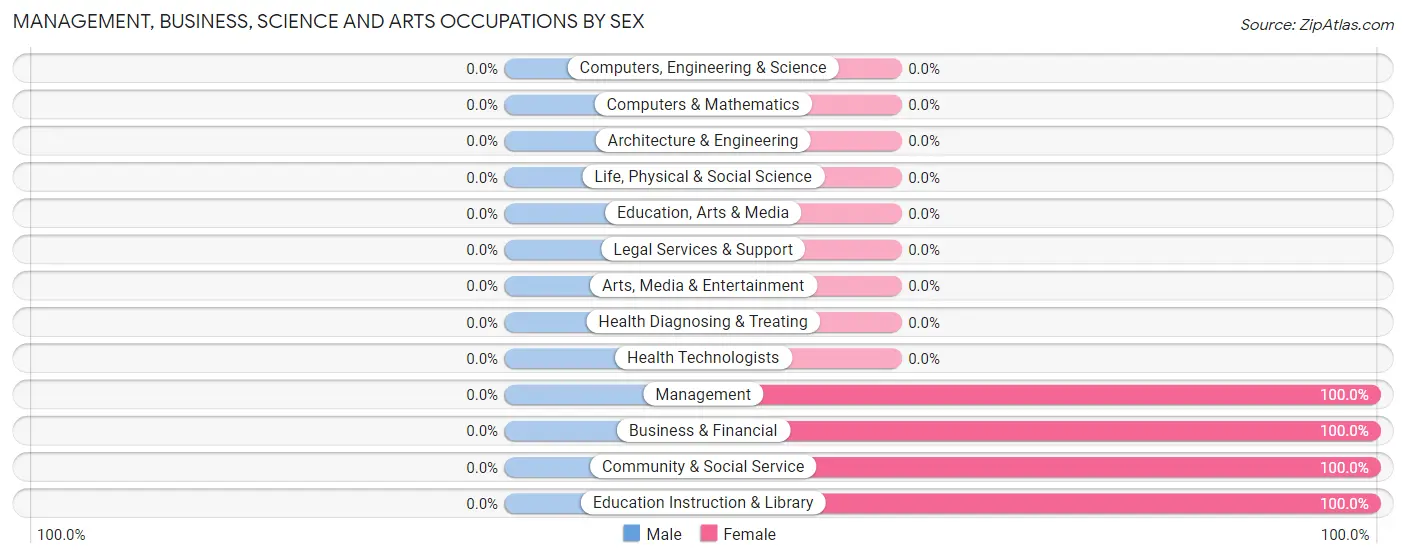
| Occupation | Male | Female |
| Management | 0 (0.0%) | 108 (100.0%) |
| Business & Financial | 0 (0.0%) | 56 (100.0%) |
| Computers, Engineering & Science | 0 (0.0%) | 0 (0.0%) |
| Computers & Mathematics | 0 (0.0%) | 0 (0.0%) |
| Architecture & Engineering | 0 (0.0%) | 0 (0.0%) |
| Life, Physical & Social Science | 0 (0.0%) | 0 (0.0%) |
| Community & Social Service | 0 (0.0%) | 13 (100.0%) |
| Education, Arts & Media | 0 (0.0%) | 0 (0.0%) |
| Legal Services & Support | 0 (0.0%) | 0 (0.0%) |
| Education Instruction & Library | 0 (0.0%) | 13 (100.0%) |
| Arts, Media & Entertainment | 0 (0.0%) | 0 (0.0%) |
| Health Diagnosing & Treating | 0 (0.0%) | 0 (0.0%) |
| Health Technologists | 0 (0.0%) | 0 (0.0%) |
| Total (Category) | 0 (0.0%) | 177 (100.0%) |
| Total (Overall) | 196 (40.7%) | 286 (59.3%) |
Services Occupations
The most common Services occupations in Magnet Cove are , and Food Preparation & Serving (10 | 2.1%).
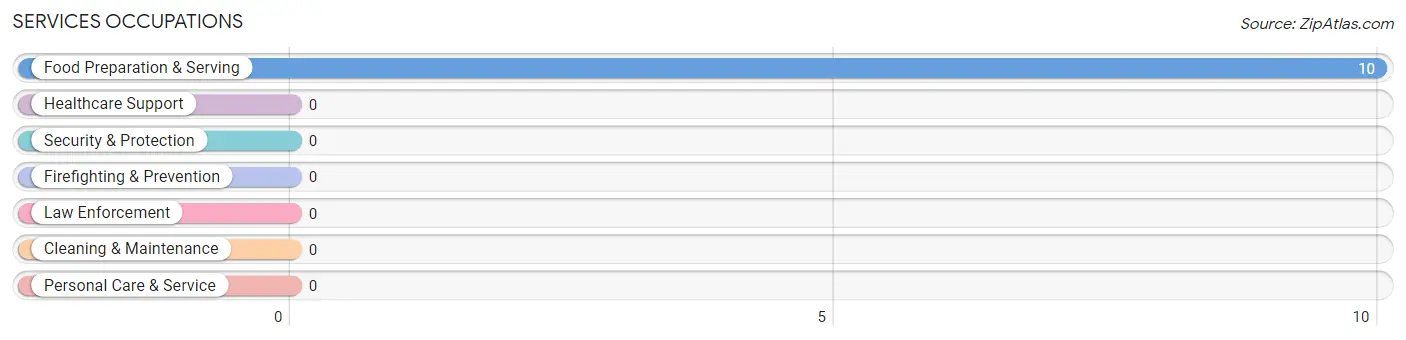
Services Occupations by Sex
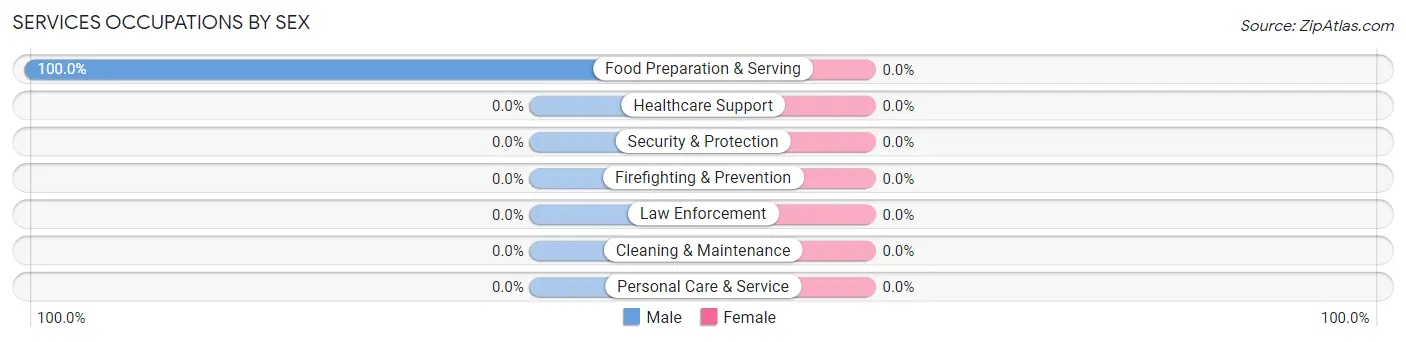
| Occupation | Male | Female |
| Healthcare Support | 0 (0.0%) | 0 (0.0%) |
| Security & Protection | 0 (0.0%) | 0 (0.0%) |
| Firefighting & Prevention | 0 (0.0%) | 0 (0.0%) |
| Law Enforcement | 0 (0.0%) | 0 (0.0%) |
| Food Preparation & Serving | 10 (100.0%) | 0 (0.0%) |
| Cleaning & Maintenance | 0 (0.0%) | 0 (0.0%) |
| Personal Care & Service | 0 (0.0%) | 0 (0.0%) |
| Total (Category) | 10 (100.0%) | 0 (0.0%) |
| Total (Overall) | 196 (40.7%) | 286 (59.3%) |
Sales and Office Occupations
The most common Sales and Office occupations in Magnet Cove are Office & Administration (104 | 21.6%), and Sales & Related (21 | 4.4%).
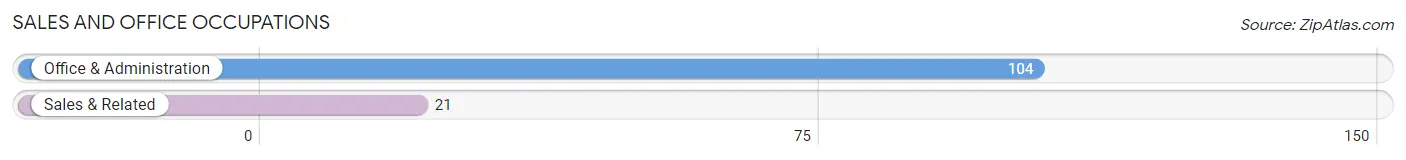
Sales and Office Occupations by Sex
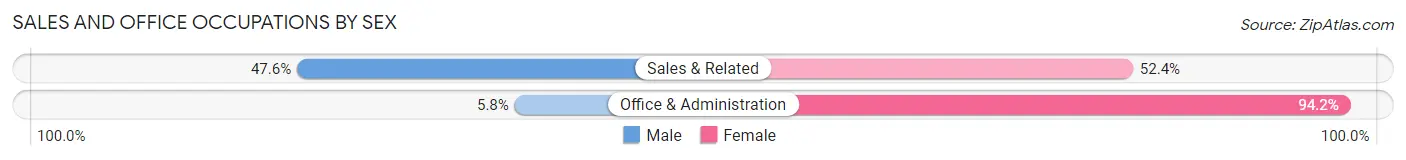
| Occupation | Male | Female |
| Sales & Related | 10 (47.6%) | 11 (52.4%) |
| Office & Administration | 6 (5.8%) | 98 (94.2%) |
| Total (Category) | 16 (12.8%) | 109 (87.2%) |
| Total (Overall) | 196 (40.7%) | 286 (59.3%) |
Natural Resources, Construction and Maintenance Occupations
The most common Natural Resources, Construction and Maintenance occupations in Magnet Cove are , and Construction & Extraction (101 | 20.9%).
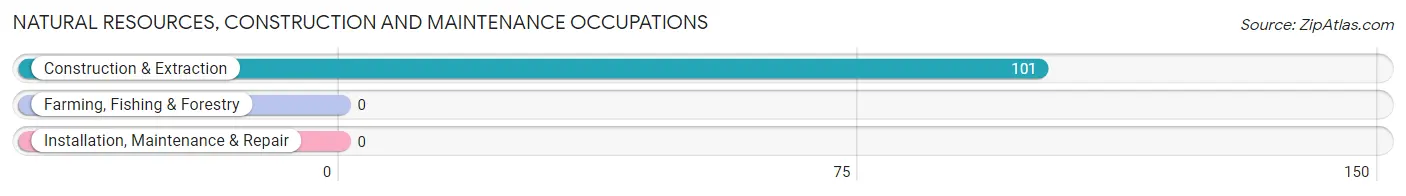
Natural Resources, Construction and Maintenance Occupations by Sex
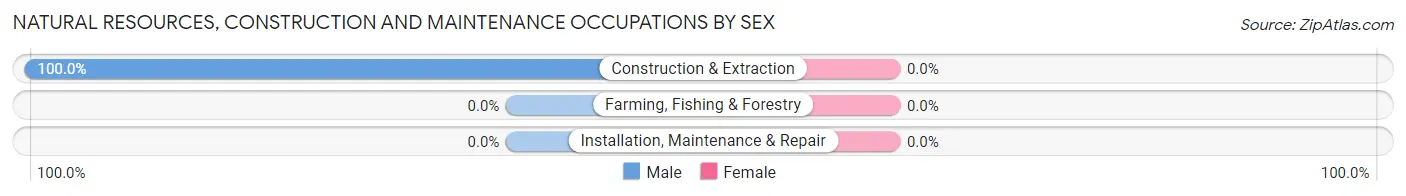
| Occupation | Male | Female |
| Farming, Fishing & Forestry | 0 (0.0%) | 0 (0.0%) |
| Construction & Extraction | 101 (100.0%) | 0 (0.0%) |
| Installation, Maintenance & Repair | 0 (0.0%) | 0 (0.0%) |
| Total (Category) | 101 (100.0%) | 0 (0.0%) |
| Total (Overall) | 196 (40.7%) | 286 (59.3%) |
Production, Transportation and Moving Occupations
The most common Production, Transportation and Moving occupations in Magnet Cove are , and Production (69 | 14.3%).
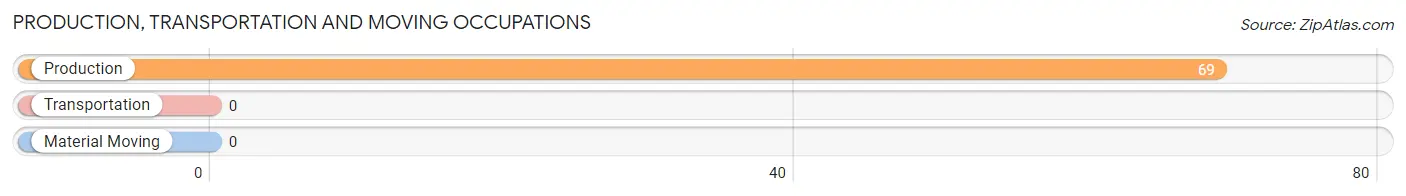
Production, Transportation and Moving Occupations by Sex
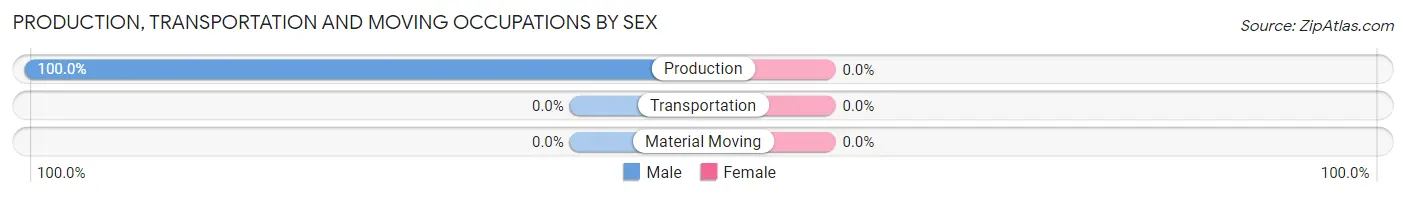
| Occupation | Male | Female |
| Production | 69 (100.0%) | 0 (0.0%) |
| Transportation | 0 (0.0%) | 0 (0.0%) |
| Material Moving | 0 (0.0%) | 0 (0.0%) |
| Total (Category) | 69 (100.0%) | 0 (0.0%) |
| Total (Overall) | 196 (40.7%) | 286 (59.3%) |
Employment Industries by Sex in Magnet Cove
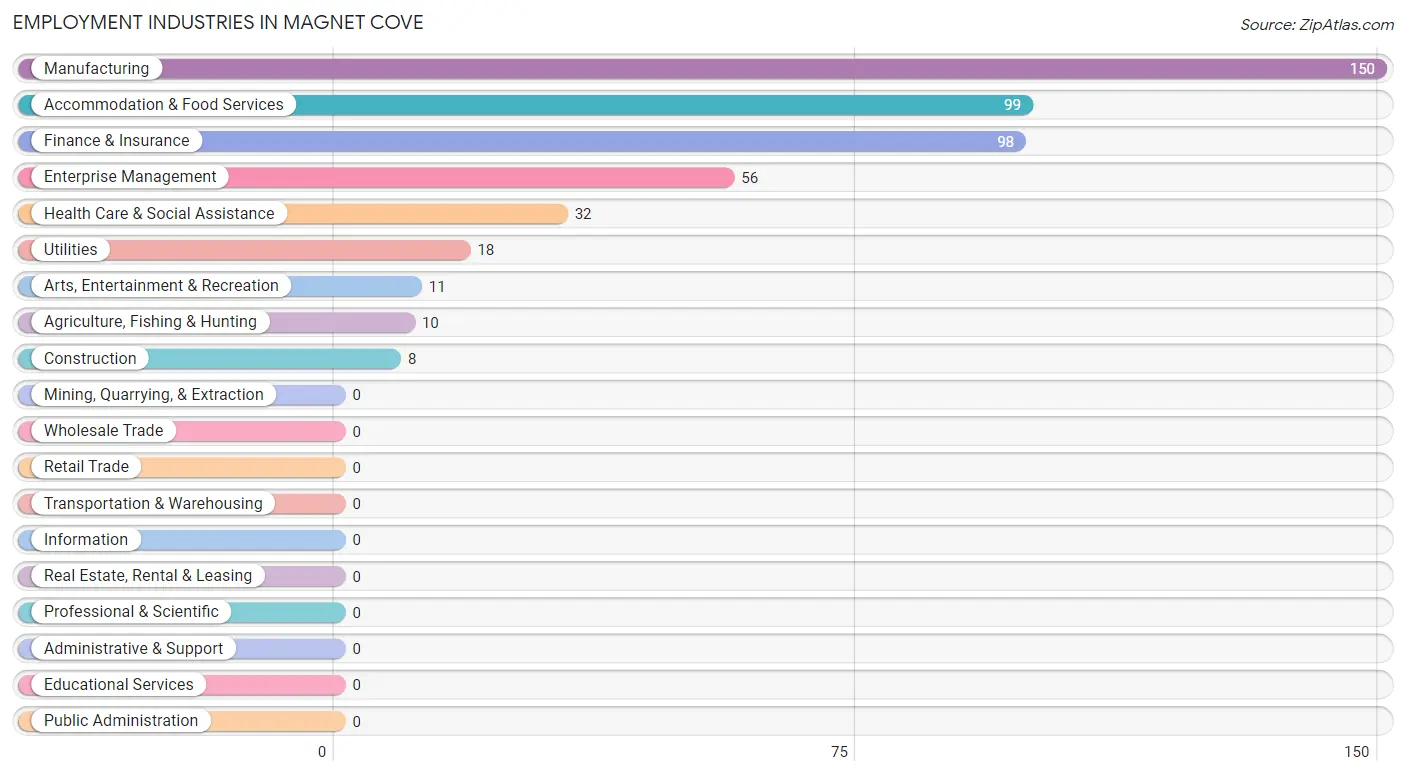
Employment Industries in Magnet Cove
The major employment industries in Magnet Cove include Manufacturing (150 | 31.1%), Accommodation & Food Services (99 | 20.5%), Finance & Insurance (98 | 20.3%), Enterprise Management (56 | 11.6%), and Health Care & Social Assistance (32 | 6.6%).
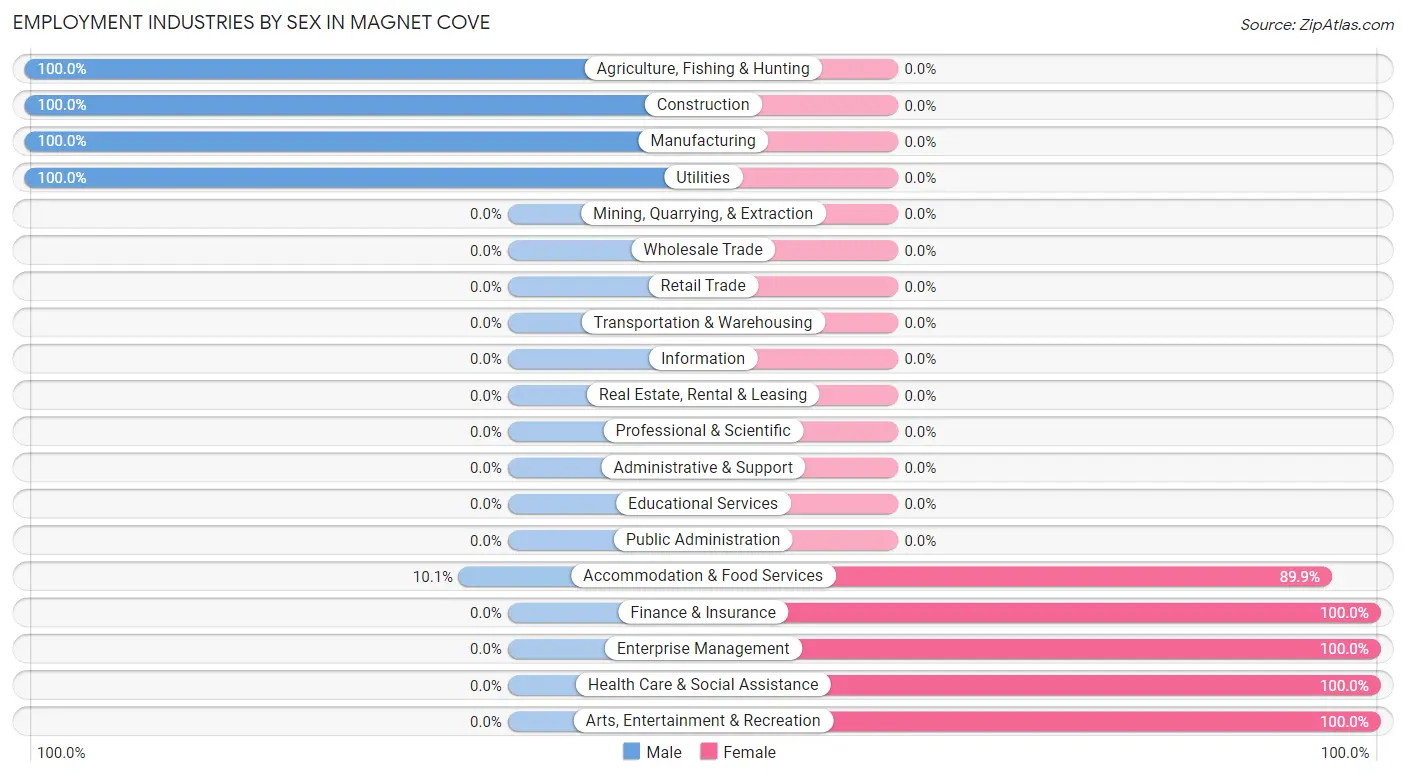
Employment Industries by Sex in Magnet Cove
The Magnet Cove industries that see more men than women are Agriculture, Fishing & Hunting (100.0%), Construction (100.0%), and Manufacturing (100.0%), whereas the industries that tend to have a higher number of women are Finance & Insurance (100.0%), Enterprise Management (100.0%), and Health Care & Social Assistance (100.0%).
| Industry | Male | Female |
| Agriculture, Fishing & Hunting | 10 (100.0%) | 0 (0.0%) |
| Mining, Quarrying, & Extraction | 0 (0.0%) | 0 (0.0%) |
| Construction | 8 (100.0%) | 0 (0.0%) |
| Manufacturing | 150 (100.0%) | 0 (0.0%) |
| Wholesale Trade | 0 (0.0%) | 0 (0.0%) |
| Retail Trade | 0 (0.0%) | 0 (0.0%) |
| Transportation & Warehousing | 0 (0.0%) | 0 (0.0%) |
| Utilities | 18 (100.0%) | 0 (0.0%) |
| Information | 0 (0.0%) | 0 (0.0%) |
| Finance & Insurance | 0 (0.0%) | 98 (100.0%) |
| Real Estate, Rental & Leasing | 0 (0.0%) | 0 (0.0%) |
| Professional & Scientific | 0 (0.0%) | 0 (0.0%) |
| Enterprise Management | 0 (0.0%) | 56 (100.0%) |
| Administrative & Support | 0 (0.0%) | 0 (0.0%) |
| Educational Services | 0 (0.0%) | 0 (0.0%) |
| Health Care & Social Assistance | 0 (0.0%) | 32 (100.0%) |
| Arts, Entertainment & Recreation | 0 (0.0%) | 11 (100.0%) |
| Accommodation & Food Services | 10 (10.1%) | 89 (89.9%) |
| Public Administration | 0 (0.0%) | 0 (0.0%) |
| Total | 196 (40.7%) | 286 (59.3%) |
Education in Magnet Cove
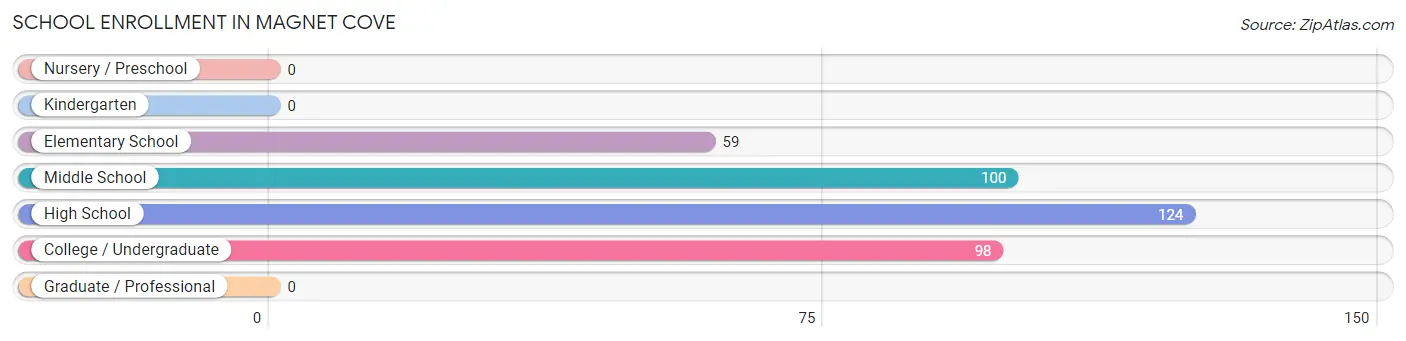
School Enrollment in Magnet Cove
The most common levels of schooling among the 381 students in Magnet Cove are high school (124 | 32.6%), middle school (100 | 26.3%), and college / undergraduate (98 | 25.7%).
| School Level | # Students | % Students |
| Nursery / Preschool | 0 | 0.0% |
| Kindergarten | 0 | 0.0% |
| Elementary School | 59 | 15.5% |
| Middle School | 100 | 26.3% |
| High School | 124 | 32.6% |
| College / Undergraduate | 98 | 25.7% |
| Graduate / Professional | 0 | 0.0% |
| Total | 381 | 100.0% |
School Enrollment by Age by Funding Source in Magnet Cove
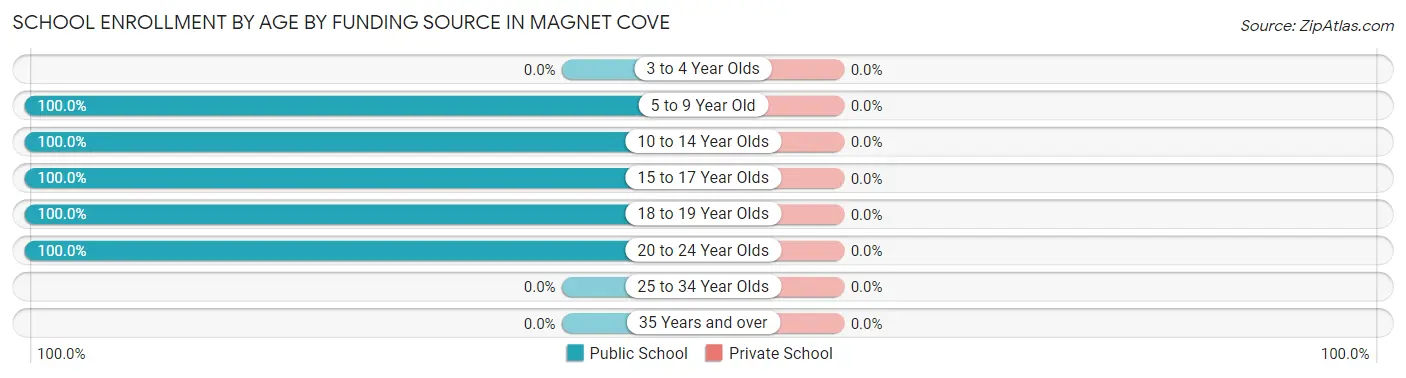
| Age Bracket | Public School | Private School |
| 3 to 4 Year Olds | 0 (0.0%) | 0 (0.0%) |
| 5 to 9 Year Old | 59 (100.0%) | 0 (0.0%) |
| 10 to 14 Year Olds | 100 (100.0%) | 0 (0.0%) |
| 15 to 17 Year Olds | 72 (100.0%) | 0 (0.0%) |
| 18 to 19 Year Olds | 52 (100.0%) | 0 (0.0%) |
| 20 to 24 Year Olds | 98 (100.0%) | 0 (0.0%) |
| 25 to 34 Year Olds | 0 (0.0%) | 0 (0.0%) |
| 35 Years and over | 0 (0.0%) | 0 (0.0%) |
| Total | 381 (100.0%) | 0 (0.0%) |
Educational Attainment by Field of Study in Magnet Cove
Physical & health sciences (23 | 23.7%), visual & performing arts (20 | 20.6%), psychology (15 | 15.5%), social sciences (15 | 15.5%), and arts & humanities (14 | 14.4%) are the most common fields of study among 97 individuals in Magnet Cove who have obtained a bachelor's degree or higher.
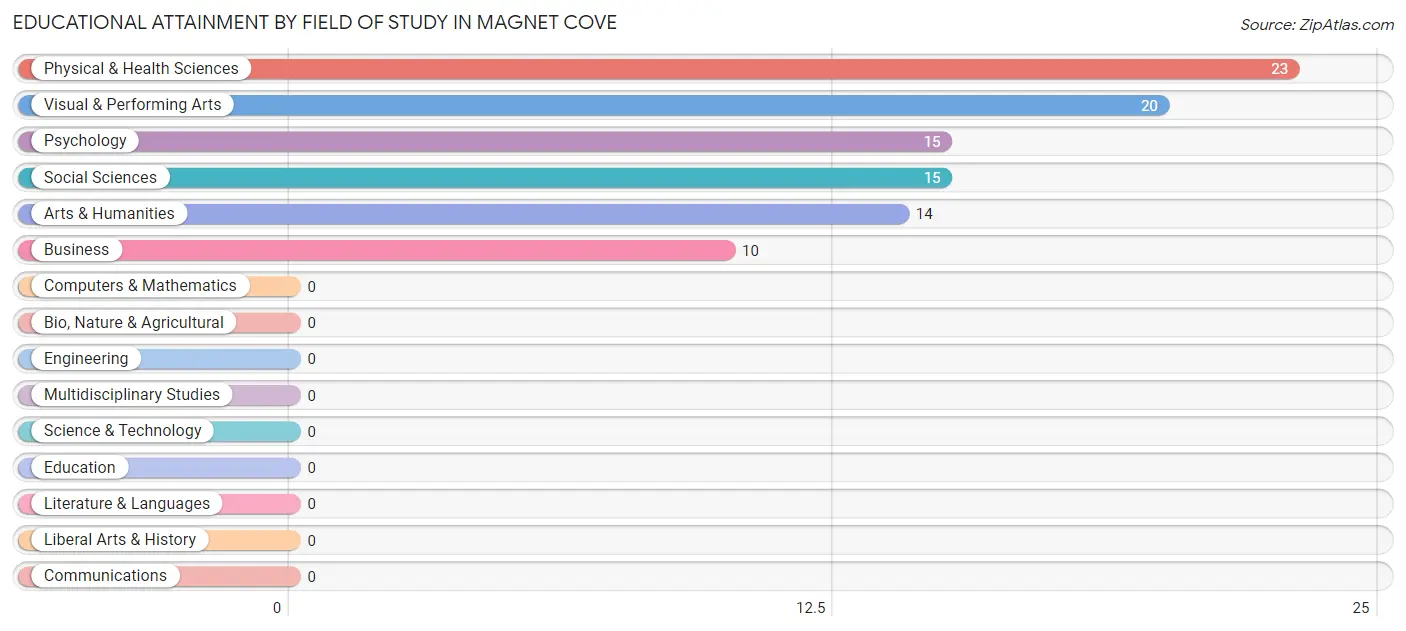
| Field of Study | # Graduates | % Graduates |
| Computers & Mathematics | 0 | 0.0% |
| Bio, Nature & Agricultural | 0 | 0.0% |
| Physical & Health Sciences | 23 | 23.7% |
| Psychology | 15 | 15.5% |
| Social Sciences | 15 | 15.5% |
| Engineering | 0 | 0.0% |
| Multidisciplinary Studies | 0 | 0.0% |
| Science & Technology | 0 | 0.0% |
| Business | 10 | 10.3% |
| Education | 0 | 0.0% |
| Literature & Languages | 0 | 0.0% |
| Liberal Arts & History | 0 | 0.0% |
| Visual & Performing Arts | 20 | 20.6% |
| Communications | 0 | 0.0% |
| Arts & Humanities | 14 | 14.4% |
| Total | 97 | 100.0% |
Transportation & Commute in Magnet Cove
Vehicle Availability by Sex in Magnet Cove
The most prevalent vehicle ownership categories in Magnet Cove are males with 3 vehicles (154, accounting for 78.6%) and females with 3 vehicles (257, making up 53.8%).
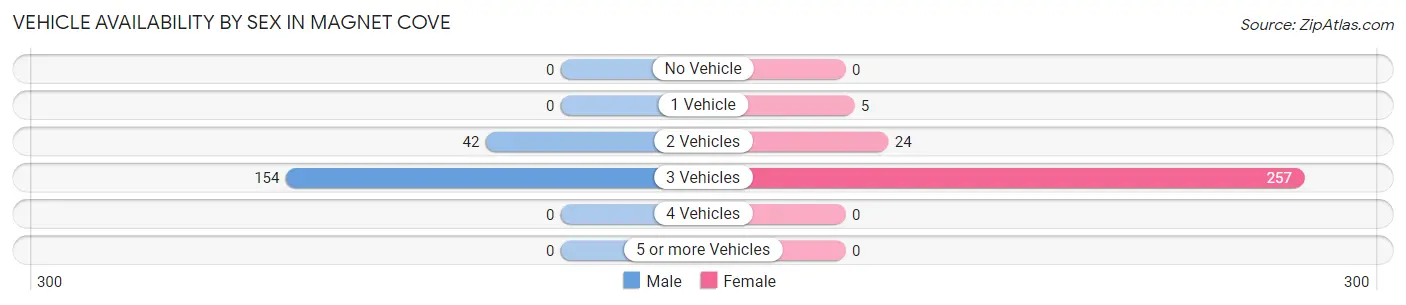
| Vehicles Available | Male | Female |
| No Vehicle | 0 (0.0%) | 0 (0.0%) |
| 1 Vehicle | 0 (0.0%) | 5 (1.8%) |
| 2 Vehicles | 42 (21.4%) | 24 (8.4%) |
| 3 Vehicles | 154 (78.6%) | 257 (89.9%) |
| 4 Vehicles | 0 (0.0%) | 0 (0.0%) |
| 5 or more Vehicles | 0 (0.0%) | 0 (0.0%) |
| Total | 196 (100.0%) | 286 (100.0%) |
Commute Time in Magnet Cove
The most frequently occuring commute durations in Magnet Cove are 45 to 59 minutes (166 commuters, 39.0%), 15 to 19 minutes (106 commuters, 24.9%), and 10 to 14 minutes (90 commuters, 21.1%).
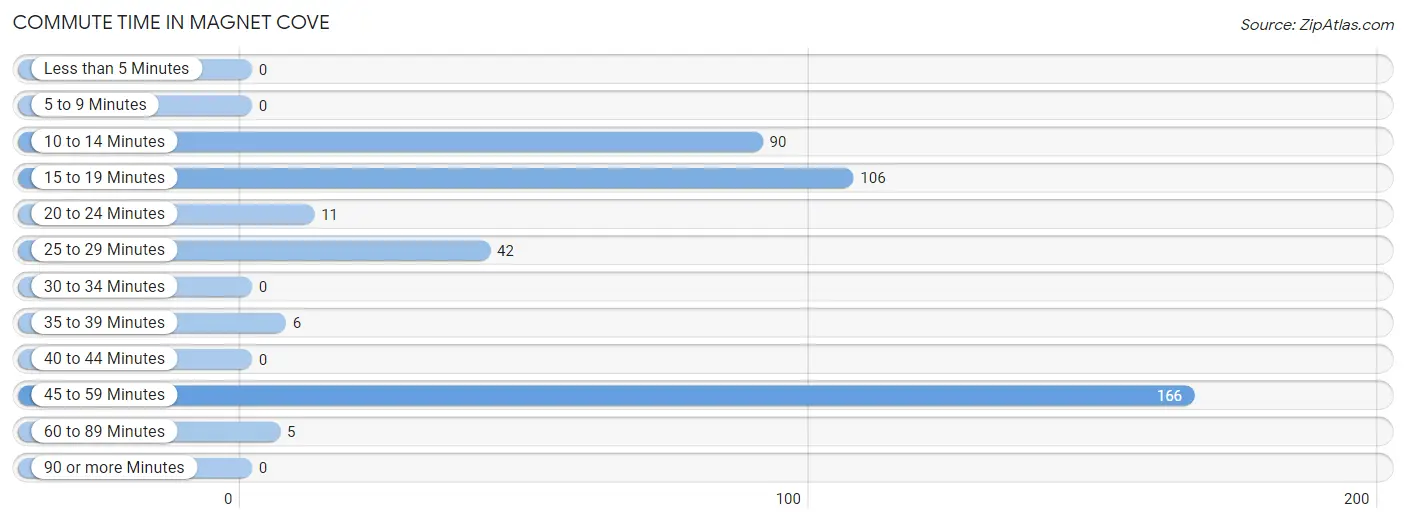
| Commute Time | # Commuters | % Commuters |
| Less than 5 Minutes | 0 | 0.0% |
| 5 to 9 Minutes | 0 | 0.0% |
| 10 to 14 Minutes | 90 | 21.1% |
| 15 to 19 Minutes | 106 | 24.9% |
| 20 to 24 Minutes | 11 | 2.6% |
| 25 to 29 Minutes | 42 | 9.9% |
| 30 to 34 Minutes | 0 | 0.0% |
| 35 to 39 Minutes | 6 | 1.4% |
| 40 to 44 Minutes | 0 | 0.0% |
| 45 to 59 Minutes | 166 | 39.0% |
| 60 to 89 Minutes | 5 | 1.2% |
| 90 or more Minutes | 0 | 0.0% |
Commute Time by Sex in Magnet Cove
The most common commute times in Magnet Cove are 45 to 59 minutes (133 commuters, 67.9%) for males and 15 to 19 minutes (98 commuters, 42.6%) for females.
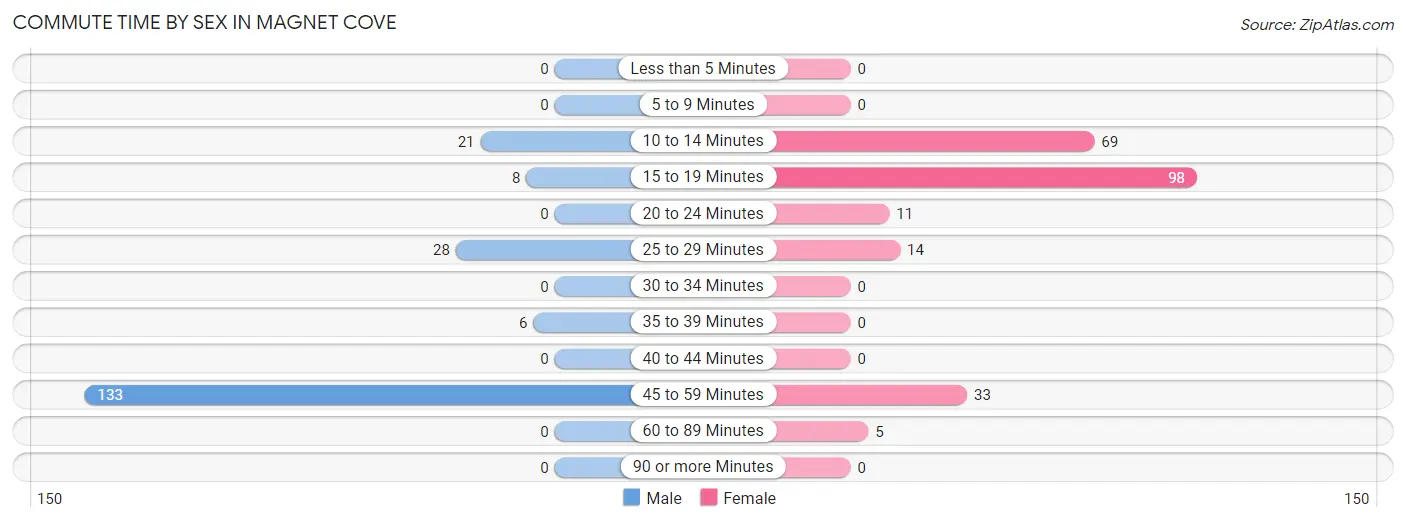
| Commute Time | Male | Female |
| Less than 5 Minutes | 0 (0.0%) | 0 (0.0%) |
| 5 to 9 Minutes | 0 (0.0%) | 0 (0.0%) |
| 10 to 14 Minutes | 21 (10.7%) | 69 (30.0%) |
| 15 to 19 Minutes | 8 (4.1%) | 98 (42.6%) |
| 20 to 24 Minutes | 0 (0.0%) | 11 (4.8%) |
| 25 to 29 Minutes | 28 (14.3%) | 14 (6.1%) |
| 30 to 34 Minutes | 0 (0.0%) | 0 (0.0%) |
| 35 to 39 Minutes | 6 (3.1%) | 0 (0.0%) |
| 40 to 44 Minutes | 0 (0.0%) | 0 (0.0%) |
| 45 to 59 Minutes | 133 (67.9%) | 33 (14.3%) |
| 60 to 89 Minutes | 0 (0.0%) | 5 (2.2%) |
| 90 or more Minutes | 0 (0.0%) | 0 (0.0%) |
Time of Departure to Work by Sex in Magnet Cove
The most frequent times of departure to work in Magnet Cove are 6:00 AM to 6:29 AM (85, 43.4%) for males and 8:00 AM to 8:29 AM (131, 57.0%) for females.
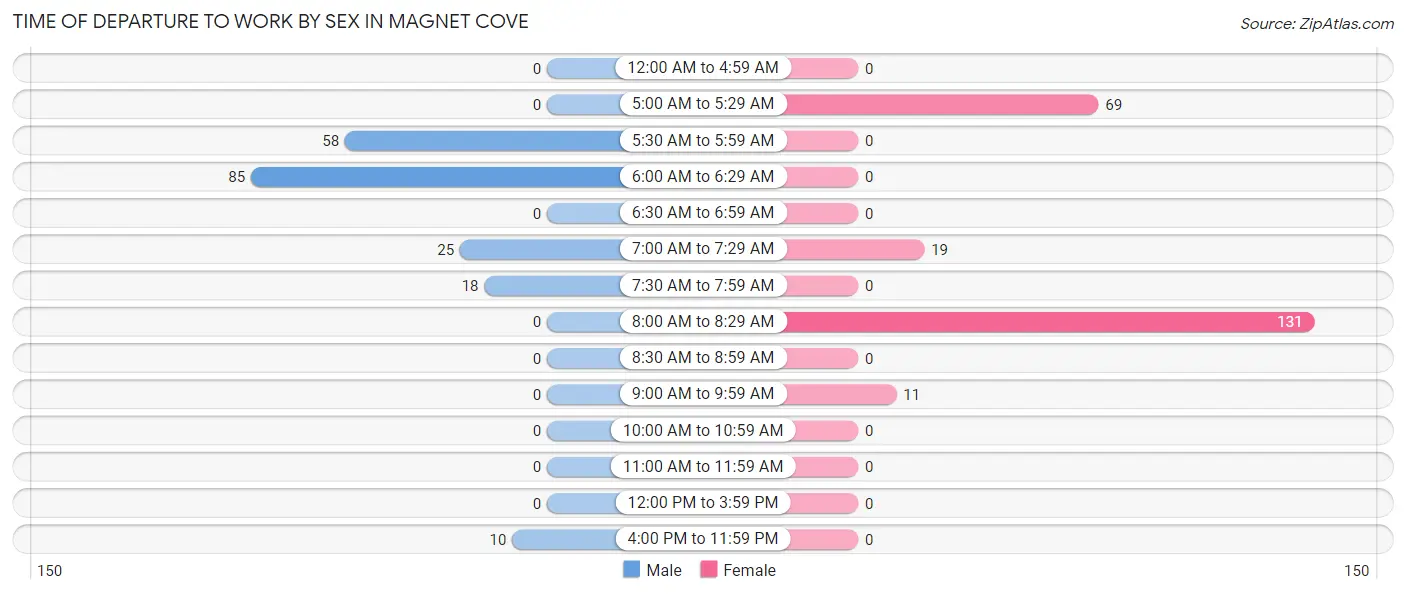
| Time of Departure | Male | Female |
| 12:00 AM to 4:59 AM | 0 (0.0%) | 0 (0.0%) |
| 5:00 AM to 5:29 AM | 0 (0.0%) | 69 (30.0%) |
| 5:30 AM to 5:59 AM | 58 (29.6%) | 0 (0.0%) |
| 6:00 AM to 6:29 AM | 85 (43.4%) | 0 (0.0%) |
| 6:30 AM to 6:59 AM | 0 (0.0%) | 0 (0.0%) |
| 7:00 AM to 7:29 AM | 25 (12.8%) | 19 (8.3%) |
| 7:30 AM to 7:59 AM | 18 (9.2%) | 0 (0.0%) |
| 8:00 AM to 8:29 AM | 0 (0.0%) | 131 (57.0%) |
| 8:30 AM to 8:59 AM | 0 (0.0%) | 0 (0.0%) |
| 9:00 AM to 9:59 AM | 0 (0.0%) | 11 (4.8%) |
| 10:00 AM to 10:59 AM | 0 (0.0%) | 0 (0.0%) |
| 11:00 AM to 11:59 AM | 0 (0.0%) | 0 (0.0%) |
| 12:00 PM to 3:59 PM | 0 (0.0%) | 0 (0.0%) |
| 4:00 PM to 11:59 PM | 10 (5.1%) | 0 (0.0%) |
| Total | 196 (100.0%) | 230 (100.0%) |
Housing Occupancy in Magnet Cove
Occupancy by Ownership in Magnet Cove
Of the total 315 dwellings in Magnet Cove, owner-occupied units account for 235 (74.6%), while renter-occupied units make up 80 (25.4%).
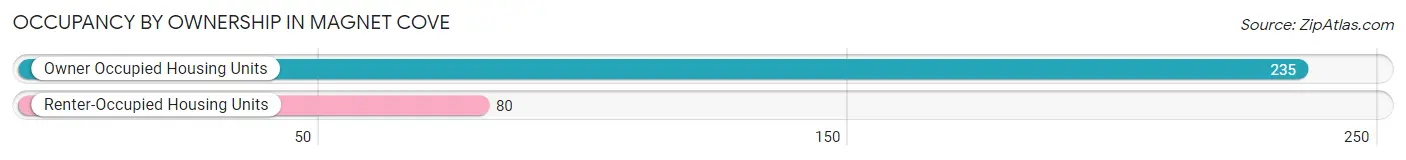
| Occupancy | # Housing Units | % Housing Units |
| Owner Occupied Housing Units | 235 | 74.6% |
| Renter-Occupied Housing Units | 80 | 25.4% |
| Total Occupied Housing Units | 315 | 100.0% |
Occupancy by Household Size in Magnet Cove
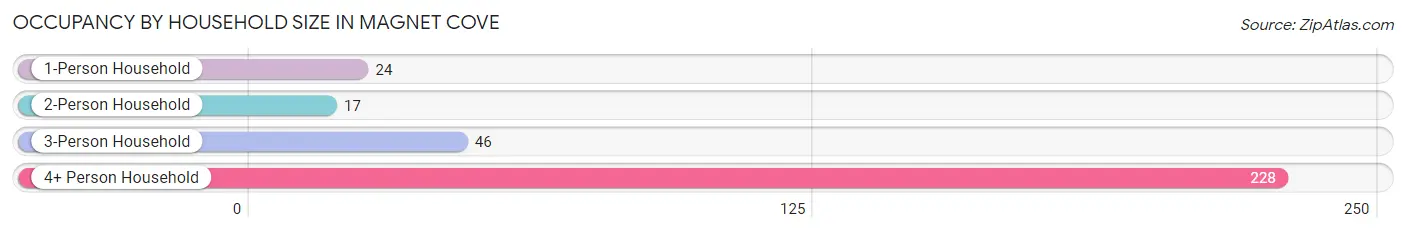
| Household Size | # Housing Units | % Housing Units |
| 1-Person Household | 24 | 7.6% |
| 2-Person Household | 17 | 5.4% |
| 3-Person Household | 46 | 14.6% |
| 4+ Person Household | 228 | 72.4% |
| Total Housing Units | 315 | 100.0% |
Occupancy by Ownership by Household Size in Magnet Cove
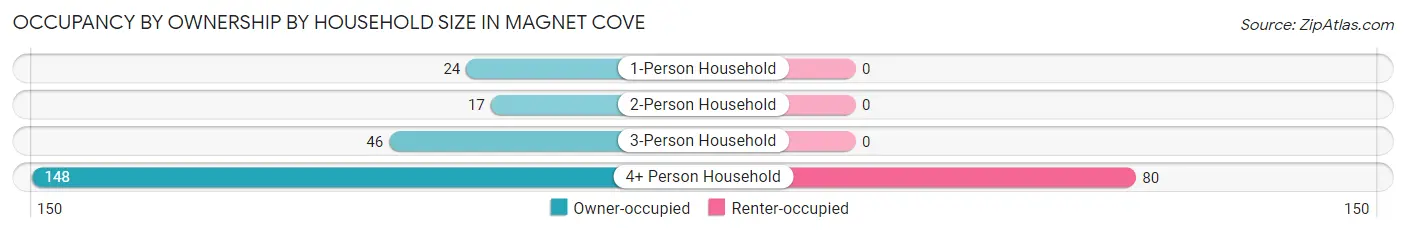
| Household Size | Owner-occupied | Renter-occupied |
| 1-Person Household | 24 (100.0%) | 0 (0.0%) |
| 2-Person Household | 17 (100.0%) | 0 (0.0%) |
| 3-Person Household | 46 (100.0%) | 0 (0.0%) |
| 4+ Person Household | 148 (64.9%) | 80 (35.1%) |
| Total Housing Units | 235 (74.6%) | 80 (25.4%) |
Occupancy by Educational Attainment in Magnet Cove
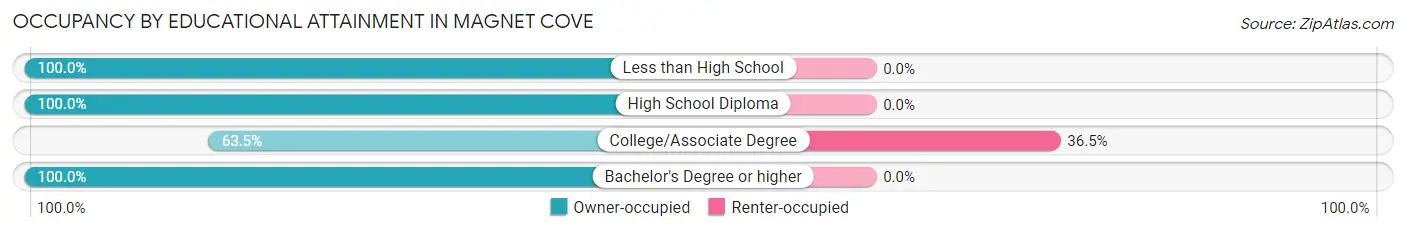
| Household Size | Owner-occupied | Renter-occupied |
| Less than High School | 11 (100.0%) | 0 (0.0%) |
| High School Diploma | 38 (100.0%) | 0 (0.0%) |
| College/Associate Degree | 139 (63.5%) | 80 (36.5%) |
| Bachelor's Degree or higher | 47 (100.0%) | 0 (0.0%) |
Occupancy by Age of Householder in Magnet Cove
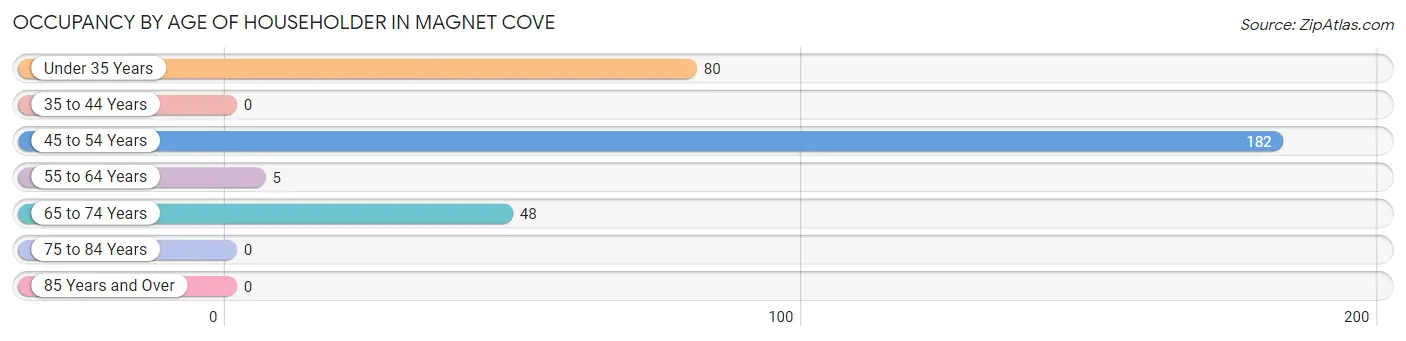
| Age Bracket | # Households | % Households |
| Under 35 Years | 80 | 25.4% |
| 35 to 44 Years | 0 | 0.0% |
| 45 to 54 Years | 182 | 57.8% |
| 55 to 64 Years | 5 | 1.6% |
| 65 to 74 Years | 48 | 15.2% |
| 75 to 84 Years | 0 | 0.0% |
| 85 Years and Over | 0 | 0.0% |
| Total | 315 | 100.0% |
Housing Finances in Magnet Cove
Median Income by Occupancy in Magnet Cove
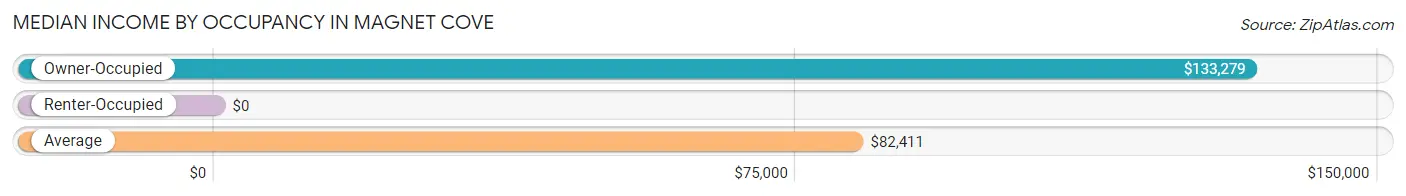
| Occupancy Type | # Households | Median Income |
| Owner-Occupied | 235 (74.6%) | $133,279 |
| Renter-Occupied | 80 (25.4%) | $0 |
| Average | 315 (100.0%) | $82,411 |
Occupancy by Householder Income Bracket in Magnet Cove
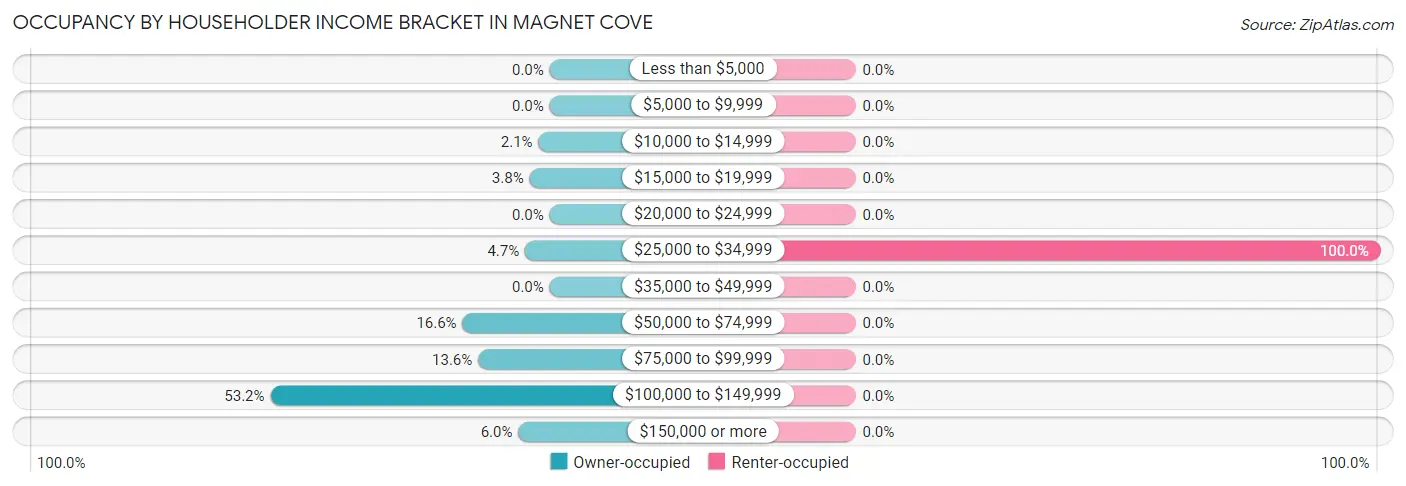
| Income Bracket | Owner-occupied | Renter-occupied |
| Less than $5,000 | 0 (0.0%) | 0 (0.0%) |
| $5,000 to $9,999 | 0 (0.0%) | 0 (0.0%) |
| $10,000 to $14,999 | 5 (2.1%) | 0 (0.0%) |
| $15,000 to $19,999 | 9 (3.8%) | 0 (0.0%) |
| $20,000 to $24,999 | 0 (0.0%) | 0 (0.0%) |
| $25,000 to $34,999 | 11 (4.7%) | 80 (100.0%) |
| $35,000 to $49,999 | 0 (0.0%) | 0 (0.0%) |
| $50,000 to $74,999 | 39 (16.6%) | 0 (0.0%) |
| $75,000 to $99,999 | 32 (13.6%) | 0 (0.0%) |
| $100,000 to $149,999 | 125 (53.2%) | 0 (0.0%) |
| $150,000 or more | 14 (6.0%) | 0 (0.0%) |
| Total | 235 (100.0%) | 80 (100.0%) |
Monthly Housing Cost Tiers in Magnet Cove
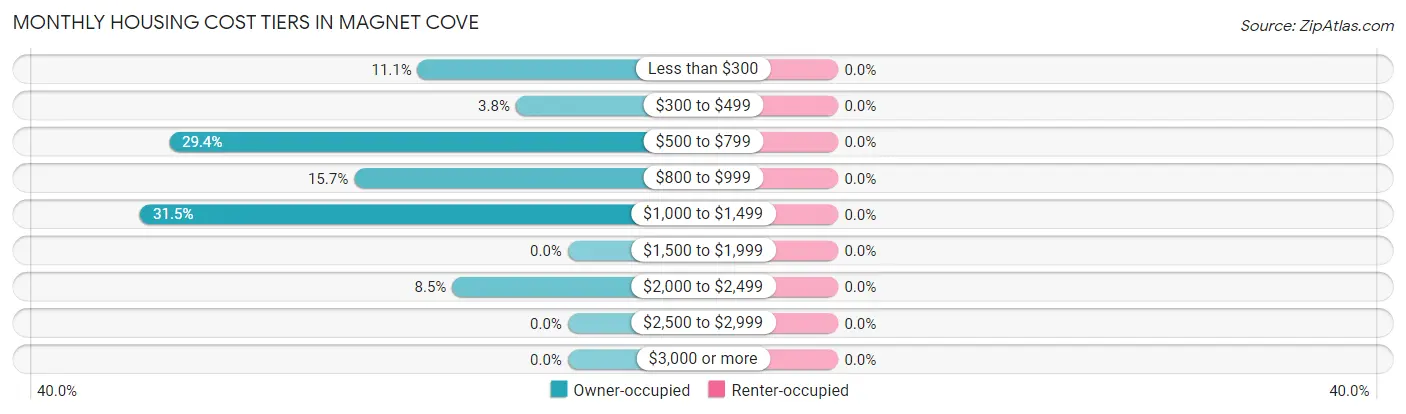
| Monthly Cost | Owner-occupied | Renter-occupied |
| Less than $300 | 26 (11.1%) | 0 (0.0%) |
| $300 to $499 | 9 (3.8%) | 0 (0.0%) |
| $500 to $799 | 69 (29.4%) | 0 (0.0%) |
| $800 to $999 | 37 (15.7%) | 0 (0.0%) |
| $1,000 to $1,499 | 74 (31.5%) | 0 (0.0%) |
| $1,500 to $1,999 | 0 (0.0%) | 0 (0.0%) |
| $2,000 to $2,499 | 20 (8.5%) | 0 (0.0%) |
| $2,500 to $2,999 | 0 (0.0%) | 0 (0.0%) |
| $3,000 or more | 0 (0.0%) | 0 (0.0%) |
| Total | 235 (100.0%) | 80 (100.0%) |
Physical Housing Characteristics in Magnet Cove
Housing Structures in Magnet Cove
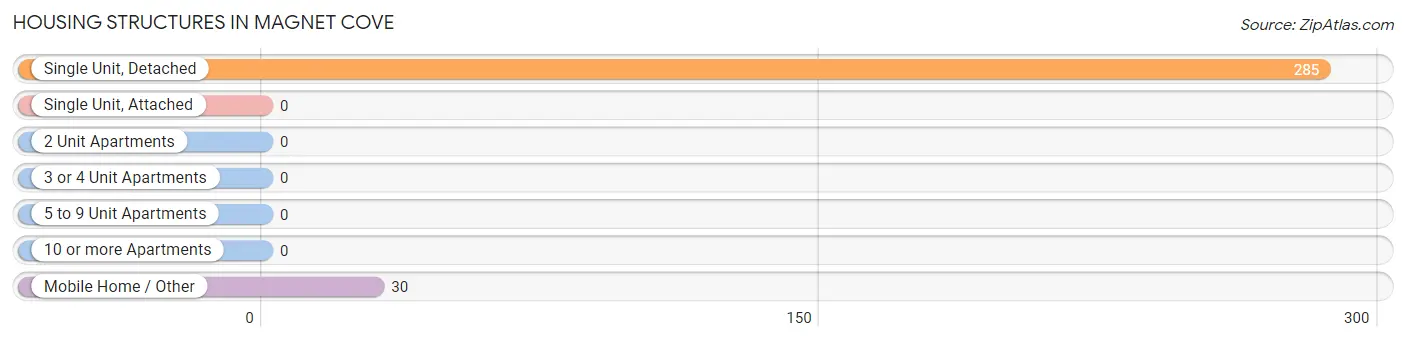
| Structure Type | # Housing Units | % Housing Units |
| Single Unit, Detached | 285 | 90.5% |
| Single Unit, Attached | 0 | 0.0% |
| 2 Unit Apartments | 0 | 0.0% |
| 3 or 4 Unit Apartments | 0 | 0.0% |
| 5 to 9 Unit Apartments | 0 | 0.0% |
| 10 or more Apartments | 0 | 0.0% |
| Mobile Home / Other | 30 | 9.5% |
| Total | 315 | 100.0% |
Housing Structures by Occupancy in Magnet Cove
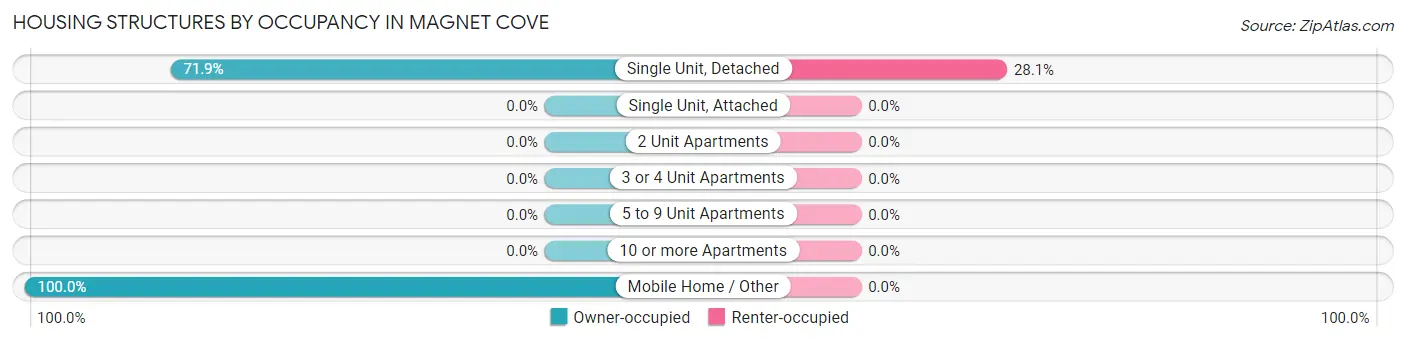
| Structure Type | Owner-occupied | Renter-occupied |
| Single Unit, Detached | 205 (71.9%) | 80 (28.1%) |
| Single Unit, Attached | 0 (0.0%) | 0 (0.0%) |
| 2 Unit Apartments | 0 (0.0%) | 0 (0.0%) |
| 3 or 4 Unit Apartments | 0 (0.0%) | 0 (0.0%) |
| 5 to 9 Unit Apartments | 0 (0.0%) | 0 (0.0%) |
| 10 or more Apartments | 0 (0.0%) | 0 (0.0%) |
| Mobile Home / Other | 30 (100.0%) | 0 (0.0%) |
| Total | 235 (74.6%) | 80 (25.4%) |
Housing Structures by Number of Rooms in Magnet Cove
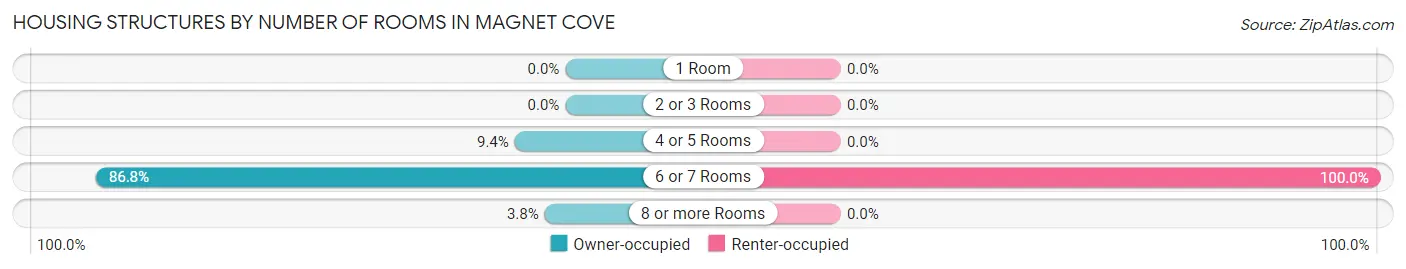
| Number of Rooms | Owner-occupied | Renter-occupied |
| 1 Room | 0 (0.0%) | 0 (0.0%) |
| 2 or 3 Rooms | 0 (0.0%) | 0 (0.0%) |
| 4 or 5 Rooms | 22 (9.4%) | 0 (0.0%) |
| 6 or 7 Rooms | 204 (86.8%) | 80 (100.0%) |
| 8 or more Rooms | 9 (3.8%) | 0 (0.0%) |
| Total | 235 (100.0%) | 80 (100.0%) |
Housing Structure by Heating Type in Magnet Cove
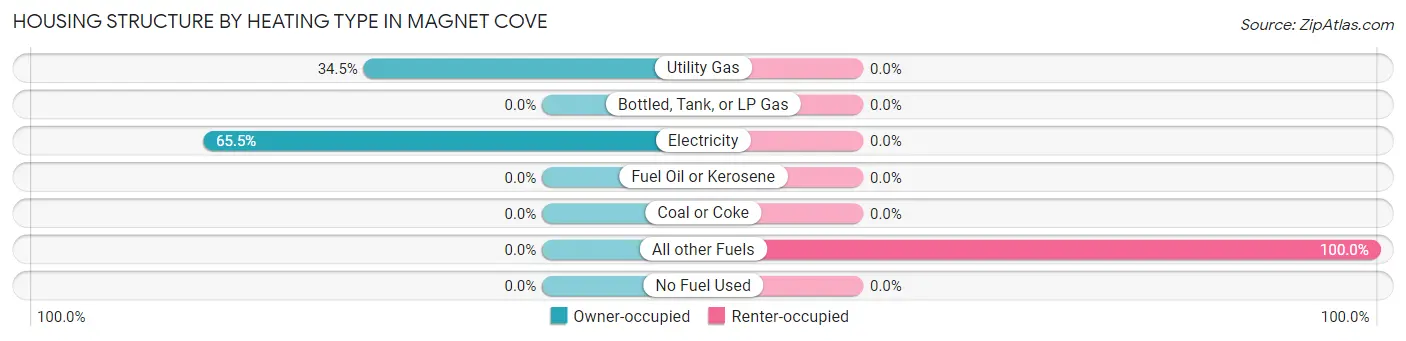
| Heating Type | Owner-occupied | Renter-occupied |
| Utility Gas | 81 (34.5%) | 0 (0.0%) |
| Bottled, Tank, or LP Gas | 0 (0.0%) | 0 (0.0%) |
| Electricity | 154 (65.5%) | 0 (0.0%) |
| Fuel Oil or Kerosene | 0 (0.0%) | 0 (0.0%) |
| Coal or Coke | 0 (0.0%) | 0 (0.0%) |
| All other Fuels | 0 (0.0%) | 80 (100.0%) |
| No Fuel Used | 0 (0.0%) | 0 (0.0%) |
| Total | 235 (100.0%) | 80 (100.0%) |
Household Vehicle Usage in Magnet Cove
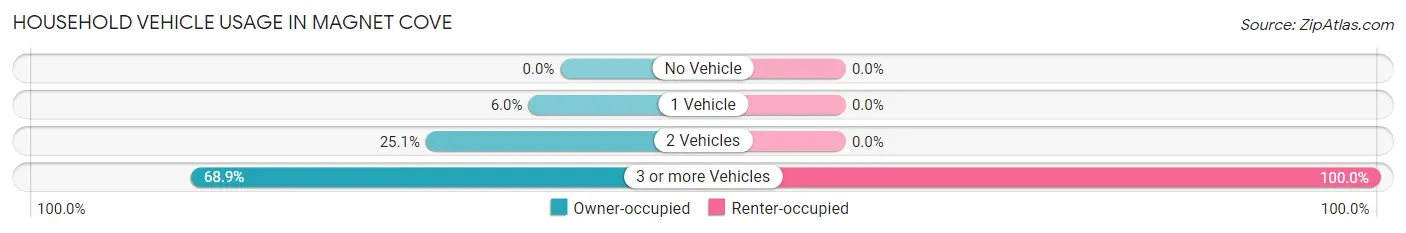
| Vehicles per Household | Owner-occupied | Renter-occupied |
| No Vehicle | 0 (0.0%) | 0 (0.0%) |
| 1 Vehicle | 14 (6.0%) | 0 (0.0%) |
| 2 Vehicles | 59 (25.1%) | 0 (0.0%) |
| 3 or more Vehicles | 162 (68.9%) | 80 (100.0%) |
| Total | 235 (100.0%) | 80 (100.0%) |
Real Estate & Mortgages in Magnet Cove
Real Estate and Mortgage Overview in Magnet Cove
| Characteristic | Without Mortgage | With Mortgage |
| Housing Units | 35 | 200 |
| Median Property Value | - | - |
| Median Household Income | $30,795 | $14 |
| Monthly Housing Costs | $222 | $0 |
| Real Estate Taxes | $474 | $0 |
Property Value by Mortgage Status in Magnet Cove
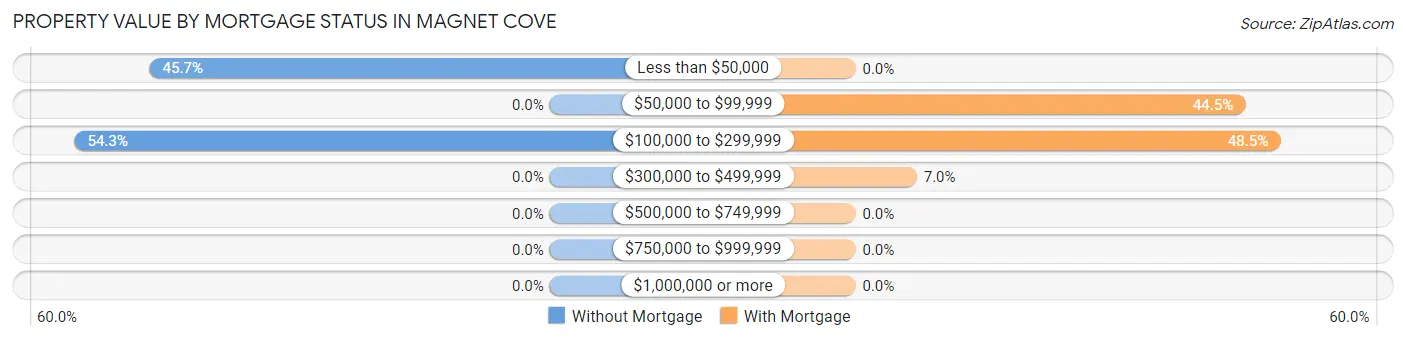
| Property Value | Without Mortgage | With Mortgage |
| Less than $50,000 | 16 (45.7%) | 0 (0.0%) |
| $50,000 to $99,999 | 0 (0.0%) | 89 (44.5%) |
| $100,000 to $299,999 | 19 (54.3%) | 97 (48.5%) |
| $300,000 to $499,999 | 0 (0.0%) | 14 (7.0%) |
| $500,000 to $749,999 | 0 (0.0%) | 0 (0.0%) |
| $750,000 to $999,999 | 0 (0.0%) | 0 (0.0%) |
| $1,000,000 or more | 0 (0.0%) | 0 (0.0%) |
| Total | 35 (100.0%) | 200 (100.0%) |
Household Income by Mortgage Status in Magnet Cove
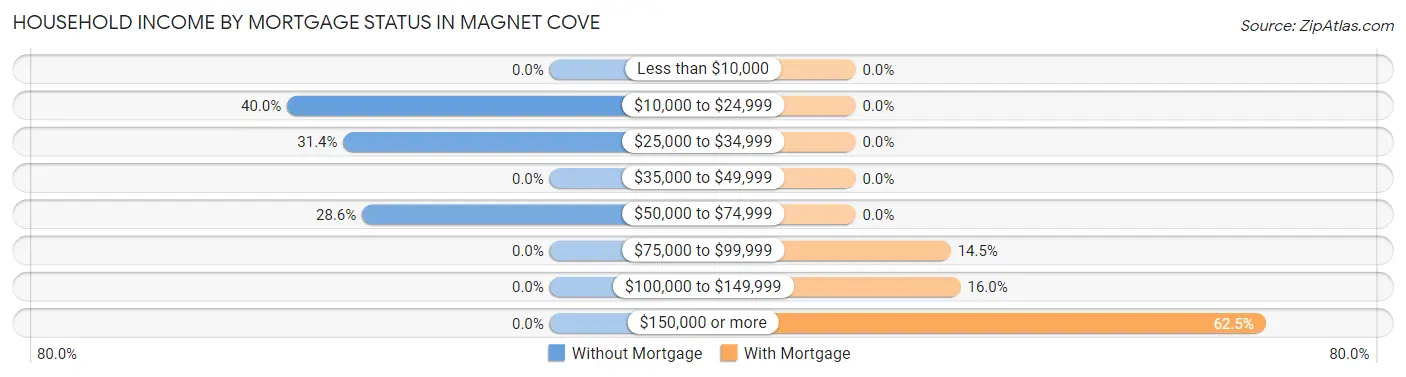
| Household Income | Without Mortgage | With Mortgage |
| Less than $10,000 | 0 (0.0%) | 0 (0.0%) |
| $10,000 to $24,999 | 14 (40.0%) | 0 (0.0%) |
| $25,000 to $34,999 | 11 (31.4%) | 0 (0.0%) |
| $35,000 to $49,999 | 0 (0.0%) | 0 (0.0%) |
| $50,000 to $74,999 | 10 (28.6%) | 0 (0.0%) |
| $75,000 to $99,999 | 0 (0.0%) | 29 (14.5%) |
| $100,000 to $149,999 | 0 (0.0%) | 32 (16.0%) |
| $150,000 or more | 0 (0.0%) | 125 (62.5%) |
| Total | 35 (100.0%) | 200 (100.0%) |
Property Value to Household Income Ratio in Magnet Cove
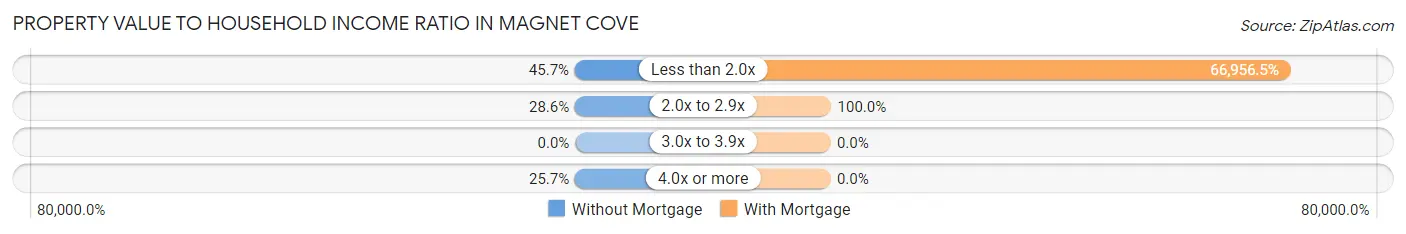
| Value-to-Income Ratio | Without Mortgage | With Mortgage |
| Less than 2.0x | 16 (45.7%) | 133,913 (66,956.5%) |
| 2.0x to 2.9x | 10 (28.6%) | 200 (100.0%) |
| 3.0x to 3.9x | 0 (0.0%) | 0 (0.0%) |
| 4.0x or more | 9 (25.7%) | 0 (0.0%) |
| Total | 35 (100.0%) | 200 (100.0%) |
Real Estate Taxes by Mortgage Status in Magnet Cove
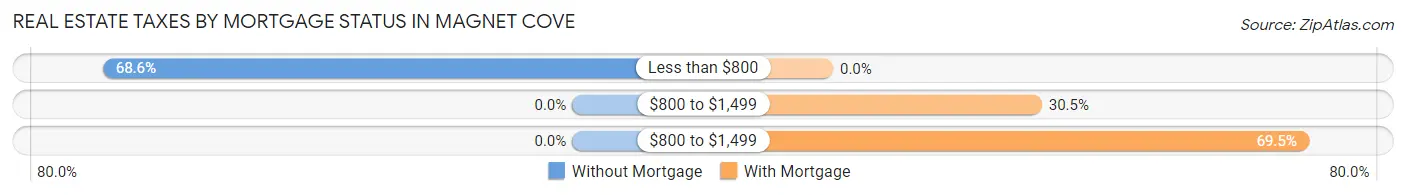
| Property Taxes | Without Mortgage | With Mortgage |
| Less than $800 | 24 (68.6%) | 0 (0.0%) |
| $800 to $1,499 | 0 (0.0%) | 61 (30.5%) |
| $800 to $1,499 | 0 (0.0%) | 139 (69.5%) |
| Total | 35 (100.0%) | 200 (100.0%) |
Health & Disability in Magnet Cove
Health Insurance Coverage by Age in Magnet Cove
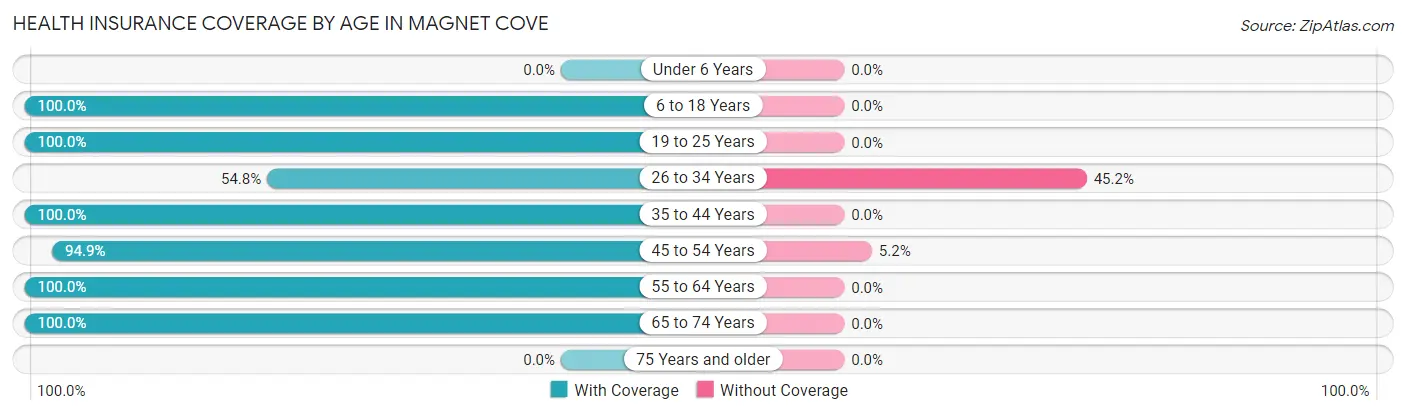
| Age Bracket | With Coverage | Without Coverage |
| Under 6 Years | 0 (0.0%) | 0 (0.0%) |
| 6 to 18 Years | 283 (100.0%) | 0 (0.0%) |
| 19 to 25 Years | 301 (100.0%) | 0 (0.0%) |
| 26 to 34 Years | 80 (54.8%) | 66 (45.2%) |
| 35 to 44 Years | 57 (100.0%) | 0 (0.0%) |
| 45 to 54 Years | 313 (94.9%) | 17 (5.1%) |
| 55 to 64 Years | 25 (100.0%) | 0 (0.0%) |
| 65 to 74 Years | 63 (100.0%) | 0 (0.0%) |
| 75 Years and older | 0 (0.0%) | 0 (0.0%) |
| Total | 1,122 (93.1%) | 83 (6.9%) |
Health Insurance Coverage by Citizenship Status in Magnet Cove
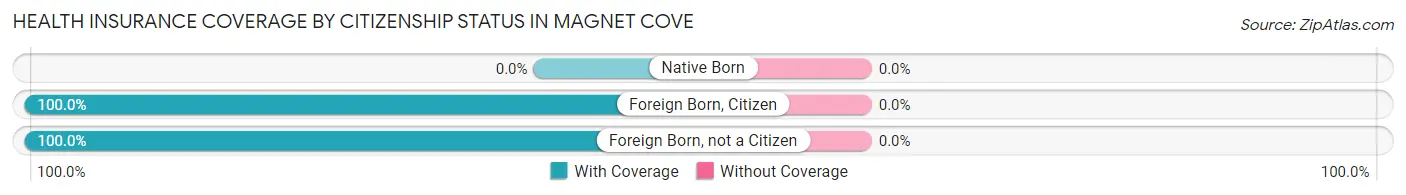
| Citizenship Status | With Coverage | Without Coverage |
| Native Born | 0 (0.0%) | 0 (0.0%) |
| Foreign Born, Citizen | 283 (100.0%) | 0 (0.0%) |
| Foreign Born, not a Citizen | 301 (100.0%) | 0 (0.0%) |
Health Insurance Coverage by Household Income in Magnet Cove
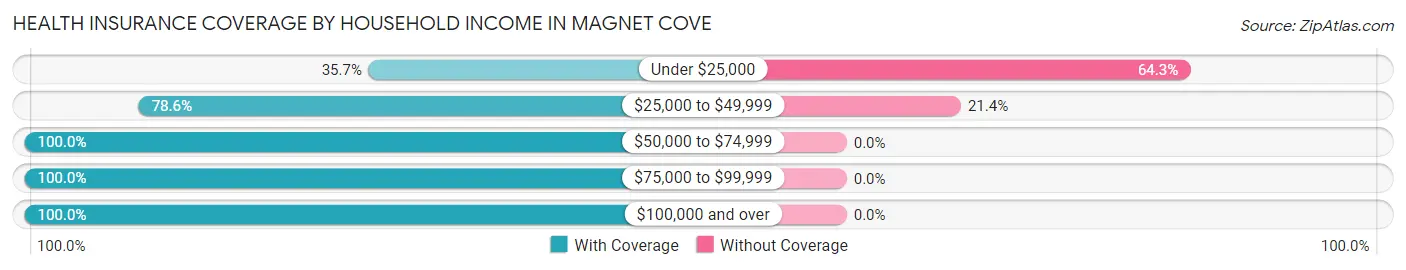
| Household Income | With Coverage | Without Coverage |
| Under $25,000 | 5 (35.7%) | 9 (64.3%) |
| $25,000 to $49,999 | 272 (78.6%) | 74 (21.4%) |
| $50,000 to $74,999 | 117 (100.0%) | 0 (0.0%) |
| $75,000 to $99,999 | 82 (100.0%) | 0 (0.0%) |
| $100,000 and over | 646 (100.0%) | 0 (0.0%) |
Public vs Private Health Insurance Coverage by Age in Magnet Cove
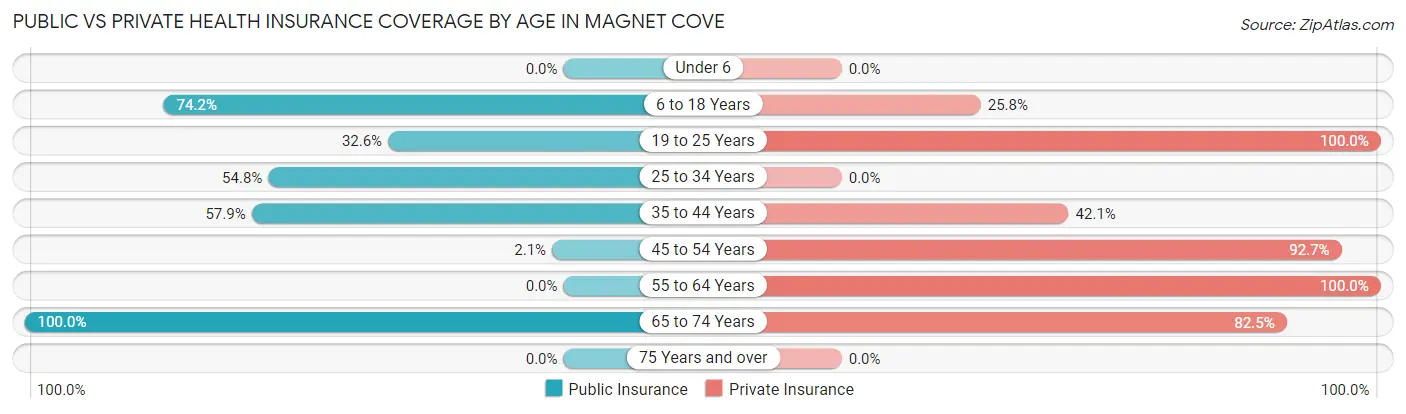
| Age Bracket | Public Insurance | Private Insurance |
| Under 6 | 0 (0.0%) | 0 (0.0%) |
| 6 to 18 Years | 210 (74.2%) | 73 (25.8%) |
| 19 to 25 Years | 98 (32.6%) | 301 (100.0%) |
| 25 to 34 Years | 80 (54.8%) | 0 (0.0%) |
| 35 to 44 Years | 33 (57.9%) | 24 (42.1%) |
| 45 to 54 Years | 7 (2.1%) | 306 (92.7%) |
| 55 to 64 Years | 0 (0.0%) | 25 (100.0%) |
| 65 to 74 Years | 63 (100.0%) | 52 (82.5%) |
| 75 Years and over | 0 (0.0%) | 0 (0.0%) |
| Total | 491 (40.7%) | 781 (64.8%) |
Disability Status by Sex by Age in Magnet Cove
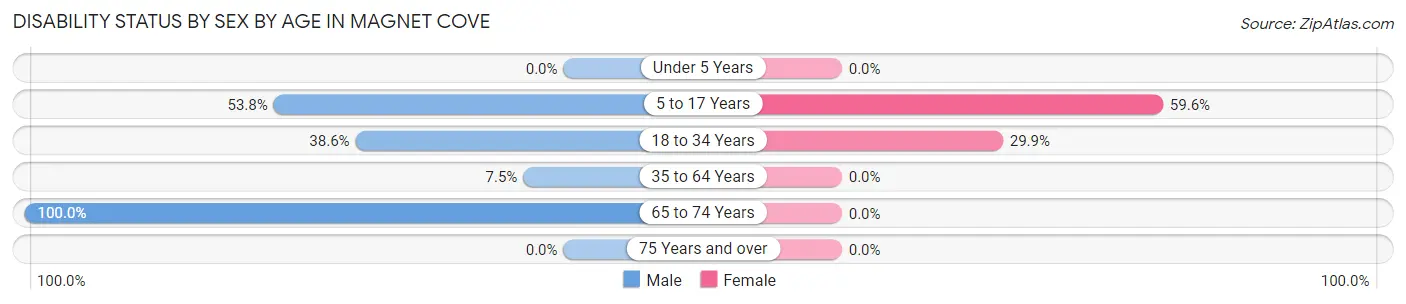
| Age Bracket | Male | Female |
| Under 5 Years | 0 (0.0%) | 0 (0.0%) |
| 5 to 17 Years | 71 (53.8%) | 59 (59.6%) |
| 18 to 34 Years | 66 (38.6%) | 98 (29.9%) |
| 35 to 64 Years | 17 (7.5%) | 0 (0.0%) |
| 65 to 74 Years | 37 (100.0%) | 0 (0.0%) |
| 75 Years and over | 0 (0.0%) | 0 (0.0%) |
Disability Class by Sex by Age in Magnet Cove
Disability Class: Hearing Difficulty
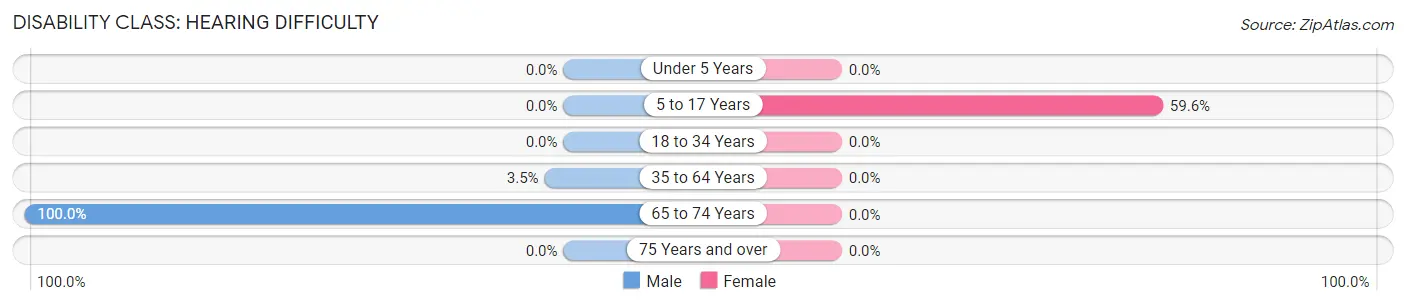
| Age Bracket | Male | Female |
| Under 5 Years | 0 (0.0%) | 0 (0.0%) |
| 5 to 17 Years | 0 (0.0%) | 59 (59.6%) |
| 18 to 34 Years | 0 (0.0%) | 0 (0.0%) |
| 35 to 64 Years | 8 (3.5%) | 0 (0.0%) |
| 65 to 74 Years | 37 (100.0%) | 0 (0.0%) |
| 75 Years and over | 0 (0.0%) | 0 (0.0%) |
Disability Class: Vision Difficulty
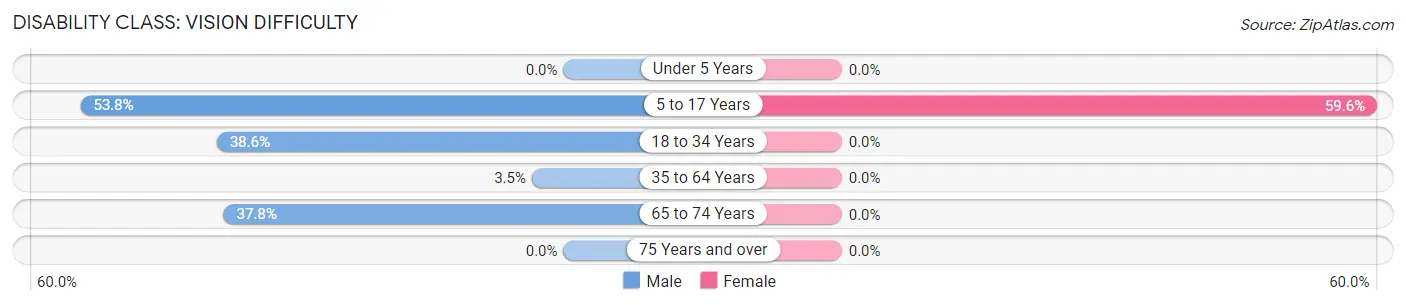
| Age Bracket | Male | Female |
| Under 5 Years | 0 (0.0%) | 0 (0.0%) |
| 5 to 17 Years | 71 (53.8%) | 59 (59.6%) |
| 18 to 34 Years | 66 (38.6%) | 0 (0.0%) |
| 35 to 64 Years | 8 (3.5%) | 0 (0.0%) |
| 65 to 74 Years | 14 (37.8%) | 0 (0.0%) |
| 75 Years and over | 0 (0.0%) | 0 (0.0%) |
Disability Class: Cognitive Difficulty

| Age Bracket | Male | Female |
| 5 to 17 Years | 0 (0.0%) | 59 (59.6%) |
| 18 to 34 Years | 0 (0.0%) | 98 (29.9%) |
| 35 to 64 Years | 9 (4.0%) | 0 (0.0%) |
| 65 to 74 Years | 0 (0.0%) | 0 (0.0%) |
| 75 Years and over | 0 (0.0%) | 0 (0.0%) |
Disability Class: Ambulatory Difficulty
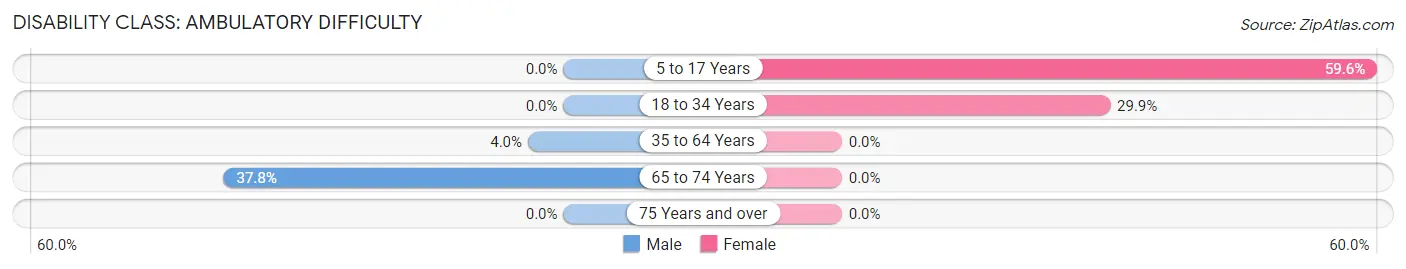
| Age Bracket | Male | Female |
| 5 to 17 Years | 0 (0.0%) | 59 (59.6%) |
| 18 to 34 Years | 0 (0.0%) | 98 (29.9%) |
| 35 to 64 Years | 9 (4.0%) | 0 (0.0%) |
| 65 to 74 Years | 14 (37.8%) | 0 (0.0%) |
| 75 Years and over | 0 (0.0%) | 0 (0.0%) |
Disability Class: Self-Care Difficulty
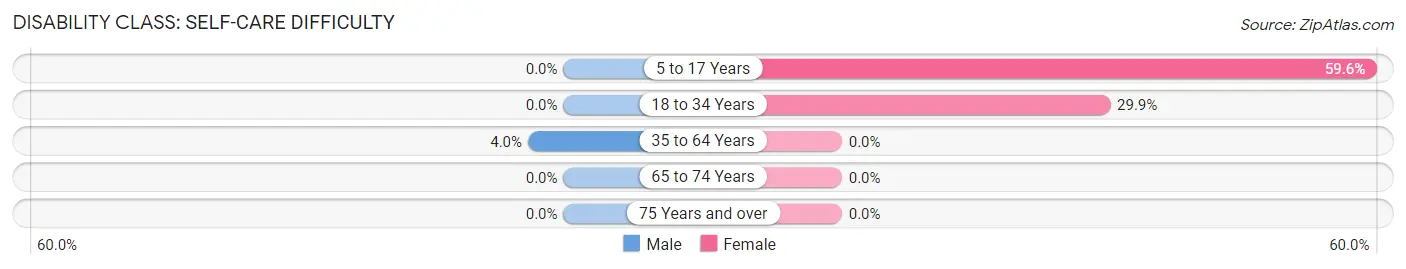
| Age Bracket | Male | Female |
| 5 to 17 Years | 0 (0.0%) | 59 (59.6%) |
| 18 to 34 Years | 0 (0.0%) | 98 (29.9%) |
| 35 to 64 Years | 9 (4.0%) | 0 (0.0%) |
| 65 to 74 Years | 0 (0.0%) | 0 (0.0%) |
| 75 Years and over | 0 (0.0%) | 0 (0.0%) |
Technology Access in Magnet Cove
Computing Device Access in Magnet Cove
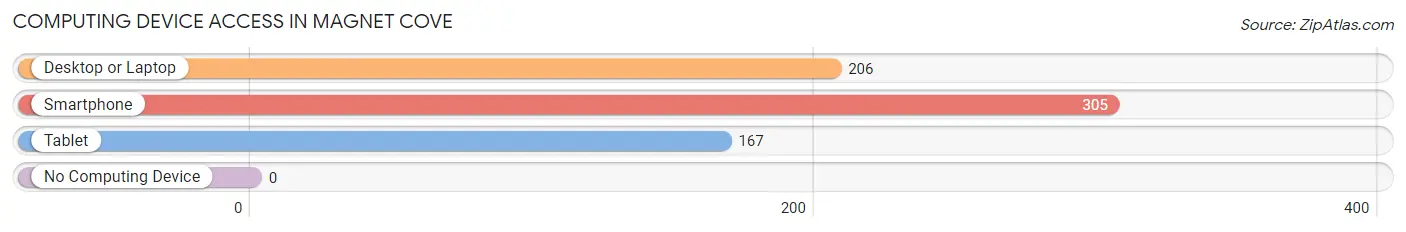
| Device Type | # Households | % Households |
| Desktop or Laptop | 206 | 65.4% |
| Smartphone | 305 | 96.8% |
| Tablet | 167 | 53.0% |
| No Computing Device | 0 | 0.0% |
| Total | 315 | 100.0% |
Internet Access in Magnet Cove
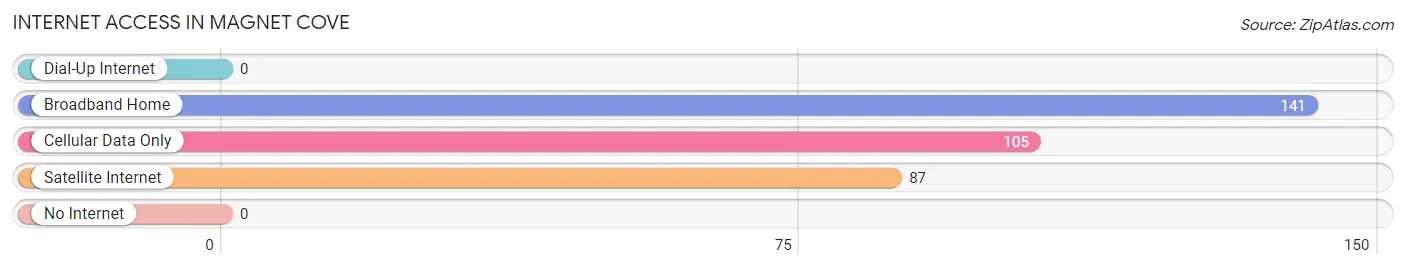
| Internet Type | # Households | % Households |
| Dial-Up Internet | 0 | 0.0% |
| Broadband Home | 141 | 44.8% |
| Cellular Data Only | 105 | 33.3% |
| Satellite Internet | 87 | 27.6% |
| No Internet | 0 | 0.0% |
| Total | 315 | 100.0% |
Magnet Cove Summary
Magnet Cove is a small unincorporated community located in Hot Spring County, Arkansas. It is situated in the Ouachita Mountains, approximately 20 miles northwest of Hot Springs. The town was founded in 1873 and is named after the magnetic ore deposits found in the area.
History
The area around Magnet Cove was first settled in the early 1800s by settlers from the nearby town of Hot Springs. The town was originally known as “Magnet Hill” and was home to a small mining operation. The ore deposits in the area were rich in iron, copper, and zinc, and the miners were able to extract these minerals from the ground.
In 1873, the town was officially incorporated as “Magnet Cove” and the mining operations expanded. The town quickly grew and by the early 1900s, it had become a bustling mining community. The town was home to several stores, a post office, a school, and a hotel.
The mining operations in Magnet Cove continued until the 1950s, when the ore deposits began to run out. The town’s population began to decline and many of the businesses closed. In the late 1970s, the town was revitalized when a new zinc mine was opened. This new mine provided jobs for many of the town’s residents and helped to revive the local economy.
Geography
Magnet Cove is located in the Ouachita Mountains of Arkansas. The town is situated in a valley surrounded by hills and mountains. The town is located approximately 20 miles northwest of Hot Springs and is accessible via Highway 270.
The town is located at an elevation of 1,400 feet and has a humid subtropical climate. The average temperature in the summer is around 80 degrees Fahrenheit and the average temperature in the winter is around 40 degrees Fahrenheit.
Economy
The economy of Magnet Cove is largely based on the mining industry. The town is home to a zinc mine, which provides jobs for many of the town’s residents. The town is also home to several small businesses, including a grocery store, a hardware store, and a restaurant.
Demographics
As of the 2010 census, the population of Magnet Cove was 1,092. The town is predominantly white, with a small African American population. The median household income in the town is $35,000 and the median home value is $90,000. The town has a poverty rate of 17.3%.
Common Questions
What is Per Capita Income in Magnet Cove?
Per Capita income in Magnet Cove is $23,185.
What is the Median Household income in Magnet Cove?
Median Household Income in Magnet Cove is $82,411.
What is Inequality or Gini Index in Magnet Cove?
Inequality or Gini Index in Magnet Cove is 0.33.
What is the Total Population of Magnet Cove?
Total Population of Magnet Cove is 1,205.
What is the Total Male Population of Magnet Cove?
Total Male Population of Magnet Cove is 568.
What is the Total Female Population of Magnet Cove?
Total Female Population of Magnet Cove is 637.
What is the Ratio of Males per 100 Females in Magnet Cove?
There are 89.17 Males per 100 Females in Magnet Cove.
What is the Ratio of Females per 100 Males in Magnet Cove?
There are 112.15 Females per 100 Males in Magnet Cove.
What is the Median Population Age in Magnet Cove?
Median Population Age in Magnet Cove is 31.3 Years.
What is the Average Family Size in Magnet Cove
Average Family Size in Magnet Cove is 4.1 People.
What is the Average Household Size in Magnet Cove
Average Household Size in Magnet Cove is 3.8 People.
How Large is the Labor Force in Magnet Cove?
There are 620 People in the Labor Forcein in Magnet Cove.
What is the Percentage of People in the Labor Force in Magnet Cove?
59.9% of People are in the Labor Force in Magnet Cove.
What is the Unemployment Rate in Magnet Cove?
Unemployment Rate in Magnet Cove is 22.3%.