Prescott, AR Map & Demographics
Prescott Map
Prescott Overview
$16,831
PER CAPITA INCOME
$45,170
AVG FAMILY INCOME
$29,899
AVG HOUSEHOLD INCOME
36.5%
WAGE / INCOME GAP [ % ]
63.5¢/ $1
WAGE / INCOME GAP [ $ ]
0.39
INEQUALITY / GINI INDEX
3,079
TOTAL POPULATION
1,563
MALE POPULATION
1,516
FEMALE POPULATION
103.10
MALES / 100 FEMALES
96.99
FEMALES / 100 MALES
35.7
MEDIAN AGE
3.8
AVG FAMILY SIZE
2.5
AVG HOUSEHOLD SIZE
1,332
LABOR FORCE [ PEOPLE ]
55.0%
PERCENT IN LABOR FORCE
5.6%
UNEMPLOYMENT RATE
Prescott Zip Codes
Prescott Area Codes
Income in Prescott
Income Overview in Prescott
Per Capita Income in Prescott is $16,831, while median incomes of families and households are $45,170 and $29,899 respectively.
| Characteristic | Number | Measure |
| Per Capita Income | 3,079 | $16,831 |
| Median Family Income | 605 | $45,170 |
| Mean Family Income | 605 | $45,341 |
| Median Household Income | 1,160 | $29,899 |
| Mean Household Income | 1,160 | $38,275 |
| Income Deficit | 605 | $0 |
| Wage / Income Gap (%) | 3,079 | 36.54% |
| Wage / Income Gap ($) | 3,079 | 63.46¢ per $1 |
| Gini / Inequality Index | 3,079 | 0.39 |
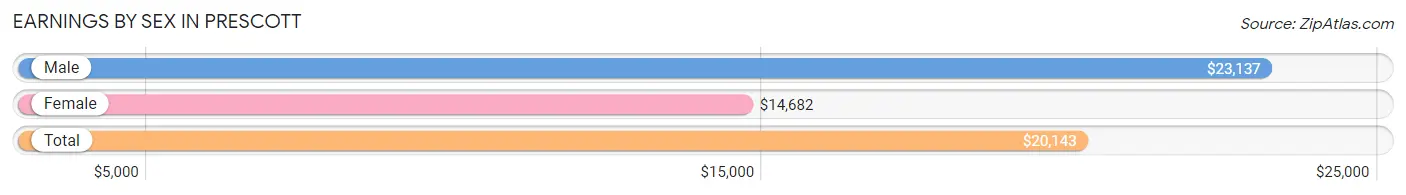
Earnings by Sex in Prescott
Average Earnings in Prescott are $20,143, $23,137 for men and $14,682 for women, a difference of 36.5%.
| Sex | Number | Average Earnings |
| Male | 647 (48.5%) | $23,137 |
| Female | 687 (51.5%) | $14,682 |
| Total | 1,334 (100.0%) | $20,143 |
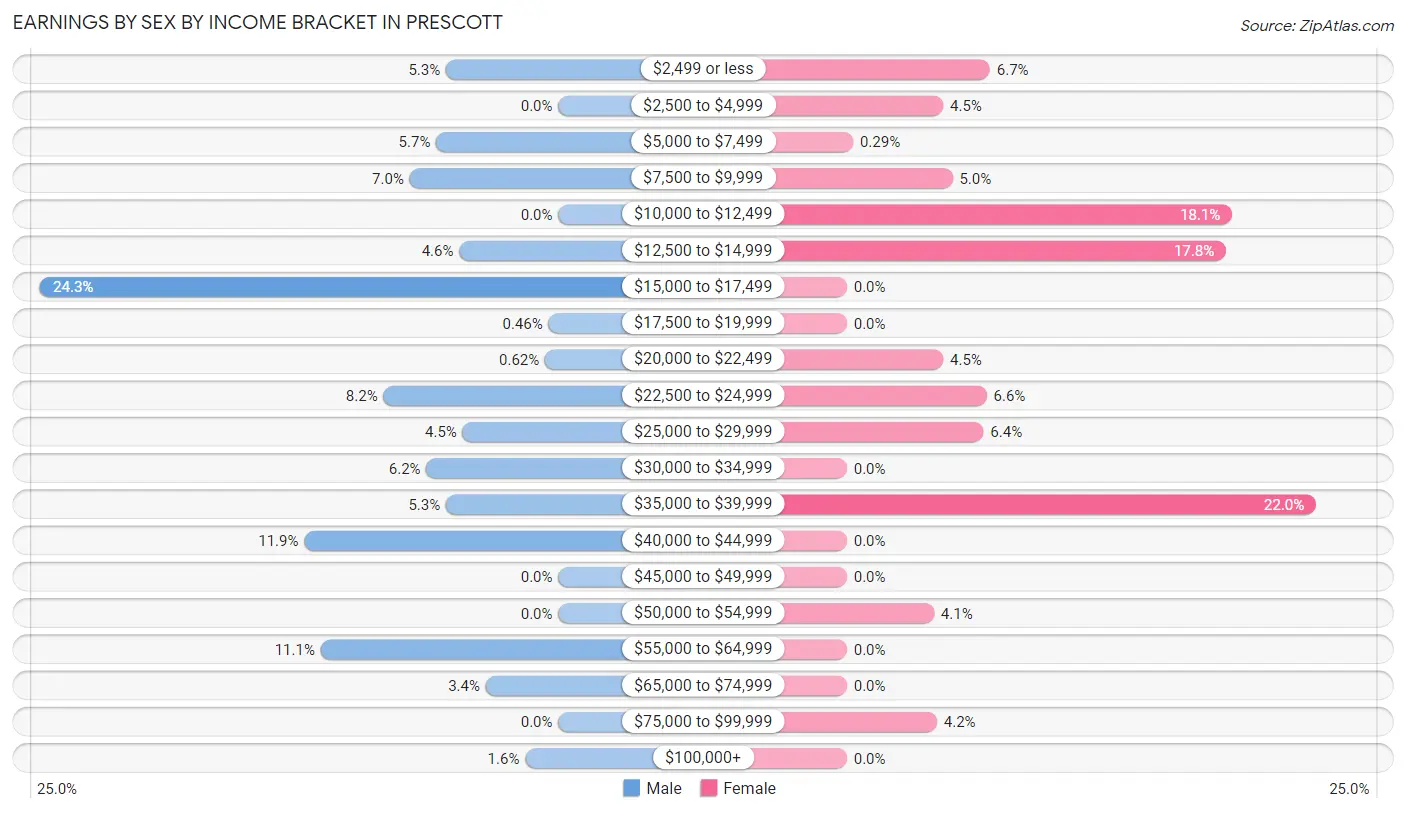
Earnings by Sex by Income Bracket in Prescott
The most common earnings brackets in Prescott are $15,000 to $17,499 for men (157 | 24.3%) and $35,000 to $39,999 for women (151 | 22.0%).
| Income | Male | Female |
| $2,499 or less | 34 (5.3%) | 46 (6.7%) |
| $2,500 to $4,999 | 0 (0.0%) | 31 (4.5%) |
| $5,000 to $7,499 | 37 (5.7%) | 2 (0.3%) |
| $7,500 to $9,999 | 45 (7.0%) | 34 (5.0%) |
| $10,000 to $12,499 | 0 (0.0%) | 124 (18.0%) |
| $12,500 to $14,999 | 30 (4.6%) | 122 (17.8%) |
| $15,000 to $17,499 | 157 (24.3%) | 0 (0.0%) |
| $17,500 to $19,999 | 3 (0.5%) | 0 (0.0%) |
| $20,000 to $22,499 | 4 (0.6%) | 31 (4.5%) |
| $22,500 to $24,999 | 53 (8.2%) | 45 (6.6%) |
| $25,000 to $29,999 | 29 (4.5%) | 44 (6.4%) |
| $30,000 to $34,999 | 40 (6.2%) | 0 (0.0%) |
| $35,000 to $39,999 | 34 (5.3%) | 151 (22.0%) |
| $40,000 to $44,999 | 77 (11.9%) | 0 (0.0%) |
| $45,000 to $49,999 | 0 (0.0%) | 0 (0.0%) |
| $50,000 to $54,999 | 0 (0.0%) | 28 (4.1%) |
| $55,000 to $64,999 | 72 (11.1%) | 0 (0.0%) |
| $65,000 to $74,999 | 22 (3.4%) | 0 (0.0%) |
| $75,000 to $99,999 | 0 (0.0%) | 29 (4.2%) |
| $100,000+ | 10 (1.5%) | 0 (0.0%) |
| Total | 647 (100.0%) | 687 (100.0%) |
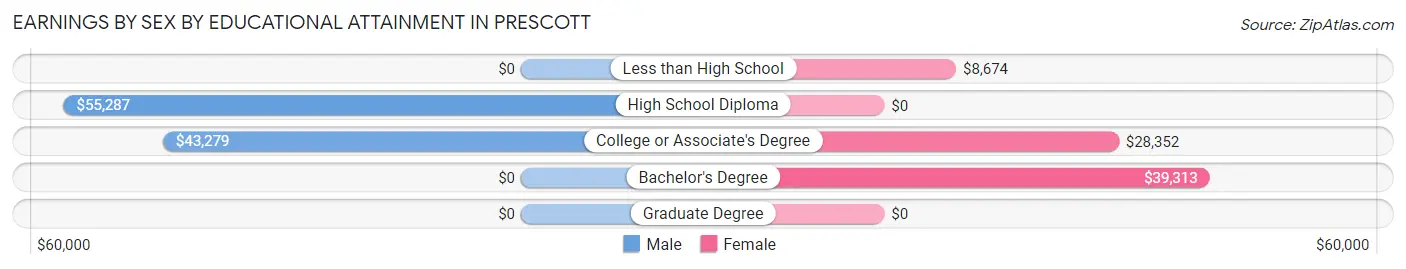
Earnings by Sex by Educational Attainment in Prescott
Average earnings in Prescott are $42,565 for men and $24,472 for women, a difference of 42.5%. Men with an educational attainment of high school diploma enjoy the highest average annual earnings of $55,287, while those with college or associate's degree education earn the least with $43,279. Women with an educational attainment of bachelor's degree earn the most with the average annual earnings of $39,313, while those with less than high school education have the smallest earnings of $8,674.
| Educational Attainment | Male Income | Female Income |
| Less than High School | - | - |
| High School Diploma | $55,287 | $0 |
| College or Associate's Degree | $43,279 | $28,352 |
| Bachelor's Degree | - | - |
| Graduate Degree | - | - |
| Total | $42,565 | $24,472 |
Family Income in Prescott
Family Income Brackets in Prescott
According to the Prescott family income data, there are 159 families falling into the $35,000 to $49,999 income range, which is the most common income bracket and makes up 26.3% of all families.
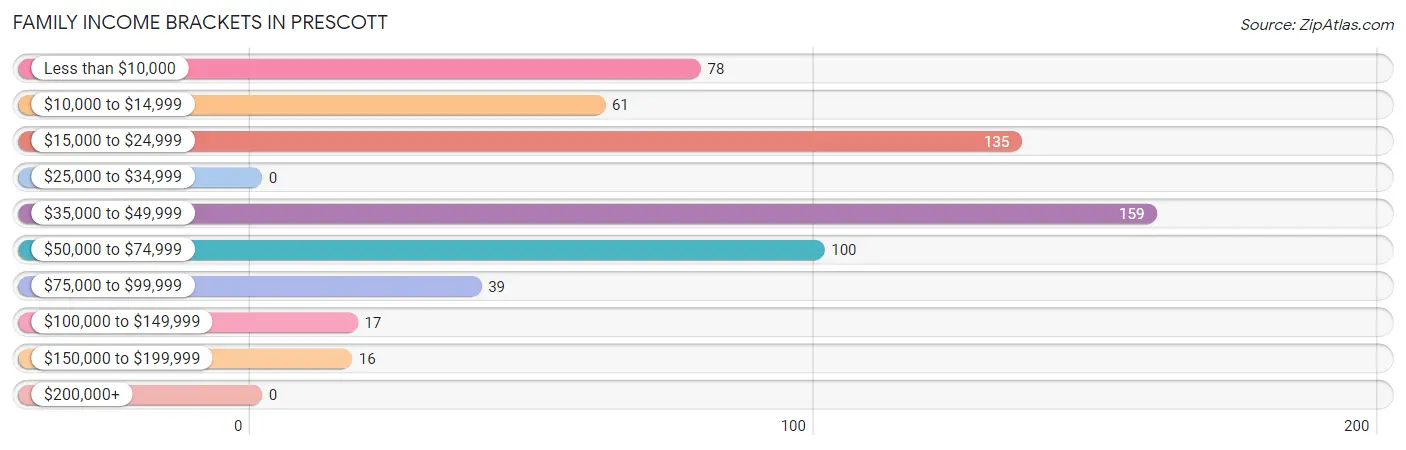
| Income Bracket | # Families | % Families |
| Less than $10,000 | 78 | 12.9% |
| $10,000 to $14,999 | 61 | 10.1% |
| $15,000 to $24,999 | 135 | 22.3% |
| $25,000 to $34,999 | 0 | 0.0% |
| $35,000 to $49,999 | 159 | 26.3% |
| $50,000 to $74,999 | 100 | 16.5% |
| $75,000 to $99,999 | 39 | 6.4% |
| $100,000 to $149,999 | 17 | 2.8% |
| $150,000 to $199,999 | 16 | 2.6% |
| $200,000+ | 0 | 0.0% |
Family Income by Famaliy Size in Prescott
2-person families (133 | 22.0%) account for the highest median family income in Prescott with $73,910 per family, while 2-person families (133 | 22.0%) have the highest median income of $36,955 per family member.
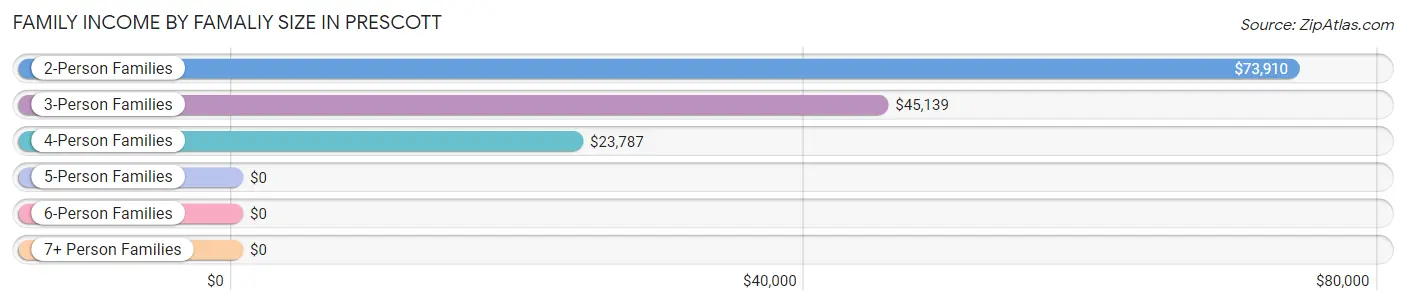
| Income Bracket | # Families | Median Income |
| 2-Person Families | 133 (22.0%) | $73,910 |
| 3-Person Families | 219 (36.2%) | $45,139 |
| 4-Person Families | 203 (33.6%) | $23,787 |
| 5-Person Families | 40 (6.6%) | $0 |
| 6-Person Families | 10 (1.7%) | $0 |
| 7+ Person Families | 0 (0.0%) | $0 |
| Total | 605 (100.0%) | $45,170 |
Family Income by Number of Earners in Prescott
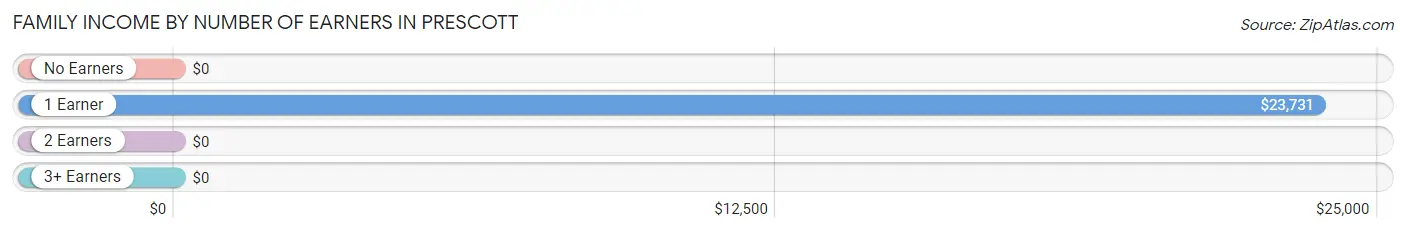
| Number of Earners | # Families | Median Income |
| No Earners | 36 (5.9%) | $0 |
| 1 Earner | 411 (67.9%) | $23,731 |
| 2 Earners | 121 (20.0%) | $0 |
| 3+ Earners | 37 (6.1%) | $0 |
| Total | 605 (100.0%) | $45,170 |
Household Income in Prescott
Household Income Brackets in Prescott
With 291 households falling in the category, the $35,000 to $49,999 income range is the most frequent in Prescott, accounting for 25.1% of all households.
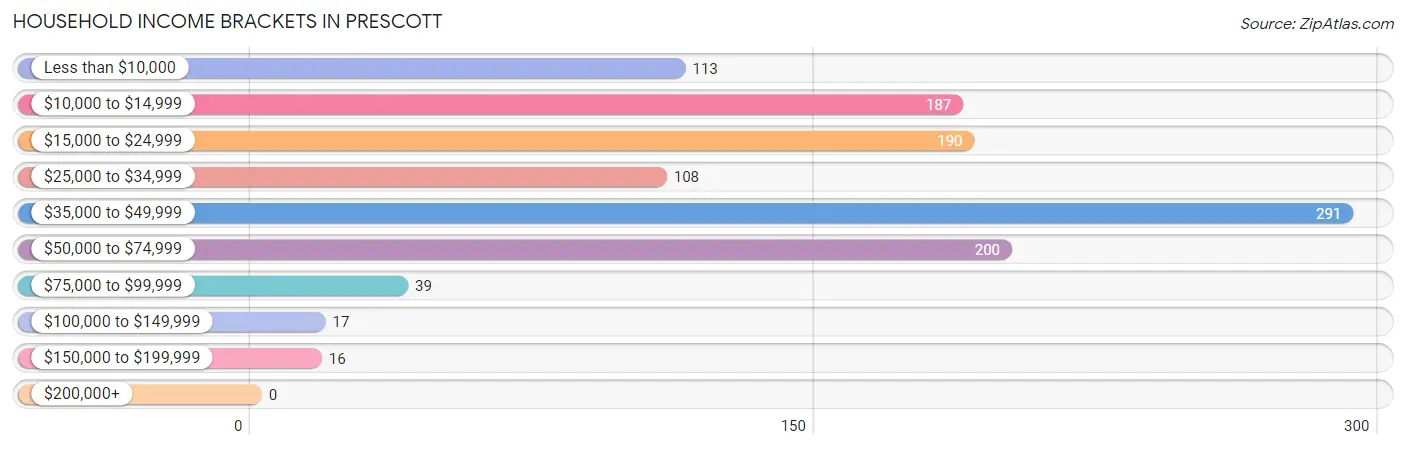
| Income Bracket | # Households | % Households |
| Less than $10,000 | 113 | 9.7% |
| $10,000 to $14,999 | 187 | 16.1% |
| $15,000 to $24,999 | 190 | 16.4% |
| $25,000 to $34,999 | 108 | 9.3% |
| $35,000 to $49,999 | 291 | 25.1% |
| $50,000 to $74,999 | 200 | 17.2% |
| $75,000 to $99,999 | 39 | 3.4% |
| $100,000 to $149,999 | 17 | 1.5% |
| $150,000 to $199,999 | 16 | 1.4% |
| $200,000+ | 0 | 0.0% |
Household Income by Householder Age in Prescott
The median household income in Prescott is $29,899, with the highest median household income of $45,158 found in the 65+ years age bracket for the primary householder. A total of 291 households (25.1%) fall into this category. Meanwhile, the 15 to 24 years age bracket for the primary householder has the lowest median household income of $0, with 40 households (3.5%) in this group.
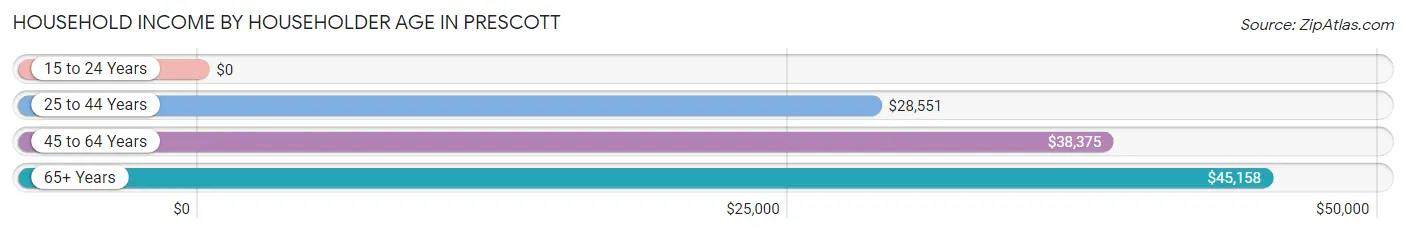
| Income Bracket | # Households | Median Income |
| 15 to 24 Years | 40 (3.5%) | $0 |
| 25 to 44 Years | 323 (27.8%) | $28,551 |
| 45 to 64 Years | 506 (43.6%) | $38,375 |
| 65+ Years | 291 (25.1%) | $45,158 |
| Total | 1,160 (100.0%) | $29,899 |
Poverty in Prescott
Income Below Poverty by Sex and Age in Prescott
With 26.0% poverty level for males and 46.4% for females among the residents of Prescott, under 5 year old males and 35 to 44 year old females are the most vulnerable to poverty, with 81 males (100.0%) and 74 females (87.1%) in their respective age groups living below the poverty level.
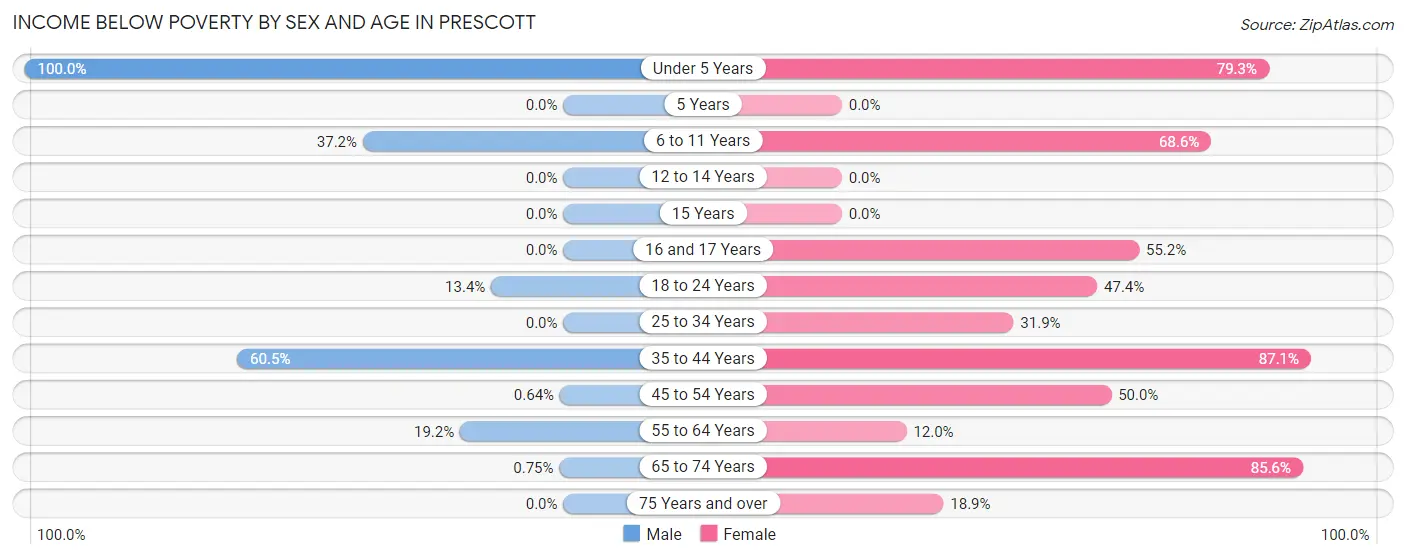
| Age Bracket | Male | Female |
| Under 5 Years | 81 (100.0%) | 84 (79.2%) |
| 5 Years | 0 (0.0%) | 0 (0.0%) |
| 6 to 11 Years | 96 (37.2%) | 109 (68.5%) |
| 12 to 14 Years | 0 (0.0%) | 0 (0.0%) |
| 15 Years | 0 (0.0%) | 0 (0.0%) |
| 16 and 17 Years | 0 (0.0%) | 32 (55.2%) |
| 18 to 24 Years | 39 (13.4%) | 100 (47.4%) |
| 25 to 34 Years | 0 (0.0%) | 43 (31.9%) |
| 35 to 44 Years | 135 (60.5%) | 74 (87.1%) |
| 45 to 54 Years | 1 (0.6%) | 78 (50.0%) |
| 55 to 64 Years | 37 (19.2%) | 30 (12.0%) |
| 65 to 74 Years | 1 (0.7%) | 83 (85.6%) |
| 75 Years and over | 0 (0.0%) | 23 (18.9%) |
| Total | 390 (26.0%) | 656 (46.4%) |
Income Above Poverty by Sex and Age in Prescott
According to the poverty statistics in Prescott, males aged 12 to 14 years and females aged 12 to 14 years are the age groups that are most secure financially, with 100.0% of males and 100.0% of females in these age groups living above the poverty line.
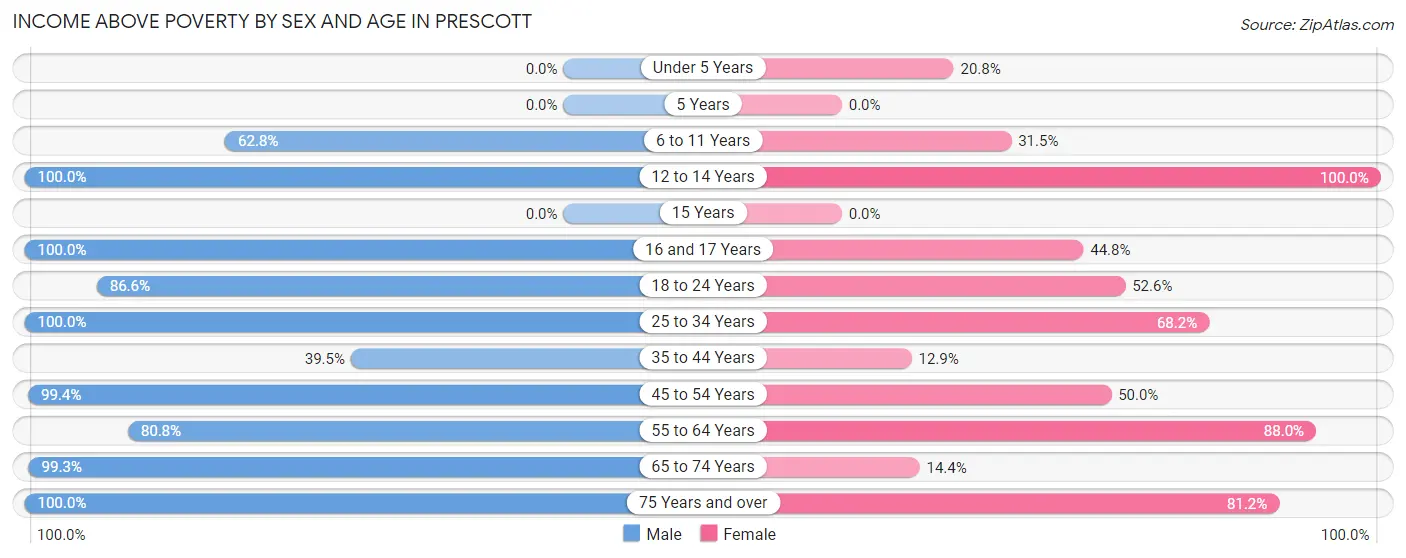
| Age Bracket | Male | Female |
| Under 5 Years | 0 (0.0%) | 22 (20.7%) |
| 5 Years | 0 (0.0%) | 0 (0.0%) |
| 6 to 11 Years | 162 (62.8%) | 50 (31.5%) |
| 12 to 14 Years | 18 (100.0%) | 36 (100.0%) |
| 15 Years | 0 (0.0%) | 0 (0.0%) |
| 16 and 17 Years | 40 (100.0%) | 26 (44.8%) |
| 18 to 24 Years | 252 (86.6%) | 111 (52.6%) |
| 25 to 34 Years | 87 (100.0%) | 92 (68.1%) |
| 35 to 44 Years | 88 (39.5%) | 11 (12.9%) |
| 45 to 54 Years | 155 (99.4%) | 78 (50.0%) |
| 55 to 64 Years | 156 (80.8%) | 220 (88.0%) |
| 65 to 74 Years | 133 (99.3%) | 14 (14.4%) |
| 75 Years and over | 17 (100.0%) | 99 (81.1%) |
| Total | 1,108 (74.0%) | 759 (53.6%) |
Income Below Poverty Among Married-Couple Families in Prescott
The poverty statistics for married-couple families in Prescott show that 53.8% or 135 of the total 251 families live below the poverty line. Families with 1 or 2 children have the highest poverty rate of 57.7%, comprising of 135 families. On the other hand, families with no children have the lowest poverty rate of 0.0%, which includes 0 families.
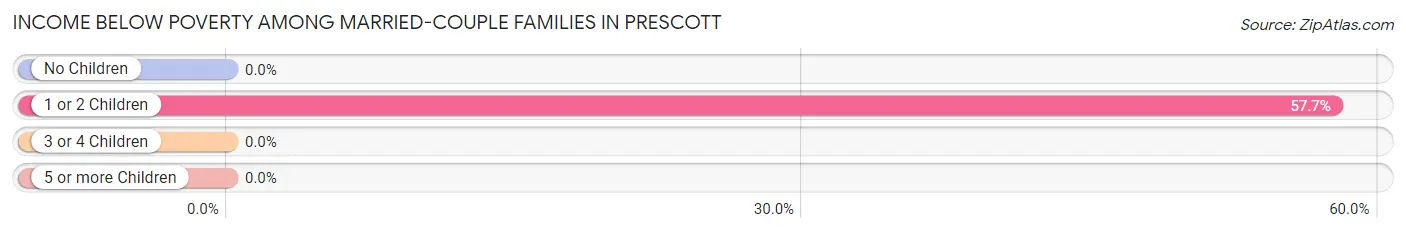
| Children | Above Poverty | Below Poverty |
| No Children | 17 (100.0%) | 0 (0.0%) |
| 1 or 2 Children | 99 (42.3%) | 135 (57.7%) |
| 3 or 4 Children | 0 (0.0%) | 0 (0.0%) |
| 5 or more Children | 0 (0.0%) | 0 (0.0%) |
| Total | 116 (46.2%) | 135 (53.8%) |
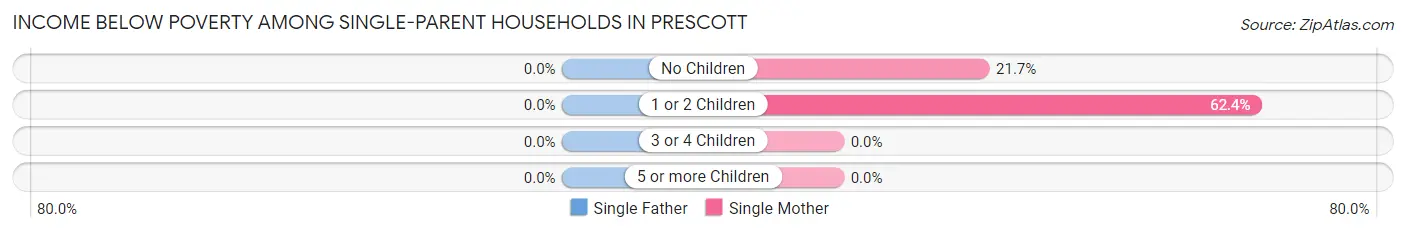
Income Below Poverty Among Single-Parent Households in Prescott
| Children | Single Father | Single Mother |
| No Children | 0 (0.0%) | 13 (21.7%) |
| 1 or 2 Children | 0 (0.0%) | 126 (62.4%) |
| 3 or 4 Children | 0 (0.0%) | 0 (0.0%) |
| 5 or more Children | 0 (0.0%) | 0 (0.0%) |
| Total | 0 (0.0%) | 139 (53.0%) |
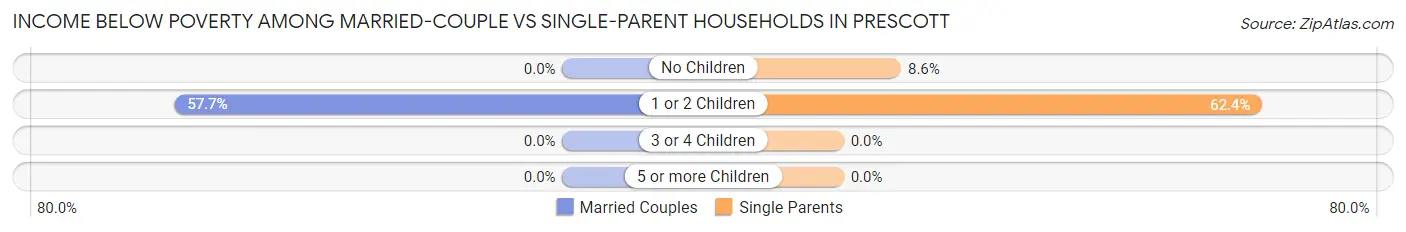
Income Below Poverty Among Married-Couple vs Single-Parent Households in Prescott
The poverty data for Prescott shows that 135 of the married-couple family households (53.8%) and 139 of the single-parent households (39.3%) are living below the poverty level. Within the married-couple family households, those with 1 or 2 children have the highest poverty rate, with 135 households (57.7%) falling below the poverty line. Among the single-parent households, those with 1 or 2 children have the highest poverty rate, with 126 household (62.4%) living below poverty.
| Children | Married-Couple Families | Single-Parent Households |
| No Children | 0 (0.0%) | 13 (8.6%) |
| 1 or 2 Children | 135 (57.7%) | 126 (62.4%) |
| 3 or 4 Children | 0 (0.0%) | 0 (0.0%) |
| 5 or more Children | 0 (0.0%) | 0 (0.0%) |
| Total | 135 (53.8%) | 139 (39.3%) |
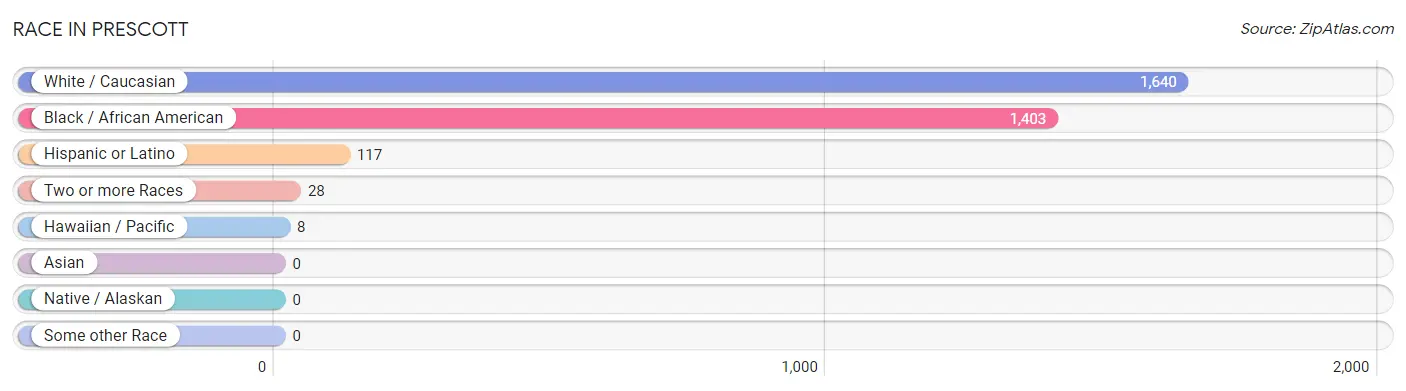
Race in Prescott
The most populous races in Prescott are White / Caucasian (1,640 | 53.3%), Black / African American (1,403 | 45.6%), and Hispanic or Latino (117 | 3.8%).
| Race | # Population | % Population |
| Asian | 0 | 0.0% |
| Black / African American | 1,403 | 45.6% |
| Hawaiian / Pacific | 8 | 0.3% |
| Hispanic or Latino | 117 | 3.8% |
| Native / Alaskan | 0 | 0.0% |
| White / Caucasian | 1,640 | 53.3% |
| Two or more Races | 28 | 0.9% |
| Some other Race | 0 | 0.0% |
| Total | 3,079 | 100.0% |
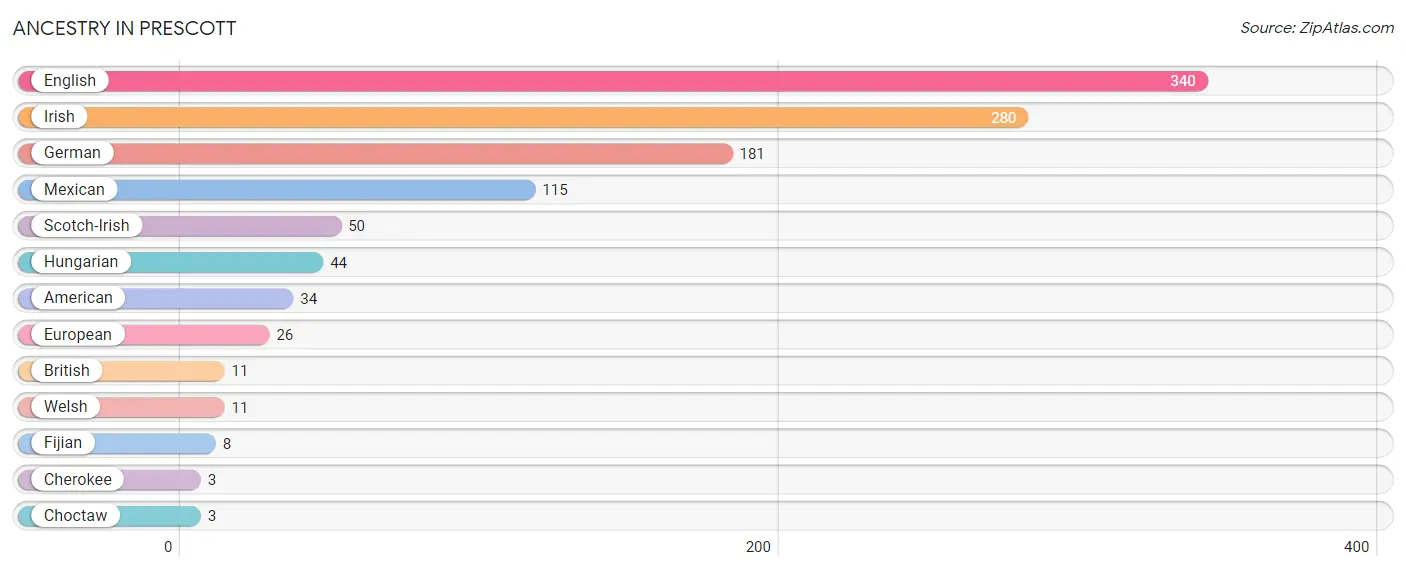
Ancestry in Prescott
The most populous ancestries reported in Prescott are English (340 | 11.0%), Irish (280 | 9.1%), German (181 | 5.9%), Mexican (115 | 3.7%), and Scotch-Irish (50 | 1.6%), together accounting for 31.4% of all Prescott residents.
| Ancestry | # Population | % Population |
| American | 34 | 1.1% |
| British | 11 | 0.4% |
| Cherokee | 3 | 0.1% |
| Choctaw | 3 | 0.1% |
| English | 340 | 11.0% |
| European | 26 | 0.8% |
| Fijian | 8 | 0.3% |
| German | 181 | 5.9% |
| Hungarian | 44 | 1.4% |
| Irish | 280 | 9.1% |
| Mexican | 115 | 3.7% |
| Scotch-Irish | 50 | 1.6% |
| Welsh | 11 | 0.4% | View All 13 Rows |
Immigrants in Prescott
The most numerous immigrant groups reported in Prescott came from Oceania (8 | 0.3%), Europe (1 | 0.0%), France (1 | 0.0%), and Western Europe (1 | 0.0%), together accounting for 0.3% of all Prescott residents.
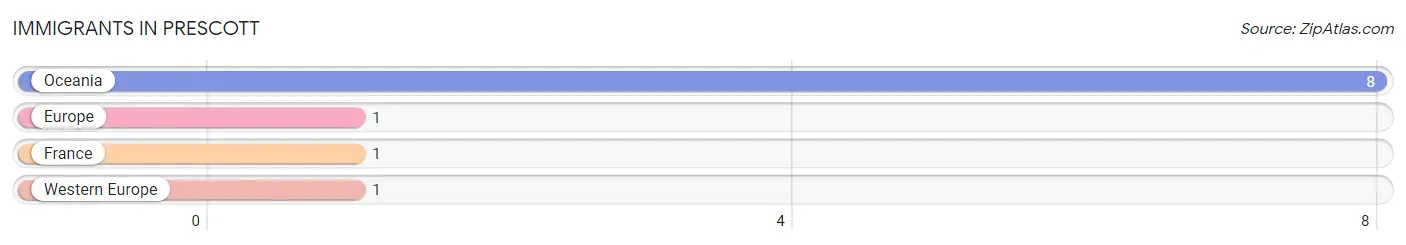
| Immigration Origin | # Population | % Population |
| Europe | 1 | 0.0% |
| France | 1 | 0.0% |
| Oceania | 8 | 0.3% |
| Western Europe | 1 | 0.0% | View All 4 Rows |
Sex and Age in Prescott
Sex and Age in Prescott
The most populous age groups in Prescott are 15 to 19 Years (225 | 14.4%) for men and 20 to 24 Years (211 | 13.9%) for women.
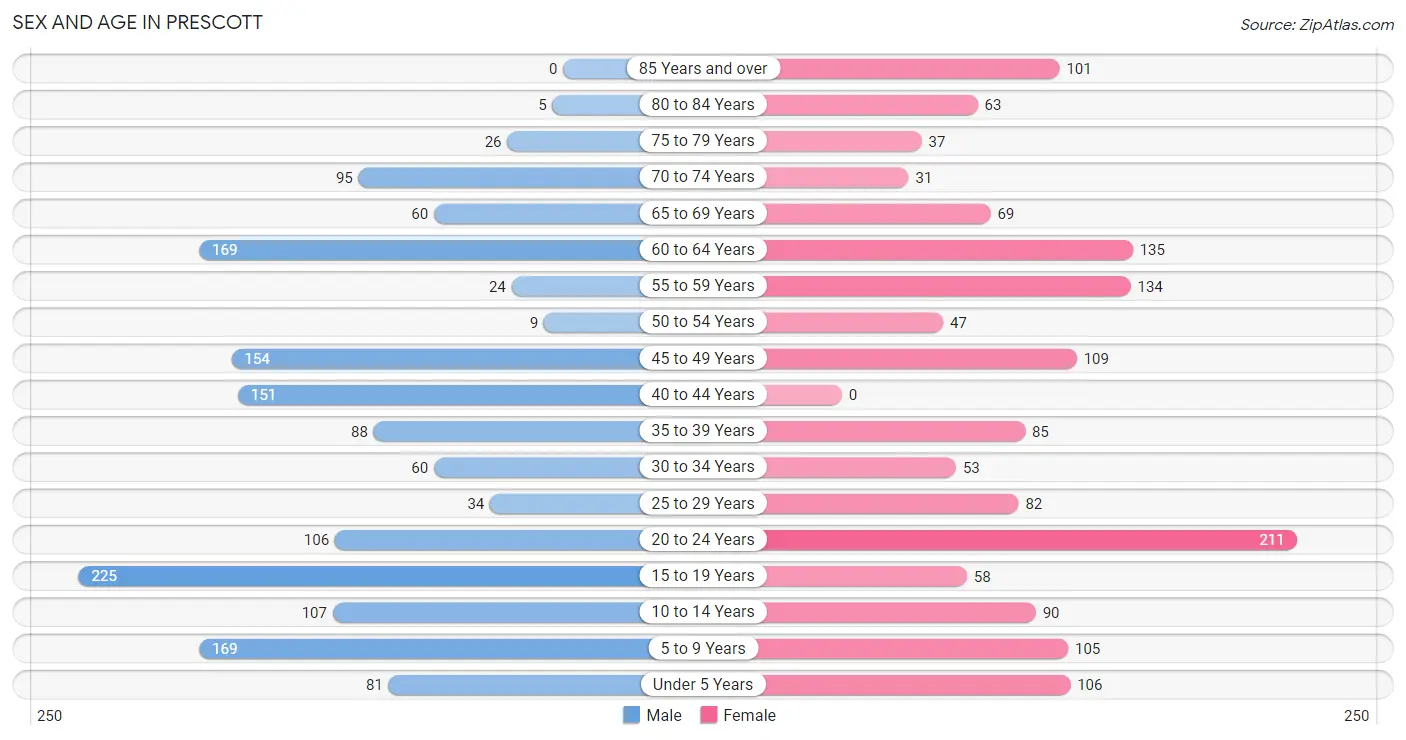
| Age Bracket | Male | Female |
| Under 5 Years | 81 (5.2%) | 106 (7.0%) |
| 5 to 9 Years | 169 (10.8%) | 105 (6.9%) |
| 10 to 14 Years | 107 (6.9%) | 90 (5.9%) |
| 15 to 19 Years | 225 (14.4%) | 58 (3.8%) |
| 20 to 24 Years | 106 (6.8%) | 211 (13.9%) |
| 25 to 29 Years | 34 (2.2%) | 82 (5.4%) |
| 30 to 34 Years | 60 (3.8%) | 53 (3.5%) |
| 35 to 39 Years | 88 (5.6%) | 85 (5.6%) |
| 40 to 44 Years | 151 (9.7%) | 0 (0.0%) |
| 45 to 49 Years | 154 (9.9%) | 109 (7.2%) |
| 50 to 54 Years | 9 (0.6%) | 47 (3.1%) |
| 55 to 59 Years | 24 (1.5%) | 134 (8.8%) |
| 60 to 64 Years | 169 (10.8%) | 135 (8.9%) |
| 65 to 69 Years | 60 (3.8%) | 69 (4.5%) |
| 70 to 74 Years | 95 (6.1%) | 31 (2.0%) |
| 75 to 79 Years | 26 (1.7%) | 37 (2.4%) |
| 80 to 84 Years | 5 (0.3%) | 63 (4.2%) |
| 85 Years and over | 0 (0.0%) | 101 (6.7%) |
| Total | 1,563 (100.0%) | 1,516 (100.0%) |
Families and Households in Prescott
Median Family Size in Prescott
The median family size in Prescott is 3.78 persons per family, with single male/father families (92 | 15.2%) accounting for the largest median family size of 4.38 persons per family. On the other hand, married-couple families (251 | 41.5%) represent the smallest median family size with 3.29 persons per family.
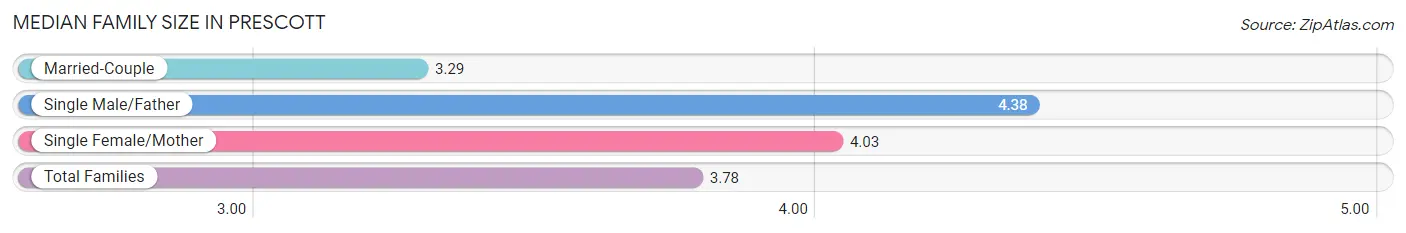
| Family Type | # Families | Family Size |
| Married-Couple | 251 (41.5%) | 3.29 |
| Single Male/Father | 92 (15.2%) | 4.38 |
| Single Female/Mother | 262 (43.3%) | 4.03 |
| Total Families | 605 (100.0%) | 3.78 |
Median Household Size in Prescott
The median household size in Prescott is 2.49 persons per household, with single male/father households (92 | 7.9%) accounting for the largest median household size of 4.38 persons per household. non-family households (555 | 47.8%) represent the smallest median household size with 1.10 persons per household.
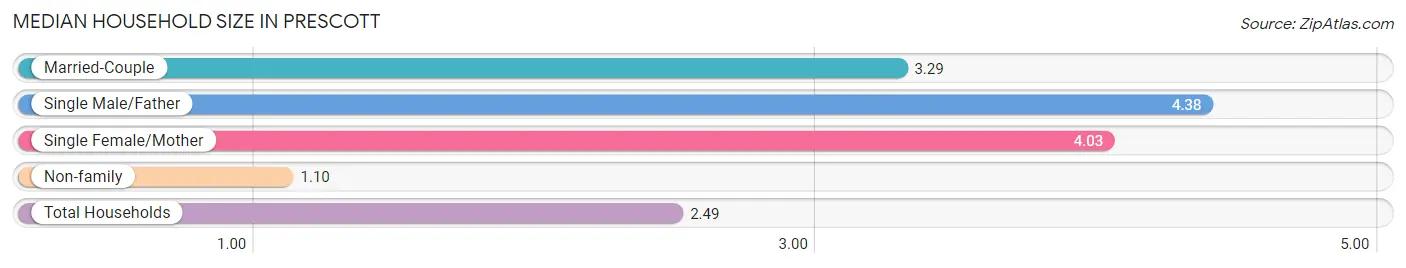
| Household Type | # Households | Household Size |
| Married-Couple | 251 (21.6%) | 3.29 |
| Single Male/Father | 92 (7.9%) | 4.38 |
| Single Female/Mother | 262 (22.6%) | 4.03 |
| Non-family | 555 (47.8%) | 1.10 |
| Total Households | 1,160 (100.0%) | 2.49 |
Household Size by Marriage Status in Prescott
Out of a total of 1,160 households in Prescott, 605 (52.2%) are family households, while 555 (47.8%) are nonfamily households. The most numerous type of family households are 3-person households, comprising 219, and the most common type of nonfamily households are 1-person households, comprising 535.
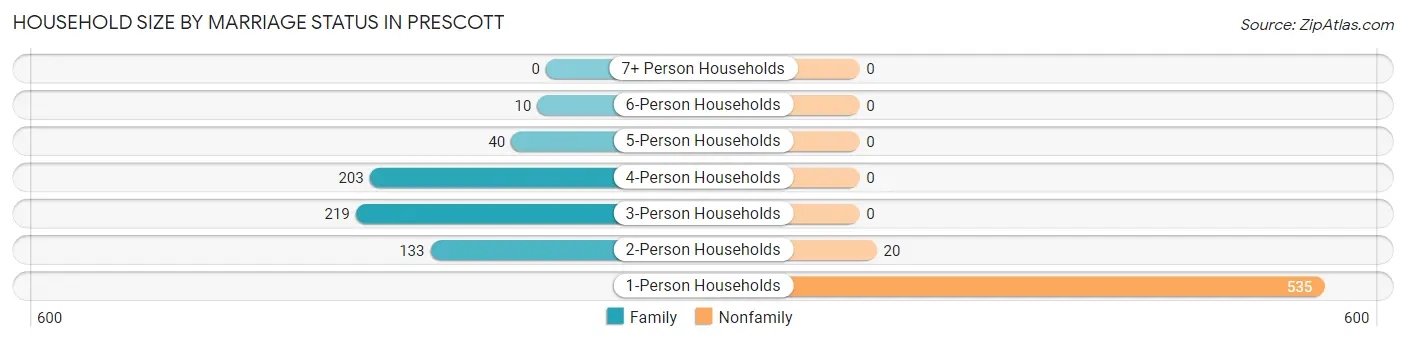
| Household Size | Family Households | Nonfamily Households |
| 1-Person Households | - | 535 (46.1%) |
| 2-Person Households | 133 (11.5%) | 20 (1.7%) |
| 3-Person Households | 219 (18.9%) | 0 (0.0%) |
| 4-Person Households | 203 (17.5%) | 0 (0.0%) |
| 5-Person Households | 40 (3.5%) | 0 (0.0%) |
| 6-Person Households | 10 (0.9%) | 0 (0.0%) |
| 7+ Person Households | 0 (0.0%) | 0 (0.0%) |
| Total | 605 (52.2%) | 555 (47.8%) |
Female Fertility in Prescott
Fertility by Age in Prescott
Average fertility rate in Prescott is 98.0 births per 1,000 women. Women in the age bracket of 20 to 34 years have the highest fertility rate with 171.0 births per 1,000 women. Women in the age bracket of 20 to 34 years acount for 100.0% of all women with births.
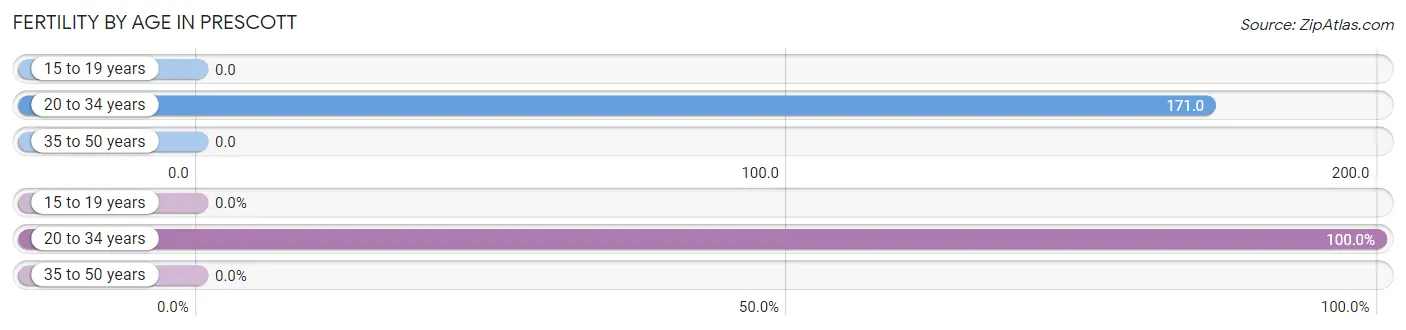
| Age Bracket | Women with Births | Births / 1,000 Women |
| 15 to 19 years | 0 (0.0%) | 0.0 |
| 20 to 34 years | 59 (100.0%) | 171.0 |
| 35 to 50 years | 0 (0.0%) | 0.0 |
| Total | 59 (100.0%) | 98.0 |
Fertility by Age by Marriage Status in Prescott
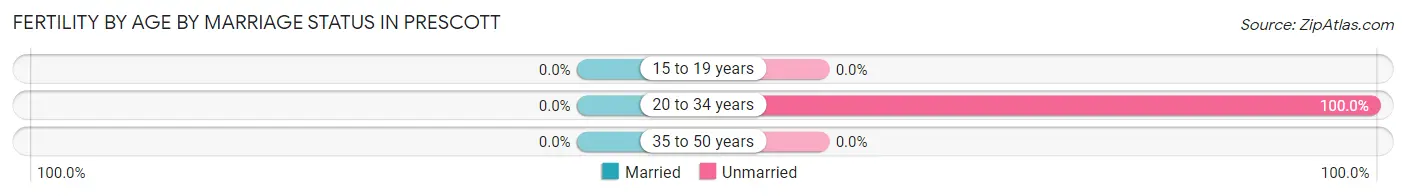
| Age Bracket | Married | Unmarried |
| 15 to 19 years | 0 (0.0%) | 0 (0.0%) |
| 20 to 34 years | 0 (0.0%) | 59 (100.0%) |
| 35 to 50 years | 0 (0.0%) | 0 (0.0%) |
| Total | 0 (0.0%) | 59 (100.0%) |
Fertility by Education in Prescott
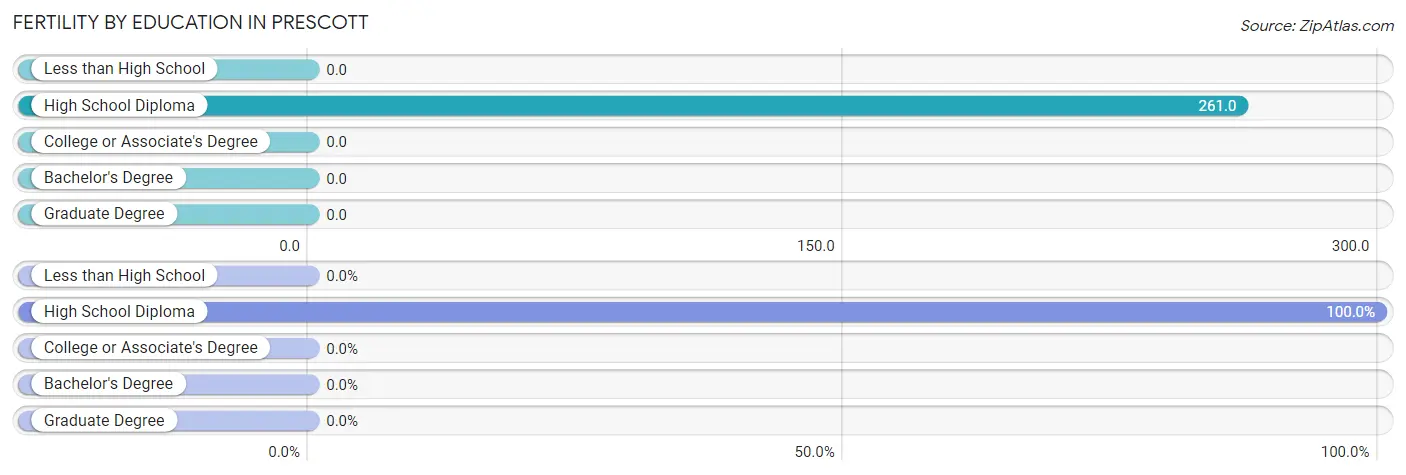
| Educational Attainment | Women with Births | Births / 1,000 Women |
| Less than High School | 0 (0.0%) | 0.0 |
| High School Diploma | 59 (100.0%) | 261.0 |
| College or Associate's Degree | 0 (0.0%) | 0.0 |
| Bachelor's Degree | 0 (0.0%) | 0.0 |
| Graduate Degree | 0 (0.0%) | 0.0 |
| Total | 59 (100.0%) | 98.0 |
Fertility by Education by Marriage Status in Prescott
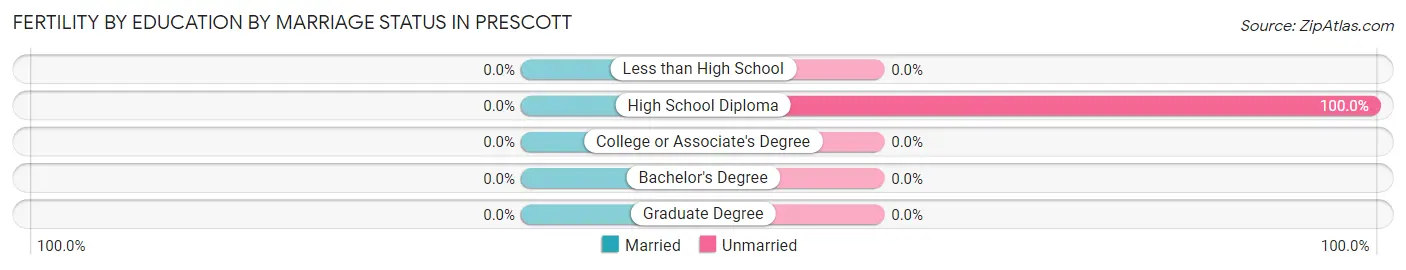
| Educational Attainment | Married | Unmarried |
| Less than High School | 0 (0.0%) | 0 (0.0%) |
| High School Diploma | 0 (0.0%) | 59 (100.0%) |
| College or Associate's Degree | 0 (0.0%) | 0 (0.0%) |
| Bachelor's Degree | 0 (0.0%) | 0 (0.0%) |
| Graduate Degree | 0 (0.0%) | 0 (0.0%) |
| Total | 0 (0.0%) | 59 (100.0%) |
Employment Characteristics in Prescott
Employment by Class of Employer in Prescott
Among the 1,257 employed individuals in Prescott, private company employees (835 | 66.4%), local government employees (145 | 11.5%), and not-for-profit organizations (118 | 9.4%) make up the most common classes of employment.
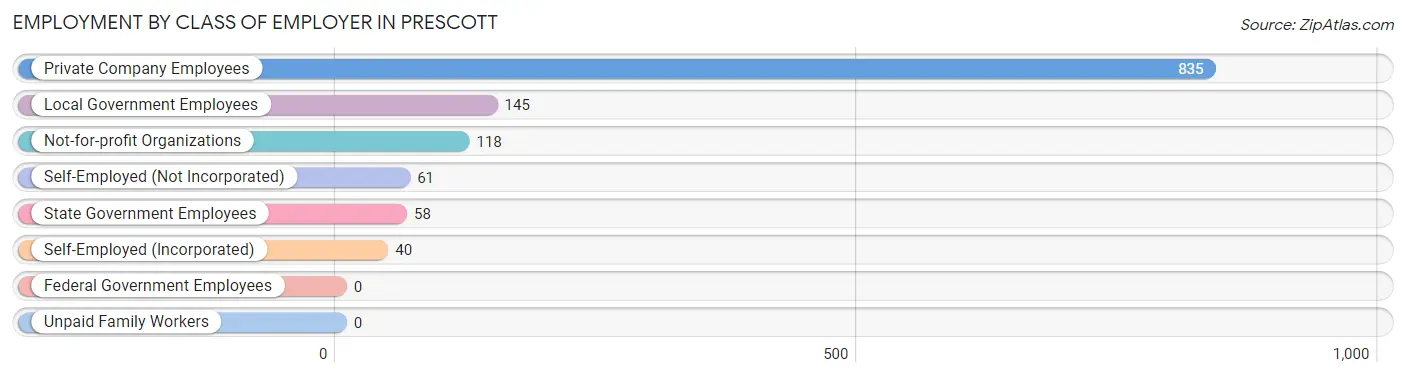
| Employer Class | # Employees | % Employees |
| Private Company Employees | 835 | 66.4% |
| Self-Employed (Incorporated) | 40 | 3.2% |
| Self-Employed (Not Incorporated) | 61 | 4.9% |
| Not-for-profit Organizations | 118 | 9.4% |
| Local Government Employees | 145 | 11.5% |
| State Government Employees | 58 | 4.6% |
| Federal Government Employees | 0 | 0.0% |
| Unpaid Family Workers | 0 | 0.0% |
| Total | 1,257 | 100.0% |
Employment Status by Age in Prescott
According to the labor force statistics for Prescott, out of the total population over 16 years of age (2,421), 55.0% or 1,332 individuals are in the labor force, with 5.6% or 75 of them unemployed. The age group with the highest labor force participation rate is 30 to 34 years, with 93.8% or 106 individuals in the labor force. Within the labor force, the 35 to 44 years age range has the highest percentage of unemployed individuals, with 45.7% or 74 of them being unemployed.
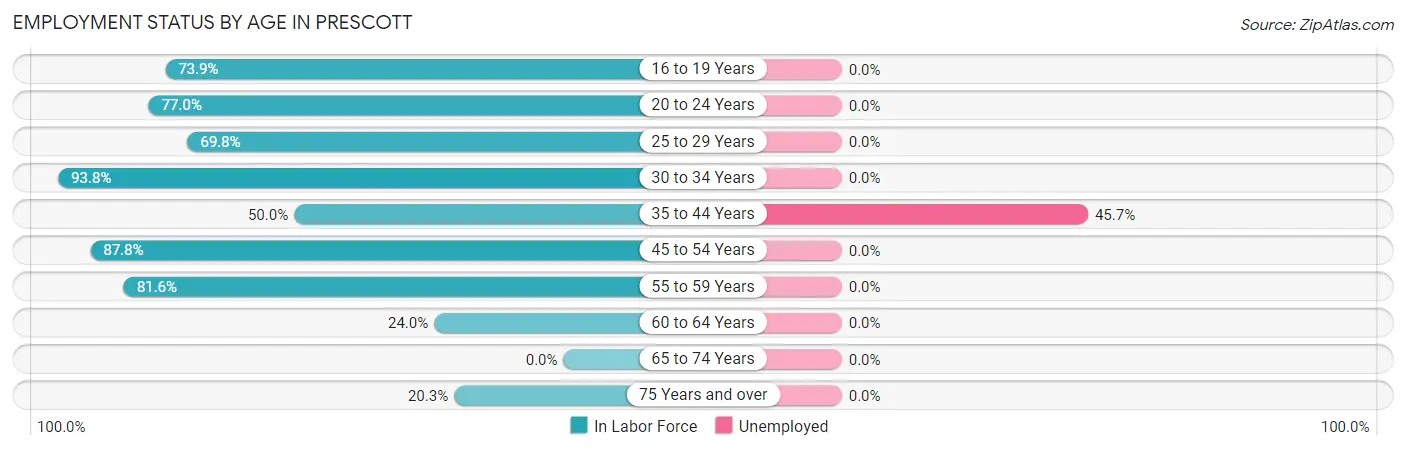
| Age Bracket | In Labor Force | Unemployed |
| 16 to 19 Years | 209 (73.9%) | 0 (0.0%) |
| 20 to 24 Years | 244 (77.0%) | 0 (0.0%) |
| 25 to 29 Years | 81 (69.8%) | 0 (0.0%) |
| 30 to 34 Years | 106 (93.8%) | 0 (0.0%) |
| 35 to 44 Years | 162 (50.0%) | 74 (45.7%) |
| 45 to 54 Years | 280 (87.8%) | 0 (0.0%) |
| 55 to 59 Years | 129 (81.6%) | 0 (0.0%) |
| 60 to 64 Years | 73 (24.0%) | 0 (0.0%) |
| 65 to 74 Years | 0 (0.0%) | 0 (0.0%) |
| 75 Years and over | 47 (20.3%) | 0 (0.0%) |
| Total | 1,332 (55.0%) | 75 (5.6%) |
Employment Status by Educational Attainment in Prescott
According to labor force statistics for Prescott, 62.3% of individuals (831) out of the total population between 25 and 64 years of age (1,334) are in the labor force, with 8.9% or 74 of them being unemployed. The group with the highest labor force participation rate are those with the educational attainment of bachelor's degree or higher, with 97.5% or 118 individuals in the labor force. Within the labor force, individuals with high school diploma education have the highest percentage of unemployment, with 20.6% or 74 of them being unemployed.
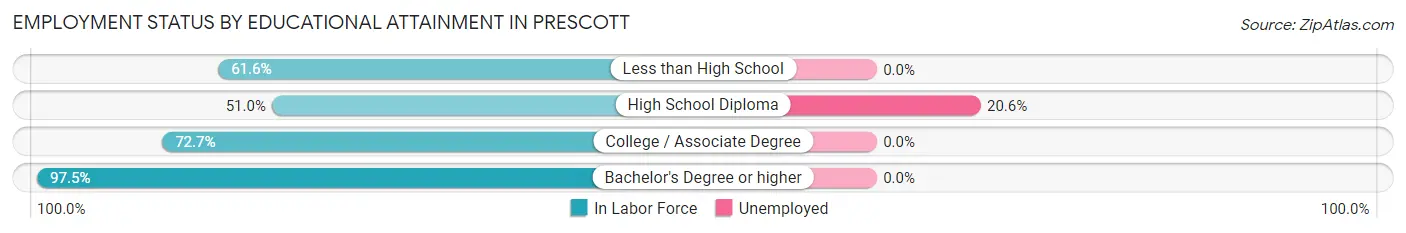
| Educational Attainment | In Labor Force | Unemployed |
| Less than High School | 90 (61.6%) | 0 (0.0%) |
| High School Diploma | 359 (51.0%) | 145 (20.6%) |
| College / Associate Degree | 264 (72.7%) | 0 (0.0%) |
| Bachelor's Degree or higher | 118 (97.5%) | 0 (0.0%) |
| Total | 831 (62.3%) | 119 (8.9%) |
Employment Occupations by Sex in Prescott
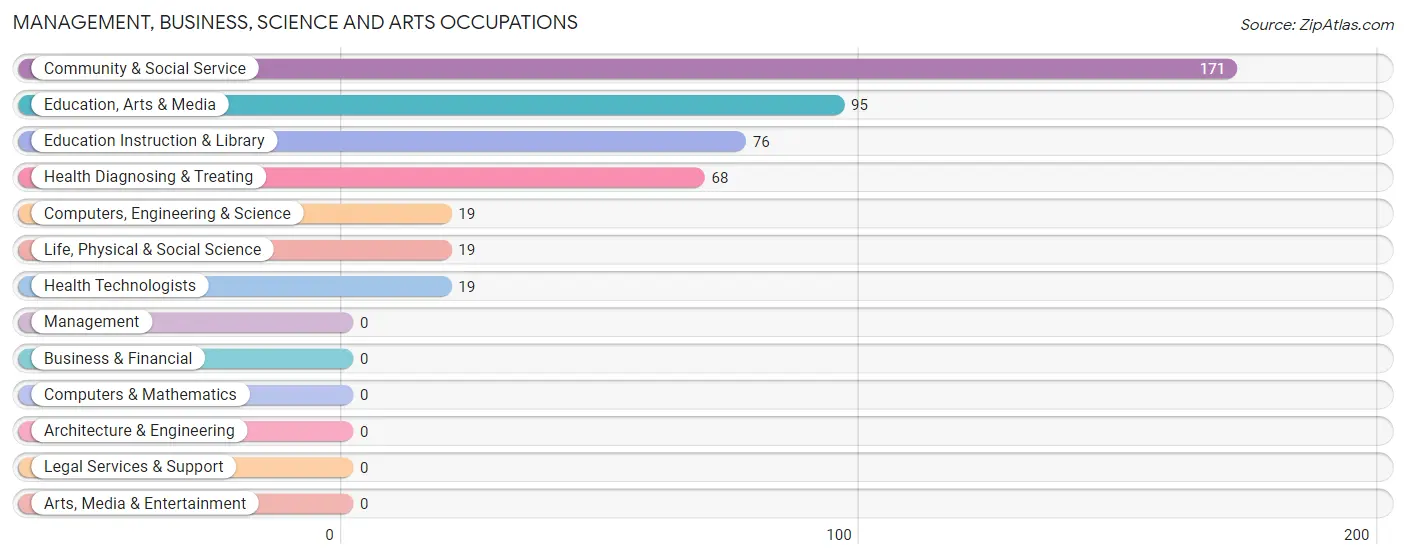
Management, Business, Science and Arts Occupations
The most common Management, Business, Science and Arts occupations in Prescott are Community & Social Service (171 | 13.6%), Education, Arts & Media (95 | 7.6%), Education Instruction & Library (76 | 6.0%), Health Diagnosing & Treating (68 | 5.4%), and Computers, Engineering & Science (19 | 1.5%).
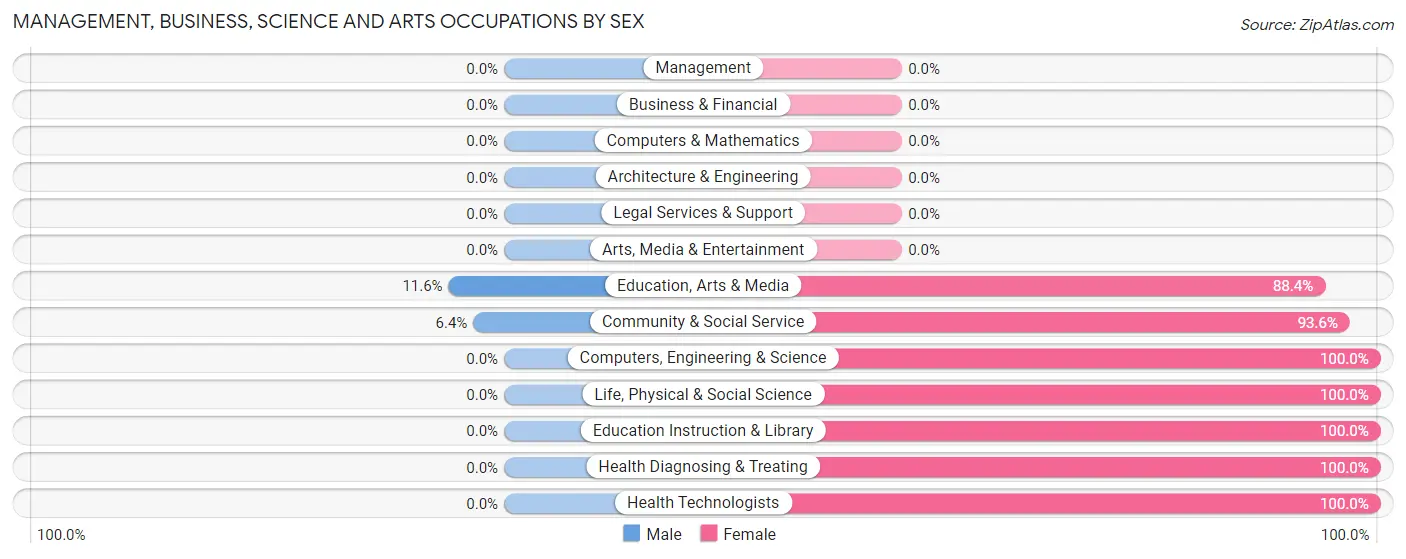
Management, Business, Science and Arts Occupations by Sex
Within the Management, Business, Science and Arts occupations in Prescott, the most male-oriented occupations are Education, Arts & Media (11.6%), and Community & Social Service (6.4%), while the most female-oriented occupations are Computers, Engineering & Science (100.0%), Life, Physical & Social Science (100.0%), and Education Instruction & Library (100.0%).
| Occupation | Male | Female |
| Management | 0 (0.0%) | 0 (0.0%) |
| Business & Financial | 0 (0.0%) | 0 (0.0%) |
| Computers, Engineering & Science | 0 (0.0%) | 19 (100.0%) |
| Computers & Mathematics | 0 (0.0%) | 0 (0.0%) |
| Architecture & Engineering | 0 (0.0%) | 0 (0.0%) |
| Life, Physical & Social Science | 0 (0.0%) | 19 (100.0%) |
| Community & Social Service | 11 (6.4%) | 160 (93.6%) |
| Education, Arts & Media | 11 (11.6%) | 84 (88.4%) |
| Legal Services & Support | 0 (0.0%) | 0 (0.0%) |
| Education Instruction & Library | 0 (0.0%) | 76 (100.0%) |
| Arts, Media & Entertainment | 0 (0.0%) | 0 (0.0%) |
| Health Diagnosing & Treating | 0 (0.0%) | 68 (100.0%) |
| Health Technologists | 0 (0.0%) | 19 (100.0%) |
| Total (Category) | 11 (4.3%) | 247 (95.7%) |
| Total (Overall) | 644 (51.2%) | 613 (48.8%) |
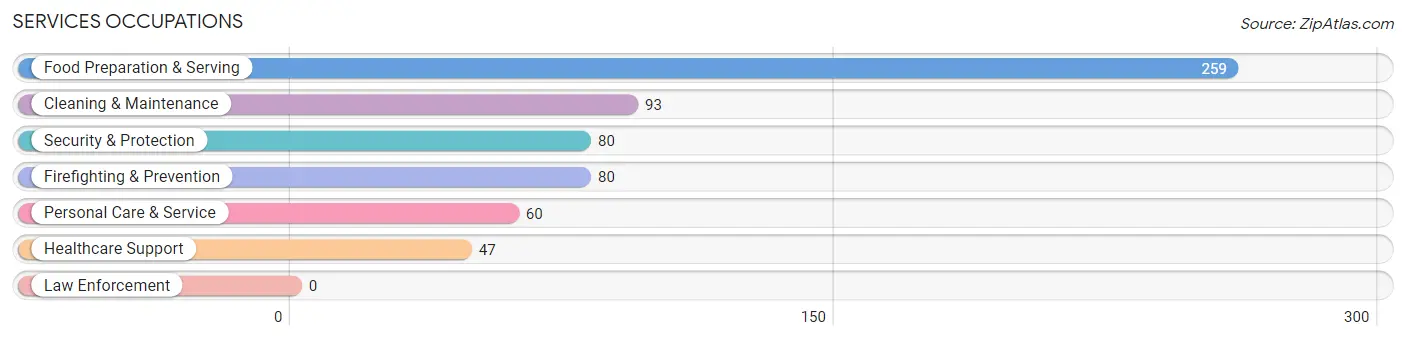
Services Occupations
The most common Services occupations in Prescott are Food Preparation & Serving (259 | 20.6%), Cleaning & Maintenance (93 | 7.4%), Security & Protection (80 | 6.4%), Firefighting & Prevention (80 | 6.4%), and Personal Care & Service (60 | 4.8%).
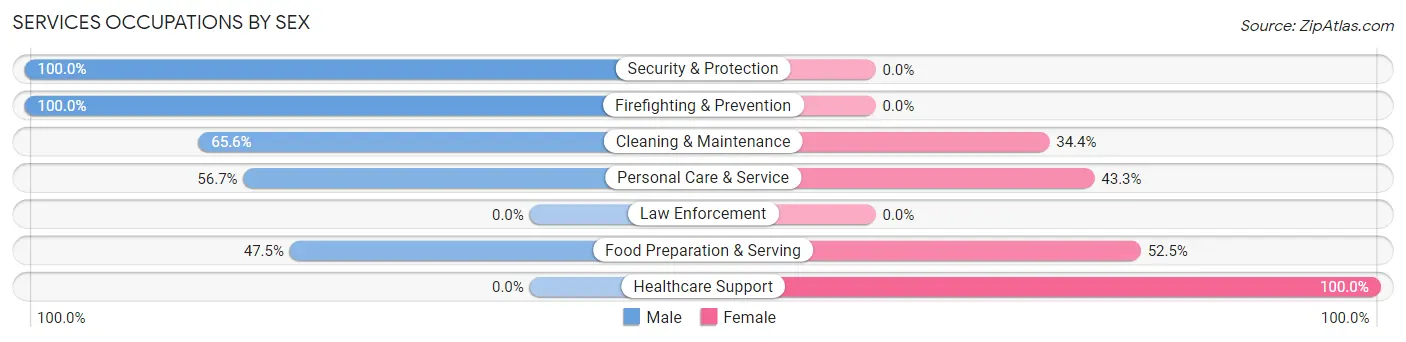
Services Occupations by Sex
Within the Services occupations in Prescott, the most male-oriented occupations are Security & Protection (100.0%), Firefighting & Prevention (100.0%), and Cleaning & Maintenance (65.6%), while the most female-oriented occupations are Healthcare Support (100.0%), Food Preparation & Serving (52.5%), and Personal Care & Service (43.3%).
| Occupation | Male | Female |
| Healthcare Support | 0 (0.0%) | 47 (100.0%) |
| Security & Protection | 80 (100.0%) | 0 (0.0%) |
| Firefighting & Prevention | 80 (100.0%) | 0 (0.0%) |
| Law Enforcement | 0 (0.0%) | 0 (0.0%) |
| Food Preparation & Serving | 123 (47.5%) | 136 (52.5%) |
| Cleaning & Maintenance | 61 (65.6%) | 32 (34.4%) |
| Personal Care & Service | 34 (56.7%) | 26 (43.3%) |
| Total (Category) | 298 (55.3%) | 241 (44.7%) |
| Total (Overall) | 644 (51.2%) | 613 (48.8%) |
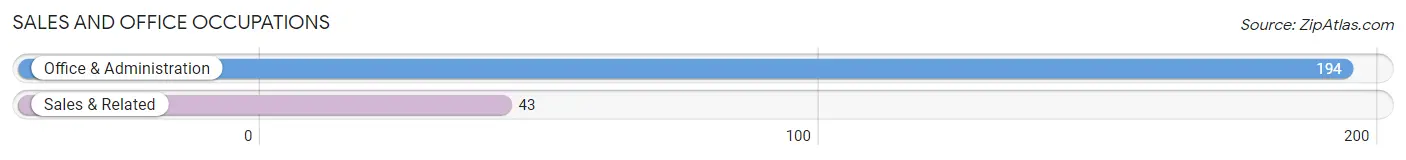
Sales and Office Occupations
The most common Sales and Office occupations in Prescott are Office & Administration (194 | 15.4%), and Sales & Related (43 | 3.4%).
Sales and Office Occupations by Sex
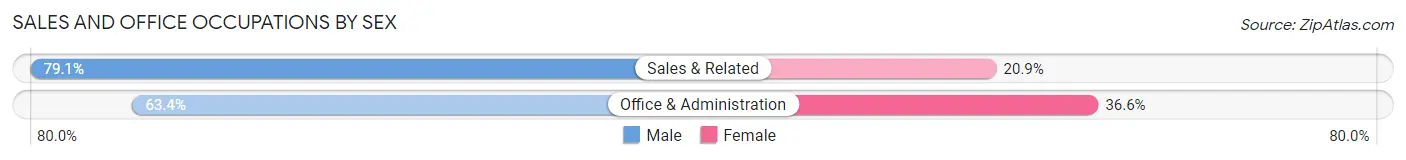
| Occupation | Male | Female |
| Sales & Related | 34 (79.1%) | 9 (20.9%) |
| Office & Administration | 123 (63.4%) | 71 (36.6%) |
| Total (Category) | 157 (66.2%) | 80 (33.8%) |
| Total (Overall) | 644 (51.2%) | 613 (48.8%) |
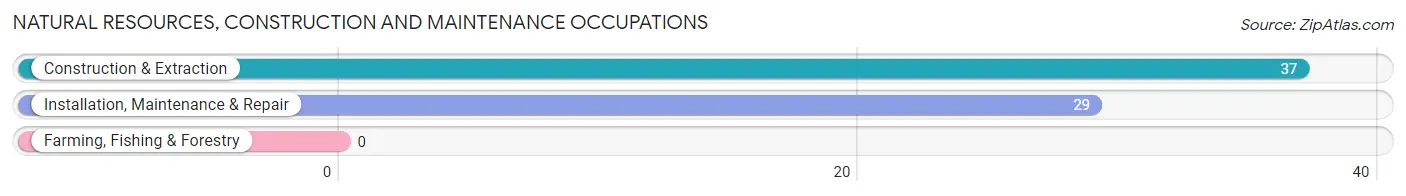
Natural Resources, Construction and Maintenance Occupations
The most common Natural Resources, Construction and Maintenance occupations in Prescott are Construction & Extraction (37 | 2.9%), and Installation, Maintenance & Repair (29 | 2.3%).
Natural Resources, Construction and Maintenance Occupations by Sex
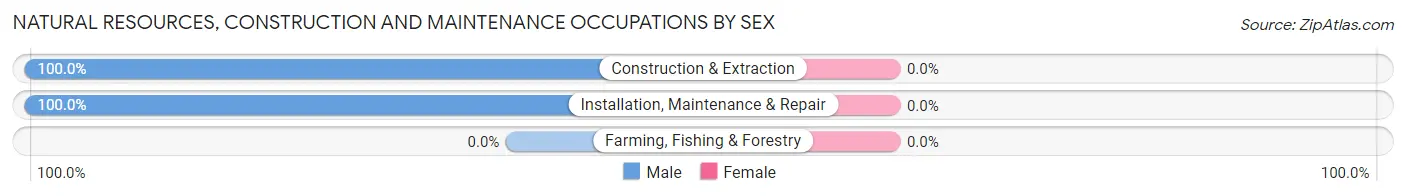
| Occupation | Male | Female |
| Farming, Fishing & Forestry | 0 (0.0%) | 0 (0.0%) |
| Construction & Extraction | 37 (100.0%) | 0 (0.0%) |
| Installation, Maintenance & Repair | 29 (100.0%) | 0 (0.0%) |
| Total (Category) | 66 (100.0%) | 0 (0.0%) |
| Total (Overall) | 644 (51.2%) | 613 (48.8%) |
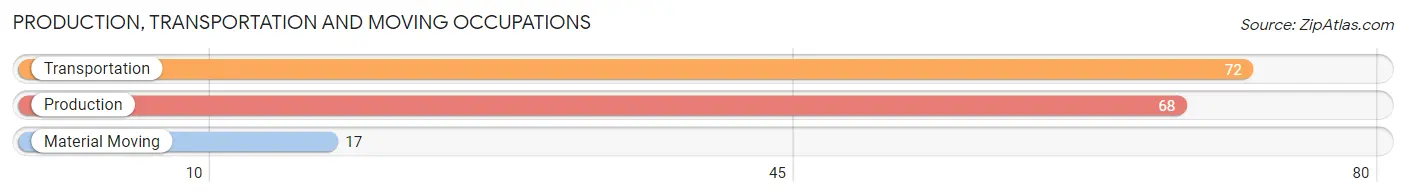
Production, Transportation and Moving Occupations
The most common Production, Transportation and Moving occupations in Prescott are Transportation (72 | 5.7%), Production (68 | 5.4%), and Material Moving (17 | 1.3%).
Production, Transportation and Moving Occupations by Sex
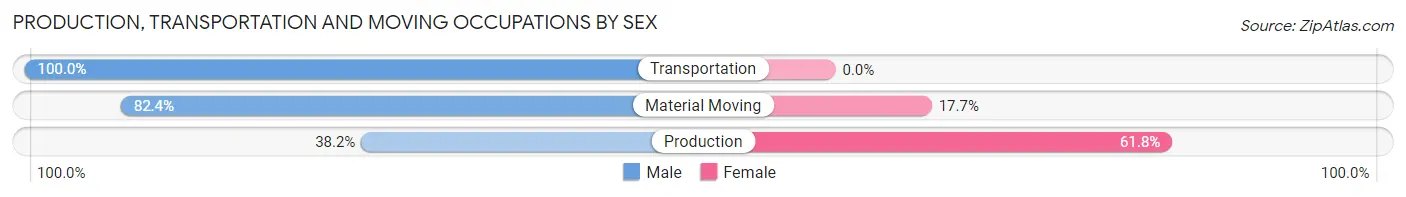
| Occupation | Male | Female |
| Production | 26 (38.2%) | 42 (61.8%) |
| Transportation | 72 (100.0%) | 0 (0.0%) |
| Material Moving | 14 (82.4%) | 3 (17.6%) |
| Total (Category) | 112 (71.3%) | 45 (28.7%) |
| Total (Overall) | 644 (51.2%) | 613 (48.8%) |
Employment Industries by Sex in Prescott
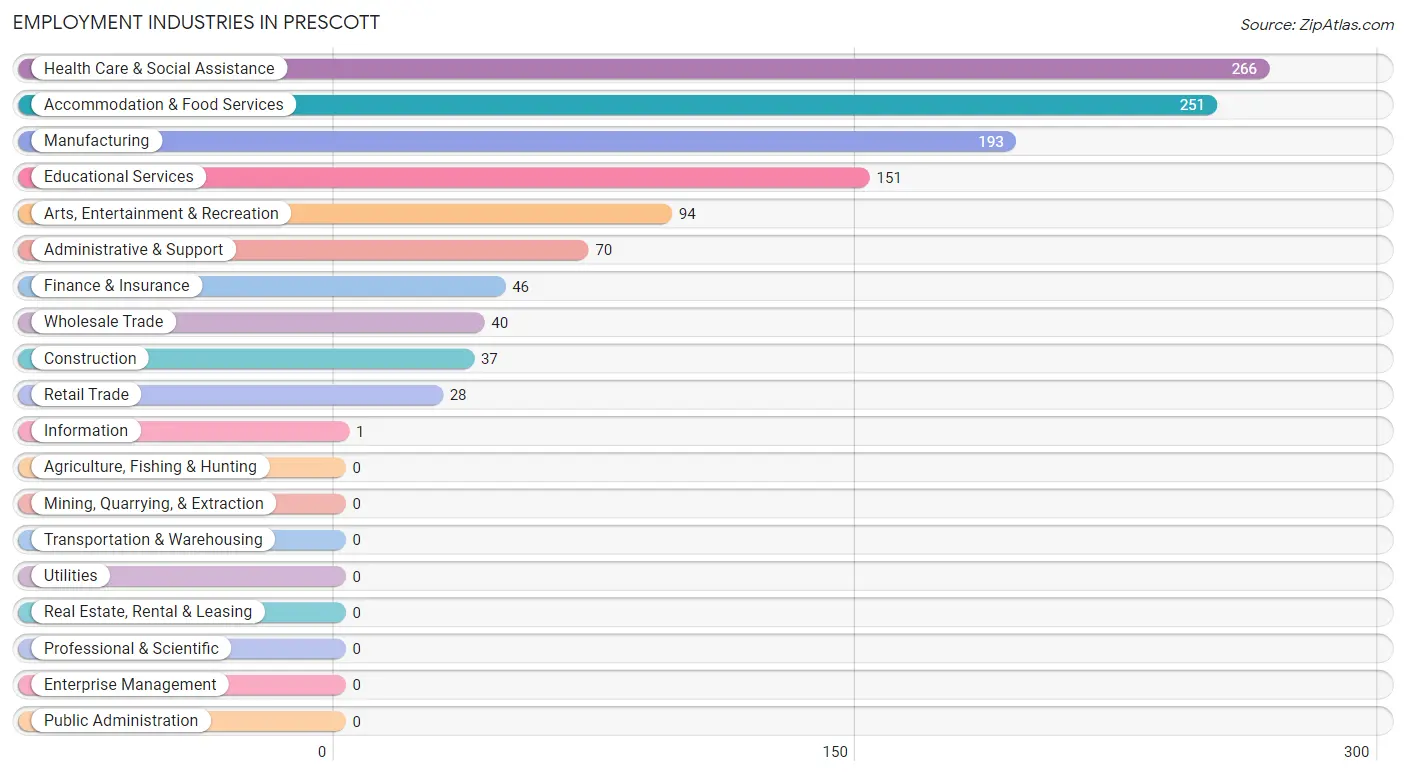
Employment Industries in Prescott
The major employment industries in Prescott include Health Care & Social Assistance (266 | 21.2%), Accommodation & Food Services (251 | 20.0%), Manufacturing (193 | 15.3%), Educational Services (151 | 12.0%), and Arts, Entertainment & Recreation (94 | 7.5%).
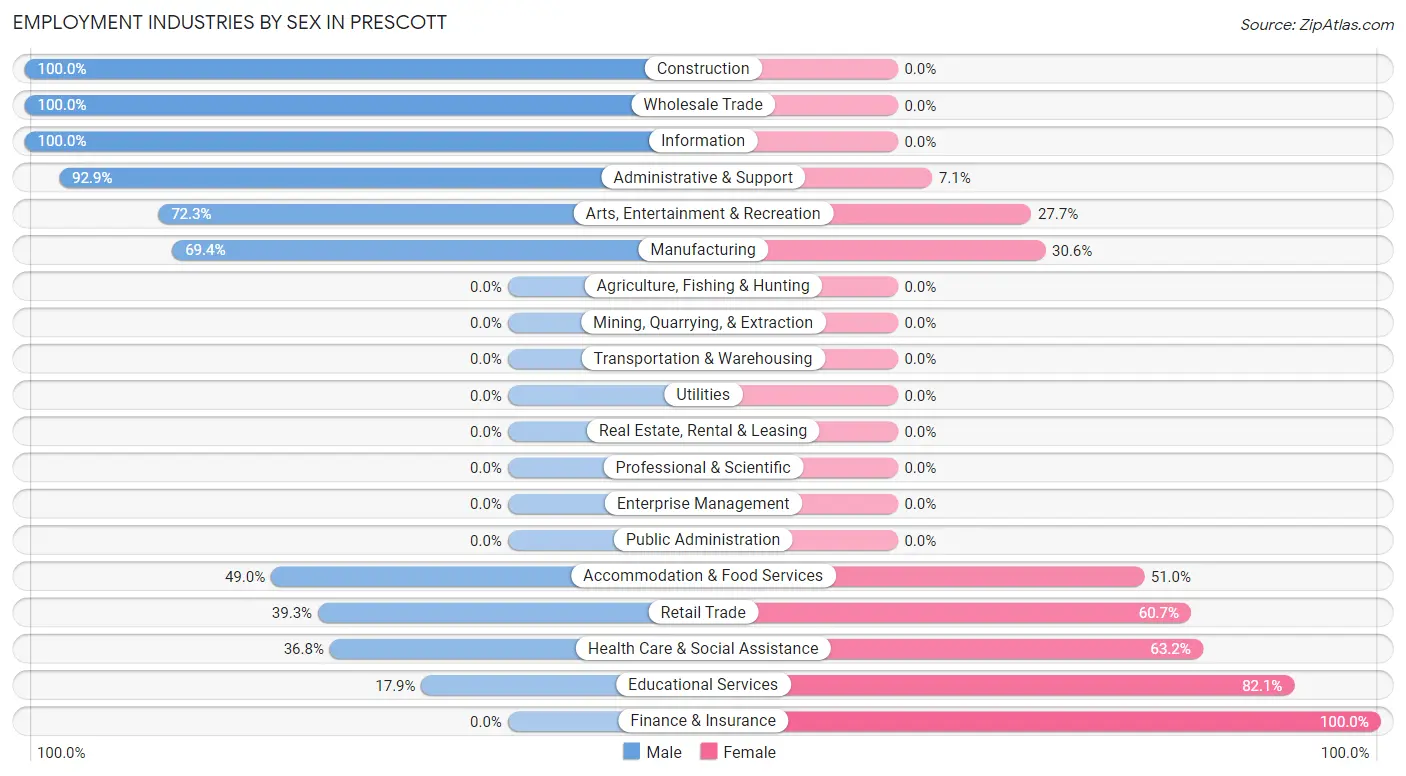
Employment Industries by Sex in Prescott
The Prescott industries that see more men than women are Construction (100.0%), Wholesale Trade (100.0%), and Information (100.0%), whereas the industries that tend to have a higher number of women are Finance & Insurance (100.0%), Educational Services (82.1%), and Health Care & Social Assistance (63.2%).
| Industry | Male | Female |
| Agriculture, Fishing & Hunting | 0 (0.0%) | 0 (0.0%) |
| Mining, Quarrying, & Extraction | 0 (0.0%) | 0 (0.0%) |
| Construction | 37 (100.0%) | 0 (0.0%) |
| Manufacturing | 134 (69.4%) | 59 (30.6%) |
| Wholesale Trade | 40 (100.0%) | 0 (0.0%) |
| Retail Trade | 11 (39.3%) | 17 (60.7%) |
| Transportation & Warehousing | 0 (0.0%) | 0 (0.0%) |
| Utilities | 0 (0.0%) | 0 (0.0%) |
| Information | 1 (100.0%) | 0 (0.0%) |
| Finance & Insurance | 0 (0.0%) | 46 (100.0%) |
| Real Estate, Rental & Leasing | 0 (0.0%) | 0 (0.0%) |
| Professional & Scientific | 0 (0.0%) | 0 (0.0%) |
| Enterprise Management | 0 (0.0%) | 0 (0.0%) |
| Administrative & Support | 65 (92.9%) | 5 (7.1%) |
| Educational Services | 27 (17.9%) | 124 (82.1%) |
| Health Care & Social Assistance | 98 (36.8%) | 168 (63.2%) |
| Arts, Entertainment & Recreation | 68 (72.3%) | 26 (27.7%) |
| Accommodation & Food Services | 123 (49.0%) | 128 (51.0%) |
| Public Administration | 0 (0.0%) | 0 (0.0%) |
| Total | 644 (51.2%) | 613 (48.8%) |
Education in Prescott
School Enrollment in Prescott
The most common levels of schooling among the 754 students in Prescott are elementary school (363 | 48.1%), college / undergraduate (209 | 27.7%), and middle school (108 | 14.3%).
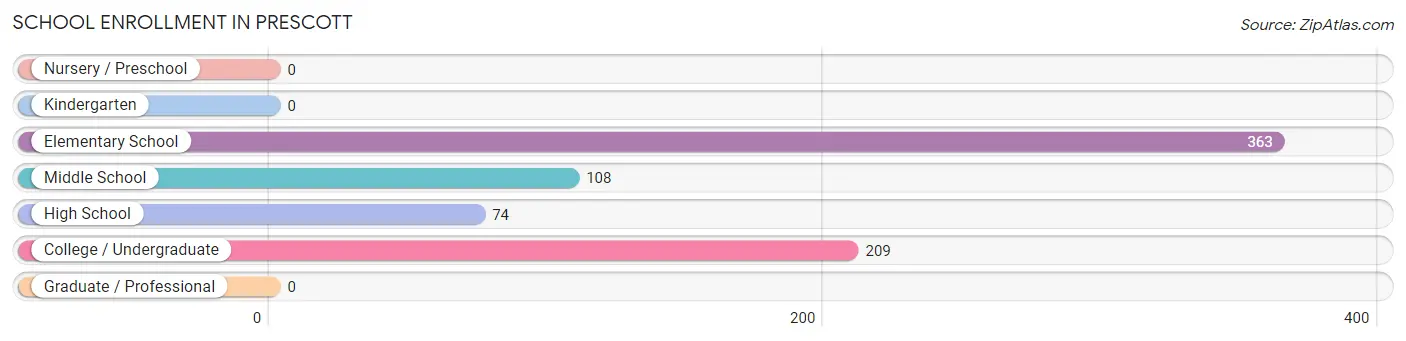
| School Level | # Students | % Students |
| Nursery / Preschool | 0 | 0.0% |
| Kindergarten | 0 | 0.0% |
| Elementary School | 363 | 48.1% |
| Middle School | 108 | 14.3% |
| High School | 74 | 9.8% |
| College / Undergraduate | 209 | 27.7% |
| Graduate / Professional | 0 | 0.0% |
| Total | 754 | 100.0% |
School Enrollment by Age by Funding Source in Prescott
Out of a total of 754 students who are enrolled in schools in Prescott, 115 (15.3%) attend a private institution, while the remaining 639 (84.7%) are enrolled in public schools. The age group of 15 to 17 year olds has the highest likelihood of being enrolled in private schools, with 32 (44.4% in the age bracket) enrolled. Conversely, the age group of 18 to 19 year olds has the lowest likelihood of being enrolled in a private school, with 39 (100.0% in the age bracket) attending a public institution.
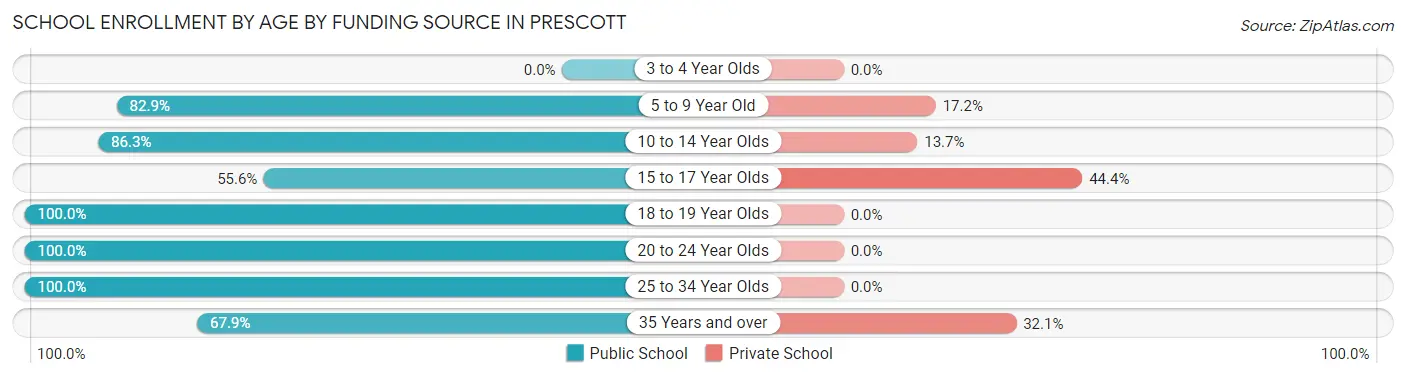
| Age Bracket | Public School | Private School |
| 3 to 4 Year Olds | 0 (0.0%) | 0 (0.0%) |
| 5 to 9 Year Old | 227 (82.9%) | 47 (17.2%) |
| 10 to 14 Year Olds | 170 (86.3%) | 27 (13.7%) |
| 15 to 17 Year Olds | 40 (55.6%) | 32 (44.4%) |
| 18 to 19 Year Olds | 39 (100.0%) | 0 (0.0%) |
| 20 to 24 Year Olds | 125 (100.0%) | 0 (0.0%) |
| 25 to 34 Year Olds | 19 (100.0%) | 0 (0.0%) |
| 35 Years and over | 19 (67.9%) | 9 (32.1%) |
| Total | 639 (84.7%) | 115 (15.3%) |
Educational Attainment by Field of Study in Prescott
Education (79 | 44.4%), visual & performing arts (40 | 22.5%), psychology (32 | 18.0%), liberal arts & history (19 | 10.7%), and physical & health sciences (4 | 2.2%) are the most common fields of study among 178 individuals in Prescott who have obtained a bachelor's degree or higher.
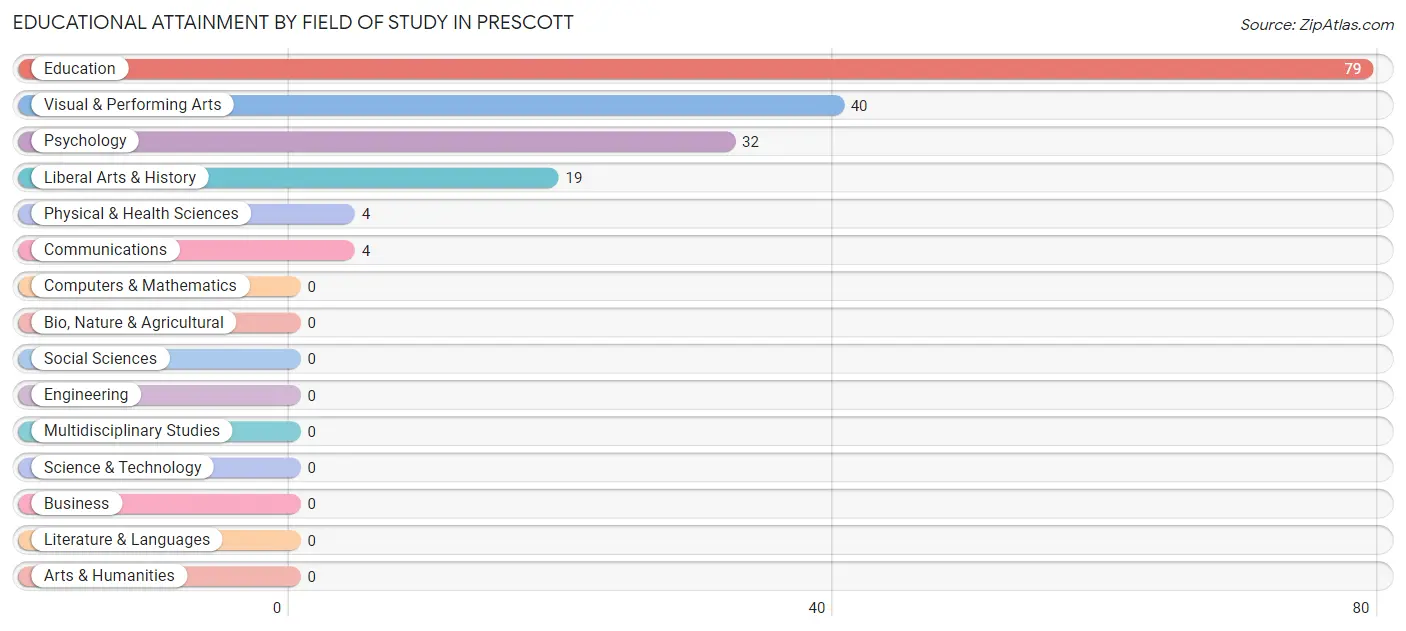
| Field of Study | # Graduates | % Graduates |
| Computers & Mathematics | 0 | 0.0% |
| Bio, Nature & Agricultural | 0 | 0.0% |
| Physical & Health Sciences | 4 | 2.2% |
| Psychology | 32 | 18.0% |
| Social Sciences | 0 | 0.0% |
| Engineering | 0 | 0.0% |
| Multidisciplinary Studies | 0 | 0.0% |
| Science & Technology | 0 | 0.0% |
| Business | 0 | 0.0% |
| Education | 79 | 44.4% |
| Literature & Languages | 0 | 0.0% |
| Liberal Arts & History | 19 | 10.7% |
| Visual & Performing Arts | 40 | 22.5% |
| Communications | 4 | 2.2% |
| Arts & Humanities | 0 | 0.0% |
| Total | 178 | 100.0% |
Transportation & Commute in Prescott
Vehicle Availability by Sex in Prescott
The most prevalent vehicle ownership categories in Prescott are males with 1 vehicle (200, accounting for 31.4%) and females with 1 vehicle (296, making up 32.9%).
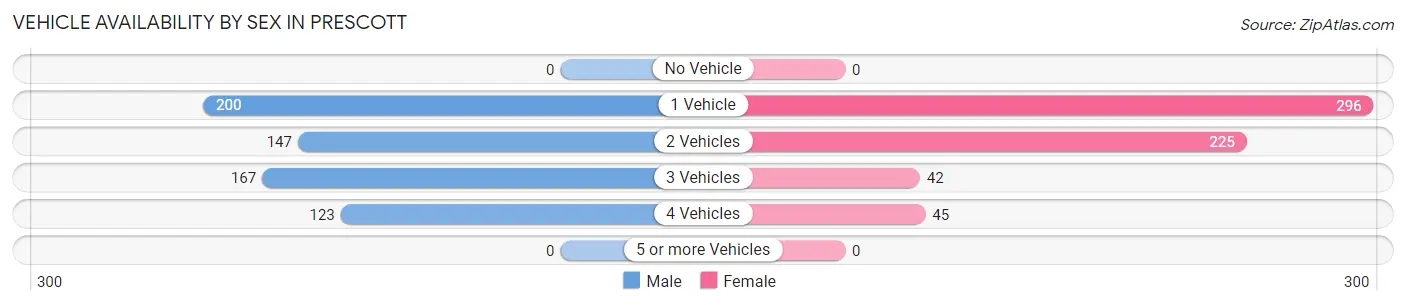
| Vehicles Available | Male | Female |
| No Vehicle | 0 (0.0%) | 0 (0.0%) |
| 1 Vehicle | 200 (31.4%) | 296 (48.7%) |
| 2 Vehicles | 147 (23.1%) | 225 (37.0%) |
| 3 Vehicles | 167 (26.2%) | 42 (6.9%) |
| 4 Vehicles | 123 (19.3%) | 45 (7.4%) |
| 5 or more Vehicles | 0 (0.0%) | 0 (0.0%) |
| Total | 637 (100.0%) | 608 (100.0%) |
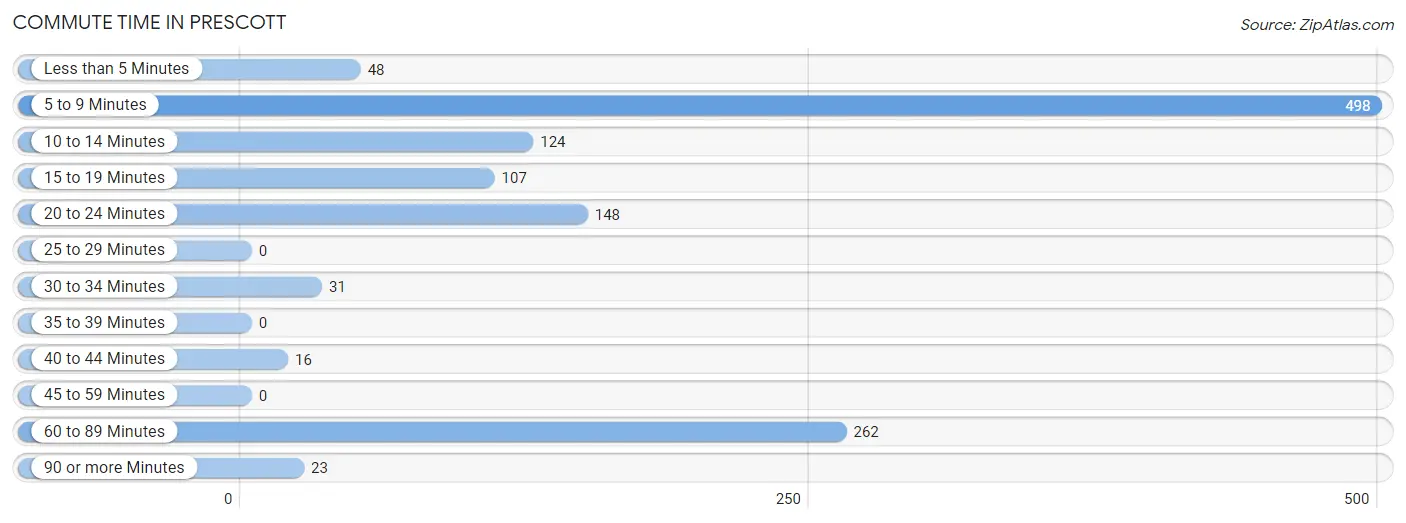
Commute Time in Prescott
The most frequently occuring commute durations in Prescott are 5 to 9 minutes (498 commuters, 39.6%), 60 to 89 minutes (262 commuters, 20.8%), and 20 to 24 minutes (148 commuters, 11.8%).
| Commute Time | # Commuters | % Commuters |
| Less than 5 Minutes | 48 | 3.8% |
| 5 to 9 Minutes | 498 | 39.6% |
| 10 to 14 Minutes | 124 | 9.9% |
| 15 to 19 Minutes | 107 | 8.5% |
| 20 to 24 Minutes | 148 | 11.8% |
| 25 to 29 Minutes | 0 | 0.0% |
| 30 to 34 Minutes | 31 | 2.5% |
| 35 to 39 Minutes | 0 | 0.0% |
| 40 to 44 Minutes | 16 | 1.3% |
| 45 to 59 Minutes | 0 | 0.0% |
| 60 to 89 Minutes | 262 | 20.8% |
| 90 or more Minutes | 23 | 1.8% |
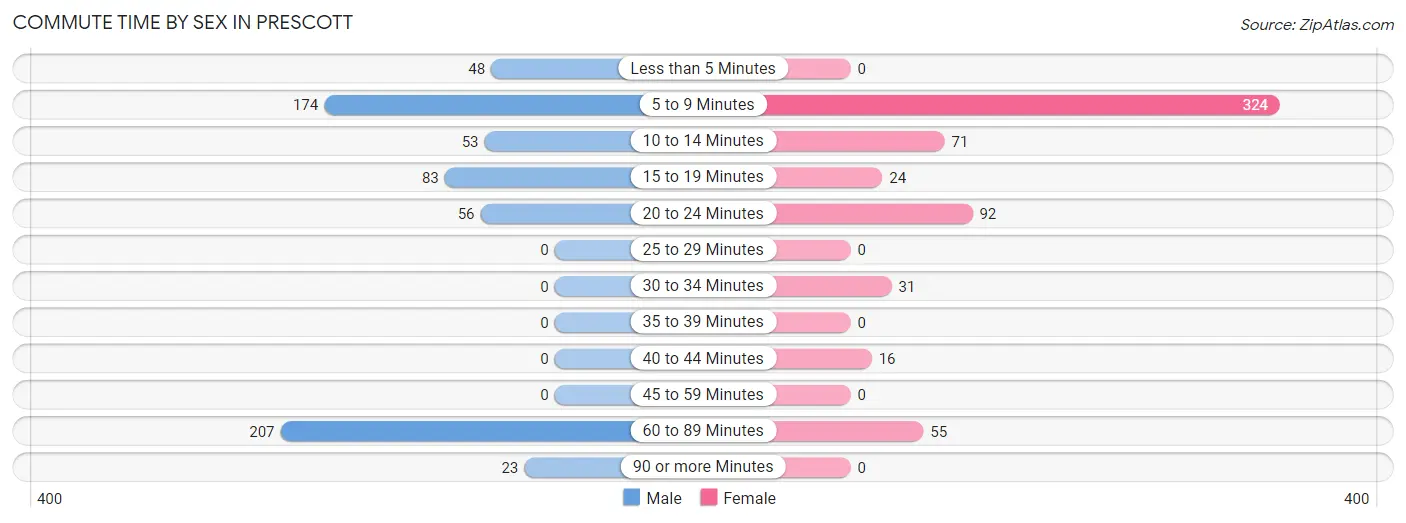
Commute Time by Sex in Prescott
The most common commute times in Prescott are 60 to 89 minutes (207 commuters, 32.1%) for males and 5 to 9 minutes (324 commuters, 52.8%) for females.
| Commute Time | Male | Female |
| Less than 5 Minutes | 48 (7.4%) | 0 (0.0%) |
| 5 to 9 Minutes | 174 (27.0%) | 324 (52.8%) |
| 10 to 14 Minutes | 53 (8.2%) | 71 (11.6%) |
| 15 to 19 Minutes | 83 (12.9%) | 24 (3.9%) |
| 20 to 24 Minutes | 56 (8.7%) | 92 (15.0%) |
| 25 to 29 Minutes | 0 (0.0%) | 0 (0.0%) |
| 30 to 34 Minutes | 0 (0.0%) | 31 (5.1%) |
| 35 to 39 Minutes | 0 (0.0%) | 0 (0.0%) |
| 40 to 44 Minutes | 0 (0.0%) | 16 (2.6%) |
| 45 to 59 Minutes | 0 (0.0%) | 0 (0.0%) |
| 60 to 89 Minutes | 207 (32.1%) | 55 (9.0%) |
| 90 or more Minutes | 23 (3.6%) | 0 (0.0%) |
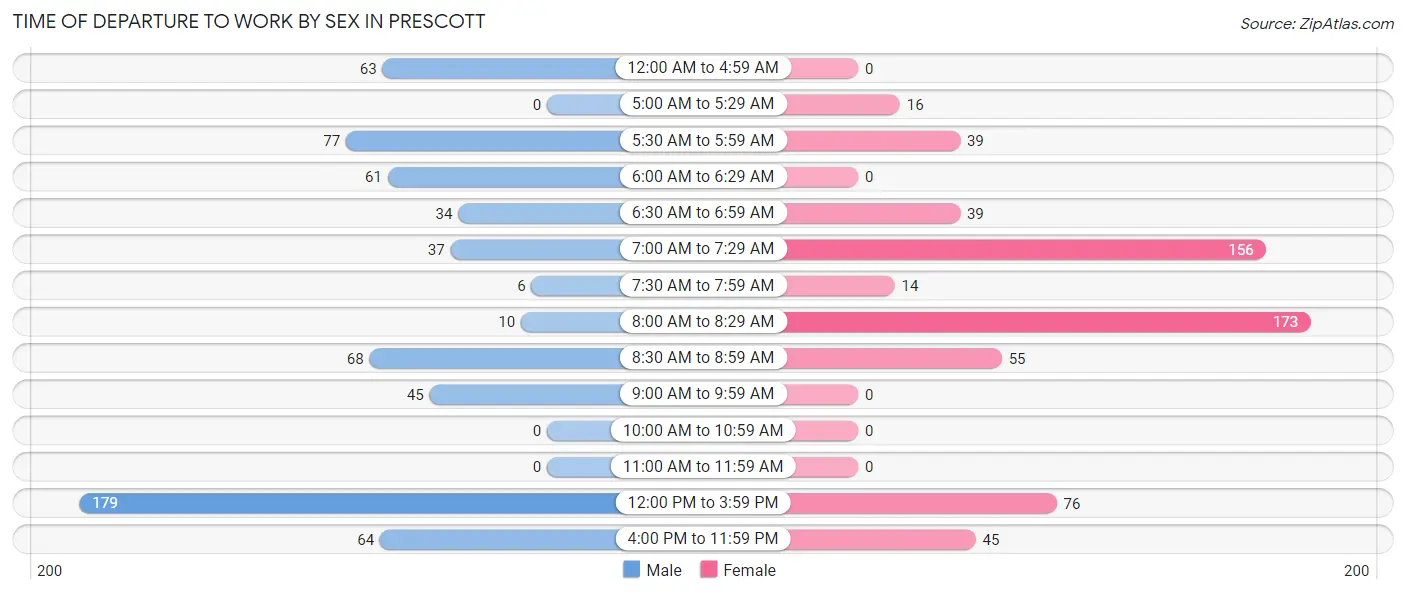
Time of Departure to Work by Sex in Prescott
The most frequent times of departure to work in Prescott are 12:00 PM to 3:59 PM (179, 27.8%) for males and 8:00 AM to 8:29 AM (173, 28.2%) for females.
| Time of Departure | Male | Female |
| 12:00 AM to 4:59 AM | 63 (9.8%) | 0 (0.0%) |
| 5:00 AM to 5:29 AM | 0 (0.0%) | 16 (2.6%) |
| 5:30 AM to 5:59 AM | 77 (12.0%) | 39 (6.4%) |
| 6:00 AM to 6:29 AM | 61 (9.5%) | 0 (0.0%) |
| 6:30 AM to 6:59 AM | 34 (5.3%) | 39 (6.4%) |
| 7:00 AM to 7:29 AM | 37 (5.8%) | 156 (25.5%) |
| 7:30 AM to 7:59 AM | 6 (0.9%) | 14 (2.3%) |
| 8:00 AM to 8:29 AM | 10 (1.5%) | 173 (28.2%) |
| 8:30 AM to 8:59 AM | 68 (10.6%) | 55 (9.0%) |
| 9:00 AM to 9:59 AM | 45 (7.0%) | 0 (0.0%) |
| 10:00 AM to 10:59 AM | 0 (0.0%) | 0 (0.0%) |
| 11:00 AM to 11:59 AM | 0 (0.0%) | 0 (0.0%) |
| 12:00 PM to 3:59 PM | 179 (27.8%) | 76 (12.4%) |
| 4:00 PM to 11:59 PM | 64 (9.9%) | 45 (7.3%) |
| Total | 644 (100.0%) | 613 (100.0%) |
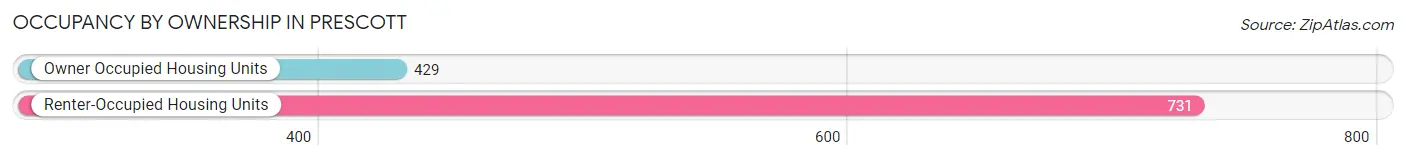
Housing Occupancy in Prescott
Occupancy by Ownership in Prescott
Of the total 1,160 dwellings in Prescott, owner-occupied units account for 429 (37.0%), while renter-occupied units make up 731 (63.0%).
| Occupancy | # Housing Units | % Housing Units |
| Owner Occupied Housing Units | 429 | 37.0% |
| Renter-Occupied Housing Units | 731 | 63.0% |
| Total Occupied Housing Units | 1,160 | 100.0% |
Occupancy by Household Size in Prescott
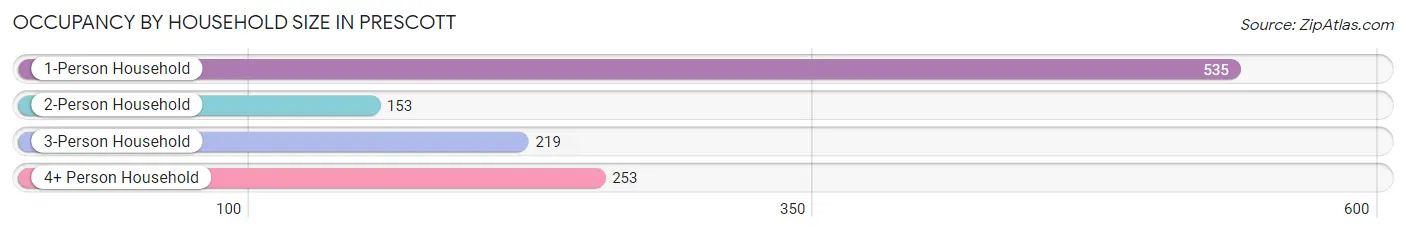
| Household Size | # Housing Units | % Housing Units |
| 1-Person Household | 535 | 46.1% |
| 2-Person Household | 153 | 13.2% |
| 3-Person Household | 219 | 18.9% |
| 4+ Person Household | 253 | 21.8% |
| Total Housing Units | 1,160 | 100.0% |
Occupancy by Ownership by Household Size in Prescott
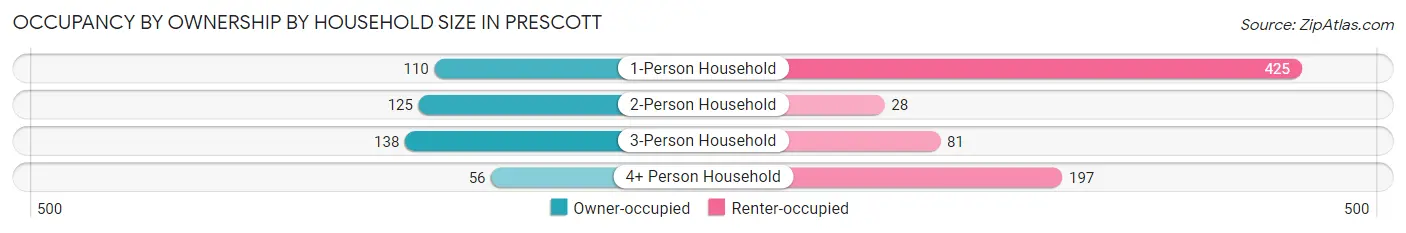
| Household Size | Owner-occupied | Renter-occupied |
| 1-Person Household | 110 (20.6%) | 425 (79.4%) |
| 2-Person Household | 125 (81.7%) | 28 (18.3%) |
| 3-Person Household | 138 (63.0%) | 81 (37.0%) |
| 4+ Person Household | 56 (22.1%) | 197 (77.9%) |
| Total Housing Units | 429 (37.0%) | 731 (63.0%) |
Occupancy by Educational Attainment in Prescott
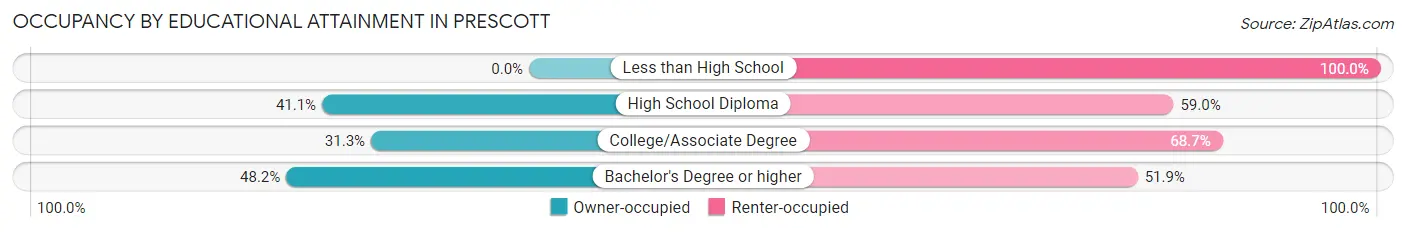
| Household Size | Owner-occupied | Renter-occupied |
| Less than High School | 0 (0.0%) | 59 (100.0%) |
| High School Diploma | 259 (41.0%) | 372 (59.0%) |
| College/Associate Degree | 105 (31.3%) | 230 (68.7%) |
| Bachelor's Degree or higher | 65 (48.1%) | 70 (51.8%) |
Occupancy by Age of Householder in Prescott
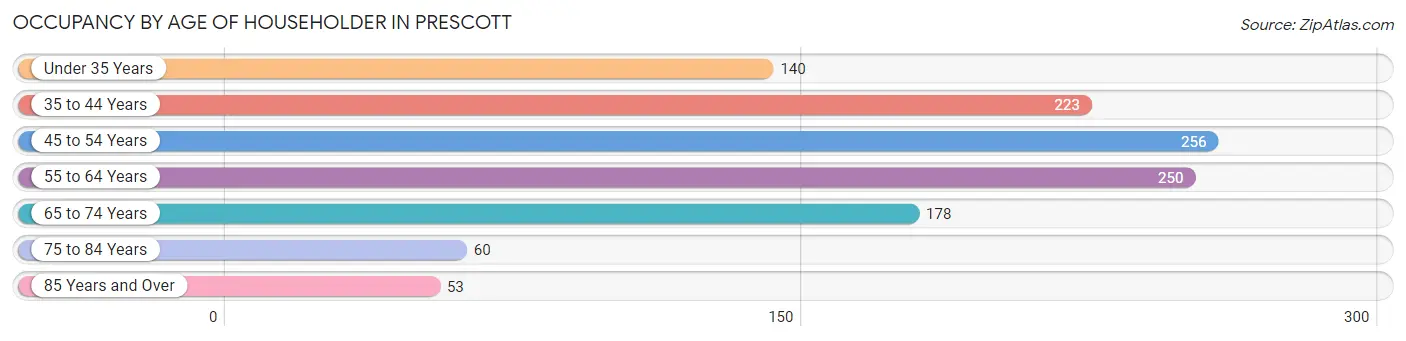
| Age Bracket | # Households | % Households |
| Under 35 Years | 140 | 12.1% |
| 35 to 44 Years | 223 | 19.2% |
| 45 to 54 Years | 256 | 22.1% |
| 55 to 64 Years | 250 | 21.5% |
| 65 to 74 Years | 178 | 15.3% |
| 75 to 84 Years | 60 | 5.2% |
| 85 Years and Over | 53 | 4.6% |
| Total | 1,160 | 100.0% |
Housing Finances in Prescott
Median Income by Occupancy in Prescott
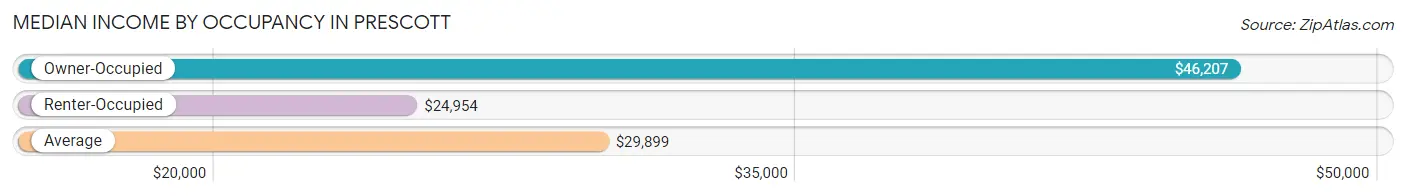
| Occupancy Type | # Households | Median Income |
| Owner-Occupied | 429 (37.0%) | $46,207 |
| Renter-Occupied | 731 (63.0%) | $24,954 |
| Average | 1,160 (100.0%) | $29,899 |
Occupancy by Householder Income Bracket in Prescott
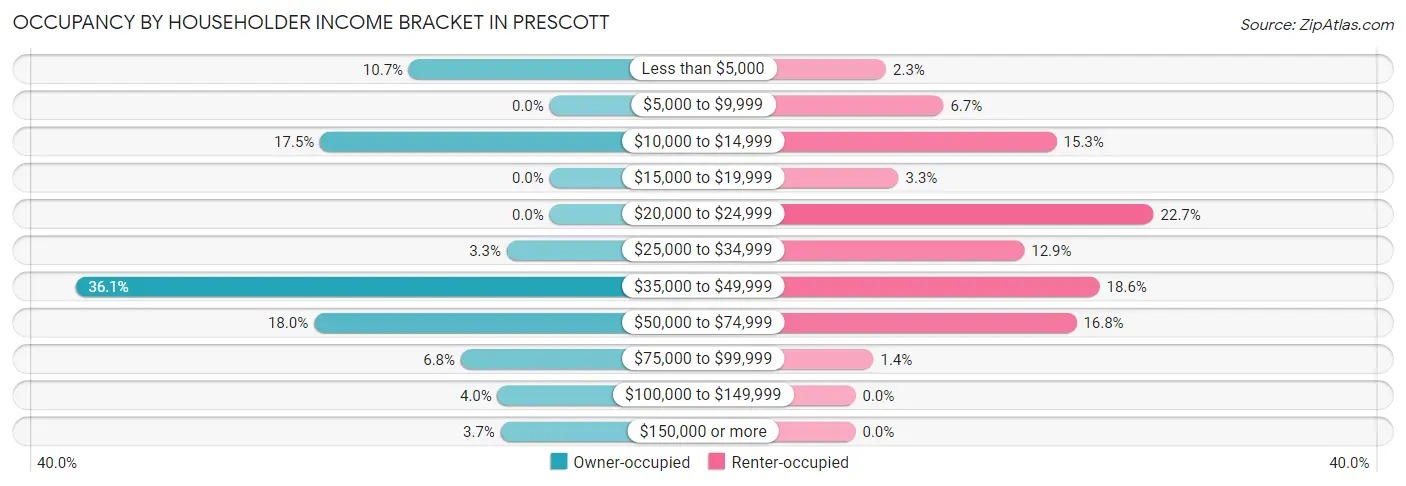
| Income Bracket | Owner-occupied | Renter-occupied |
| Less than $5,000 | 46 (10.7%) | 17 (2.3%) |
| $5,000 to $9,999 | 0 (0.0%) | 49 (6.7%) |
| $10,000 to $14,999 | 75 (17.5%) | 112 (15.3%) |
| $15,000 to $19,999 | 0 (0.0%) | 24 (3.3%) |
| $20,000 to $24,999 | 0 (0.0%) | 166 (22.7%) |
| $25,000 to $34,999 | 14 (3.3%) | 94 (12.9%) |
| $35,000 to $49,999 | 155 (36.1%) | 136 (18.6%) |
| $50,000 to $74,999 | 77 (17.9%) | 123 (16.8%) |
| $75,000 to $99,999 | 29 (6.8%) | 10 (1.4%) |
| $100,000 to $149,999 | 17 (4.0%) | 0 (0.0%) |
| $150,000 or more | 16 (3.7%) | 0 (0.0%) |
| Total | 429 (100.0%) | 731 (100.0%) |
Monthly Housing Cost Tiers in Prescott
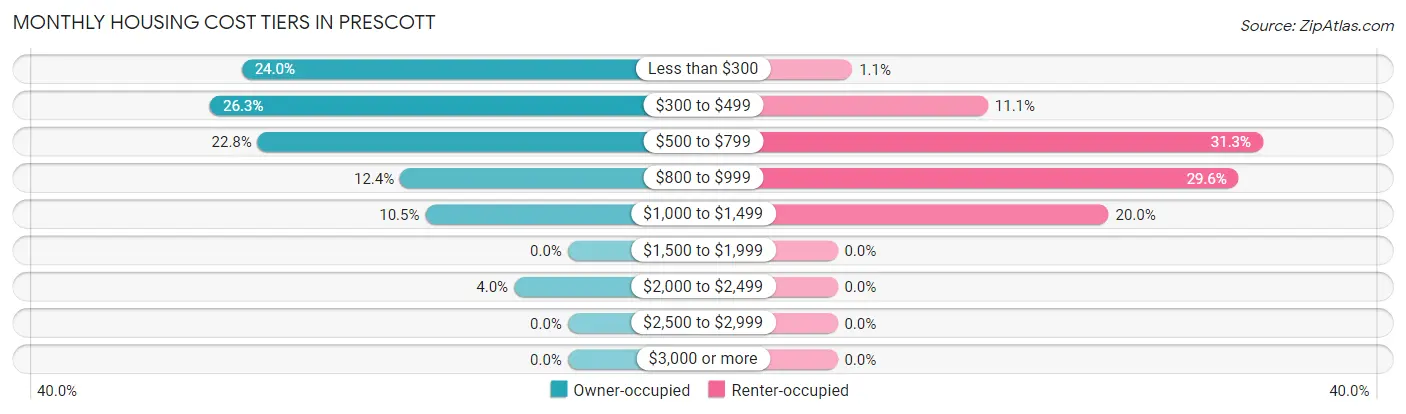
| Monthly Cost | Owner-occupied | Renter-occupied |
| Less than $300 | 103 (24.0%) | 8 (1.1%) |
| $300 to $499 | 113 (26.3%) | 81 (11.1%) |
| $500 to $799 | 98 (22.8%) | 229 (31.3%) |
| $800 to $999 | 53 (12.3%) | 216 (29.5%) |
| $1,000 to $1,499 | 45 (10.5%) | 146 (20.0%) |
| $1,500 to $1,999 | 0 (0.0%) | 0 (0.0%) |
| $2,000 to $2,499 | 17 (4.0%) | 0 (0.0%) |
| $2,500 to $2,999 | 0 (0.0%) | 0 (0.0%) |
| $3,000 or more | 0 (0.0%) | 0 (0.0%) |
| Total | 429 (100.0%) | 731 (100.0%) |
Physical Housing Characteristics in Prescott
Housing Structures in Prescott
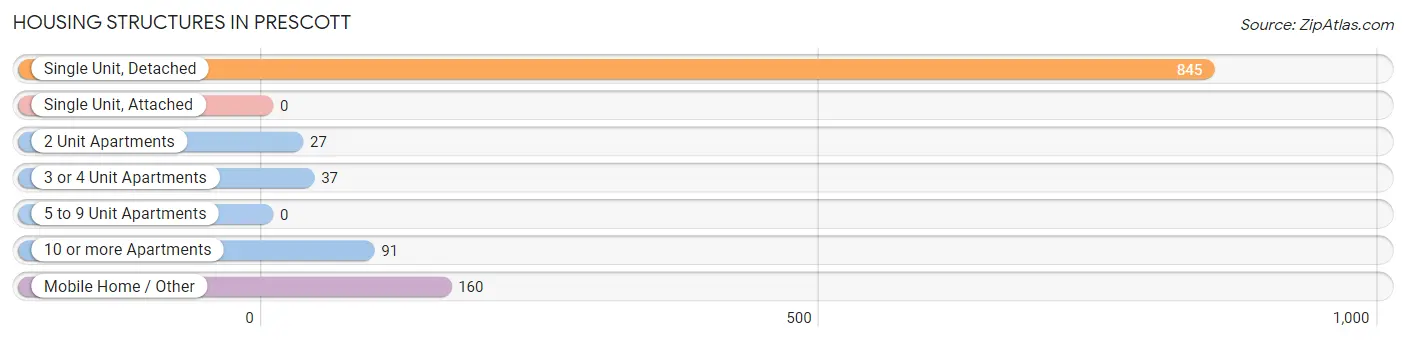
| Structure Type | # Housing Units | % Housing Units |
| Single Unit, Detached | 845 | 72.8% |
| Single Unit, Attached | 0 | 0.0% |
| 2 Unit Apartments | 27 | 2.3% |
| 3 or 4 Unit Apartments | 37 | 3.2% |
| 5 to 9 Unit Apartments | 0 | 0.0% |
| 10 or more Apartments | 91 | 7.8% |
| Mobile Home / Other | 160 | 13.8% |
| Total | 1,160 | 100.0% |
Housing Structures by Occupancy in Prescott
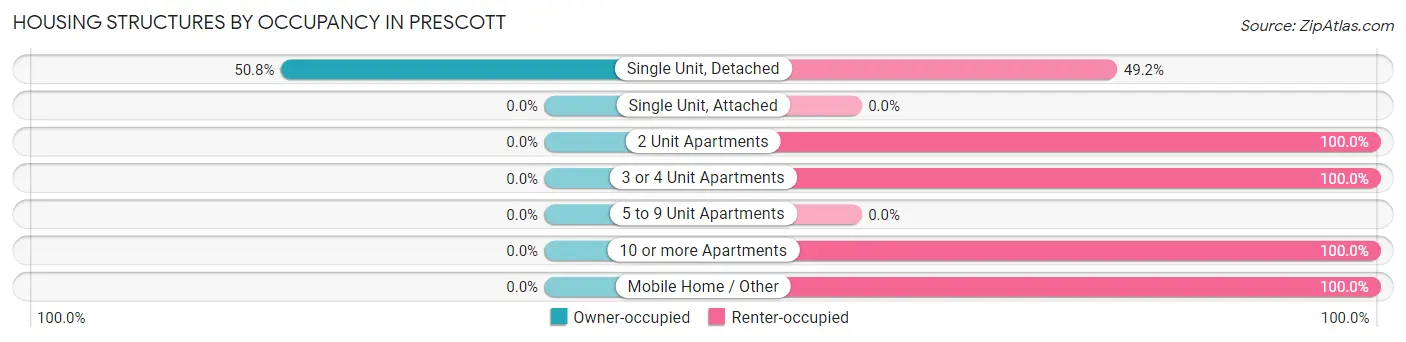
| Structure Type | Owner-occupied | Renter-occupied |
| Single Unit, Detached | 429 (50.8%) | 416 (49.2%) |
| Single Unit, Attached | 0 (0.0%) | 0 (0.0%) |
| 2 Unit Apartments | 0 (0.0%) | 27 (100.0%) |
| 3 or 4 Unit Apartments | 0 (0.0%) | 37 (100.0%) |
| 5 to 9 Unit Apartments | 0 (0.0%) | 0 (0.0%) |
| 10 or more Apartments | 0 (0.0%) | 91 (100.0%) |
| Mobile Home / Other | 0 (0.0%) | 160 (100.0%) |
| Total | 429 (37.0%) | 731 (63.0%) |
Housing Structures by Number of Rooms in Prescott
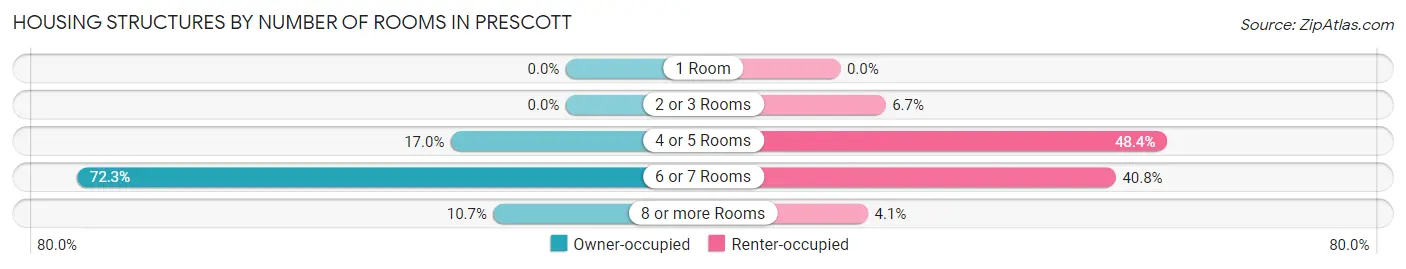
| Number of Rooms | Owner-occupied | Renter-occupied |
| 1 Room | 0 (0.0%) | 0 (0.0%) |
| 2 or 3 Rooms | 0 (0.0%) | 49 (6.7%) |
| 4 or 5 Rooms | 73 (17.0%) | 354 (48.4%) |
| 6 or 7 Rooms | 310 (72.3%) | 298 (40.8%) |
| 8 or more Rooms | 46 (10.7%) | 30 (4.1%) |
| Total | 429 (100.0%) | 731 (100.0%) |
Housing Structure by Heating Type in Prescott
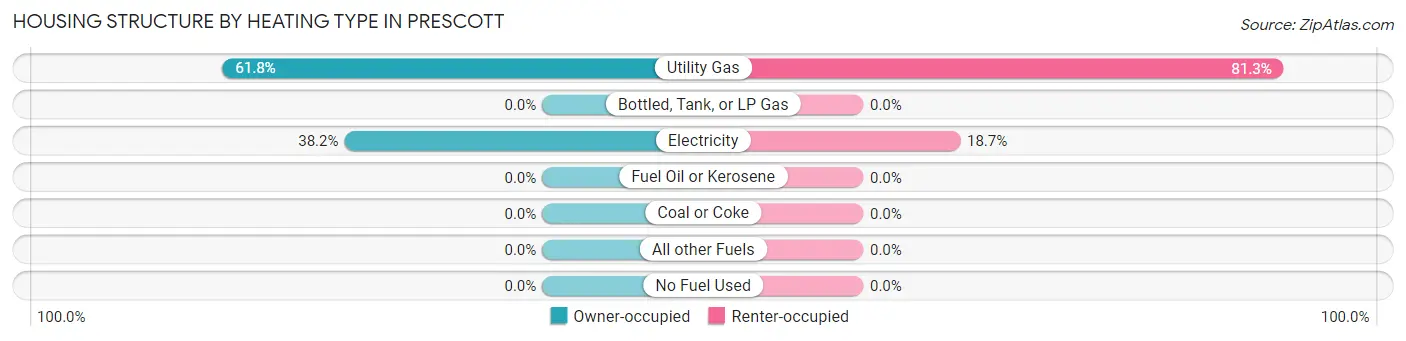
| Heating Type | Owner-occupied | Renter-occupied |
| Utility Gas | 265 (61.8%) | 594 (81.3%) |
| Bottled, Tank, or LP Gas | 0 (0.0%) | 0 (0.0%) |
| Electricity | 164 (38.2%) | 137 (18.7%) |
| Fuel Oil or Kerosene | 0 (0.0%) | 0 (0.0%) |
| Coal or Coke | 0 (0.0%) | 0 (0.0%) |
| All other Fuels | 0 (0.0%) | 0 (0.0%) |
| No Fuel Used | 0 (0.0%) | 0 (0.0%) |
| Total | 429 (100.0%) | 731 (100.0%) |
Household Vehicle Usage in Prescott
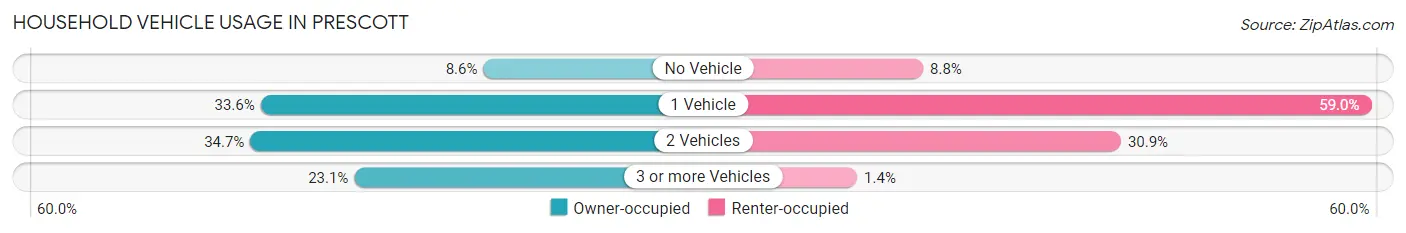
| Vehicles per Household | Owner-occupied | Renter-occupied |
| No Vehicle | 37 (8.6%) | 64 (8.8%) |
| 1 Vehicle | 144 (33.6%) | 431 (59.0%) |
| 2 Vehicles | 149 (34.7%) | 226 (30.9%) |
| 3 or more Vehicles | 99 (23.1%) | 10 (1.4%) |
| Total | 429 (100.0%) | 731 (100.0%) |
Real Estate & Mortgages in Prescott
Real Estate and Mortgage Overview in Prescott
| Characteristic | Without Mortgage | With Mortgage |
| Housing Units | 249 | 180 |
| Median Property Value | $92,600 | $95,700 |
| Median Household Income | $45,932 | $16 |
| Monthly Housing Costs | $397 | $0 |
| Real Estate Taxes | $492 | $29 |
Property Value by Mortgage Status in Prescott
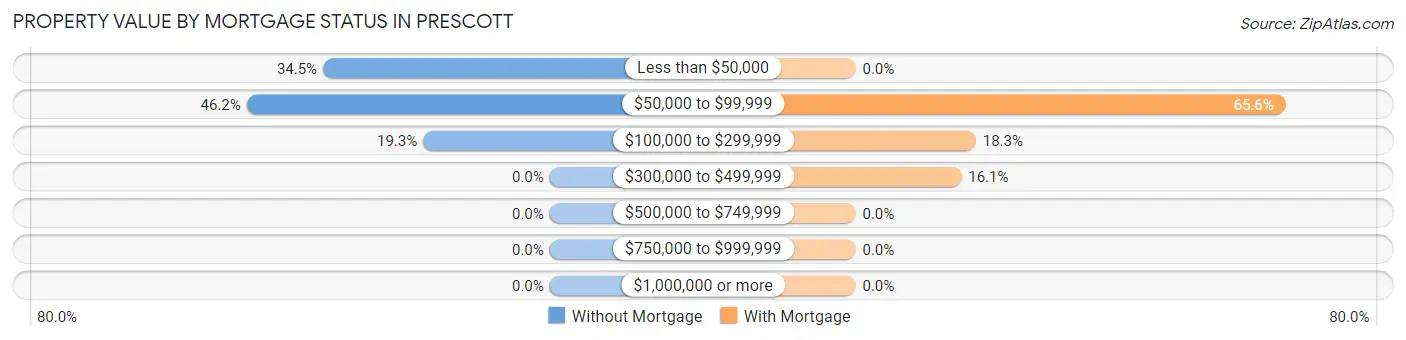
| Property Value | Without Mortgage | With Mortgage |
| Less than $50,000 | 86 (34.5%) | 0 (0.0%) |
| $50,000 to $99,999 | 115 (46.2%) | 118 (65.6%) |
| $100,000 to $299,999 | 48 (19.3%) | 33 (18.3%) |
| $300,000 to $499,999 | 0 (0.0%) | 29 (16.1%) |
| $500,000 to $749,999 | 0 (0.0%) | 0 (0.0%) |
| $750,000 to $999,999 | 0 (0.0%) | 0 (0.0%) |
| $1,000,000 or more | 0 (0.0%) | 0 (0.0%) |
| Total | 249 (100.0%) | 180 (100.0%) |
Household Income by Mortgage Status in Prescott
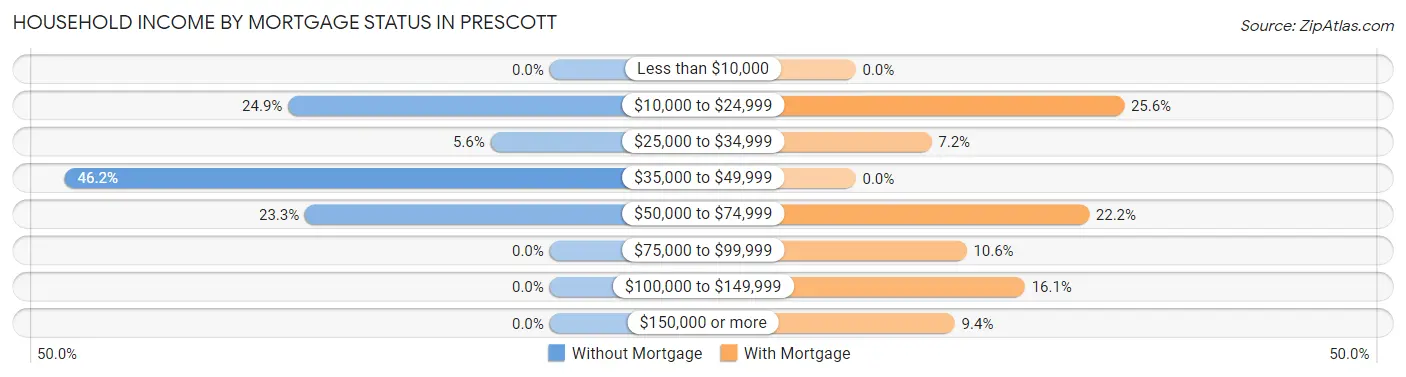
| Household Income | Without Mortgage | With Mortgage |
| Less than $10,000 | 0 (0.0%) | 0 (0.0%) |
| $10,000 to $24,999 | 62 (24.9%) | 46 (25.6%) |
| $25,000 to $34,999 | 14 (5.6%) | 13 (7.2%) |
| $35,000 to $49,999 | 115 (46.2%) | 0 (0.0%) |
| $50,000 to $74,999 | 58 (23.3%) | 40 (22.2%) |
| $75,000 to $99,999 | 0 (0.0%) | 19 (10.6%) |
| $100,000 to $149,999 | 0 (0.0%) | 29 (16.1%) |
| $150,000 or more | 0 (0.0%) | 17 (9.4%) |
| Total | 249 (100.0%) | 180 (100.0%) |
Property Value to Household Income Ratio in Prescott
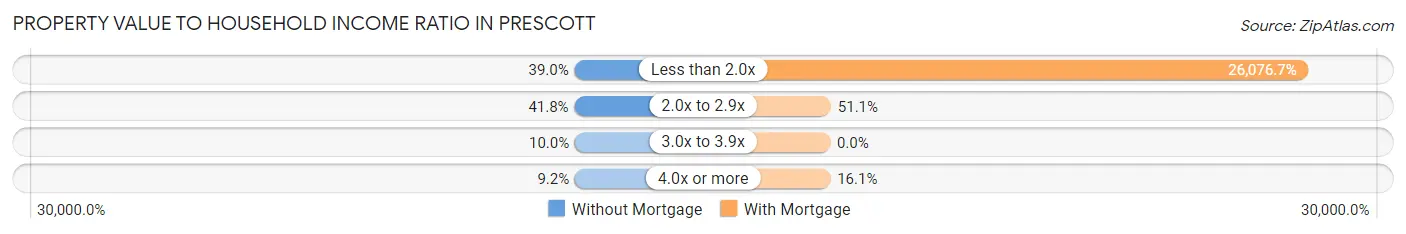
| Value-to-Income Ratio | Without Mortgage | With Mortgage |
| Less than 2.0x | 97 (39.0%) | 46,938 (26,076.7%) |
| 2.0x to 2.9x | 104 (41.8%) | 92 (51.1%) |
| 3.0x to 3.9x | 25 (10.0%) | 0 (0.0%) |
| 4.0x or more | 23 (9.2%) | 29 (16.1%) |
| Total | 249 (100.0%) | 180 (100.0%) |
Real Estate Taxes by Mortgage Status in Prescott
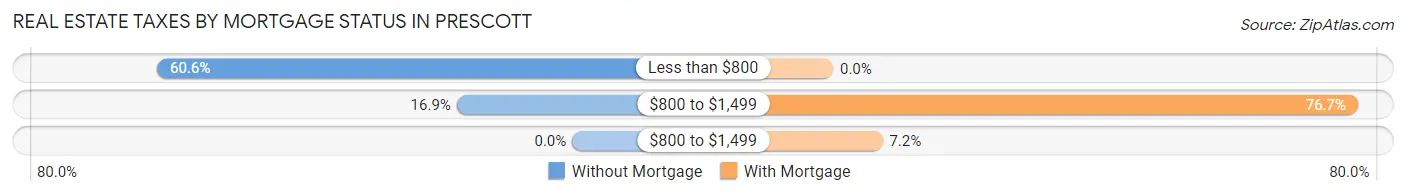
| Property Taxes | Without Mortgage | With Mortgage |
| Less than $800 | 151 (60.6%) | 0 (0.0%) |
| $800 to $1,499 | 42 (16.9%) | 138 (76.7%) |
| $800 to $1,499 | 0 (0.0%) | 13 (7.2%) |
| Total | 249 (100.0%) | 180 (100.0%) |
Health & Disability in Prescott
Health Insurance Coverage by Age in Prescott
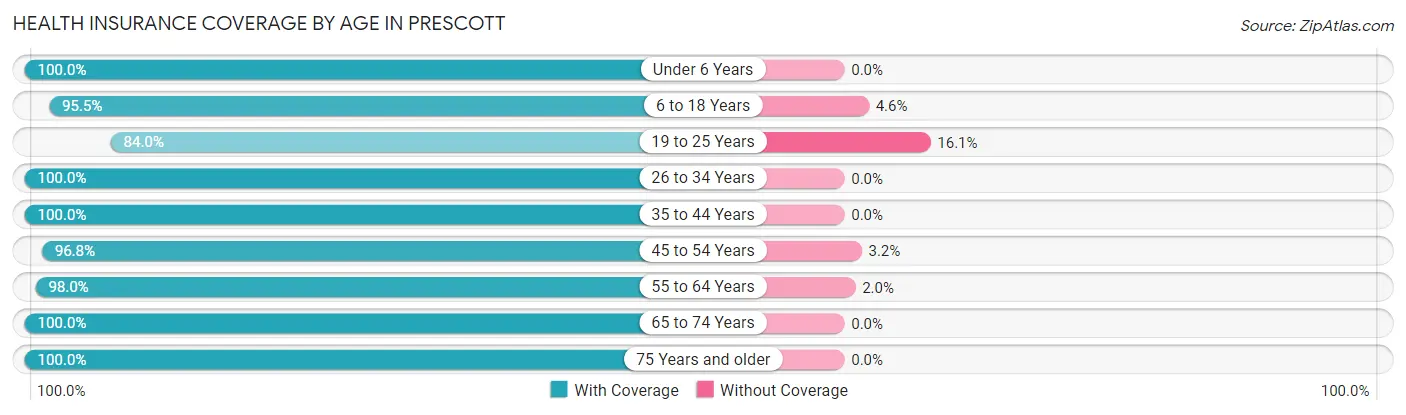
| Age Bracket | With Coverage | Without Coverage |
| Under 6 Years | 187 (100.0%) | 0 (0.0%) |
| 6 to 18 Years | 545 (95.5%) | 26 (4.5%) |
| 19 to 25 Years | 455 (84.0%) | 87 (16.1%) |
| 26 to 34 Years | 180 (100.0%) | 0 (0.0%) |
| 35 to 44 Years | 308 (100.0%) | 0 (0.0%) |
| 45 to 54 Years | 302 (96.8%) | 10 (3.2%) |
| 55 to 64 Years | 434 (98.0%) | 9 (2.0%) |
| 65 to 74 Years | 231 (100.0%) | 0 (0.0%) |
| 75 Years and older | 139 (100.0%) | 0 (0.0%) |
| Total | 2,781 (95.5%) | 132 (4.5%) |
Health Insurance Coverage by Citizenship Status in Prescott
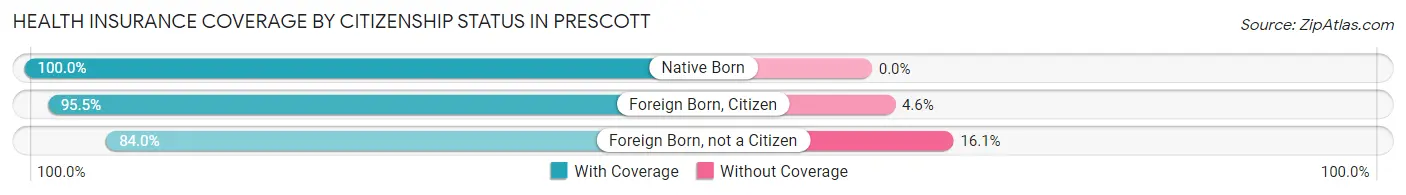
| Citizenship Status | With Coverage | Without Coverage |
| Native Born | 187 (100.0%) | 0 (0.0%) |
| Foreign Born, Citizen | 545 (95.5%) | 26 (4.5%) |
| Foreign Born, not a Citizen | 455 (84.0%) | 87 (16.1%) |
Health Insurance Coverage by Household Income in Prescott
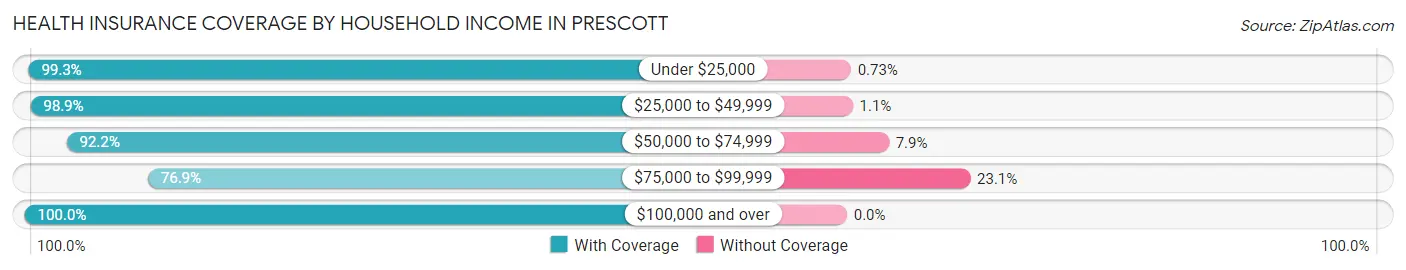
| Household Income | With Coverage | Without Coverage |
| Under $25,000 | 1,088 (99.3%) | 8 (0.7%) |
| $25,000 to $49,999 | 814 (98.9%) | 9 (1.1%) |
| $50,000 to $74,999 | 528 (92.1%) | 45 (7.9%) |
| $75,000 to $99,999 | 233 (76.9%) | 70 (23.1%) |
| $100,000 and over | 99 (100.0%) | 0 (0.0%) |
Public vs Private Health Insurance Coverage by Age in Prescott
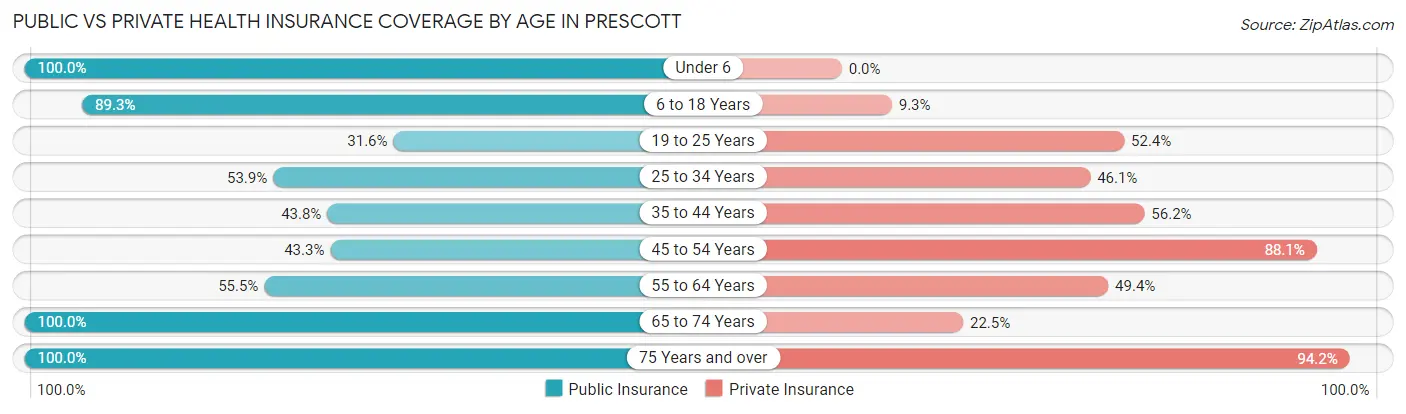
| Age Bracket | Public Insurance | Private Insurance |
| Under 6 | 187 (100.0%) | 0 (0.0%) |
| 6 to 18 Years | 510 (89.3%) | 53 (9.3%) |
| 19 to 25 Years | 171 (31.6%) | 284 (52.4%) |
| 25 to 34 Years | 97 (53.9%) | 83 (46.1%) |
| 35 to 44 Years | 135 (43.8%) | 173 (56.2%) |
| 45 to 54 Years | 135 (43.3%) | 275 (88.1%) |
| 55 to 64 Years | 246 (55.5%) | 219 (49.4%) |
| 65 to 74 Years | 231 (100.0%) | 52 (22.5%) |
| 75 Years and over | 139 (100.0%) | 131 (94.2%) |
| Total | 1,851 (63.5%) | 1,270 (43.6%) |
Disability Status by Sex by Age in Prescott
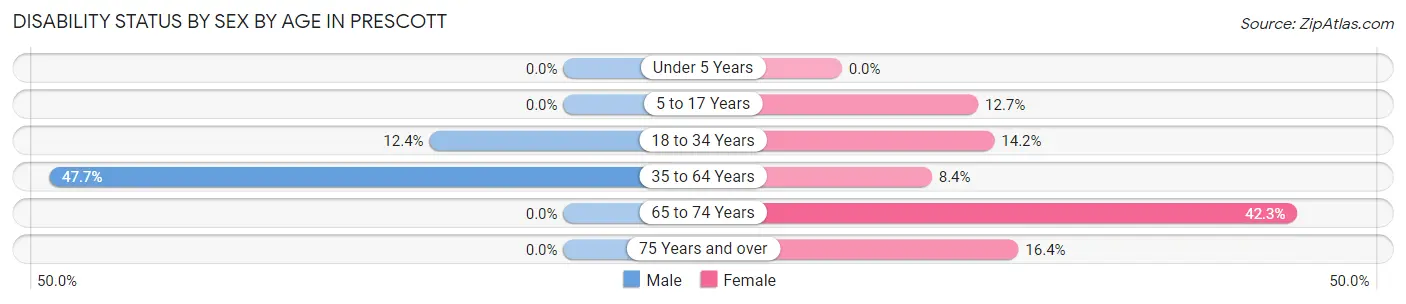
| Age Bracket | Male | Female |
| Under 5 Years | 0 (0.0%) | 0 (0.0%) |
| 5 to 17 Years | 0 (0.0%) | 32 (12.7%) |
| 18 to 34 Years | 47 (12.4%) | 49 (14.2%) |
| 35 to 64 Years | 273 (47.7%) | 41 (8.4%) |
| 65 to 74 Years | 0 (0.0%) | 41 (42.3%) |
| 75 Years and over | 0 (0.0%) | 20 (16.4%) |
Disability Class by Sex by Age in Prescott
Disability Class: Hearing Difficulty
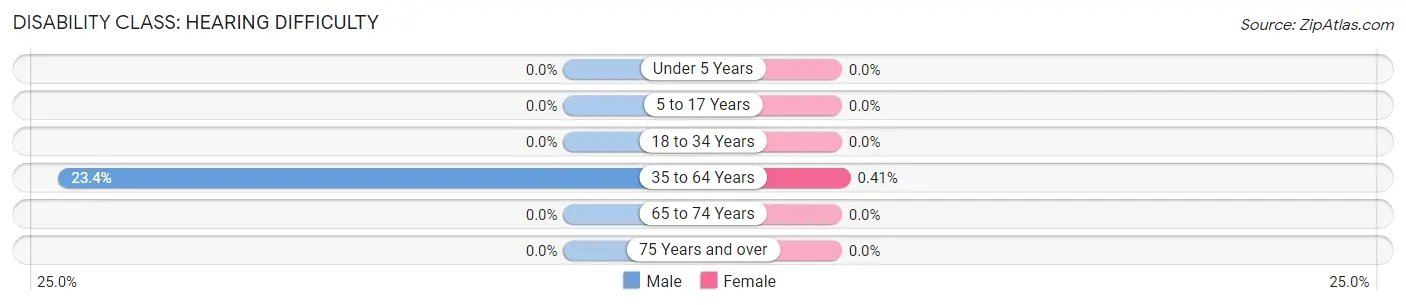
| Age Bracket | Male | Female |
| Under 5 Years | 0 (0.0%) | 0 (0.0%) |
| 5 to 17 Years | 0 (0.0%) | 0 (0.0%) |
| 18 to 34 Years | 0 (0.0%) | 0 (0.0%) |
| 35 to 64 Years | 134 (23.4%) | 2 (0.4%) |
| 65 to 74 Years | 0 (0.0%) | 0 (0.0%) |
| 75 Years and over | 0 (0.0%) | 0 (0.0%) |
Disability Class: Vision Difficulty
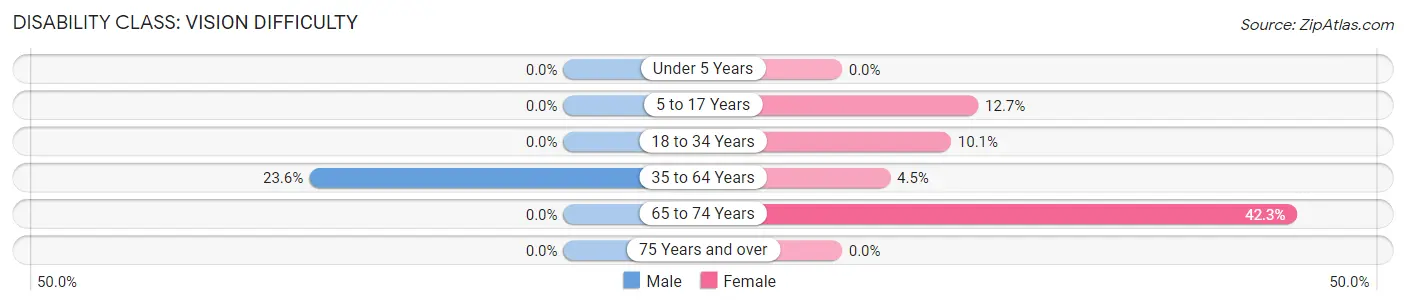
| Age Bracket | Male | Female |
| Under 5 Years | 0 (0.0%) | 0 (0.0%) |
| 5 to 17 Years | 0 (0.0%) | 32 (12.7%) |
| 18 to 34 Years | 0 (0.0%) | 35 (10.1%) |
| 35 to 64 Years | 135 (23.6%) | 22 (4.5%) |
| 65 to 74 Years | 0 (0.0%) | 41 (42.3%) |
| 75 Years and over | 0 (0.0%) | 0 (0.0%) |
Disability Class: Cognitive Difficulty
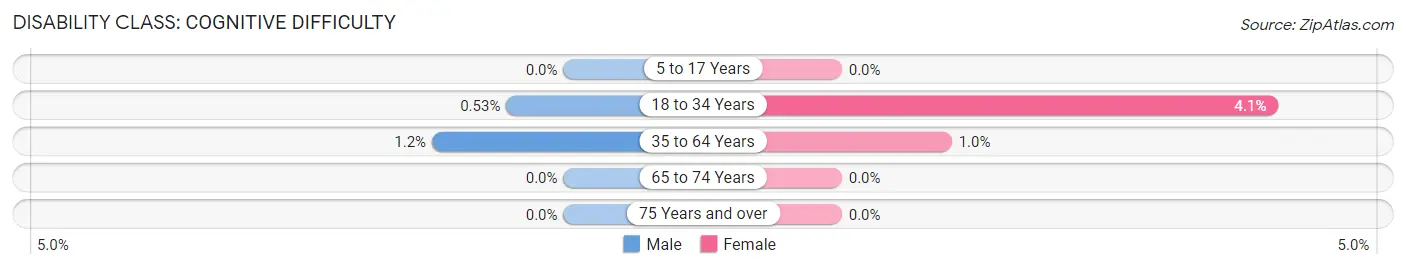
| Age Bracket | Male | Female |
| 5 to 17 Years | 0 (0.0%) | 0 (0.0%) |
| 18 to 34 Years | 2 (0.5%) | 14 (4.1%) |
| 35 to 64 Years | 7 (1.2%) | 5 (1.0%) |
| 65 to 74 Years | 0 (0.0%) | 0 (0.0%) |
| 75 Years and over | 0 (0.0%) | 0 (0.0%) |
Disability Class: Ambulatory Difficulty
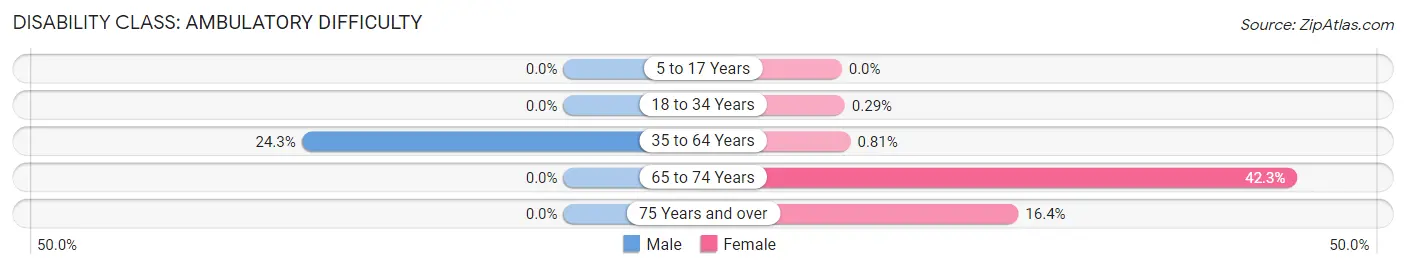
| Age Bracket | Male | Female |
| 5 to 17 Years | 0 (0.0%) | 0 (0.0%) |
| 18 to 34 Years | 0 (0.0%) | 1 (0.3%) |
| 35 to 64 Years | 139 (24.3%) | 4 (0.8%) |
| 65 to 74 Years | 0 (0.0%) | 41 (42.3%) |
| 75 Years and over | 0 (0.0%) | 20 (16.4%) |
Disability Class: Self-Care Difficulty
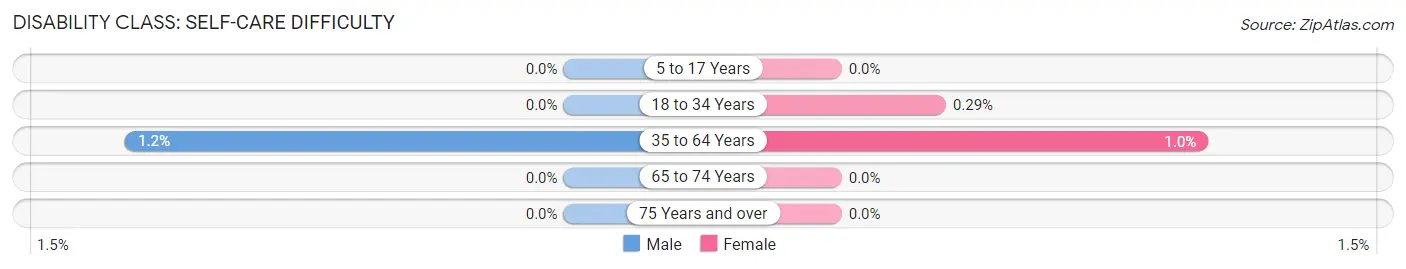
| Age Bracket | Male | Female |
| 5 to 17 Years | 0 (0.0%) | 0 (0.0%) |
| 18 to 34 Years | 0 (0.0%) | 1 (0.3%) |
| 35 to 64 Years | 7 (1.2%) | 5 (1.0%) |
| 65 to 74 Years | 0 (0.0%) | 0 (0.0%) |
| 75 Years and over | 0 (0.0%) | 0 (0.0%) |
Technology Access in Prescott
Computing Device Access in Prescott
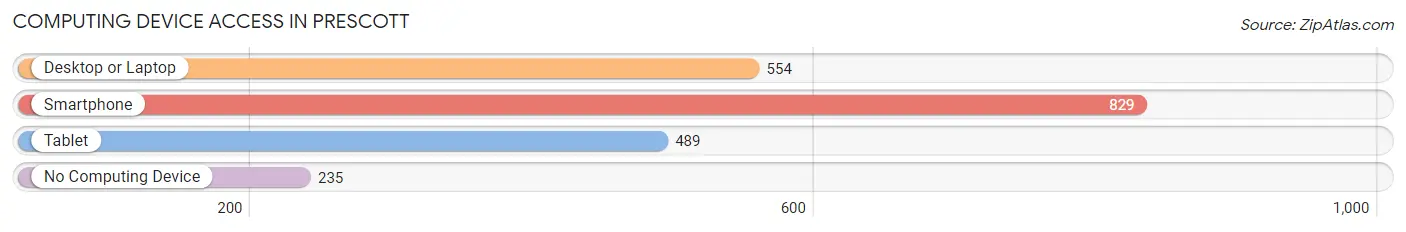
| Device Type | # Households | % Households |
| Desktop or Laptop | 554 | 47.8% |
| Smartphone | 829 | 71.5% |
| Tablet | 489 | 42.2% |
| No Computing Device | 235 | 20.3% |
| Total | 1,160 | 100.0% |
Internet Access in Prescott
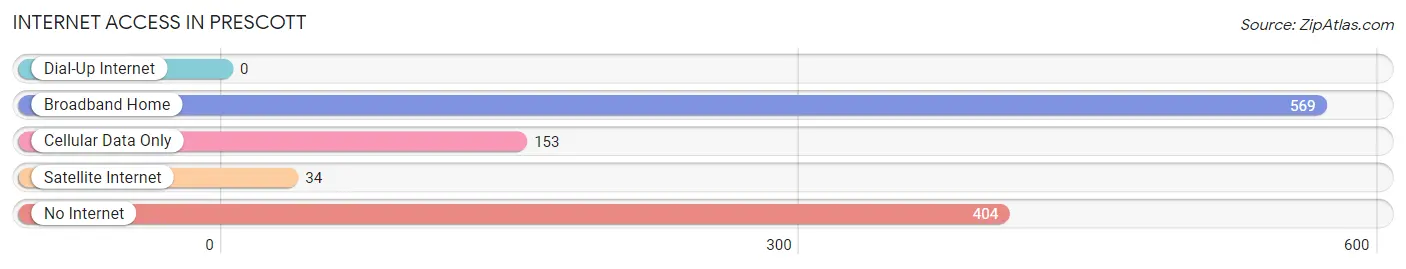
| Internet Type | # Households | % Households |
| Dial-Up Internet | 0 | 0.0% |
| Broadband Home | 569 | 49.0% |
| Cellular Data Only | 153 | 13.2% |
| Satellite Internet | 34 | 2.9% |
| No Internet | 404 | 34.8% |
| Total | 1,160 | 100.0% |
Prescott Summary
Prescott, Arkansas is a city located in Nevada County in the southwestern part of the state. It is the county seat and the largest city in the county. The city is situated on the Ouachita River and is part of the Texarkana metropolitan area. As of the 2010 census, the population of Prescott was 3,831.
History
Prescott was founded in 1873 by the Arkansas and Louisiana Railroad. The city was named after William Hickman Prescott, a railroad official. The city was incorporated in 1875 and was the first city in Nevada County.
In the late 19th century, Prescott was a major center for the timber industry. The city was also home to several sawmills and lumber companies. The timber industry was a major contributor to the city's economy until the mid-20th century.
Geography
Prescott is located at 33°45'N 93°41'W (33.75, -93.68). The city is situated on the Ouachita River and is part of the Texarkana metropolitan area. The city has a total area of 4.2 square miles, all of which is land.
Economy
Prescott's economy is largely based on agriculture and manufacturing. The city is home to several poultry processing plants, as well as a number of other manufacturing companies. The city is also home to a number of retail stores and restaurants.
Demographics
As of the 2010 census, there were 3,831 people, 1,541 households, and 990 families residing in the city. The population density was 912.2 people per square mile. The racial makeup of the city was 79.2% White, 17.3% African American, 0.3% Native American, 0.4% Asian, 0.1% Pacific Islander, 1.2% from other races, and 1.5% from two or more races. Hispanic or Latino of any race were 3.2% of the population.
The median income for a household in the city was $30,938, and the median income for a family was $37,917. Males had a median income of $30,938 versus $21,917 for females. The per capita income for the city was $15,945. About 16.2% of families and 19.2% of the population were below the poverty line, including 28.2% of those under age 18 and 14.2% of those age 65 or over.
Common Questions
What is Per Capita Income in Prescott?
Per Capita income in Prescott is $16,831.
What is the Median Family Income in Prescott?
Median Family Income in Prescott is $45,170.
What is the Median Household income in Prescott?
Median Household Income in Prescott is $29,899.
What is Income or Wage Gap in Prescott?
Income or Wage Gap in Prescott is 36.5%.
Women in Prescott earn 63.5 cents for every dollar earned by a man.
What is Inequality or Gini Index in Prescott?
Inequality or Gini Index in Prescott is 0.39.
What is the Total Population of Prescott?
Total Population of Prescott is 3,079.
What is the Total Male Population of Prescott?
Total Male Population of Prescott is 1,563.
What is the Total Female Population of Prescott?
Total Female Population of Prescott is 1,516.
What is the Ratio of Males per 100 Females in Prescott?
There are 103.10 Males per 100 Females in Prescott.
What is the Ratio of Females per 100 Males in Prescott?
There are 96.99 Females per 100 Males in Prescott.
What is the Median Population Age in Prescott?
Median Population Age in Prescott is 35.7 Years.
What is the Average Family Size in Prescott
Average Family Size in Prescott is 3.8 People.
What is the Average Household Size in Prescott
Average Household Size in Prescott is 2.5 People.
How Large is the Labor Force in Prescott?
There are 1,332 People in the Labor Forcein in Prescott.
What is the Percentage of People in the Labor Force in Prescott?
55.0% of People are in the Labor Force in Prescott.
What is the Unemployment Rate in Prescott?
Unemployment Rate in Prescott is 5.6%.