Fredonia Biscoe, AR Map & Demographics
Fredonia Biscoe Map
Fredonia Biscoe Overview
$25,943
PER CAPITA INCOME
$83,000
AVG FAMILY INCOME
$39,500
AVG HOUSEHOLD INCOME
36.8%
WAGE / INCOME GAP [ % ]
63.2¢/ $1
WAGE / INCOME GAP [ $ ]
0.45
INEQUALITY / GINI INDEX
221
TOTAL POPULATION
101
MALE POPULATION
120
FEMALE POPULATION
84.17
MALES / 100 FEMALES
118.81
FEMALES / 100 MALES
41.9
MEDIAN AGE
3.6
AVG FAMILY SIZE
2.7
AVG HOUSEHOLD SIZE
84
LABOR FORCE [ PEOPLE ]
50.0%
PERCENT IN LABOR FORCE
7.1%
UNEMPLOYMENT RATE
Income in Fredonia Biscoe
Income Overview in Fredonia Biscoe
Per Capita Income in Fredonia Biscoe is $25,943, while median incomes of families and households are $83,000 and $39,500 respectively.
| Characteristic | Number | Measure |
| Per Capita Income | 221 | $25,943 |
| Median Family Income | 50 | $83,000 |
| Mean Family Income | 50 | $86,600 |
| Median Household Income | 82 | $39,500 |
| Mean Household Income | 82 | $63,920 |
| Income Deficit | 50 | $0 |
| Wage / Income Gap (%) | 221 | 36.77% |
| Wage / Income Gap ($) | 221 | 63.23¢ per $1 |
| Gini / Inequality Index | 221 | 0.45 |
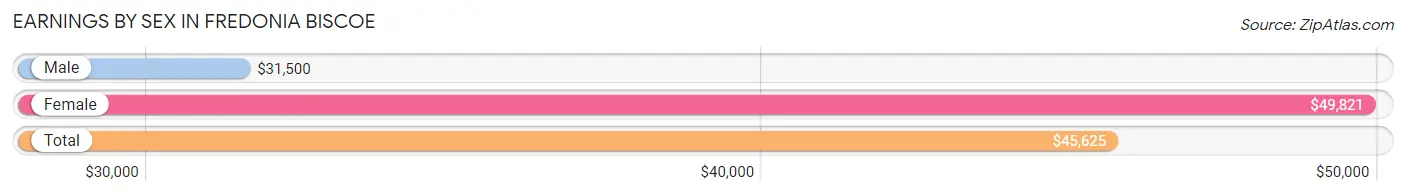
Earnings by Sex in Fredonia Biscoe
Average Earnings in Fredonia Biscoe are $45,625, $31,500 for men and $49,821 for women, a difference of 36.8%.
| Sex | Number | Average Earnings |
| Male | 52 (61.2%) | $31,500 |
| Female | 33 (38.8%) | $49,821 |
| Total | 85 (100.0%) | $45,625 |
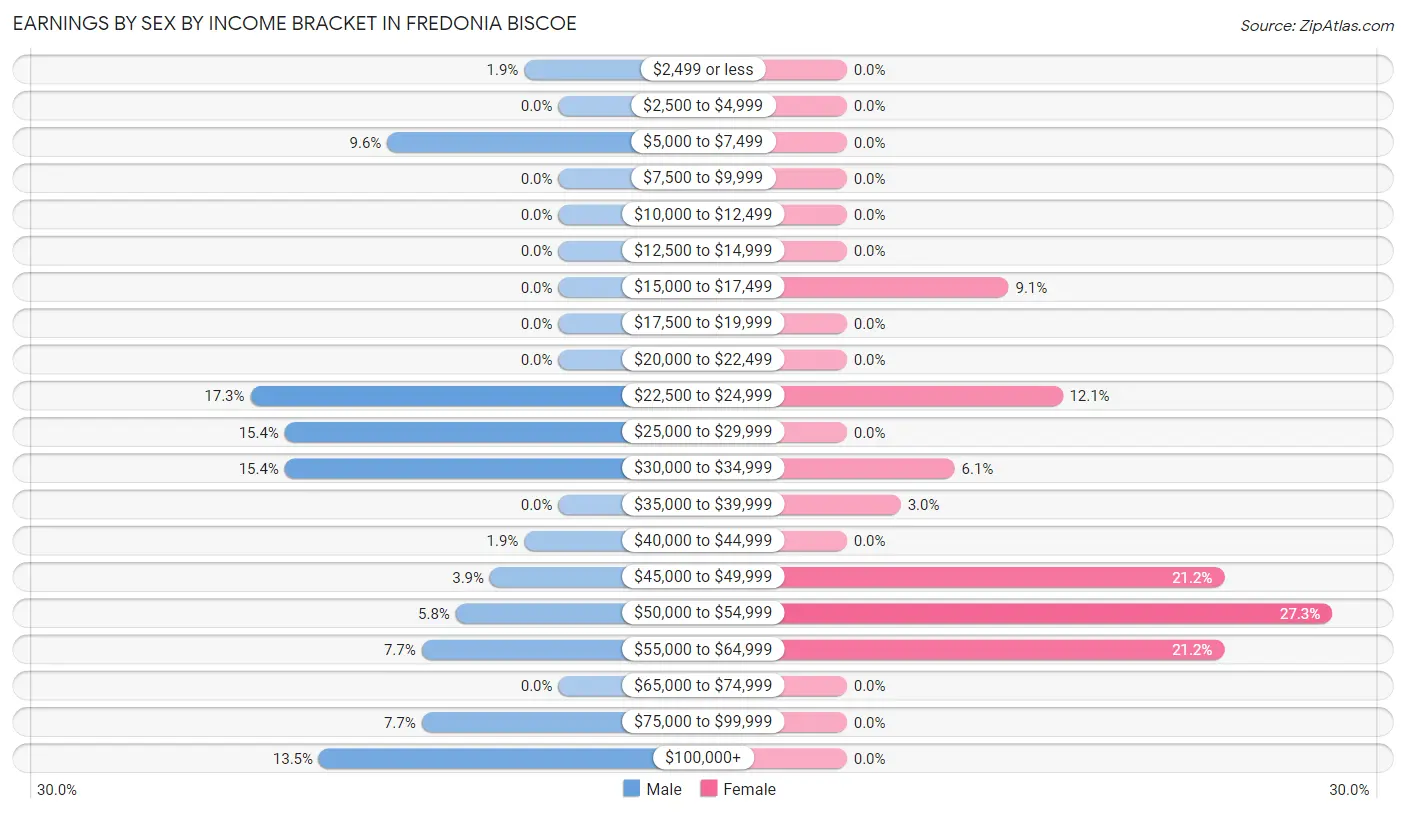
Earnings by Sex by Income Bracket in Fredonia Biscoe
The most common earnings brackets in Fredonia Biscoe are $22,500 to $24,999 for men (9 | 17.3%) and $50,000 to $54,999 for women (9 | 27.3%).
| Income | Male | Female |
| $2,499 or less | 1 (1.9%) | 0 (0.0%) |
| $2,500 to $4,999 | 0 (0.0%) | 0 (0.0%) |
| $5,000 to $7,499 | 5 (9.6%) | 0 (0.0%) |
| $7,500 to $9,999 | 0 (0.0%) | 0 (0.0%) |
| $10,000 to $12,499 | 0 (0.0%) | 0 (0.0%) |
| $12,500 to $14,999 | 0 (0.0%) | 0 (0.0%) |
| $15,000 to $17,499 | 0 (0.0%) | 3 (9.1%) |
| $17,500 to $19,999 | 0 (0.0%) | 0 (0.0%) |
| $20,000 to $22,499 | 0 (0.0%) | 0 (0.0%) |
| $22,500 to $24,999 | 9 (17.3%) | 4 (12.1%) |
| $25,000 to $29,999 | 8 (15.4%) | 0 (0.0%) |
| $30,000 to $34,999 | 8 (15.4%) | 2 (6.1%) |
| $35,000 to $39,999 | 0 (0.0%) | 1 (3.0%) |
| $40,000 to $44,999 | 1 (1.9%) | 0 (0.0%) |
| $45,000 to $49,999 | 2 (3.8%) | 7 (21.2%) |
| $50,000 to $54,999 | 3 (5.8%) | 9 (27.3%) |
| $55,000 to $64,999 | 4 (7.7%) | 7 (21.2%) |
| $65,000 to $74,999 | 0 (0.0%) | 0 (0.0%) |
| $75,000 to $99,999 | 4 (7.7%) | 0 (0.0%) |
| $100,000+ | 7 (13.5%) | 0 (0.0%) |
| Total | 52 (100.0%) | 33 (100.0%) |
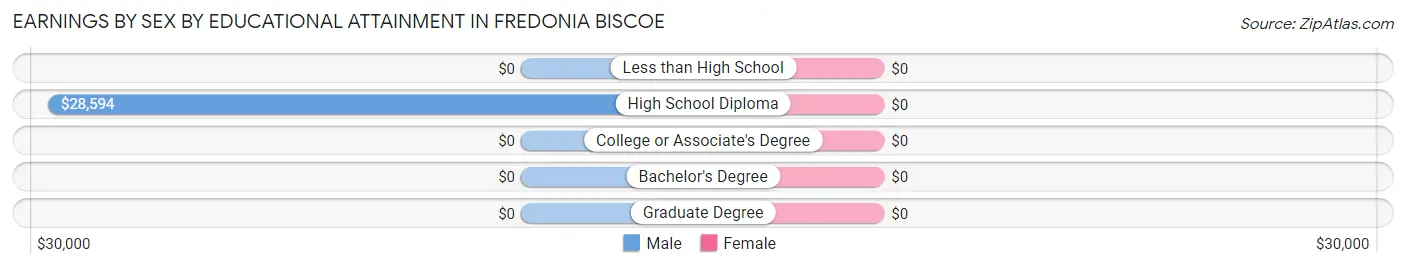
Earnings by Sex by Educational Attainment in Fredonia Biscoe
| Educational Attainment | Male Income | Female Income |
| Less than High School | - | - |
| High School Diploma | $28,594 | $0 |
| College or Associate's Degree | - | - |
| Bachelor's Degree | - | - |
| Graduate Degree | - | - |
| Total | $31,000 | $49,821 |
Family Income in Fredonia Biscoe
Family Income Brackets in Fredonia Biscoe
According to the Fredonia Biscoe family income data, there are 12 families falling into the $35,000 to $49,999 income range, which is the most common income bracket and makes up 24.0% of all families.
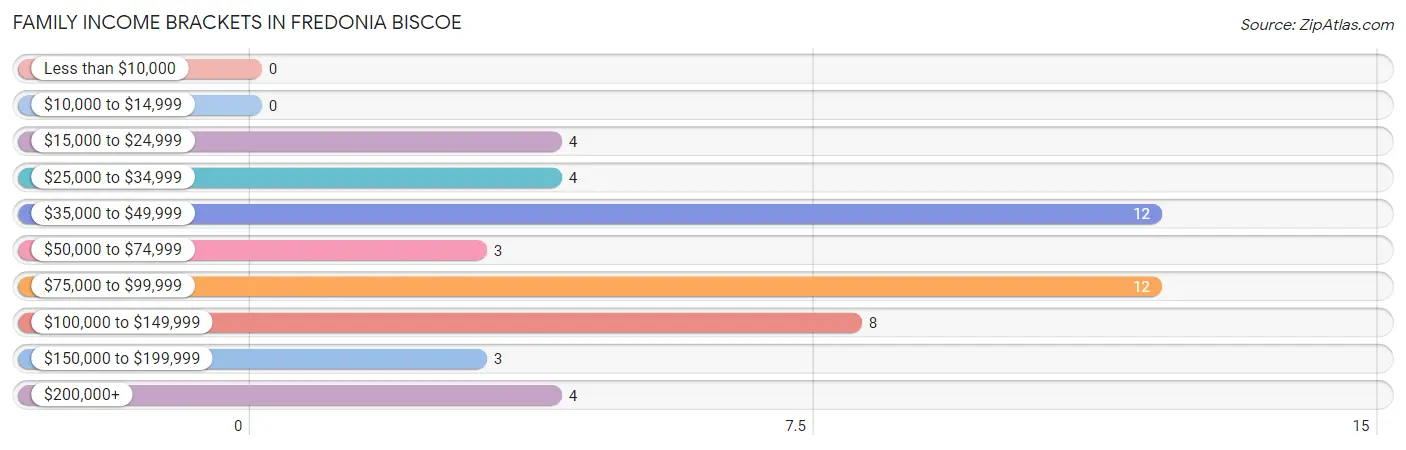
| Income Bracket | # Families | % Families |
| Less than $10,000 | 0 | 0.0% |
| $10,000 to $14,999 | 0 | 0.0% |
| $15,000 to $24,999 | 4 | 8.0% |
| $25,000 to $34,999 | 4 | 8.0% |
| $35,000 to $49,999 | 12 | 24.0% |
| $50,000 to $74,999 | 3 | 6.0% |
| $75,000 to $99,999 | 12 | 24.0% |
| $100,000 to $149,999 | 8 | 16.0% |
| $150,000 to $199,999 | 3 | 6.0% |
| $200,000+ | 4 | 8.0% |
Family Income by Famaliy Size in Fredonia Biscoe
2-person families (18 | 36.0%) account for the highest median family income in Fredonia Biscoe with $61,667 per family, while 2-person families (18 | 36.0%) have the highest median income of $30,834 per family member.
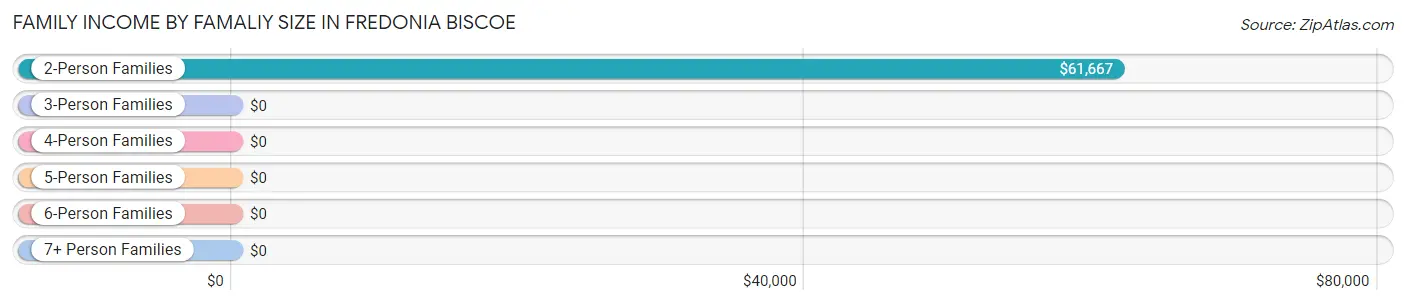
| Income Bracket | # Families | Median Income |
| 2-Person Families | 18 (36.0%) | $61,667 |
| 3-Person Families | 21 (42.0%) | $0 |
| 4-Person Families | 3 (6.0%) | $0 |
| 5-Person Families | 4 (8.0%) | $0 |
| 6-Person Families | 4 (8.0%) | $0 |
| 7+ Person Families | 0 (0.0%) | $0 |
| Total | 50 (100.0%) | $83,000 |
Family Income by Number of Earners in Fredonia Biscoe
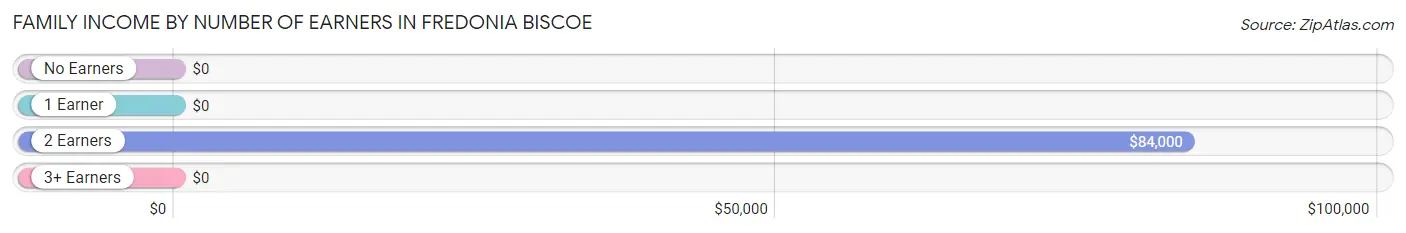
| Number of Earners | # Families | Median Income |
| No Earners | 14 (28.0%) | $0 |
| 1 Earner | 16 (32.0%) | $0 |
| 2 Earners | 16 (32.0%) | $84,000 |
| 3+ Earners | 4 (8.0%) | $0 |
| Total | 50 (100.0%) | $83,000 |
Household Income in Fredonia Biscoe
Household Income Brackets in Fredonia Biscoe
With 19 households falling in the category, the $35,000 to $49,999 income range is the most frequent in Fredonia Biscoe, accounting for 23.2% of all households.
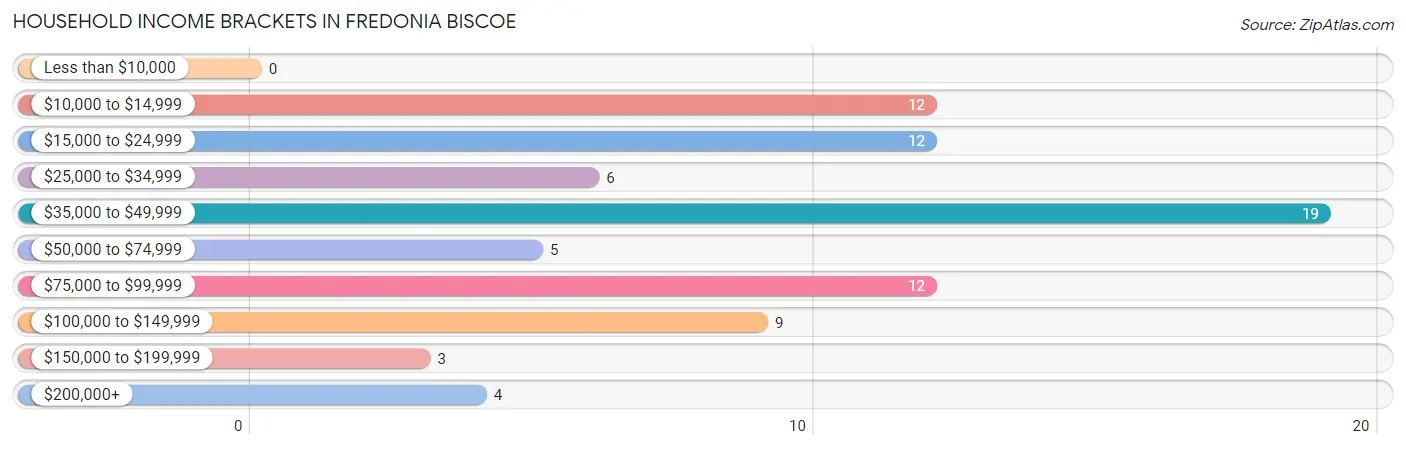
| Income Bracket | # Households | % Households |
| Less than $10,000 | 0 | 0.0% |
| $10,000 to $14,999 | 12 | 14.6% |
| $15,000 to $24,999 | 12 | 14.6% |
| $25,000 to $34,999 | 6 | 7.3% |
| $35,000 to $49,999 | 19 | 23.2% |
| $50,000 to $74,999 | 5 | 6.1% |
| $75,000 to $99,999 | 12 | 14.6% |
| $100,000 to $149,999 | 9 | 11.0% |
| $150,000 to $199,999 | 3 | 3.7% |
| $200,000+ | 4 | 4.9% |
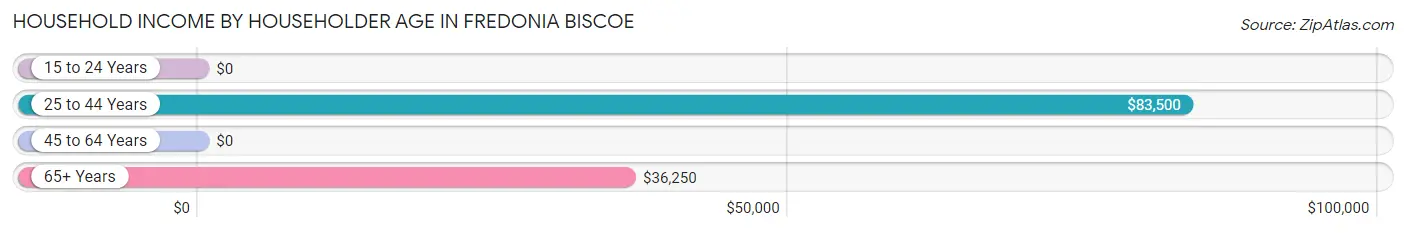
Household Income by Householder Age in Fredonia Biscoe
The median household income in Fredonia Biscoe is $39,500, with the highest median household income of $83,500 found in the 25 to 44 years age bracket for the primary householder. A total of 16 households (19.5%) fall into this category.
| Income Bracket | # Households | Median Income |
| 15 to 24 Years | 0 (0.0%) | $0 |
| 25 to 44 Years | 16 (19.5%) | $83,500 |
| 45 to 64 Years | 30 (36.6%) | $0 |
| 65+ Years | 36 (43.9%) | $36,250 |
| Total | 82 (100.0%) | $39,500 |
Poverty in Fredonia Biscoe
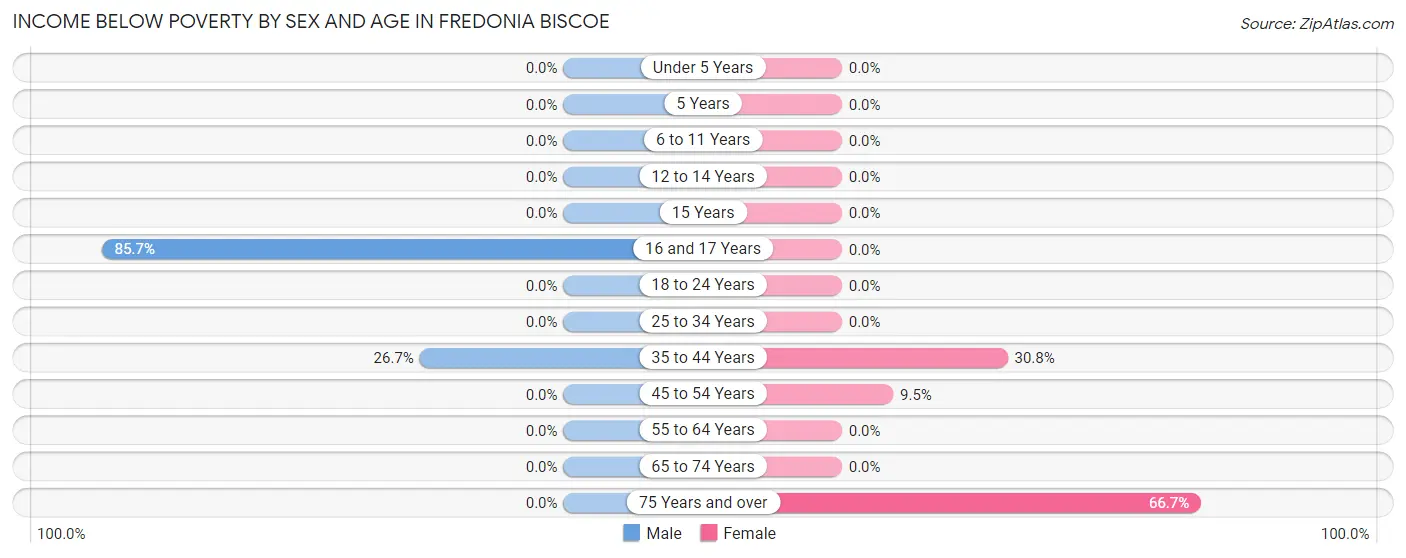
Income Below Poverty by Sex and Age in Fredonia Biscoe
With 9.9% poverty level for males and 15.7% for females among the residents of Fredonia Biscoe, 16 and 17 year old males and 75 year old and over females are the most vulnerable to poverty, with 6 males (85.7%) and 12 females (66.7%) in their respective age groups living below the poverty level.
| Age Bracket | Male | Female |
| Under 5 Years | 0 (0.0%) | 0 (0.0%) |
| 5 Years | 0 (0.0%) | 0 (0.0%) |
| 6 to 11 Years | 0 (0.0%) | 0 (0.0%) |
| 12 to 14 Years | 0 (0.0%) | 0 (0.0%) |
| 15 Years | 0 (0.0%) | 0 (0.0%) |
| 16 and 17 Years | 6 (85.7%) | 0 (0.0%) |
| 18 to 24 Years | 0 (0.0%) | 0 (0.0%) |
| 25 to 34 Years | 0 (0.0%) | 0 (0.0%) |
| 35 to 44 Years | 4 (26.7%) | 4 (30.8%) |
| 45 to 54 Years | 0 (0.0%) | 2 (9.5%) |
| 55 to 64 Years | 0 (0.0%) | 0 (0.0%) |
| 65 to 74 Years | 0 (0.0%) | 0 (0.0%) |
| 75 Years and over | 0 (0.0%) | 12 (66.7%) |
| Total | 10 (9.9%) | 18 (15.7%) |
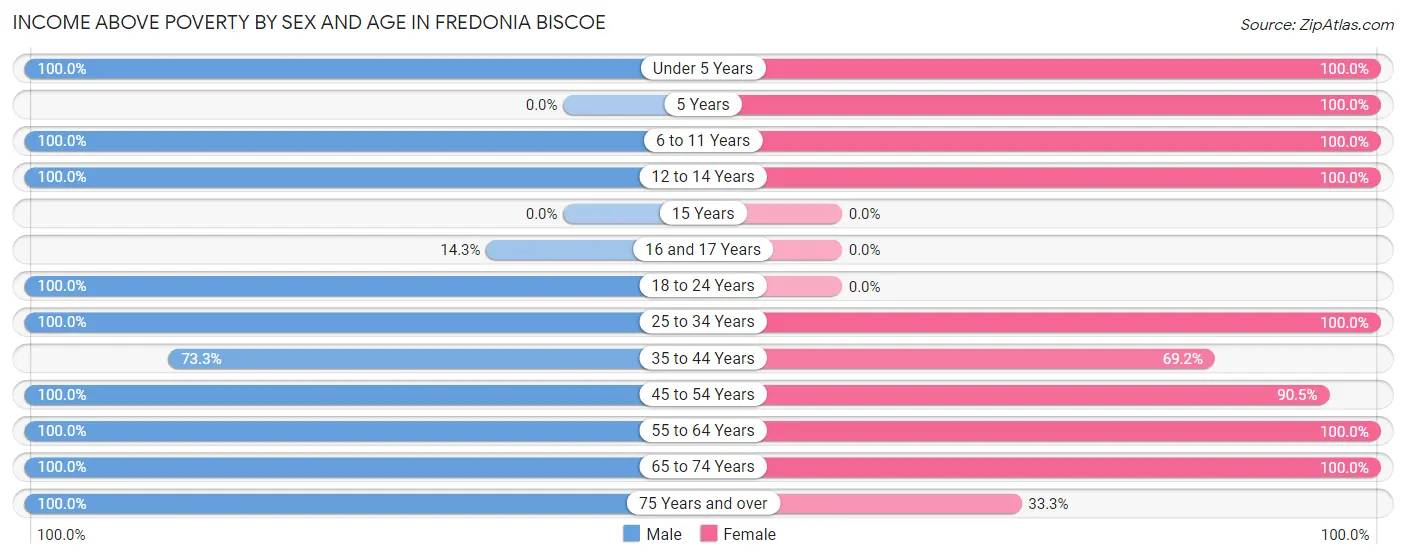
Income Above Poverty by Sex and Age in Fredonia Biscoe
According to the poverty statistics in Fredonia Biscoe, males aged under 5 years and females aged under 5 years are the age groups that are most secure financially, with 100.0% of males and 100.0% of females in these age groups living above the poverty line.
| Age Bracket | Male | Female |
| Under 5 Years | 8 (100.0%) | 12 (100.0%) |
| 5 Years | 0 (0.0%) | 3 (100.0%) |
| 6 to 11 Years | 8 (100.0%) | 13 (100.0%) |
| 12 to 14 Years | 2 (100.0%) | 2 (100.0%) |
| 15 Years | 0 (0.0%) | 0 (0.0%) |
| 16 and 17 Years | 1 (14.3%) | 0 (0.0%) |
| 18 to 24 Years | 3 (100.0%) | 0 (0.0%) |
| 25 to 34 Years | 8 (100.0%) | 15 (100.0%) |
| 35 to 44 Years | 11 (73.3%) | 9 (69.2%) |
| 45 to 54 Years | 22 (100.0%) | 19 (90.5%) |
| 55 to 64 Years | 13 (100.0%) | 9 (100.0%) |
| 65 to 74 Years | 9 (100.0%) | 9 (100.0%) |
| 75 Years and over | 6 (100.0%) | 6 (33.3%) |
| Total | 91 (90.1%) | 97 (84.4%) |
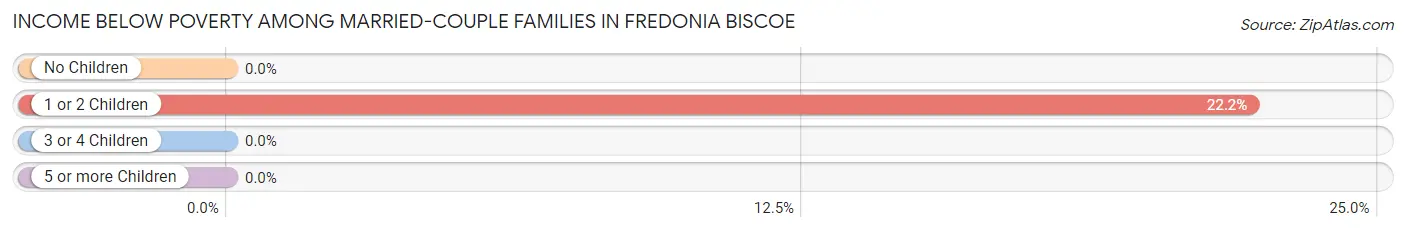
Income Below Poverty Among Married-Couple Families in Fredonia Biscoe
The poverty statistics for married-couple families in Fredonia Biscoe show that 9.8% or 4 of the total 41 families live below the poverty line. Families with 1 or 2 children have the highest poverty rate of 22.2%, comprising of 4 families. On the other hand, families with no children have the lowest poverty rate of 0.0%, which includes 0 families.
| Children | Above Poverty | Below Poverty |
| No Children | 18 (100.0%) | 0 (0.0%) |
| 1 or 2 Children | 14 (77.8%) | 4 (22.2%) |
| 3 or 4 Children | 5 (100.0%) | 0 (0.0%) |
| 5 or more Children | 0 (0.0%) | 0 (0.0%) |
| Total | 37 (90.2%) | 4 (9.8%) |
Income Below Poverty Among Single-Parent Households in Fredonia Biscoe
| Children | Single Father | Single Mother |
| No Children | 0 (0.0%) | 0 (0.0%) |
| 1 or 2 Children | 0 (0.0%) | 0 (0.0%) |
| 3 or 4 Children | 0 (0.0%) | 0 (0.0%) |
| 5 or more Children | 0 (0.0%) | 0 (0.0%) |
| Total | 0 (0.0%) | 0 (0.0%) |
Income Below Poverty Among Married-Couple vs Single-Parent Households in Fredonia Biscoe
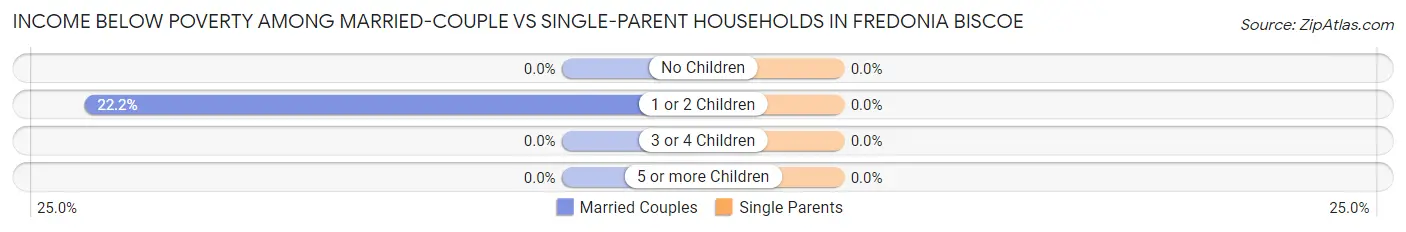
| Children | Married-Couple Families | Single-Parent Households |
| No Children | 0 (0.0%) | 0 (0.0%) |
| 1 or 2 Children | 4 (22.2%) | 0 (0.0%) |
| 3 or 4 Children | 0 (0.0%) | 0 (0.0%) |
| 5 or more Children | 0 (0.0%) | 0 (0.0%) |
| Total | 4 (9.8%) | 0 (0.0%) |
Race in Fredonia Biscoe
The most populous races in Fredonia Biscoe are White / Caucasian (147 | 66.5%), Black / African American (71 | 32.1%), and Two or more Races (3 | 1.4%).
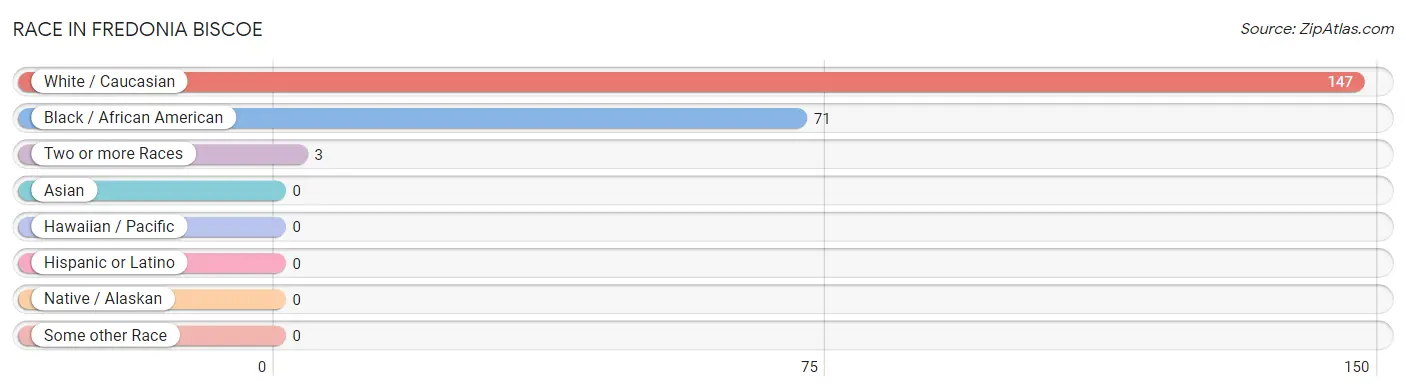
| Race | # Population | % Population |
| Asian | 0 | 0.0% |
| Black / African American | 71 | 32.1% |
| Hawaiian / Pacific | 0 | 0.0% |
| Hispanic or Latino | 0 | 0.0% |
| Native / Alaskan | 0 | 0.0% |
| White / Caucasian | 147 | 66.5% |
| Two or more Races | 3 | 1.4% |
| Some other Race | 0 | 0.0% |
| Total | 221 | 100.0% |
Ancestry in Fredonia Biscoe
The most populous ancestries reported in Fredonia Biscoe are American (24 | 10.9%), Irish (11 | 5.0%), English (6 | 2.7%), African (5 | 2.3%), and Subsaharan African (5 | 2.3%), together accounting for 23.1% of all Fredonia Biscoe residents.
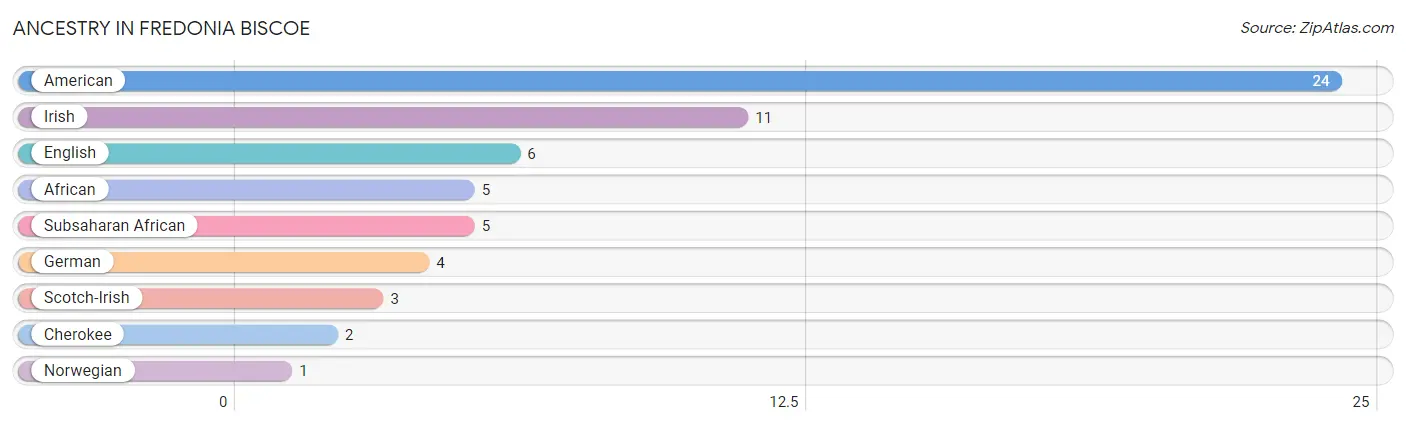
| Ancestry | # Population | % Population |
| African | 5 | 2.3% |
| American | 24 | 10.9% |
| Cherokee | 2 | 0.9% |
| English | 6 | 2.7% |
| German | 4 | 1.8% |
| Irish | 11 | 5.0% |
| Norwegian | 1 | 0.4% |
| Scotch-Irish | 3 | 1.4% |
| Subsaharan African | 5 | 2.3% | View All 9 Rows |
Immigrants in Fredonia Biscoe

| Immigration Origin | # Population | % Population | View All 0 Rows |
Sex and Age in Fredonia Biscoe
Sex and Age in Fredonia Biscoe
The most populous age groups in Fredonia Biscoe are 50 to 54 Years (18 | 17.8%) for men and 45 to 49 Years (18 | 15.0%) for women.
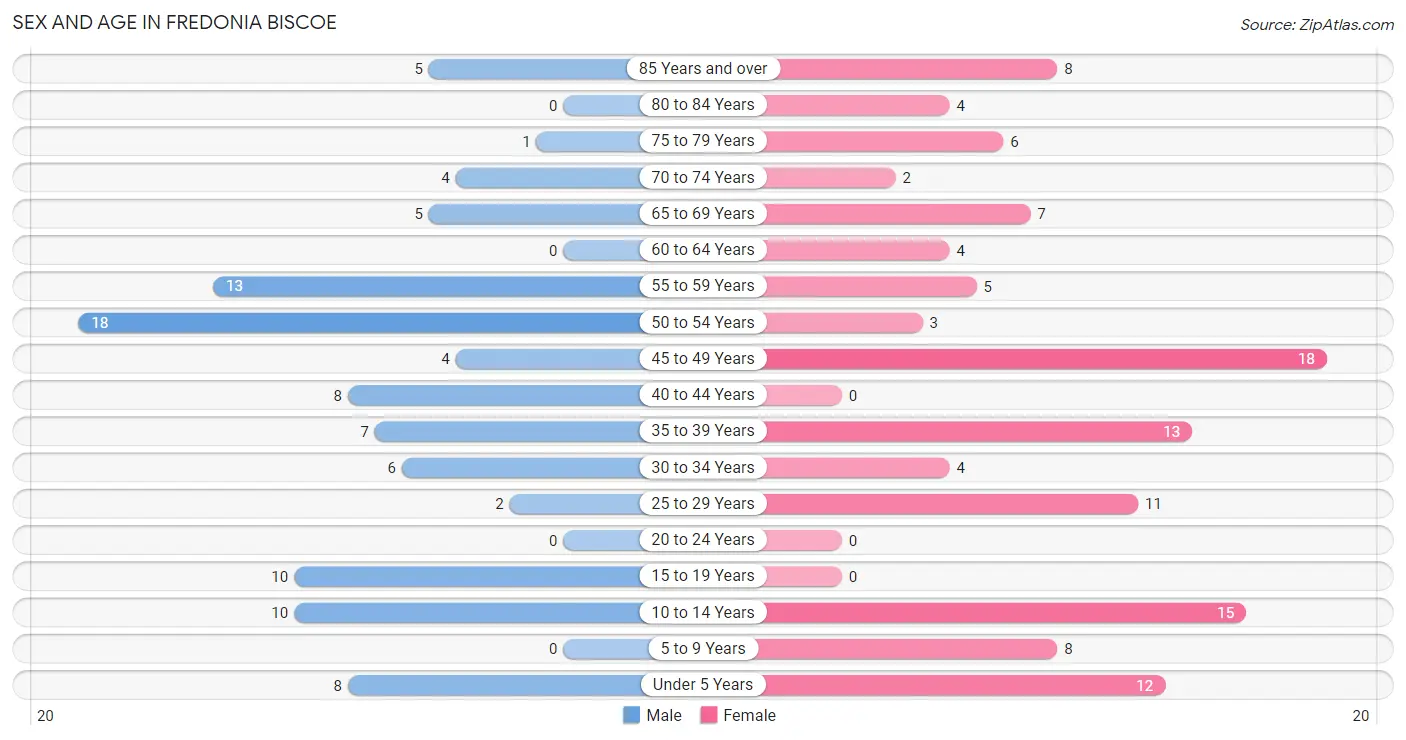
| Age Bracket | Male | Female |
| Under 5 Years | 8 (7.9%) | 12 (10.0%) |
| 5 to 9 Years | 0 (0.0%) | 8 (6.7%) |
| 10 to 14 Years | 10 (9.9%) | 15 (12.5%) |
| 15 to 19 Years | 10 (9.9%) | 0 (0.0%) |
| 20 to 24 Years | 0 (0.0%) | 0 (0.0%) |
| 25 to 29 Years | 2 (2.0%) | 11 (9.2%) |
| 30 to 34 Years | 6 (5.9%) | 4 (3.3%) |
| 35 to 39 Years | 7 (6.9%) | 13 (10.8%) |
| 40 to 44 Years | 8 (7.9%) | 0 (0.0%) |
| 45 to 49 Years | 4 (4.0%) | 18 (15.0%) |
| 50 to 54 Years | 18 (17.8%) | 3 (2.5%) |
| 55 to 59 Years | 13 (12.9%) | 5 (4.2%) |
| 60 to 64 Years | 0 (0.0%) | 4 (3.3%) |
| 65 to 69 Years | 5 (5.0%) | 7 (5.8%) |
| 70 to 74 Years | 4 (4.0%) | 2 (1.7%) |
| 75 to 79 Years | 1 (1.0%) | 6 (5.0%) |
| 80 to 84 Years | 0 (0.0%) | 4 (3.3%) |
| 85 Years and over | 5 (5.0%) | 8 (6.7%) |
| Total | 101 (100.0%) | 120 (100.0%) |
Families and Households in Fredonia Biscoe
Median Family Size in Fredonia Biscoe
The median family size in Fredonia Biscoe is 3.58 persons per family, with single male/father families (5 | 10.0%) accounting for the largest median family size of 4.6 persons per family. On the other hand, married-couple families (41 | 82.0%) represent the smallest median family size with 3.37 persons per family.
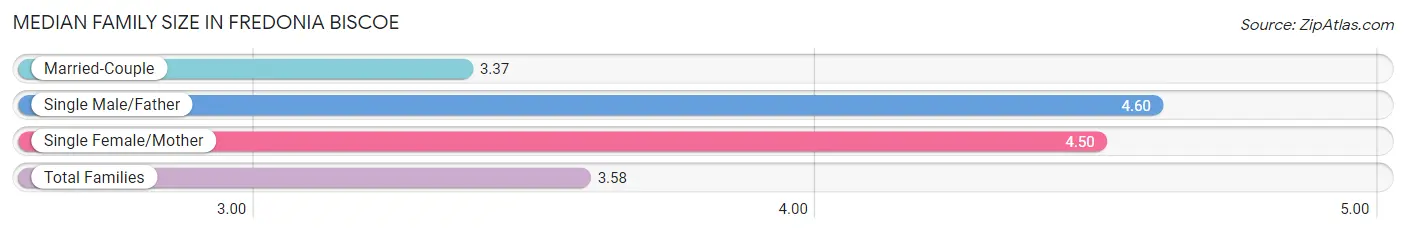
| Family Type | # Families | Family Size |
| Married-Couple | 41 (82.0%) | 3.37 |
| Single Male/Father | 5 (10.0%) | 4.60 |
| Single Female/Mother | 4 (8.0%) | 4.50 |
| Total Families | 50 (100.0%) | 3.58 |
Median Household Size in Fredonia Biscoe
The median household size in Fredonia Biscoe is 2.70 persons per household, with single male/father households (5 | 6.1%) accounting for the largest median household size of 4.6 persons per household. non-family households (32 | 39.0%) represent the smallest median household size with 1.16 persons per household.
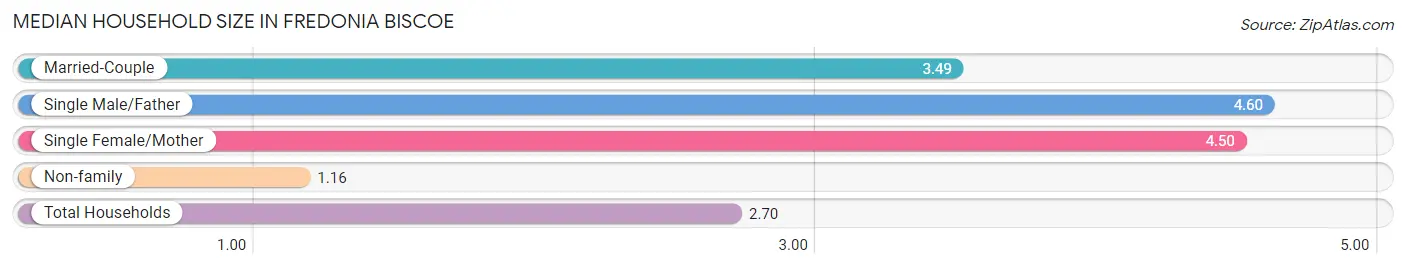
| Household Type | # Households | Household Size |
| Married-Couple | 41 (50.0%) | 3.49 |
| Single Male/Father | 5 (6.1%) | 4.60 |
| Single Female/Mother | 4 (4.9%) | 4.50 |
| Non-family | 32 (39.0%) | 1.16 |
| Total Households | 82 (100.0%) | 2.70 |
Household Size by Marriage Status in Fredonia Biscoe
Out of a total of 82 households in Fredonia Biscoe, 50 (61.0%) are family households, while 32 (39.0%) are nonfamily households. The most numerous type of family households are 2-person households, comprising 18, and the most common type of nonfamily households are 1-person households, comprising 25.
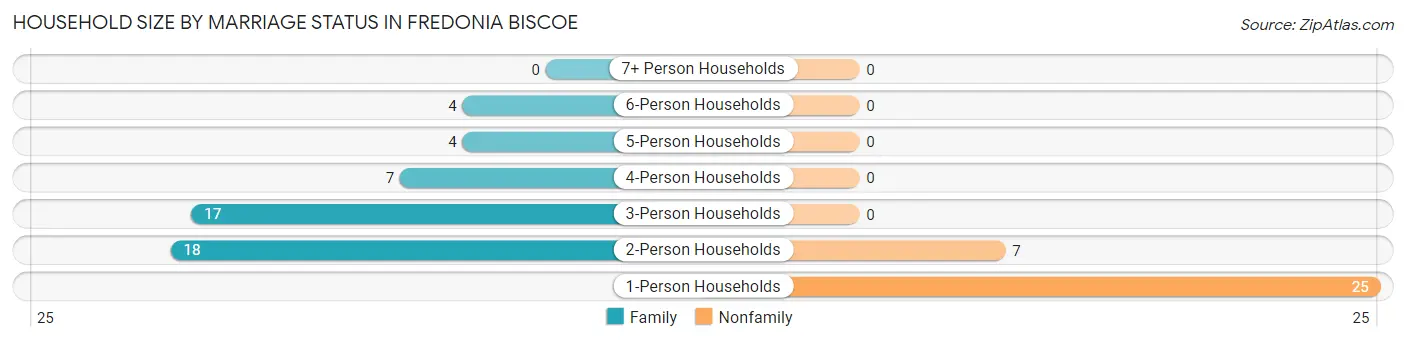
| Household Size | Family Households | Nonfamily Households |
| 1-Person Households | - | 25 (30.5%) |
| 2-Person Households | 18 (22.0%) | 7 (8.5%) |
| 3-Person Households | 17 (20.7%) | 0 (0.0%) |
| 4-Person Households | 7 (8.5%) | 0 (0.0%) |
| 5-Person Households | 4 (4.9%) | 0 (0.0%) |
| 6-Person Households | 4 (4.9%) | 0 (0.0%) |
| 7+ Person Households | 0 (0.0%) | 0 (0.0%) |
| Total | 50 (61.0%) | 32 (39.0%) |
Female Fertility in Fredonia Biscoe
Fertility by Age in Fredonia Biscoe
Average fertility rate in Fredonia Biscoe is 174.0 births per 1,000 women. Women in the age bracket of 35 to 50 years have the highest fertility rate with 258.0 births per 1,000 women. Women in the age bracket of 35 to 50 years acount for 100.0% of all women with births.
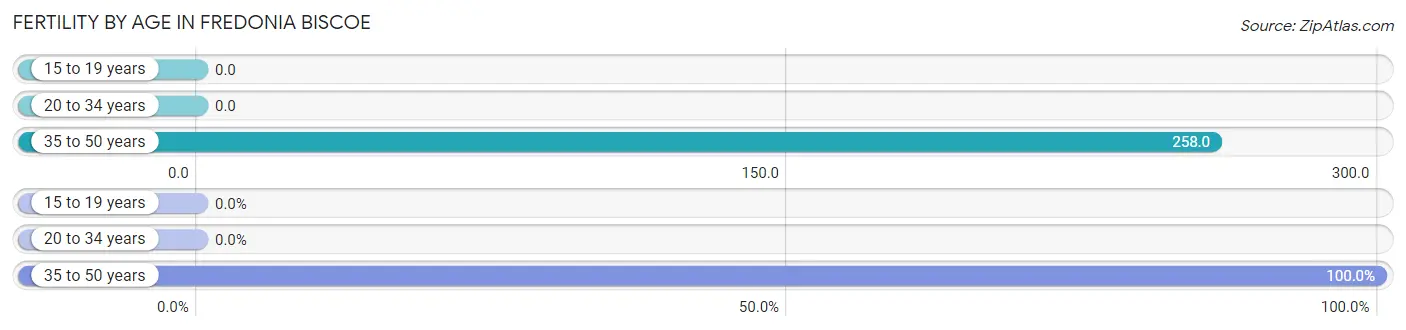
| Age Bracket | Women with Births | Births / 1,000 Women |
| 15 to 19 years | 0 (0.0%) | 0.0 |
| 20 to 34 years | 0 (0.0%) | 0.0 |
| 35 to 50 years | 8 (100.0%) | 258.0 |
| Total | 8 (100.0%) | 174.0 |
Fertility by Age by Marriage Status in Fredonia Biscoe
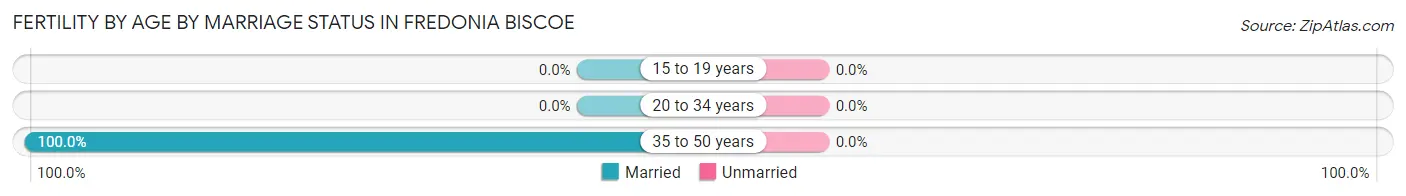
| Age Bracket | Married | Unmarried |
| 15 to 19 years | 0 (0.0%) | 0 (0.0%) |
| 20 to 34 years | 0 (0.0%) | 0 (0.0%) |
| 35 to 50 years | 8 (100.0%) | 0 (0.0%) |
| Total | 8 (100.0%) | 0 (0.0%) |
Fertility by Education in Fredonia Biscoe
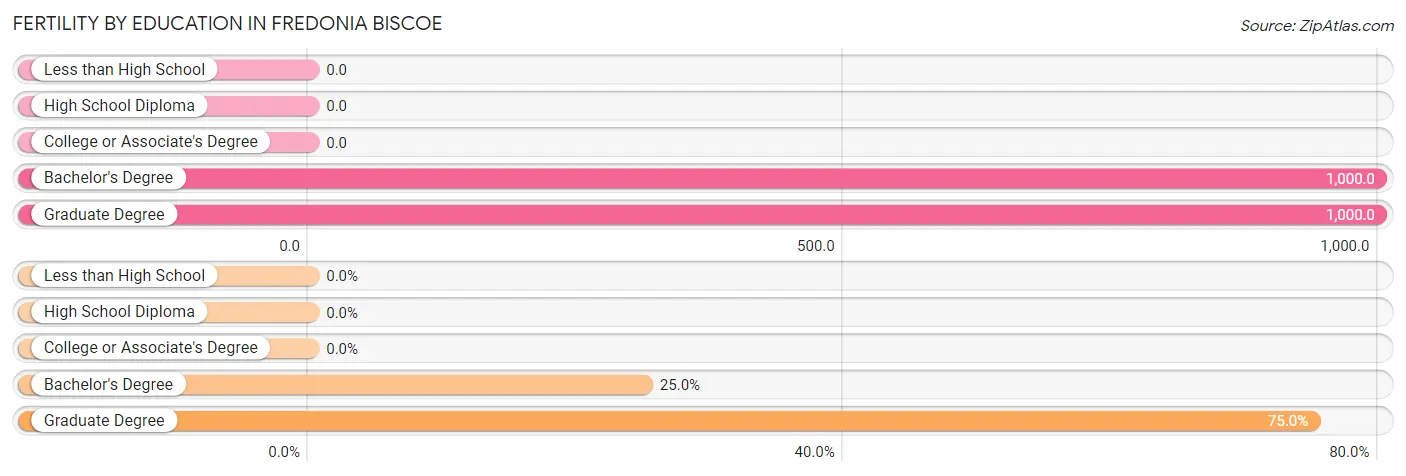
| Educational Attainment | Women with Births | Births / 1,000 Women |
| Less than High School | 0 (0.0%) | 0.0 |
| High School Diploma | 0 (0.0%) | 0.0 |
| College or Associate's Degree | 0 (0.0%) | 0.0 |
| Bachelor's Degree | 2 (25.0%) | 1,000.0 |
| Graduate Degree | 6 (75.0%) | 1,000.0 |
| Total | 8 (100.0%) | 174.0 |
Fertility by Education by Marriage Status in Fredonia Biscoe
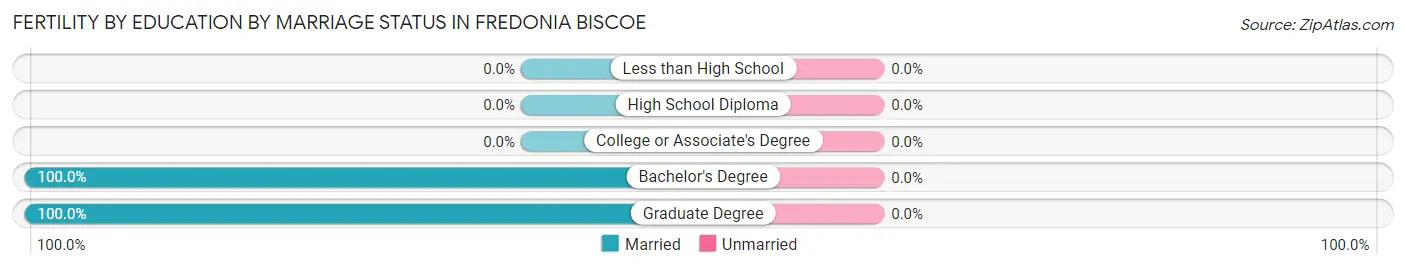
| Educational Attainment | Married | Unmarried |
| Less than High School | 0 (0.0%) | 0 (0.0%) |
| High School Diploma | 0 (0.0%) | 0 (0.0%) |
| College or Associate's Degree | 0 (0.0%) | 0 (0.0%) |
| Bachelor's Degree | 2 (100.0%) | 0 (0.0%) |
| Graduate Degree | 6 (100.0%) | 0 (0.0%) |
| Total | 8 (100.0%) | 0 (0.0%) |
Employment Characteristics in Fredonia Biscoe
Employment by Class of Employer in Fredonia Biscoe
Among the 78 employed individuals in Fredonia Biscoe, private company employees (42 | 53.8%), not-for-profit organizations (13 | 16.7%), and local government employees (8 | 10.3%) make up the most common classes of employment.
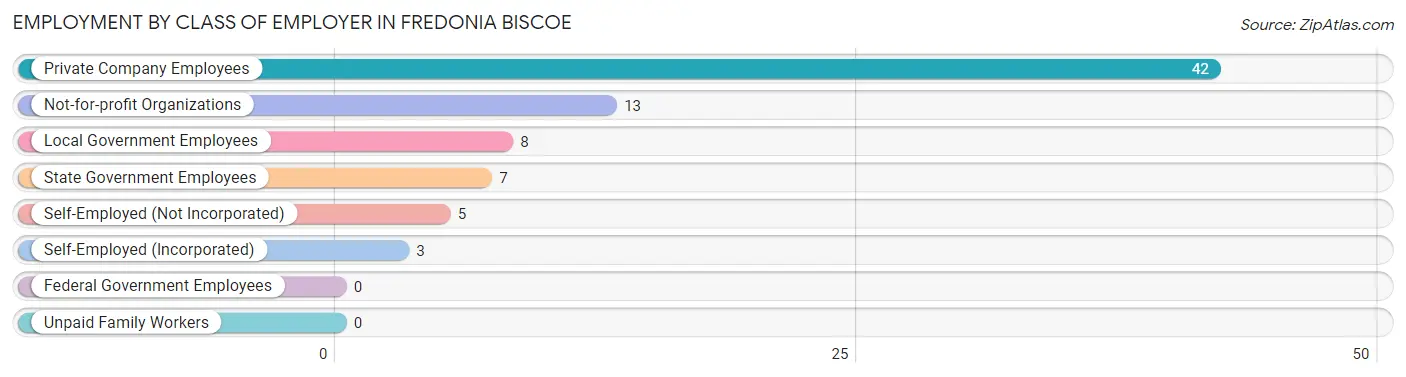
| Employer Class | # Employees | % Employees |
| Private Company Employees | 42 | 53.8% |
| Self-Employed (Incorporated) | 3 | 3.8% |
| Self-Employed (Not Incorporated) | 5 | 6.4% |
| Not-for-profit Organizations | 13 | 16.7% |
| Local Government Employees | 8 | 10.3% |
| State Government Employees | 7 | 9.0% |
| Federal Government Employees | 0 | 0.0% |
| Unpaid Family Workers | 0 | 0.0% |
| Total | 78 | 100.0% |
Employment Status by Age in Fredonia Biscoe
According to the labor force statistics for Fredonia Biscoe, out of the total population over 16 years of age (168), 50.0% or 84 individuals are in the labor force, with 7.1% or 6 of them unemployed. The age group with the highest labor force participation rate is 45 to 54 years, with 83.7% or 36 individuals in the labor force. Within the labor force, the 30 to 34 years age range has the highest percentage of unemployed individuals, with 83.3% or 5 of them being unemployed.
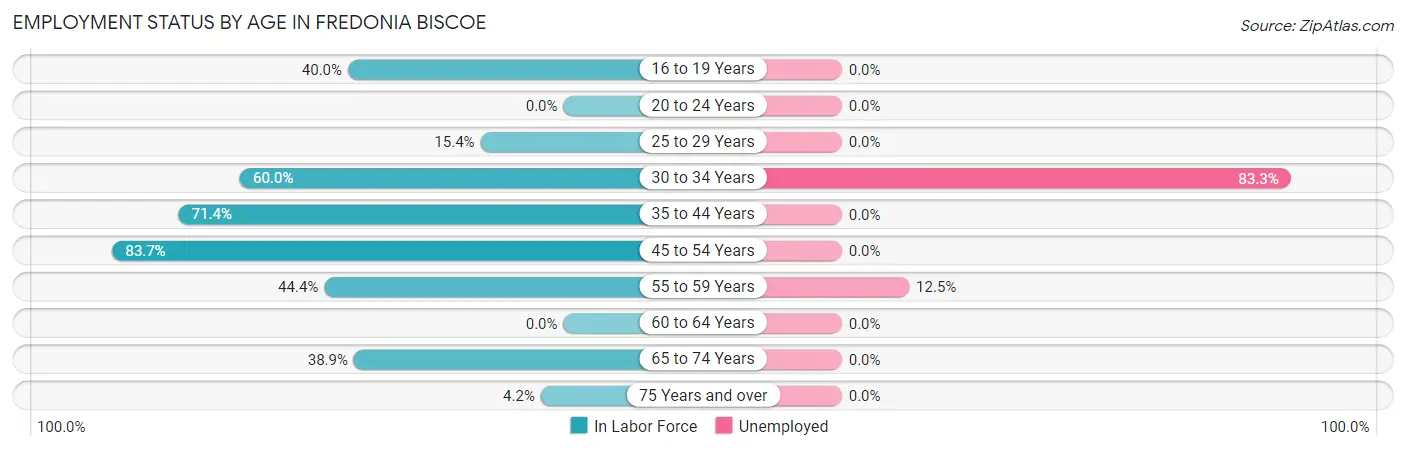
| Age Bracket | In Labor Force | Unemployed |
| 16 to 19 Years | 4 (40.0%) | 0 (0.0%) |
| 20 to 24 Years | 0 (0.0%) | 0 (0.0%) |
| 25 to 29 Years | 2 (15.4%) | 0 (0.0%) |
| 30 to 34 Years | 6 (60.0%) | 5 (83.3%) |
| 35 to 44 Years | 20 (71.4%) | 0 (0.0%) |
| 45 to 54 Years | 36 (83.7%) | 0 (0.0%) |
| 55 to 59 Years | 8 (44.4%) | 1 (12.5%) |
| 60 to 64 Years | 0 (0.0%) | 0 (0.0%) |
| 65 to 74 Years | 7 (38.9%) | 0 (0.0%) |
| 75 Years and over | 1 (4.2%) | 0 (0.0%) |
| Total | 84 (50.0%) | 6 (7.1%) |
Employment Status by Educational Attainment in Fredonia Biscoe
According to labor force statistics for Fredonia Biscoe, 62.1% of individuals (72) out of the total population between 25 and 64 years of age (116) are in the labor force, with 8.3% or 6 of them being unemployed. The group with the highest labor force participation rate are those with the educational attainment of bachelor's degree or higher, with 87.0% or 20 individuals in the labor force. Within the labor force, individuals with high school diploma education have the highest percentage of unemployment, with 14.3% or 6 of them being unemployed.
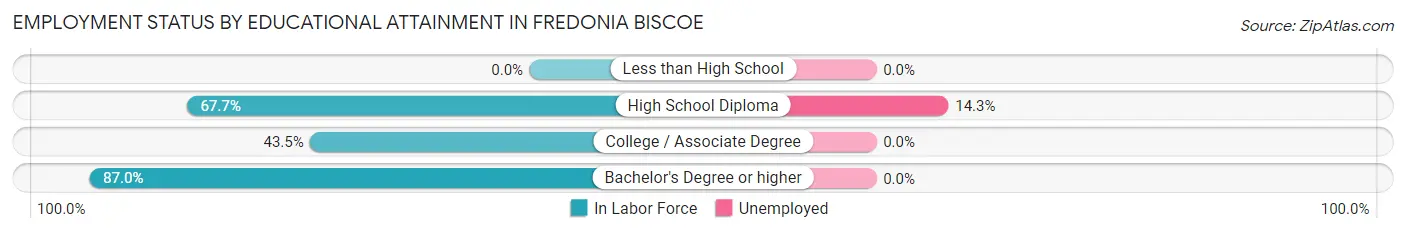
| Educational Attainment | In Labor Force | Unemployed |
| Less than High School | 0 (0.0%) | 0 (0.0%) |
| High School Diploma | 42 (67.7%) | 9 (14.3%) |
| College / Associate Degree | 10 (43.5%) | 0 (0.0%) |
| Bachelor's Degree or higher | 20 (87.0%) | 0 (0.0%) |
| Total | 72 (62.1%) | 10 (8.3%) |
Employment Occupations by Sex in Fredonia Biscoe
Management, Business, Science and Arts Occupations
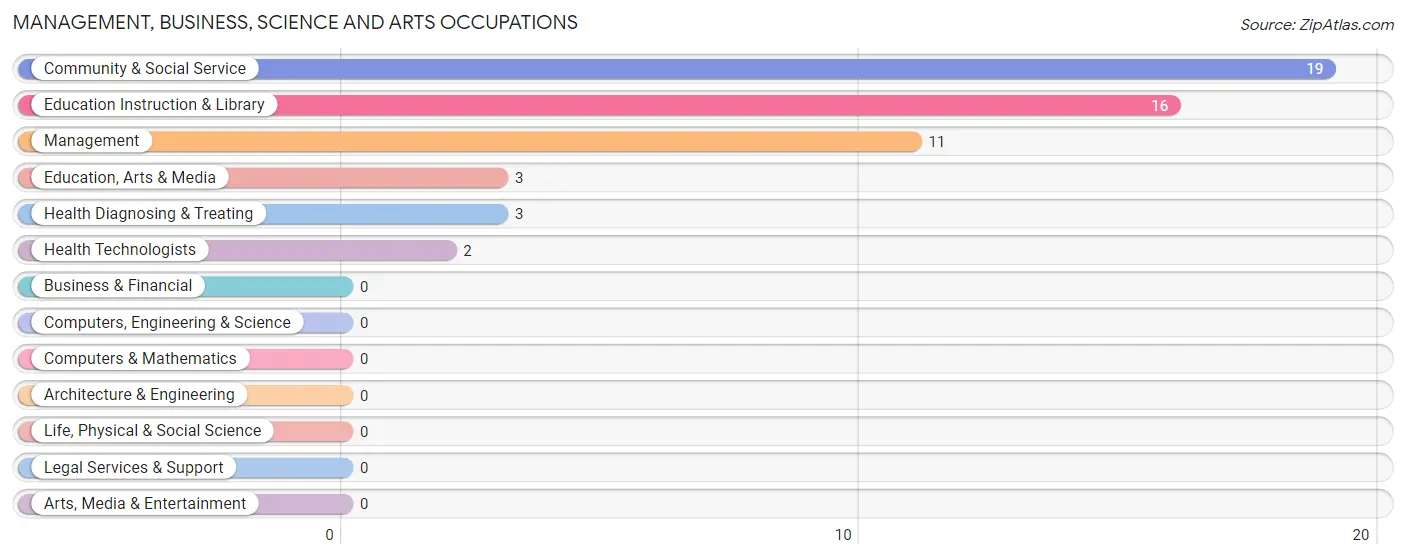
The most common Management, Business, Science and Arts occupations in Fredonia Biscoe are Community & Social Service (19 | 24.4%), Education Instruction & Library (16 | 20.5%), Management (11 | 14.1%), Education, Arts & Media (3 | 3.8%), and Health Diagnosing & Treating (3 | 3.8%).
Management, Business, Science and Arts Occupations by Sex
Within the Management, Business, Science and Arts occupations in Fredonia Biscoe, the most male-oriented occupations are Education, Arts & Media (100.0%), Management (81.8%), and Community & Social Service (26.3%), while the most female-oriented occupations are Health Diagnosing & Treating (100.0%), Health Technologists (100.0%), and Education Instruction & Library (87.5%).
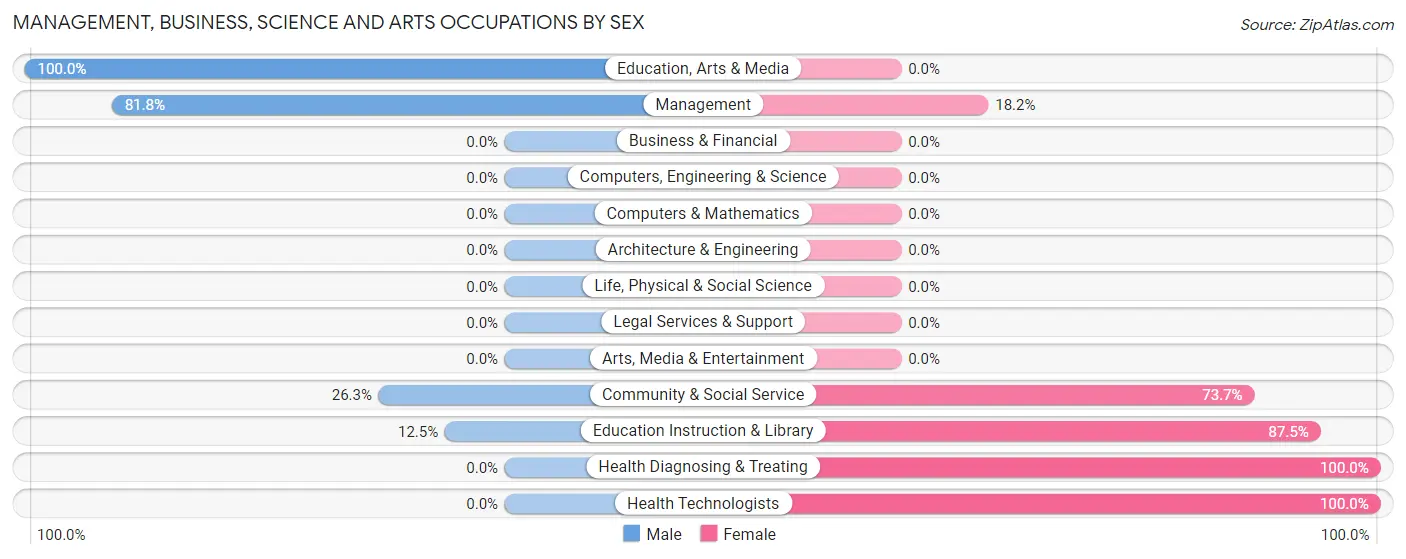
| Occupation | Male | Female |
| Management | 9 (81.8%) | 2 (18.2%) |
| Business & Financial | 0 (0.0%) | 0 (0.0%) |
| Computers, Engineering & Science | 0 (0.0%) | 0 (0.0%) |
| Computers & Mathematics | 0 (0.0%) | 0 (0.0%) |
| Architecture & Engineering | 0 (0.0%) | 0 (0.0%) |
| Life, Physical & Social Science | 0 (0.0%) | 0 (0.0%) |
| Community & Social Service | 5 (26.3%) | 14 (73.7%) |
| Education, Arts & Media | 3 (100.0%) | 0 (0.0%) |
| Legal Services & Support | 0 (0.0%) | 0 (0.0%) |
| Education Instruction & Library | 2 (12.5%) | 14 (87.5%) |
| Arts, Media & Entertainment | 0 (0.0%) | 0 (0.0%) |
| Health Diagnosing & Treating | 0 (0.0%) | 3 (100.0%) |
| Health Technologists | 0 (0.0%) | 2 (100.0%) |
| Total (Category) | 14 (42.4%) | 19 (57.6%) |
| Total (Overall) | 46 (59.0%) | 32 (41.0%) |
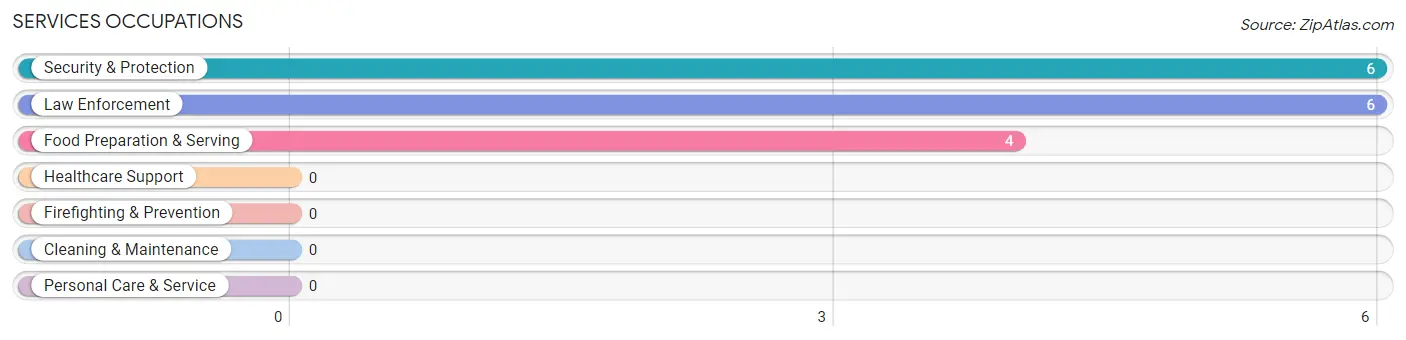
Services Occupations
The most common Services occupations in Fredonia Biscoe are Security & Protection (6 | 7.7%), Law Enforcement (6 | 7.7%), and Food Preparation & Serving (4 | 5.1%).
Services Occupations by Sex
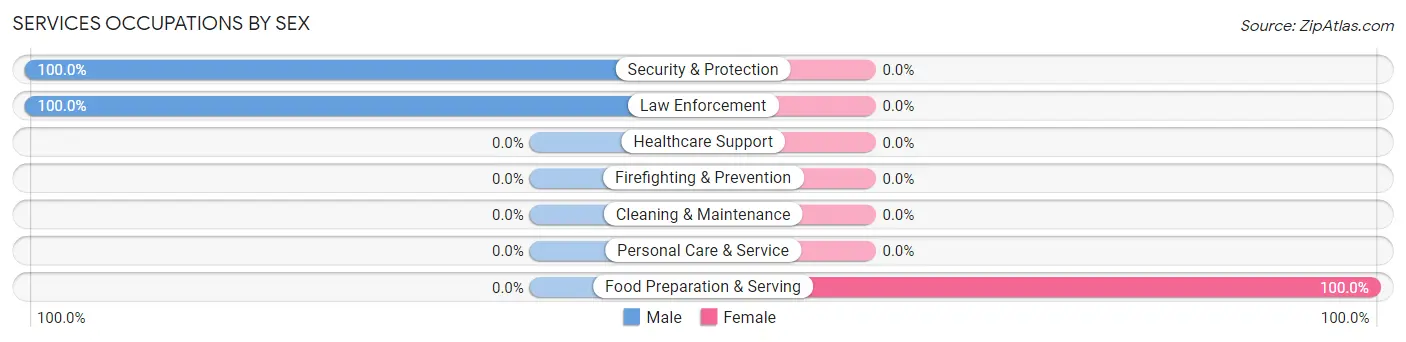
| Occupation | Male | Female |
| Healthcare Support | 0 (0.0%) | 0 (0.0%) |
| Security & Protection | 6 (100.0%) | 0 (0.0%) |
| Firefighting & Prevention | 0 (0.0%) | 0 (0.0%) |
| Law Enforcement | 6 (100.0%) | 0 (0.0%) |
| Food Preparation & Serving | 0 (0.0%) | 4 (100.0%) |
| Cleaning & Maintenance | 0 (0.0%) | 0 (0.0%) |
| Personal Care & Service | 0 (0.0%) | 0 (0.0%) |
| Total (Category) | 6 (60.0%) | 4 (40.0%) |
| Total (Overall) | 46 (59.0%) | 32 (41.0%) |
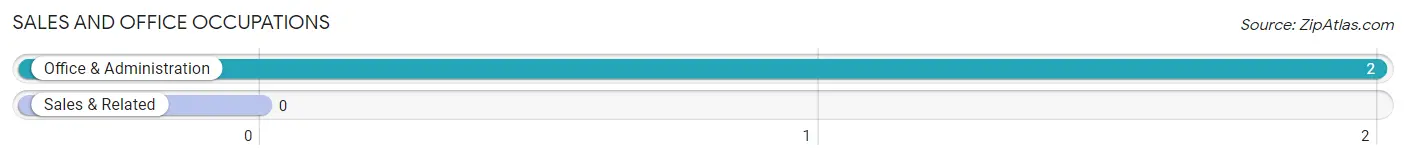
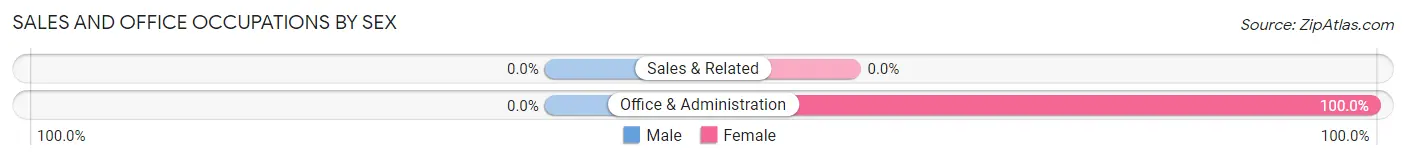
Sales and Office Occupations
The most common Sales and Office occupations in Fredonia Biscoe are , and Office & Administration (2 | 2.6%).
Sales and Office Occupations by Sex
| Occupation | Male | Female |
| Sales & Related | 0 (0.0%) | 0 (0.0%) |
| Office & Administration | 0 (0.0%) | 2 (100.0%) |
| Total (Category) | 0 (0.0%) | 2 (100.0%) |
| Total (Overall) | 46 (59.0%) | 32 (41.0%) |
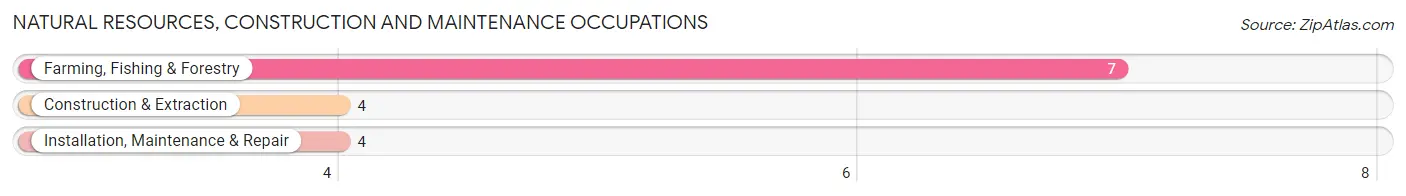
Natural Resources, Construction and Maintenance Occupations
The most common Natural Resources, Construction and Maintenance occupations in Fredonia Biscoe are Farming, Fishing & Forestry (7 | 9.0%), Construction & Extraction (4 | 5.1%), and Installation, Maintenance & Repair (4 | 5.1%).
Natural Resources, Construction and Maintenance Occupations by Sex
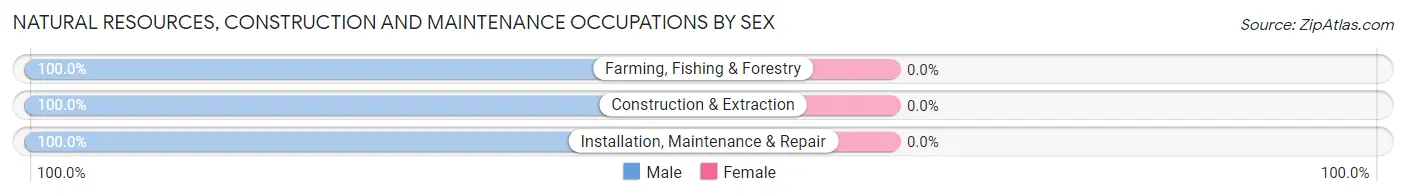
| Occupation | Male | Female |
| Farming, Fishing & Forestry | 7 (100.0%) | 0 (0.0%) |
| Construction & Extraction | 4 (100.0%) | 0 (0.0%) |
| Installation, Maintenance & Repair | 4 (100.0%) | 0 (0.0%) |
| Total (Category) | 15 (100.0%) | 0 (0.0%) |
| Total (Overall) | 46 (59.0%) | 32 (41.0%) |
Production, Transportation and Moving Occupations
The most common Production, Transportation and Moving occupations in Fredonia Biscoe are Transportation (8 | 10.3%), Production (7 | 9.0%), and Material Moving (3 | 3.8%).
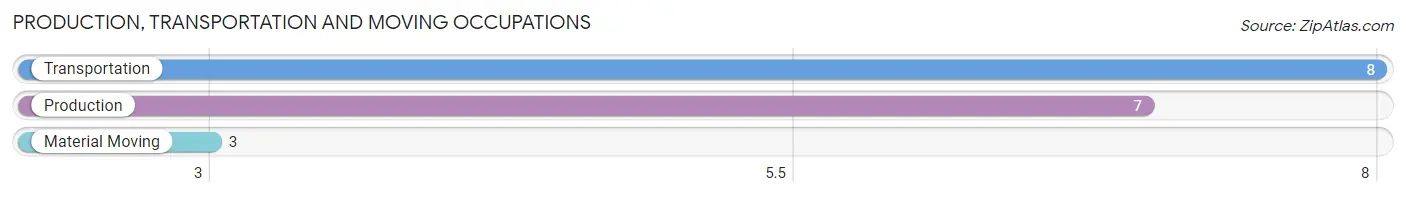
Production, Transportation and Moving Occupations by Sex
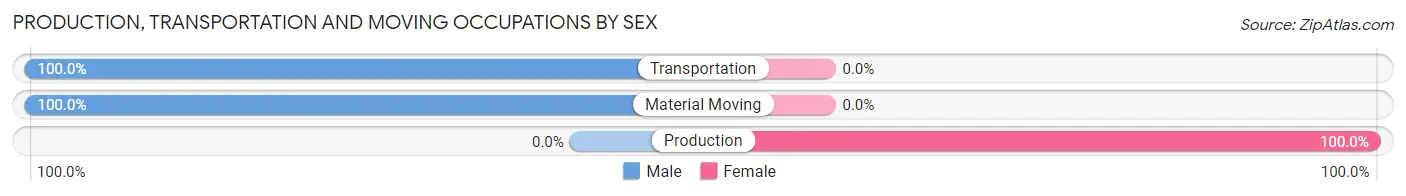
| Occupation | Male | Female |
| Production | 0 (0.0%) | 7 (100.0%) |
| Transportation | 8 (100.0%) | 0 (0.0%) |
| Material Moving | 3 (100.0%) | 0 (0.0%) |
| Total (Category) | 11 (61.1%) | 7 (38.9%) |
| Total (Overall) | 46 (59.0%) | 32 (41.0%) |
Employment Industries by Sex in Fredonia Biscoe
Employment Industries in Fredonia Biscoe
The major employment industries in Fredonia Biscoe include Agriculture, Fishing & Hunting (14 | 17.9%), Manufacturing (12 | 15.4%), Health Care & Social Assistance (12 | 15.4%), Educational Services (9 | 11.5%), and Public Administration (6 | 7.7%).
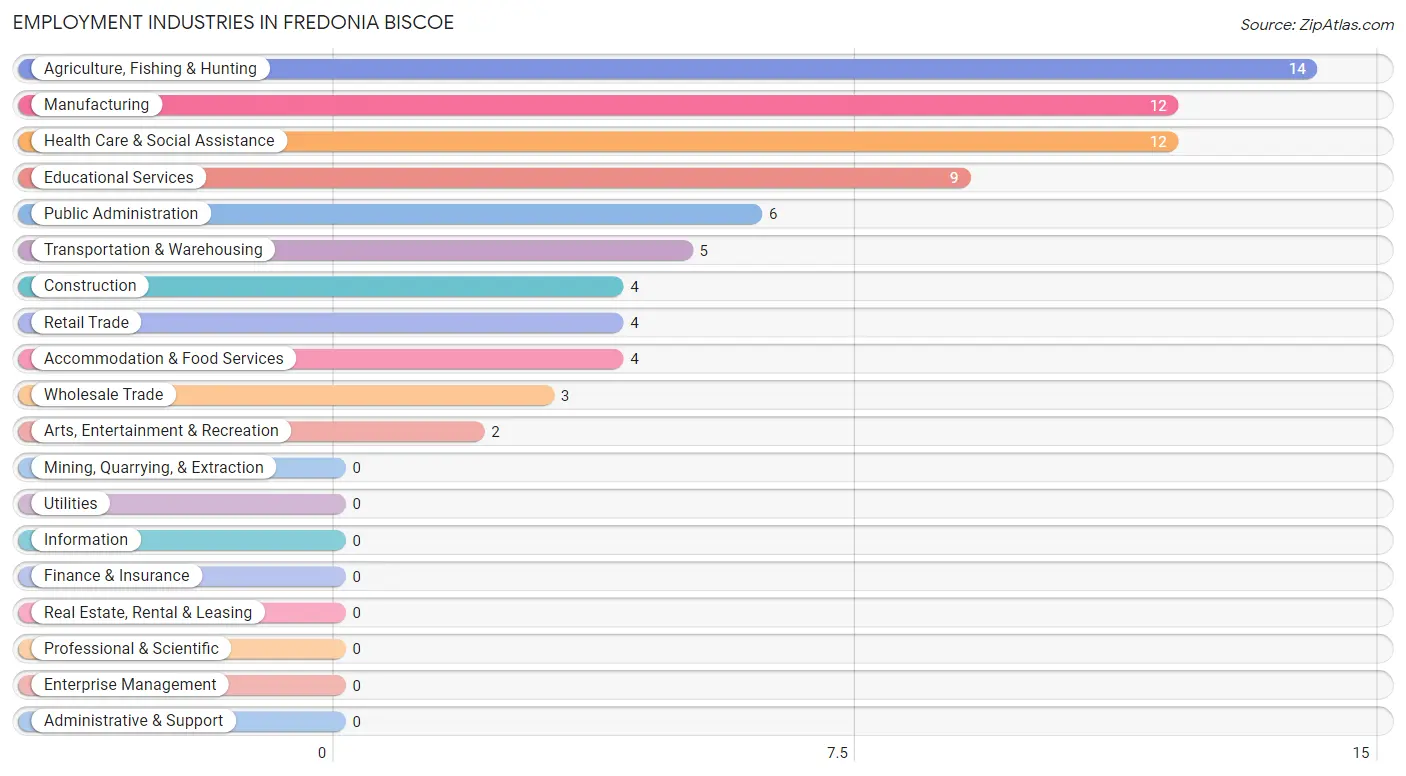
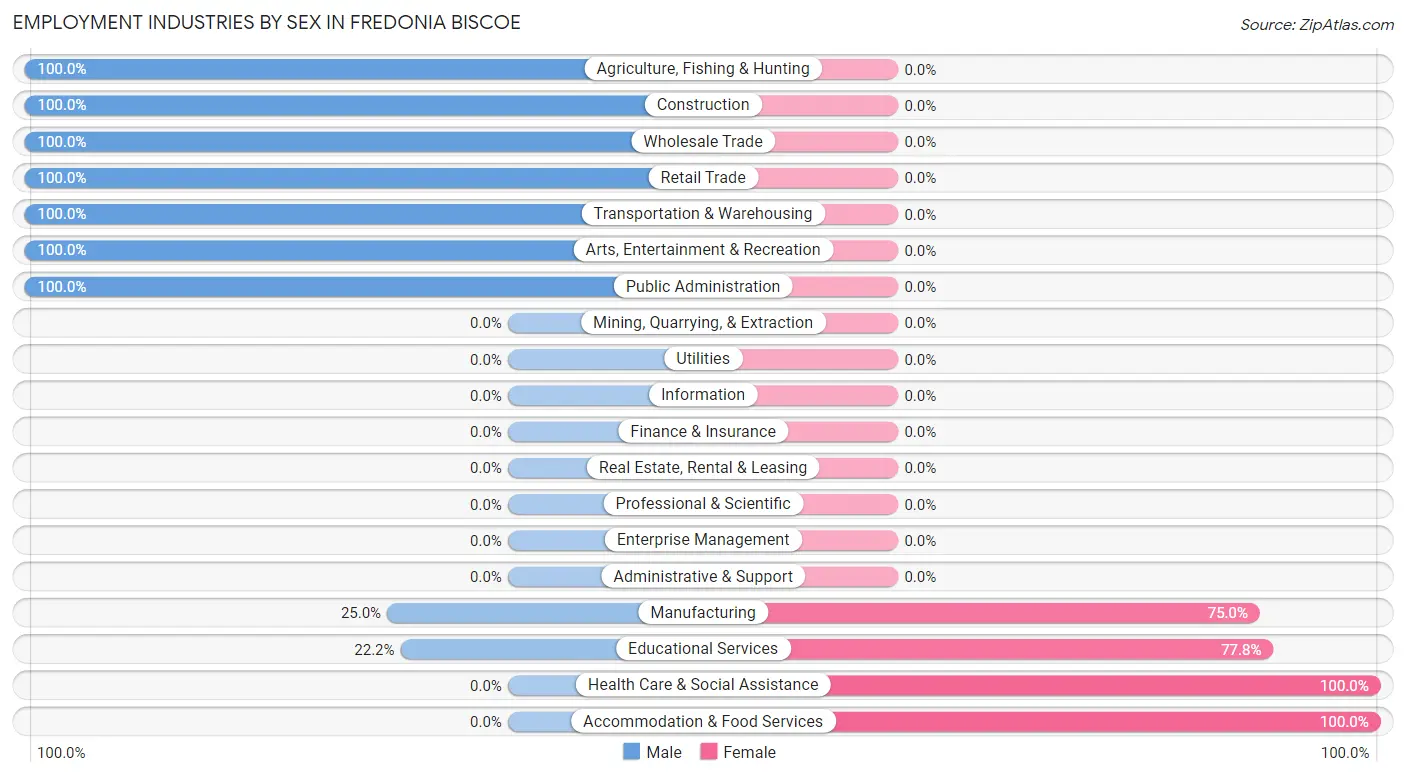
Employment Industries by Sex in Fredonia Biscoe
The Fredonia Biscoe industries that see more men than women are Agriculture, Fishing & Hunting (100.0%), Construction (100.0%), and Wholesale Trade (100.0%), whereas the industries that tend to have a higher number of women are Health Care & Social Assistance (100.0%), Accommodation & Food Services (100.0%), and Educational Services (77.8%).
| Industry | Male | Female |
| Agriculture, Fishing & Hunting | 14 (100.0%) | 0 (0.0%) |
| Mining, Quarrying, & Extraction | 0 (0.0%) | 0 (0.0%) |
| Construction | 4 (100.0%) | 0 (0.0%) |
| Manufacturing | 3 (25.0%) | 9 (75.0%) |
| Wholesale Trade | 3 (100.0%) | 0 (0.0%) |
| Retail Trade | 4 (100.0%) | 0 (0.0%) |
| Transportation & Warehousing | 5 (100.0%) | 0 (0.0%) |
| Utilities | 0 (0.0%) | 0 (0.0%) |
| Information | 0 (0.0%) | 0 (0.0%) |
| Finance & Insurance | 0 (0.0%) | 0 (0.0%) |
| Real Estate, Rental & Leasing | 0 (0.0%) | 0 (0.0%) |
| Professional & Scientific | 0 (0.0%) | 0 (0.0%) |
| Enterprise Management | 0 (0.0%) | 0 (0.0%) |
| Administrative & Support | 0 (0.0%) | 0 (0.0%) |
| Educational Services | 2 (22.2%) | 7 (77.8%) |
| Health Care & Social Assistance | 0 (0.0%) | 12 (100.0%) |
| Arts, Entertainment & Recreation | 2 (100.0%) | 0 (0.0%) |
| Accommodation & Food Services | 0 (0.0%) | 4 (100.0%) |
| Public Administration | 6 (100.0%) | 0 (0.0%) |
| Total | 46 (59.0%) | 32 (41.0%) |
Education in Fredonia Biscoe
School Enrollment in Fredonia Biscoe
The most common levels of schooling among the 38 students in Fredonia Biscoe are middle school (17 | 44.7%), high school (7 | 18.4%), and college / undergraduate (6 | 15.8%).
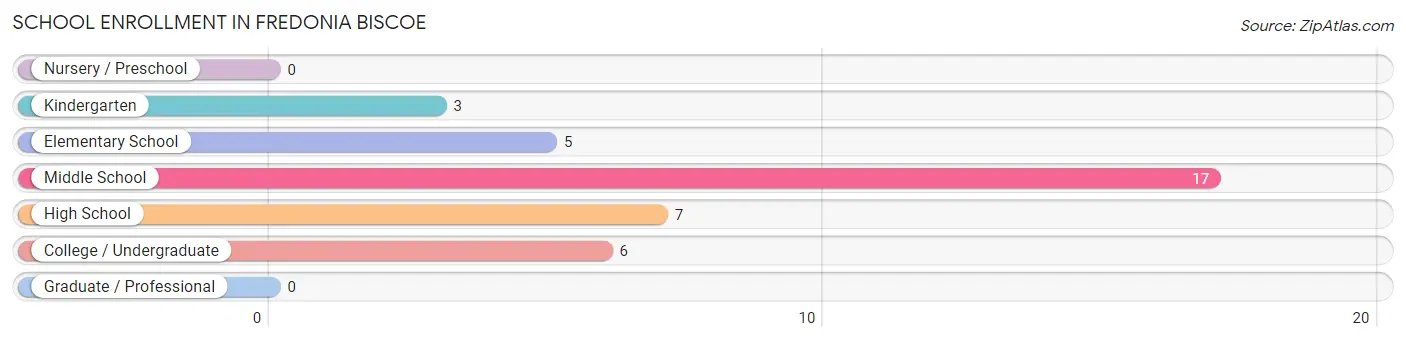
| School Level | # Students | % Students |
| Nursery / Preschool | 0 | 0.0% |
| Kindergarten | 3 | 7.9% |
| Elementary School | 5 | 13.2% |
| Middle School | 17 | 44.7% |
| High School | 7 | 18.4% |
| College / Undergraduate | 6 | 15.8% |
| Graduate / Professional | 0 | 0.0% |
| Total | 38 | 100.0% |
School Enrollment by Age by Funding Source in Fredonia Biscoe
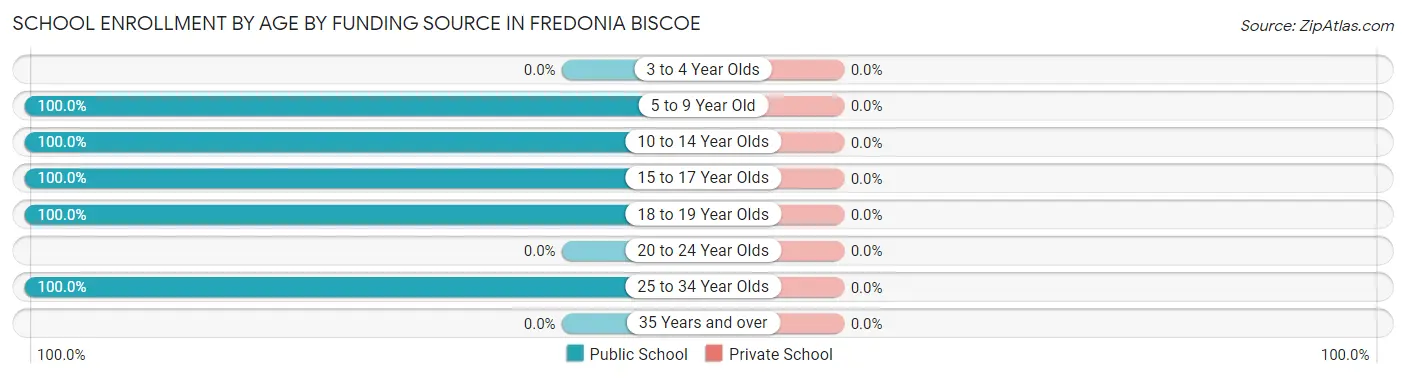
| Age Bracket | Public School | Private School |
| 3 to 4 Year Olds | 0 (0.0%) | 0 (0.0%) |
| 5 to 9 Year Old | 8 (100.0%) | 0 (0.0%) |
| 10 to 14 Year Olds | 17 (100.0%) | 0 (0.0%) |
| 15 to 17 Year Olds | 7 (100.0%) | 0 (0.0%) |
| 18 to 19 Year Olds | 3 (100.0%) | 0 (0.0%) |
| 20 to 24 Year Olds | 0 (0.0%) | 0 (0.0%) |
| 25 to 34 Year Olds | 3 (100.0%) | 0 (0.0%) |
| 35 Years and over | 0 (0.0%) | 0 (0.0%) |
| Total | 38 (100.0%) | 0 (0.0%) |
Educational Attainment by Field of Study in Fredonia Biscoe
Education (8 | 28.6%), literature & languages (6 | 21.4%), arts & humanities (5 | 17.9%), liberal arts & history (3 | 10.7%), and bio, nature & agricultural (2 | 7.1%) are the most common fields of study among 28 individuals in Fredonia Biscoe who have obtained a bachelor's degree or higher.
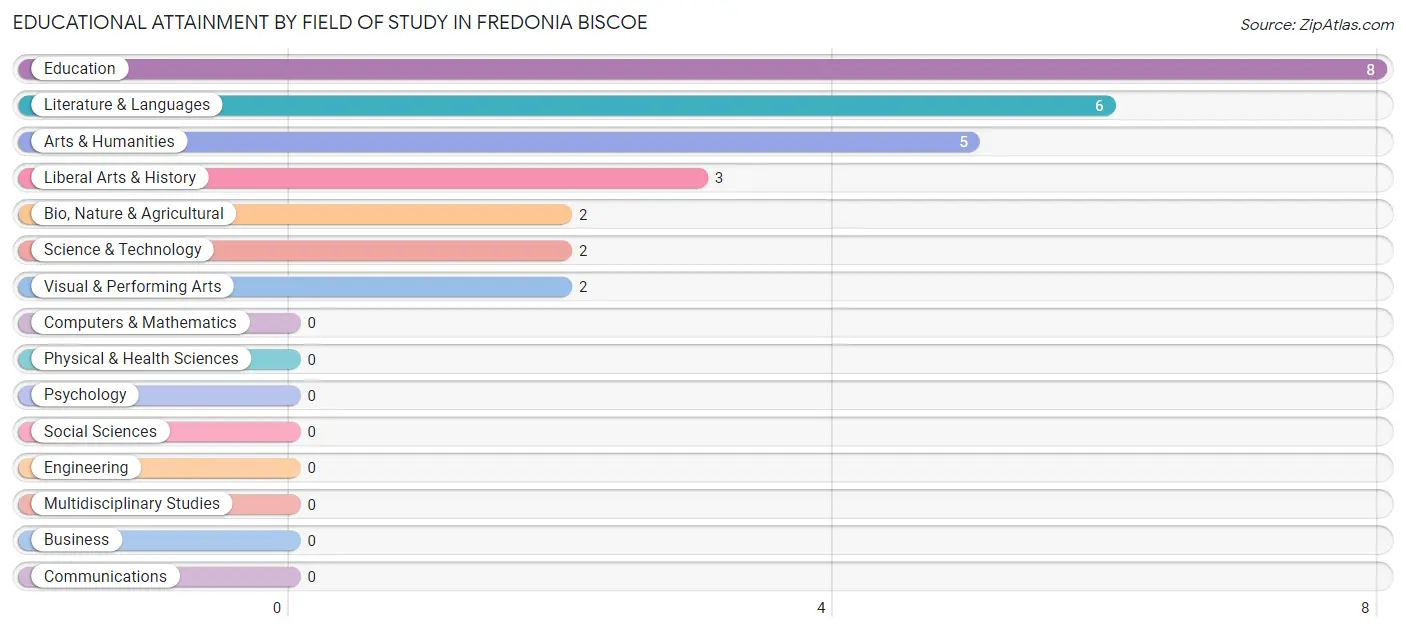
| Field of Study | # Graduates | % Graduates |
| Computers & Mathematics | 0 | 0.0% |
| Bio, Nature & Agricultural | 2 | 7.1% |
| Physical & Health Sciences | 0 | 0.0% |
| Psychology | 0 | 0.0% |
| Social Sciences | 0 | 0.0% |
| Engineering | 0 | 0.0% |
| Multidisciplinary Studies | 0 | 0.0% |
| Science & Technology | 2 | 7.1% |
| Business | 0 | 0.0% |
| Education | 8 | 28.6% |
| Literature & Languages | 6 | 21.4% |
| Liberal Arts & History | 3 | 10.7% |
| Visual & Performing Arts | 2 | 7.1% |
| Communications | 0 | 0.0% |
| Arts & Humanities | 5 | 17.9% |
| Total | 28 | 100.0% |
Transportation & Commute in Fredonia Biscoe
Vehicle Availability by Sex in Fredonia Biscoe
The most prevalent vehicle ownership categories in Fredonia Biscoe are males with 2 vehicles (22, accounting for 47.8%) and females with 2 vehicles (9, making up 68.8%).
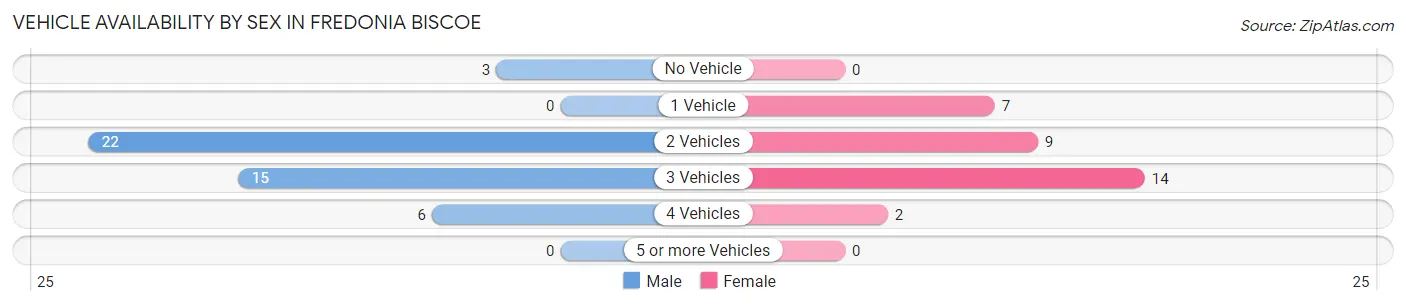
| Vehicles Available | Male | Female |
| No Vehicle | 3 (6.5%) | 0 (0.0%) |
| 1 Vehicle | 0 (0.0%) | 7 (21.9%) |
| 2 Vehicles | 22 (47.8%) | 9 (28.1%) |
| 3 Vehicles | 15 (32.6%) | 14 (43.8%) |
| 4 Vehicles | 6 (13.0%) | 2 (6.2%) |
| 5 or more Vehicles | 0 (0.0%) | 0 (0.0%) |
| Total | 46 (100.0%) | 32 (100.0%) |
Commute Time in Fredonia Biscoe
The most frequently occuring commute durations in Fredonia Biscoe are 30 to 34 minutes (21 commuters, 26.9%), 15 to 19 minutes (18 commuters, 23.1%), and 60 to 89 minutes (17 commuters, 21.8%).
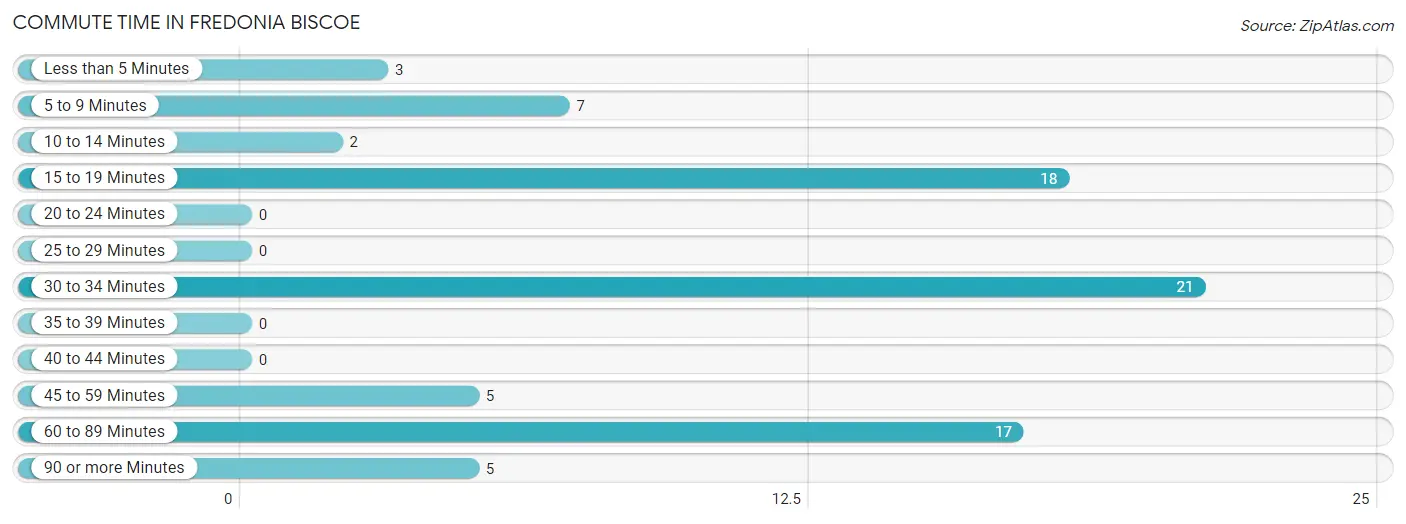
| Commute Time | # Commuters | % Commuters |
| Less than 5 Minutes | 3 | 3.8% |
| 5 to 9 Minutes | 7 | 9.0% |
| 10 to 14 Minutes | 2 | 2.6% |
| 15 to 19 Minutes | 18 | 23.1% |
| 20 to 24 Minutes | 0 | 0.0% |
| 25 to 29 Minutes | 0 | 0.0% |
| 30 to 34 Minutes | 21 | 26.9% |
| 35 to 39 Minutes | 0 | 0.0% |
| 40 to 44 Minutes | 0 | 0.0% |
| 45 to 59 Minutes | 5 | 6.4% |
| 60 to 89 Minutes | 17 | 21.8% |
| 90 or more Minutes | 5 | 6.4% |
Commute Time by Sex in Fredonia Biscoe
The most common commute times in Fredonia Biscoe are 15 to 19 minutes (13 commuters, 28.3%) for males and 30 to 34 minutes (16 commuters, 50.0%) for females.
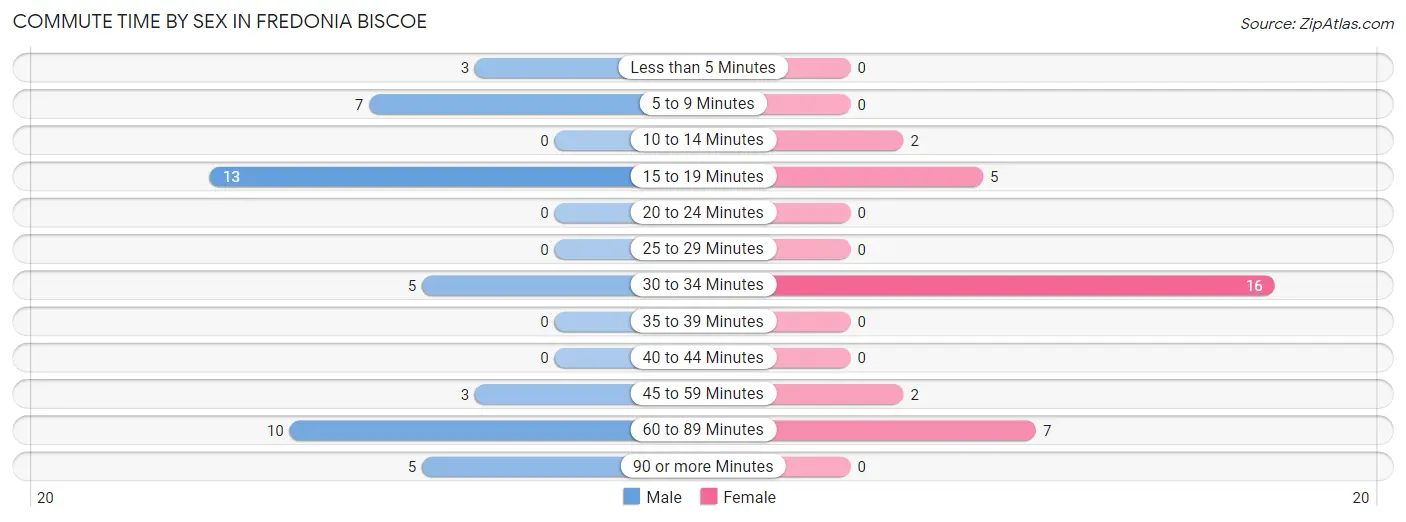
| Commute Time | Male | Female |
| Less than 5 Minutes | 3 (6.5%) | 0 (0.0%) |
| 5 to 9 Minutes | 7 (15.2%) | 0 (0.0%) |
| 10 to 14 Minutes | 0 (0.0%) | 2 (6.2%) |
| 15 to 19 Minutes | 13 (28.3%) | 5 (15.6%) |
| 20 to 24 Minutes | 0 (0.0%) | 0 (0.0%) |
| 25 to 29 Minutes | 0 (0.0%) | 0 (0.0%) |
| 30 to 34 Minutes | 5 (10.9%) | 16 (50.0%) |
| 35 to 39 Minutes | 0 (0.0%) | 0 (0.0%) |
| 40 to 44 Minutes | 0 (0.0%) | 0 (0.0%) |
| 45 to 59 Minutes | 3 (6.5%) | 2 (6.2%) |
| 60 to 89 Minutes | 10 (21.7%) | 7 (21.9%) |
| 90 or more Minutes | 5 (10.9%) | 0 (0.0%) |
Time of Departure to Work by Sex in Fredonia Biscoe
The most frequent times of departure to work in Fredonia Biscoe are 7:00 AM to 7:29 AM (13, 28.3%) for males and 5:30 AM to 5:59 AM (14, 43.8%) for females.
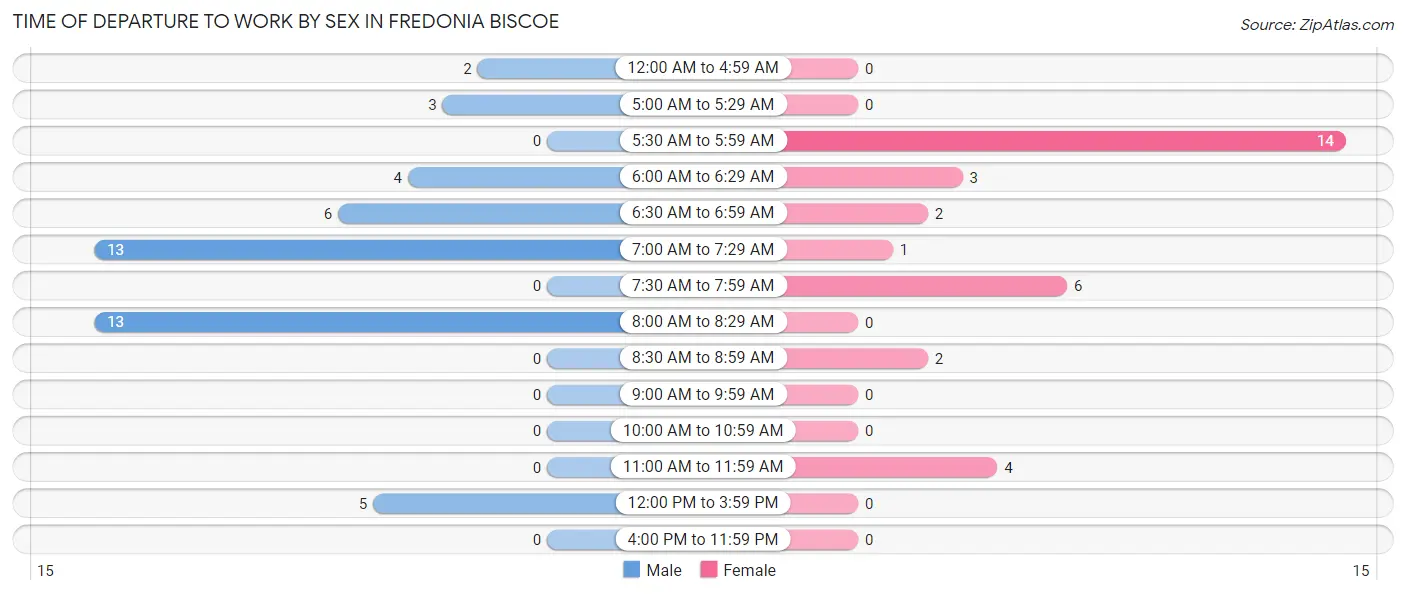
| Time of Departure | Male | Female |
| 12:00 AM to 4:59 AM | 2 (4.3%) | 0 (0.0%) |
| 5:00 AM to 5:29 AM | 3 (6.5%) | 0 (0.0%) |
| 5:30 AM to 5:59 AM | 0 (0.0%) | 14 (43.8%) |
| 6:00 AM to 6:29 AM | 4 (8.7%) | 3 (9.4%) |
| 6:30 AM to 6:59 AM | 6 (13.0%) | 2 (6.2%) |
| 7:00 AM to 7:29 AM | 13 (28.3%) | 1 (3.1%) |
| 7:30 AM to 7:59 AM | 0 (0.0%) | 6 (18.8%) |
| 8:00 AM to 8:29 AM | 13 (28.3%) | 0 (0.0%) |
| 8:30 AM to 8:59 AM | 0 (0.0%) | 2 (6.2%) |
| 9:00 AM to 9:59 AM | 0 (0.0%) | 0 (0.0%) |
| 10:00 AM to 10:59 AM | 0 (0.0%) | 0 (0.0%) |
| 11:00 AM to 11:59 AM | 0 (0.0%) | 4 (12.5%) |
| 12:00 PM to 3:59 PM | 5 (10.9%) | 0 (0.0%) |
| 4:00 PM to 11:59 PM | 0 (0.0%) | 0 (0.0%) |
| Total | 46 (100.0%) | 32 (100.0%) |
Housing Occupancy in Fredonia Biscoe
Occupancy by Ownership in Fredonia Biscoe
Of the total 82 dwellings in Fredonia Biscoe, owner-occupied units account for 53 (64.6%), while renter-occupied units make up 29 (35.4%).
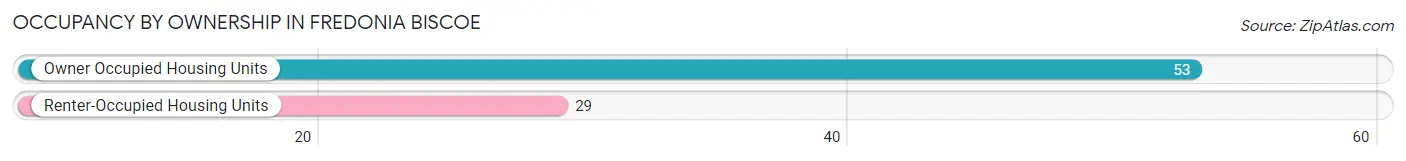
| Occupancy | # Housing Units | % Housing Units |
| Owner Occupied Housing Units | 53 | 64.6% |
| Renter-Occupied Housing Units | 29 | 35.4% |
| Total Occupied Housing Units | 82 | 100.0% |
Occupancy by Household Size in Fredonia Biscoe
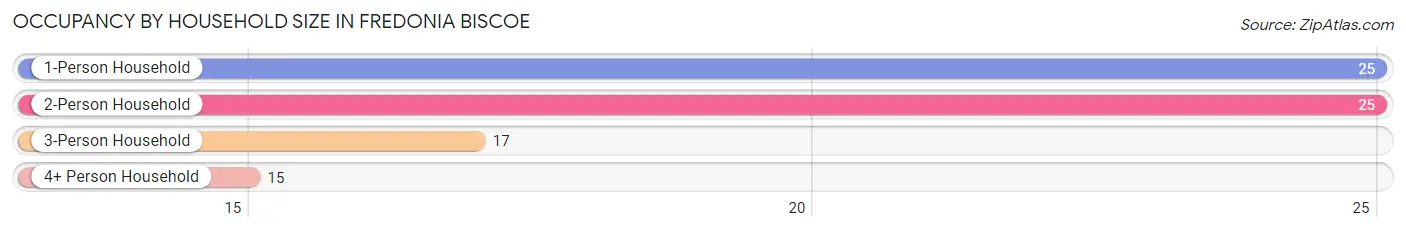
| Household Size | # Housing Units | % Housing Units |
| 1-Person Household | 25 | 30.5% |
| 2-Person Household | 25 | 30.5% |
| 3-Person Household | 17 | 20.7% |
| 4+ Person Household | 15 | 18.3% |
| Total Housing Units | 82 | 100.0% |
Occupancy by Ownership by Household Size in Fredonia Biscoe
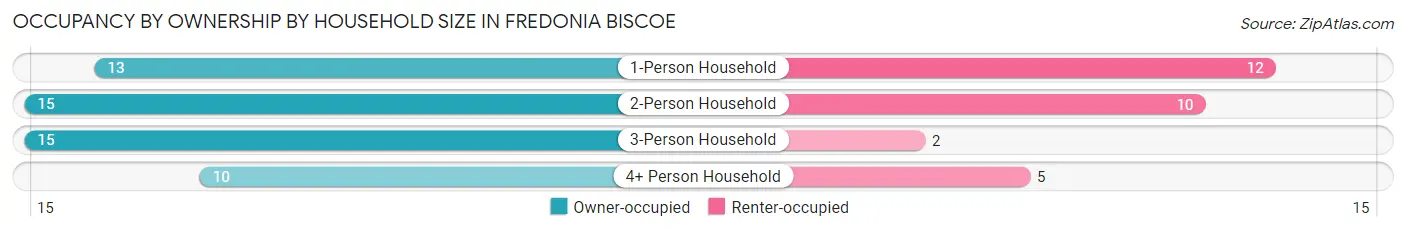
| Household Size | Owner-occupied | Renter-occupied |
| 1-Person Household | 13 (52.0%) | 12 (48.0%) |
| 2-Person Household | 15 (60.0%) | 10 (40.0%) |
| 3-Person Household | 15 (88.2%) | 2 (11.8%) |
| 4+ Person Household | 10 (66.7%) | 5 (33.3%) |
| Total Housing Units | 53 (64.6%) | 29 (35.4%) |
Occupancy by Educational Attainment in Fredonia Biscoe
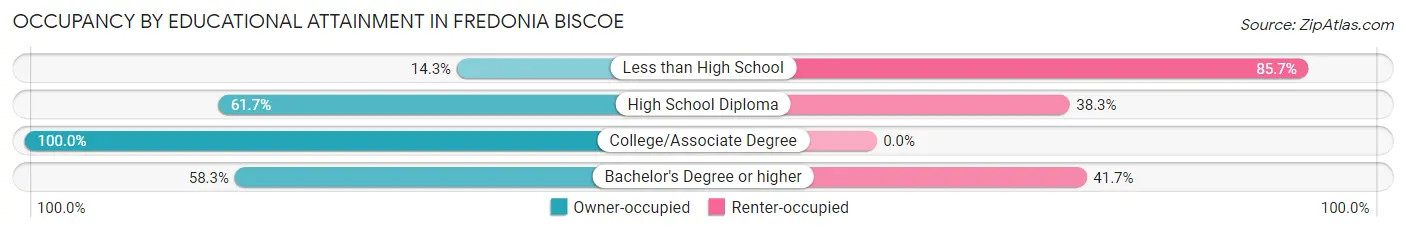
| Household Size | Owner-occupied | Renter-occupied |
| Less than High School | 1 (14.3%) | 6 (85.7%) |
| High School Diploma | 29 (61.7%) | 18 (38.3%) |
| College/Associate Degree | 16 (100.0%) | 0 (0.0%) |
| Bachelor's Degree or higher | 7 (58.3%) | 5 (41.7%) |
Occupancy by Age of Householder in Fredonia Biscoe
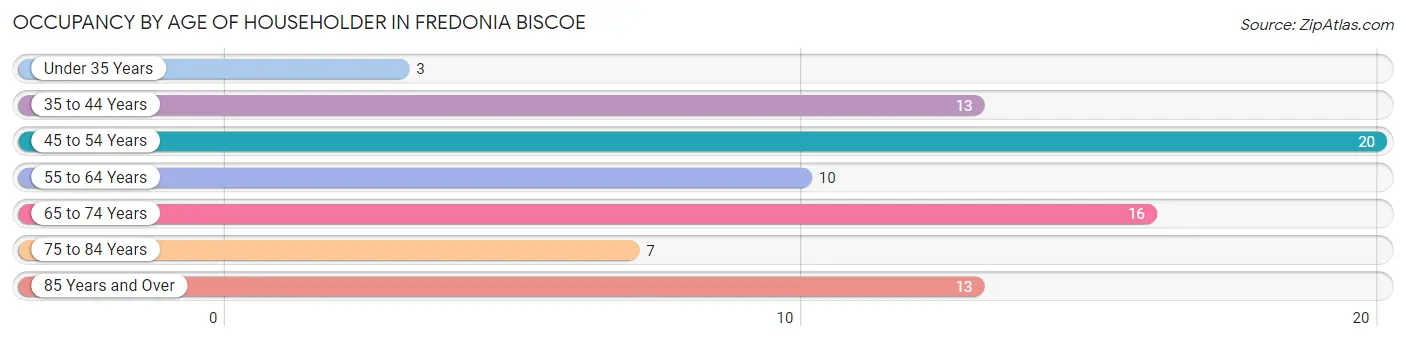
| Age Bracket | # Households | % Households |
| Under 35 Years | 3 | 3.7% |
| 35 to 44 Years | 13 | 15.9% |
| 45 to 54 Years | 20 | 24.4% |
| 55 to 64 Years | 10 | 12.2% |
| 65 to 74 Years | 16 | 19.5% |
| 75 to 84 Years | 7 | 8.5% |
| 85 Years and Over | 13 | 15.9% |
| Total | 82 | 100.0% |
Housing Finances in Fredonia Biscoe
Median Income by Occupancy in Fredonia Biscoe
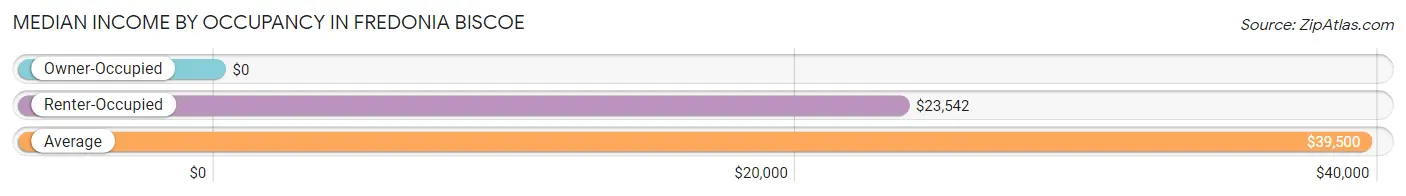
| Occupancy Type | # Households | Median Income |
| Owner-Occupied | 53 (64.6%) | $0 |
| Renter-Occupied | 29 (35.4%) | $23,542 |
| Average | 82 (100.0%) | $39,500 |
Occupancy by Householder Income Bracket in Fredonia Biscoe
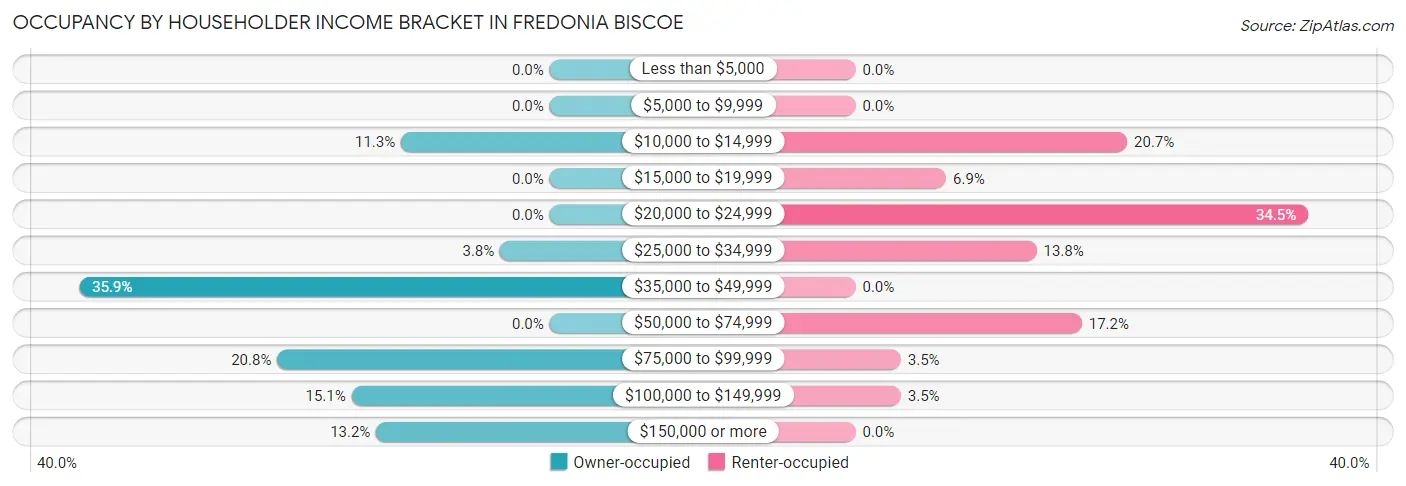
| Income Bracket | Owner-occupied | Renter-occupied |
| Less than $5,000 | 0 (0.0%) | 0 (0.0%) |
| $5,000 to $9,999 | 0 (0.0%) | 0 (0.0%) |
| $10,000 to $14,999 | 6 (11.3%) | 6 (20.7%) |
| $15,000 to $19,999 | 0 (0.0%) | 2 (6.9%) |
| $20,000 to $24,999 | 0 (0.0%) | 10 (34.5%) |
| $25,000 to $34,999 | 2 (3.8%) | 4 (13.8%) |
| $35,000 to $49,999 | 19 (35.8%) | 0 (0.0%) |
| $50,000 to $74,999 | 0 (0.0%) | 5 (17.2%) |
| $75,000 to $99,999 | 11 (20.7%) | 1 (3.5%) |
| $100,000 to $149,999 | 8 (15.1%) | 1 (3.5%) |
| $150,000 or more | 7 (13.2%) | 0 (0.0%) |
| Total | 53 (100.0%) | 29 (100.0%) |
Monthly Housing Cost Tiers in Fredonia Biscoe
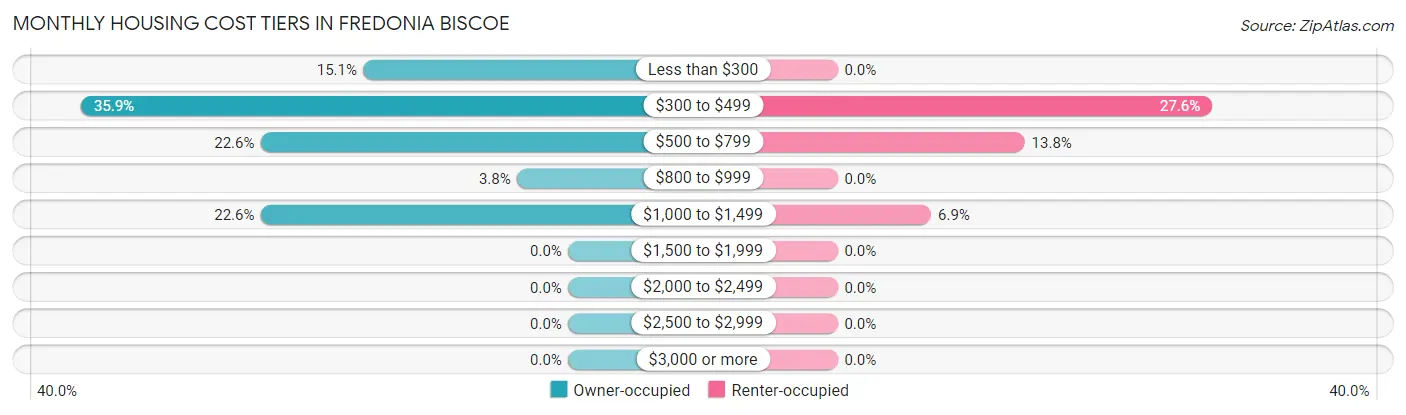
| Monthly Cost | Owner-occupied | Renter-occupied |
| Less than $300 | 8 (15.1%) | 0 (0.0%) |
| $300 to $499 | 19 (35.8%) | 8 (27.6%) |
| $500 to $799 | 12 (22.6%) | 4 (13.8%) |
| $800 to $999 | 2 (3.8%) | 0 (0.0%) |
| $1,000 to $1,499 | 12 (22.6%) | 2 (6.9%) |
| $1,500 to $1,999 | 0 (0.0%) | 0 (0.0%) |
| $2,000 to $2,499 | 0 (0.0%) | 0 (0.0%) |
| $2,500 to $2,999 | 0 (0.0%) | 0 (0.0%) |
| $3,000 or more | 0 (0.0%) | 0 (0.0%) |
| Total | 53 (100.0%) | 29 (100.0%) |
Physical Housing Characteristics in Fredonia Biscoe
Housing Structures in Fredonia Biscoe
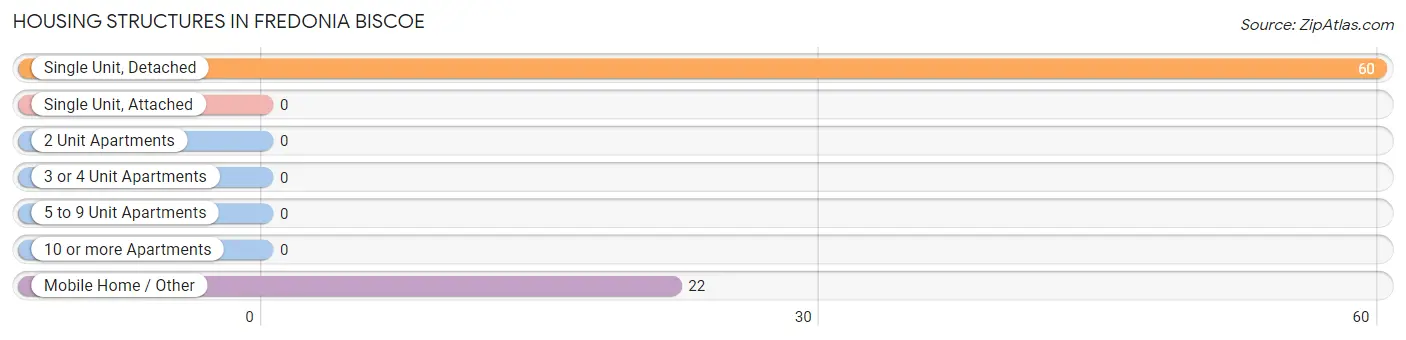
| Structure Type | # Housing Units | % Housing Units |
| Single Unit, Detached | 60 | 73.2% |
| Single Unit, Attached | 0 | 0.0% |
| 2 Unit Apartments | 0 | 0.0% |
| 3 or 4 Unit Apartments | 0 | 0.0% |
| 5 to 9 Unit Apartments | 0 | 0.0% |
| 10 or more Apartments | 0 | 0.0% |
| Mobile Home / Other | 22 | 26.8% |
| Total | 82 | 100.0% |
Housing Structures by Occupancy in Fredonia Biscoe
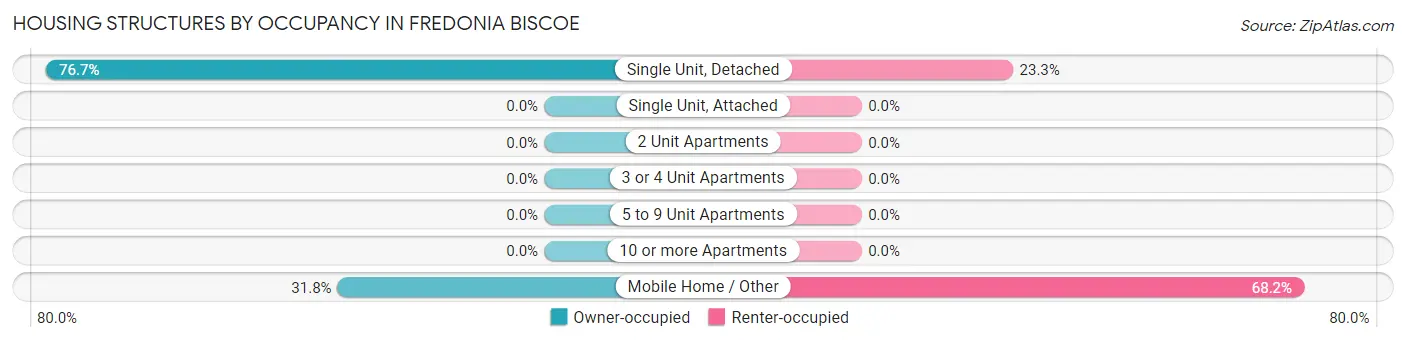
| Structure Type | Owner-occupied | Renter-occupied |
| Single Unit, Detached | 46 (76.7%) | 14 (23.3%) |
| Single Unit, Attached | 0 (0.0%) | 0 (0.0%) |
| 2 Unit Apartments | 0 (0.0%) | 0 (0.0%) |
| 3 or 4 Unit Apartments | 0 (0.0%) | 0 (0.0%) |
| 5 to 9 Unit Apartments | 0 (0.0%) | 0 (0.0%) |
| 10 or more Apartments | 0 (0.0%) | 0 (0.0%) |
| Mobile Home / Other | 7 (31.8%) | 15 (68.2%) |
| Total | 53 (64.6%) | 29 (35.4%) |
Housing Structures by Number of Rooms in Fredonia Biscoe
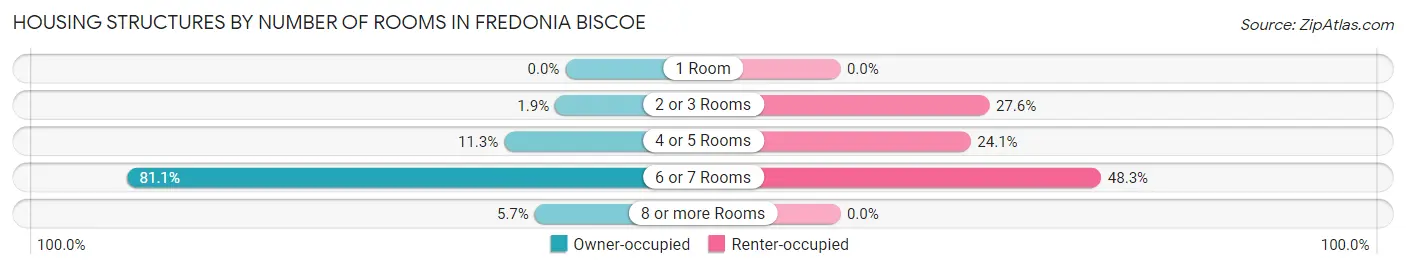
| Number of Rooms | Owner-occupied | Renter-occupied |
| 1 Room | 0 (0.0%) | 0 (0.0%) |
| 2 or 3 Rooms | 1 (1.9%) | 8 (27.6%) |
| 4 or 5 Rooms | 6 (11.3%) | 7 (24.1%) |
| 6 or 7 Rooms | 43 (81.1%) | 14 (48.3%) |
| 8 or more Rooms | 3 (5.7%) | 0 (0.0%) |
| Total | 53 (100.0%) | 29 (100.0%) |
Housing Structure by Heating Type in Fredonia Biscoe
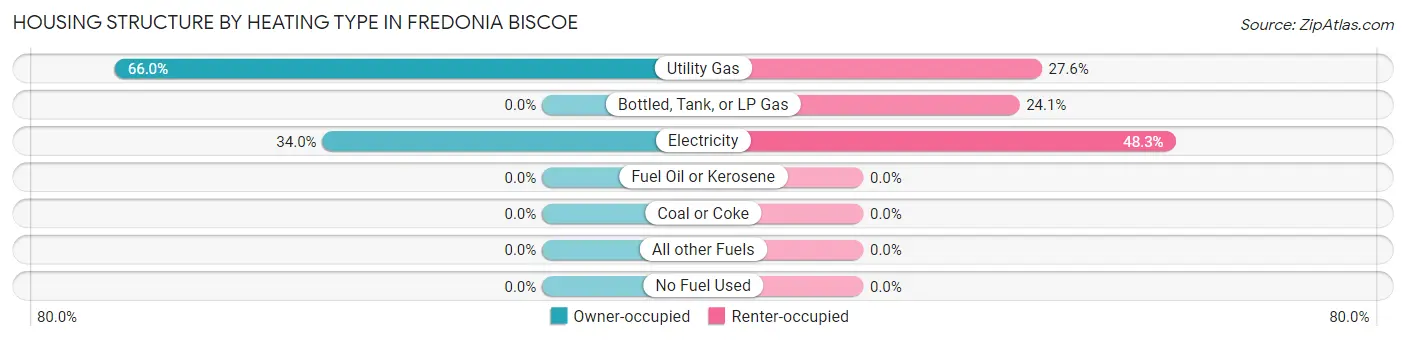
| Heating Type | Owner-occupied | Renter-occupied |
| Utility Gas | 35 (66.0%) | 8 (27.6%) |
| Bottled, Tank, or LP Gas | 0 (0.0%) | 7 (24.1%) |
| Electricity | 18 (34.0%) | 14 (48.3%) |
| Fuel Oil or Kerosene | 0 (0.0%) | 0 (0.0%) |
| Coal or Coke | 0 (0.0%) | 0 (0.0%) |
| All other Fuels | 0 (0.0%) | 0 (0.0%) |
| No Fuel Used | 0 (0.0%) | 0 (0.0%) |
| Total | 53 (100.0%) | 29 (100.0%) |
Household Vehicle Usage in Fredonia Biscoe
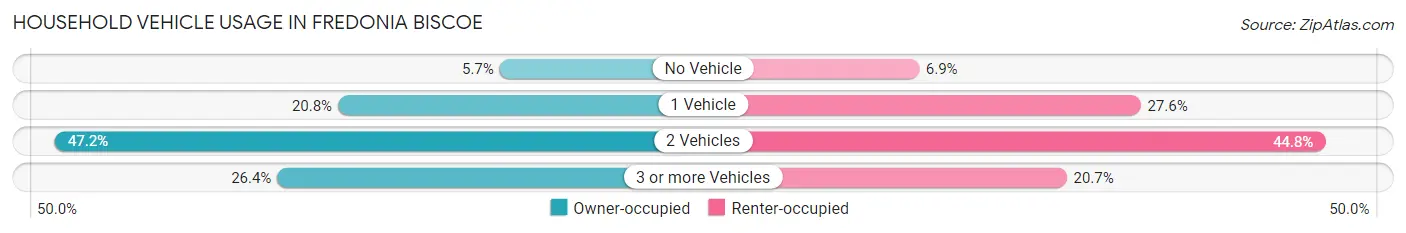
| Vehicles per Household | Owner-occupied | Renter-occupied |
| No Vehicle | 3 (5.7%) | 2 (6.9%) |
| 1 Vehicle | 11 (20.7%) | 8 (27.6%) |
| 2 Vehicles | 25 (47.2%) | 13 (44.8%) |
| 3 or more Vehicles | 14 (26.4%) | 6 (20.7%) |
| Total | 53 (100.0%) | 29 (100.0%) |
Real Estate & Mortgages in Fredonia Biscoe
Real Estate and Mortgage Overview in Fredonia Biscoe
| Characteristic | Without Mortgage | With Mortgage |
| Housing Units | 34 | 19 |
| Median Property Value | $65,000 | $65,000 |
| Median Household Income | - | - |
| Monthly Housing Costs | $388 | $0 |
| Real Estate Taxes | $342 | $4 |
Property Value by Mortgage Status in Fredonia Biscoe
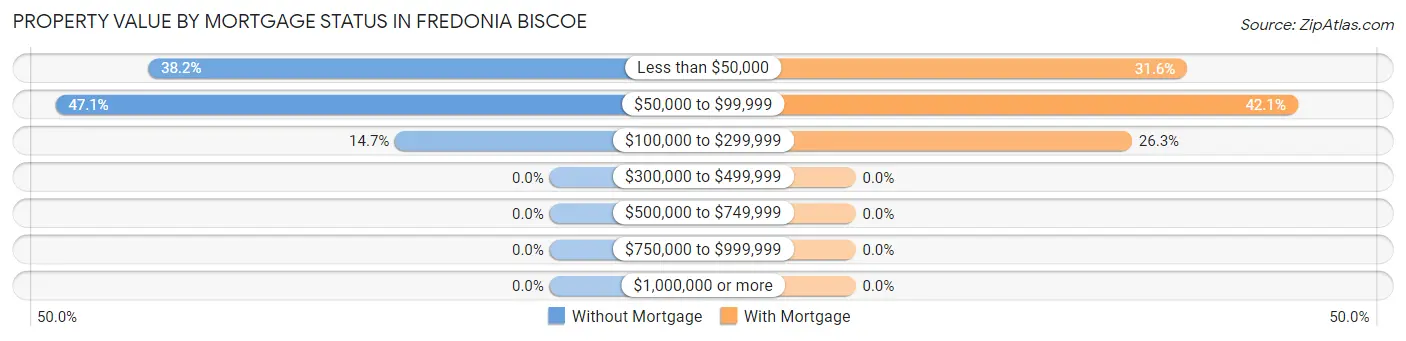
| Property Value | Without Mortgage | With Mortgage |
| Less than $50,000 | 13 (38.2%) | 6 (31.6%) |
| $50,000 to $99,999 | 16 (47.1%) | 8 (42.1%) |
| $100,000 to $299,999 | 5 (14.7%) | 5 (26.3%) |
| $300,000 to $499,999 | 0 (0.0%) | 0 (0.0%) |
| $500,000 to $749,999 | 0 (0.0%) | 0 (0.0%) |
| $750,000 to $999,999 | 0 (0.0%) | 0 (0.0%) |
| $1,000,000 or more | 0 (0.0%) | 0 (0.0%) |
| Total | 34 (100.0%) | 19 (100.0%) |
Household Income by Mortgage Status in Fredonia Biscoe
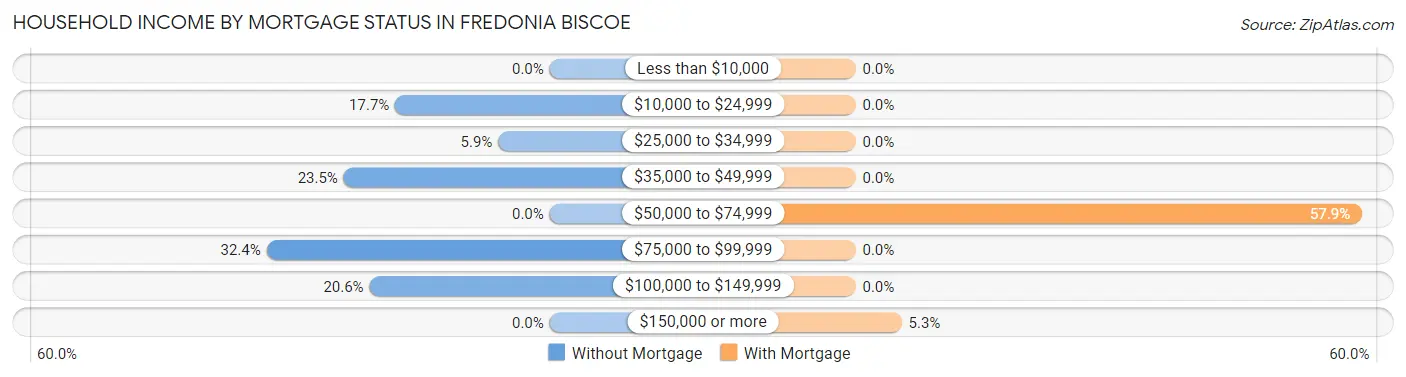
| Household Income | Without Mortgage | With Mortgage |
| Less than $10,000 | 0 (0.0%) | 0 (0.0%) |
| $10,000 to $24,999 | 6 (17.6%) | 0 (0.0%) |
| $25,000 to $34,999 | 2 (5.9%) | 0 (0.0%) |
| $35,000 to $49,999 | 8 (23.5%) | 0 (0.0%) |
| $50,000 to $74,999 | 0 (0.0%) | 11 (57.9%) |
| $75,000 to $99,999 | 11 (32.4%) | 0 (0.0%) |
| $100,000 to $149,999 | 7 (20.6%) | 0 (0.0%) |
| $150,000 or more | 0 (0.0%) | 1 (5.3%) |
| Total | 34 (100.0%) | 19 (100.0%) |
Property Value to Household Income Ratio in Fredonia Biscoe
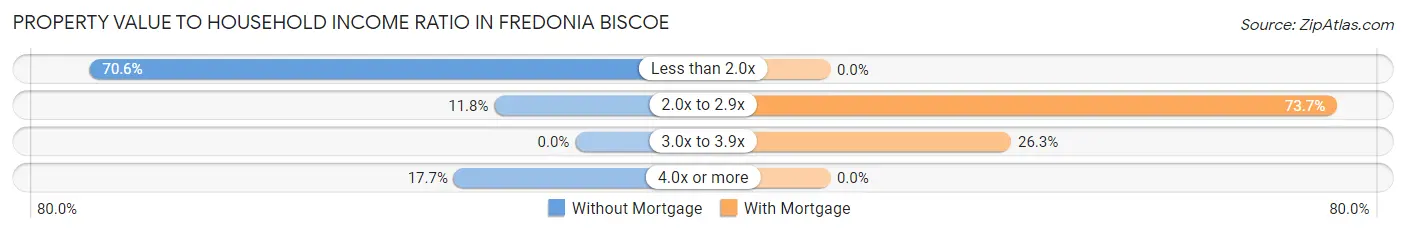
| Value-to-Income Ratio | Without Mortgage | With Mortgage |
| Less than 2.0x | 24 (70.6%) | 0 (0.0%) |
| 2.0x to 2.9x | 4 (11.8%) | 14 (73.7%) |
| 3.0x to 3.9x | 0 (0.0%) | 5 (26.3%) |
| 4.0x or more | 6 (17.6%) | 0 (0.0%) |
| Total | 34 (100.0%) | 19 (100.0%) |
Real Estate Taxes by Mortgage Status in Fredonia Biscoe
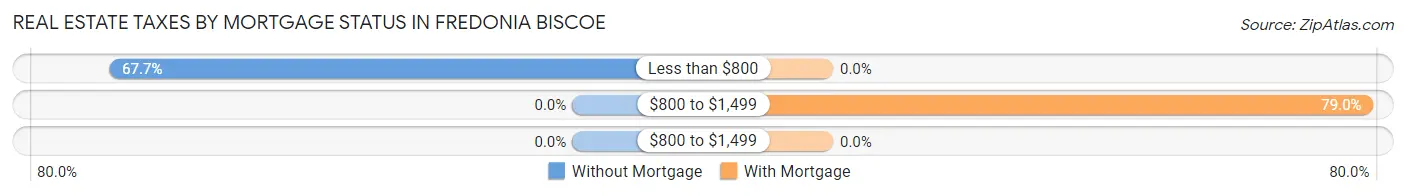
| Property Taxes | Without Mortgage | With Mortgage |
| Less than $800 | 23 (67.6%) | 0 (0.0%) |
| $800 to $1,499 | 0 (0.0%) | 15 (78.9%) |
| $800 to $1,499 | 0 (0.0%) | 0 (0.0%) |
| Total | 34 (100.0%) | 19 (100.0%) |
Health & Disability in Fredonia Biscoe
Health Insurance Coverage by Age in Fredonia Biscoe
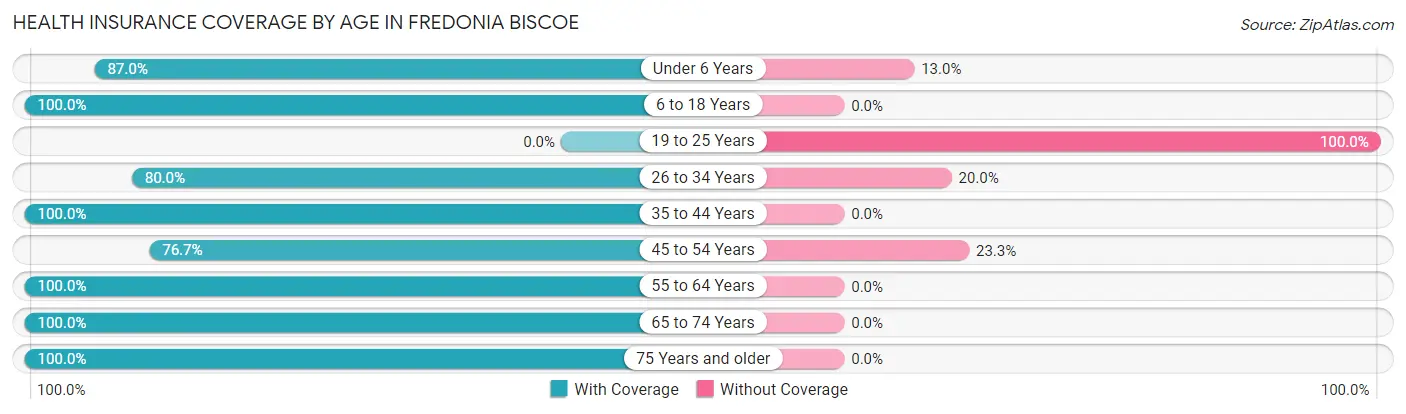
| Age Bracket | With Coverage | Without Coverage |
| Under 6 Years | 20 (87.0%) | 3 (13.0%) |
| 6 to 18 Years | 40 (100.0%) | 0 (0.0%) |
| 19 to 25 Years | 0 (0.0%) | 3 (100.0%) |
| 26 to 34 Years | 16 (80.0%) | 4 (20.0%) |
| 35 to 44 Years | 28 (100.0%) | 0 (0.0%) |
| 45 to 54 Years | 33 (76.7%) | 10 (23.3%) |
| 55 to 64 Years | 22 (100.0%) | 0 (0.0%) |
| 65 to 74 Years | 18 (100.0%) | 0 (0.0%) |
| 75 Years and older | 24 (100.0%) | 0 (0.0%) |
| Total | 201 (90.9%) | 20 (9.0%) |
Health Insurance Coverage by Citizenship Status in Fredonia Biscoe
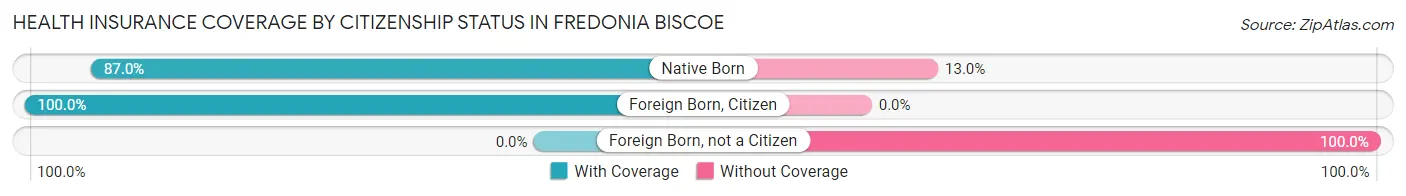
| Citizenship Status | With Coverage | Without Coverage |
| Native Born | 20 (87.0%) | 3 (13.0%) |
| Foreign Born, Citizen | 40 (100.0%) | 0 (0.0%) |
| Foreign Born, not a Citizen | 0 (0.0%) | 3 (100.0%) |
Health Insurance Coverage by Household Income in Fredonia Biscoe
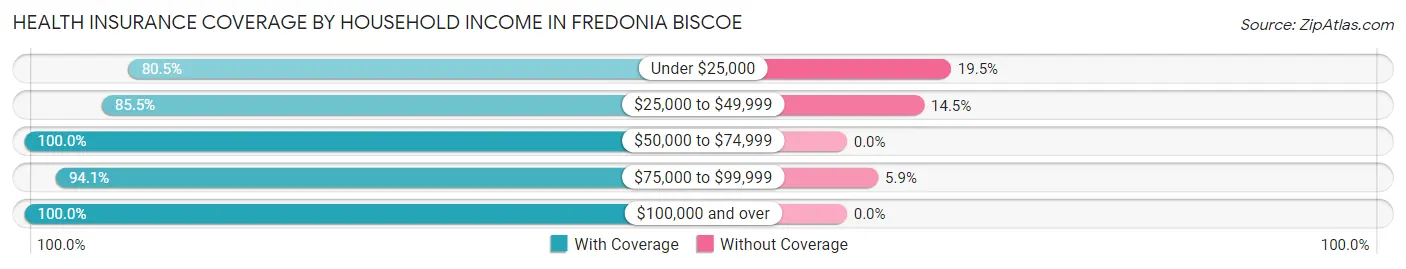
| Household Income | With Coverage | Without Coverage |
| Under $25,000 | 33 (80.5%) | 8 (19.5%) |
| $25,000 to $49,999 | 59 (85.5%) | 10 (14.5%) |
| $50,000 to $74,999 | 8 (100.0%) | 0 (0.0%) |
| $75,000 to $99,999 | 32 (94.1%) | 2 (5.9%) |
| $100,000 and over | 69 (100.0%) | 0 (0.0%) |
Public vs Private Health Insurance Coverage by Age in Fredonia Biscoe
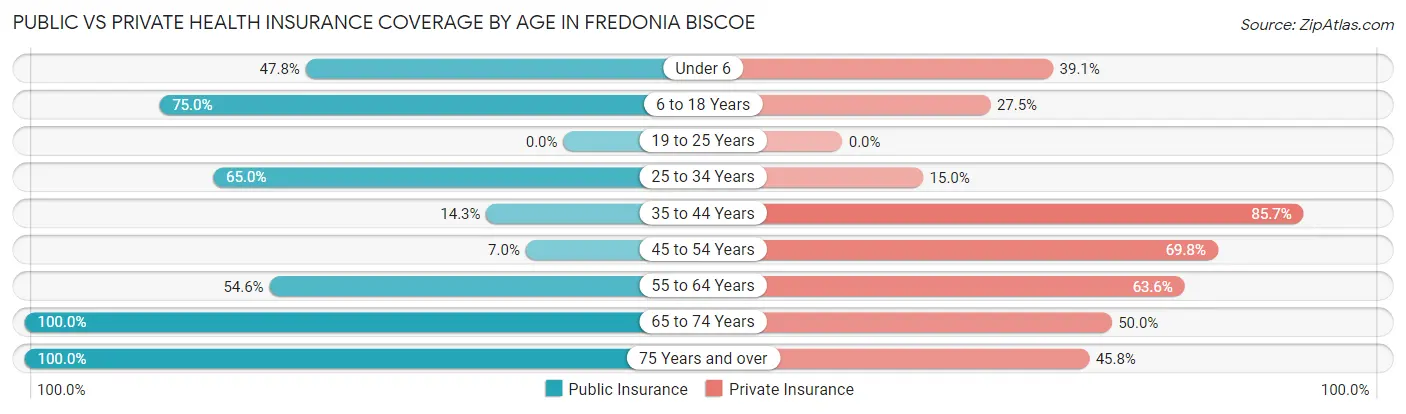
| Age Bracket | Public Insurance | Private Insurance |
| Under 6 | 11 (47.8%) | 9 (39.1%) |
| 6 to 18 Years | 30 (75.0%) | 11 (27.5%) |
| 19 to 25 Years | 0 (0.0%) | 0 (0.0%) |
| 25 to 34 Years | 13 (65.0%) | 3 (15.0%) |
| 35 to 44 Years | 4 (14.3%) | 24 (85.7%) |
| 45 to 54 Years | 3 (7.0%) | 30 (69.8%) |
| 55 to 64 Years | 12 (54.5%) | 14 (63.6%) |
| 65 to 74 Years | 18 (100.0%) | 9 (50.0%) |
| 75 Years and over | 24 (100.0%) | 11 (45.8%) |
| Total | 115 (52.0%) | 111 (50.2%) |
Disability Status by Sex by Age in Fredonia Biscoe
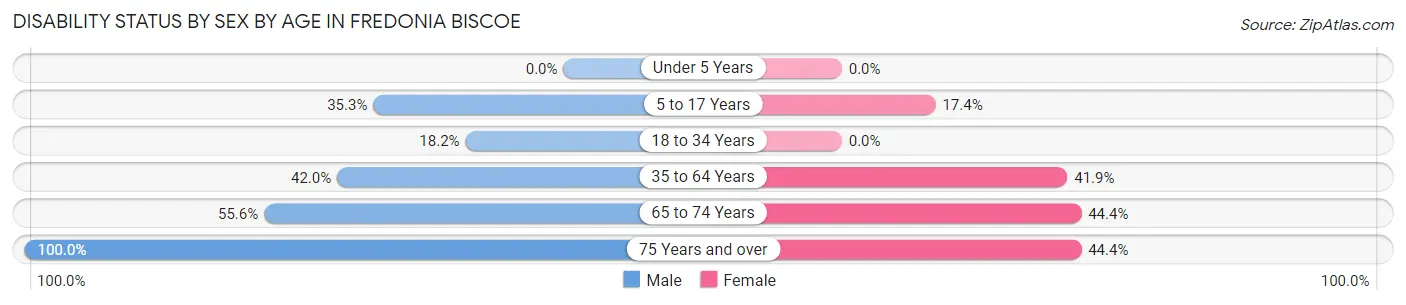
| Age Bracket | Male | Female |
| Under 5 Years | 0 (0.0%) | 0 (0.0%) |
| 5 to 17 Years | 6 (35.3%) | 4 (17.4%) |
| 18 to 34 Years | 2 (18.2%) | 0 (0.0%) |
| 35 to 64 Years | 21 (42.0%) | 18 (41.9%) |
| 65 to 74 Years | 5 (55.6%) | 4 (44.4%) |
| 75 Years and over | 6 (100.0%) | 8 (44.4%) |
Disability Class by Sex by Age in Fredonia Biscoe
Disability Class: Hearing Difficulty
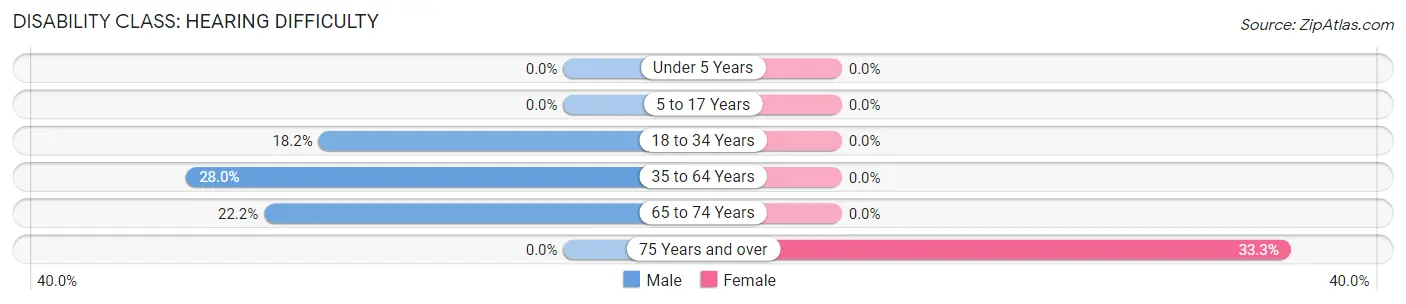
| Age Bracket | Male | Female |
| Under 5 Years | 0 (0.0%) | 0 (0.0%) |
| 5 to 17 Years | 0 (0.0%) | 0 (0.0%) |
| 18 to 34 Years | 2 (18.2%) | 0 (0.0%) |
| 35 to 64 Years | 14 (28.0%) | 0 (0.0%) |
| 65 to 74 Years | 2 (22.2%) | 0 (0.0%) |
| 75 Years and over | 0 (0.0%) | 6 (33.3%) |
Disability Class: Vision Difficulty
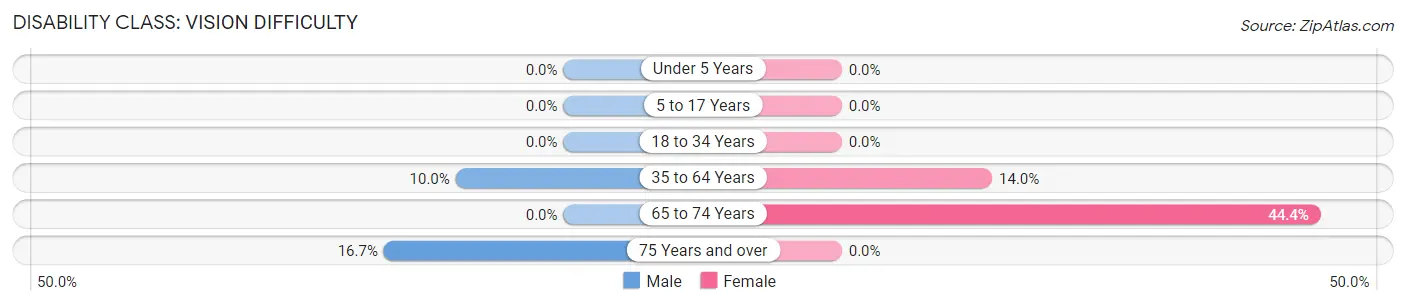
| Age Bracket | Male | Female |
| Under 5 Years | 0 (0.0%) | 0 (0.0%) |
| 5 to 17 Years | 0 (0.0%) | 0 (0.0%) |
| 18 to 34 Years | 0 (0.0%) | 0 (0.0%) |
| 35 to 64 Years | 5 (10.0%) | 6 (14.0%) |
| 65 to 74 Years | 0 (0.0%) | 4 (44.4%) |
| 75 Years and over | 1 (16.7%) | 0 (0.0%) |
Disability Class: Cognitive Difficulty
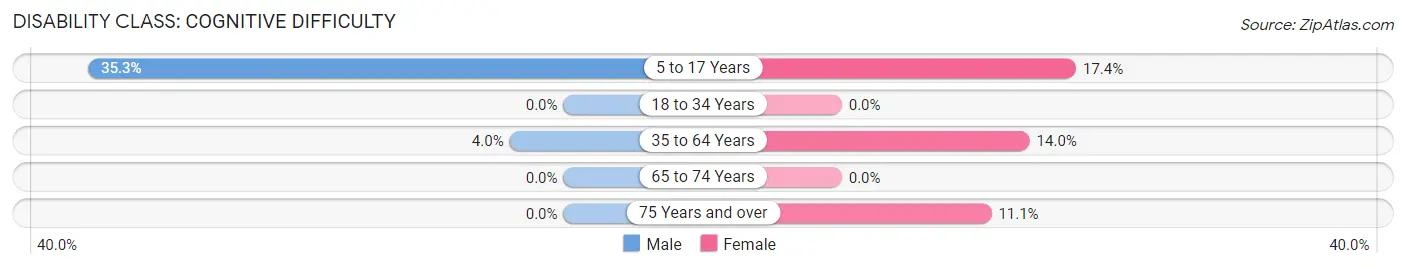
| Age Bracket | Male | Female |
| 5 to 17 Years | 6 (35.3%) | 4 (17.4%) |
| 18 to 34 Years | 0 (0.0%) | 0 (0.0%) |
| 35 to 64 Years | 2 (4.0%) | 6 (14.0%) |
| 65 to 74 Years | 0 (0.0%) | 0 (0.0%) |
| 75 Years and over | 0 (0.0%) | 2 (11.1%) |
Disability Class: Ambulatory Difficulty
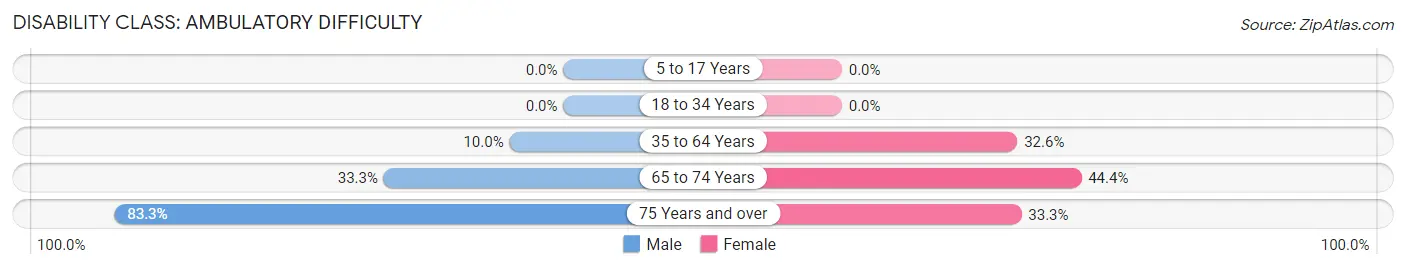
| Age Bracket | Male | Female |
| 5 to 17 Years | 0 (0.0%) | 0 (0.0%) |
| 18 to 34 Years | 0 (0.0%) | 0 (0.0%) |
| 35 to 64 Years | 5 (10.0%) | 14 (32.6%) |
| 65 to 74 Years | 3 (33.3%) | 4 (44.4%) |
| 75 Years and over | 5 (83.3%) | 6 (33.3%) |
Disability Class: Self-Care Difficulty
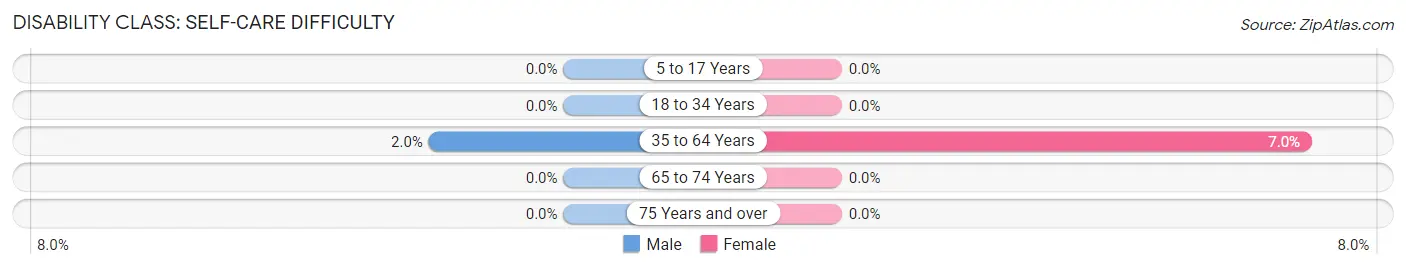
| Age Bracket | Male | Female |
| 5 to 17 Years | 0 (0.0%) | 0 (0.0%) |
| 18 to 34 Years | 0 (0.0%) | 0 (0.0%) |
| 35 to 64 Years | 1 (2.0%) | 3 (7.0%) |
| 65 to 74 Years | 0 (0.0%) | 0 (0.0%) |
| 75 Years and over | 0 (0.0%) | 0 (0.0%) |
Technology Access in Fredonia Biscoe
Computing Device Access in Fredonia Biscoe
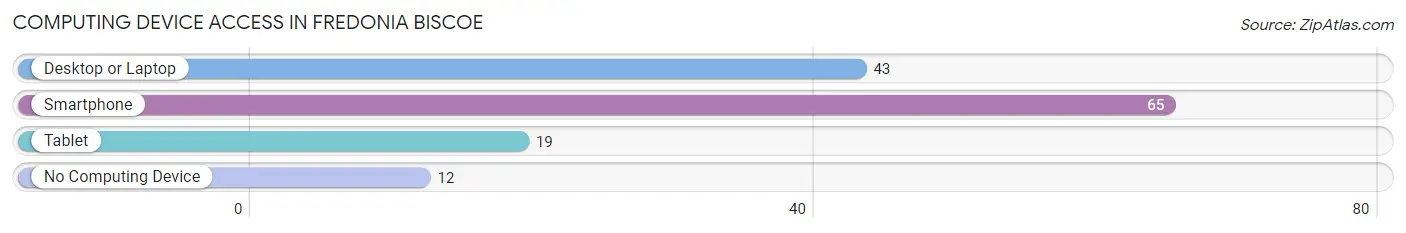
| Device Type | # Households | % Households |
| Desktop or Laptop | 43 | 52.4% |
| Smartphone | 65 | 79.3% |
| Tablet | 19 | 23.2% |
| No Computing Device | 12 | 14.6% |
| Total | 82 | 100.0% |
Internet Access in Fredonia Biscoe
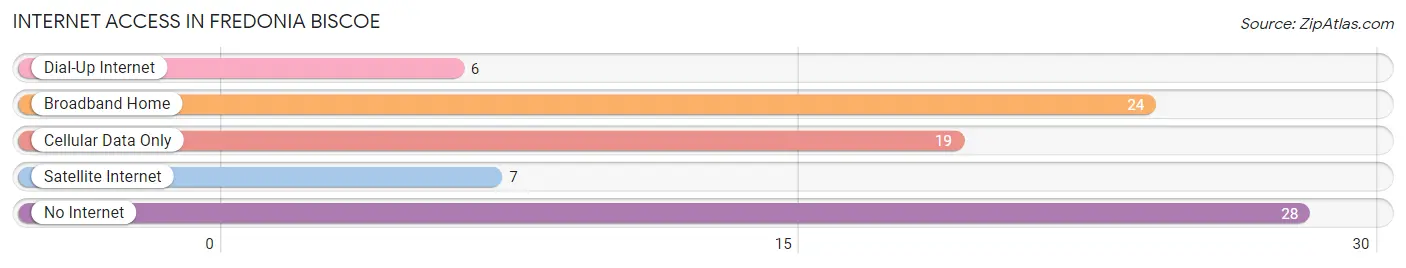
| Internet Type | # Households | % Households |
| Dial-Up Internet | 6 | 7.3% |
| Broadband Home | 24 | 29.3% |
| Cellular Data Only | 19 | 23.2% |
| Satellite Internet | 7 | 8.5% |
| No Internet | 28 | 34.2% |
| Total | 82 | 100.0% |
Fredonia Biscoe Summary
Fredonia Biscoe is a small town located in the Arkansas Delta region of Arkansas. It is situated in the northern part of the state, about 30 miles south of the state capital of Little Rock. The town was founded in 1883 and named after the Fredonia Land Company, which was responsible for the development of the area. The population of Fredonia Biscoe was 1,072 in the 2010 census.
Geography
Fredonia Biscoe is located in the Arkansas Delta region of Arkansas. It is situated in the northern part of the state, about 30 miles south of the state capital of Little Rock. The town is located in the Arkansas River Valley, which is a major agricultural region of the state. The town is situated on the banks of the White River, which is a major tributary of the Arkansas River. The town is surrounded by rolling hills and flatlands, which are typical of the Arkansas Delta region.
The climate in Fredonia Biscoe is humid subtropical, with hot summers and mild winters. The average annual temperature is around 64 degrees Fahrenheit, with an average high of around 90 degrees in the summer and an average low of around 40 degrees in the winter. The town receives an average of around 48 inches of precipitation per year, with most of it falling in the spring and summer months.
Economy
The economy of Fredonia Biscoe is largely based on agriculture. The town is located in the Arkansas River Valley, which is a major agricultural region of the state. The town is home to several large farms, which produce a variety of crops, including cotton, soybeans, corn, and wheat. The town is also home to several small businesses, including restaurants, convenience stores, and auto repair shops.
Demographics
The population of Fredonia Biscoe was 1,072 in the 2010 census. The population is predominantly white, with African Americans making up around 10% of the population. The median household income in the town is around $30,000, which is slightly lower than the state average. The town has a poverty rate of around 20%, which is higher than the state average.
Education
Fredonia Biscoe is served by the Biscoe School District, which includes two elementary schools, one middle school, and one high school. The town is also home to a branch of the University of Arkansas at Little Rock, which offers a variety of degree programs.
Conclusion
Fredonia Biscoe is a small town located in the Arkansas Delta region of Arkansas. It is situated in the northern part of the state, about 30 miles south of the state capital of Little Rock. The town was founded in 1883 and named after the Fredonia Land Company, which was responsible for the development of the area. The population of Fredonia Biscoe was 1,072 in the 2010 census. The economy of the town is largely based on agriculture, and the town is served by the Biscoe School District. The town has a poverty rate of around 20%, which is higher than the state average.
Common Questions
What is Per Capita Income in Fredonia Biscoe?
Per Capita income in Fredonia Biscoe is $25,943.
What is the Median Family Income in Fredonia Biscoe?
Median Family Income in Fredonia Biscoe is $83,000.
What is the Median Household income in Fredonia Biscoe?
Median Household Income in Fredonia Biscoe is $39,500.
What is Income or Wage Gap in Fredonia Biscoe?
Income or Wage Gap in Fredonia Biscoe is 36.8%.
Women in Fredonia Biscoe earn 63.2 cents for every dollar earned by a man.
What is Inequality or Gini Index in Fredonia Biscoe?
Inequality or Gini Index in Fredonia Biscoe is 0.45.
What is the Total Population of Fredonia Biscoe?
Total Population of Fredonia Biscoe is 221.
What is the Total Male Population of Fredonia Biscoe?
Total Male Population of Fredonia Biscoe is 101.
What is the Total Female Population of Fredonia Biscoe?
Total Female Population of Fredonia Biscoe is 120.
What is the Ratio of Males per 100 Females in Fredonia Biscoe?
There are 84.17 Males per 100 Females in Fredonia Biscoe.
What is the Ratio of Females per 100 Males in Fredonia Biscoe?
There are 118.81 Females per 100 Males in Fredonia Biscoe.
What is the Median Population Age in Fredonia Biscoe?
Median Population Age in Fredonia Biscoe is 41.9 Years.
What is the Average Family Size in Fredonia Biscoe
Average Family Size in Fredonia Biscoe is 3.6 People.
What is the Average Household Size in Fredonia Biscoe
Average Household Size in Fredonia Biscoe is 2.7 People.
How Large is the Labor Force in Fredonia Biscoe?
There are 84 People in the Labor Forcein in Fredonia Biscoe.
What is the Percentage of People in the Labor Force in Fredonia Biscoe?
50.0% of People are in the Labor Force in Fredonia Biscoe.
What is the Unemployment Rate in Fredonia Biscoe?
Unemployment Rate in Fredonia Biscoe is 7.1%.