Alpena, AR Map & Demographics
Alpena Map
Alpena Overview
$18,119
PER CAPITA INCOME
$70,481
AVG FAMILY INCOME
$48,500
AVG HOUSEHOLD INCOME
20.9%
WAGE / INCOME GAP [ % ]
79.1¢/ $1
WAGE / INCOME GAP [ $ ]
0.32
INEQUALITY / GINI INDEX
404
TOTAL POPULATION
201
MALE POPULATION
203
FEMALE POPULATION
99.01
MALES / 100 FEMALES
101.00
FEMALES / 100 MALES
35.6
MEDIAN AGE
4.1
AVG FAMILY SIZE
3.3
AVG HOUSEHOLD SIZE
183
LABOR FORCE [ PEOPLE ]
58.8%
PERCENT IN LABOR FORCE
1.1%
UNEMPLOYMENT RATE
Alpena Zip Codes
Alpena Area Codes
Income in Alpena
Income Overview in Alpena
Per Capita Income in Alpena is $18,119, while median incomes of families and households are $70,481 and $48,500 respectively.
| Characteristic | Number | Measure |
| Per Capita Income | 404 | $18,119 |
| Median Family Income | 83 | $70,481 |
| Mean Family Income | 83 | $64,487 |
| Median Household Income | 124 | $48,500 |
| Mean Household Income | 124 | $54,900 |
| Income Deficit | 83 | $0 |
| Wage / Income Gap (%) | 404 | 20.94% |
| Wage / Income Gap ($) | 404 | 79.06¢ per $1 |
| Gini / Inequality Index | 404 | 0.32 |
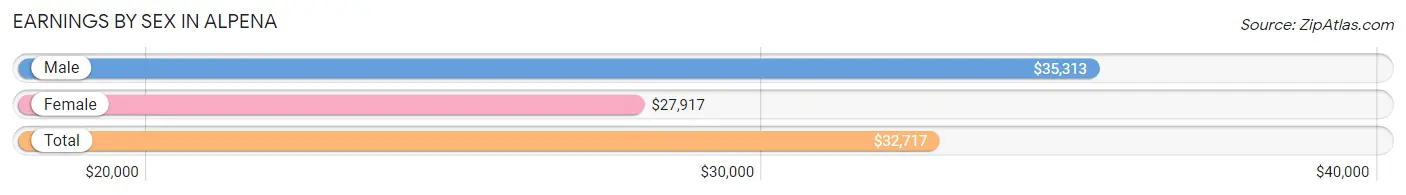
Earnings by Sex in Alpena
Average Earnings in Alpena are $32,717, $35,313 for men and $27,917 for women, a difference of 20.9%.
| Sex | Number | Average Earnings |
| Male | 80 (43.0%) | $35,313 |
| Female | 106 (57.0%) | $27,917 |
| Total | 186 (100.0%) | $32,717 |
Earnings by Sex by Income Bracket in Alpena
The most common earnings brackets in Alpena are $35,000 to $39,999 for men (20 | 25.0%) and $10,000 to $12,499 for women (19 | 17.9%).

| Income | Male | Female |
| $2,499 or less | 1 (1.3%) | 0 (0.0%) |
| $2,500 to $4,999 | 6 (7.5%) | 2 (1.9%) |
| $5,000 to $7,499 | 0 (0.0%) | 11 (10.4%) |
| $7,500 to $9,999 | 2 (2.5%) | 2 (1.9%) |
| $10,000 to $12,499 | 2 (2.5%) | 19 (17.9%) |
| $12,500 to $14,999 | 2 (2.5%) | 5 (4.7%) |
| $15,000 to $17,499 | 2 (2.5%) | 0 (0.0%) |
| $17,500 to $19,999 | 2 (2.5%) | 4 (3.8%) |
| $20,000 to $22,499 | 0 (0.0%) | 3 (2.8%) |
| $22,500 to $24,999 | 0 (0.0%) | 6 (5.7%) |
| $25,000 to $29,999 | 12 (15.0%) | 6 (5.7%) |
| $30,000 to $34,999 | 9 (11.3%) | 18 (17.0%) |
| $35,000 to $39,999 | 20 (25.0%) | 9 (8.5%) |
| $40,000 to $44,999 | 9 (11.3%) | 12 (11.3%) |
| $45,000 to $49,999 | 1 (1.3%) | 2 (1.9%) |
| $50,000 to $54,999 | 3 (3.7%) | 1 (0.9%) |
| $55,000 to $64,999 | 1 (1.3%) | 5 (4.7%) |
| $65,000 to $74,999 | 1 (1.3%) | 0 (0.0%) |
| $75,000 to $99,999 | 7 (8.7%) | 1 (0.9%) |
| $100,000+ | 0 (0.0%) | 0 (0.0%) |
| Total | 80 (100.0%) | 106 (100.0%) |
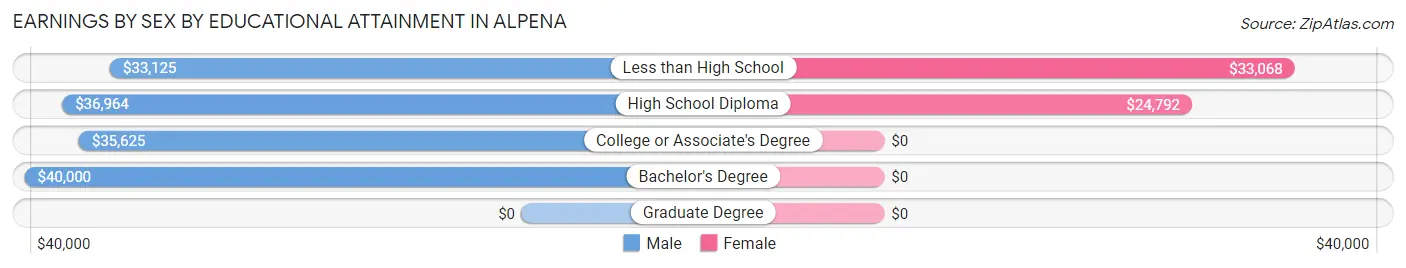
Earnings by Sex by Educational Attainment in Alpena
Average earnings in Alpena are $36,563 for men and $29,063 for women, a difference of 20.5%. Men with an educational attainment of bachelor's degree enjoy the highest average annual earnings of $40,000, while those with less than high school education earn the least with $33,125. Women with an educational attainment of less than high school earn the most with the average annual earnings of $33,068, while those with high school diploma education have the smallest earnings of $24,792.
| Educational Attainment | Male Income | Female Income |
| Less than High School | $33,125 | $33,068 |
| High School Diploma | $36,964 | $24,792 |
| College or Associate's Degree | $35,625 | $0 |
| Bachelor's Degree | $40,000 | $0 |
| Graduate Degree | - | - |
| Total | $36,563 | $29,063 |
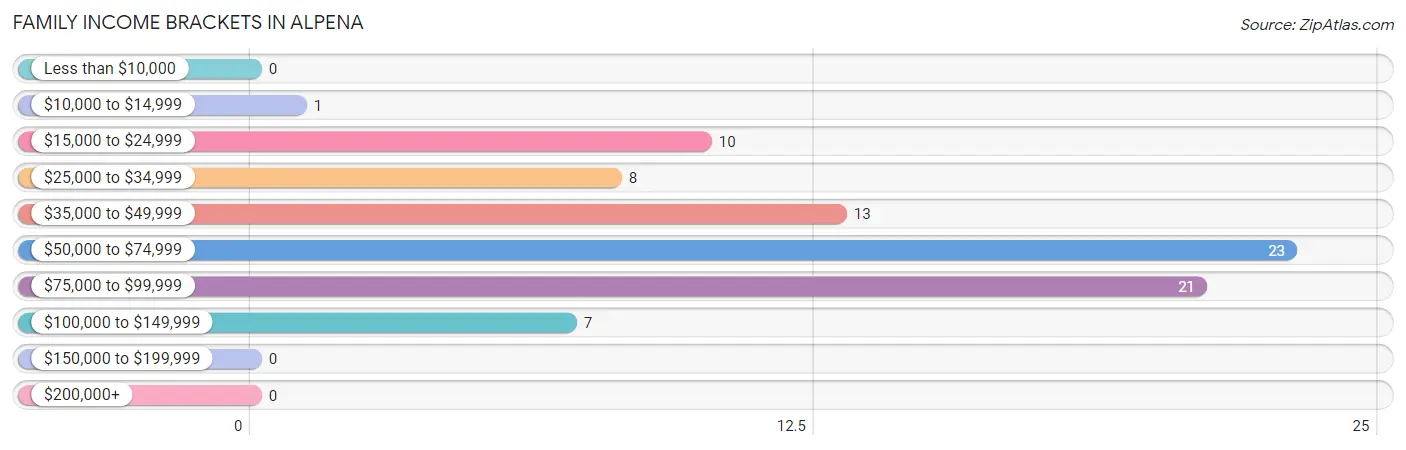
Family Income in Alpena
Family Income Brackets in Alpena
According to the Alpena family income data, there are 23 families falling into the $50,000 to $74,999 income range, which is the most common income bracket and makes up 27.7% of all families.
| Income Bracket | # Families | % Families |
| Less than $10,000 | 0 | 0.0% |
| $10,000 to $14,999 | 1 | 1.2% |
| $15,000 to $24,999 | 10 | 12.0% |
| $25,000 to $34,999 | 8 | 9.6% |
| $35,000 to $49,999 | 13 | 15.7% |
| $50,000 to $74,999 | 23 | 27.7% |
| $75,000 to $99,999 | 21 | 25.3% |
| $100,000 to $149,999 | 7 | 8.4% |
| $150,000 to $199,999 | 0 | 0.0% |
| $200,000+ | 0 | 0.0% |
Family Income by Famaliy Size in Alpena
4-person families (16 | 19.3%) account for the highest median family income in Alpena with $79,167 per family, while 3-person families (25 | 30.1%) have the highest median income of $23,429 per family member.

| Income Bracket | # Families | Median Income |
| 2-Person Families | 26 (31.3%) | $43,750 |
| 3-Person Families | 25 (30.1%) | $70,288 |
| 4-Person Families | 16 (19.3%) | $79,167 |
| 5-Person Families | 7 (8.4%) | $74,375 |
| 6-Person Families | 3 (3.6%) | $0 |
| 7+ Person Families | 6 (7.2%) | $0 |
| Total | 83 (100.0%) | $70,481 |
Family Income by Number of Earners in Alpena
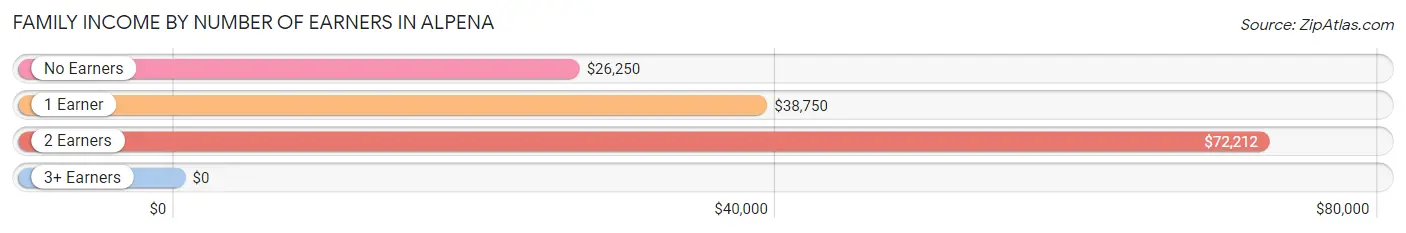
| Number of Earners | # Families | Median Income |
| No Earners | 5 (6.0%) | $26,250 |
| 1 Earner | 37 (44.6%) | $38,750 |
| 2 Earners | 31 (37.3%) | $72,212 |
| 3+ Earners | 10 (12.0%) | $0 |
| Total | 83 (100.0%) | $70,481 |
Household Income in Alpena
Household Income Brackets in Alpena
With 31 households falling in the category, the $50,000 to $74,999 income range is the most frequent in Alpena, accounting for 25.0% of all households.
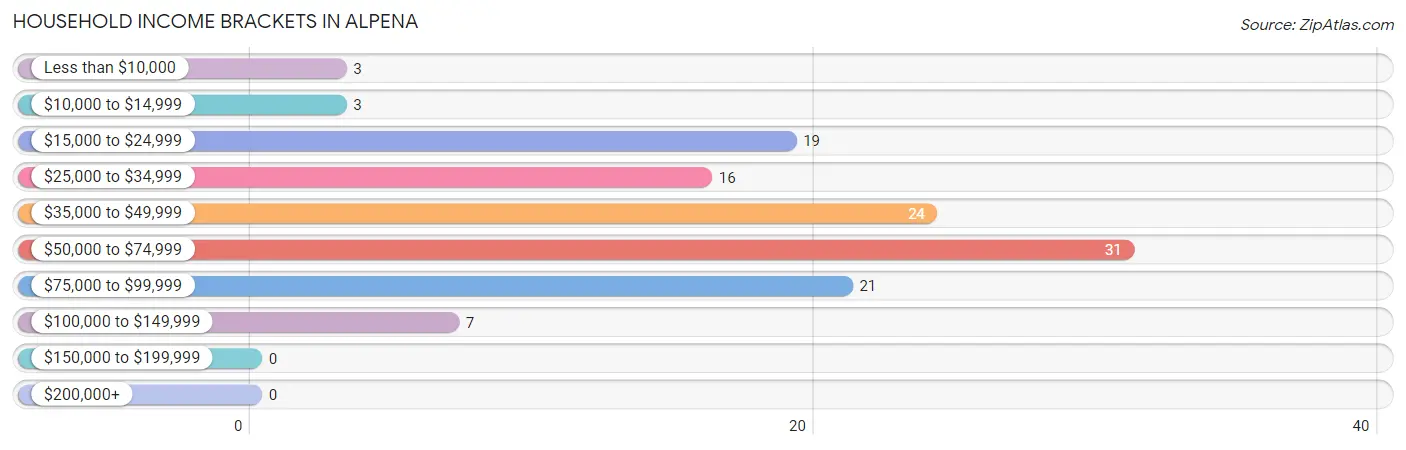
| Income Bracket | # Households | % Households |
| Less than $10,000 | 3 | 2.4% |
| $10,000 to $14,999 | 3 | 2.4% |
| $15,000 to $24,999 | 19 | 15.3% |
| $25,000 to $34,999 | 16 | 12.9% |
| $35,000 to $49,999 | 24 | 19.4% |
| $50,000 to $74,999 | 31 | 25.0% |
| $75,000 to $99,999 | 21 | 16.9% |
| $100,000 to $149,999 | 7 | 5.6% |
| $150,000 to $199,999 | 0 | 0.0% |
| $200,000+ | 0 | 0.0% |
Household Income by Householder Age in Alpena
The median household income in Alpena is $48,500, with the highest median household income of $70,288 found in the 25 to 44 years age bracket for the primary householder. A total of 43 households (34.7%) fall into this category. Meanwhile, the 65+ years age bracket for the primary householder has the lowest median household income of $34,375, with 27 households (21.8%) in this group.
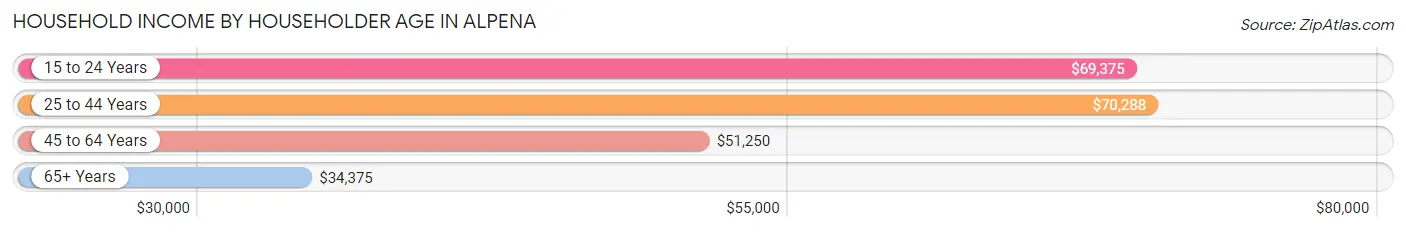
| Income Bracket | # Households | Median Income |
| 15 to 24 Years | 7 (5.7%) | $69,375 |
| 25 to 44 Years | 43 (34.7%) | $70,288 |
| 45 to 64 Years | 47 (37.9%) | $51,250 |
| 65+ Years | 27 (21.8%) | $34,375 |
| Total | 124 (100.0%) | $48,500 |
Poverty in Alpena
Income Below Poverty by Sex and Age in Alpena
With 9.0% poverty level for males and 9.0% for females among the residents of Alpena, 5 year old males and under 5 year old females are the most vulnerable to poverty, with 1 males (100.0%) and 1 females (25.0%) in their respective age groups living below the poverty level.
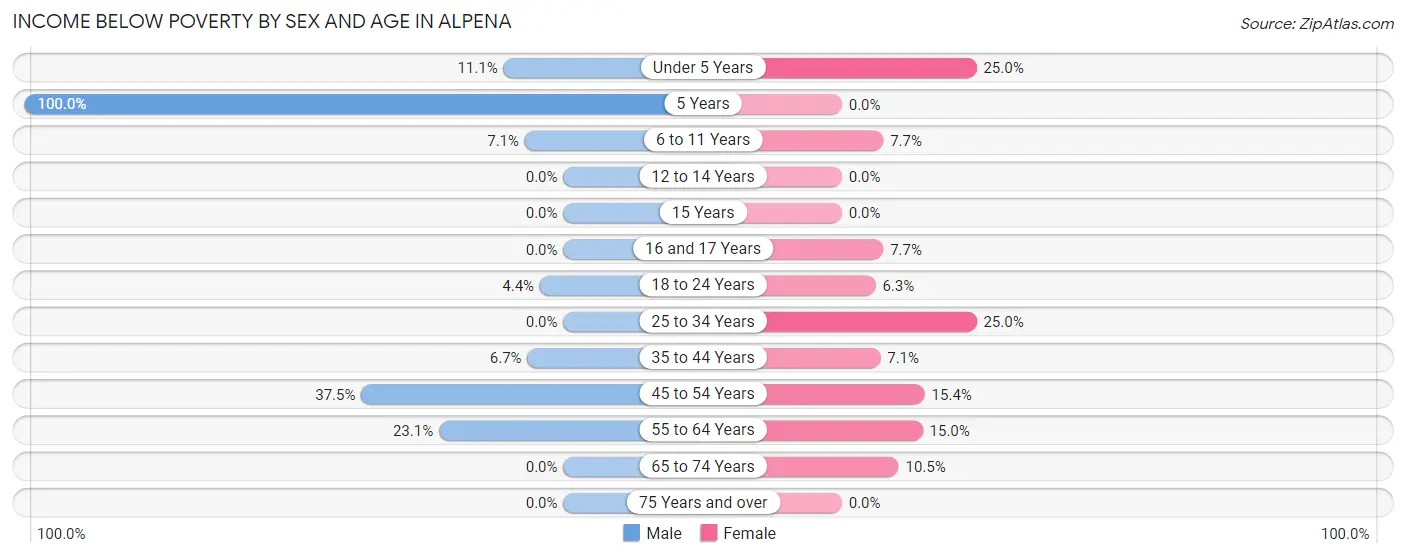
| Age Bracket | Male | Female |
| Under 5 Years | 1 (11.1%) | 1 (25.0%) |
| 5 Years | 1 (100.0%) | 0 (0.0%) |
| 6 to 11 Years | 1 (7.1%) | 1 (7.7%) |
| 12 to 14 Years | 0 (0.0%) | 0 (0.0%) |
| 15 Years | 0 (0.0%) | 0 (0.0%) |
| 16 and 17 Years | 0 (0.0%) | 1 (7.7%) |
| 18 to 24 Years | 1 (4.3%) | 1 (6.2%) |
| 25 to 34 Years | 0 (0.0%) | 2 (25.0%) |
| 35 to 44 Years | 2 (6.7%) | 3 (7.1%) |
| 45 to 54 Years | 6 (37.5%) | 4 (15.4%) |
| 55 to 64 Years | 6 (23.1%) | 3 (15.0%) |
| 65 to 74 Years | 0 (0.0%) | 2 (10.5%) |
| 75 Years and over | 0 (0.0%) | 0 (0.0%) |
| Total | 18 (9.0%) | 18 (9.0%) |
Income Above Poverty by Sex and Age in Alpena
According to the poverty statistics in Alpena, males aged 12 to 14 years and females aged 12 to 14 years are the age groups that are most secure financially, with 100.0% of males and 100.0% of females in these age groups living above the poverty line.
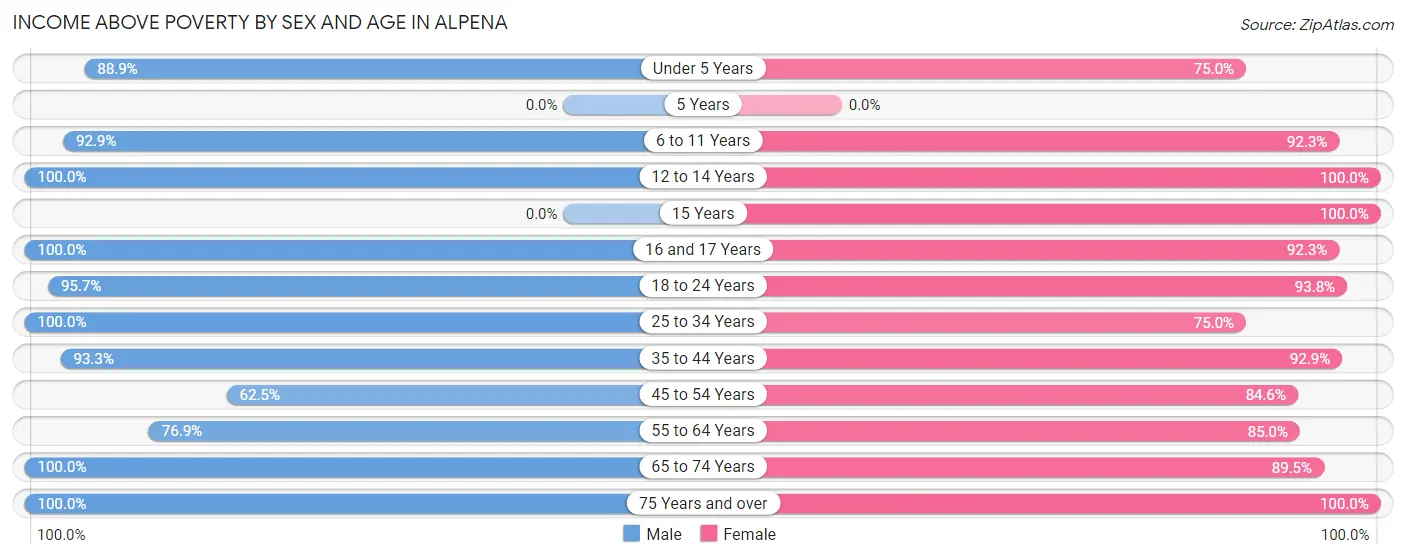
| Age Bracket | Male | Female |
| Under 5 Years | 8 (88.9%) | 3 (75.0%) |
| 5 Years | 0 (0.0%) | 0 (0.0%) |
| 6 to 11 Years | 13 (92.9%) | 12 (92.3%) |
| 12 to 14 Years | 18 (100.0%) | 19 (100.0%) |
| 15 Years | 0 (0.0%) | 13 (100.0%) |
| 16 and 17 Years | 30 (100.0%) | 12 (92.3%) |
| 18 to 24 Years | 22 (95.7%) | 15 (93.8%) |
| 25 to 34 Years | 12 (100.0%) | 6 (75.0%) |
| 35 to 44 Years | 28 (93.3%) | 39 (92.9%) |
| 45 to 54 Years | 10 (62.5%) | 22 (84.6%) |
| 55 to 64 Years | 20 (76.9%) | 17 (85.0%) |
| 65 to 74 Years | 16 (100.0%) | 17 (89.5%) |
| 75 Years and over | 6 (100.0%) | 8 (100.0%) |
| Total | 183 (91.0%) | 183 (91.0%) |
Income Below Poverty Among Married-Couple Families in Alpena

| Children | Above Poverty | Below Poverty |
| No Children | 15 (100.0%) | 0 (0.0%) |
| 1 or 2 Children | 23 (100.0%) | 0 (0.0%) |
| 3 or 4 Children | 10 (100.0%) | 0 (0.0%) |
| 5 or more Children | 3 (100.0%) | 0 (0.0%) |
| Total | 51 (100.0%) | 0 (0.0%) |
Income Below Poverty Among Single-Parent Households in Alpena
According to the poverty data in Alpena, 100.0% or 2 single-father households and 6.7% or 2 single-mother households are living below the poverty line. Among single-father households, those with no children have the highest poverty rate, with 1 households (100.0%) experiencing poverty. Likewise, among single-mother households, those with 3 or 4 children have the highest poverty rate, with 2 households (100.0%) falling below the poverty line.

| Children | Single Father | Single Mother |
| No Children | 1 (100.0%) | 0 (0.0%) |
| 1 or 2 Children | 0 (0.0%) | 0 (0.0%) |
| 3 or 4 Children | 1 (100.0%) | 2 (100.0%) |
| 5 or more Children | 0 (0.0%) | 0 (0.0%) |
| Total | 2 (100.0%) | 2 (6.7%) |
Income Below Poverty Among Married-Couple vs Single-Parent Households in Alpena
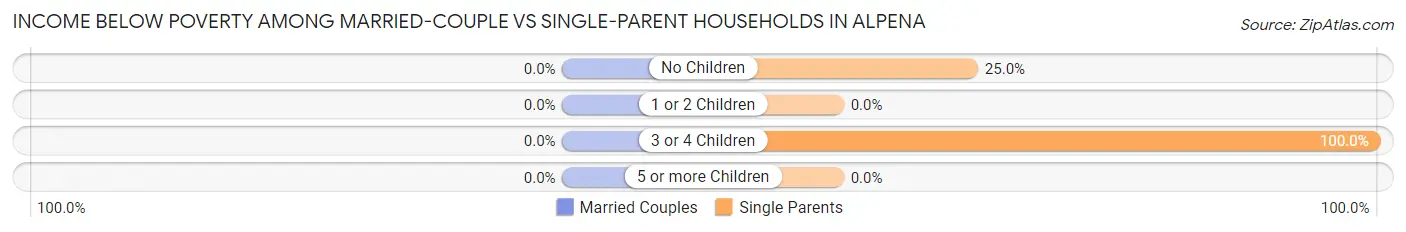
| Children | Married-Couple Families | Single-Parent Households |
| No Children | 0 (0.0%) | 1 (25.0%) |
| 1 or 2 Children | 0 (0.0%) | 0 (0.0%) |
| 3 or 4 Children | 0 (0.0%) | 3 (100.0%) |
| 5 or more Children | 0 (0.0%) | 0 (0.0%) |
| Total | 0 (0.0%) | 4 (12.5%) |
Race in Alpena
The most populous races in Alpena are White / Caucasian (310 | 76.7%), Two or more Races (85 | 21.0%), and Hispanic or Latino (4 | 1.0%).

| Race | # Population | % Population |
| Asian | 0 | 0.0% |
| Black / African American | 3 | 0.7% |
| Hawaiian / Pacific | 0 | 0.0% |
| Hispanic or Latino | 4 | 1.0% |
| Native / Alaskan | 2 | 0.5% |
| White / Caucasian | 310 | 76.7% |
| Two or more Races | 85 | 21.0% |
| Some other Race | 4 | 1.0% |
| Total | 404 | 100.0% |
Ancestry in Alpena
The most populous ancestries reported in Alpena are German (82 | 20.3%), Irish (44 | 10.9%), American (34 | 8.4%), Creek (32 | 7.9%), and Scottish (26 | 6.4%), together accounting for 54.0% of all Alpena residents.
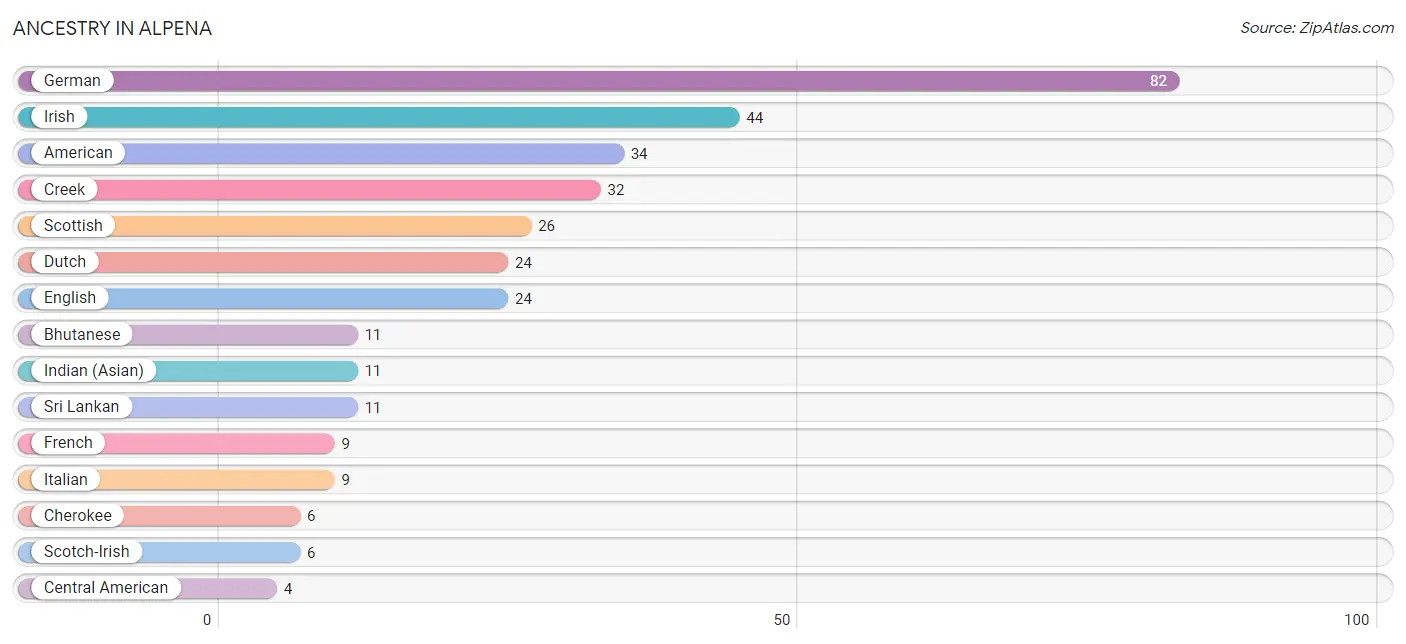
| Ancestry | # Population | % Population |
| American | 34 | 8.4% |
| Bhutanese | 11 | 2.7% |
| Central American | 4 | 1.0% |
| Cherokee | 6 | 1.5% |
| Creek | 32 | 7.9% |
| Dutch | 24 | 5.9% |
| Eastern European | 1 | 0.3% |
| English | 24 | 5.9% |
| French | 9 | 2.2% |
| German | 82 | 20.3% |
| Guatemalan | 4 | 1.0% |
| Hungarian | 2 | 0.5% |
| Indian (Asian) | 11 | 2.7% |
| Irish | 44 | 10.9% |
| Italian | 9 | 2.2% |
| Polish | 3 | 0.7% |
| Scotch-Irish | 6 | 1.5% |
| Scottish | 26 | 6.4% |
| Sri Lankan | 11 | 2.7% |
| Swedish | 1 | 0.3% | View All 20 Rows |
Immigrants in Alpena
The most numerous immigrant groups reported in Alpena came from Central America (2 | 0.5%), Guatemala (2 | 0.5%), and Latin America (2 | 0.5%), together accounting for 1.5% of all Alpena residents.
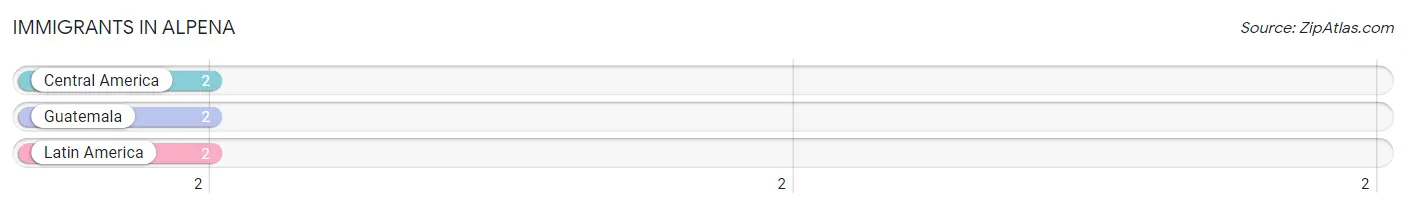
| Immigration Origin | # Population | % Population |
| Central America | 2 | 0.5% |
| Guatemala | 2 | 0.5% |
| Latin America | 2 | 0.5% | View All 3 Rows |
Sex and Age in Alpena
Sex and Age in Alpena
The most populous age groups in Alpena are 15 to 19 Years (37 | 18.4%) for men and 15 to 19 Years (35 | 17.2%) for women.

| Age Bracket | Male | Female |
| Under 5 Years | 9 (4.5%) | 4 (2.0%) |
| 5 to 9 Years | 1 (0.5%) | 11 (5.4%) |
| 10 to 14 Years | 32 (15.9%) | 23 (11.3%) |
| 15 to 19 Years | 37 (18.4%) | 35 (17.2%) |
| 20 to 24 Years | 16 (8.0%) | 7 (3.5%) |
| 25 to 29 Years | 5 (2.5%) | 1 (0.5%) |
| 30 to 34 Years | 7 (3.5%) | 7 (3.5%) |
| 35 to 39 Years | 9 (4.5%) | 19 (9.4%) |
| 40 to 44 Years | 21 (10.4%) | 23 (11.3%) |
| 45 to 49 Years | 11 (5.5%) | 20 (9.9%) |
| 50 to 54 Years | 5 (2.5%) | 6 (3.0%) |
| 55 to 59 Years | 18 (9.0%) | 7 (3.5%) |
| 60 to 64 Years | 8 (4.0%) | 13 (6.4%) |
| 65 to 69 Years | 14 (7.0%) | 16 (7.9%) |
| 70 to 74 Years | 2 (1.0%) | 3 (1.5%) |
| 75 to 79 Years | 3 (1.5%) | 2 (1.0%) |
| 80 to 84 Years | 1 (0.5%) | 2 (1.0%) |
| 85 Years and over | 2 (1.0%) | 4 (2.0%) |
| Total | 201 (100.0%) | 203 (100.0%) |
Families and Households in Alpena
Median Family Size in Alpena
The median family size in Alpena is 4.08 persons per family, with married-couple families (51 | 61.5%) accounting for the largest median family size of 4.86 persons per family. On the other hand, single female/mother families (30 | 36.1%) represent the smallest median family size with 2.83 persons per family.

| Family Type | # Families | Family Size |
| Married-Couple | 51 (61.5%) | 4.86 |
| Single Male/Father | 2 (2.4%) | 3.00 |
| Single Female/Mother | 30 (36.1%) | 2.83 |
| Total Families | 83 (100.0%) | 4.08 |
Median Household Size in Alpena
The median household size in Alpena is 3.26 persons per household, with married-couple households (51 | 41.1%) accounting for the largest median household size of 4.86 persons per household. non-family households (41 | 33.1%) represent the smallest median household size with 1.37 persons per household.

| Household Type | # Households | Household Size |
| Married-Couple | 51 (41.1%) | 4.86 |
| Single Male/Father | 2 (1.6%) | 4.50 |
| Single Female/Mother | 30 (24.2%) | 3.03 |
| Non-family | 41 (33.1%) | 1.37 |
| Total Households | 124 (100.0%) | 3.26 |
Household Size by Marriage Status in Alpena
Out of a total of 124 households in Alpena, 83 (66.9%) are family households, while 41 (33.1%) are nonfamily households. The most numerous type of family households are 3-person households, comprising 26, and the most common type of nonfamily households are 1-person households, comprising 30.
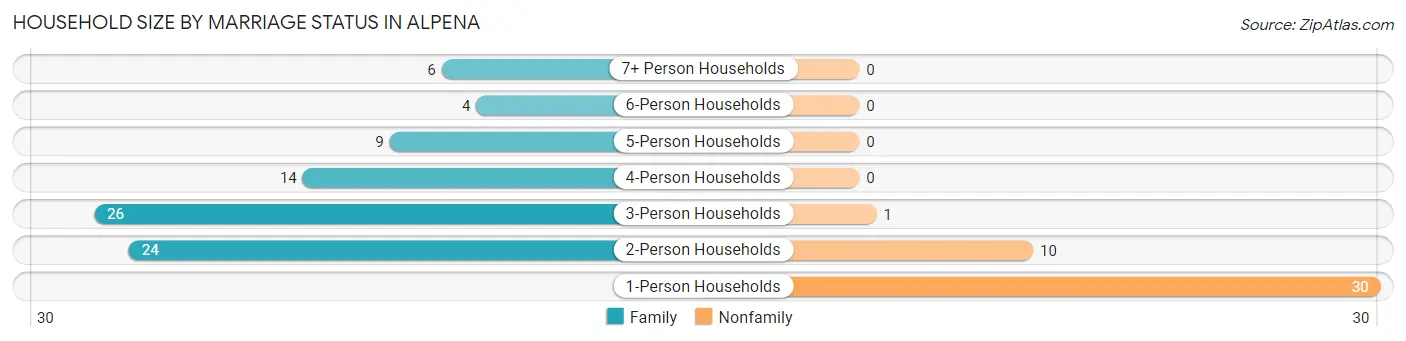
| Household Size | Family Households | Nonfamily Households |
| 1-Person Households | - | 30 (24.2%) |
| 2-Person Households | 24 (19.4%) | 10 (8.1%) |
| 3-Person Households | 26 (21.0%) | 1 (0.8%) |
| 4-Person Households | 14 (11.3%) | 0 (0.0%) |
| 5-Person Households | 9 (7.3%) | 0 (0.0%) |
| 6-Person Households | 4 (3.2%) | 0 (0.0%) |
| 7+ Person Households | 6 (4.8%) | 0 (0.0%) |
| Total | 83 (66.9%) | 41 (33.1%) |
Female Fertility in Alpena
Fertility by Age in Alpena
Average fertility rate in Alpena is 78.0 births per 1,000 women. Women in the age bracket of 15 to 19 years have the highest fertility rate with 200.0 births per 1,000 women. Women in the age bracket of 15 to 19 years acount for 77.8% of all women with births.

| Age Bracket | Women with Births | Births / 1,000 Women |
| 15 to 19 years | 7 (77.8%) | 200.0 |
| 20 to 34 years | 2 (22.2%) | 133.0 |
| 35 to 50 years | 0 (0.0%) | 0.0 |
| Total | 9 (100.0%) | 78.0 |
Fertility by Age by Marriage Status in Alpena
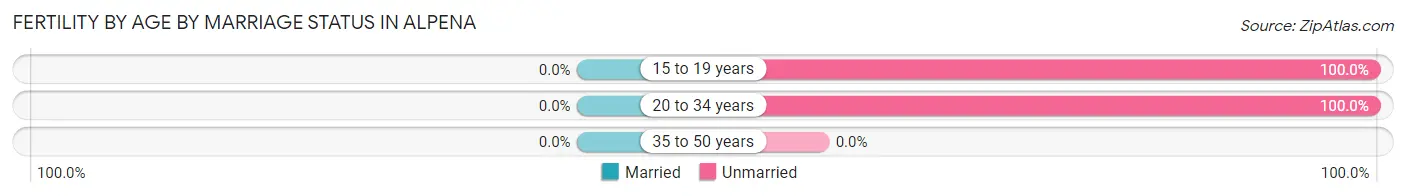
| Age Bracket | Married | Unmarried |
| 15 to 19 years | 0 (0.0%) | 7 (100.0%) |
| 20 to 34 years | 0 (0.0%) | 2 (100.0%) |
| 35 to 50 years | 0 (0.0%) | 0 (0.0%) |
| Total | 0 (0.0%) | 9 (100.0%) |
Fertility by Education in Alpena
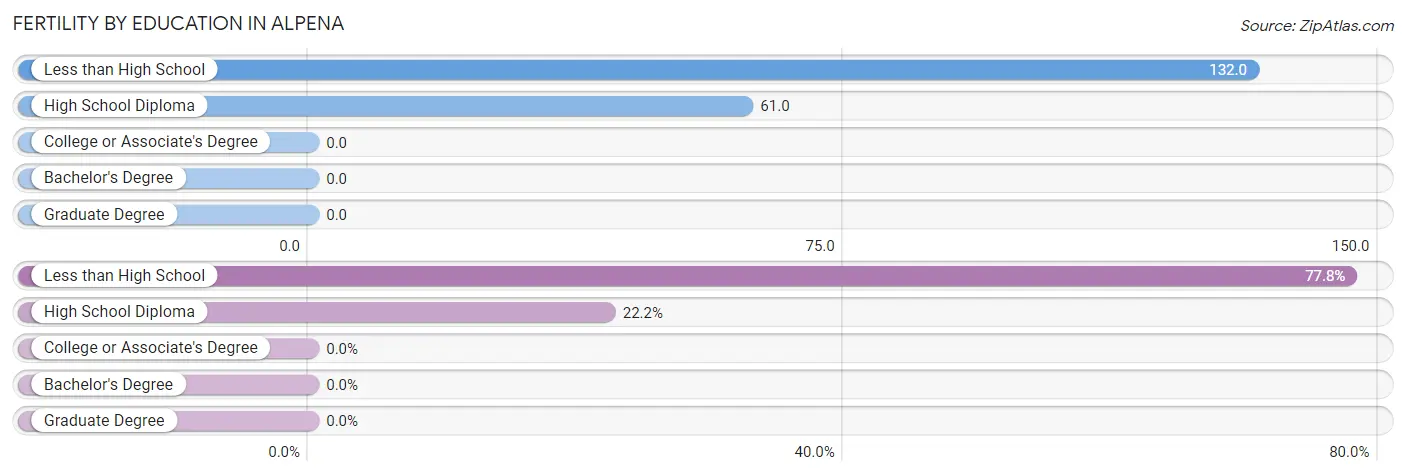
| Educational Attainment | Women with Births | Births / 1,000 Women |
| Less than High School | 7 (77.8%) | 132.0 |
| High School Diploma | 2 (22.2%) | 61.0 |
| College or Associate's Degree | 0 (0.0%) | 0.0 |
| Bachelor's Degree | 0 (0.0%) | 0.0 |
| Graduate Degree | 0 (0.0%) | 0.0 |
| Total | 9 (100.0%) | 78.0 |
Fertility by Education by Marriage Status in Alpena
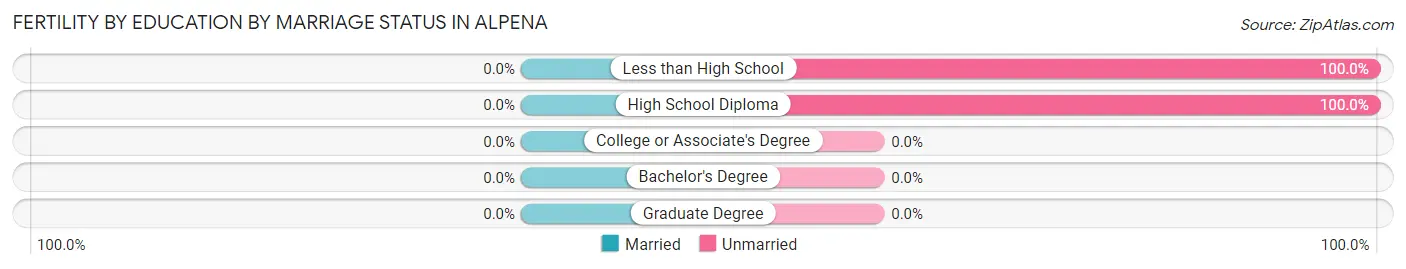
| Educational Attainment | Married | Unmarried |
| Less than High School | 0 (0.0%) | 7 (100.0%) |
| High School Diploma | 0 (0.0%) | 2 (100.0%) |
| College or Associate's Degree | 0 (0.0%) | 0 (0.0%) |
| Bachelor's Degree | 0 (0.0%) | 0 (0.0%) |
| Graduate Degree | 0 (0.0%) | 0 (0.0%) |
| Total | 0 (0.0%) | 9 (100.0%) |
Employment Characteristics in Alpena
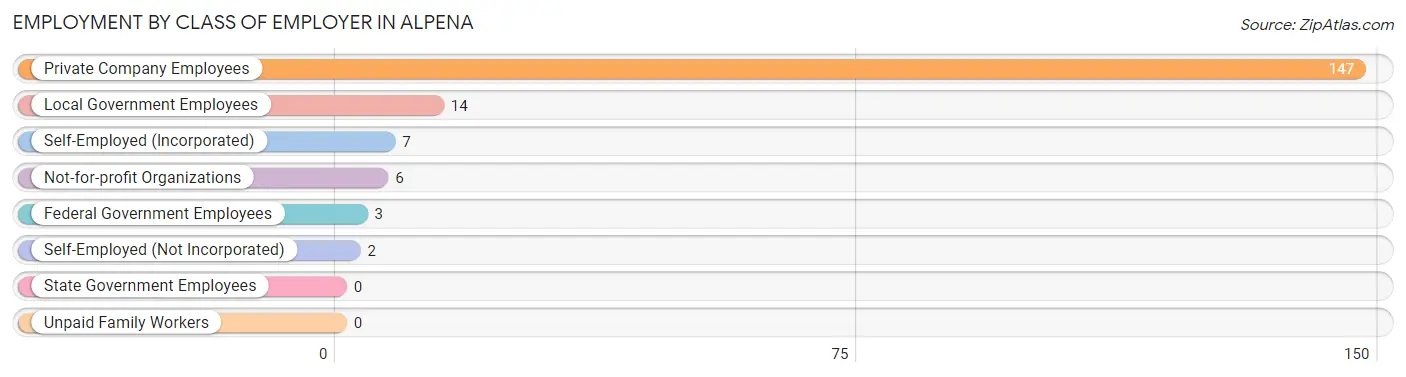
Employment by Class of Employer in Alpena
Among the 179 employed individuals in Alpena, private company employees (147 | 82.1%), local government employees (14 | 7.8%), and self-employed (incorporated) (7 | 3.9%) make up the most common classes of employment.
| Employer Class | # Employees | % Employees |
| Private Company Employees | 147 | 82.1% |
| Self-Employed (Incorporated) | 7 | 3.9% |
| Self-Employed (Not Incorporated) | 2 | 1.1% |
| Not-for-profit Organizations | 6 | 3.4% |
| Local Government Employees | 14 | 7.8% |
| State Government Employees | 0 | 0.0% |
| Federal Government Employees | 3 | 1.7% |
| Unpaid Family Workers | 0 | 0.0% |
| Total | 179 | 100.0% |
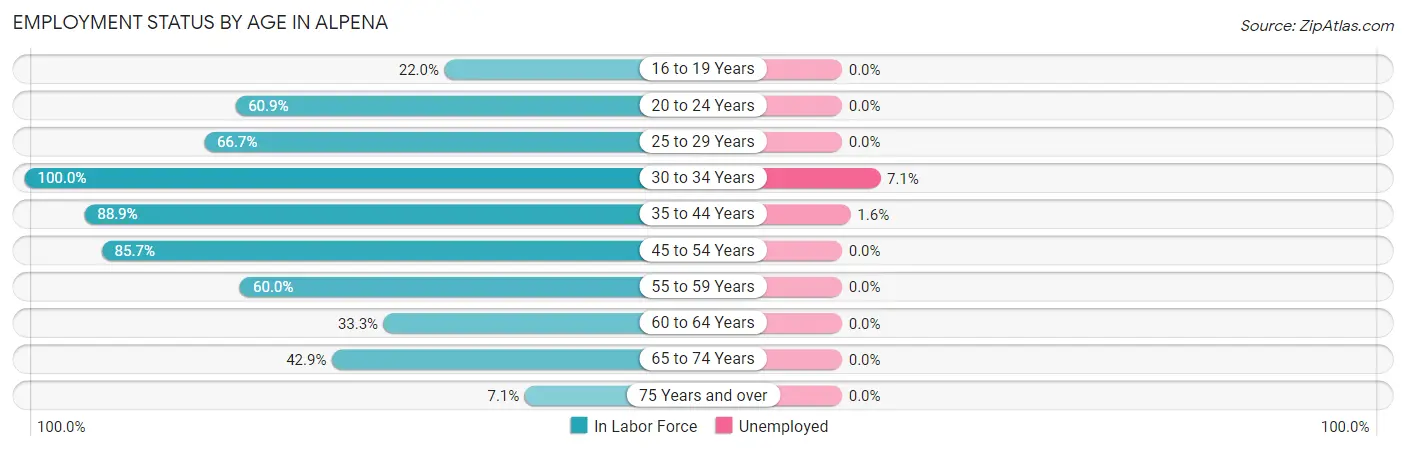
Employment Status by Age in Alpena
According to the labor force statistics for Alpena, out of the total population over 16 years of age (311), 58.8% or 183 individuals are in the labor force, with 1.1% or 2 of them unemployed. The age group with the highest labor force participation rate is 30 to 34 years, with 100.0% or 14 individuals in the labor force. Within the labor force, the 30 to 34 years age range has the highest percentage of unemployed individuals, with 7.1% or 1 of them being unemployed.
| Age Bracket | In Labor Force | Unemployed |
| 16 to 19 Years | 13 (22.0%) | 0 (0.0%) |
| 20 to 24 Years | 14 (60.9%) | 0 (0.0%) |
| 25 to 29 Years | 4 (66.7%) | 0 (0.0%) |
| 30 to 34 Years | 14 (100.0%) | 1 (7.1%) |
| 35 to 44 Years | 64 (88.9%) | 1 (1.6%) |
| 45 to 54 Years | 36 (85.7%) | 0 (0.0%) |
| 55 to 59 Years | 15 (60.0%) | 0 (0.0%) |
| 60 to 64 Years | 7 (33.3%) | 0 (0.0%) |
| 65 to 74 Years | 15 (42.9%) | 0 (0.0%) |
| 75 Years and over | 1 (7.1%) | 0 (0.0%) |
| Total | 183 (58.8%) | 2 (1.1%) |
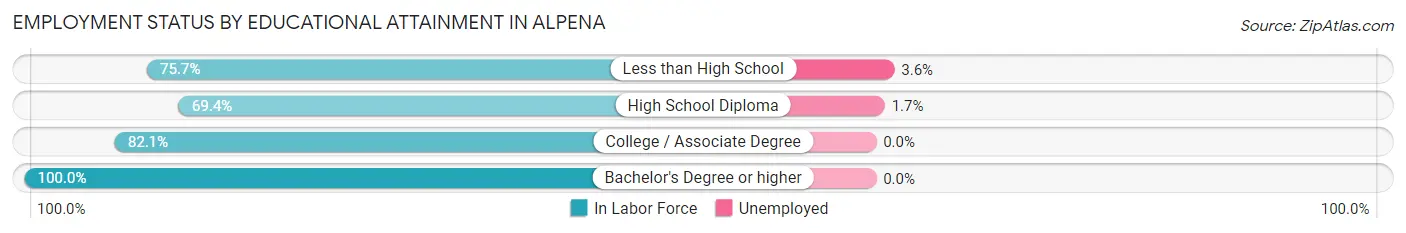
Employment Status by Educational Attainment in Alpena
According to labor force statistics for Alpena, 77.8% of individuals (140) out of the total population between 25 and 64 years of age (180) are in the labor force, with 1.4% or 2 of them being unemployed. The group with the highest labor force participation rate are those with the educational attainment of bachelor's degree or higher, with 100.0% or 30 individuals in the labor force. Within the labor force, individuals with less than high school education have the highest percentage of unemployment, with 3.6% or 1 of them being unemployed.
| Educational Attainment | In Labor Force | Unemployed |
| Less than High School | 28 (75.7%) | 1 (3.6%) |
| High School Diploma | 59 (69.4%) | 1 (1.7%) |
| College / Associate Degree | 23 (82.1%) | 0 (0.0%) |
| Bachelor's Degree or higher | 30 (100.0%) | 0 (0.0%) |
| Total | 140 (77.8%) | 3 (1.4%) |
Employment Occupations by Sex in Alpena
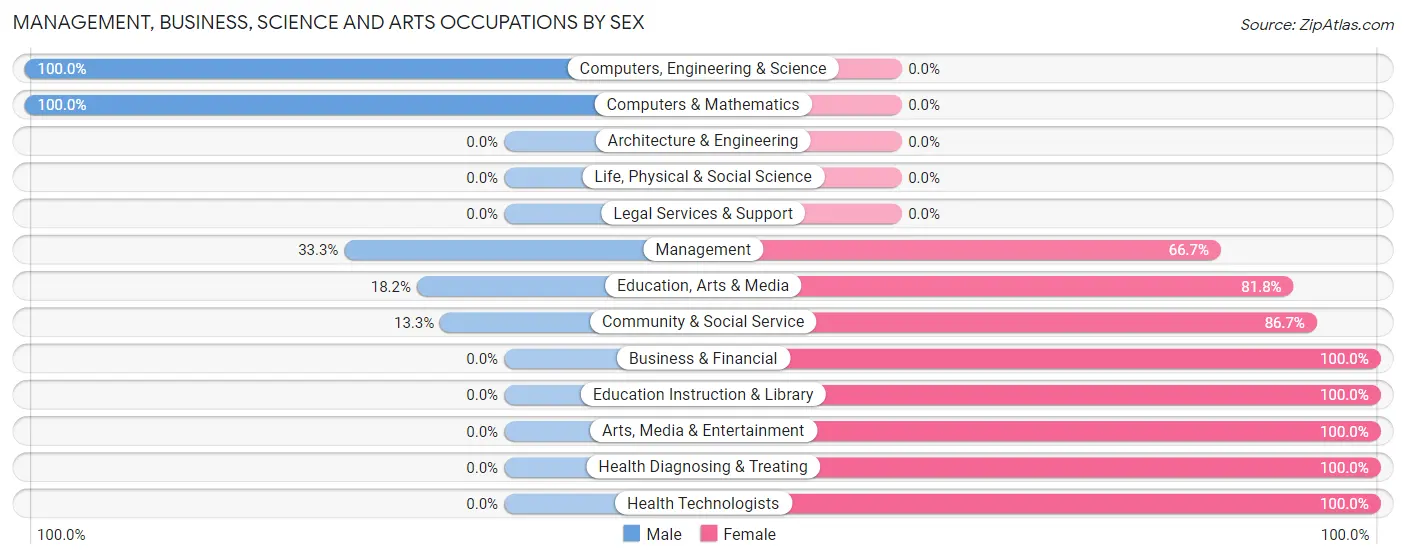
Management, Business, Science and Arts Occupations
The most common Management, Business, Science and Arts occupations in Alpena are Community & Social Service (15 | 8.3%), Education, Arts & Media (11 | 6.1%), Management (3 | 1.7%), Business & Financial (3 | 1.7%), and Computers, Engineering & Science (3 | 1.7%).
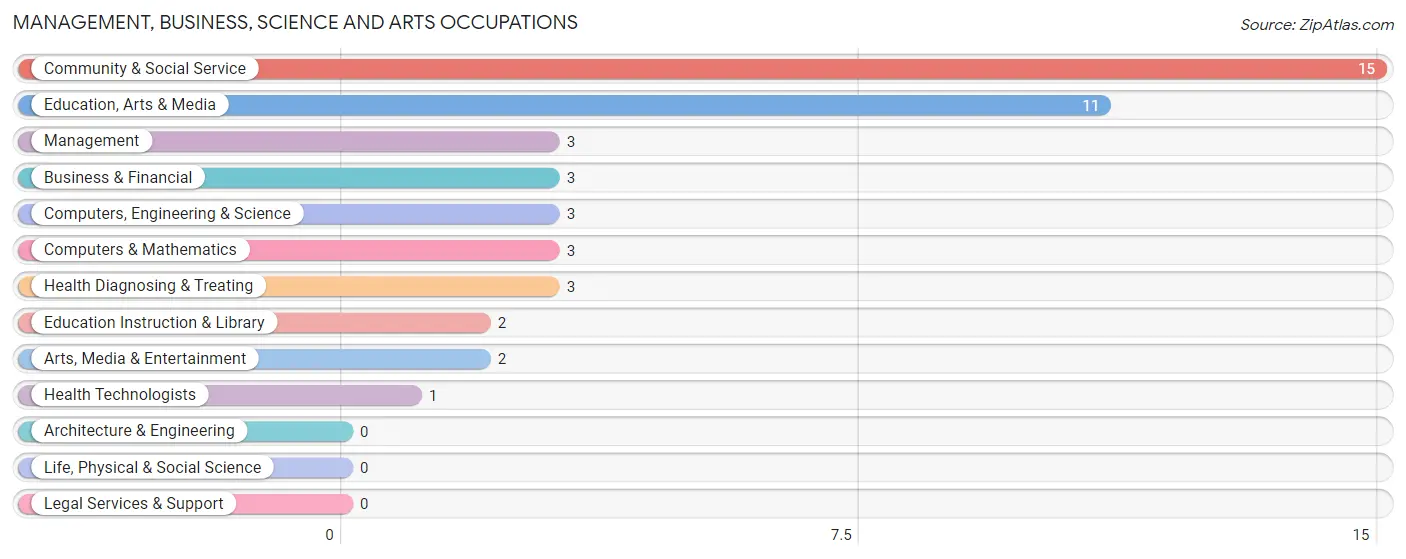
Management, Business, Science and Arts Occupations by Sex
Within the Management, Business, Science and Arts occupations in Alpena, the most male-oriented occupations are Computers, Engineering & Science (100.0%), Computers & Mathematics (100.0%), and Management (33.3%), while the most female-oriented occupations are Business & Financial (100.0%), Education Instruction & Library (100.0%), and Arts, Media & Entertainment (100.0%).
| Occupation | Male | Female |
| Management | 1 (33.3%) | 2 (66.7%) |
| Business & Financial | 0 (0.0%) | 3 (100.0%) |
| Computers, Engineering & Science | 3 (100.0%) | 0 (0.0%) |
| Computers & Mathematics | 3 (100.0%) | 0 (0.0%) |
| Architecture & Engineering | 0 (0.0%) | 0 (0.0%) |
| Life, Physical & Social Science | 0 (0.0%) | 0 (0.0%) |
| Community & Social Service | 2 (13.3%) | 13 (86.7%) |
| Education, Arts & Media | 2 (18.2%) | 9 (81.8%) |
| Legal Services & Support | 0 (0.0%) | 0 (0.0%) |
| Education Instruction & Library | 0 (0.0%) | 2 (100.0%) |
| Arts, Media & Entertainment | 0 (0.0%) | 2 (100.0%) |
| Health Diagnosing & Treating | 0 (0.0%) | 3 (100.0%) |
| Health Technologists | 0 (0.0%) | 1 (100.0%) |
| Total (Category) | 6 (22.2%) | 21 (77.8%) |
| Total (Overall) | 76 (42.0%) | 105 (58.0%) |
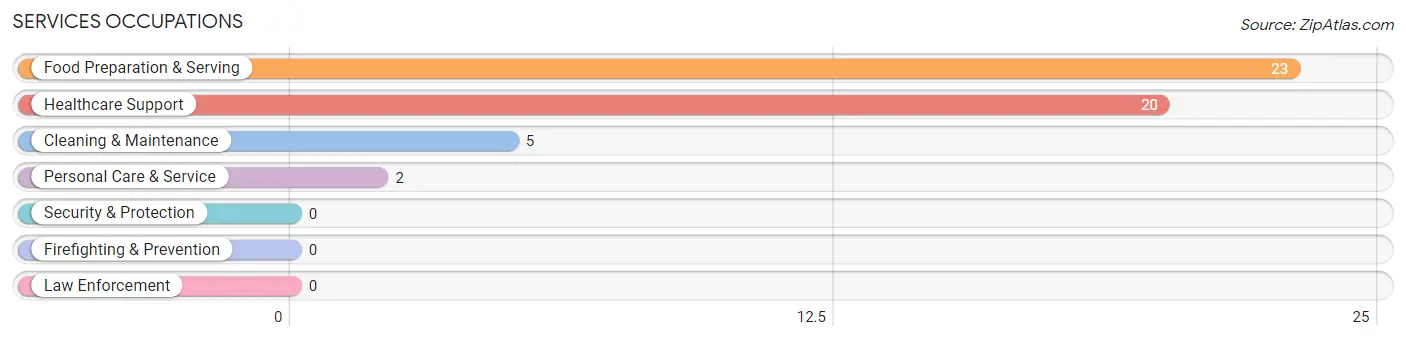
Services Occupations
The most common Services occupations in Alpena are Food Preparation & Serving (23 | 12.7%), Healthcare Support (20 | 11.1%), Cleaning & Maintenance (5 | 2.8%), and Personal Care & Service (2 | 1.1%).
Services Occupations by Sex
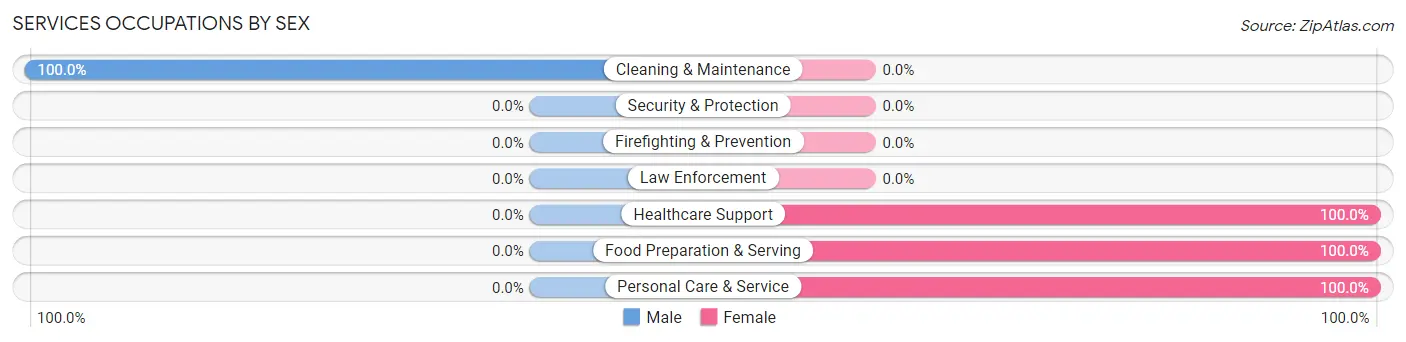
| Occupation | Male | Female |
| Healthcare Support | 0 (0.0%) | 20 (100.0%) |
| Security & Protection | 0 (0.0%) | 0 (0.0%) |
| Firefighting & Prevention | 0 (0.0%) | 0 (0.0%) |
| Law Enforcement | 0 (0.0%) | 0 (0.0%) |
| Food Preparation & Serving | 0 (0.0%) | 23 (100.0%) |
| Cleaning & Maintenance | 5 (100.0%) | 0 (0.0%) |
| Personal Care & Service | 0 (0.0%) | 2 (100.0%) |
| Total (Category) | 5 (10.0%) | 45 (90.0%) |
| Total (Overall) | 76 (42.0%) | 105 (58.0%) |
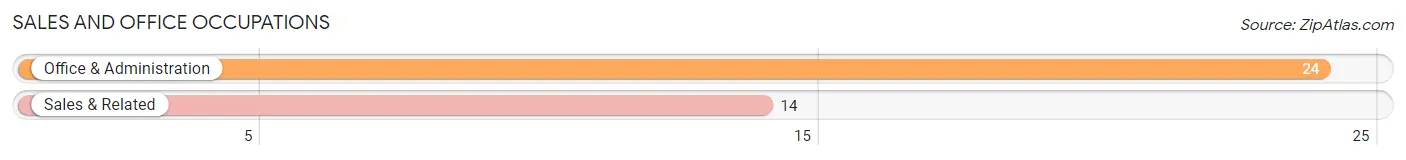
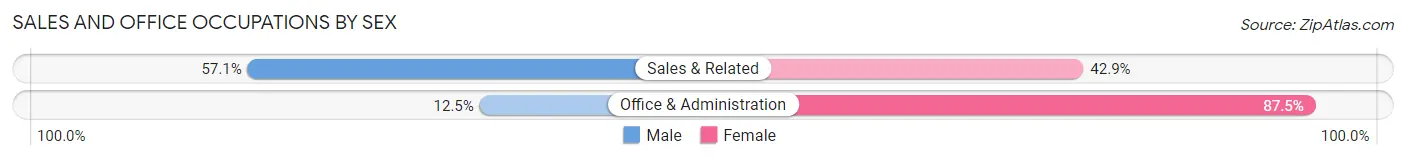
Sales and Office Occupations
The most common Sales and Office occupations in Alpena are Office & Administration (24 | 13.3%), and Sales & Related (14 | 7.7%).
Sales and Office Occupations by Sex
| Occupation | Male | Female |
| Sales & Related | 8 (57.1%) | 6 (42.9%) |
| Office & Administration | 3 (12.5%) | 21 (87.5%) |
| Total (Category) | 11 (28.9%) | 27 (71.1%) |
| Total (Overall) | 76 (42.0%) | 105 (58.0%) |
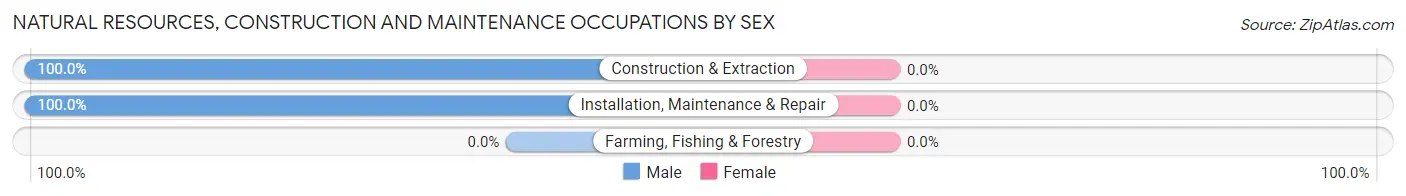
Natural Resources, Construction and Maintenance Occupations
The most common Natural Resources, Construction and Maintenance occupations in Alpena are Installation, Maintenance & Repair (2 | 1.1%), and Construction & Extraction (1 | 0.5%).

Natural Resources, Construction and Maintenance Occupations by Sex
| Occupation | Male | Female |
| Farming, Fishing & Forestry | 0 (0.0%) | 0 (0.0%) |
| Construction & Extraction | 1 (100.0%) | 0 (0.0%) |
| Installation, Maintenance & Repair | 2 (100.0%) | 0 (0.0%) |
| Total (Category) | 3 (100.0%) | 0 (0.0%) |
| Total (Overall) | 76 (42.0%) | 105 (58.0%) |
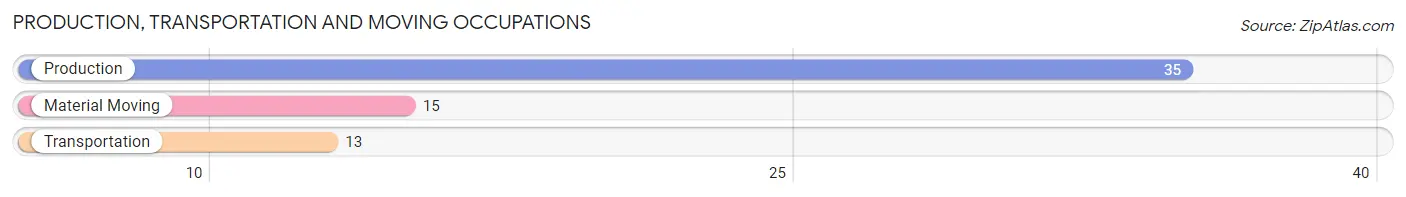
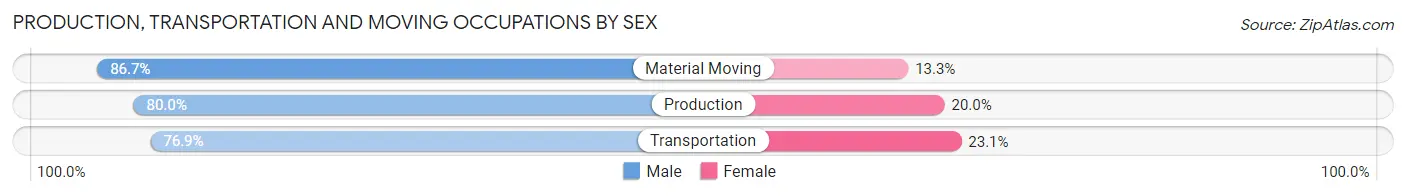
Production, Transportation and Moving Occupations
The most common Production, Transportation and Moving occupations in Alpena are Production (35 | 19.3%), Material Moving (15 | 8.3%), and Transportation (13 | 7.2%).
Production, Transportation and Moving Occupations by Sex
| Occupation | Male | Female |
| Production | 28 (80.0%) | 7 (20.0%) |
| Transportation | 10 (76.9%) | 3 (23.1%) |
| Material Moving | 13 (86.7%) | 2 (13.3%) |
| Total (Category) | 51 (80.9%) | 12 (19.1%) |
| Total (Overall) | 76 (42.0%) | 105 (58.0%) |
Employment Industries by Sex in Alpena
Employment Industries in Alpena
The major employment industries in Alpena include Health Care & Social Assistance (43 | 23.8%), Manufacturing (35 | 19.3%), Retail Trade (28 | 15.5%), Wholesale Trade (20 | 11.1%), and Accommodation & Food Services (17 | 9.4%).

Employment Industries by Sex in Alpena
The Alpena industries that see more men than women are Construction (100.0%), Wholesale Trade (95.0%), and Public Administration (75.0%), whereas the industries that tend to have a higher number of women are Real Estate, Rental & Leasing (100.0%), Educational Services (100.0%), and Health Care & Social Assistance (100.0%).
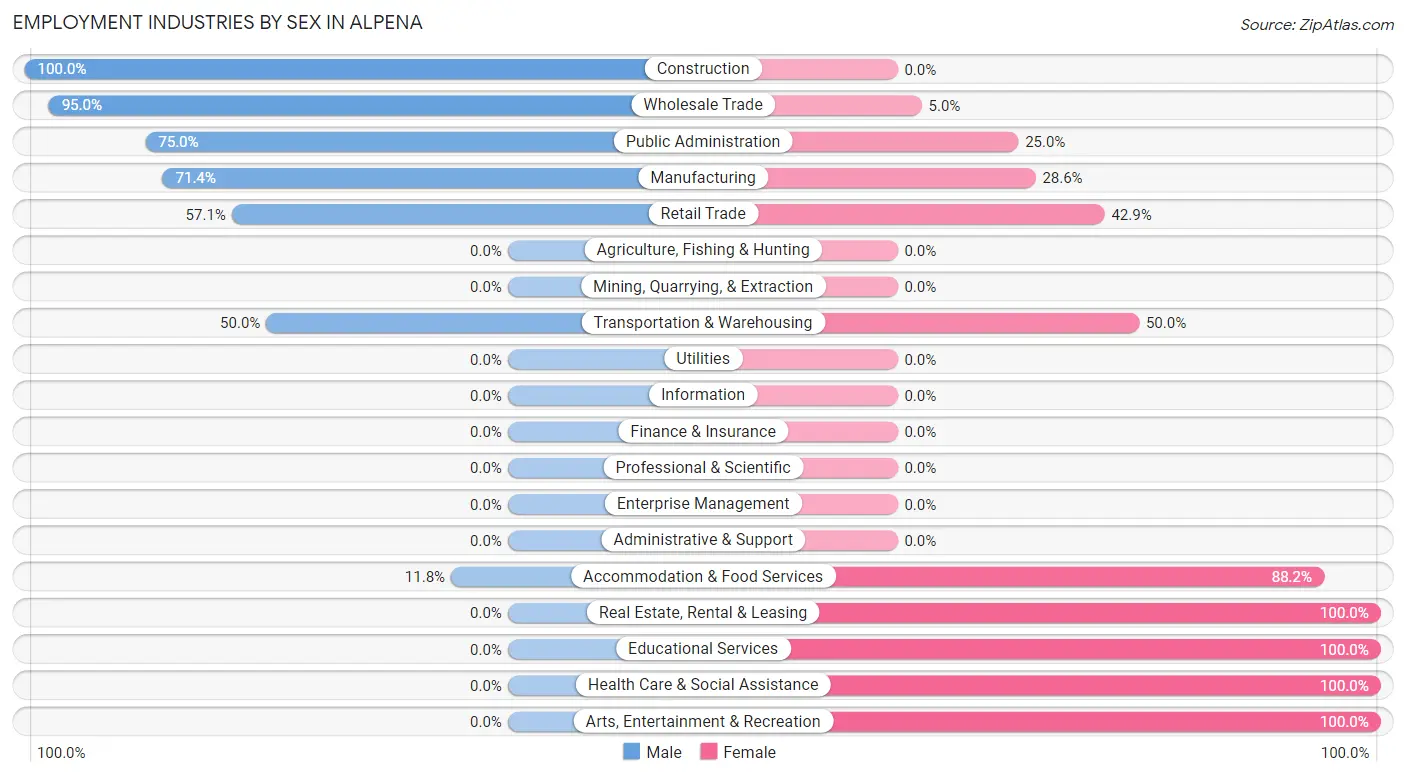
| Industry | Male | Female |
| Agriculture, Fishing & Hunting | 0 (0.0%) | 0 (0.0%) |
| Mining, Quarrying, & Extraction | 0 (0.0%) | 0 (0.0%) |
| Construction | 1 (100.0%) | 0 (0.0%) |
| Manufacturing | 25 (71.4%) | 10 (28.6%) |
| Wholesale Trade | 19 (95.0%) | 1 (5.0%) |
| Retail Trade | 16 (57.1%) | 12 (42.9%) |
| Transportation & Warehousing | 5 (50.0%) | 5 (50.0%) |
| Utilities | 0 (0.0%) | 0 (0.0%) |
| Information | 0 (0.0%) | 0 (0.0%) |
| Finance & Insurance | 0 (0.0%) | 0 (0.0%) |
| Real Estate, Rental & Leasing | 0 (0.0%) | 1 (100.0%) |
| Professional & Scientific | 0 (0.0%) | 0 (0.0%) |
| Enterprise Management | 0 (0.0%) | 0 (0.0%) |
| Administrative & Support | 0 (0.0%) | 0 (0.0%) |
| Educational Services | 0 (0.0%) | 14 (100.0%) |
| Health Care & Social Assistance | 0 (0.0%) | 43 (100.0%) |
| Arts, Entertainment & Recreation | 0 (0.0%) | 2 (100.0%) |
| Accommodation & Food Services | 2 (11.8%) | 15 (88.2%) |
| Public Administration | 6 (75.0%) | 2 (25.0%) |
| Total | 76 (42.0%) | 105 (58.0%) |
Education in Alpena
School Enrollment in Alpena
The most common levels of schooling among the 144 students in Alpena are high school (82 | 56.9%), middle school (32 | 22.2%), and elementary school (13 | 9.0%).
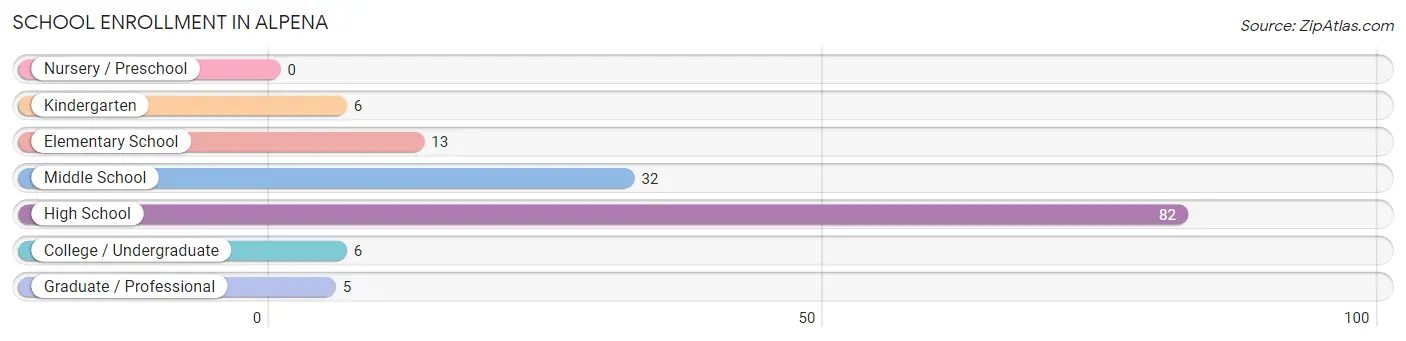
| School Level | # Students | % Students |
| Nursery / Preschool | 0 | 0.0% |
| Kindergarten | 6 | 4.2% |
| Elementary School | 13 | 9.0% |
| Middle School | 32 | 22.2% |
| High School | 82 | 56.9% |
| College / Undergraduate | 6 | 4.2% |
| Graduate / Professional | 5 | 3.5% |
| Total | 144 | 100.0% |
School Enrollment by Age by Funding Source in Alpena
Out of a total of 144 students who are enrolled in schools in Alpena, 7 (4.9%) attend a private institution, while the remaining 137 (95.1%) are enrolled in public schools. The age group of 5 to 9 year old has the highest likelihood of being enrolled in private schools, with 2 (16.7% in the age bracket) enrolled. Conversely, the age group of 3 to 4 year olds has the lowest likelihood of being enrolled in a private school, with 2 (100.0% in the age bracket) attending a public institution.
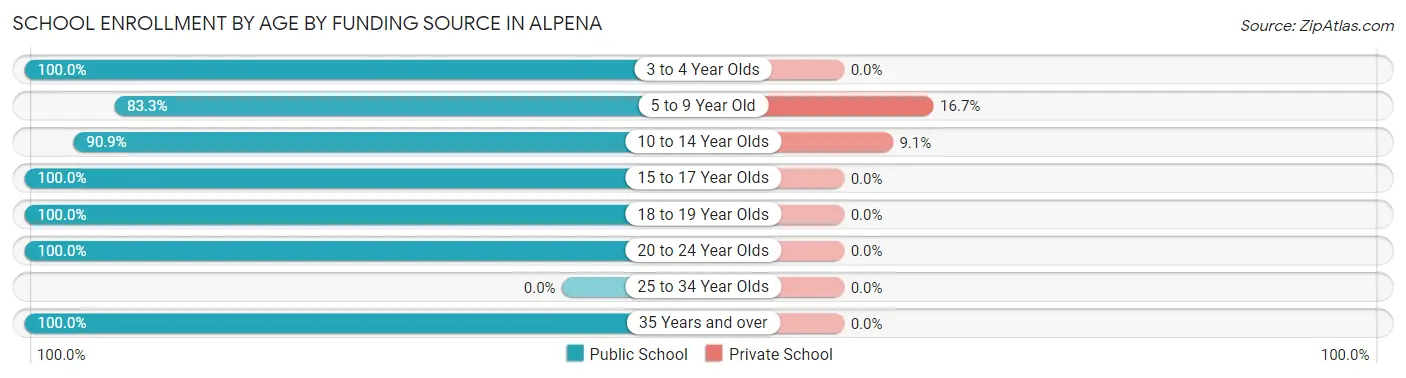
| Age Bracket | Public School | Private School |
| 3 to 4 Year Olds | 2 (100.0%) | 0 (0.0%) |
| 5 to 9 Year Old | 10 (83.3%) | 2 (16.7%) |
| 10 to 14 Year Olds | 50 (90.9%) | 5 (9.1%) |
| 15 to 17 Year Olds | 56 (100.0%) | 0 (0.0%) |
| 18 to 19 Year Olds | 8 (100.0%) | 0 (0.0%) |
| 20 to 24 Year Olds | 6 (100.0%) | 0 (0.0%) |
| 25 to 34 Year Olds | 0 (0.0%) | 0 (0.0%) |
| 35 Years and over | 5 (100.0%) | 0 (0.0%) |
| Total | 137 (95.1%) | 7 (4.9%) |
Educational Attainment by Field of Study in Alpena
Arts & humanities (14 | 40.0%), psychology (6 | 17.1%), computers & mathematics (3 | 8.6%), communications (3 | 8.6%), and bio, nature & agricultural (2 | 5.7%) are the most common fields of study among 35 individuals in Alpena who have obtained a bachelor's degree or higher.
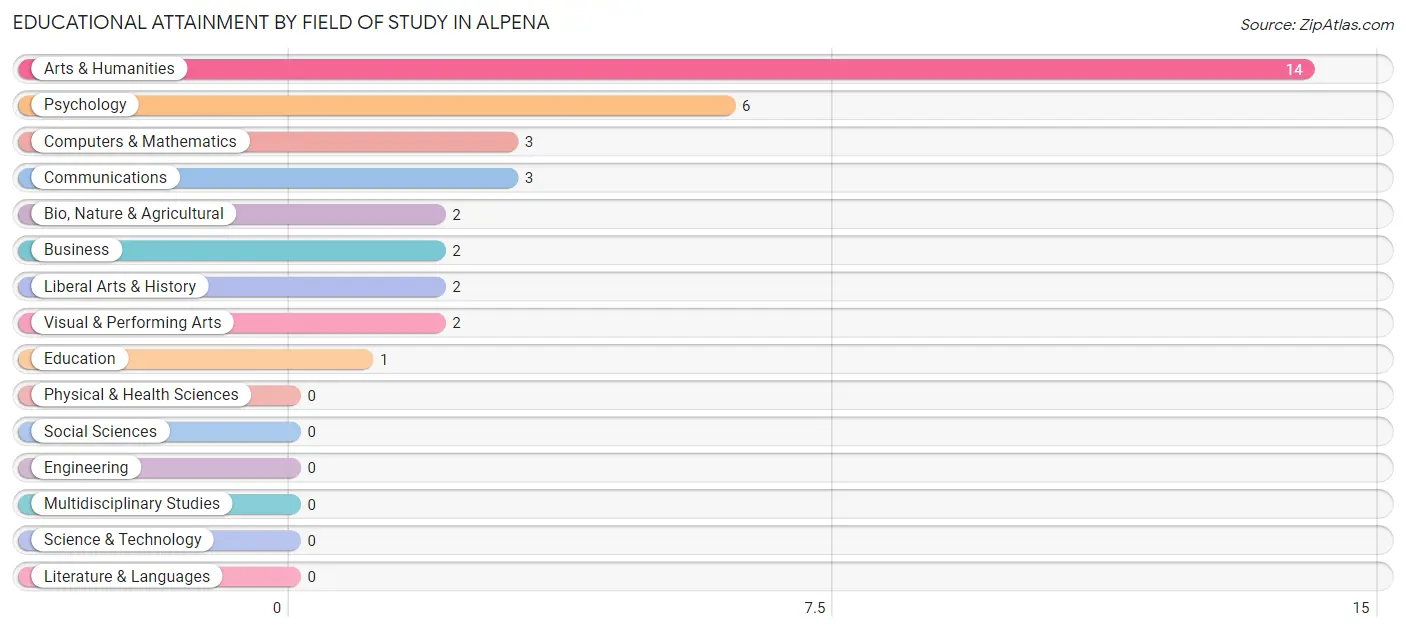
| Field of Study | # Graduates | % Graduates |
| Computers & Mathematics | 3 | 8.6% |
| Bio, Nature & Agricultural | 2 | 5.7% |
| Physical & Health Sciences | 0 | 0.0% |
| Psychology | 6 | 17.1% |
| Social Sciences | 0 | 0.0% |
| Engineering | 0 | 0.0% |
| Multidisciplinary Studies | 0 | 0.0% |
| Science & Technology | 0 | 0.0% |
| Business | 2 | 5.7% |
| Education | 1 | 2.9% |
| Literature & Languages | 0 | 0.0% |
| Liberal Arts & History | 2 | 5.7% |
| Visual & Performing Arts | 2 | 5.7% |
| Communications | 3 | 8.6% |
| Arts & Humanities | 14 | 40.0% |
| Total | 35 | 100.0% |
Transportation & Commute in Alpena
Vehicle Availability by Sex in Alpena
The most prevalent vehicle ownership categories in Alpena are males with 2 vehicles (31, accounting for 40.8%) and females with 2 vehicles (63, making up 30.1%).

| Vehicles Available | Male | Female |
| No Vehicle | 2 (2.6%) | 1 (1.0%) |
| 1 Vehicle | 5 (6.6%) | 16 (15.5%) |
| 2 Vehicles | 31 (40.8%) | 63 (61.2%) |
| 3 Vehicles | 10 (13.2%) | 6 (5.8%) |
| 4 Vehicles | 26 (34.2%) | 16 (15.5%) |
| 5 or more Vehicles | 2 (2.6%) | 1 (1.0%) |
| Total | 76 (100.0%) | 103 (100.0%) |
Commute Time in Alpena
The most frequently occuring commute durations in Alpena are 20 to 24 minutes (55 commuters, 31.2%), 10 to 14 minutes (33 commuters, 18.8%), and 25 to 29 minutes (25 commuters, 14.2%).

| Commute Time | # Commuters | % Commuters |
| Less than 5 Minutes | 18 | 10.2% |
| 5 to 9 Minutes | 3 | 1.7% |
| 10 to 14 Minutes | 33 | 18.8% |
| 15 to 19 Minutes | 18 | 10.2% |
| 20 to 24 Minutes | 55 | 31.2% |
| 25 to 29 Minutes | 25 | 14.2% |
| 30 to 34 Minutes | 13 | 7.4% |
| 35 to 39 Minutes | 0 | 0.0% |
| 40 to 44 Minutes | 0 | 0.0% |
| 45 to 59 Minutes | 3 | 1.7% |
| 60 to 89 Minutes | 7 | 4.0% |
| 90 or more Minutes | 1 | 0.6% |
Commute Time by Sex in Alpena
The most common commute times in Alpena are 20 to 24 minutes (22 commuters, 28.9%) for males and 20 to 24 minutes (33 commuters, 33.0%) for females.
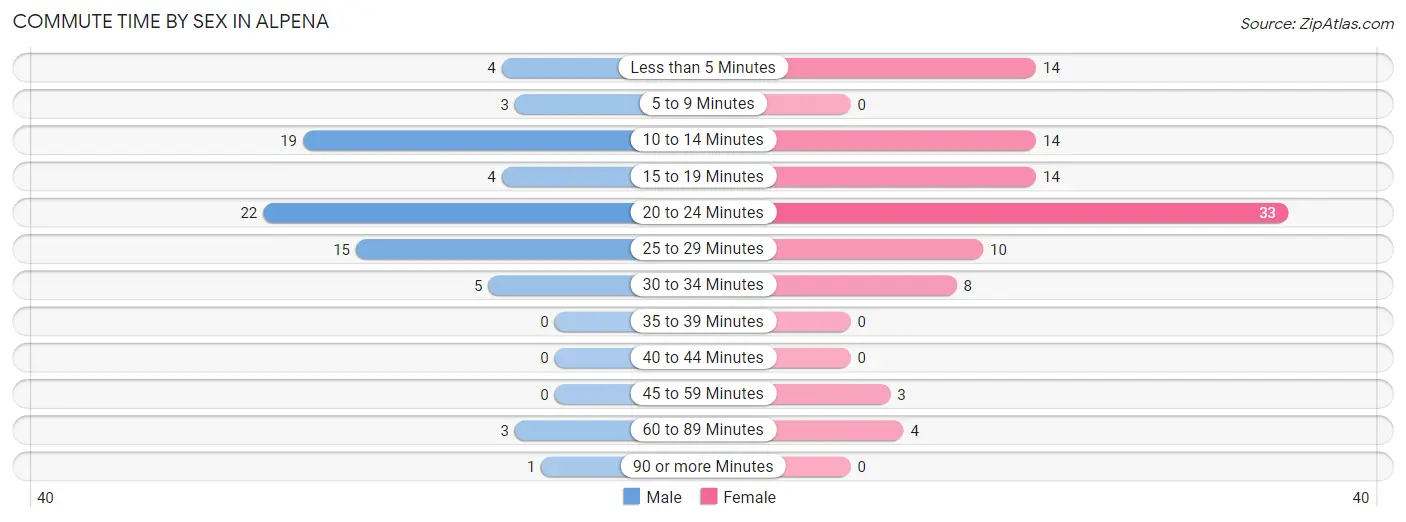
| Commute Time | Male | Female |
| Less than 5 Minutes | 4 (5.3%) | 14 (14.0%) |
| 5 to 9 Minutes | 3 (4.0%) | 0 (0.0%) |
| 10 to 14 Minutes | 19 (25.0%) | 14 (14.0%) |
| 15 to 19 Minutes | 4 (5.3%) | 14 (14.0%) |
| 20 to 24 Minutes | 22 (28.9%) | 33 (33.0%) |
| 25 to 29 Minutes | 15 (19.7%) | 10 (10.0%) |
| 30 to 34 Minutes | 5 (6.6%) | 8 (8.0%) |
| 35 to 39 Minutes | 0 (0.0%) | 0 (0.0%) |
| 40 to 44 Minutes | 0 (0.0%) | 0 (0.0%) |
| 45 to 59 Minutes | 0 (0.0%) | 3 (3.0%) |
| 60 to 89 Minutes | 3 (4.0%) | 4 (4.0%) |
| 90 or more Minutes | 1 (1.3%) | 0 (0.0%) |
Time of Departure to Work by Sex in Alpena
The most frequent times of departure to work in Alpena are 7:00 AM to 7:29 AM (24, 31.6%) for males and 8:00 AM to 8:29 AM (19, 19.0%) for females.

| Time of Departure | Male | Female |
| 12:00 AM to 4:59 AM | 18 (23.7%) | 8 (8.0%) |
| 5:00 AM to 5:29 AM | 2 (2.6%) | 16 (16.0%) |
| 5:30 AM to 5:59 AM | 8 (10.5%) | 4 (4.0%) |
| 6:00 AM to 6:29 AM | 2 (2.6%) | 3 (3.0%) |
| 6:30 AM to 6:59 AM | 5 (6.6%) | 12 (12.0%) |
| 7:00 AM to 7:29 AM | 24 (31.6%) | 13 (13.0%) |
| 7:30 AM to 7:59 AM | 1 (1.3%) | 10 (10.0%) |
| 8:00 AM to 8:29 AM | 2 (2.6%) | 19 (19.0%) |
| 8:30 AM to 8:59 AM | 0 (0.0%) | 2 (2.0%) |
| 9:00 AM to 9:59 AM | 0 (0.0%) | 1 (1.0%) |
| 10:00 AM to 10:59 AM | 1 (1.3%) | 0 (0.0%) |
| 11:00 AM to 11:59 AM | 0 (0.0%) | 1 (1.0%) |
| 12:00 PM to 3:59 PM | 10 (13.2%) | 11 (11.0%) |
| 4:00 PM to 11:59 PM | 3 (4.0%) | 0 (0.0%) |
| Total | 76 (100.0%) | 100 (100.0%) |
Housing Occupancy in Alpena
Occupancy by Ownership in Alpena
Of the total 124 dwellings in Alpena, owner-occupied units account for 77 (62.1%), while renter-occupied units make up 47 (37.9%).

| Occupancy | # Housing Units | % Housing Units |
| Owner Occupied Housing Units | 77 | 62.1% |
| Renter-Occupied Housing Units | 47 | 37.9% |
| Total Occupied Housing Units | 124 | 100.0% |
Occupancy by Household Size in Alpena

| Household Size | # Housing Units | % Housing Units |
| 1-Person Household | 30 | 24.2% |
| 2-Person Household | 34 | 27.4% |
| 3-Person Household | 27 | 21.8% |
| 4+ Person Household | 33 | 26.6% |
| Total Housing Units | 124 | 100.0% |
Occupancy by Ownership by Household Size in Alpena

| Household Size | Owner-occupied | Renter-occupied |
| 1-Person Household | 23 (76.7%) | 7 (23.3%) |
| 2-Person Household | 23 (67.6%) | 11 (32.4%) |
| 3-Person Household | 12 (44.4%) | 15 (55.6%) |
| 4+ Person Household | 19 (57.6%) | 14 (42.4%) |
| Total Housing Units | 77 (62.1%) | 47 (37.9%) |
Occupancy by Educational Attainment in Alpena

| Household Size | Owner-occupied | Renter-occupied |
| Less than High School | 11 (52.4%) | 10 (47.6%) |
| High School Diploma | 39 (55.7%) | 31 (44.3%) |
| College/Associate Degree | 15 (78.9%) | 4 (21.0%) |
| Bachelor's Degree or higher | 12 (85.7%) | 2 (14.3%) |
Occupancy by Age of Householder in Alpena

| Age Bracket | # Households | % Households |
| Under 35 Years | 12 | 9.7% |
| 35 to 44 Years | 38 | 30.6% |
| 45 to 54 Years | 25 | 20.2% |
| 55 to 64 Years | 22 | 17.7% |
| 65 to 74 Years | 17 | 13.7% |
| 75 to 84 Years | 4 | 3.2% |
| 85 Years and Over | 6 | 4.8% |
| Total | 124 | 100.0% |
Housing Finances in Alpena
Median Income by Occupancy in Alpena
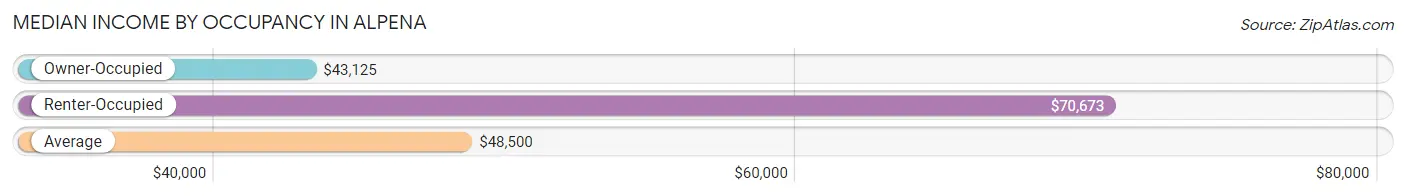
| Occupancy Type | # Households | Median Income |
| Owner-Occupied | 77 (62.1%) | $43,125 |
| Renter-Occupied | 47 (37.9%) | $70,673 |
| Average | 124 (100.0%) | $48,500 |
Occupancy by Householder Income Bracket in Alpena

| Income Bracket | Owner-occupied | Renter-occupied |
| Less than $5,000 | 3 (3.9%) | 0 (0.0%) |
| $5,000 to $9,999 | 0 (0.0%) | 0 (0.0%) |
| $10,000 to $14,999 | 1 (1.3%) | 2 (4.3%) |
| $15,000 to $19,999 | 4 (5.2%) | 2 (4.3%) |
| $20,000 to $24,999 | 9 (11.7%) | 4 (8.5%) |
| $25,000 to $34,999 | 11 (14.3%) | 5 (10.6%) |
| $35,000 to $49,999 | 21 (27.3%) | 3 (6.4%) |
| $50,000 to $74,999 | 12 (15.6%) | 19 (40.4%) |
| $75,000 to $99,999 | 9 (11.7%) | 12 (25.5%) |
| $100,000 to $149,999 | 7 (9.1%) | 0 (0.0%) |
| $150,000 or more | 0 (0.0%) | 0 (0.0%) |
| Total | 77 (100.0%) | 47 (100.0%) |
Monthly Housing Cost Tiers in Alpena

| Monthly Cost | Owner-occupied | Renter-occupied |
| Less than $300 | 17 (22.1%) | 0 (0.0%) |
| $300 to $499 | 30 (39.0%) | 15 (31.9%) |
| $500 to $799 | 18 (23.4%) | 17 (36.2%) |
| $800 to $999 | 3 (3.9%) | 8 (17.0%) |
| $1,000 to $1,499 | 8 (10.4%) | 5 (10.6%) |
| $1,500 to $1,999 | 1 (1.3%) | 0 (0.0%) |
| $2,000 to $2,499 | 0 (0.0%) | 0 (0.0%) |
| $2,500 to $2,999 | 0 (0.0%) | 0 (0.0%) |
| $3,000 or more | 0 (0.0%) | 0 (0.0%) |
| Total | 77 (100.0%) | 47 (100.0%) |
Physical Housing Characteristics in Alpena
Housing Structures in Alpena
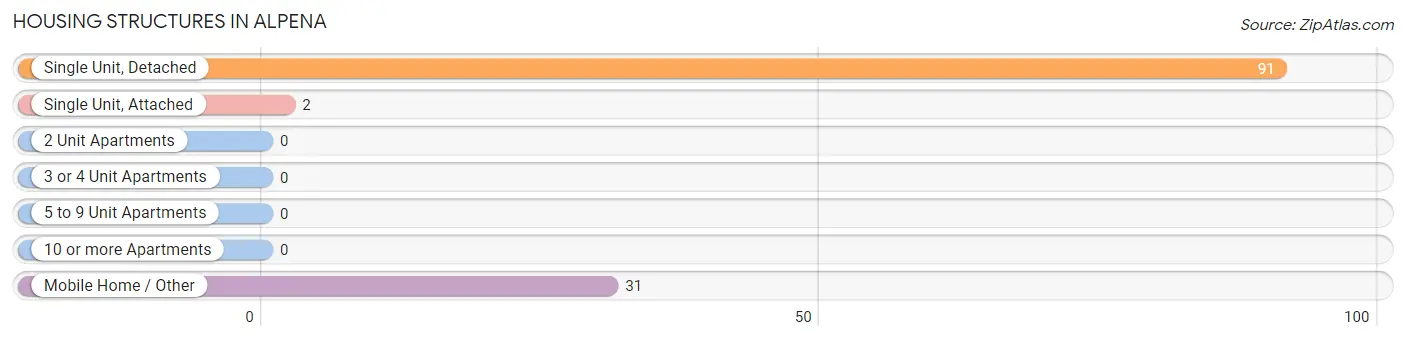
| Structure Type | # Housing Units | % Housing Units |
| Single Unit, Detached | 91 | 73.4% |
| Single Unit, Attached | 2 | 1.6% |
| 2 Unit Apartments | 0 | 0.0% |
| 3 or 4 Unit Apartments | 0 | 0.0% |
| 5 to 9 Unit Apartments | 0 | 0.0% |
| 10 or more Apartments | 0 | 0.0% |
| Mobile Home / Other | 31 | 25.0% |
| Total | 124 | 100.0% |
Housing Structures by Occupancy in Alpena
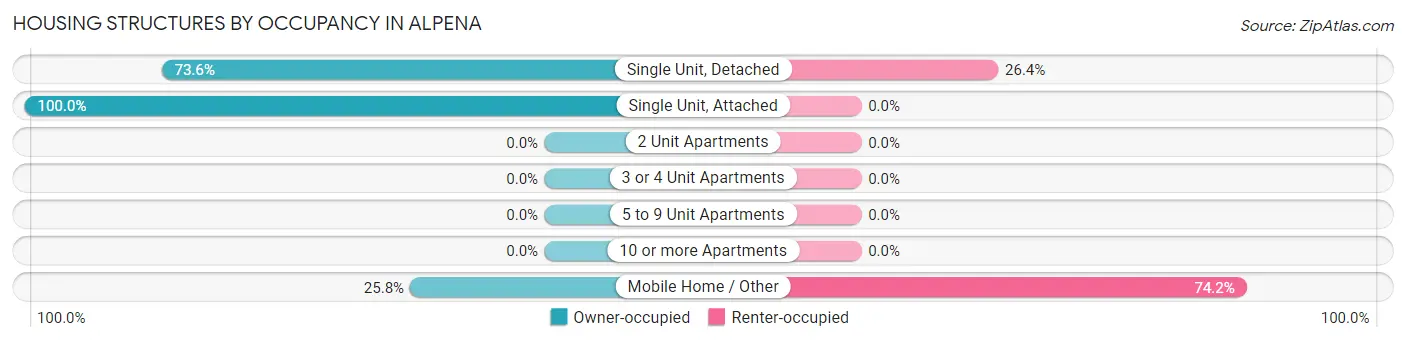
| Structure Type | Owner-occupied | Renter-occupied |
| Single Unit, Detached | 67 (73.6%) | 24 (26.4%) |
| Single Unit, Attached | 2 (100.0%) | 0 (0.0%) |
| 2 Unit Apartments | 0 (0.0%) | 0 (0.0%) |
| 3 or 4 Unit Apartments | 0 (0.0%) | 0 (0.0%) |
| 5 to 9 Unit Apartments | 0 (0.0%) | 0 (0.0%) |
| 10 or more Apartments | 0 (0.0%) | 0 (0.0%) |
| Mobile Home / Other | 8 (25.8%) | 23 (74.2%) |
| Total | 77 (62.1%) | 47 (37.9%) |
Housing Structures by Number of Rooms in Alpena
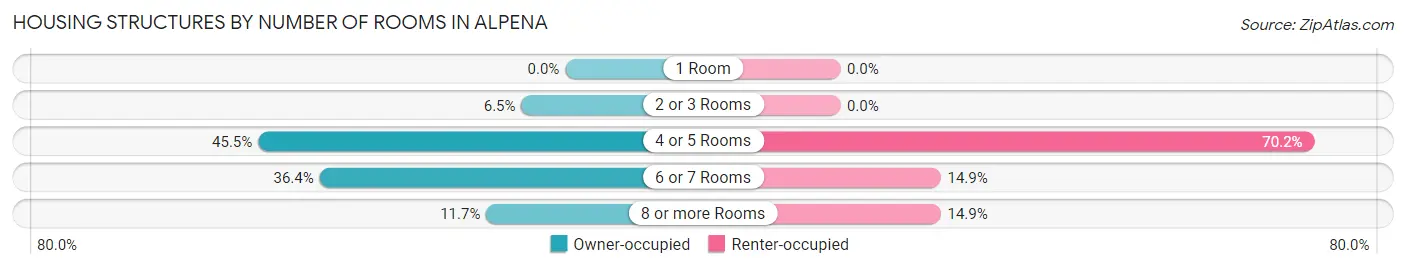
| Number of Rooms | Owner-occupied | Renter-occupied |
| 1 Room | 0 (0.0%) | 0 (0.0%) |
| 2 or 3 Rooms | 5 (6.5%) | 0 (0.0%) |
| 4 or 5 Rooms | 35 (45.5%) | 33 (70.2%) |
| 6 or 7 Rooms | 28 (36.4%) | 7 (14.9%) |
| 8 or more Rooms | 9 (11.7%) | 7 (14.9%) |
| Total | 77 (100.0%) | 47 (100.0%) |
Housing Structure by Heating Type in Alpena

| Heating Type | Owner-occupied | Renter-occupied |
| Utility Gas | 63 (81.8%) | 44 (93.6%) |
| Bottled, Tank, or LP Gas | 0 (0.0%) | 0 (0.0%) |
| Electricity | 13 (16.9%) | 3 (6.4%) |
| Fuel Oil or Kerosene | 0 (0.0%) | 0 (0.0%) |
| Coal or Coke | 0 (0.0%) | 0 (0.0%) |
| All other Fuels | 1 (1.3%) | 0 (0.0%) |
| No Fuel Used | 0 (0.0%) | 0 (0.0%) |
| Total | 77 (100.0%) | 47 (100.0%) |
Household Vehicle Usage in Alpena
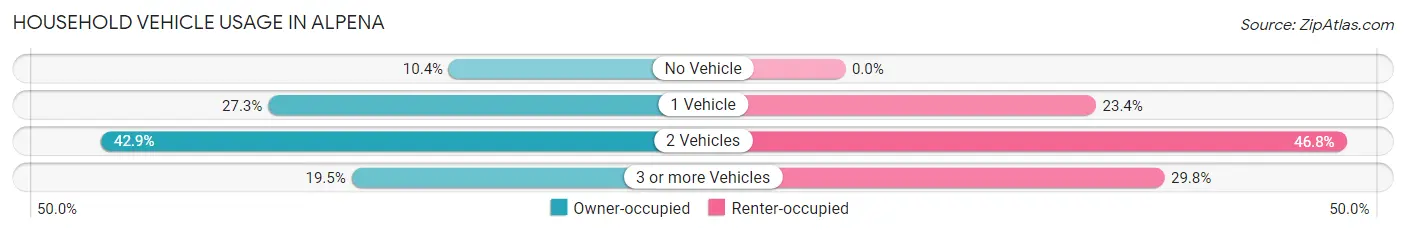
| Vehicles per Household | Owner-occupied | Renter-occupied |
| No Vehicle | 8 (10.4%) | 0 (0.0%) |
| 1 Vehicle | 21 (27.3%) | 11 (23.4%) |
| 2 Vehicles | 33 (42.9%) | 22 (46.8%) |
| 3 or more Vehicles | 15 (19.5%) | 14 (29.8%) |
| Total | 77 (100.0%) | 47 (100.0%) |
Real Estate & Mortgages in Alpena
Real Estate and Mortgage Overview in Alpena
| Characteristic | Without Mortgage | With Mortgage |
| Housing Units | 46 | 31 |
| Median Property Value | $75,000 | $89,500 |
| Median Household Income | $36,250 | $0 |
| Monthly Housing Costs | $325 | $0 |
| Real Estate Taxes | $486 | $0 |
Property Value by Mortgage Status in Alpena
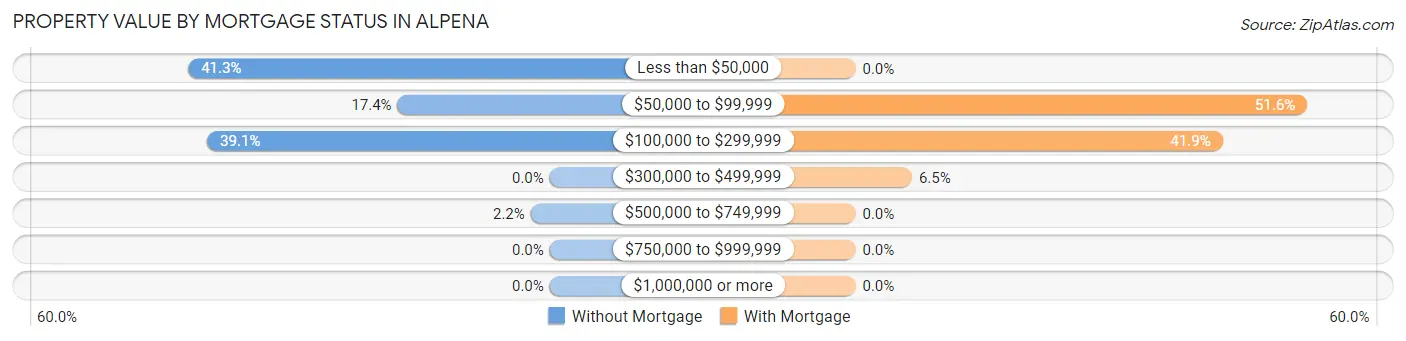
| Property Value | Without Mortgage | With Mortgage |
| Less than $50,000 | 19 (41.3%) | 0 (0.0%) |
| $50,000 to $99,999 | 8 (17.4%) | 16 (51.6%) |
| $100,000 to $299,999 | 18 (39.1%) | 13 (41.9%) |
| $300,000 to $499,999 | 0 (0.0%) | 2 (6.5%) |
| $500,000 to $749,999 | 1 (2.2%) | 0 (0.0%) |
| $750,000 to $999,999 | 0 (0.0%) | 0 (0.0%) |
| $1,000,000 or more | 0 (0.0%) | 0 (0.0%) |
| Total | 46 (100.0%) | 31 (100.0%) |
Household Income by Mortgage Status in Alpena
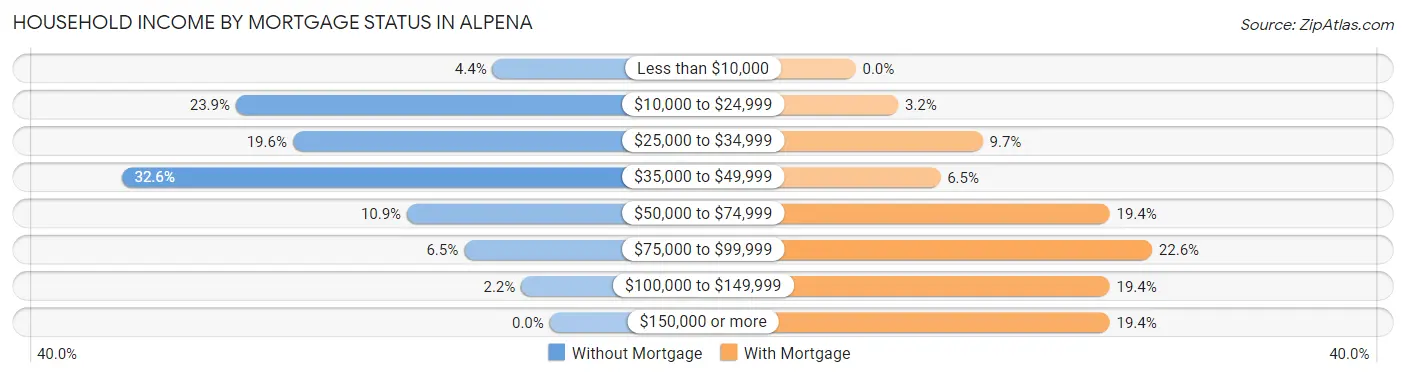
| Household Income | Without Mortgage | With Mortgage |
| Less than $10,000 | 2 (4.3%) | 0 (0.0%) |
| $10,000 to $24,999 | 11 (23.9%) | 1 (3.2%) |
| $25,000 to $34,999 | 9 (19.6%) | 3 (9.7%) |
| $35,000 to $49,999 | 15 (32.6%) | 2 (6.5%) |
| $50,000 to $74,999 | 5 (10.9%) | 6 (19.4%) |
| $75,000 to $99,999 | 3 (6.5%) | 7 (22.6%) |
| $100,000 to $149,999 | 1 (2.2%) | 6 (19.4%) |
| $150,000 or more | 0 (0.0%) | 6 (19.4%) |
| Total | 46 (100.0%) | 31 (100.0%) |
Property Value to Household Income Ratio in Alpena
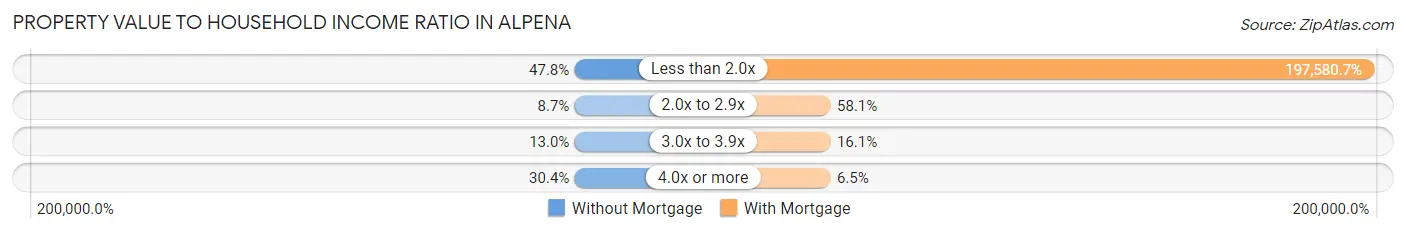
| Value-to-Income Ratio | Without Mortgage | With Mortgage |
| Less than 2.0x | 22 (47.8%) | 61,250 (197,580.6%) |
| 2.0x to 2.9x | 4 (8.7%) | 18 (58.1%) |
| 3.0x to 3.9x | 6 (13.0%) | 5 (16.1%) |
| 4.0x or more | 14 (30.4%) | 2 (6.5%) |
| Total | 46 (100.0%) | 31 (100.0%) |
Real Estate Taxes by Mortgage Status in Alpena
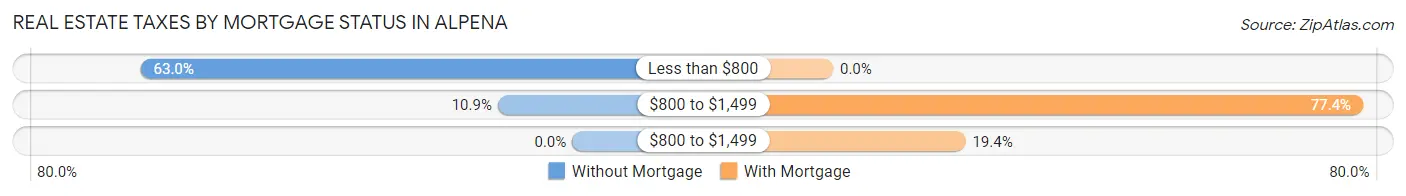
| Property Taxes | Without Mortgage | With Mortgage |
| Less than $800 | 29 (63.0%) | 0 (0.0%) |
| $800 to $1,499 | 5 (10.9%) | 24 (77.4%) |
| $800 to $1,499 | 0 (0.0%) | 6 (19.4%) |
| Total | 46 (100.0%) | 31 (100.0%) |
Health & Disability in Alpena
Health Insurance Coverage by Age in Alpena
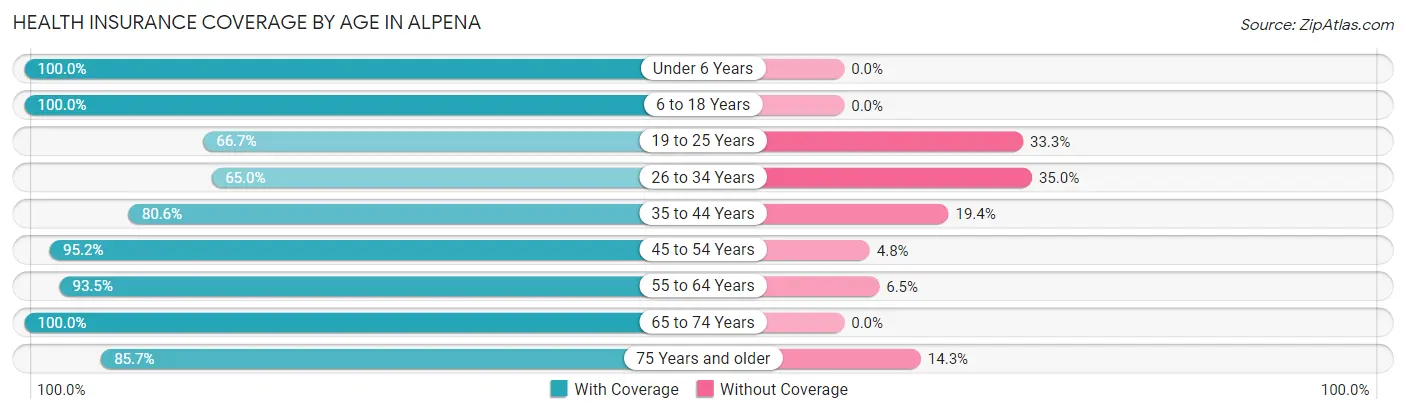
| Age Bracket | With Coverage | Without Coverage |
| Under 6 Years | 14 (100.0%) | 0 (0.0%) |
| 6 to 18 Years | 131 (100.0%) | 0 (0.0%) |
| 19 to 25 Years | 20 (66.7%) | 10 (33.3%) |
| 26 to 34 Years | 13 (65.0%) | 7 (35.0%) |
| 35 to 44 Years | 58 (80.6%) | 14 (19.4%) |
| 45 to 54 Years | 40 (95.2%) | 2 (4.8%) |
| 55 to 64 Years | 43 (93.5%) | 3 (6.5%) |
| 65 to 74 Years | 35 (100.0%) | 0 (0.0%) |
| 75 Years and older | 12 (85.7%) | 2 (14.3%) |
| Total | 366 (90.6%) | 38 (9.4%) |
Health Insurance Coverage by Citizenship Status in Alpena

| Citizenship Status | With Coverage | Without Coverage |
| Native Born | 14 (100.0%) | 0 (0.0%) |
| Foreign Born, Citizen | 131 (100.0%) | 0 (0.0%) |
| Foreign Born, not a Citizen | 20 (66.7%) | 10 (33.3%) |
Health Insurance Coverage by Household Income in Alpena

| Household Income | With Coverage | Without Coverage |
| Under $25,000 | 32 (78.0%) | 9 (22.0%) |
| $25,000 to $49,999 | 77 (87.5%) | 11 (12.5%) |
| $50,000 to $74,999 | 111 (97.4%) | 3 (2.6%) |
| $75,000 to $99,999 | 116 (88.5%) | 15 (11.5%) |
| $100,000 and over | 30 (100.0%) | 0 (0.0%) |
Public vs Private Health Insurance Coverage by Age in Alpena
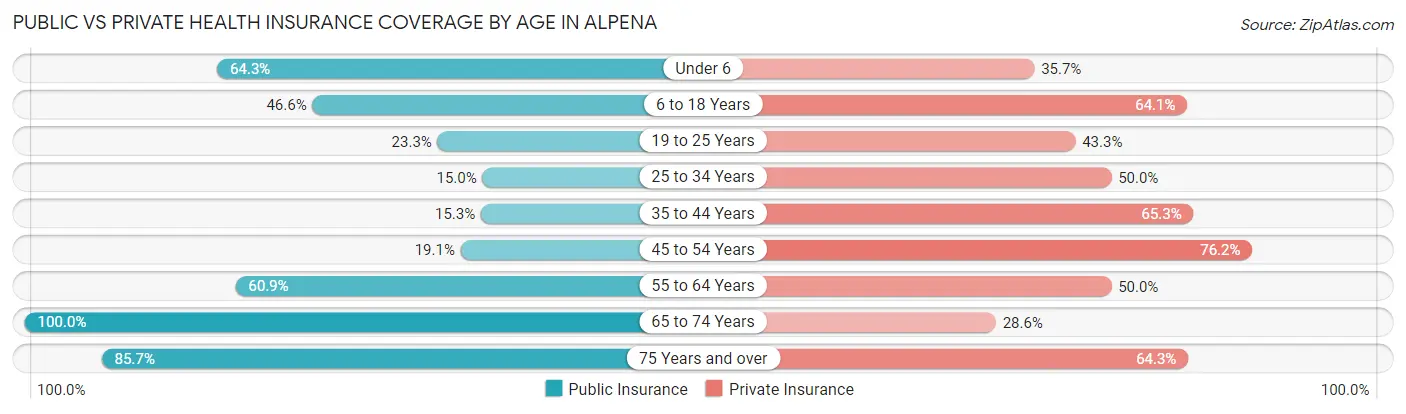
| Age Bracket | Public Insurance | Private Insurance |
| Under 6 | 9 (64.3%) | 5 (35.7%) |
| 6 to 18 Years | 61 (46.6%) | 84 (64.1%) |
| 19 to 25 Years | 7 (23.3%) | 13 (43.3%) |
| 25 to 34 Years | 3 (15.0%) | 10 (50.0%) |
| 35 to 44 Years | 11 (15.3%) | 47 (65.3%) |
| 45 to 54 Years | 8 (19.1%) | 32 (76.2%) |
| 55 to 64 Years | 28 (60.9%) | 23 (50.0%) |
| 65 to 74 Years | 35 (100.0%) | 10 (28.6%) |
| 75 Years and over | 12 (85.7%) | 9 (64.3%) |
| Total | 174 (43.1%) | 233 (57.7%) |
Disability Status by Sex by Age in Alpena
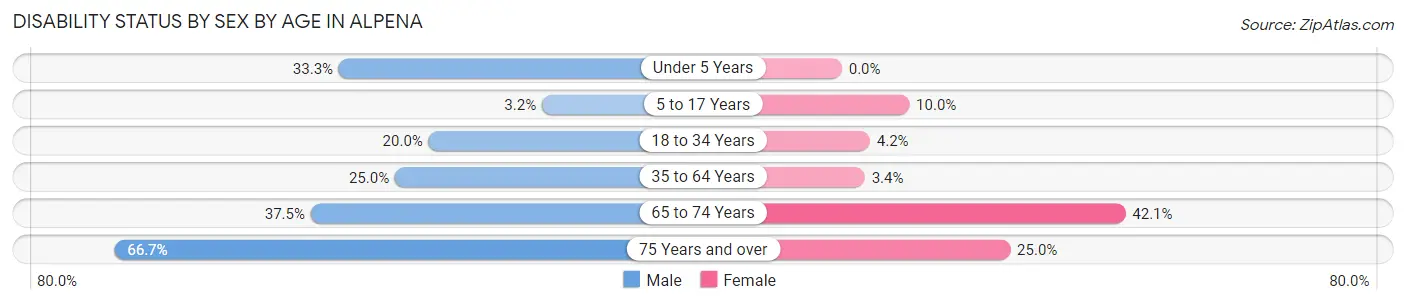
| Age Bracket | Male | Female |
| Under 5 Years | 3 (33.3%) | 0 (0.0%) |
| 5 to 17 Years | 2 (3.2%) | 6 (10.0%) |
| 18 to 34 Years | 7 (20.0%) | 1 (4.2%) |
| 35 to 64 Years | 18 (25.0%) | 3 (3.4%) |
| 65 to 74 Years | 6 (37.5%) | 8 (42.1%) |
| 75 Years and over | 4 (66.7%) | 2 (25.0%) |
Disability Class by Sex by Age in Alpena
Disability Class: Hearing Difficulty
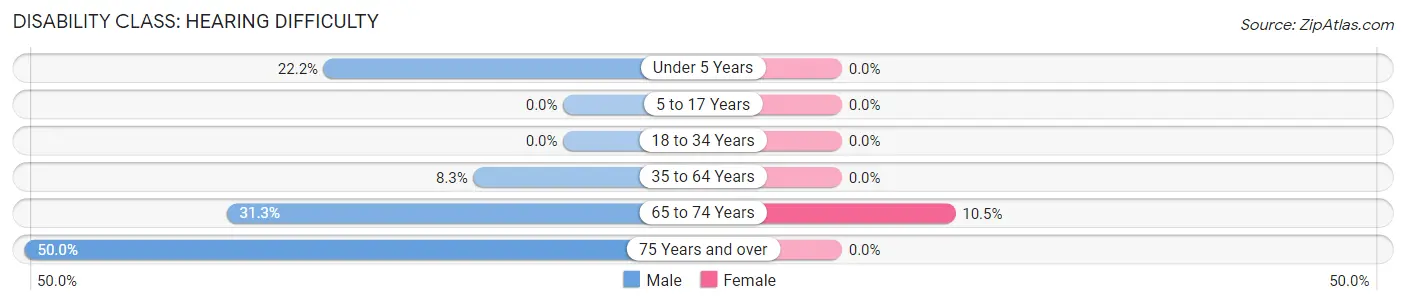
| Age Bracket | Male | Female |
| Under 5 Years | 2 (22.2%) | 0 (0.0%) |
| 5 to 17 Years | 0 (0.0%) | 0 (0.0%) |
| 18 to 34 Years | 0 (0.0%) | 0 (0.0%) |
| 35 to 64 Years | 6 (8.3%) | 0 (0.0%) |
| 65 to 74 Years | 5 (31.2%) | 2 (10.5%) |
| 75 Years and over | 3 (50.0%) | 0 (0.0%) |
Disability Class: Vision Difficulty
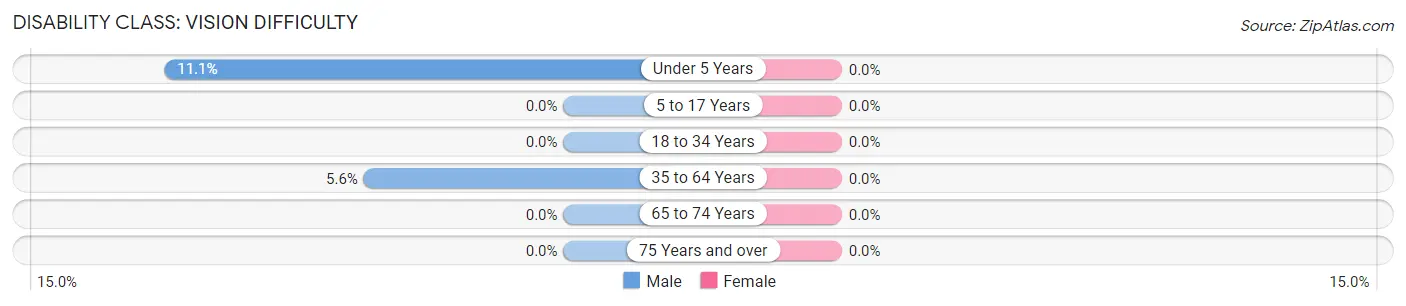
| Age Bracket | Male | Female |
| Under 5 Years | 1 (11.1%) | 0 (0.0%) |
| 5 to 17 Years | 0 (0.0%) | 0 (0.0%) |
| 18 to 34 Years | 0 (0.0%) | 0 (0.0%) |
| 35 to 64 Years | 4 (5.6%) | 0 (0.0%) |
| 65 to 74 Years | 0 (0.0%) | 0 (0.0%) |
| 75 Years and over | 0 (0.0%) | 0 (0.0%) |
Disability Class: Cognitive Difficulty
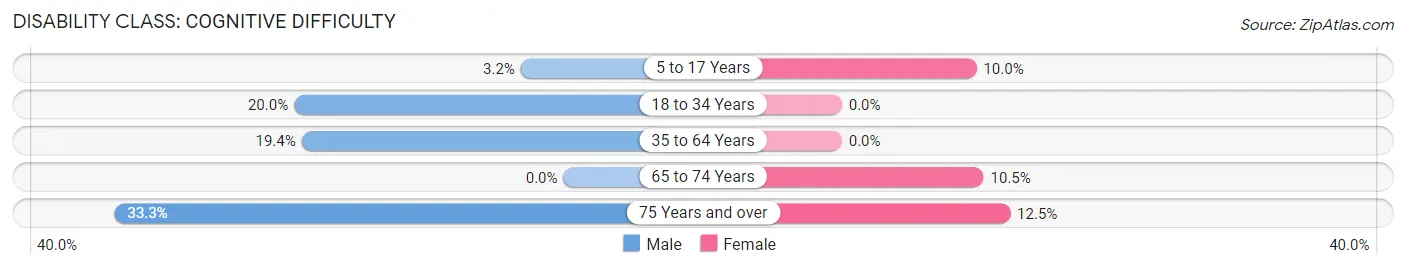
| Age Bracket | Male | Female |
| 5 to 17 Years | 2 (3.2%) | 6 (10.0%) |
| 18 to 34 Years | 7 (20.0%) | 0 (0.0%) |
| 35 to 64 Years | 14 (19.4%) | 0 (0.0%) |
| 65 to 74 Years | 0 (0.0%) | 2 (10.5%) |
| 75 Years and over | 2 (33.3%) | 1 (12.5%) |
Disability Class: Ambulatory Difficulty
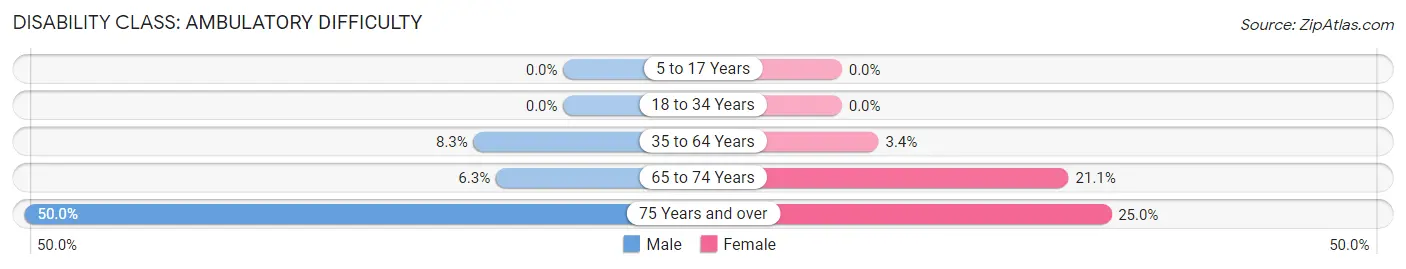
| Age Bracket | Male | Female |
| 5 to 17 Years | 0 (0.0%) | 0 (0.0%) |
| 18 to 34 Years | 0 (0.0%) | 0 (0.0%) |
| 35 to 64 Years | 6 (8.3%) | 3 (3.4%) |
| 65 to 74 Years | 1 (6.2%) | 4 (21.0%) |
| 75 Years and over | 3 (50.0%) | 2 (25.0%) |
Disability Class: Self-Care Difficulty

| Age Bracket | Male | Female |
| 5 to 17 Years | 0 (0.0%) | 0 (0.0%) |
| 18 to 34 Years | 0 (0.0%) | 0 (0.0%) |
| 35 to 64 Years | 4 (5.6%) | 0 (0.0%) |
| 65 to 74 Years | 1 (6.2%) | 1 (5.3%) |
| 75 Years and over | 0 (0.0%) | 1 (12.5%) |
Technology Access in Alpena
Computing Device Access in Alpena
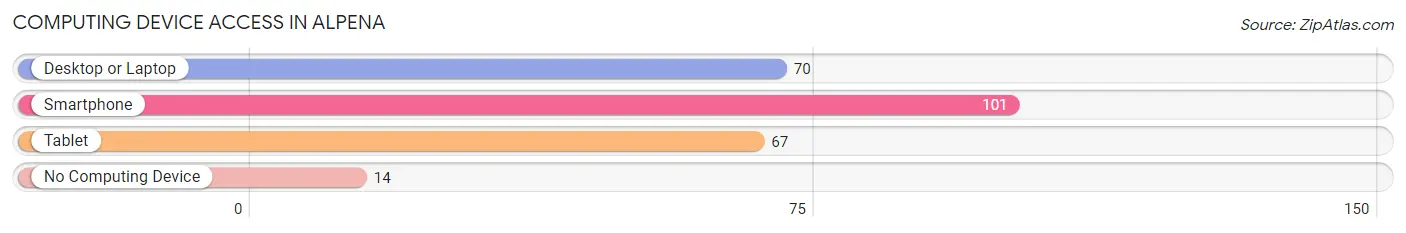
| Device Type | # Households | % Households |
| Desktop or Laptop | 70 | 56.5% |
| Smartphone | 101 | 81.5% |
| Tablet | 67 | 54.0% |
| No Computing Device | 14 | 11.3% |
| Total | 124 | 100.0% |
Internet Access in Alpena
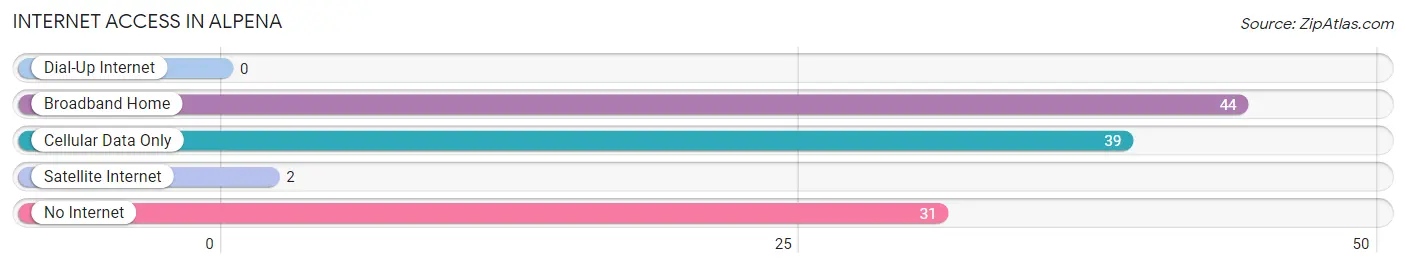
| Internet Type | # Households | % Households |
| Dial-Up Internet | 0 | 0.0% |
| Broadband Home | 44 | 35.5% |
| Cellular Data Only | 39 | 31.5% |
| Satellite Internet | 2 | 1.6% |
| No Internet | 31 | 25.0% |
| Total | 124 | 100.0% |
Alpena Summary
Alpena, Arkansas is a small town located in the Ozark Mountains of Northwest Arkansas. It is situated in the foothills of the Ozarks, and is surrounded by the White River, the Buffalo National River, and the Ozark National Forest. The town has a population of approximately 1,000 people, and is the county seat of Boone County.
History
Alpena was founded in 1883 by a group of settlers from the nearby town of Harrison. The town was named after the Alpena, a German-speaking people who lived in the area. The settlers were attracted to the area due to its abundance of natural resources, including timber, minerals, and water. The town quickly grew, and by the early 1900s, it had become a thriving community.
In the early 1900s, Alpena was a major center for the timber industry. The town was home to several sawmills, and the timber industry provided employment for many of the town’s residents. The timber industry also provided the town with a steady source of income.
In the late 1940s, Alpena began to experience a decline in the timber industry. This led to a decrease in the town’s population, and by the 1970s, the town had become a virtual ghost town. However, in the 1980s, the town began to experience a resurgence. The town was revitalized by the opening of the Buffalo National River, which brought in tourists and new businesses.
Geography
Alpena is located in the Ozark Mountains of Northwest Arkansas. The town is situated in the foothills of the Ozarks, and is surrounded by the White River, the Buffalo National River, and the Ozark National Forest. The town is located approximately 30 miles from the Arkansas-Missouri border.
The town is located at an elevation of 1,000 feet above sea level. The climate in Alpena is mild, with temperatures ranging from the low 30s in the winter to the mid-80s in the summer. The town receives an average of 45 inches of precipitation per year.
Economy
Alpena’s economy is largely based on tourism. The town is home to several tourist attractions, including the Buffalo National River, the Ozark National Forest, and the White River. The town also has several restaurants, shops, and lodging facilities.
In addition to tourism, Alpena’s economy is also supported by the timber industry. The town is home to several sawmills, and the timber industry provides employment for many of the town’s residents.
Demographics
As of the 2010 census, Alpena had a population of 1,000 people. The town is predominantly white, with approximately 95% of the population being white. The town also has a small Hispanic population, with approximately 4% of the population being Hispanic. The median household income in Alpena is $35,000, and the median home value is $90,000.
Common Questions
What is Per Capita Income in Alpena?
Per Capita income in Alpena is $18,119.
What is the Median Family Income in Alpena?
Median Family Income in Alpena is $70,481.
What is the Median Household income in Alpena?
Median Household Income in Alpena is $48,500.
What is Income or Wage Gap in Alpena?
Income or Wage Gap in Alpena is 20.9%.
Women in Alpena earn 79.1 cents for every dollar earned by a man.
What is Inequality or Gini Index in Alpena?
Inequality or Gini Index in Alpena is 0.32.
What is the Total Population of Alpena?
Total Population of Alpena is 404.
What is the Total Male Population of Alpena?
Total Male Population of Alpena is 201.
What is the Total Female Population of Alpena?
Total Female Population of Alpena is 203.
What is the Ratio of Males per 100 Females in Alpena?
There are 99.01 Males per 100 Females in Alpena.
What is the Ratio of Females per 100 Males in Alpena?
There are 101.00 Females per 100 Males in Alpena.
What is the Median Population Age in Alpena?
Median Population Age in Alpena is 35.6 Years.
What is the Average Family Size in Alpena
Average Family Size in Alpena is 4.1 People.
What is the Average Household Size in Alpena
Average Household Size in Alpena is 3.3 People.
How Large is the Labor Force in Alpena?
There are 183 People in the Labor Forcein in Alpena.
What is the Percentage of People in the Labor Force in Alpena?
58.8% of People are in the Labor Force in Alpena.
What is the Unemployment Rate in Alpena?
Unemployment Rate in Alpena is 1.1%.