St Charles, AR Map & Demographics
St Charles Map
St Charles Overview
$23,987
PER CAPITA INCOME
$62,396
AVG FAMILY INCOME
$61,250
AVG HOUSEHOLD INCOME
32.2%
WAGE / INCOME GAP [ % ]
67.8¢/ $1
WAGE / INCOME GAP [ $ ]
0.39
INEQUALITY / GINI INDEX
270
TOTAL POPULATION
164
MALE POPULATION
106
FEMALE POPULATION
154.72
MALES / 100 FEMALES
64.63
FEMALES / 100 MALES
36.5
MEDIAN AGE
4.2
AVG FAMILY SIZE
3.3
AVG HOUSEHOLD SIZE
84
LABOR FORCE [ PEOPLE ]
50.0%
PERCENT IN LABOR FORCE
7.1%
UNEMPLOYMENT RATE
Income in St Charles
Income Overview in St Charles
Per Capita Income in St Charles is $23,987, while median incomes of families and households are $62,396 and $61,250 respectively.
| Characteristic | Number | Measure |
| Per Capita Income | 270 | $23,987 |
| Median Family Income | 57 | $62,396 |
| Mean Family Income | 57 | $88,091 |
| Median Household Income | 82 | $61,250 |
| Mean Household Income | 82 | $74,077 |
| Income Deficit | 57 | $0 |
| Wage / Income Gap (%) | 270 | 32.19% |
| Wage / Income Gap ($) | 270 | 67.81¢ per $1 |
| Gini / Inequality Index | 270 | 0.39 |
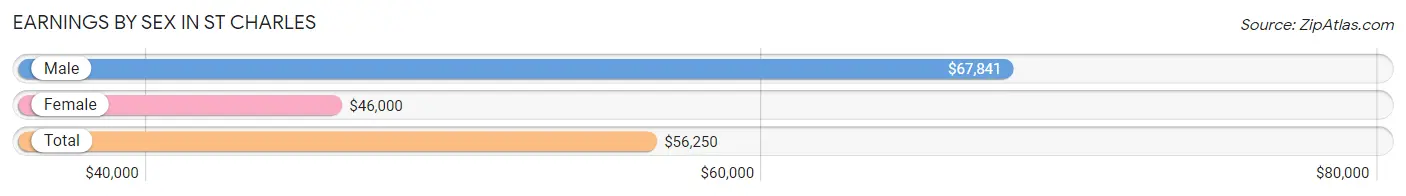
Earnings by Sex in St Charles
Average Earnings in St Charles are $56,250, $67,841 for men and $46,000 for women, a difference of 32.2%.
| Sex | Number | Average Earnings |
| Male | 49 (60.5%) | $67,841 |
| Female | 32 (39.5%) | $46,000 |
| Total | 81 (100.0%) | $56,250 |
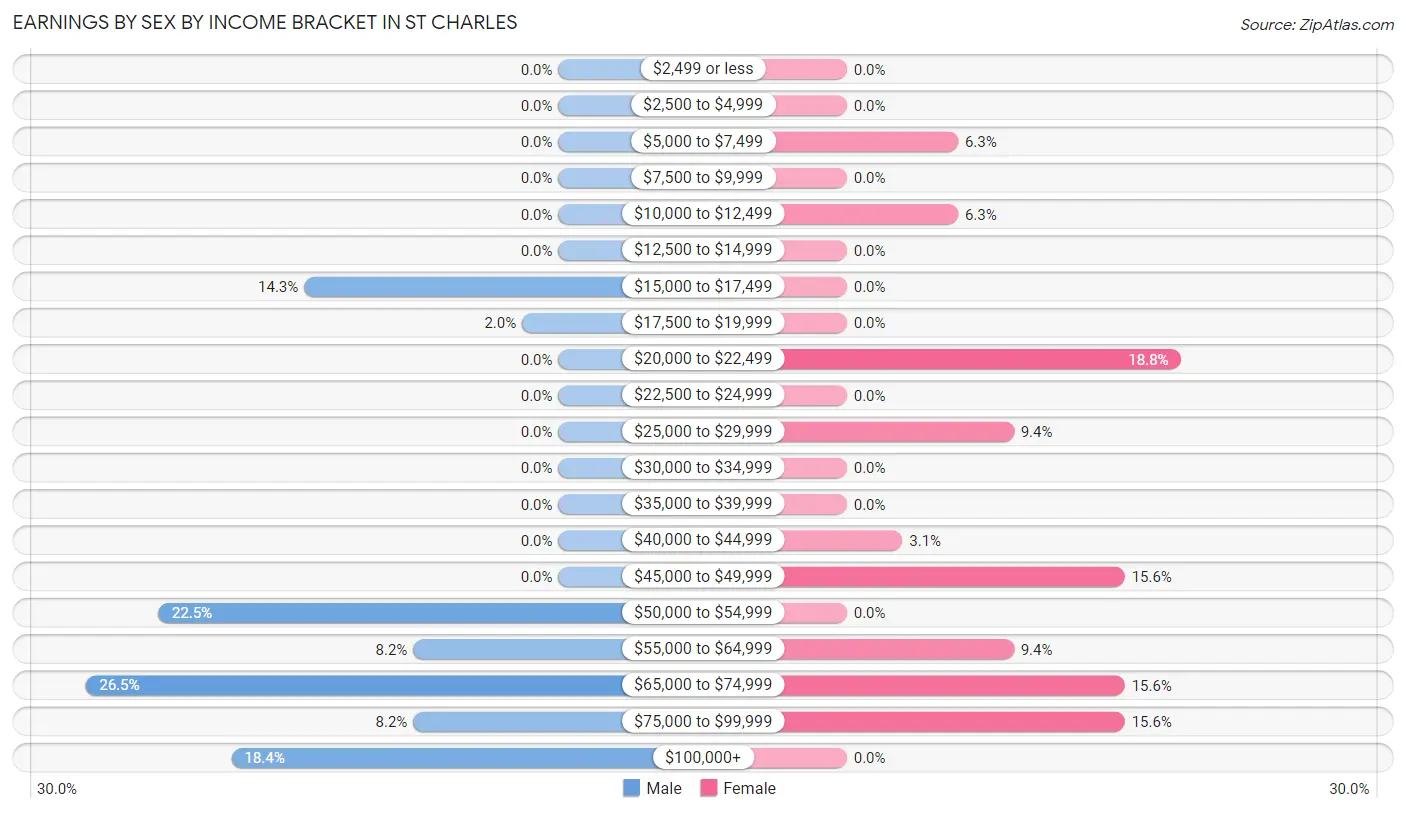
Earnings by Sex by Income Bracket in St Charles
The most common earnings brackets in St Charles are $65,000 to $74,999 for men (13 | 26.5%) and $20,000 to $22,499 for women (6 | 18.8%).
| Income | Male | Female |
| $2,499 or less | 0 (0.0%) | 0 (0.0%) |
| $2,500 to $4,999 | 0 (0.0%) | 0 (0.0%) |
| $5,000 to $7,499 | 0 (0.0%) | 2 (6.2%) |
| $7,500 to $9,999 | 0 (0.0%) | 0 (0.0%) |
| $10,000 to $12,499 | 0 (0.0%) | 2 (6.2%) |
| $12,500 to $14,999 | 0 (0.0%) | 0 (0.0%) |
| $15,000 to $17,499 | 7 (14.3%) | 0 (0.0%) |
| $17,500 to $19,999 | 1 (2.0%) | 0 (0.0%) |
| $20,000 to $22,499 | 0 (0.0%) | 6 (18.8%) |
| $22,500 to $24,999 | 0 (0.0%) | 0 (0.0%) |
| $25,000 to $29,999 | 0 (0.0%) | 3 (9.4%) |
| $30,000 to $34,999 | 0 (0.0%) | 0 (0.0%) |
| $35,000 to $39,999 | 0 (0.0%) | 0 (0.0%) |
| $40,000 to $44,999 | 0 (0.0%) | 1 (3.1%) |
| $45,000 to $49,999 | 0 (0.0%) | 5 (15.6%) |
| $50,000 to $54,999 | 11 (22.5%) | 0 (0.0%) |
| $55,000 to $64,999 | 4 (8.2%) | 3 (9.4%) |
| $65,000 to $74,999 | 13 (26.5%) | 5 (15.6%) |
| $75,000 to $99,999 | 4 (8.2%) | 5 (15.6%) |
| $100,000+ | 9 (18.4%) | 0 (0.0%) |
| Total | 49 (100.0%) | 32 (100.0%) |
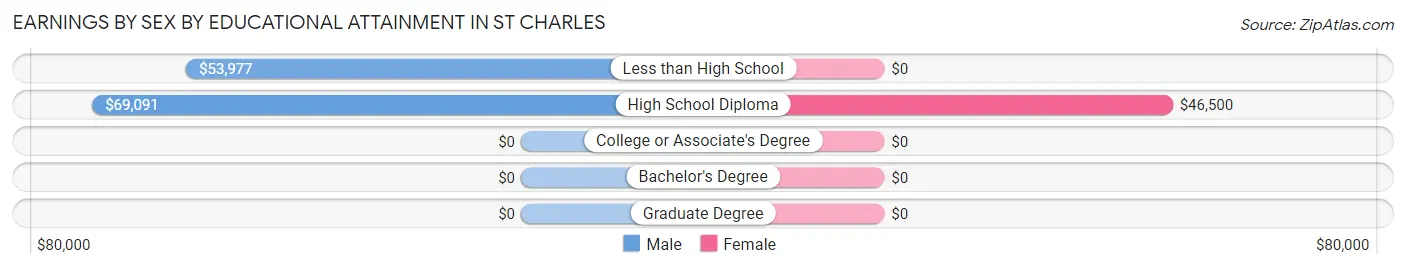
Earnings by Sex by Educational Attainment in St Charles
Average earnings in St Charles are $67,841 for men and $46,000 for women, a difference of 32.2%. Men with an educational attainment of high school diploma enjoy the highest average annual earnings of $69,091, while those with less than high school education earn the least with $53,977. Women with an educational attainment of high school diploma earn the most with the average annual earnings of $46,500, while those with high school diploma education have the smallest earnings of $46,500.
| Educational Attainment | Male Income | Female Income |
| Less than High School | $53,977 | $0 |
| High School Diploma | $69,091 | $46,500 |
| College or Associate's Degree | - | - |
| Bachelor's Degree | - | - |
| Graduate Degree | - | - |
| Total | $67,841 | $46,000 |
Family Income in St Charles
Family Income Brackets in St Charles
According to the St Charles family income data, there are 23 families falling into the $50,000 to $74,999 income range, which is the most common income bracket and makes up 40.4% of all families.
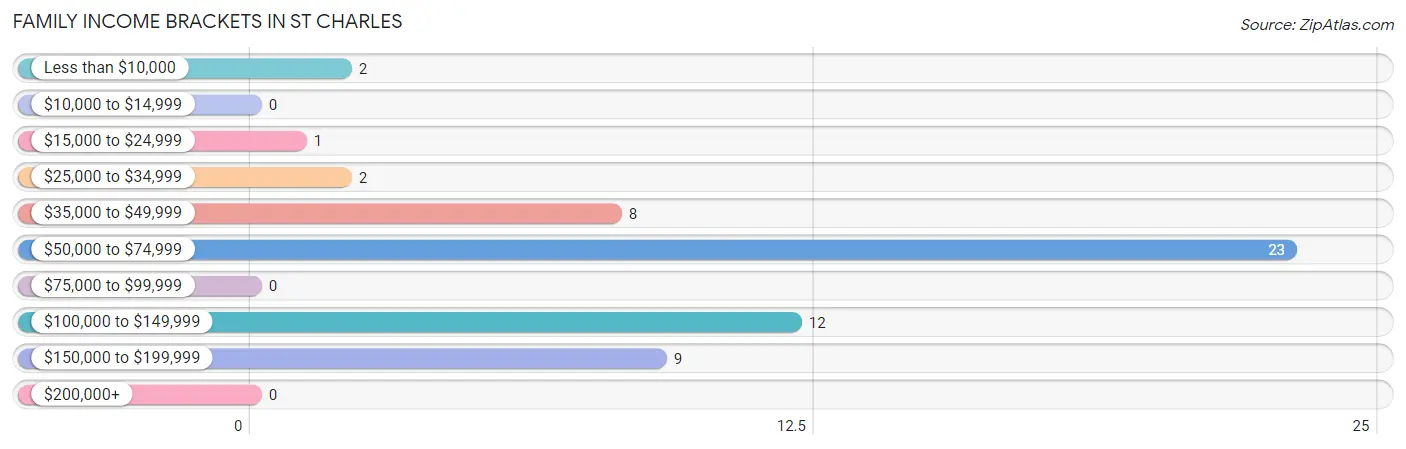
| Income Bracket | # Families | % Families |
| Less than $10,000 | 2 | 3.5% |
| $10,000 to $14,999 | 0 | 0.0% |
| $15,000 to $24,999 | 1 | 1.8% |
| $25,000 to $34,999 | 2 | 3.5% |
| $35,000 to $49,999 | 8 | 14.0% |
| $50,000 to $74,999 | 23 | 40.4% |
| $75,000 to $99,999 | 0 | 0.0% |
| $100,000 to $149,999 | 12 | 21.1% |
| $150,000 to $199,999 | 9 | 15.8% |
| $200,000+ | 0 | 0.0% |
Family Income by Famaliy Size in St Charles
3-person families (11 | 19.3%) account for the highest median family income in St Charles with $174,583 per family, while 3-person families (11 | 19.3%) have the highest median income of $58,194 per family member.
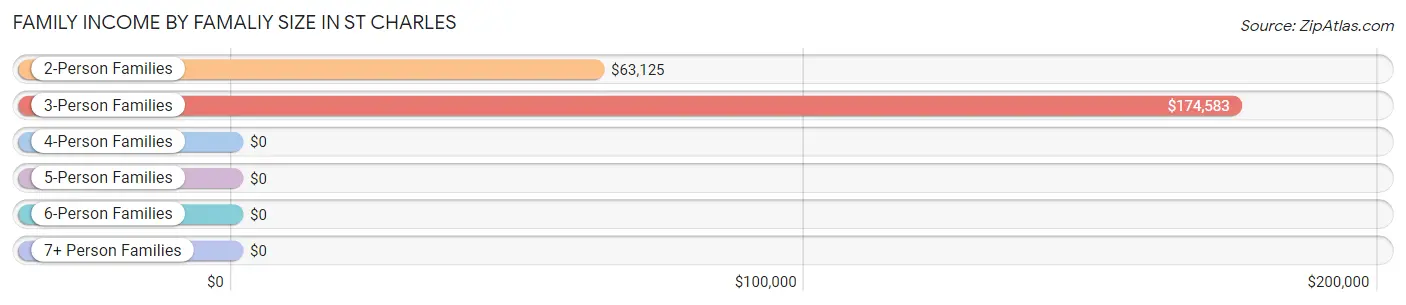
| Income Bracket | # Families | Median Income |
| 2-Person Families | 19 (33.3%) | $63,125 |
| 3-Person Families | 11 (19.3%) | $174,583 |
| 4-Person Families | 10 (17.5%) | $0 |
| 5-Person Families | 16 (28.1%) | $0 |
| 6-Person Families | 1 (1.8%) | $0 |
| 7+ Person Families | 0 (0.0%) | $0 |
| Total | 57 (100.0%) | $62,396 |
Family Income by Number of Earners in St Charles
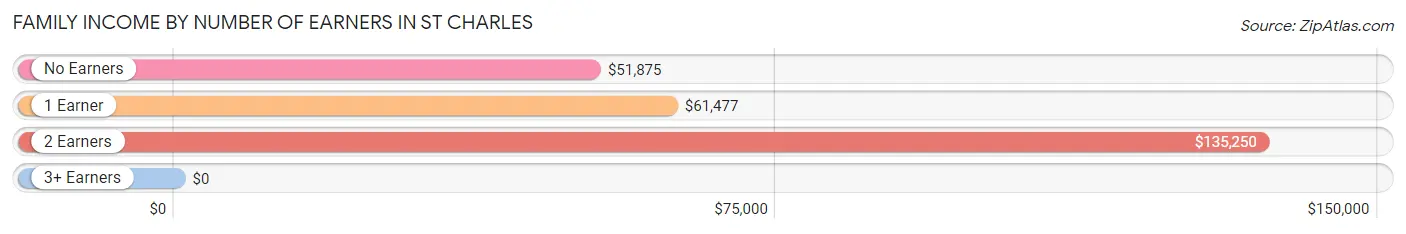
| Number of Earners | # Families | Median Income |
| No Earners | 15 (26.3%) | $51,875 |
| 1 Earner | 19 (33.3%) | $61,477 |
| 2 Earners | 23 (40.4%) | $135,250 |
| 3+ Earners | 0 (0.0%) | $0 |
| Total | 57 (100.0%) | $62,396 |
Household Income in St Charles
Household Income Brackets in St Charles
With 26 households falling in the category, the $50,000 to $74,999 income range is the most frequent in St Charles, accounting for 31.7% of all households.
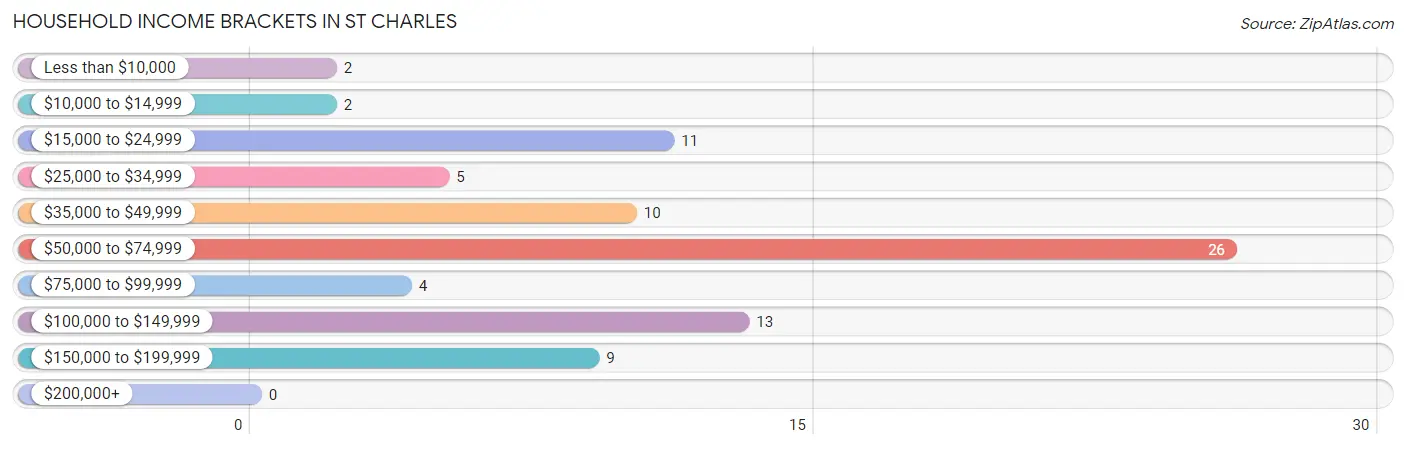
| Income Bracket | # Households | % Households |
| Less than $10,000 | 2 | 2.4% |
| $10,000 to $14,999 | 2 | 2.4% |
| $15,000 to $24,999 | 11 | 13.4% |
| $25,000 to $34,999 | 5 | 6.1% |
| $35,000 to $49,999 | 10 | 12.2% |
| $50,000 to $74,999 | 26 | 31.7% |
| $75,000 to $99,999 | 4 | 4.9% |
| $100,000 to $149,999 | 13 | 15.9% |
| $150,000 to $199,999 | 9 | 11.0% |
| $200,000+ | 0 | 0.0% |
Household Income by Householder Age in St Charles
The median household income in St Charles is $61,250, with the highest median household income of $66,250 found in the 45 to 64 years age bracket for the primary householder. A total of 39 households (47.6%) fall into this category.
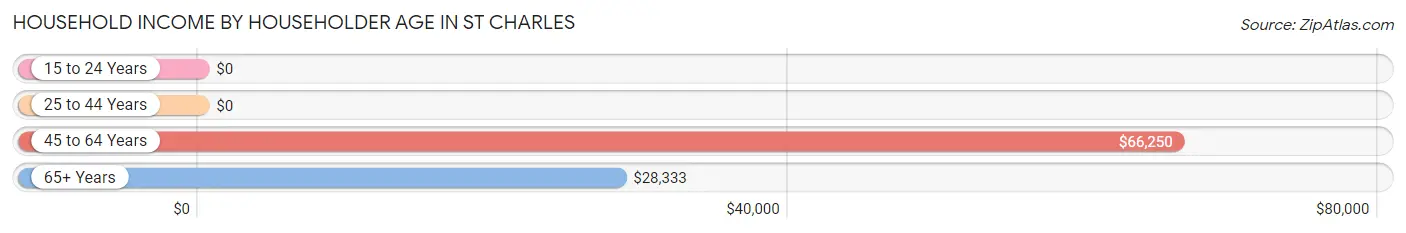
| Income Bracket | # Households | Median Income |
| 15 to 24 Years | 0 (0.0%) | $0 |
| 25 to 44 Years | 11 (13.4%) | $0 |
| 45 to 64 Years | 39 (47.6%) | $66,250 |
| 65+ Years | 32 (39.0%) | $28,333 |
| Total | 82 (100.0%) | $61,250 |
Poverty in St Charles
Income Below Poverty by Sex and Age in St Charles
With 10.4% poverty level for males and 14.1% for females among the residents of St Charles, 25 to 34 year old males and under 5 year old females are the most vulnerable to poverty, with 3 males (33.3%) and 3 females (50.0%) in their respective age groups living below the poverty level.
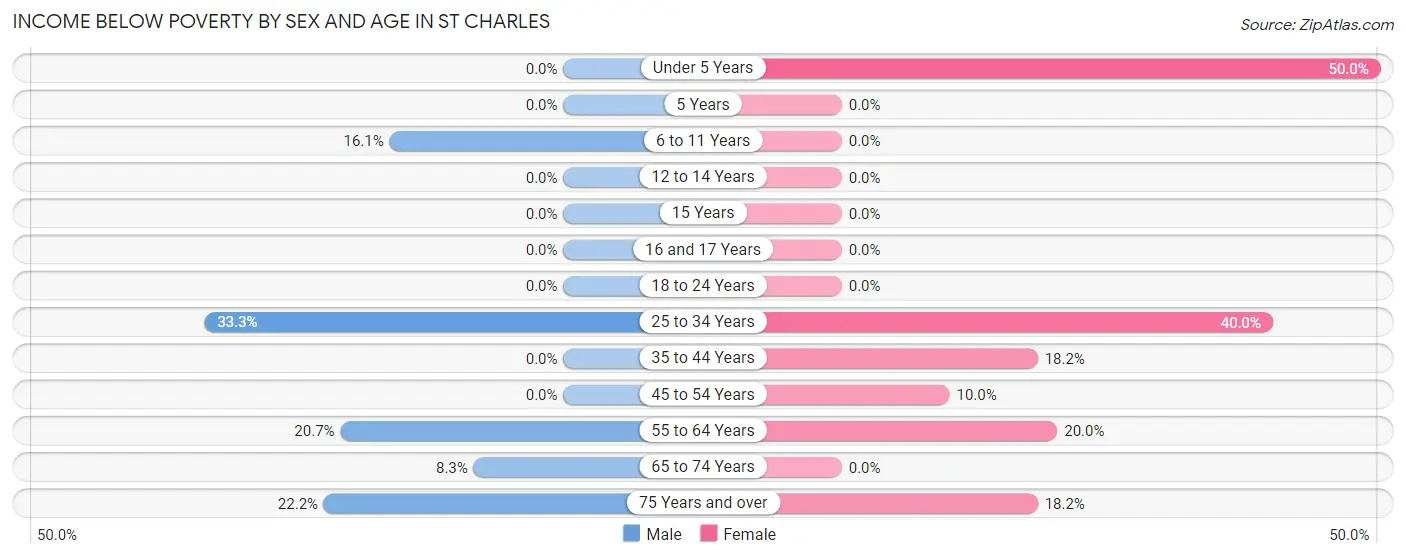
| Age Bracket | Male | Female |
| Under 5 Years | 0 (0.0%) | 3 (50.0%) |
| 5 Years | 0 (0.0%) | 0 (0.0%) |
| 6 to 11 Years | 5 (16.1%) | 0 (0.0%) |
| 12 to 14 Years | 0 (0.0%) | 0 (0.0%) |
| 15 Years | 0 (0.0%) | 0 (0.0%) |
| 16 and 17 Years | 0 (0.0%) | 0 (0.0%) |
| 18 to 24 Years | 0 (0.0%) | 0 (0.0%) |
| 25 to 34 Years | 3 (33.3%) | 4 (40.0%) |
| 35 to 44 Years | 0 (0.0%) | 2 (18.2%) |
| 45 to 54 Years | 0 (0.0%) | 2 (10.0%) |
| 55 to 64 Years | 6 (20.7%) | 2 (20.0%) |
| 65 to 74 Years | 1 (8.3%) | 0 (0.0%) |
| 75 Years and over | 2 (22.2%) | 2 (18.2%) |
| Total | 17 (10.4%) | 15 (14.1%) |
Income Above Poverty by Sex and Age in St Charles
According to the poverty statistics in St Charles, males aged under 5 years and females aged 6 to 11 years are the age groups that are most secure financially, with 100.0% of males and 100.0% of females in these age groups living above the poverty line.
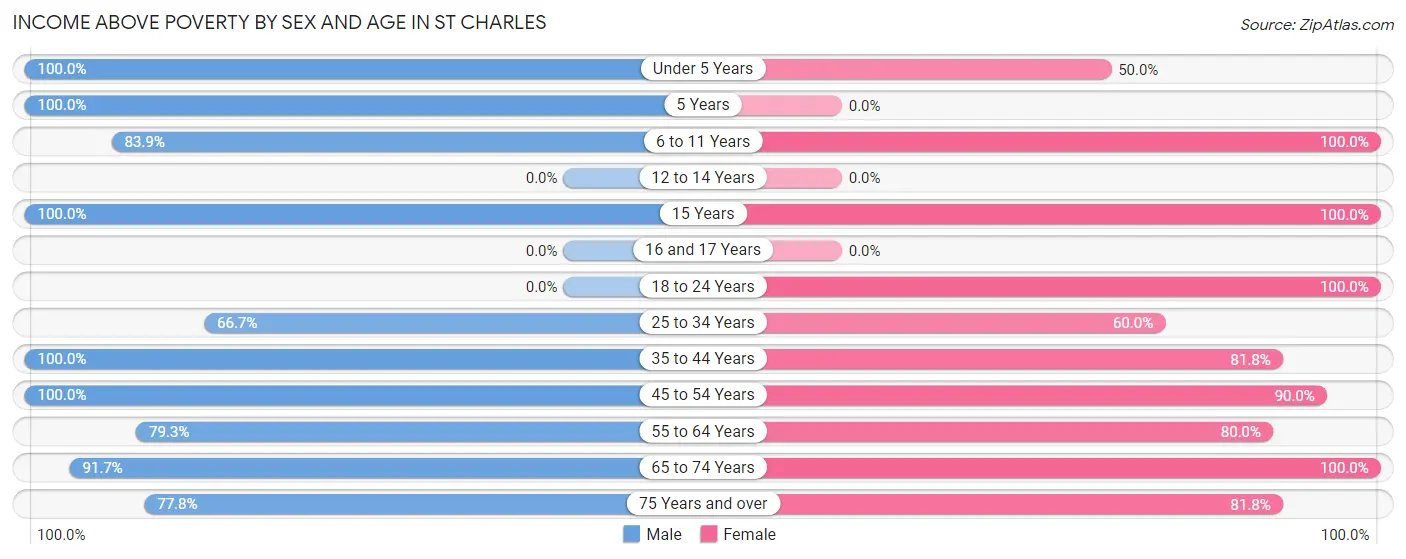
| Age Bracket | Male | Female |
| Under 5 Years | 6 (100.0%) | 3 (50.0%) |
| 5 Years | 9 (100.0%) | 0 (0.0%) |
| 6 to 11 Years | 26 (83.9%) | 12 (100.0%) |
| 12 to 14 Years | 0 (0.0%) | 0 (0.0%) |
| 15 Years | 33 (100.0%) | 5 (100.0%) |
| 16 and 17 Years | 0 (0.0%) | 0 (0.0%) |
| 18 to 24 Years | 0 (0.0%) | 12 (100.0%) |
| 25 to 34 Years | 6 (66.7%) | 6 (60.0%) |
| 35 to 44 Years | 6 (100.0%) | 9 (81.8%) |
| 45 to 54 Years | 20 (100.0%) | 18 (90.0%) |
| 55 to 64 Years | 23 (79.3%) | 8 (80.0%) |
| 65 to 74 Years | 11 (91.7%) | 9 (100.0%) |
| 75 Years and over | 7 (77.8%) | 9 (81.8%) |
| Total | 147 (89.6%) | 91 (85.9%) |
Income Below Poverty Among Married-Couple Families in St Charles
The poverty statistics for married-couple families in St Charles show that 2.5% or 1 of the total 40 families live below the poverty line. Families with 3 or 4 children have the highest poverty rate of 100.0%, comprising of 1 families. On the other hand, families with no children have the lowest poverty rate of 0.0%, which includes 0 families.
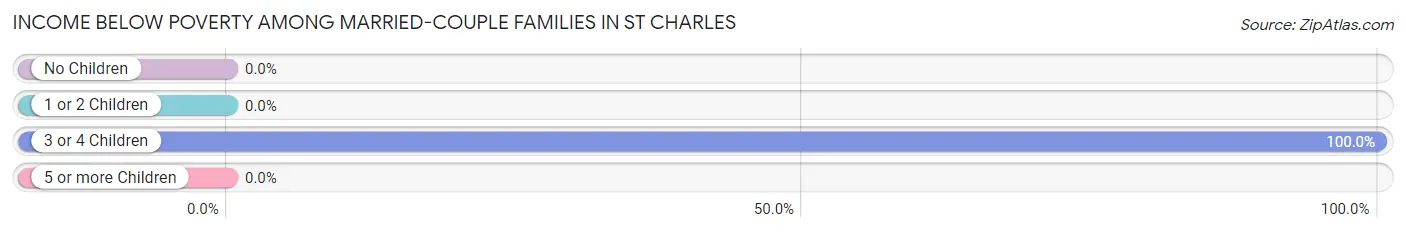
| Children | Above Poverty | Below Poverty |
| No Children | 18 (100.0%) | 0 (0.0%) |
| 1 or 2 Children | 21 (100.0%) | 0 (0.0%) |
| 3 or 4 Children | 0 (0.0%) | 1 (100.0%) |
| 5 or more Children | 0 (0.0%) | 0 (0.0%) |
| Total | 39 (97.5%) | 1 (2.5%) |
Income Below Poverty Among Single-Parent Households in St Charles
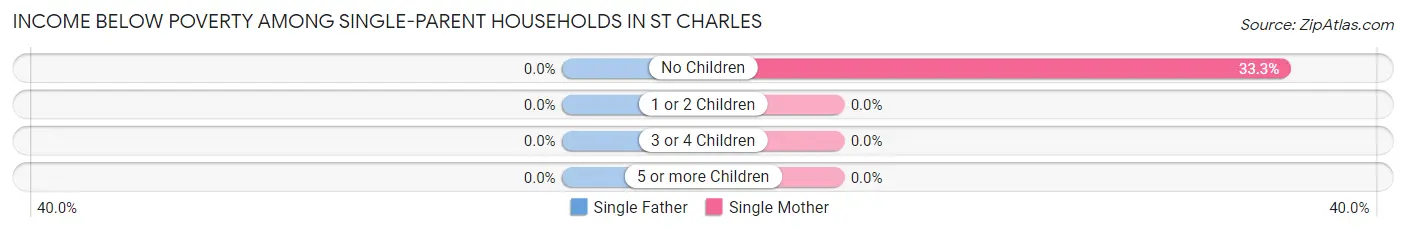
| Children | Single Father | Single Mother |
| No Children | 0 (0.0%) | 2 (33.3%) |
| 1 or 2 Children | 0 (0.0%) | 0 (0.0%) |
| 3 or 4 Children | 0 (0.0%) | 0 (0.0%) |
| 5 or more Children | 0 (0.0%) | 0 (0.0%) |
| Total | 0 (0.0%) | 2 (33.3%) |
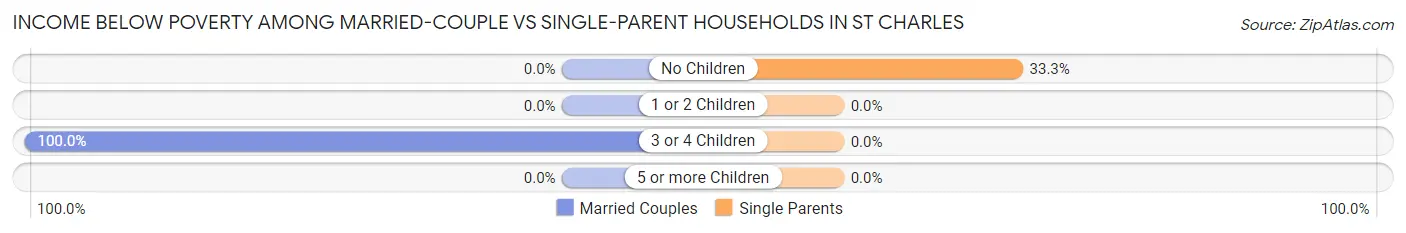
Income Below Poverty Among Married-Couple vs Single-Parent Households in St Charles
The poverty data for St Charles shows that 1 of the married-couple family households (2.5%) and 2 of the single-parent households (11.8%) are living below the poverty level. Within the married-couple family households, those with 3 or 4 children have the highest poverty rate, with 1 households (100.0%) falling below the poverty line. Among the single-parent households, those with no children have the highest poverty rate, with 2 household (33.3%) living below poverty.
| Children | Married-Couple Families | Single-Parent Households |
| No Children | 0 (0.0%) | 2 (33.3%) |
| 1 or 2 Children | 0 (0.0%) | 0 (0.0%) |
| 3 or 4 Children | 1 (100.0%) | 0 (0.0%) |
| 5 or more Children | 0 (0.0%) | 0 (0.0%) |
| Total | 1 (2.5%) | 2 (11.8%) |
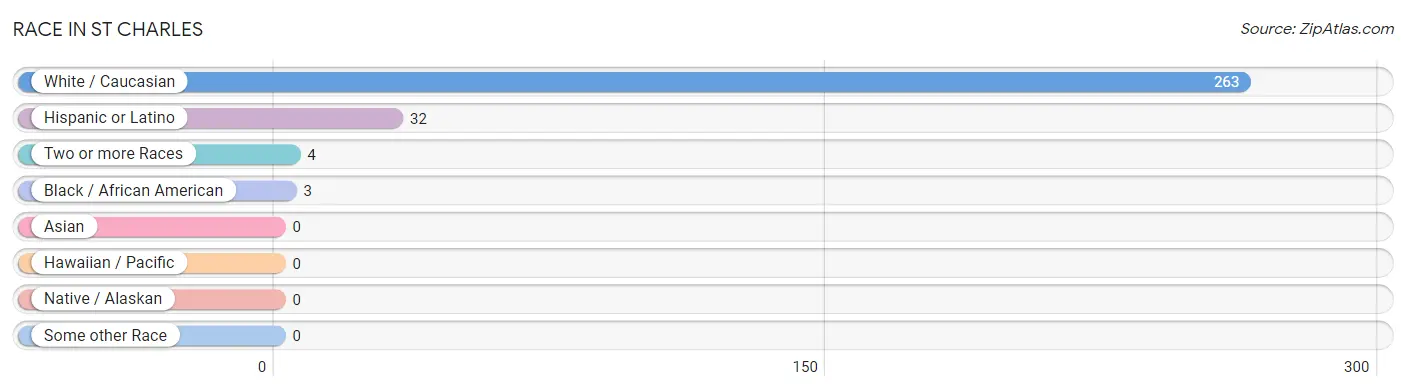
Race in St Charles
The most populous races in St Charles are White / Caucasian (263 | 97.4%), Hispanic or Latino (32 | 11.8%), and Two or more Races (4 | 1.5%).
| Race | # Population | % Population |
| Asian | 0 | 0.0% |
| Black / African American | 3 | 1.1% |
| Hawaiian / Pacific | 0 | 0.0% |
| Hispanic or Latino | 32 | 11.8% |
| Native / Alaskan | 0 | 0.0% |
| White / Caucasian | 263 | 97.4% |
| Two or more Races | 4 | 1.5% |
| Some other Race | 0 | 0.0% |
| Total | 270 | 100.0% |
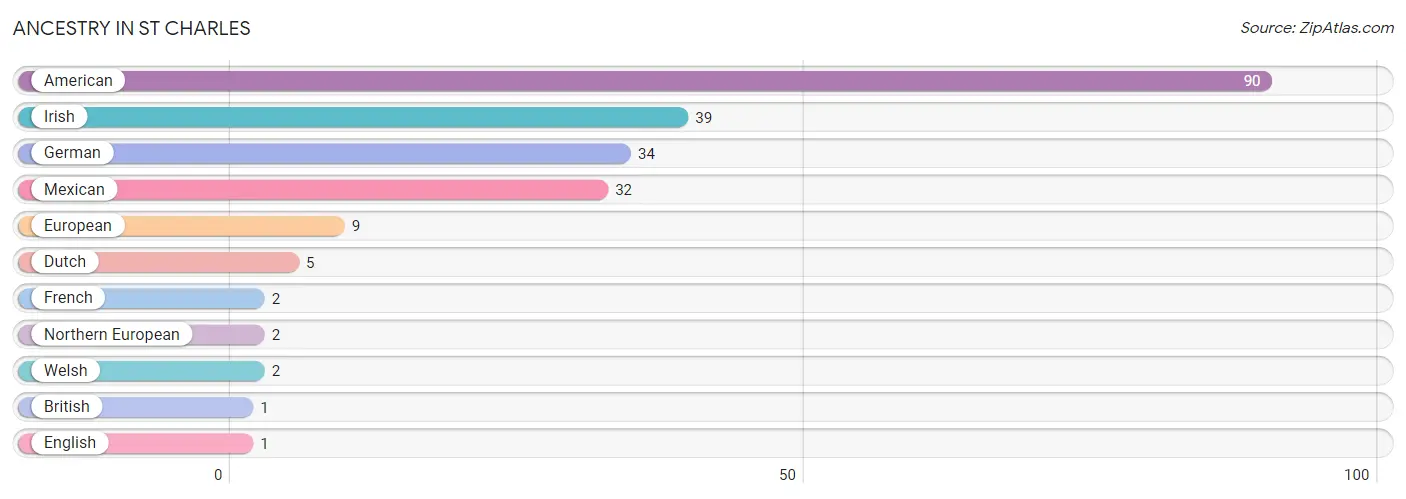
Ancestry in St Charles
The most populous ancestries reported in St Charles are American (90 | 33.3%), Irish (39 | 14.4%), German (34 | 12.6%), Mexican (32 | 11.8%), and European (9 | 3.3%), together accounting for 75.5% of all St Charles residents.
| Ancestry | # Population | % Population |
| American | 90 | 33.3% |
| British | 1 | 0.4% |
| Dutch | 5 | 1.8% |
| English | 1 | 0.4% |
| European | 9 | 3.3% |
| French | 2 | 0.7% |
| German | 34 | 12.6% |
| Irish | 39 | 14.4% |
| Mexican | 32 | 11.8% |
| Northern European | 2 | 0.7% |
| Welsh | 2 | 0.7% | View All 11 Rows |
Immigrants in St Charles

| Immigration Origin | # Population | % Population | View All 0 Rows |
Sex and Age in St Charles
Sex and Age in St Charles
The most populous age groups in St Charles are 5 to 9 Years (34 | 20.7%) for men and 45 to 49 Years (20 | 18.9%) for women.
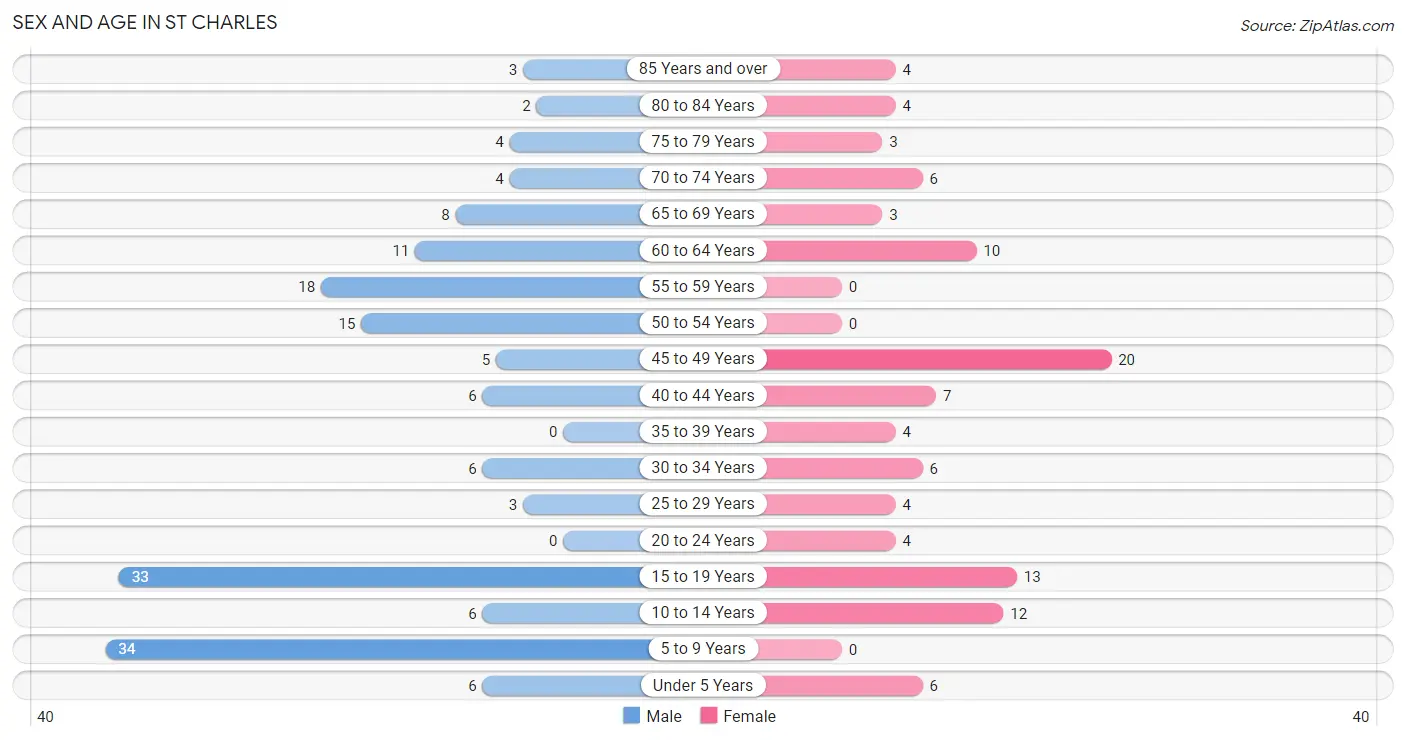
| Age Bracket | Male | Female |
| Under 5 Years | 6 (3.7%) | 6 (5.7%) |
| 5 to 9 Years | 34 (20.7%) | 0 (0.0%) |
| 10 to 14 Years | 6 (3.7%) | 12 (11.3%) |
| 15 to 19 Years | 33 (20.1%) | 13 (12.3%) |
| 20 to 24 Years | 0 (0.0%) | 4 (3.8%) |
| 25 to 29 Years | 3 (1.8%) | 4 (3.8%) |
| 30 to 34 Years | 6 (3.7%) | 6 (5.7%) |
| 35 to 39 Years | 0 (0.0%) | 4 (3.8%) |
| 40 to 44 Years | 6 (3.7%) | 7 (6.6%) |
| 45 to 49 Years | 5 (3.0%) | 20 (18.9%) |
| 50 to 54 Years | 15 (9.1%) | 0 (0.0%) |
| 55 to 59 Years | 18 (11.0%) | 0 (0.0%) |
| 60 to 64 Years | 11 (6.7%) | 10 (9.4%) |
| 65 to 69 Years | 8 (4.9%) | 3 (2.8%) |
| 70 to 74 Years | 4 (2.4%) | 6 (5.7%) |
| 75 to 79 Years | 4 (2.4%) | 3 (2.8%) |
| 80 to 84 Years | 2 (1.2%) | 4 (3.8%) |
| 85 Years and over | 3 (1.8%) | 4 (3.8%) |
| Total | 164 (100.0%) | 106 (100.0%) |
Families and Households in St Charles
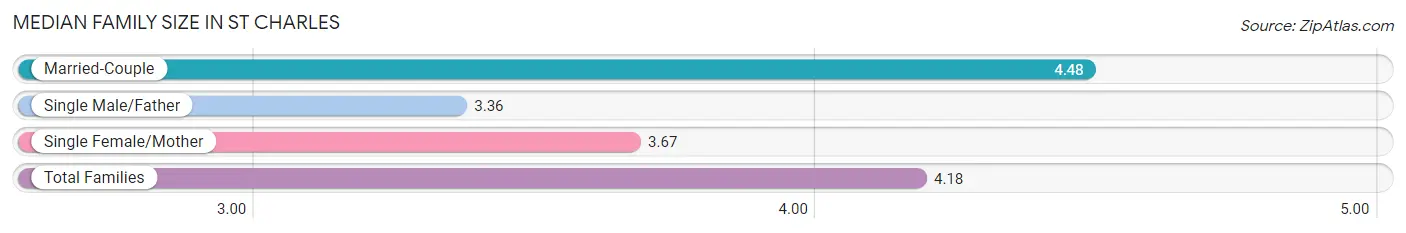
Median Family Size in St Charles
The median family size in St Charles is 4.18 persons per family, with married-couple families (40 | 70.2%) accounting for the largest median family size of 4.48 persons per family. On the other hand, single male/father families (11 | 19.3%) represent the smallest median family size with 3.36 persons per family.
| Family Type | # Families | Family Size |
| Married-Couple | 40 (70.2%) | 4.48 |
| Single Male/Father | 11 (19.3%) | 3.36 |
| Single Female/Mother | 6 (10.5%) | 3.67 |
| Total Families | 57 (100.0%) | 4.18 |
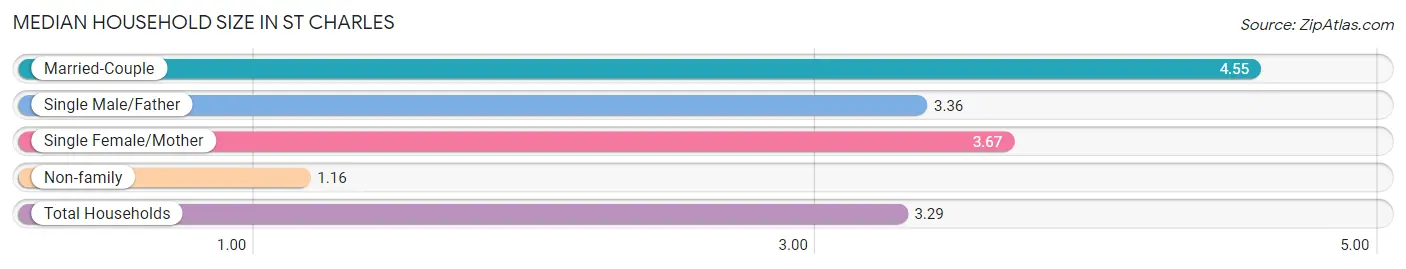
Median Household Size in St Charles
The median household size in St Charles is 3.29 persons per household, with married-couple households (40 | 48.8%) accounting for the largest median household size of 4.55 persons per household. non-family households (25 | 30.5%) represent the smallest median household size with 1.16 persons per household.
| Household Type | # Households | Household Size |
| Married-Couple | 40 (48.8%) | 4.55 |
| Single Male/Father | 11 (13.4%) | 3.36 |
| Single Female/Mother | 6 (7.3%) | 3.67 |
| Non-family | 25 (30.5%) | 1.16 |
| Total Households | 82 (100.0%) | 3.29 |
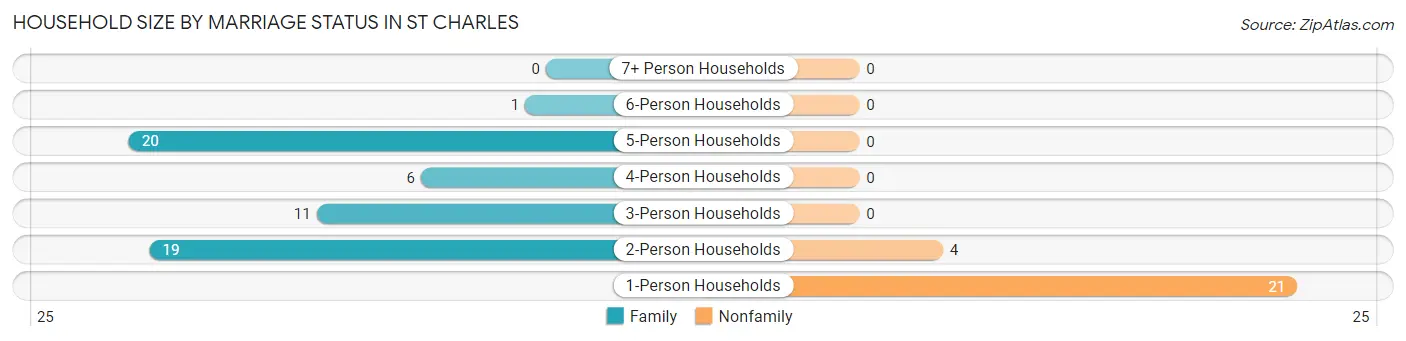
Household Size by Marriage Status in St Charles
Out of a total of 82 households in St Charles, 57 (69.5%) are family households, while 25 (30.5%) are nonfamily households. The most numerous type of family households are 5-person households, comprising 20, and the most common type of nonfamily households are 1-person households, comprising 21.
| Household Size | Family Households | Nonfamily Households |
| 1-Person Households | - | 21 (25.6%) |
| 2-Person Households | 19 (23.2%) | 4 (4.9%) |
| 3-Person Households | 11 (13.4%) | 0 (0.0%) |
| 4-Person Households | 6 (7.3%) | 0 (0.0%) |
| 5-Person Households | 20 (24.4%) | 0 (0.0%) |
| 6-Person Households | 1 (1.2%) | 0 (0.0%) |
| 7+ Person Households | 0 (0.0%) | 0 (0.0%) |
| Total | 57 (69.5%) | 25 (30.5%) |
Female Fertility in St Charles
Fertility by Age in St Charles
| Age Bracket | Women with Births | Births / 1,000 Women |
| 15 to 19 years | 0 (0.0%) | 0.0 |
| 20 to 34 years | 0 (0.0%) | 0.0 |
| 35 to 50 years | 0 (0.0%) | 0.0 |
| Total | 0 (0.0%) | 0.0 |
Fertility by Age by Marriage Status in St Charles
| Age Bracket | Married | Unmarried |
| 15 to 19 years | 0 (0.0%) | 0 (0.0%) |
| 20 to 34 years | 0 (0.0%) | 0 (0.0%) |
| 35 to 50 years | 0 (0.0%) | 0 (0.0%) |
| Total | 0 (0.0%) | 0 (0.0%) |
Fertility by Education in St Charles
| Educational Attainment | Women with Births | Births / 1,000 Women |
| Less than High School | 0 (0.0%) | 0.0 |
| High School Diploma | 0 (0.0%) | 0.0 |
| College or Associate's Degree | 0 (0.0%) | 0.0 |
| Bachelor's Degree | 0 (0.0%) | 0.0 |
| Graduate Degree | 0 (0.0%) | 0.0 |
| Total | 0 (0.0%) | 0.0 |
Fertility by Education by Marriage Status in St Charles
| Educational Attainment | Married | Unmarried |
| Less than High School | 0 (0.0%) | 0 (0.0%) |
| High School Diploma | 0 (0.0%) | 0 (0.0%) |
| College or Associate's Degree | 0 (0.0%) | 0 (0.0%) |
| Bachelor's Degree | 0 (0.0%) | 0 (0.0%) |
| Graduate Degree | 0 (0.0%) | 0 (0.0%) |
| Total | 0 (0.0%) | 0 (0.0%) |
Employment Characteristics in St Charles
Employment by Class of Employer in St Charles
Among the 78 employed individuals in St Charles, private company employees (38 | 48.7%), self-employed (not incorporated) (19 | 24.4%), and self-employed (incorporated) (17 | 21.8%) make up the most common classes of employment.
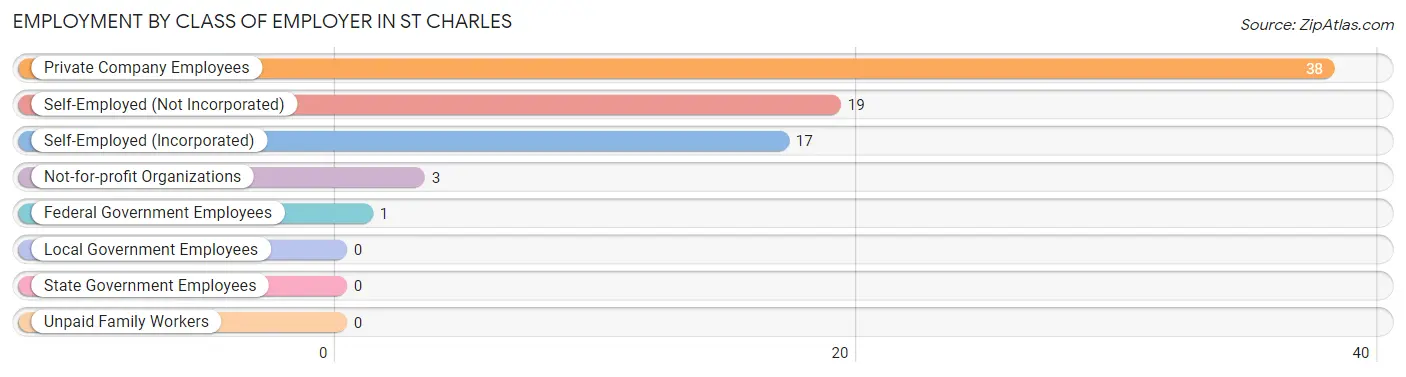
| Employer Class | # Employees | % Employees |
| Private Company Employees | 38 | 48.7% |
| Self-Employed (Incorporated) | 17 | 21.8% |
| Self-Employed (Not Incorporated) | 19 | 24.4% |
| Not-for-profit Organizations | 3 | 3.8% |
| Local Government Employees | 0 | 0.0% |
| State Government Employees | 0 | 0.0% |
| Federal Government Employees | 1 | 1.3% |
| Unpaid Family Workers | 0 | 0.0% |
| Total | 78 | 100.0% |
Employment Status by Age in St Charles
According to the labor force statistics for St Charles, out of the total population over 16 years of age (168), 50.0% or 84 individuals are in the labor force, with 7.1% or 6 of them unemployed. The age group with the highest labor force participation rate is 30 to 34 years, with 100.0% or 12 individuals in the labor force. Within the labor force, the 25 to 29 years age range has the highest percentage of unemployed individuals, with 100.0% or 4 of them being unemployed.
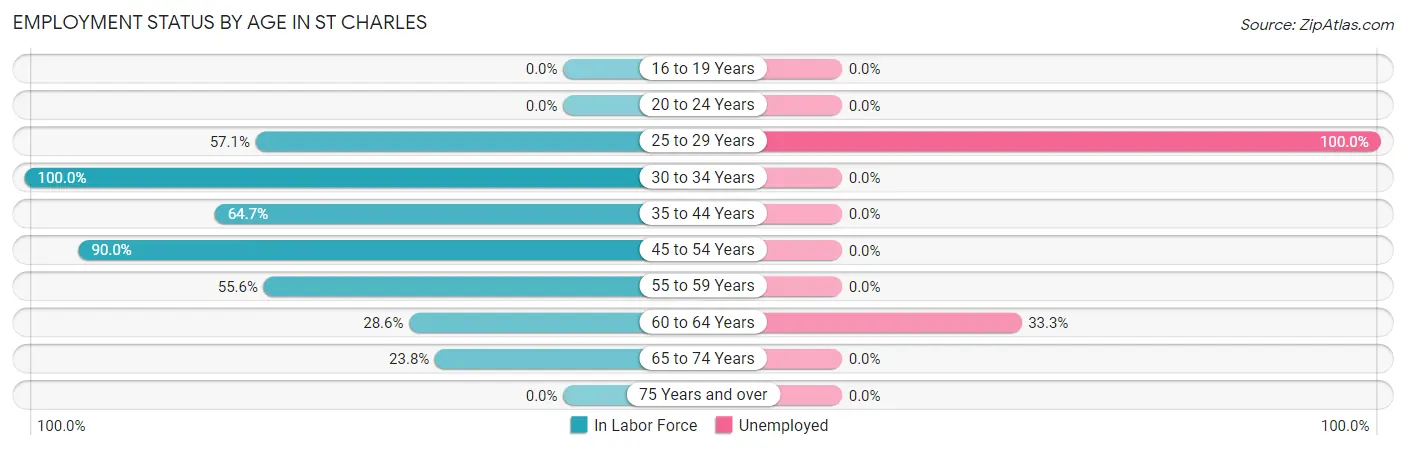
| Age Bracket | In Labor Force | Unemployed |
| 16 to 19 Years | 0 (0.0%) | 0 (0.0%) |
| 20 to 24 Years | 0 (0.0%) | 0 (0.0%) |
| 25 to 29 Years | 4 (57.1%) | 4 (100.0%) |
| 30 to 34 Years | 12 (100.0%) | 0 (0.0%) |
| 35 to 44 Years | 11 (64.7%) | 0 (0.0%) |
| 45 to 54 Years | 36 (90.0%) | 0 (0.0%) |
| 55 to 59 Years | 10 (55.6%) | 0 (0.0%) |
| 60 to 64 Years | 6 (28.6%) | 2 (33.3%) |
| 65 to 74 Years | 5 (23.8%) | 0 (0.0%) |
| 75 Years and over | 0 (0.0%) | 0 (0.0%) |
| Total | 84 (50.0%) | 6 (7.1%) |
Employment Status by Educational Attainment in St Charles
According to labor force statistics for St Charles, 68.7% of individuals (79) out of the total population between 25 and 64 years of age (115) are in the labor force, with 7.6% or 6 of them being unemployed. The group with the highest labor force participation rate are those with the educational attainment of bachelor's degree or higher, with 100.0% or 23 individuals in the labor force. Within the labor force, individuals with less than high school education have the highest percentage of unemployment, with 22.2% or 4 of them being unemployed.
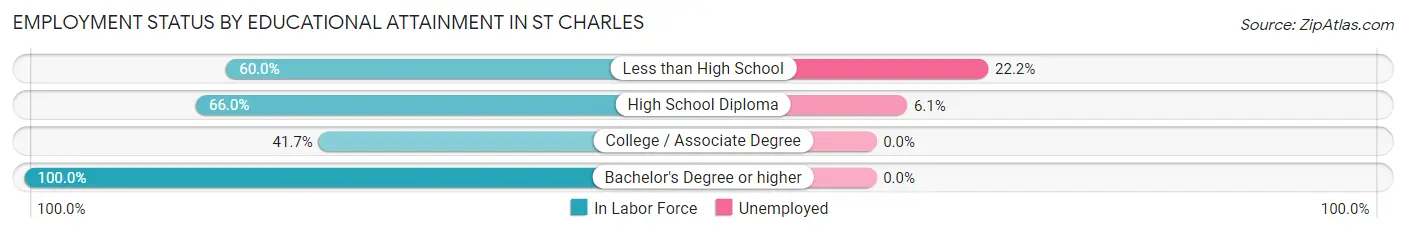
| Educational Attainment | In Labor Force | Unemployed |
| Less than High School | 18 (60.0%) | 7 (22.2%) |
| High School Diploma | 33 (66.0%) | 3 (6.1%) |
| College / Associate Degree | 5 (41.7%) | 0 (0.0%) |
| Bachelor's Degree or higher | 23 (100.0%) | 0 (0.0%) |
| Total | 79 (68.7%) | 9 (7.6%) |
Employment Occupations by Sex in St Charles
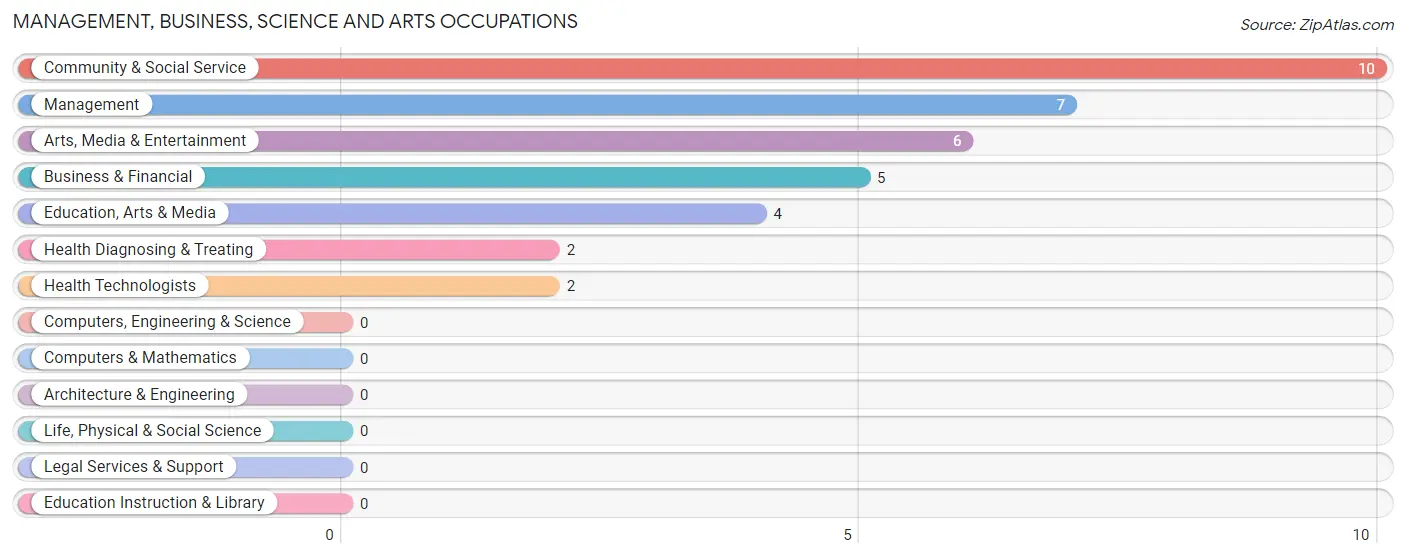
Management, Business, Science and Arts Occupations
The most common Management, Business, Science and Arts occupations in St Charles are Community & Social Service (10 | 12.8%), Management (7 | 9.0%), Arts, Media & Entertainment (6 | 7.7%), Business & Financial (5 | 6.4%), and Education, Arts & Media (4 | 5.1%).
Management, Business, Science and Arts Occupations by Sex
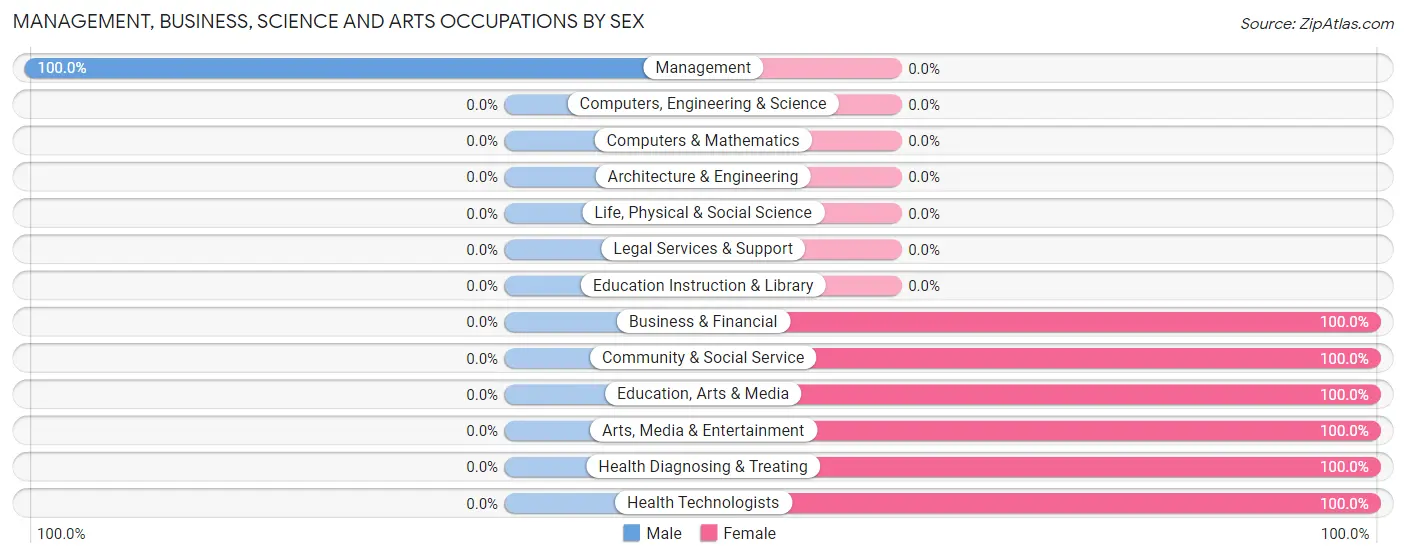
| Occupation | Male | Female |
| Management | 7 (100.0%) | 0 (0.0%) |
| Business & Financial | 0 (0.0%) | 5 (100.0%) |
| Computers, Engineering & Science | 0 (0.0%) | 0 (0.0%) |
| Computers & Mathematics | 0 (0.0%) | 0 (0.0%) |
| Architecture & Engineering | 0 (0.0%) | 0 (0.0%) |
| Life, Physical & Social Science | 0 (0.0%) | 0 (0.0%) |
| Community & Social Service | 0 (0.0%) | 10 (100.0%) |
| Education, Arts & Media | 0 (0.0%) | 4 (100.0%) |
| Legal Services & Support | 0 (0.0%) | 0 (0.0%) |
| Education Instruction & Library | 0 (0.0%) | 0 (0.0%) |
| Arts, Media & Entertainment | 0 (0.0%) | 6 (100.0%) |
| Health Diagnosing & Treating | 0 (0.0%) | 2 (100.0%) |
| Health Technologists | 0 (0.0%) | 2 (100.0%) |
| Total (Category) | 7 (29.2%) | 17 (70.8%) |
| Total (Overall) | 48 (61.5%) | 30 (38.5%) |
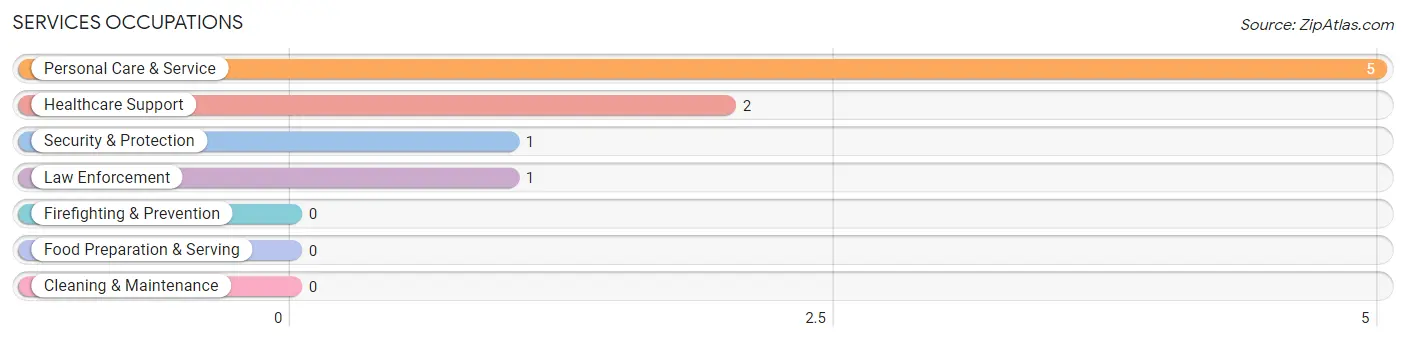
Services Occupations
The most common Services occupations in St Charles are Personal Care & Service (5 | 6.4%), Healthcare Support (2 | 2.6%), Security & Protection (1 | 1.3%), and Law Enforcement (1 | 1.3%).
Services Occupations by Sex
Within the Services occupations in St Charles, the most male-oriented occupations are Security & Protection (100.0%), and Law Enforcement (100.0%), while the most female-oriented occupations are Healthcare Support (100.0%), and Personal Care & Service (100.0%).
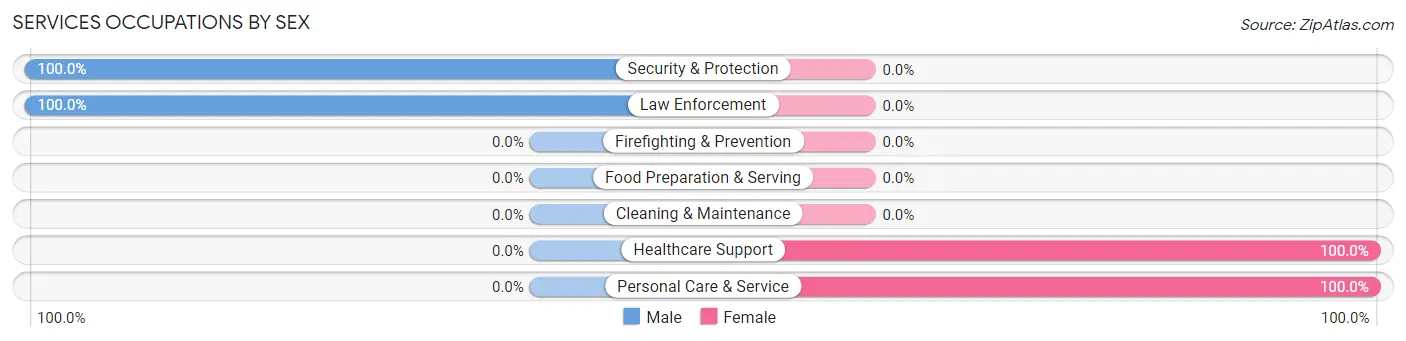
| Occupation | Male | Female |
| Healthcare Support | 0 (0.0%) | 2 (100.0%) |
| Security & Protection | 1 (100.0%) | 0 (0.0%) |
| Firefighting & Prevention | 0 (0.0%) | 0 (0.0%) |
| Law Enforcement | 1 (100.0%) | 0 (0.0%) |
| Food Preparation & Serving | 0 (0.0%) | 0 (0.0%) |
| Cleaning & Maintenance | 0 (0.0%) | 0 (0.0%) |
| Personal Care & Service | 0 (0.0%) | 5 (100.0%) |
| Total (Category) | 1 (12.5%) | 7 (87.5%) |
| Total (Overall) | 48 (61.5%) | 30 (38.5%) |
Sales and Office Occupations
The most common Sales and Office occupations in St Charles are Sales & Related (6 | 7.7%), and Office & Administration (2 | 2.6%).
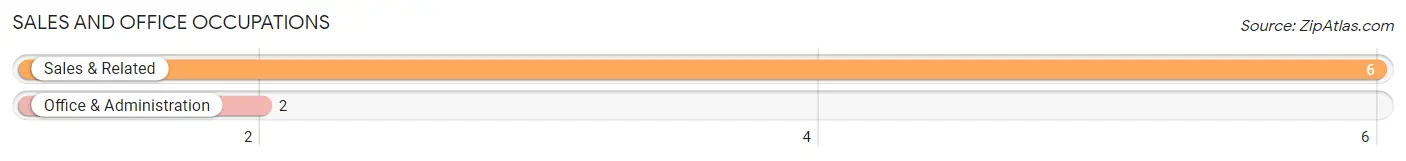
Sales and Office Occupations by Sex
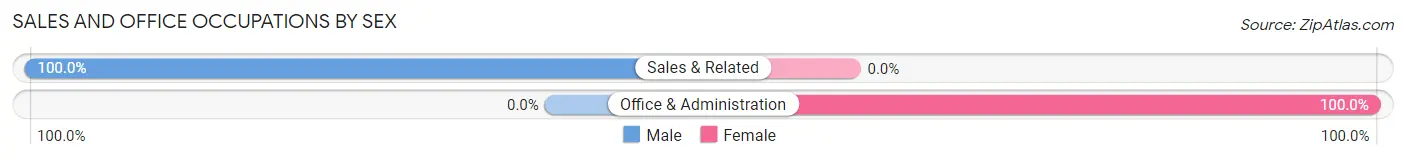
| Occupation | Male | Female |
| Sales & Related | 6 (100.0%) | 0 (0.0%) |
| Office & Administration | 0 (0.0%) | 2 (100.0%) |
| Total (Category) | 6 (75.0%) | 2 (25.0%) |
| Total (Overall) | 48 (61.5%) | 30 (38.5%) |
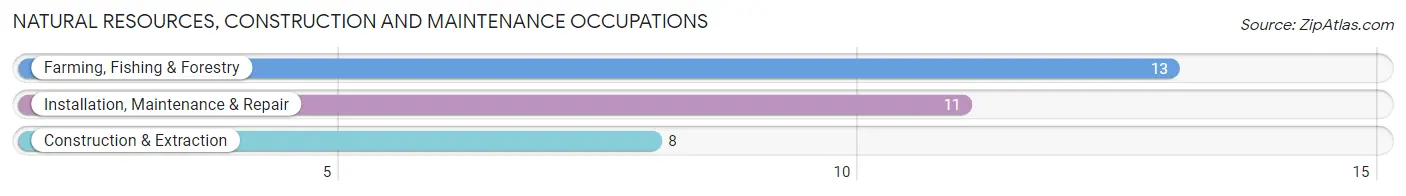
Natural Resources, Construction and Maintenance Occupations
The most common Natural Resources, Construction and Maintenance occupations in St Charles are Farming, Fishing & Forestry (13 | 16.7%), Installation, Maintenance & Repair (11 | 14.1%), and Construction & Extraction (8 | 10.3%).
Natural Resources, Construction and Maintenance Occupations by Sex
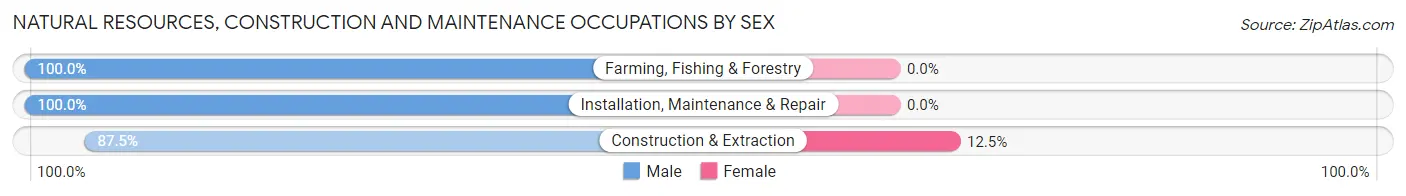
| Occupation | Male | Female |
| Farming, Fishing & Forestry | 13 (100.0%) | 0 (0.0%) |
| Construction & Extraction | 7 (87.5%) | 1 (12.5%) |
| Installation, Maintenance & Repair | 11 (100.0%) | 0 (0.0%) |
| Total (Category) | 31 (96.9%) | 1 (3.1%) |
| Total (Overall) | 48 (61.5%) | 30 (38.5%) |
Production, Transportation and Moving Occupations
The most common Production, Transportation and Moving occupations in St Charles are Production (3 | 3.8%), and Transportation (3 | 3.8%).
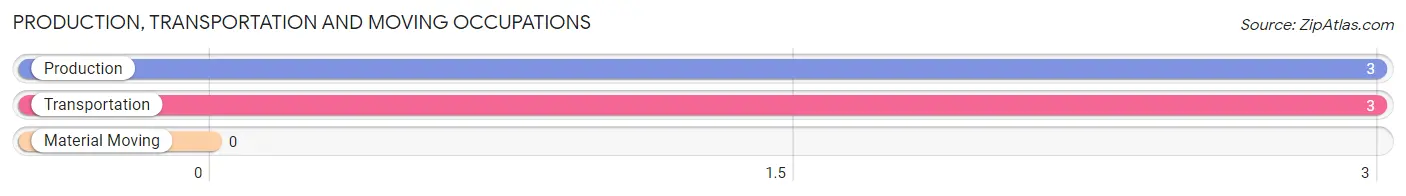
Production, Transportation and Moving Occupations by Sex
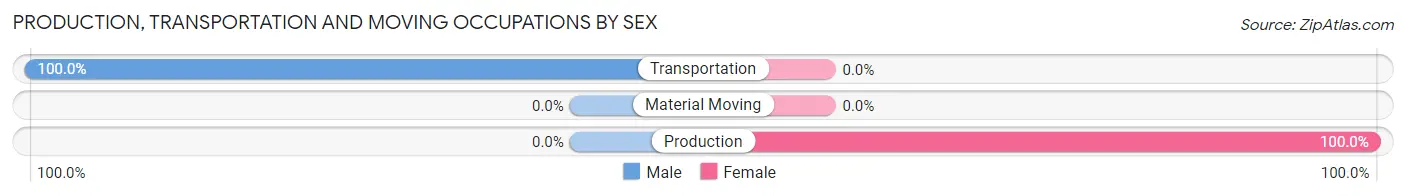
| Occupation | Male | Female |
| Production | 0 (0.0%) | 3 (100.0%) |
| Transportation | 3 (100.0%) | 0 (0.0%) |
| Material Moving | 0 (0.0%) | 0 (0.0%) |
| Total (Category) | 3 (50.0%) | 3 (50.0%) |
| Total (Overall) | 48 (61.5%) | 30 (38.5%) |
Employment Industries by Sex in St Charles
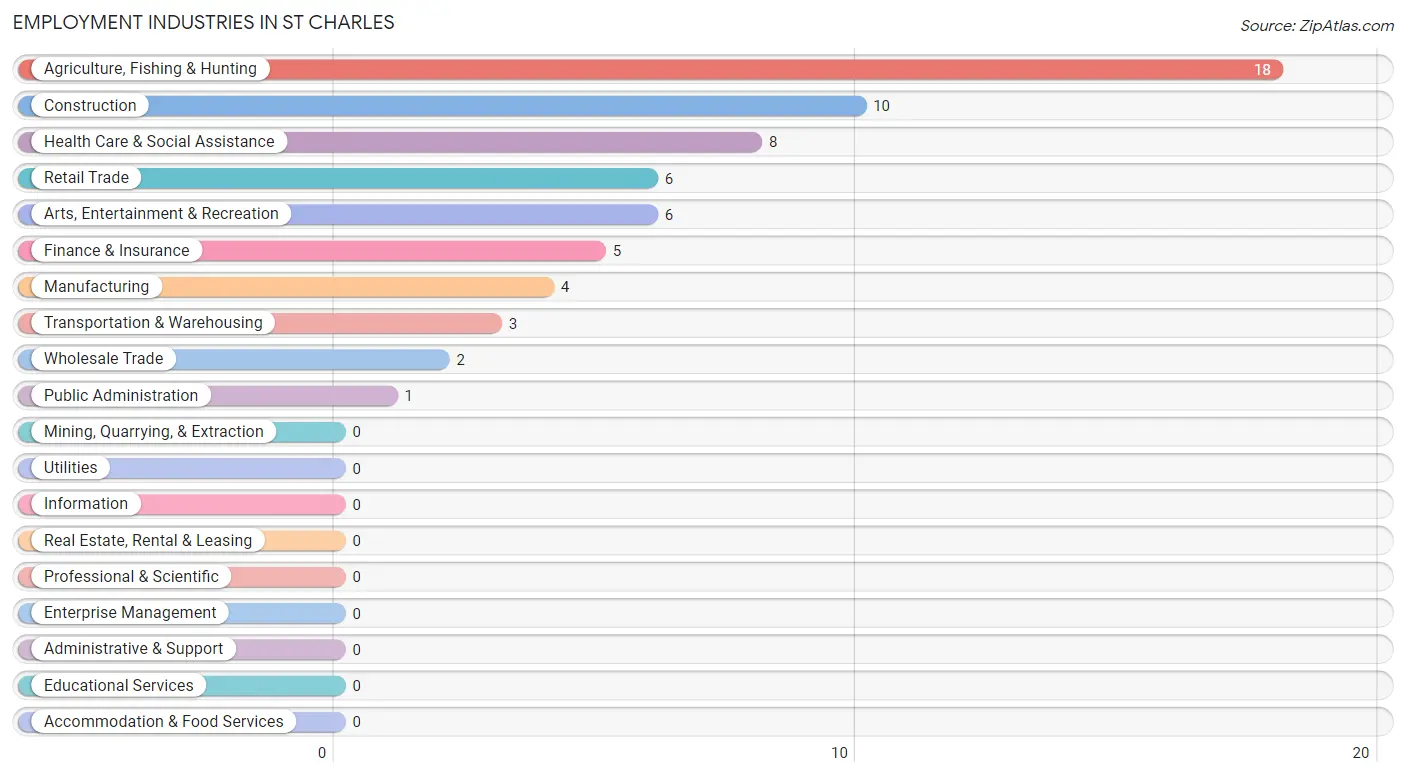
Employment Industries in St Charles
The major employment industries in St Charles include Agriculture, Fishing & Hunting (18 | 23.1%), Construction (10 | 12.8%), Health Care & Social Assistance (8 | 10.3%), Retail Trade (6 | 7.7%), and Arts, Entertainment & Recreation (6 | 7.7%).
Employment Industries by Sex in St Charles
The St Charles industries that see more men than women are Agriculture, Fishing & Hunting (100.0%), Retail Trade (100.0%), and Transportation & Warehousing (100.0%), whereas the industries that tend to have a higher number of women are Wholesale Trade (100.0%), Finance & Insurance (100.0%), and Health Care & Social Assistance (100.0%).

| Industry | Male | Female |
| Agriculture, Fishing & Hunting | 18 (100.0%) | 0 (0.0%) |
| Mining, Quarrying, & Extraction | 0 (0.0%) | 0 (0.0%) |
| Construction | 9 (90.0%) | 1 (10.0%) |
| Manufacturing | 1 (25.0%) | 3 (75.0%) |
| Wholesale Trade | 0 (0.0%) | 2 (100.0%) |
| Retail Trade | 6 (100.0%) | 0 (0.0%) |
| Transportation & Warehousing | 3 (100.0%) | 0 (0.0%) |
| Utilities | 0 (0.0%) | 0 (0.0%) |
| Information | 0 (0.0%) | 0 (0.0%) |
| Finance & Insurance | 0 (0.0%) | 5 (100.0%) |
| Real Estate, Rental & Leasing | 0 (0.0%) | 0 (0.0%) |
| Professional & Scientific | 0 (0.0%) | 0 (0.0%) |
| Enterprise Management | 0 (0.0%) | 0 (0.0%) |
| Administrative & Support | 0 (0.0%) | 0 (0.0%) |
| Educational Services | 0 (0.0%) | 0 (0.0%) |
| Health Care & Social Assistance | 0 (0.0%) | 8 (100.0%) |
| Arts, Entertainment & Recreation | 0 (0.0%) | 6 (100.0%) |
| Accommodation & Food Services | 0 (0.0%) | 0 (0.0%) |
| Public Administration | 1 (100.0%) | 0 (0.0%) |
| Total | 48 (61.5%) | 30 (38.5%) |
Education in St Charles
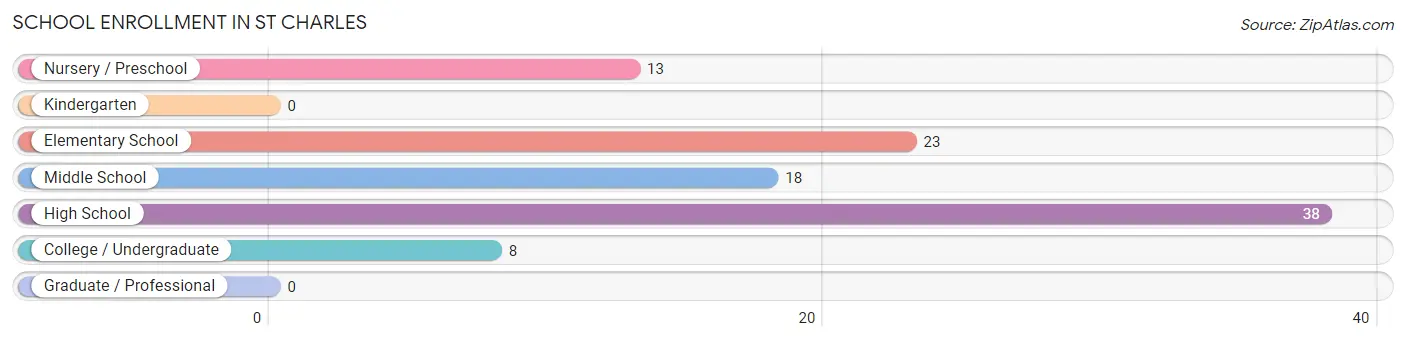
School Enrollment in St Charles
The most common levels of schooling among the 100 students in St Charles are high school (38 | 38.0%), elementary school (23 | 23.0%), and middle school (18 | 18.0%).
| School Level | # Students | % Students |
| Nursery / Preschool | 13 | 13.0% |
| Kindergarten | 0 | 0.0% |
| Elementary School | 23 | 23.0% |
| Middle School | 18 | 18.0% |
| High School | 38 | 38.0% |
| College / Undergraduate | 8 | 8.0% |
| Graduate / Professional | 0 | 0.0% |
| Total | 100 | 100.0% |
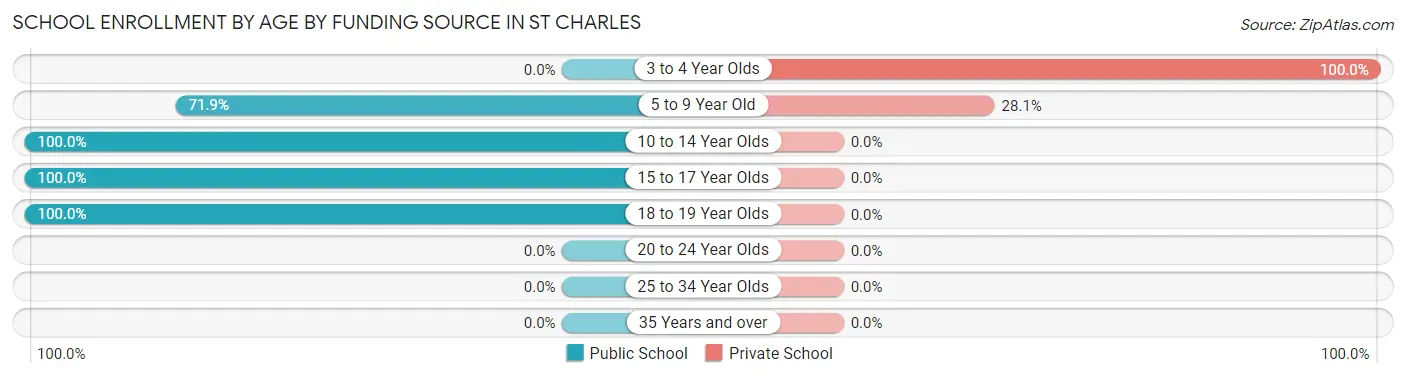
School Enrollment by Age by Funding Source in St Charles
Out of a total of 100 students who are enrolled in schools in St Charles, 13 (13.0%) attend a private institution, while the remaining 87 (87.0%) are enrolled in public schools. The age group of 3 to 4 year olds has the highest likelihood of being enrolled in private schools, with 4 (100.0% in the age bracket) enrolled. Conversely, the age group of 10 to 14 year olds has the lowest likelihood of being enrolled in a private school, with 18 (100.0% in the age bracket) attending a public institution.
| Age Bracket | Public School | Private School |
| 3 to 4 Year Olds | 0 (0.0%) | 4 (100.0%) |
| 5 to 9 Year Old | 23 (71.9%) | 9 (28.1%) |
| 10 to 14 Year Olds | 18 (100.0%) | 0 (0.0%) |
| 15 to 17 Year Olds | 38 (100.0%) | 0 (0.0%) |
| 18 to 19 Year Olds | 8 (100.0%) | 0 (0.0%) |
| 20 to 24 Year Olds | 0 (0.0%) | 0 (0.0%) |
| 25 to 34 Year Olds | 0 (0.0%) | 0 (0.0%) |
| 35 Years and over | 0 (0.0%) | 0 (0.0%) |
| Total | 87 (87.0%) | 13 (13.0%) |
Educational Attainment by Field of Study in St Charles
Bio, nature & agricultural (7 | 21.2%), social sciences (6 | 18.2%), business (6 | 18.2%), visual & performing arts (6 | 18.2%), and arts & humanities (4 | 12.1%) are the most common fields of study among 33 individuals in St Charles who have obtained a bachelor's degree or higher.
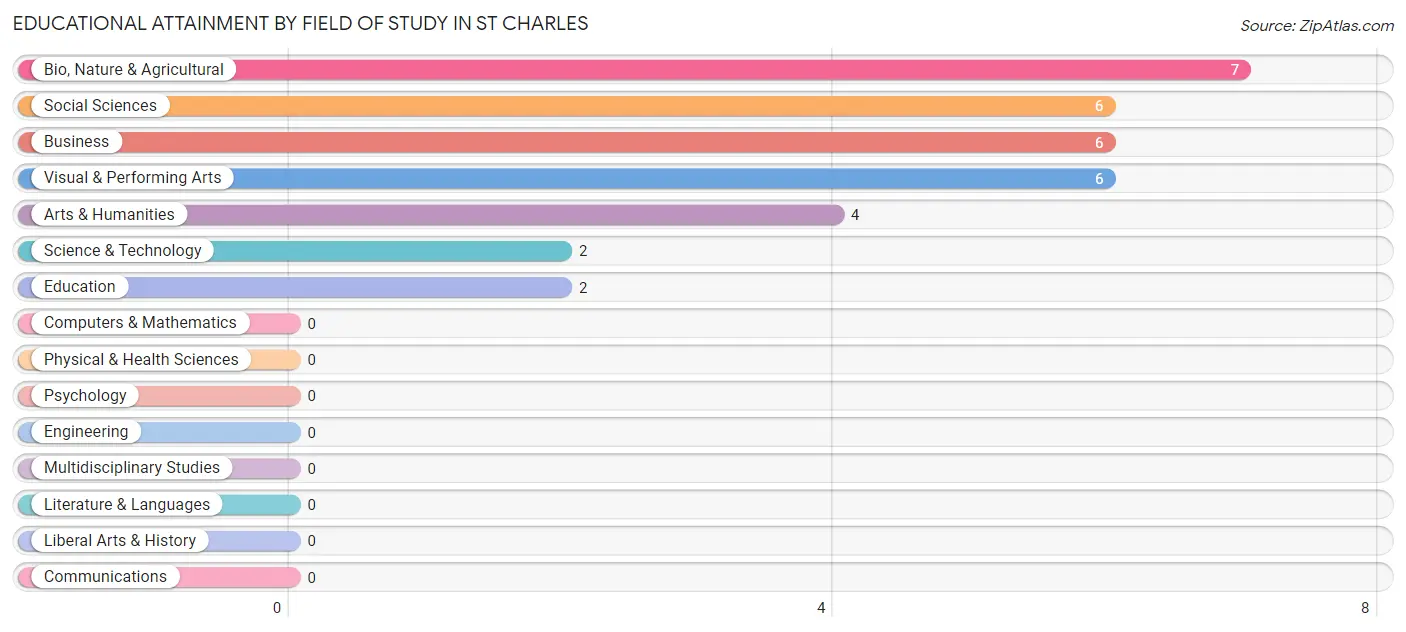
| Field of Study | # Graduates | % Graduates |
| Computers & Mathematics | 0 | 0.0% |
| Bio, Nature & Agricultural | 7 | 21.2% |
| Physical & Health Sciences | 0 | 0.0% |
| Psychology | 0 | 0.0% |
| Social Sciences | 6 | 18.2% |
| Engineering | 0 | 0.0% |
| Multidisciplinary Studies | 0 | 0.0% |
| Science & Technology | 2 | 6.1% |
| Business | 6 | 18.2% |
| Education | 2 | 6.1% |
| Literature & Languages | 0 | 0.0% |
| Liberal Arts & History | 0 | 0.0% |
| Visual & Performing Arts | 6 | 18.2% |
| Communications | 0 | 0.0% |
| Arts & Humanities | 4 | 12.1% |
| Total | 33 | 100.0% |
Transportation & Commute in St Charles
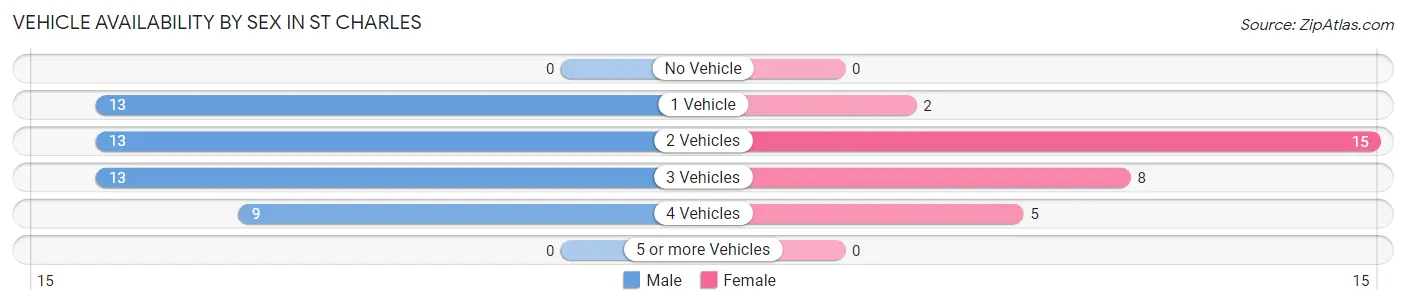
Vehicle Availability by Sex in St Charles
The most prevalent vehicle ownership categories in St Charles are males with 1 vehicle (13, accounting for 27.1%) and females with 1 vehicle (2, making up 43.3%).
| Vehicles Available | Male | Female |
| No Vehicle | 0 (0.0%) | 0 (0.0%) |
| 1 Vehicle | 13 (27.1%) | 2 (6.7%) |
| 2 Vehicles | 13 (27.1%) | 15 (50.0%) |
| 3 Vehicles | 13 (27.1%) | 8 (26.7%) |
| 4 Vehicles | 9 (18.8%) | 5 (16.7%) |
| 5 or more Vehicles | 0 (0.0%) | 0 (0.0%) |
| Total | 48 (100.0%) | 30 (100.0%) |
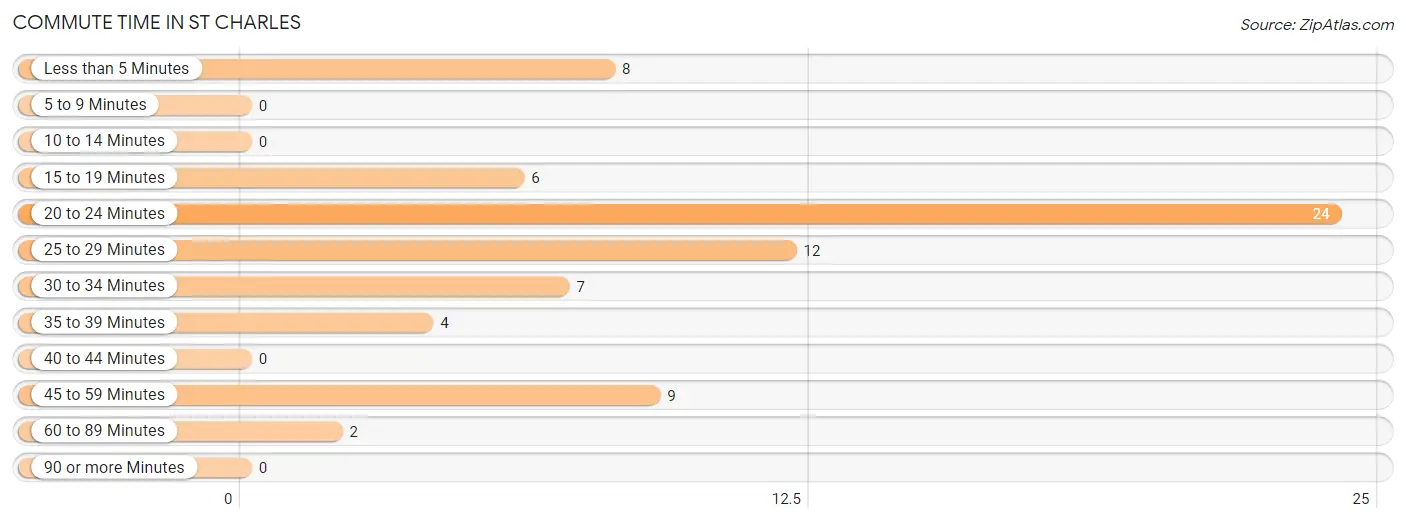
Commute Time in St Charles
The most frequently occuring commute durations in St Charles are 20 to 24 minutes (24 commuters, 33.3%), 25 to 29 minutes (12 commuters, 16.7%), and 45 to 59 minutes (9 commuters, 12.5%).
| Commute Time | # Commuters | % Commuters |
| Less than 5 Minutes | 8 | 11.1% |
| 5 to 9 Minutes | 0 | 0.0% |
| 10 to 14 Minutes | 0 | 0.0% |
| 15 to 19 Minutes | 6 | 8.3% |
| 20 to 24 Minutes | 24 | 33.3% |
| 25 to 29 Minutes | 12 | 16.7% |
| 30 to 34 Minutes | 7 | 9.7% |
| 35 to 39 Minutes | 4 | 5.6% |
| 40 to 44 Minutes | 0 | 0.0% |
| 45 to 59 Minutes | 9 | 12.5% |
| 60 to 89 Minutes | 2 | 2.8% |
| 90 or more Minutes | 0 | 0.0% |
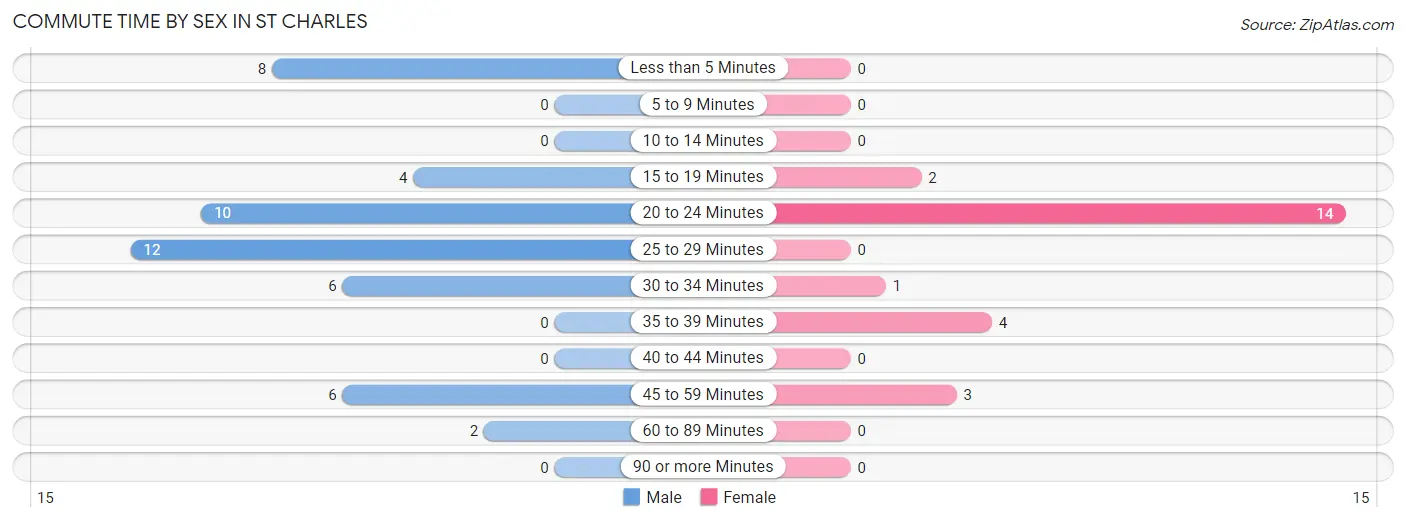
Commute Time by Sex in St Charles
The most common commute times in St Charles are 25 to 29 minutes (12 commuters, 25.0%) for males and 20 to 24 minutes (14 commuters, 58.3%) for females.
| Commute Time | Male | Female |
| Less than 5 Minutes | 8 (16.7%) | 0 (0.0%) |
| 5 to 9 Minutes | 0 (0.0%) | 0 (0.0%) |
| 10 to 14 Minutes | 0 (0.0%) | 0 (0.0%) |
| 15 to 19 Minutes | 4 (8.3%) | 2 (8.3%) |
| 20 to 24 Minutes | 10 (20.8%) | 14 (58.3%) |
| 25 to 29 Minutes | 12 (25.0%) | 0 (0.0%) |
| 30 to 34 Minutes | 6 (12.5%) | 1 (4.2%) |
| 35 to 39 Minutes | 0 (0.0%) | 4 (16.7%) |
| 40 to 44 Minutes | 0 (0.0%) | 0 (0.0%) |
| 45 to 59 Minutes | 6 (12.5%) | 3 (12.5%) |
| 60 to 89 Minutes | 2 (4.2%) | 0 (0.0%) |
| 90 or more Minutes | 0 (0.0%) | 0 (0.0%) |
Time of Departure to Work by Sex in St Charles
The most frequent times of departure to work in St Charles are 6:30 AM to 6:59 AM (14, 29.2%) for males and 6:30 AM to 6:59 AM (8, 33.3%) for females.
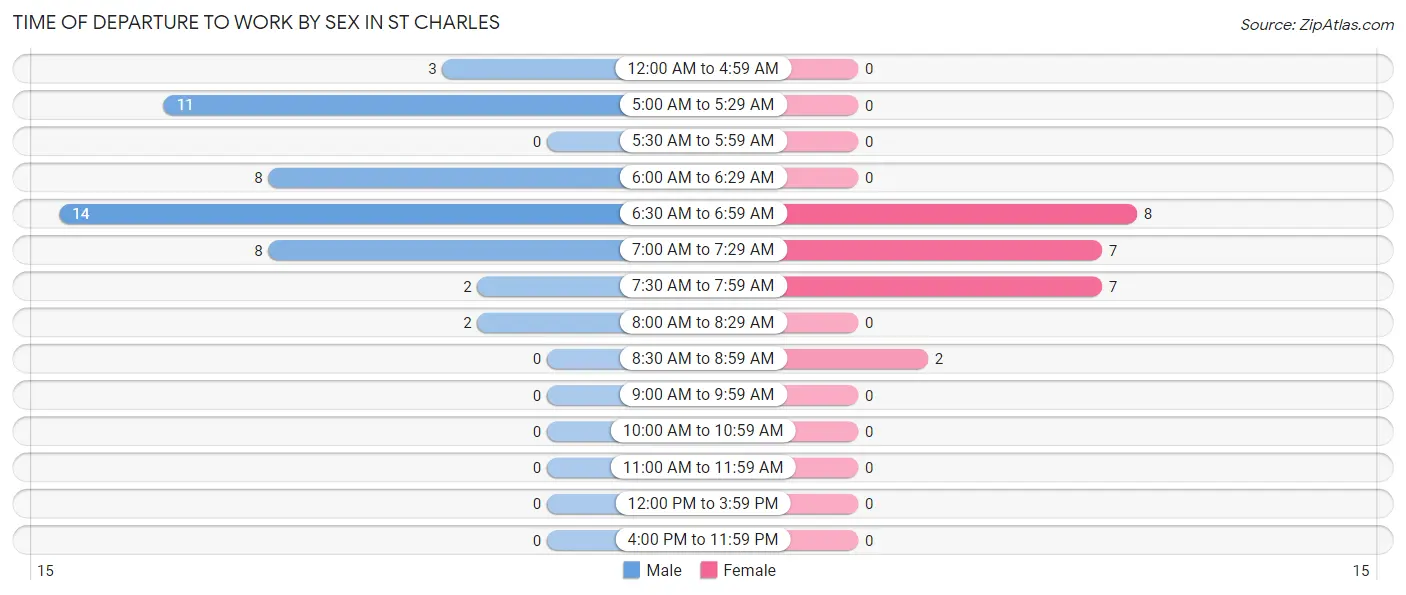
| Time of Departure | Male | Female |
| 12:00 AM to 4:59 AM | 3 (6.2%) | 0 (0.0%) |
| 5:00 AM to 5:29 AM | 11 (22.9%) | 0 (0.0%) |
| 5:30 AM to 5:59 AM | 0 (0.0%) | 0 (0.0%) |
| 6:00 AM to 6:29 AM | 8 (16.7%) | 0 (0.0%) |
| 6:30 AM to 6:59 AM | 14 (29.2%) | 8 (33.3%) |
| 7:00 AM to 7:29 AM | 8 (16.7%) | 7 (29.2%) |
| 7:30 AM to 7:59 AM | 2 (4.2%) | 7 (29.2%) |
| 8:00 AM to 8:29 AM | 2 (4.2%) | 0 (0.0%) |
| 8:30 AM to 8:59 AM | 0 (0.0%) | 2 (8.3%) |
| 9:00 AM to 9:59 AM | 0 (0.0%) | 0 (0.0%) |
| 10:00 AM to 10:59 AM | 0 (0.0%) | 0 (0.0%) |
| 11:00 AM to 11:59 AM | 0 (0.0%) | 0 (0.0%) |
| 12:00 PM to 3:59 PM | 0 (0.0%) | 0 (0.0%) |
| 4:00 PM to 11:59 PM | 0 (0.0%) | 0 (0.0%) |
| Total | 48 (100.0%) | 24 (100.0%) |
Housing Occupancy in St Charles
Occupancy by Ownership in St Charles
Of the total 82 dwellings in St Charles, owner-occupied units account for 65 (79.3%), while renter-occupied units make up 17 (20.7%).
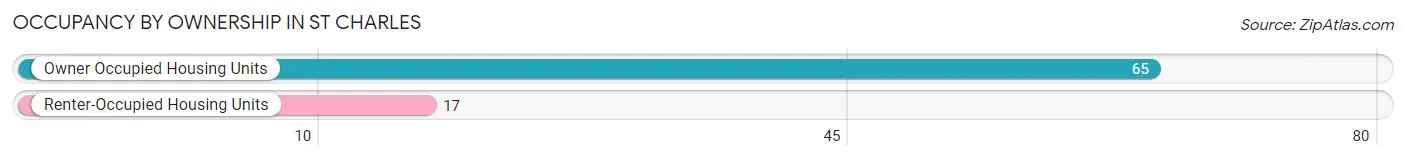
| Occupancy | # Housing Units | % Housing Units |
| Owner Occupied Housing Units | 65 | 79.3% |
| Renter-Occupied Housing Units | 17 | 20.7% |
| Total Occupied Housing Units | 82 | 100.0% |
Occupancy by Household Size in St Charles
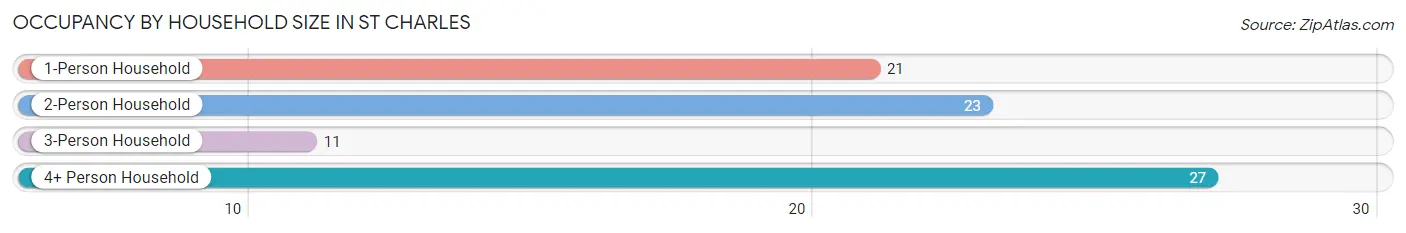
| Household Size | # Housing Units | % Housing Units |
| 1-Person Household | 21 | 25.6% |
| 2-Person Household | 23 | 28.1% |
| 3-Person Household | 11 | 13.4% |
| 4+ Person Household | 27 | 32.9% |
| Total Housing Units | 82 | 100.0% |
Occupancy by Ownership by Household Size in St Charles
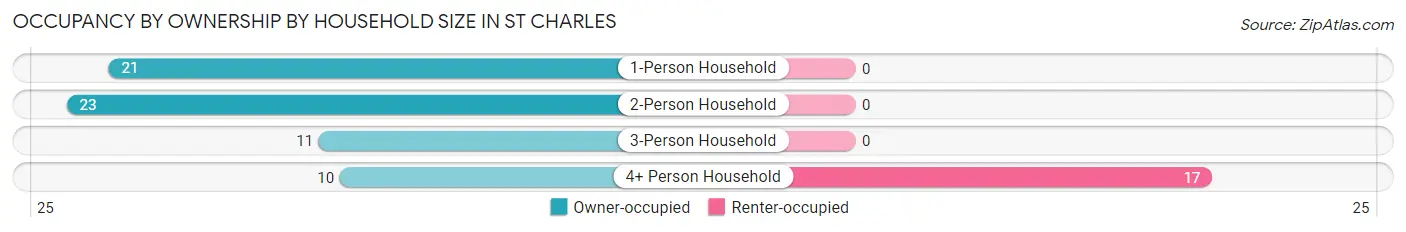
| Household Size | Owner-occupied | Renter-occupied |
| 1-Person Household | 21 (100.0%) | 0 (0.0%) |
| 2-Person Household | 23 (100.0%) | 0 (0.0%) |
| 3-Person Household | 11 (100.0%) | 0 (0.0%) |
| 4+ Person Household | 10 (37.0%) | 17 (63.0%) |
| Total Housing Units | 65 (79.3%) | 17 (20.7%) |
Occupancy by Educational Attainment in St Charles
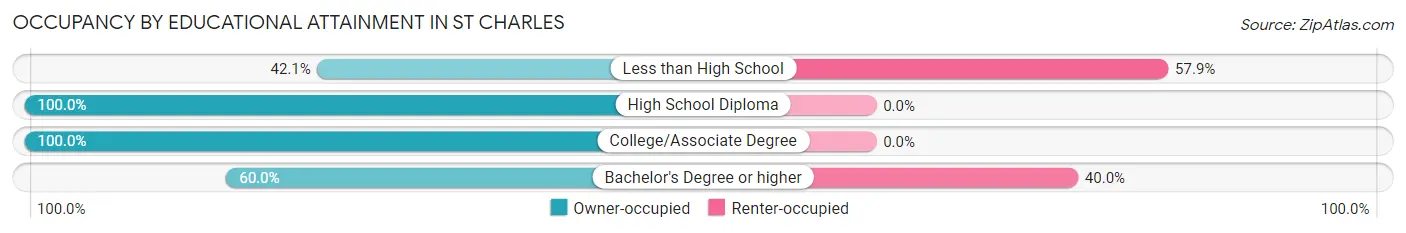
| Household Size | Owner-occupied | Renter-occupied |
| Less than High School | 8 (42.1%) | 11 (57.9%) |
| High School Diploma | 24 (100.0%) | 0 (0.0%) |
| College/Associate Degree | 24 (100.0%) | 0 (0.0%) |
| Bachelor's Degree or higher | 9 (60.0%) | 6 (40.0%) |
Occupancy by Age of Householder in St Charles
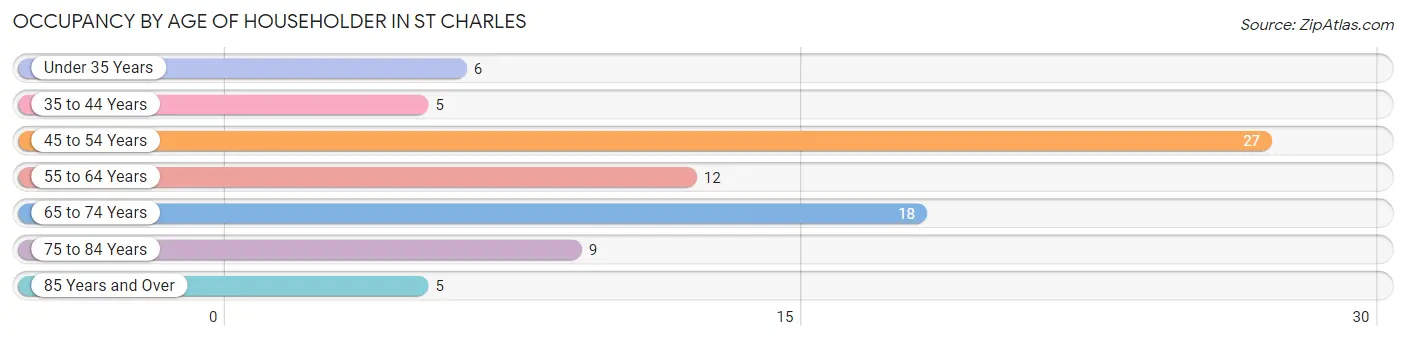
| Age Bracket | # Households | % Households |
| Under 35 Years | 6 | 7.3% |
| 35 to 44 Years | 5 | 6.1% |
| 45 to 54 Years | 27 | 32.9% |
| 55 to 64 Years | 12 | 14.6% |
| 65 to 74 Years | 18 | 22.0% |
| 75 to 84 Years | 9 | 11.0% |
| 85 Years and Over | 5 | 6.1% |
| Total | 82 | 100.0% |
Housing Finances in St Charles
Median Income by Occupancy in St Charles
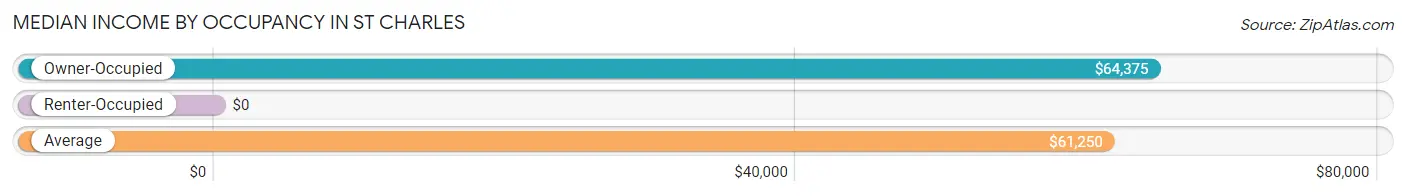
| Occupancy Type | # Households | Median Income |
| Owner-Occupied | 65 (79.3%) | $64,375 |
| Renter-Occupied | 17 (20.7%) | $0 |
| Average | 82 (100.0%) | $61,250 |
Occupancy by Householder Income Bracket in St Charles
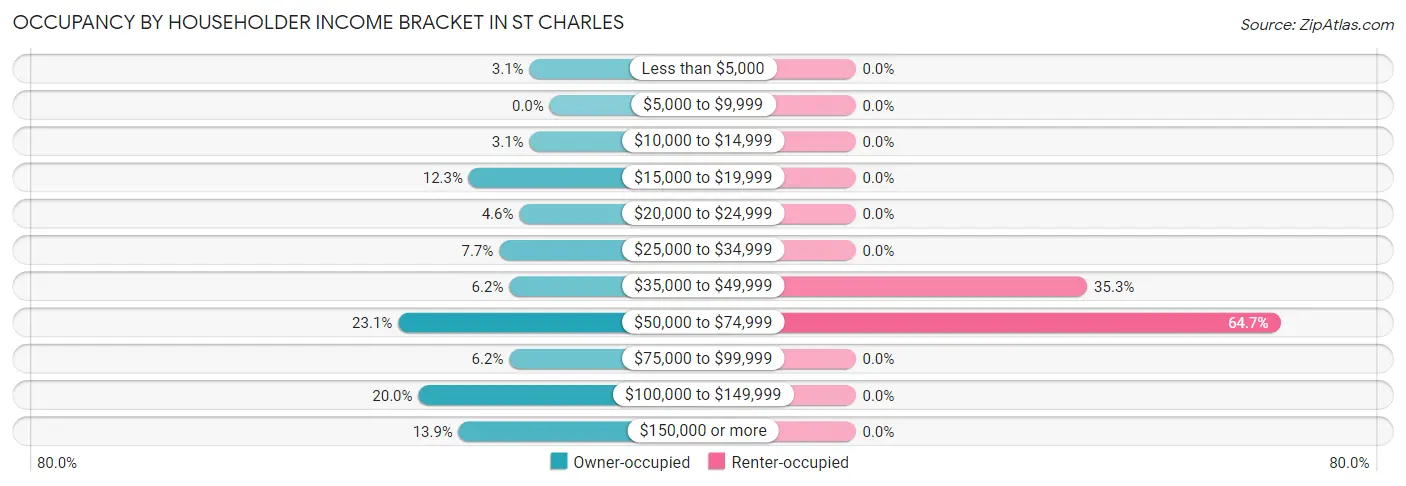
| Income Bracket | Owner-occupied | Renter-occupied |
| Less than $5,000 | 2 (3.1%) | 0 (0.0%) |
| $5,000 to $9,999 | 0 (0.0%) | 0 (0.0%) |
| $10,000 to $14,999 | 2 (3.1%) | 0 (0.0%) |
| $15,000 to $19,999 | 8 (12.3%) | 0 (0.0%) |
| $20,000 to $24,999 | 3 (4.6%) | 0 (0.0%) |
| $25,000 to $34,999 | 5 (7.7%) | 0 (0.0%) |
| $35,000 to $49,999 | 4 (6.1%) | 6 (35.3%) |
| $50,000 to $74,999 | 15 (23.1%) | 11 (64.7%) |
| $75,000 to $99,999 | 4 (6.1%) | 0 (0.0%) |
| $100,000 to $149,999 | 13 (20.0%) | 0 (0.0%) |
| $150,000 or more | 9 (13.9%) | 0 (0.0%) |
| Total | 65 (100.0%) | 17 (100.0%) |
Monthly Housing Cost Tiers in St Charles
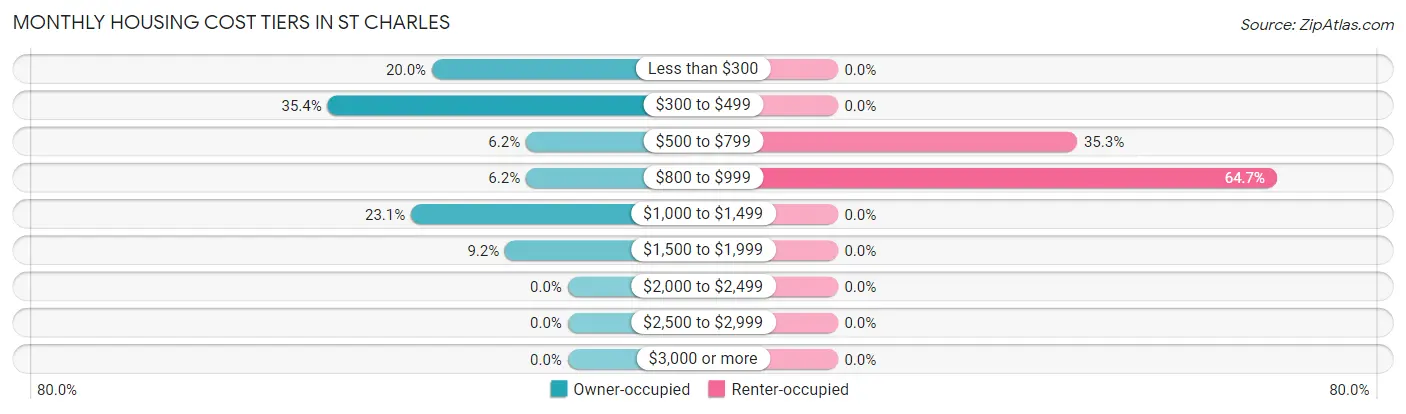
| Monthly Cost | Owner-occupied | Renter-occupied |
| Less than $300 | 13 (20.0%) | 0 (0.0%) |
| $300 to $499 | 23 (35.4%) | 0 (0.0%) |
| $500 to $799 | 4 (6.1%) | 6 (35.3%) |
| $800 to $999 | 4 (6.1%) | 11 (64.7%) |
| $1,000 to $1,499 | 15 (23.1%) | 0 (0.0%) |
| $1,500 to $1,999 | 6 (9.2%) | 0 (0.0%) |
| $2,000 to $2,499 | 0 (0.0%) | 0 (0.0%) |
| $2,500 to $2,999 | 0 (0.0%) | 0 (0.0%) |
| $3,000 or more | 0 (0.0%) | 0 (0.0%) |
| Total | 65 (100.0%) | 17 (100.0%) |
Physical Housing Characteristics in St Charles
Housing Structures in St Charles
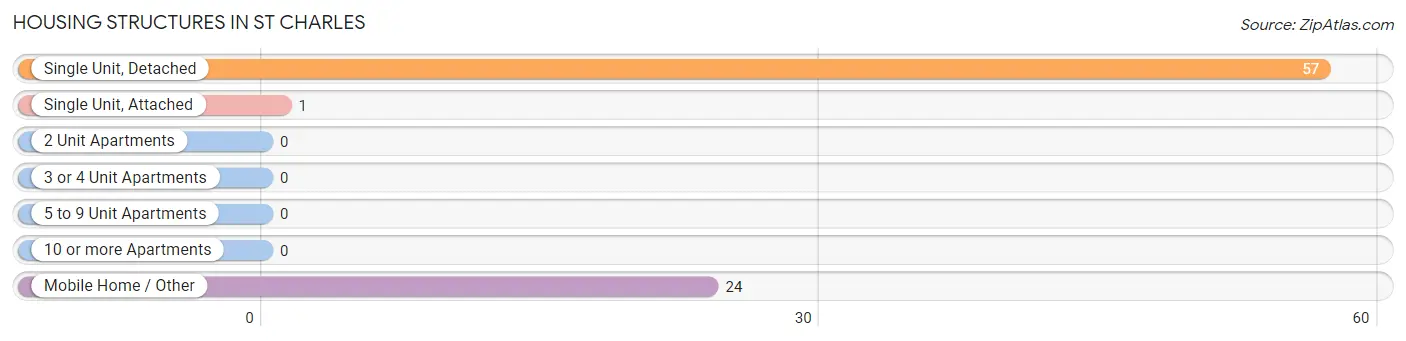
| Structure Type | # Housing Units | % Housing Units |
| Single Unit, Detached | 57 | 69.5% |
| Single Unit, Attached | 1 | 1.2% |
| 2 Unit Apartments | 0 | 0.0% |
| 3 or 4 Unit Apartments | 0 | 0.0% |
| 5 to 9 Unit Apartments | 0 | 0.0% |
| 10 or more Apartments | 0 | 0.0% |
| Mobile Home / Other | 24 | 29.3% |
| Total | 82 | 100.0% |
Housing Structures by Occupancy in St Charles
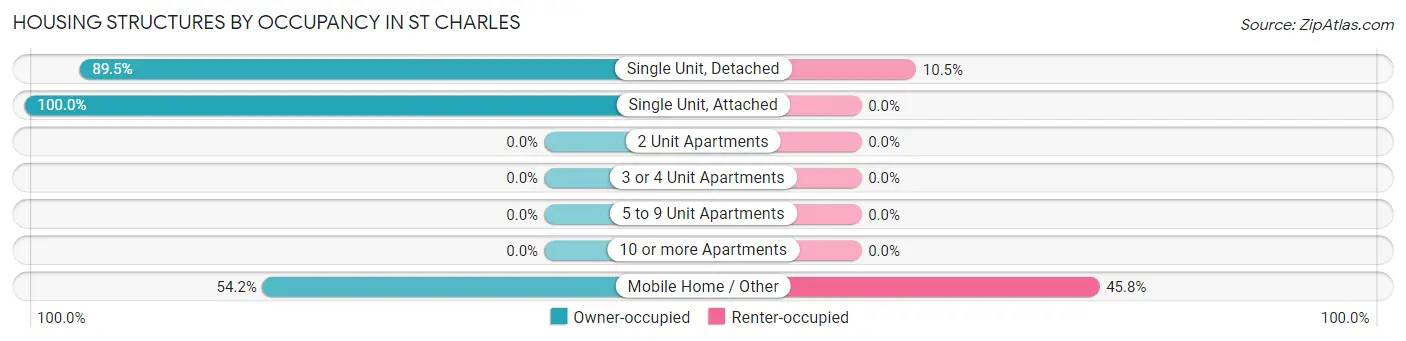
| Structure Type | Owner-occupied | Renter-occupied |
| Single Unit, Detached | 51 (89.5%) | 6 (10.5%) |
| Single Unit, Attached | 1 (100.0%) | 0 (0.0%) |
| 2 Unit Apartments | 0 (0.0%) | 0 (0.0%) |
| 3 or 4 Unit Apartments | 0 (0.0%) | 0 (0.0%) |
| 5 to 9 Unit Apartments | 0 (0.0%) | 0 (0.0%) |
| 10 or more Apartments | 0 (0.0%) | 0 (0.0%) |
| Mobile Home / Other | 13 (54.2%) | 11 (45.8%) |
| Total | 65 (79.3%) | 17 (20.7%) |
Housing Structures by Number of Rooms in St Charles
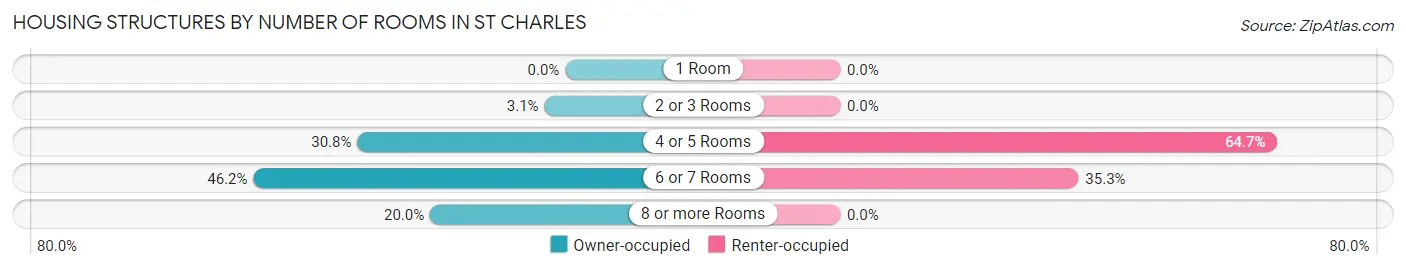
| Number of Rooms | Owner-occupied | Renter-occupied |
| 1 Room | 0 (0.0%) | 0 (0.0%) |
| 2 or 3 Rooms | 2 (3.1%) | 0 (0.0%) |
| 4 or 5 Rooms | 20 (30.8%) | 11 (64.7%) |
| 6 or 7 Rooms | 30 (46.2%) | 6 (35.3%) |
| 8 or more Rooms | 13 (20.0%) | 0 (0.0%) |
| Total | 65 (100.0%) | 17 (100.0%) |
Housing Structure by Heating Type in St Charles
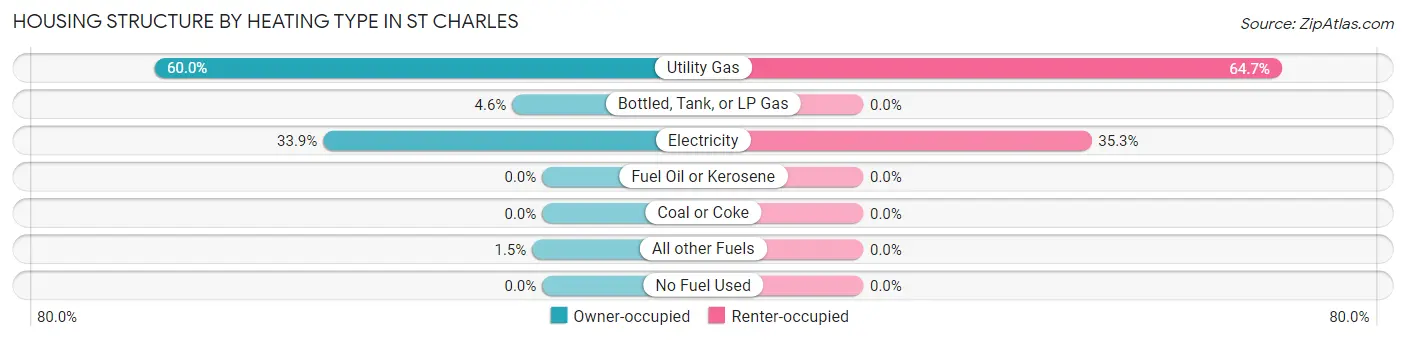
| Heating Type | Owner-occupied | Renter-occupied |
| Utility Gas | 39 (60.0%) | 11 (64.7%) |
| Bottled, Tank, or LP Gas | 3 (4.6%) | 0 (0.0%) |
| Electricity | 22 (33.9%) | 6 (35.3%) |
| Fuel Oil or Kerosene | 0 (0.0%) | 0 (0.0%) |
| Coal or Coke | 0 (0.0%) | 0 (0.0%) |
| All other Fuels | 1 (1.5%) | 0 (0.0%) |
| No Fuel Used | 0 (0.0%) | 0 (0.0%) |
| Total | 65 (100.0%) | 17 (100.0%) |
Household Vehicle Usage in St Charles
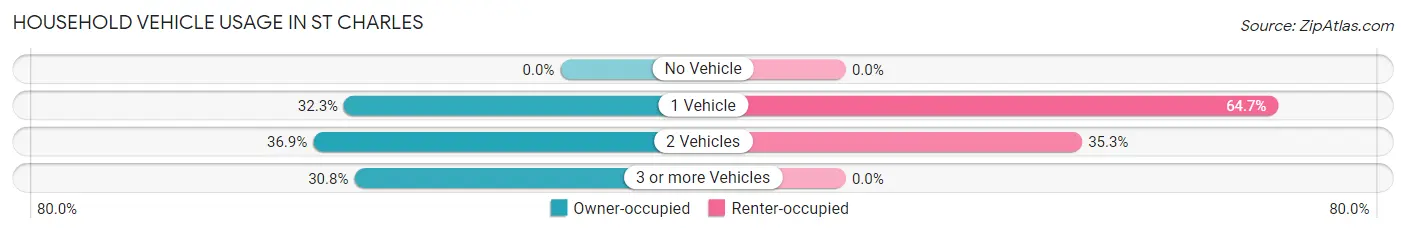
| Vehicles per Household | Owner-occupied | Renter-occupied |
| No Vehicle | 0 (0.0%) | 0 (0.0%) |
| 1 Vehicle | 21 (32.3%) | 11 (64.7%) |
| 2 Vehicles | 24 (36.9%) | 6 (35.3%) |
| 3 or more Vehicles | 20 (30.8%) | 0 (0.0%) |
| Total | 65 (100.0%) | 17 (100.0%) |
Real Estate & Mortgages in St Charles
Real Estate and Mortgage Overview in St Charles
| Characteristic | Without Mortgage | With Mortgage |
| Housing Units | 43 | 22 |
| Median Property Value | $86,300 | $146,400 |
| Median Household Income | $50,625 | $8 |
| Monthly Housing Costs | $375 | $0 |
| Real Estate Taxes | $370 | $0 |
Property Value by Mortgage Status in St Charles
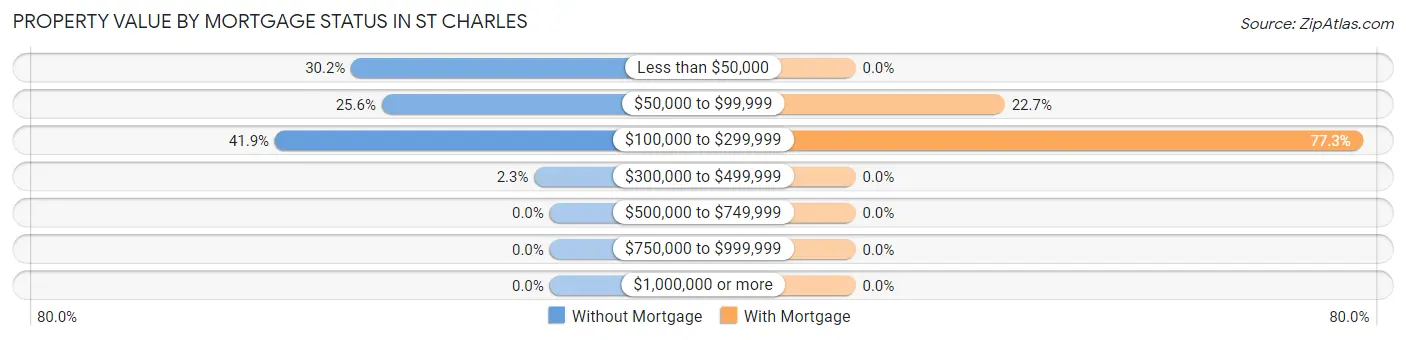
| Property Value | Without Mortgage | With Mortgage |
| Less than $50,000 | 13 (30.2%) | 0 (0.0%) |
| $50,000 to $99,999 | 11 (25.6%) | 5 (22.7%) |
| $100,000 to $299,999 | 18 (41.9%) | 17 (77.3%) |
| $300,000 to $499,999 | 1 (2.3%) | 0 (0.0%) |
| $500,000 to $749,999 | 0 (0.0%) | 0 (0.0%) |
| $750,000 to $999,999 | 0 (0.0%) | 0 (0.0%) |
| $1,000,000 or more | 0 (0.0%) | 0 (0.0%) |
| Total | 43 (100.0%) | 22 (100.0%) |
Household Income by Mortgage Status in St Charles
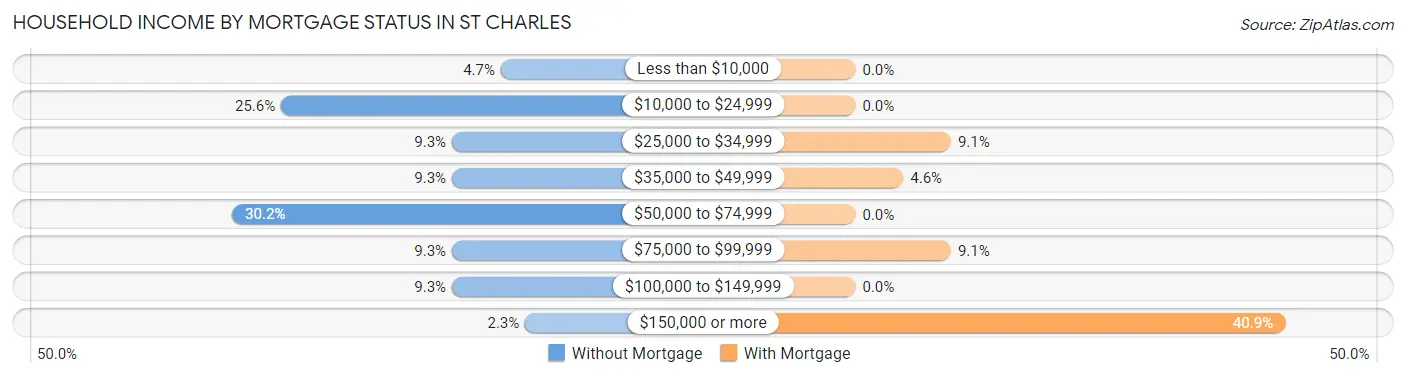
| Household Income | Without Mortgage | With Mortgage |
| Less than $10,000 | 2 (4.6%) | 0 (0.0%) |
| $10,000 to $24,999 | 11 (25.6%) | 0 (0.0%) |
| $25,000 to $34,999 | 4 (9.3%) | 2 (9.1%) |
| $35,000 to $49,999 | 4 (9.3%) | 1 (4.5%) |
| $50,000 to $74,999 | 13 (30.2%) | 0 (0.0%) |
| $75,000 to $99,999 | 4 (9.3%) | 2 (9.1%) |
| $100,000 to $149,999 | 4 (9.3%) | 0 (0.0%) |
| $150,000 or more | 1 (2.3%) | 9 (40.9%) |
| Total | 43 (100.0%) | 22 (100.0%) |
Property Value to Household Income Ratio in St Charles
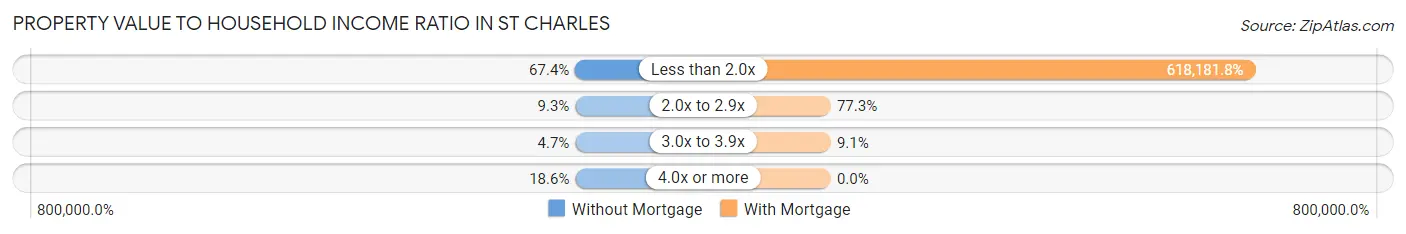
| Value-to-Income Ratio | Without Mortgage | With Mortgage |
| Less than 2.0x | 29 (67.4%) | 136,000 (618,181.8%) |
| 2.0x to 2.9x | 4 (9.3%) | 17 (77.3%) |
| 3.0x to 3.9x | 2 (4.6%) | 2 (9.1%) |
| 4.0x or more | 8 (18.6%) | 0 (0.0%) |
| Total | 43 (100.0%) | 22 (100.0%) |
Real Estate Taxes by Mortgage Status in St Charles
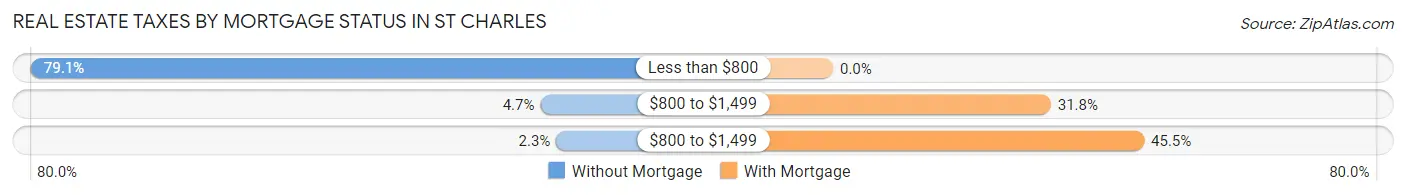
| Property Taxes | Without Mortgage | With Mortgage |
| Less than $800 | 34 (79.1%) | 0 (0.0%) |
| $800 to $1,499 | 2 (4.6%) | 7 (31.8%) |
| $800 to $1,499 | 1 (2.3%) | 10 (45.5%) |
| Total | 43 (100.0%) | 22 (100.0%) |
Health & Disability in St Charles
Health Insurance Coverage by Age in St Charles
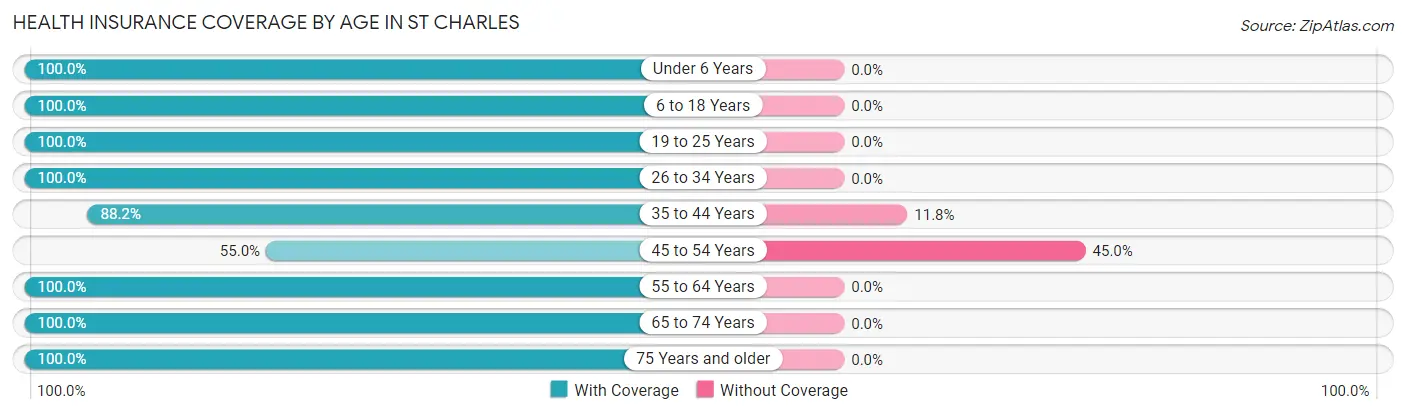
| Age Bracket | With Coverage | Without Coverage |
| Under 6 Years | 21 (100.0%) | 0 (0.0%) |
| 6 to 18 Years | 89 (100.0%) | 0 (0.0%) |
| 19 to 25 Years | 7 (100.0%) | 0 (0.0%) |
| 26 to 34 Years | 16 (100.0%) | 0 (0.0%) |
| 35 to 44 Years | 15 (88.2%) | 2 (11.8%) |
| 45 to 54 Years | 22 (55.0%) | 18 (45.0%) |
| 55 to 64 Years | 39 (100.0%) | 0 (0.0%) |
| 65 to 74 Years | 21 (100.0%) | 0 (0.0%) |
| 75 Years and older | 20 (100.0%) | 0 (0.0%) |
| Total | 250 (92.6%) | 20 (7.4%) |
Health Insurance Coverage by Citizenship Status in St Charles
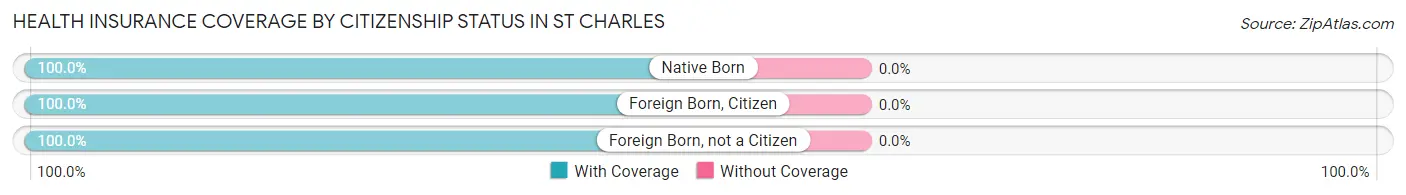
| Citizenship Status | With Coverage | Without Coverage |
| Native Born | 21 (100.0%) | 0 (0.0%) |
| Foreign Born, Citizen | 89 (100.0%) | 0 (0.0%) |
| Foreign Born, not a Citizen | 7 (100.0%) | 0 (0.0%) |
Health Insurance Coverage by Household Income in St Charles
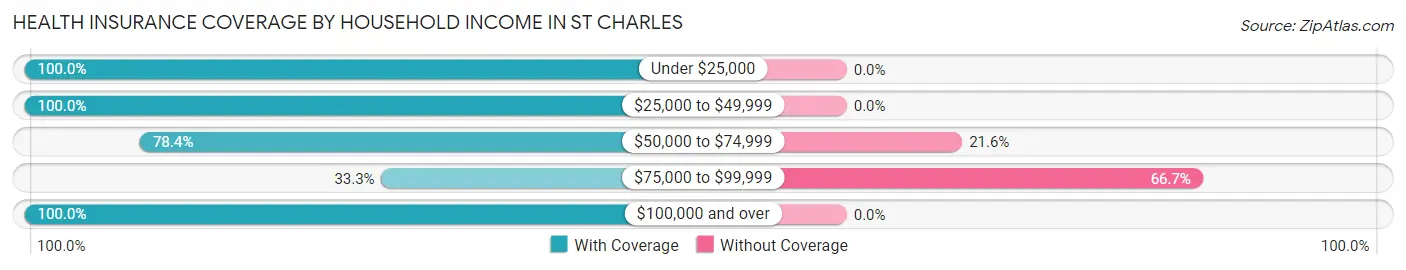
| Household Income | With Coverage | Without Coverage |
| Under $25,000 | 35 (100.0%) | 0 (0.0%) |
| $25,000 to $49,999 | 47 (100.0%) | 0 (0.0%) |
| $50,000 to $74,999 | 58 (78.4%) | 16 (21.6%) |
| $75,000 to $99,999 | 2 (33.3%) | 4 (66.7%) |
| $100,000 and over | 108 (100.0%) | 0 (0.0%) |
Public vs Private Health Insurance Coverage by Age in St Charles
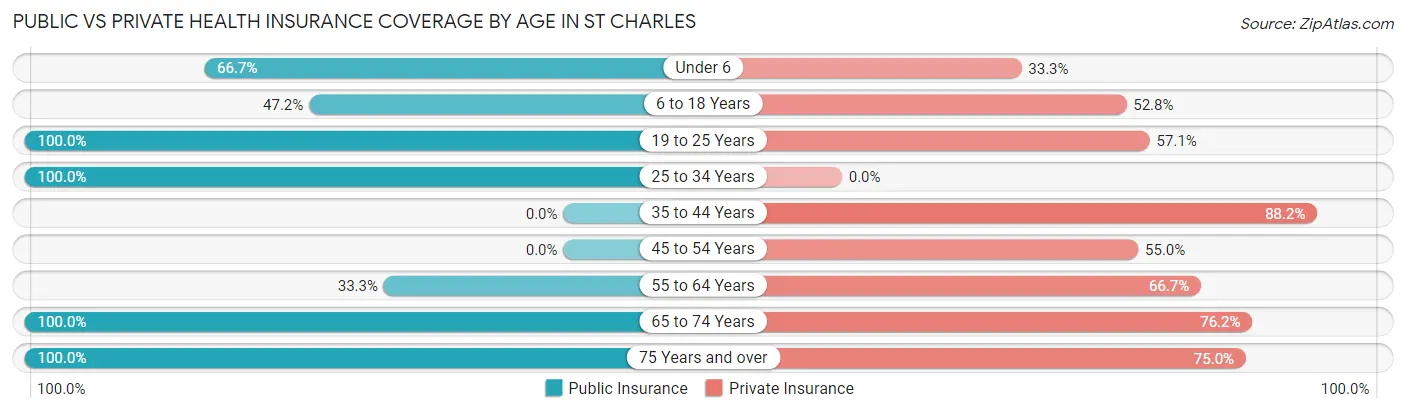
| Age Bracket | Public Insurance | Private Insurance |
| Under 6 | 14 (66.7%) | 7 (33.3%) |
| 6 to 18 Years | 42 (47.2%) | 47 (52.8%) |
| 19 to 25 Years | 7 (100.0%) | 4 (57.1%) |
| 25 to 34 Years | 16 (100.0%) | 0 (0.0%) |
| 35 to 44 Years | 0 (0.0%) | 15 (88.2%) |
| 45 to 54 Years | 0 (0.0%) | 22 (55.0%) |
| 55 to 64 Years | 13 (33.3%) | 26 (66.7%) |
| 65 to 74 Years | 21 (100.0%) | 16 (76.2%) |
| 75 Years and over | 20 (100.0%) | 15 (75.0%) |
| Total | 133 (49.3%) | 152 (56.3%) |
Disability Status by Sex by Age in St Charles
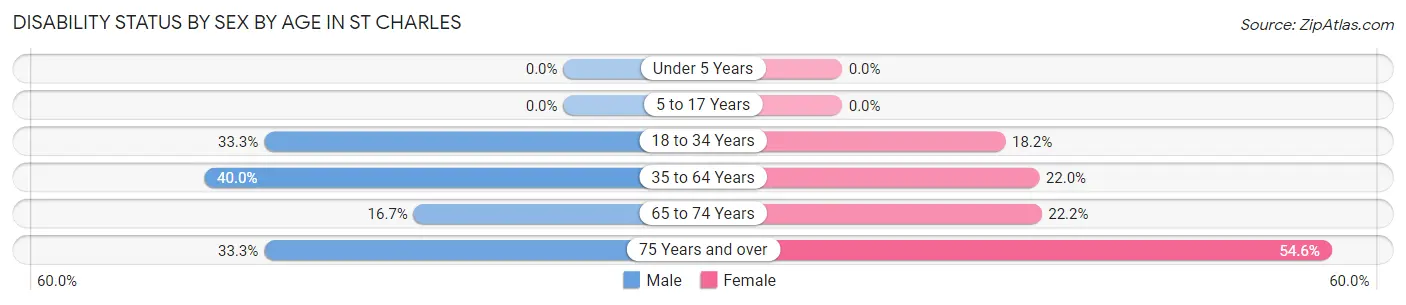
| Age Bracket | Male | Female |
| Under 5 Years | 0 (0.0%) | 0 (0.0%) |
| 5 to 17 Years | 0 (0.0%) | 0 (0.0%) |
| 18 to 34 Years | 3 (33.3%) | 4 (18.2%) |
| 35 to 64 Years | 22 (40.0%) | 9 (22.0%) |
| 65 to 74 Years | 2 (16.7%) | 2 (22.2%) |
| 75 Years and over | 3 (33.3%) | 6 (54.5%) |
Disability Class by Sex by Age in St Charles
Disability Class: Hearing Difficulty
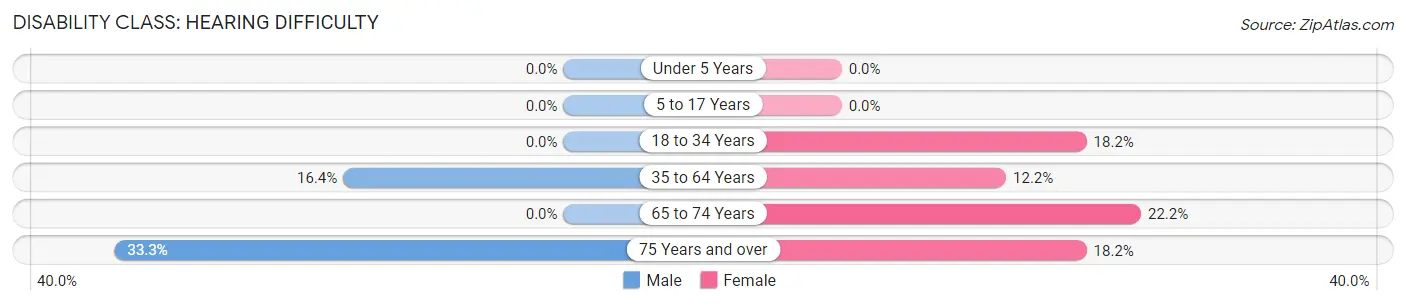
| Age Bracket | Male | Female |
| Under 5 Years | 0 (0.0%) | 0 (0.0%) |
| 5 to 17 Years | 0 (0.0%) | 0 (0.0%) |
| 18 to 34 Years | 0 (0.0%) | 4 (18.2%) |
| 35 to 64 Years | 9 (16.4%) | 5 (12.2%) |
| 65 to 74 Years | 0 (0.0%) | 2 (22.2%) |
| 75 Years and over | 3 (33.3%) | 2 (18.2%) |
Disability Class: Vision Difficulty
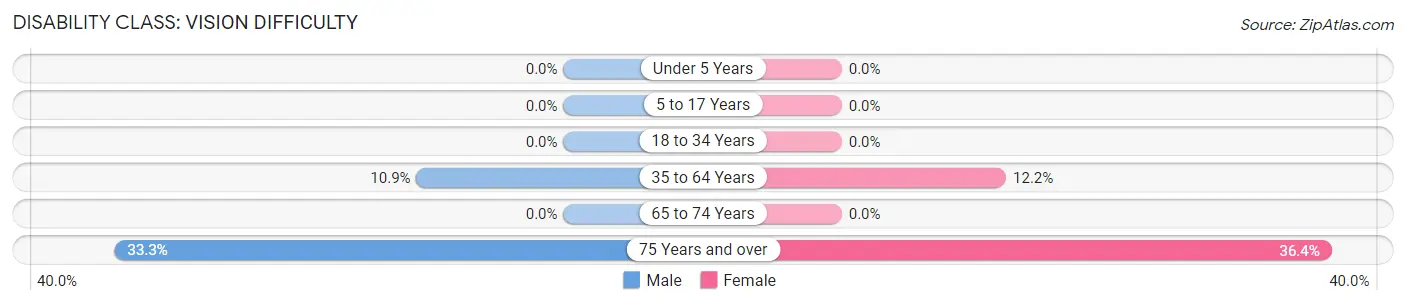
| Age Bracket | Male | Female |
| Under 5 Years | 0 (0.0%) | 0 (0.0%) |
| 5 to 17 Years | 0 (0.0%) | 0 (0.0%) |
| 18 to 34 Years | 0 (0.0%) | 0 (0.0%) |
| 35 to 64 Years | 6 (10.9%) | 5 (12.2%) |
| 65 to 74 Years | 0 (0.0%) | 0 (0.0%) |
| 75 Years and over | 3 (33.3%) | 4 (36.4%) |
Disability Class: Cognitive Difficulty
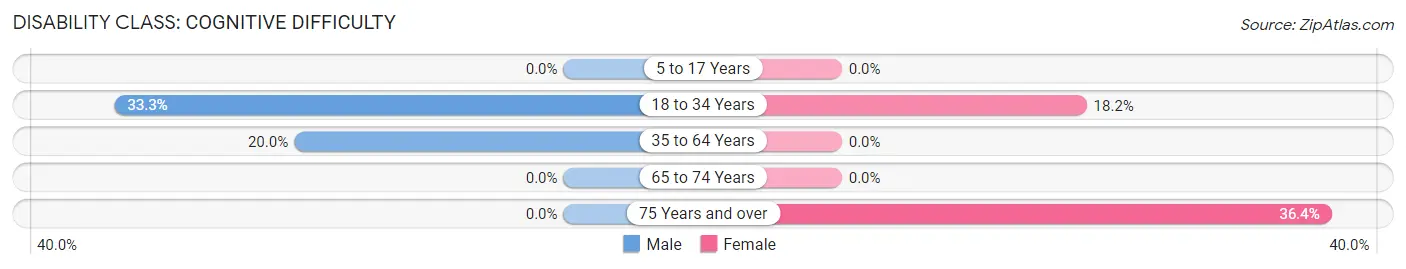
| Age Bracket | Male | Female |
| 5 to 17 Years | 0 (0.0%) | 0 (0.0%) |
| 18 to 34 Years | 3 (33.3%) | 4 (18.2%) |
| 35 to 64 Years | 11 (20.0%) | 0 (0.0%) |
| 65 to 74 Years | 0 (0.0%) | 0 (0.0%) |
| 75 Years and over | 0 (0.0%) | 4 (36.4%) |
Disability Class: Ambulatory Difficulty
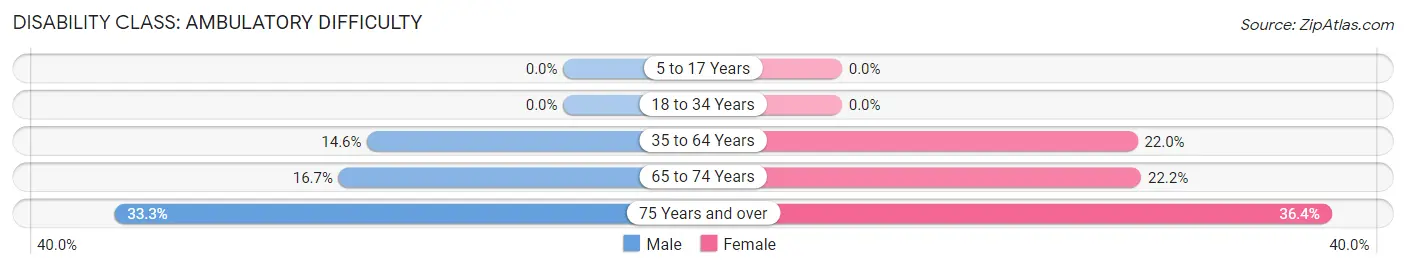
| Age Bracket | Male | Female |
| 5 to 17 Years | 0 (0.0%) | 0 (0.0%) |
| 18 to 34 Years | 0 (0.0%) | 0 (0.0%) |
| 35 to 64 Years | 8 (14.5%) | 9 (22.0%) |
| 65 to 74 Years | 2 (16.7%) | 2 (22.2%) |
| 75 Years and over | 3 (33.3%) | 4 (36.4%) |
Disability Class: Self-Care Difficulty
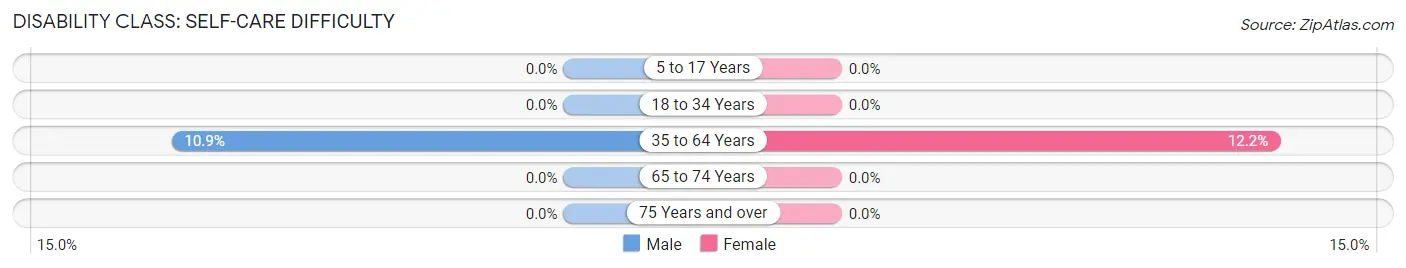
| Age Bracket | Male | Female |
| 5 to 17 Years | 0 (0.0%) | 0 (0.0%) |
| 18 to 34 Years | 0 (0.0%) | 0 (0.0%) |
| 35 to 64 Years | 6 (10.9%) | 5 (12.2%) |
| 65 to 74 Years | 0 (0.0%) | 0 (0.0%) |
| 75 Years and over | 0 (0.0%) | 0 (0.0%) |
Technology Access in St Charles
Computing Device Access in St Charles
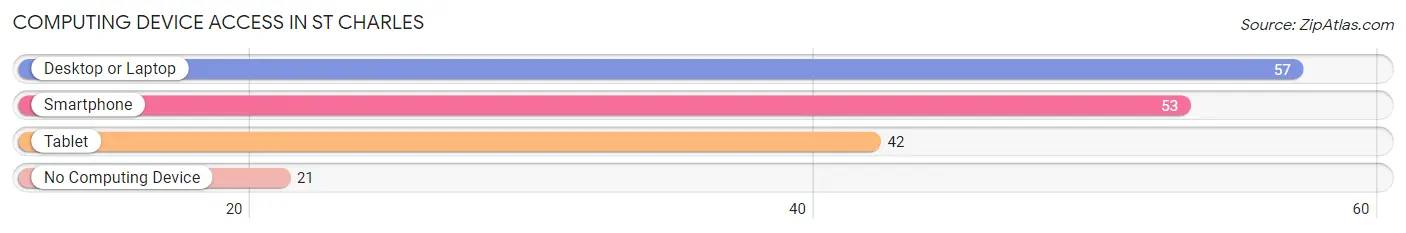
| Device Type | # Households | % Households |
| Desktop or Laptop | 57 | 69.5% |
| Smartphone | 53 | 64.6% |
| Tablet | 42 | 51.2% |
| No Computing Device | 21 | 25.6% |
| Total | 82 | 100.0% |
Internet Access in St Charles
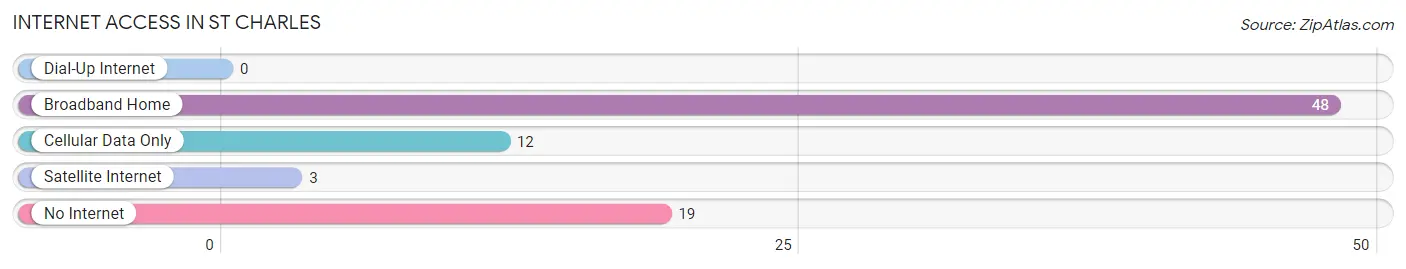
| Internet Type | # Households | % Households |
| Dial-Up Internet | 0 | 0.0% |
| Broadband Home | 48 | 58.5% |
| Cellular Data Only | 12 | 14.6% |
| Satellite Internet | 3 | 3.7% |
| No Internet | 19 | 23.2% |
| Total | 82 | 100.0% |
St Charles Summary
St. Charles is a small town located in the Arkansas Delta region of Arkansas. It is situated in the southeastern corner of the state, about 30 miles south of Little Rock. The town is part of the St. Francis County and is home to a population of just over 1,000 people.
History
St. Charles was founded in 1871 by a group of settlers from the nearby town of St. Francis. The town was named after the St. Charles River, which runs through the area. The town was originally a farming community, but it soon became a center for timber and cotton production. The town was incorporated in 1883 and the first post office was established in 1884.
In the early 1900s, St. Charles began to experience a period of growth and development. The town was connected to the railroad in 1906, which allowed for the transportation of goods and services to and from the town. The town also saw the construction of a number of businesses, including a cotton gin, a sawmill, and a gristmill.
Geography
St. Charles is located in the Arkansas Delta region of Arkansas. The town is situated in the southeastern corner of the state, about 30 miles south of Little Rock. The town is part of the St. Francis County and is home to a population of just over 1,000 people.
The town is located on the banks of the St. Charles River, which runs through the area. The town is surrounded by a number of small towns and villages, including St. Francis, Forrest City, and Wynne. The town is also located near the St. Francis National Forest, which is a popular destination for outdoor recreation.
Economy
The economy of St. Charles is largely based on agriculture and timber production. The town is home to a number of farms and ranches, which produce a variety of crops, including cotton, soybeans, corn, and wheat. The town is also home to a number of timber companies, which harvest and process timber for use in construction and other industries.
The town is also home to a number of small businesses, including restaurants, retail stores, and service providers. The town is also home to a number of manufacturing companies, which produce a variety of products, including furniture, clothing, and electronics.
Demographics
As of the 2010 census, the population of St. Charles was 1,072. The town has a population that is predominantly white, with African Americans making up the second largest racial group. The town also has a small Hispanic population.
The median household income in St. Charles is $31,250, which is lower than the national average. The town also has a higher than average poverty rate, with nearly 20% of the population living below the poverty line. The town also has a higher than average unemployment rate, with nearly 10% of the population unemployed.
Common Questions
What is Per Capita Income in St Charles?
Per Capita income in St Charles is $23,987.
What is the Median Family Income in St Charles?
Median Family Income in St Charles is $62,396.
What is the Median Household income in St Charles?
Median Household Income in St Charles is $61,250.
What is Income or Wage Gap in St Charles?
Income or Wage Gap in St Charles is 32.2%.
Women in St Charles earn 67.8 cents for every dollar earned by a man.
What is Inequality or Gini Index in St Charles?
Inequality or Gini Index in St Charles is 0.39.
What is the Total Population of St Charles?
Total Population of St Charles is 270.
What is the Total Male Population of St Charles?
Total Male Population of St Charles is 164.
What is the Total Female Population of St Charles?
Total Female Population of St Charles is 106.
What is the Ratio of Males per 100 Females in St Charles?
There are 154.72 Males per 100 Females in St Charles.
What is the Ratio of Females per 100 Males in St Charles?
There are 64.63 Females per 100 Males in St Charles.
What is the Median Population Age in St Charles?
Median Population Age in St Charles is 36.5 Years.
What is the Average Family Size in St Charles
Average Family Size in St Charles is 4.2 People.
What is the Average Household Size in St Charles
Average Household Size in St Charles is 3.3 People.
How Large is the Labor Force in St Charles?
There are 84 People in the Labor Forcein in St Charles.
What is the Percentage of People in the Labor Force in St Charles?
50.0% of People are in the Labor Force in St Charles.
What is the Unemployment Rate in St Charles?
Unemployment Rate in St Charles is 7.1%.