Zip Codes with the Highest Percentage of Population with a Degree in Visual and Performing Arts in Conway, AR
RELATED REPORTS & OPTIONS
Visual and Performing Arts
Conway
Compare Zip Codes
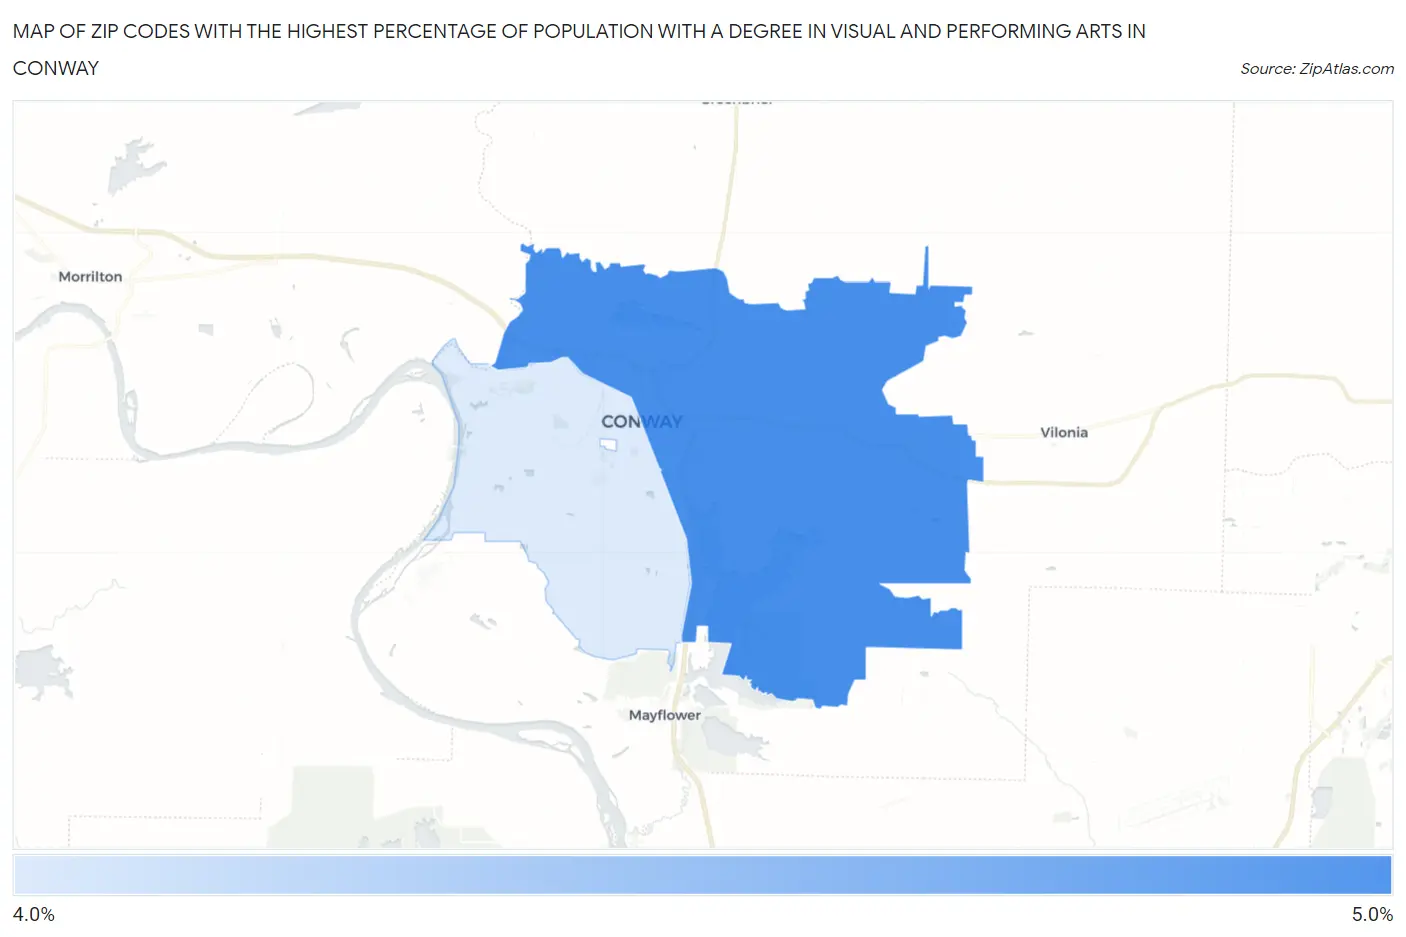
Map of Zip Codes with the Highest Percentage of Population with a Degree in Visual and Performing Arts in Conway
4.5%
4.8%
Zip Codes with the Highest Percentage of Population with a Degree in Visual and Performing Arts in Conway, AR
| Zip Code | % Graduates | vs State | vs National | |
| 1. | 72032 | 4.8% | 3.1%(+1.73)#74 | 4.3%(+0.552)#7,063 |
| 2. | 72034 | 4.5% | 3.1%(+1.43)#84 | 4.3%(+0.247)#7,816 |
1
Common Questions
What are the Top Zip Codes with the Highest Percentage of Population with a Degree in Visual and Performing Arts in Conway, AR?
Top Zip Codes with the Highest Percentage of Population with a Degree in Visual and Performing Arts in Conway, AR are:
What zip code has the Highest Percentage of Population with a Degree in Visual and Performing Arts in Conway, AR?
72032 has the Highest Percentage of Population with a Degree in Visual and Performing Arts in Conway, AR with 4.8%.
What is the Percentage of Population with a Degree in Visual and Performing Arts in Conway, AR?
Percentage of Population with a Degree in Visual and Performing Arts in Conway is 4.8%.
What is the Percentage of Population with a Degree in Visual and Performing Arts in Arkansas?
Percentage of Population with a Degree in Visual and Performing Arts in Arkansas is 3.1%.
What is the Percentage of Population with a Degree in Visual and Performing Arts in the United States?
Percentage of Population with a Degree in Visual and Performing Arts in the United States is 4.3%.