Holiday Island, AR Map & Demographics
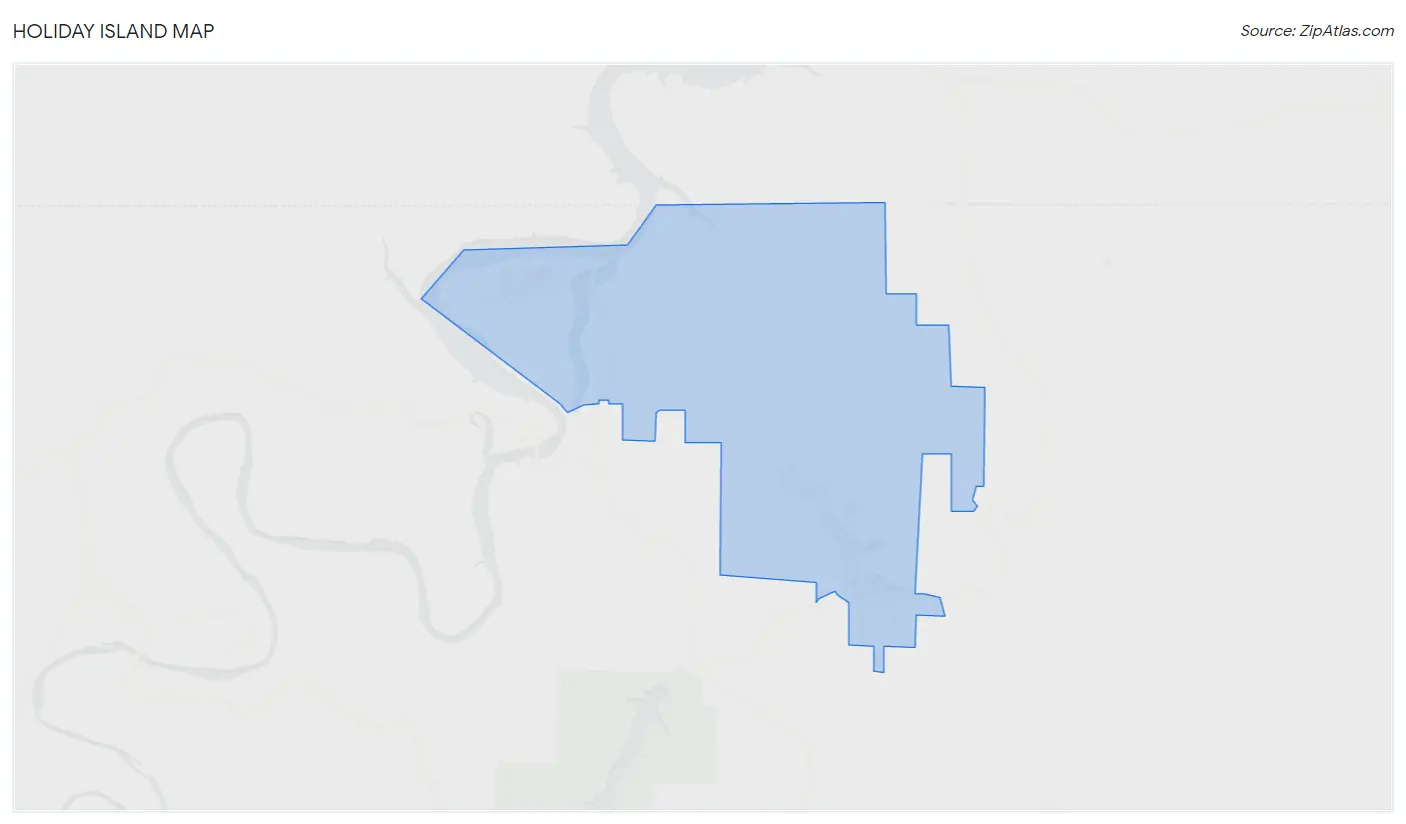
Holiday Island Map
Holiday Island Overview
$31,522
PER CAPITA INCOME
$71,806
AVG FAMILY INCOME
$51,938
AVG HOUSEHOLD INCOME
33.1%
WAGE / INCOME GAP [ % ]
66.9¢/ $1
WAGE / INCOME GAP [ $ ]
0.38
INEQUALITY / GINI INDEX
2,358
TOTAL POPULATION
1,288
MALE POPULATION
1,070
FEMALE POPULATION
120.37
MALES / 100 FEMALES
83.07
FEMALES / 100 MALES
63.4
MEDIAN AGE
2.5
AVG FAMILY SIZE
1.9
AVG HOUSEHOLD SIZE
1,014
LABOR FORCE [ PEOPLE ]
45.8%
PERCENT IN LABOR FORCE
3.7%
UNEMPLOYMENT RATE
Holiday Island Area Codes
Income in Holiday Island
Income Overview in Holiday Island
Per Capita Income in Holiday Island is $31,522, while median incomes of families and households are $71,806 and $51,938 respectively.
| Characteristic | Number | Measure |
| Per Capita Income | 2,358 | $31,522 |
| Median Family Income | 685 | $71,806 |
| Mean Family Income | 685 | $81,941 |
| Median Household Income | 1,199 | $51,938 |
| Mean Household Income | 1,199 | $60,540 |
| Income Deficit | 685 | $0 |
| Wage / Income Gap (%) | 2,358 | 33.08% |
| Wage / Income Gap ($) | 2,358 | 66.92¢ per $1 |
| Gini / Inequality Index | 2,358 | 0.38 |
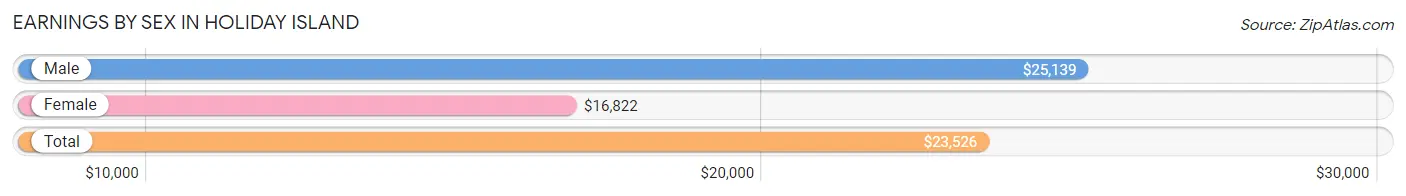
Earnings by Sex in Holiday Island
Average Earnings in Holiday Island are $23,526, $25,139 for men and $16,822 for women, a difference of 33.1%.
| Sex | Number | Average Earnings |
| Male | 664 (58.1%) | $25,139 |
| Female | 478 (41.9%) | $16,822 |
| Total | 1,142 (100.0%) | $23,526 |
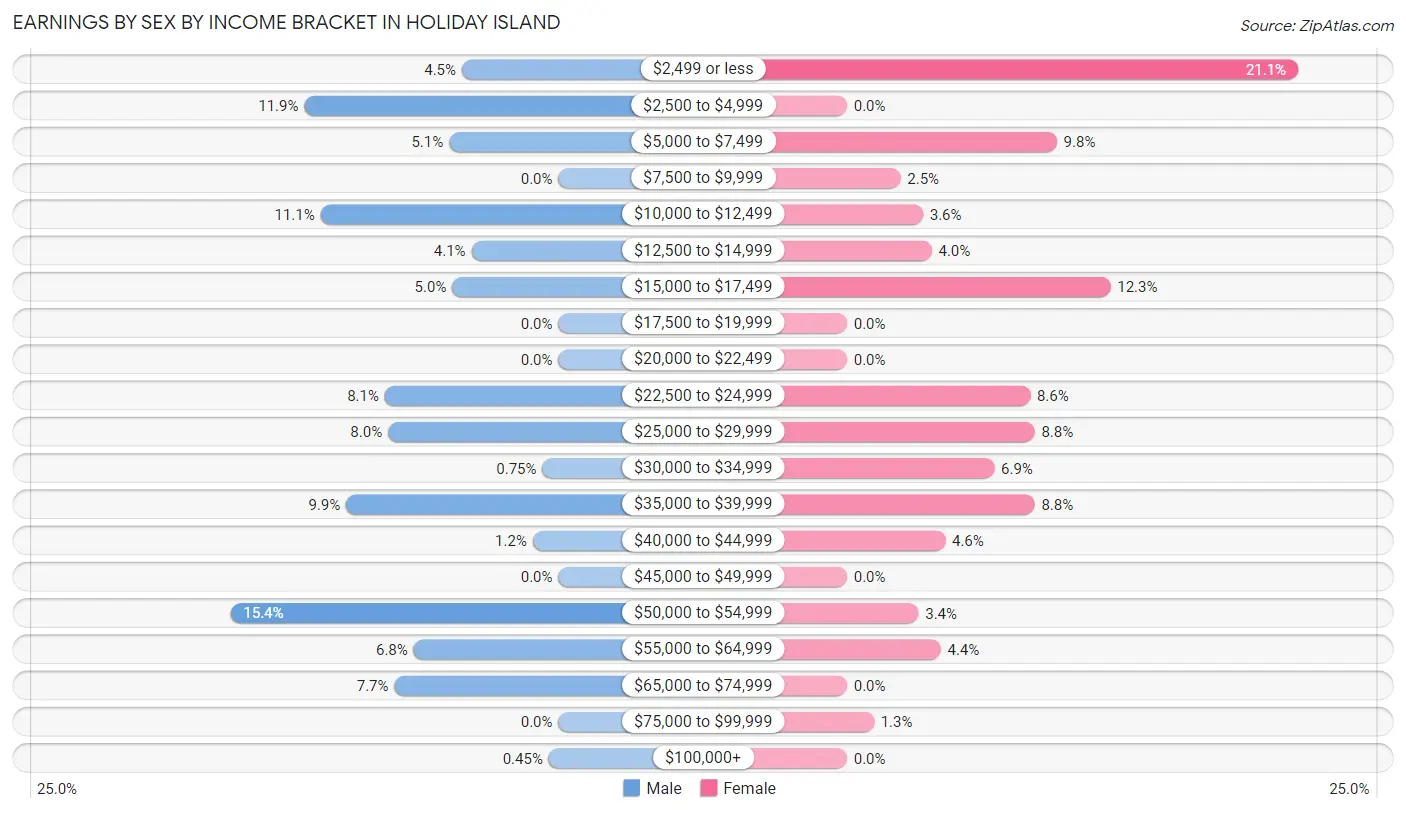
Earnings by Sex by Income Bracket in Holiday Island
The most common earnings brackets in Holiday Island are $50,000 to $54,999 for men (102 | 15.4%) and $2,499 or less for women (101 | 21.1%).
| Income | Male | Female |
| $2,499 or less | 30 (4.5%) | 101 (21.1%) |
| $2,500 to $4,999 | 79 (11.9%) | 0 (0.0%) |
| $5,000 to $7,499 | 34 (5.1%) | 47 (9.8%) |
| $7,500 to $9,999 | 0 (0.0%) | 12 (2.5%) |
| $10,000 to $12,499 | 74 (11.1%) | 17 (3.6%) |
| $12,500 to $14,999 | 27 (4.1%) | 19 (4.0%) |
| $15,000 to $17,499 | 33 (5.0%) | 59 (12.3%) |
| $17,500 to $19,999 | 0 (0.0%) | 0 (0.0%) |
| $20,000 to $22,499 | 0 (0.0%) | 0 (0.0%) |
| $22,500 to $24,999 | 54 (8.1%) | 41 (8.6%) |
| $25,000 to $29,999 | 53 (8.0%) | 42 (8.8%) |
| $30,000 to $34,999 | 5 (0.7%) | 33 (6.9%) |
| $35,000 to $39,999 | 66 (9.9%) | 42 (8.8%) |
| $40,000 to $44,999 | 8 (1.2%) | 22 (4.6%) |
| $45,000 to $49,999 | 0 (0.0%) | 0 (0.0%) |
| $50,000 to $54,999 | 102 (15.4%) | 16 (3.4%) |
| $55,000 to $64,999 | 45 (6.8%) | 21 (4.4%) |
| $65,000 to $74,999 | 51 (7.7%) | 0 (0.0%) |
| $75,000 to $99,999 | 0 (0.0%) | 6 (1.3%) |
| $100,000+ | 3 (0.4%) | 0 (0.0%) |
| Total | 664 (100.0%) | 478 (100.0%) |
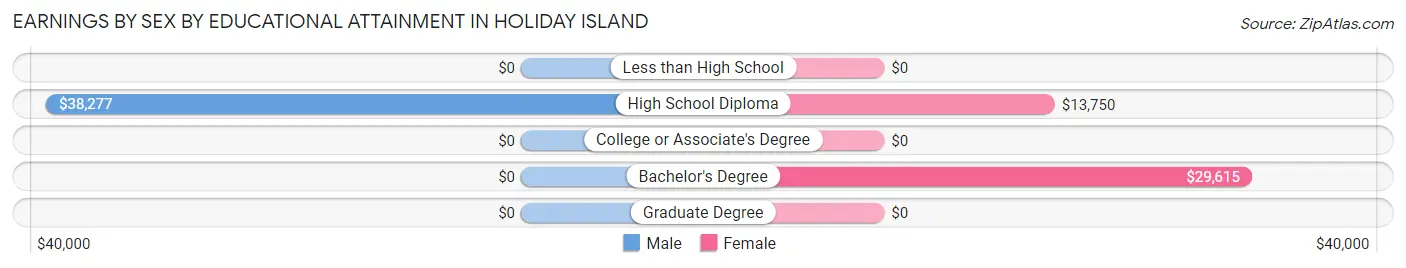
Earnings by Sex by Educational Attainment in Holiday Island
Average earnings in Holiday Island are $38,277 for men and $15,445 for women, a difference of 59.7%. Men with an educational attainment of high school diploma enjoy the highest average annual earnings of $38,277, while those with high school diploma education earn the least with $38,277. Women with an educational attainment of bachelor's degree earn the most with the average annual earnings of $29,615, while those with high school diploma education have the smallest earnings of $13,750.
| Educational Attainment | Male Income | Female Income |
| Less than High School | - | - |
| High School Diploma | $38,277 | $13,750 |
| College or Associate's Degree | - | - |
| Bachelor's Degree | - | - |
| Graduate Degree | - | - |
| Total | $38,277 | $15,445 |
Family Income in Holiday Island
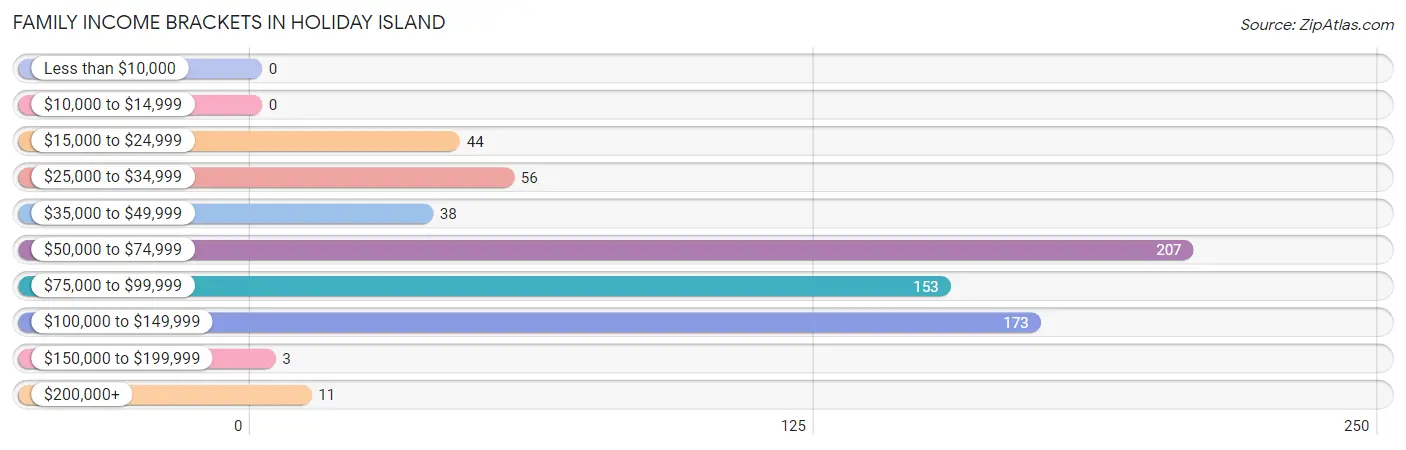
Family Income Brackets in Holiday Island
According to the Holiday Island family income data, there are 207 families falling into the $50,000 to $74,999 income range, which is the most common income bracket and makes up 30.2% of all families.
| Income Bracket | # Families | % Families |
| Less than $10,000 | 0 | 0.0% |
| $10,000 to $14,999 | 0 | 0.0% |
| $15,000 to $24,999 | 44 | 6.4% |
| $25,000 to $34,999 | 56 | 8.2% |
| $35,000 to $49,999 | 38 | 5.5% |
| $50,000 to $74,999 | 207 | 30.2% |
| $75,000 to $99,999 | 153 | 22.3% |
| $100,000 to $149,999 | 173 | 25.3% |
| $150,000 to $199,999 | 3 | 0.4% |
| $200,000+ | 11 | 1.6% |
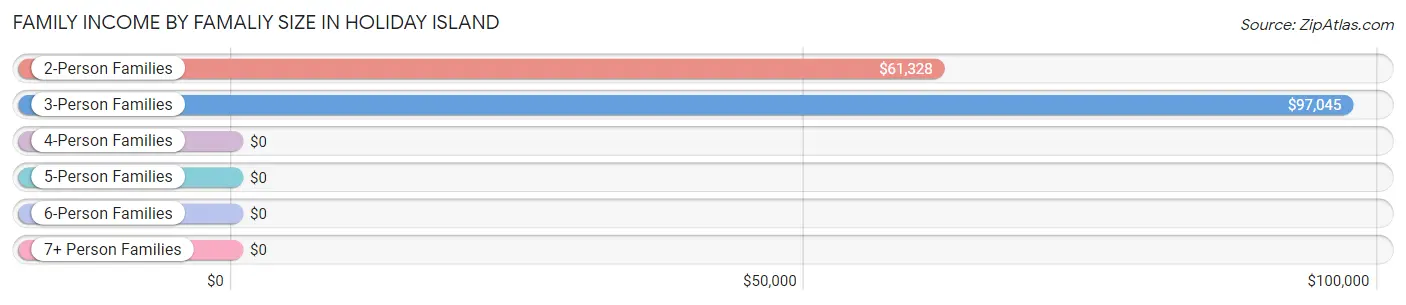
Family Income by Famaliy Size in Holiday Island
3-person families (68 | 9.9%) account for the highest median family income in Holiday Island with $97,045 per family, while 3-person families (68 | 9.9%) have the highest median income of $32,348 per family member.
| Income Bracket | # Families | Median Income |
| 2-Person Families | 508 (74.2%) | $61,328 |
| 3-Person Families | 68 (9.9%) | $97,045 |
| 4-Person Families | 38 (5.6%) | $0 |
| 5-Person Families | 71 (10.4%) | $0 |
| 6-Person Families | 0 (0.0%) | $0 |
| 7+ Person Families | 0 (0.0%) | $0 |
| Total | 685 (100.0%) | $71,806 |
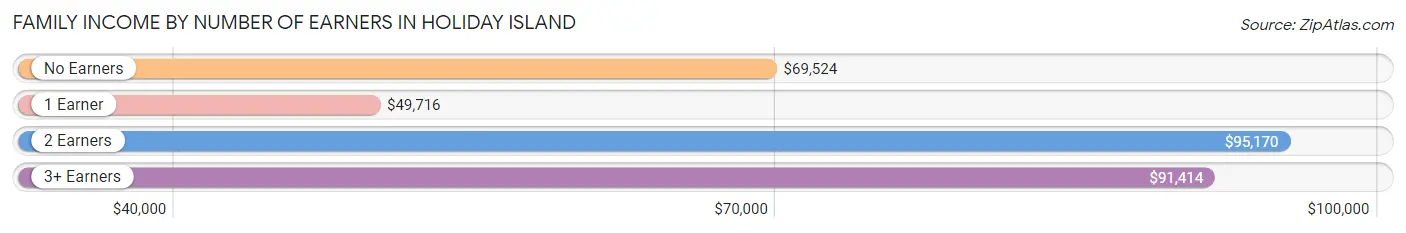
Family Income by Number of Earners in Holiday Island
The median family income in Holiday Island is $71,806, with families comprising 2 earners (175) having the highest median family income of $95,170, while families with 1 earner (159) have the lowest median family income of $49,716, accounting for 25.6% and 23.2% of families, respectively.
| Number of Earners | # Families | Median Income |
| No Earners | 294 (42.9%) | $69,524 |
| 1 Earner | 159 (23.2%) | $49,716 |
| 2 Earners | 175 (25.6%) | $95,170 |
| 3+ Earners | 57 (8.3%) | $91,414 |
| Total | 685 (100.0%) | $71,806 |
Household Income in Holiday Island
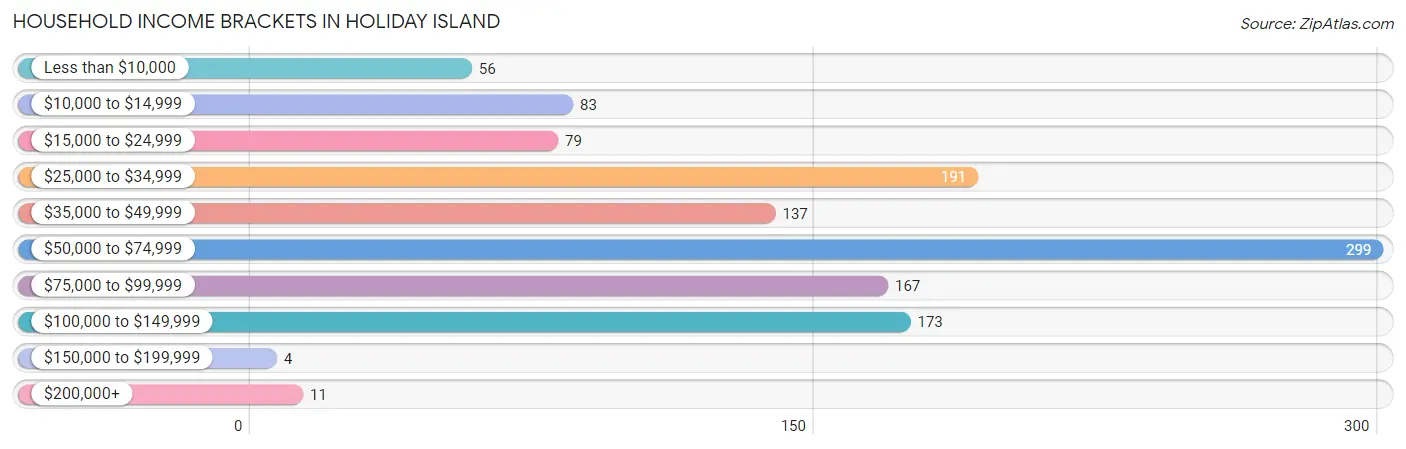
Household Income Brackets in Holiday Island
With 299 households falling in the category, the $50,000 to $74,999 income range is the most frequent in Holiday Island, accounting for 24.9% of all households. In contrast, only 4 households (0.3%) fall into the $150,000 to $199,999 income bracket, making it the least populous group.
| Income Bracket | # Households | % Households |
| Less than $10,000 | 56 | 4.7% |
| $10,000 to $14,999 | 83 | 6.9% |
| $15,000 to $24,999 | 79 | 6.6% |
| $25,000 to $34,999 | 191 | 15.9% |
| $35,000 to $49,999 | 137 | 11.4% |
| $50,000 to $74,999 | 299 | 24.9% |
| $75,000 to $99,999 | 167 | 13.9% |
| $100,000 to $149,999 | 173 | 14.4% |
| $150,000 to $199,999 | 4 | 0.3% |
| $200,000+ | 11 | 0.9% |
Household Income by Householder Age in Holiday Island
The median household income in Holiday Island is $51,938, with the highest median household income of $67,713 found in the 45 to 64 years age bracket for the primary householder. A total of 367 households (30.6%) fall into this category. Meanwhile, the 25 to 44 years age bracket for the primary householder has the lowest median household income of $0, with 51 households (4.3%) in this group.
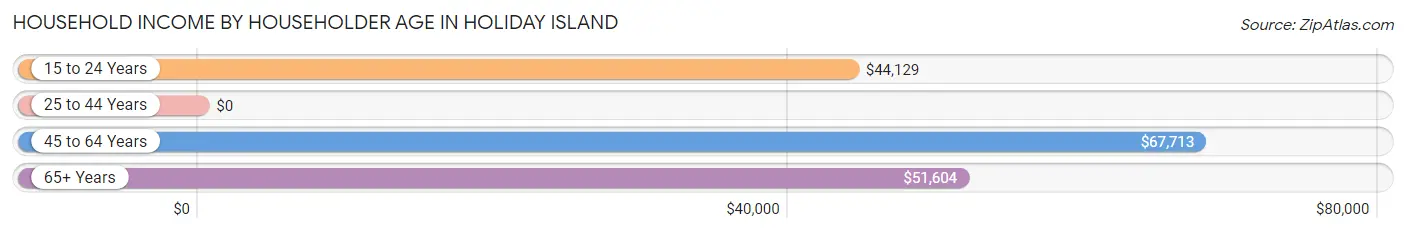
| Income Bracket | # Households | Median Income |
| 15 to 24 Years | 105 (8.8%) | $44,129 |
| 25 to 44 Years | 51 (4.3%) | $0 |
| 45 to 64 Years | 367 (30.6%) | $67,713 |
| 65+ Years | 676 (56.4%) | $51,604 |
| Total | 1,199 (100.0%) | $51,938 |
Poverty in Holiday Island
Income Below Poverty by Sex and Age in Holiday Island
With 3.5% poverty level for males and 6.2% for females among the residents of Holiday Island, 18 to 24 year old males and 45 to 54 year old females are the most vulnerable to poverty, with 13 males (8.3%) and 30 females (27.5%) in their respective age groups living below the poverty level.
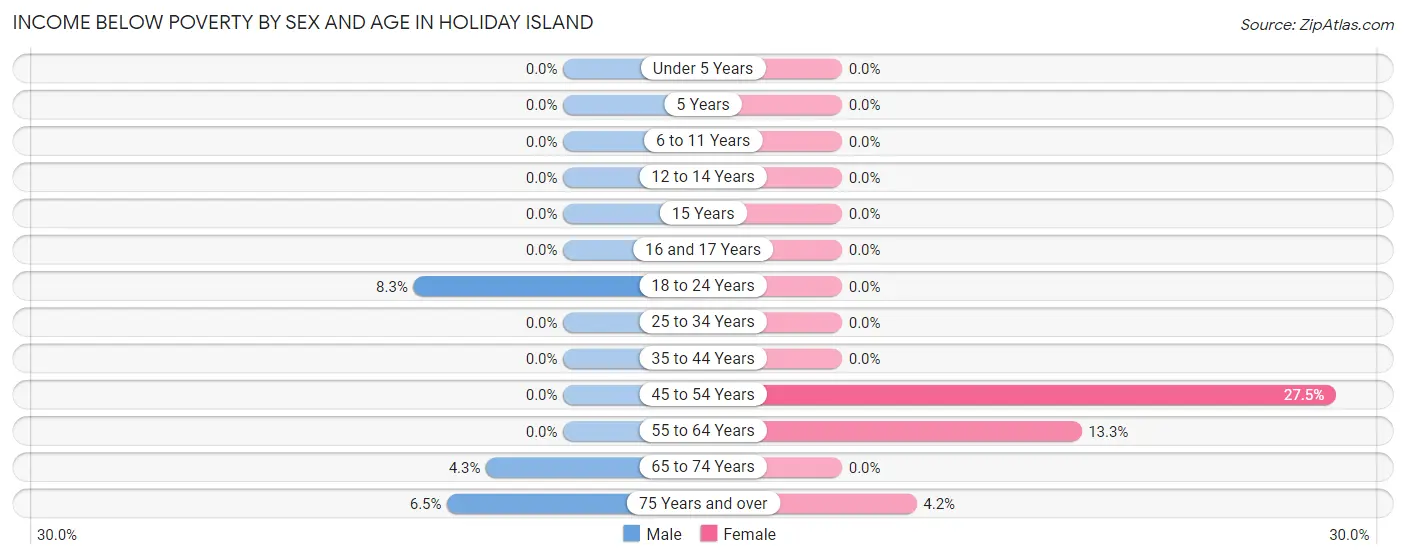
| Age Bracket | Male | Female |
| Under 5 Years | 0 (0.0%) | 0 (0.0%) |
| 5 Years | 0 (0.0%) | 0 (0.0%) |
| 6 to 11 Years | 0 (0.0%) | 0 (0.0%) |
| 12 to 14 Years | 0 (0.0%) | 0 (0.0%) |
| 15 Years | 0 (0.0%) | 0 (0.0%) |
| 16 and 17 Years | 0 (0.0%) | 0 (0.0%) |
| 18 to 24 Years | 13 (8.3%) | 0 (0.0%) |
| 25 to 34 Years | 0 (0.0%) | 0 (0.0%) |
| 35 to 44 Years | 0 (0.0%) | 0 (0.0%) |
| 45 to 54 Years | 0 (0.0%) | 30 (27.5%) |
| 55 to 64 Years | 0 (0.0%) | 26 (13.3%) |
| 65 to 74 Years | 13 (4.3%) | 0 (0.0%) |
| 75 Years and over | 19 (6.5%) | 9 (4.2%) |
| Total | 45 (3.5%) | 65 (6.2%) |
Income Above Poverty by Sex and Age in Holiday Island
According to the poverty statistics in Holiday Island, males aged under 5 years and females aged under 5 years are the age groups that are most secure financially, with 100.0% of males and 100.0% of females in these age groups living above the poverty line.
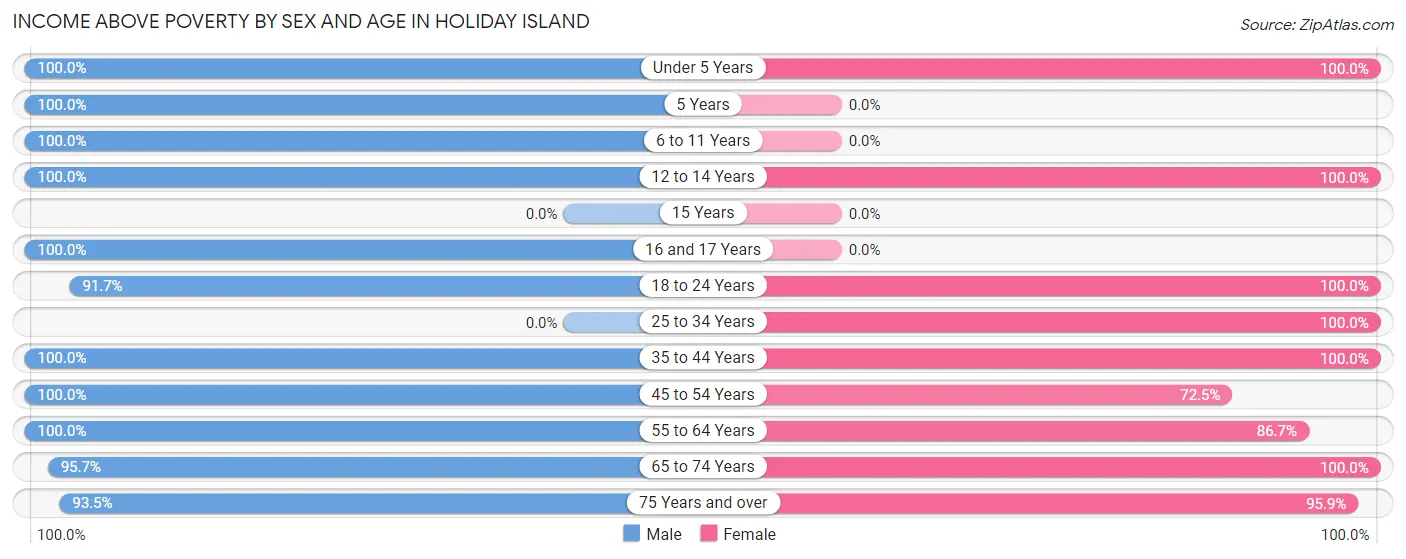
| Age Bracket | Male | Female |
| Under 5 Years | 8 (100.0%) | 34 (100.0%) |
| 5 Years | 15 (100.0%) | 0 (0.0%) |
| 6 to 11 Years | 17 (100.0%) | 0 (0.0%) |
| 12 to 14 Years | 61 (100.0%) | 9 (100.0%) |
| 15 Years | 0 (0.0%) | 0 (0.0%) |
| 16 and 17 Years | 59 (100.0%) | 0 (0.0%) |
| 18 to 24 Years | 143 (91.7%) | 75 (100.0%) |
| 25 to 34 Years | 0 (0.0%) | 87 (100.0%) |
| 35 to 44 Years | 65 (100.0%) | 61 (100.0%) |
| 45 to 54 Years | 108 (100.0%) | 79 (72.5%) |
| 55 to 64 Years | 202 (100.0%) | 169 (86.7%) |
| 65 to 74 Years | 290 (95.7%) | 262 (100.0%) |
| 75 Years and over | 275 (93.5%) | 208 (95.9%) |
| Total | 1,243 (96.5%) | 984 (93.8%) |
Income Below Poverty Among Married-Couple Families in Holiday Island
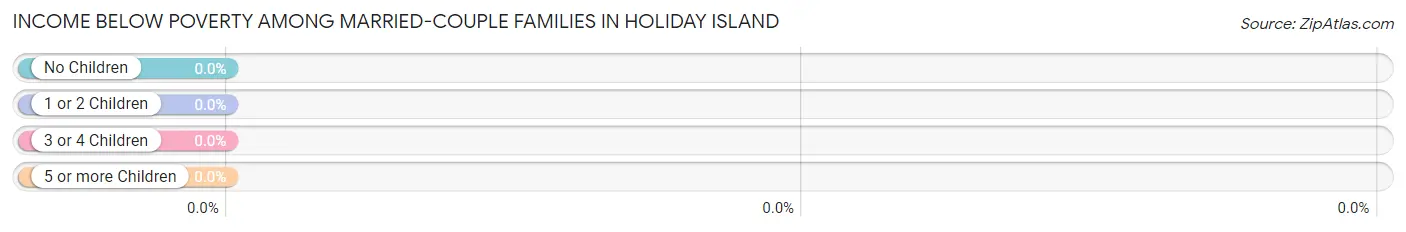
| Children | Above Poverty | Below Poverty |
| No Children | 477 (100.0%) | 0 (0.0%) |
| 1 or 2 Children | 149 (100.0%) | 0 (0.0%) |
| 3 or 4 Children | 0 (0.0%) | 0 (0.0%) |
| 5 or more Children | 0 (0.0%) | 0 (0.0%) |
| Total | 626 (100.0%) | 0 (0.0%) |
Income Below Poverty Among Single-Parent Households in Holiday Island
| Children | Single Father | Single Mother |
| No Children | 0 (0.0%) | 0 (0.0%) |
| 1 or 2 Children | 0 (0.0%) | 0 (0.0%) |
| 3 or 4 Children | 0 (0.0%) | 0 (0.0%) |
| 5 or more Children | 0 (0.0%) | 0 (0.0%) |
| Total | 0 (0.0%) | 0 (0.0%) |
Income Below Poverty Among Married-Couple vs Single-Parent Households in Holiday Island
| Children | Married-Couple Families | Single-Parent Households |
| No Children | 0 (0.0%) | 0 (0.0%) |
| 1 or 2 Children | 0 (0.0%) | 0 (0.0%) |
| 3 or 4 Children | 0 (0.0%) | 0 (0.0%) |
| 5 or more Children | 0 (0.0%) | 0 (0.0%) |
| Total | 0 (0.0%) | 0 (0.0%) |
Race in Holiday Island
The most populous races in Holiday Island are White / Caucasian (2,213 | 93.9%), Two or more Races (108 | 4.6%), and Hispanic or Latino (79 | 3.4%).
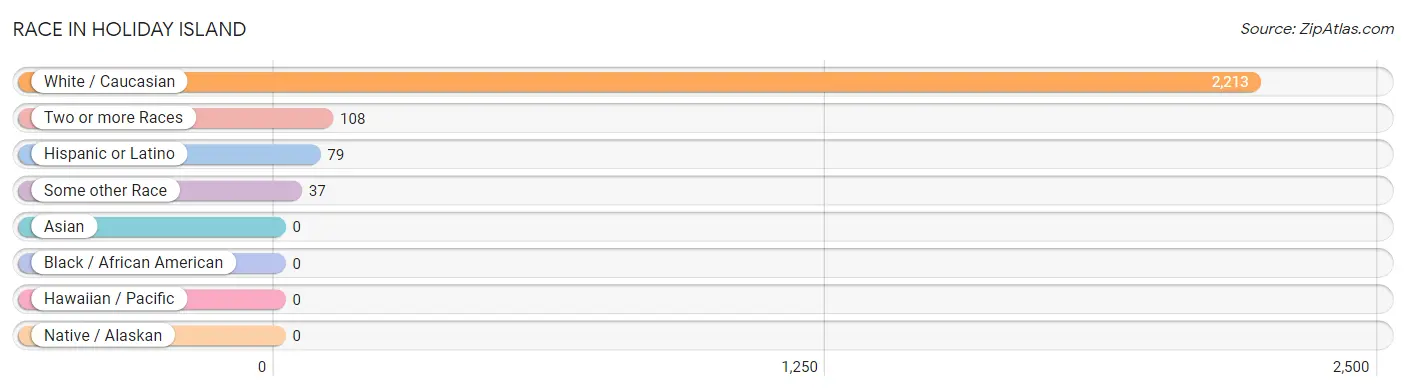
| Race | # Population | % Population |
| Asian | 0 | 0.0% |
| Black / African American | 0 | 0.0% |
| Hawaiian / Pacific | 0 | 0.0% |
| Hispanic or Latino | 79 | 3.4% |
| Native / Alaskan | 0 | 0.0% |
| White / Caucasian | 2,213 | 93.9% |
| Two or more Races | 108 | 4.6% |
| Some other Race | 37 | 1.6% |
| Total | 2,358 | 100.0% |
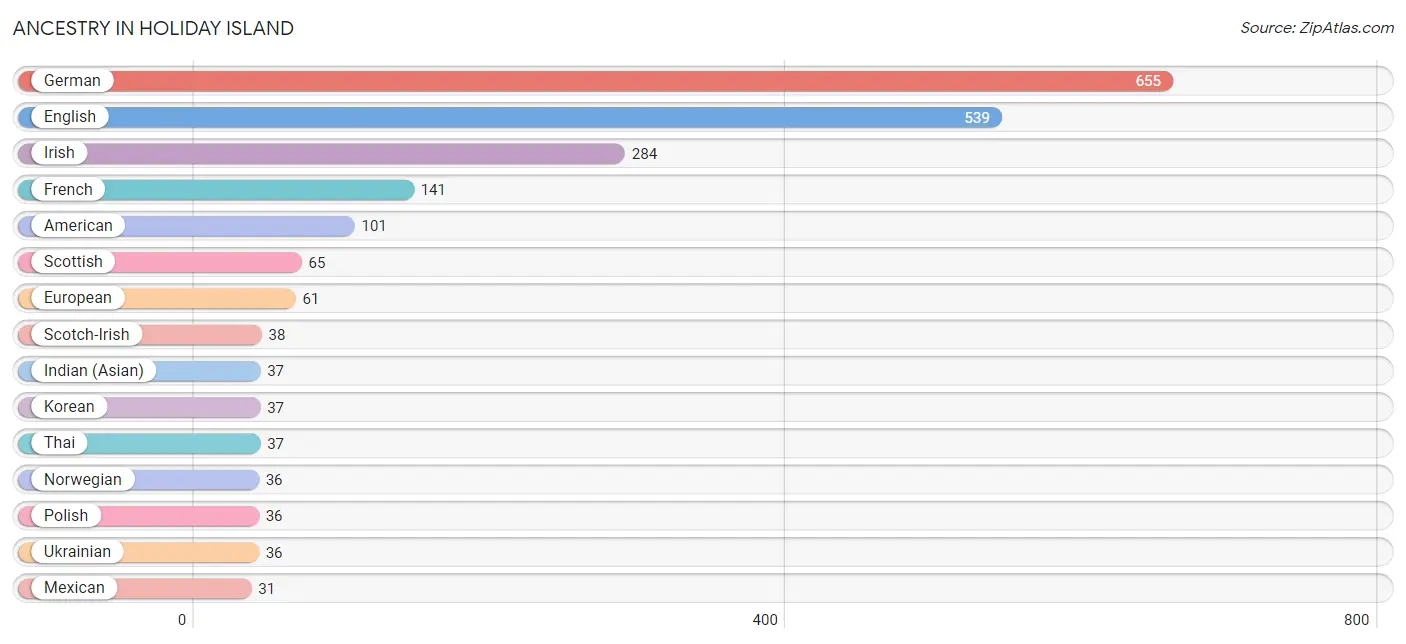
Ancestry in Holiday Island
The most populous ancestries reported in Holiday Island are German (655 | 27.8%), English (539 | 22.9%), Irish (284 | 12.0%), French (141 | 6.0%), and American (101 | 4.3%), together accounting for 72.9% of all Holiday Island residents.
| Ancestry | # Population | % Population |
| American | 101 | 4.3% |
| Austrian | 3 | 0.1% |
| Bangladeshi | 29 | 1.2% |
| British | 27 | 1.1% |
| Celtic | 3 | 0.1% |
| Central American | 6 | 0.3% |
| Cherokee | 29 | 1.2% |
| Chippewa | 9 | 0.4% |
| Costa Rican | 6 | 0.3% |
| Croatian | 4 | 0.2% |
| Czech | 19 | 0.8% |
| Dutch | 19 | 0.8% |
| Ecuadorian | 29 | 1.2% |
| English | 539 | 22.9% |
| European | 61 | 2.6% |
| French | 141 | 6.0% |
| German | 655 | 27.8% |
| Greek | 18 | 0.8% |
| Indian (Asian) | 37 | 1.6% |
| Irish | 284 | 12.0% |
| Italian | 21 | 0.9% |
| Korean | 37 | 1.6% |
| Mexican | 31 | 1.3% |
| Northern European | 28 | 1.2% |
| Norwegian | 36 | 1.5% |
| Polish | 36 | 1.5% |
| Puerto Rican | 13 | 0.5% |
| Romanian | 13 | 0.5% |
| Russian | 14 | 0.6% |
| Scotch-Irish | 38 | 1.6% |
| Scottish | 65 | 2.8% |
| Slovak | 13 | 0.5% |
| South American | 29 | 1.2% |
| Swedish | 15 | 0.6% |
| Thai | 37 | 1.6% |
| Tongan | 29 | 1.2% |
| Ukrainian | 36 | 1.5% |
| Welsh | 13 | 0.5% | View All 38 Rows |
Immigrants in Holiday Island
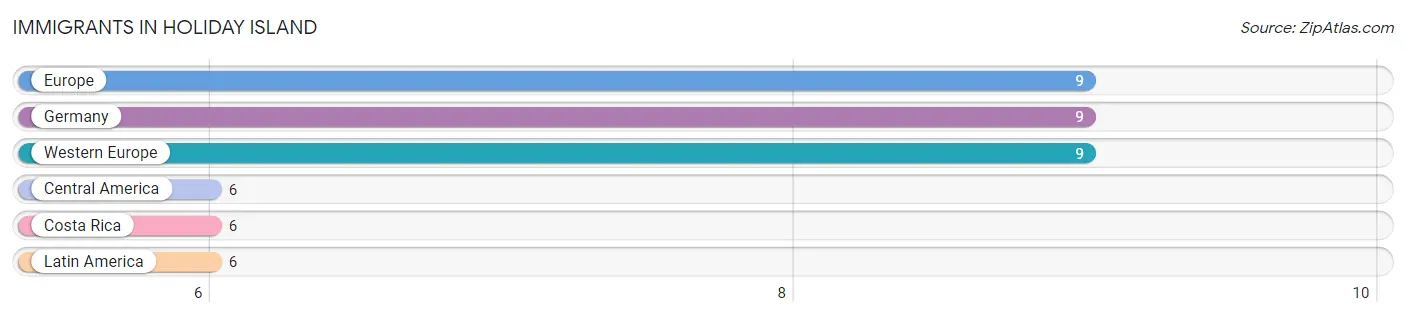
The most numerous immigrant groups reported in Holiday Island came from Europe (9 | 0.4%), Germany (9 | 0.4%), Western Europe (9 | 0.4%), Central America (6 | 0.3%), and Costa Rica (6 | 0.3%), together accounting for 1.6% of all Holiday Island residents.
| Immigration Origin | # Population | % Population |
| Central America | 6 | 0.3% |
| Costa Rica | 6 | 0.3% |
| Europe | 9 | 0.4% |
| Germany | 9 | 0.4% |
| Latin America | 6 | 0.3% |
| Western Europe | 9 | 0.4% | View All 6 Rows |
Sex and Age in Holiday Island
Sex and Age in Holiday Island
The most populous age groups in Holiday Island are 75 to 79 Years (199 | 15.4%) for men and 70 to 74 Years (157 | 14.7%) for women.
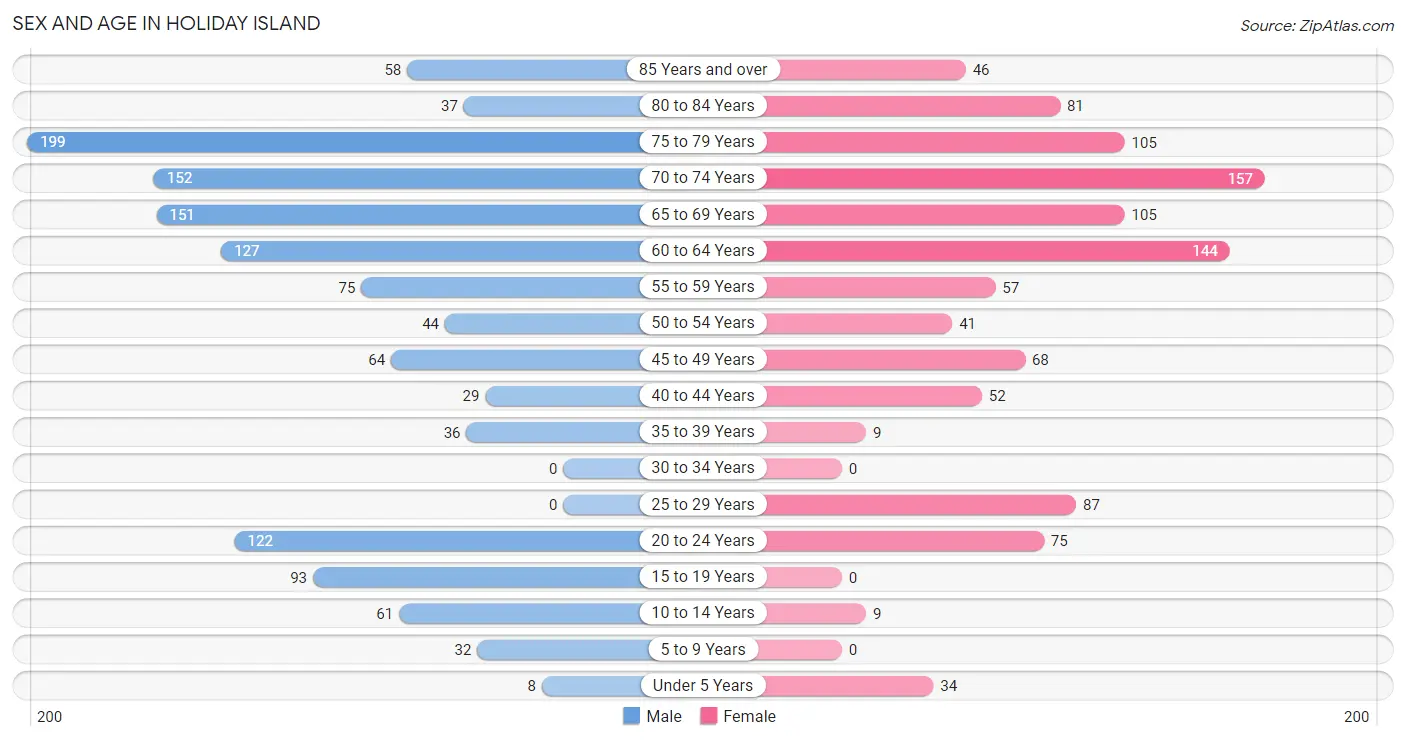
| Age Bracket | Male | Female |
| Under 5 Years | 8 (0.6%) | 34 (3.2%) |
| 5 to 9 Years | 32 (2.5%) | 0 (0.0%) |
| 10 to 14 Years | 61 (4.7%) | 9 (0.8%) |
| 15 to 19 Years | 93 (7.2%) | 0 (0.0%) |
| 20 to 24 Years | 122 (9.5%) | 75 (7.0%) |
| 25 to 29 Years | 0 (0.0%) | 87 (8.1%) |
| 30 to 34 Years | 0 (0.0%) | 0 (0.0%) |
| 35 to 39 Years | 36 (2.8%) | 9 (0.8%) |
| 40 to 44 Years | 29 (2.2%) | 52 (4.9%) |
| 45 to 49 Years | 64 (5.0%) | 68 (6.4%) |
| 50 to 54 Years | 44 (3.4%) | 41 (3.8%) |
| 55 to 59 Years | 75 (5.8%) | 57 (5.3%) |
| 60 to 64 Years | 127 (9.9%) | 144 (13.5%) |
| 65 to 69 Years | 151 (11.7%) | 105 (9.8%) |
| 70 to 74 Years | 152 (11.8%) | 157 (14.7%) |
| 75 to 79 Years | 199 (15.4%) | 105 (9.8%) |
| 80 to 84 Years | 37 (2.9%) | 81 (7.6%) |
| 85 Years and over | 58 (4.5%) | 46 (4.3%) |
| Total | 1,288 (100.0%) | 1,070 (100.0%) |
Families and Households in Holiday Island
Median Family Size in Holiday Island
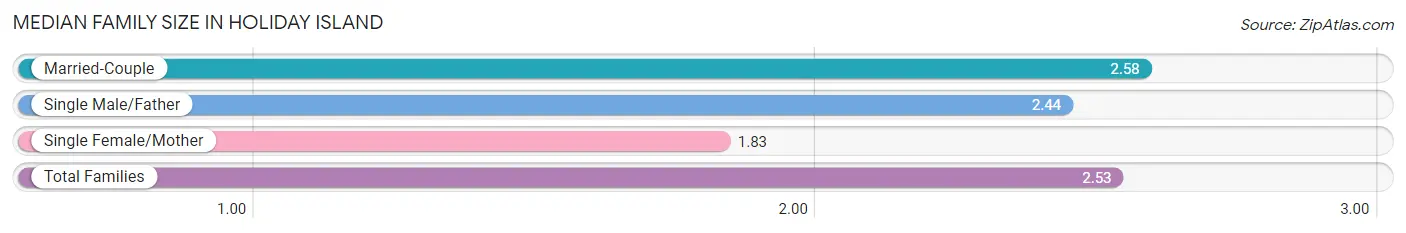
The median family size in Holiday Island is 2.53 persons per family, with married-couple families (626 | 91.4%) accounting for the largest median family size of 2.58 persons per family. On the other hand, single female/mother families (41 | 6.0%) represent the smallest median family size with 1.83 persons per family.
| Family Type | # Families | Family Size |
| Married-Couple | 626 (91.4%) | 2.58 |
| Single Male/Father | 18 (2.6%) | 2.44 |
| Single Female/Mother | 41 (6.0%) | 1.83 |
| Total Families | 685 (100.0%) | 2.53 |
Median Household Size in Holiday Island
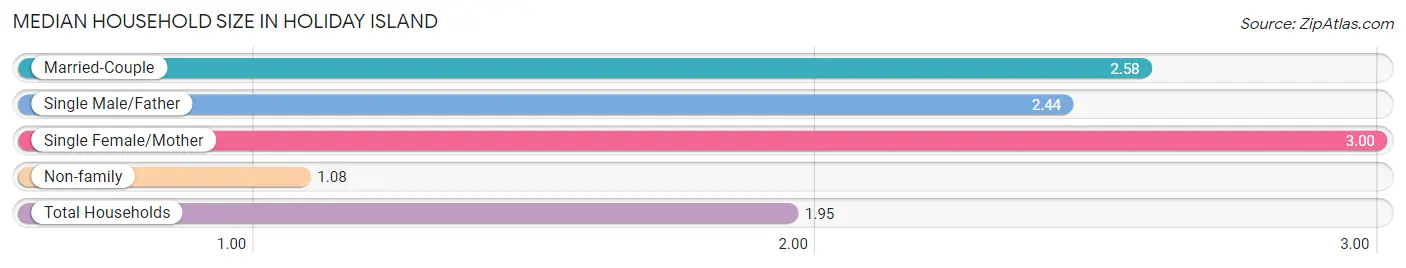
The median household size in Holiday Island is 1.95 persons per household, with single female/mother households (41 | 3.4%) accounting for the largest median household size of 3 persons per household. non-family households (514 | 42.9%) represent the smallest median household size with 1.08 persons per household.
| Household Type | # Households | Household Size |
| Married-Couple | 626 (52.2%) | 2.58 |
| Single Male/Father | 18 (1.5%) | 2.44 |
| Single Female/Mother | 41 (3.4%) | 3.00 |
| Non-family | 514 (42.9%) | 1.08 |
| Total Households | 1,199 (100.0%) | 1.95 |
Household Size by Marriage Status in Holiday Island
Out of a total of 1,199 households in Holiday Island, 685 (57.1%) are family households, while 514 (42.9%) are nonfamily households. The most numerous type of family households are 2-person households, comprising 467, and the most common type of nonfamily households are 1-person households, comprising 471.
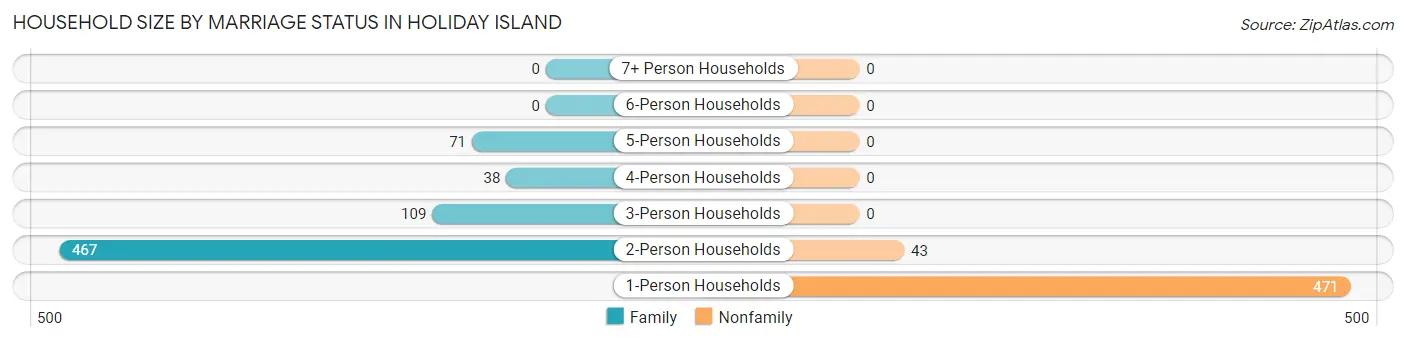
| Household Size | Family Households | Nonfamily Households |
| 1-Person Households | - | 471 (39.3%) |
| 2-Person Households | 467 (39.0%) | 43 (3.6%) |
| 3-Person Households | 109 (9.1%) | 0 (0.0%) |
| 4-Person Households | 38 (3.2%) | 0 (0.0%) |
| 5-Person Households | 71 (5.9%) | 0 (0.0%) |
| 6-Person Households | 0 (0.0%) | 0 (0.0%) |
| 7+ Person Households | 0 (0.0%) | 0 (0.0%) |
| Total | 685 (57.1%) | 514 (42.9%) |
Female Fertility in Holiday Island
Fertility by Age in Holiday Island
Average fertility rate in Holiday Island is 86.0 births per 1,000 women. Women in the age bracket of 20 to 34 years have the highest fertility rate with 154.0 births per 1,000 women. Women in the age bracket of 20 to 34 years acount for 100.0% of all women with births.
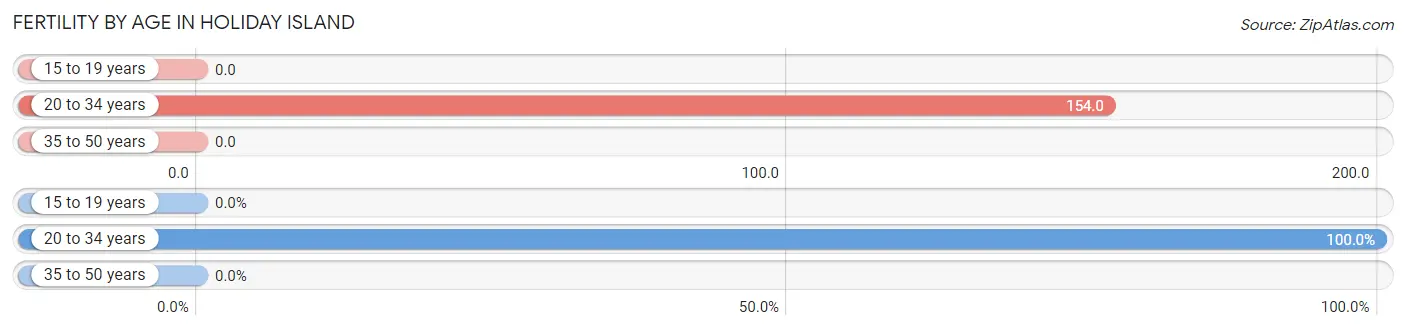
| Age Bracket | Women with Births | Births / 1,000 Women |
| 15 to 19 years | 0 (0.0%) | 0.0 |
| 20 to 34 years | 25 (100.0%) | 154.0 |
| 35 to 50 years | 0 (0.0%) | 0.0 |
| Total | 25 (100.0%) | 86.0 |
Fertility by Age by Marriage Status in Holiday Island
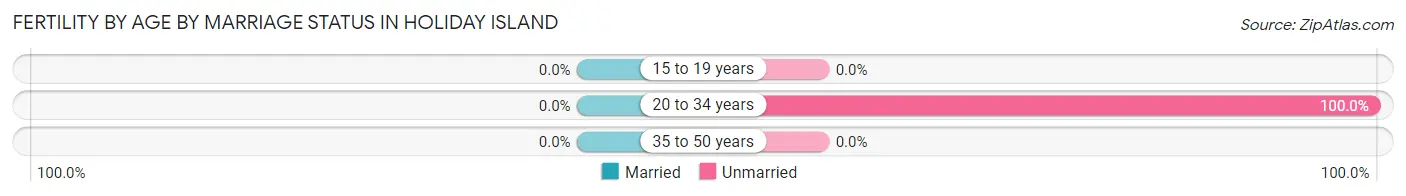
| Age Bracket | Married | Unmarried |
| 15 to 19 years | 0 (0.0%) | 0 (0.0%) |
| 20 to 34 years | 0 (0.0%) | 25 (100.0%) |
| 35 to 50 years | 0 (0.0%) | 0 (0.0%) |
| Total | 0 (0.0%) | 25 (100.0%) |
Fertility by Education in Holiday Island
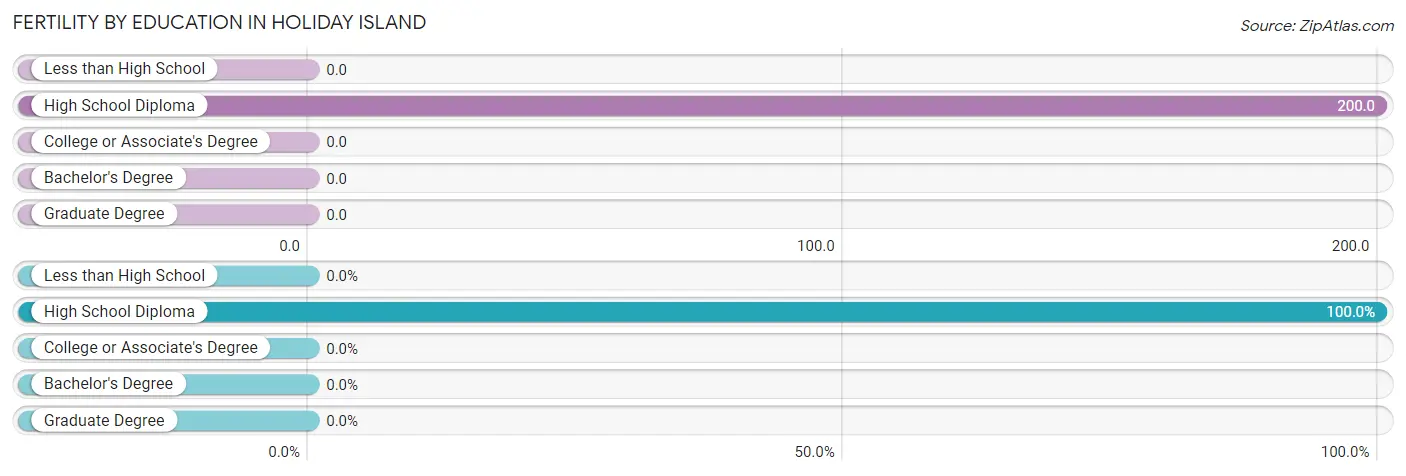
| Educational Attainment | Women with Births | Births / 1,000 Women |
| Less than High School | 0 (0.0%) | 0.0 |
| High School Diploma | 25 (100.0%) | 200.0 |
| College or Associate's Degree | 0 (0.0%) | 0.0 |
| Bachelor's Degree | 0 (0.0%) | 0.0 |
| Graduate Degree | 0 (0.0%) | 0.0 |
| Total | 25 (100.0%) | 86.0 |
Fertility by Education by Marriage Status in Holiday Island
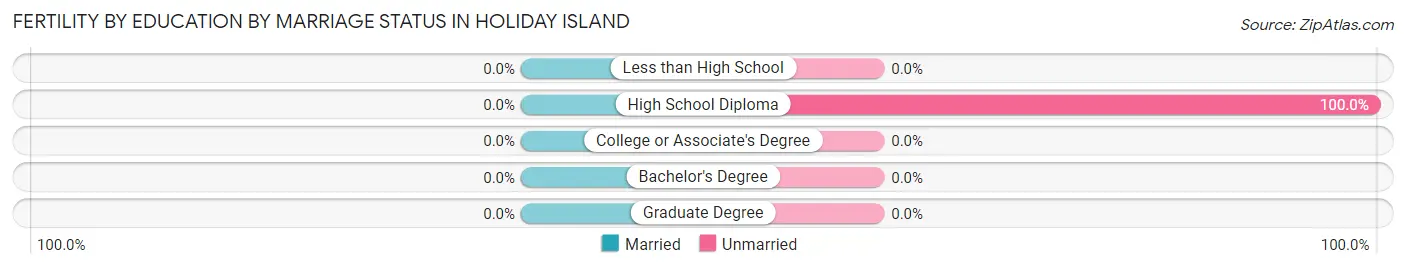
| Educational Attainment | Married | Unmarried |
| Less than High School | 0 (0.0%) | 0 (0.0%) |
| High School Diploma | 0 (0.0%) | 25 (100.0%) |
| College or Associate's Degree | 0 (0.0%) | 0 (0.0%) |
| Bachelor's Degree | 0 (0.0%) | 0 (0.0%) |
| Graduate Degree | 0 (0.0%) | 0 (0.0%) |
| Total | 0 (0.0%) | 25 (100.0%) |
Employment Characteristics in Holiday Island
Employment by Class of Employer in Holiday Island
Among the 960 employed individuals in Holiday Island, private company employees (561 | 58.4%), self-employed (not incorporated) (172 | 17.9%), and local government employees (80 | 8.3%) make up the most common classes of employment.
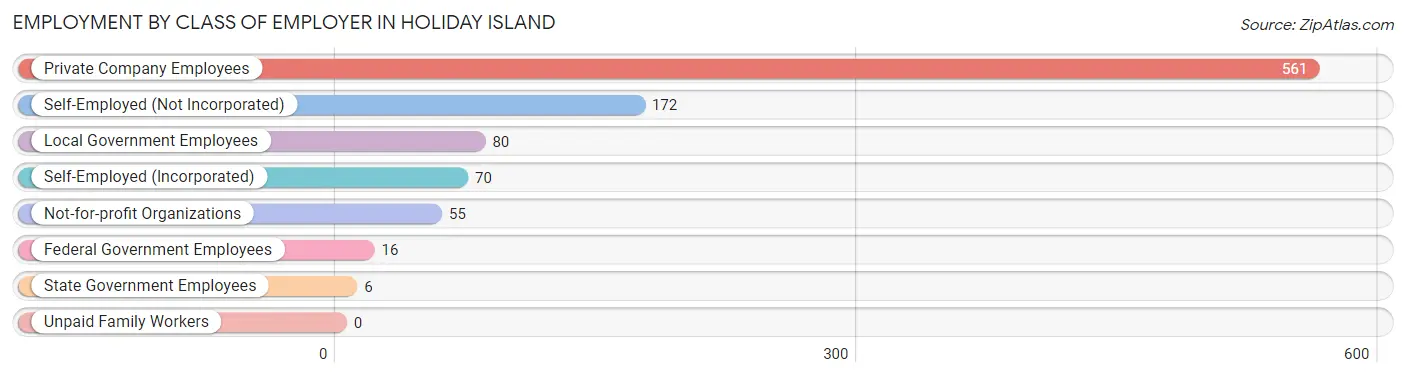
| Employer Class | # Employees | % Employees |
| Private Company Employees | 561 | 58.4% |
| Self-Employed (Incorporated) | 70 | 7.3% |
| Self-Employed (Not Incorporated) | 172 | 17.9% |
| Not-for-profit Organizations | 55 | 5.7% |
| Local Government Employees | 80 | 8.3% |
| State Government Employees | 6 | 0.6% |
| Federal Government Employees | 16 | 1.7% |
| Unpaid Family Workers | 0 | 0.0% |
| Total | 960 | 100.0% |
Employment Status by Age in Holiday Island
According to the labor force statistics for Holiday Island, out of the total population over 16 years of age (2,214), 45.8% or 1,014 individuals are in the labor force, with 3.7% or 38 of them unemployed. The age group with the highest labor force participation rate is 16 to 19 years, with 100.0% or 93 individuals in the labor force. Within the labor force, the 75 years and over age range has the highest percentage of unemployed individuals, with 38.5% or 15 of them being unemployed.
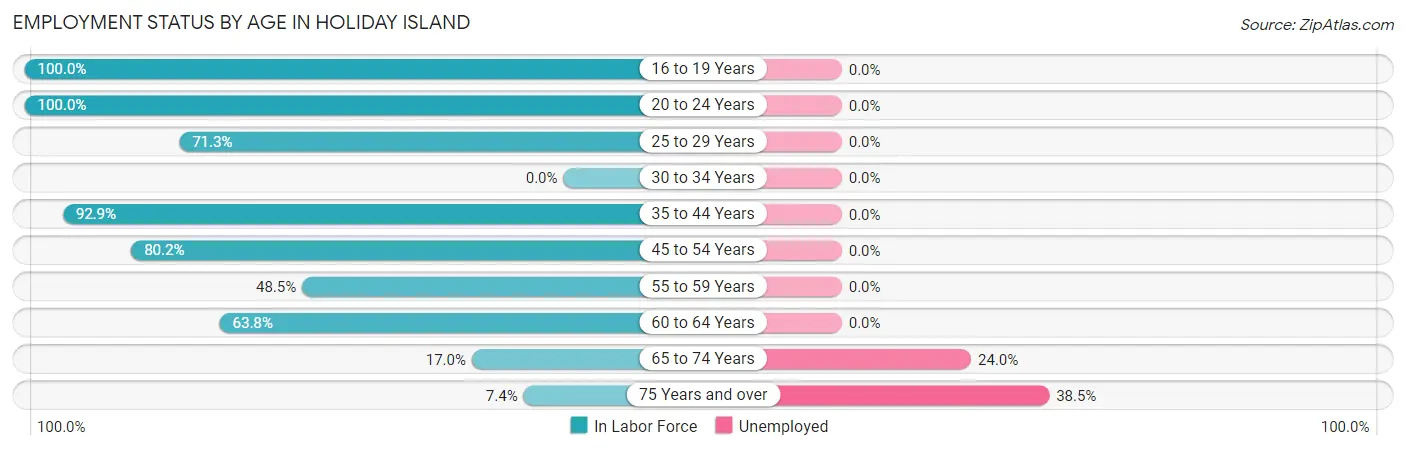
| Age Bracket | In Labor Force | Unemployed |
| 16 to 19 Years | 93 (100.0%) | 0 (0.0%) |
| 20 to 24 Years | 197 (100.0%) | 0 (0.0%) |
| 25 to 29 Years | 62 (71.3%) | 0 (0.0%) |
| 30 to 34 Years | 0 (0.0%) | 0 (0.0%) |
| 35 to 44 Years | 117 (92.9%) | 0 (0.0%) |
| 45 to 54 Years | 174 (80.2%) | 0 (0.0%) |
| 55 to 59 Years | 64 (48.5%) | 0 (0.0%) |
| 60 to 64 Years | 173 (63.8%) | 0 (0.0%) |
| 65 to 74 Years | 96 (17.0%) | 23 (24.0%) |
| 75 Years and over | 39 (7.4%) | 15 (38.5%) |
| Total | 1,014 (45.8%) | 38 (3.7%) |
Employment Status by Educational Attainment in Holiday Island
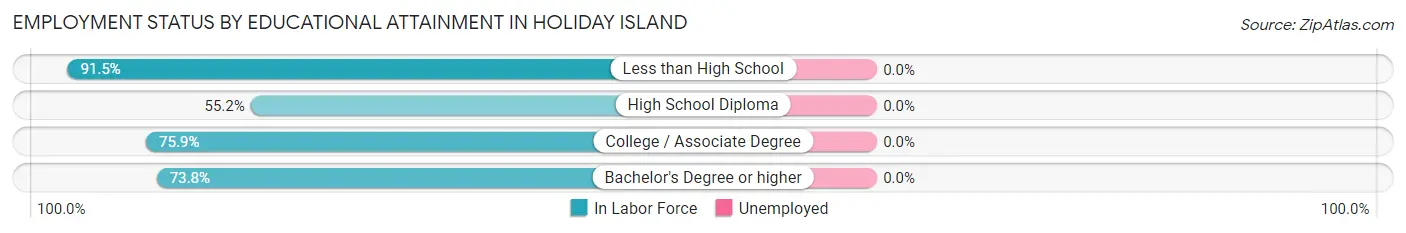
| Educational Attainment | In Labor Force | Unemployed |
| Less than High School | 65 (91.5%) | 0 (0.0%) |
| High School Diploma | 128 (55.2%) | 0 (0.0%) |
| College / Associate Degree | 217 (75.9%) | 0 (0.0%) |
| Bachelor's Degree or higher | 180 (73.8%) | 0 (0.0%) |
| Total | 590 (70.8%) | 0 (0.0%) |
Employment Occupations by Sex in Holiday Island
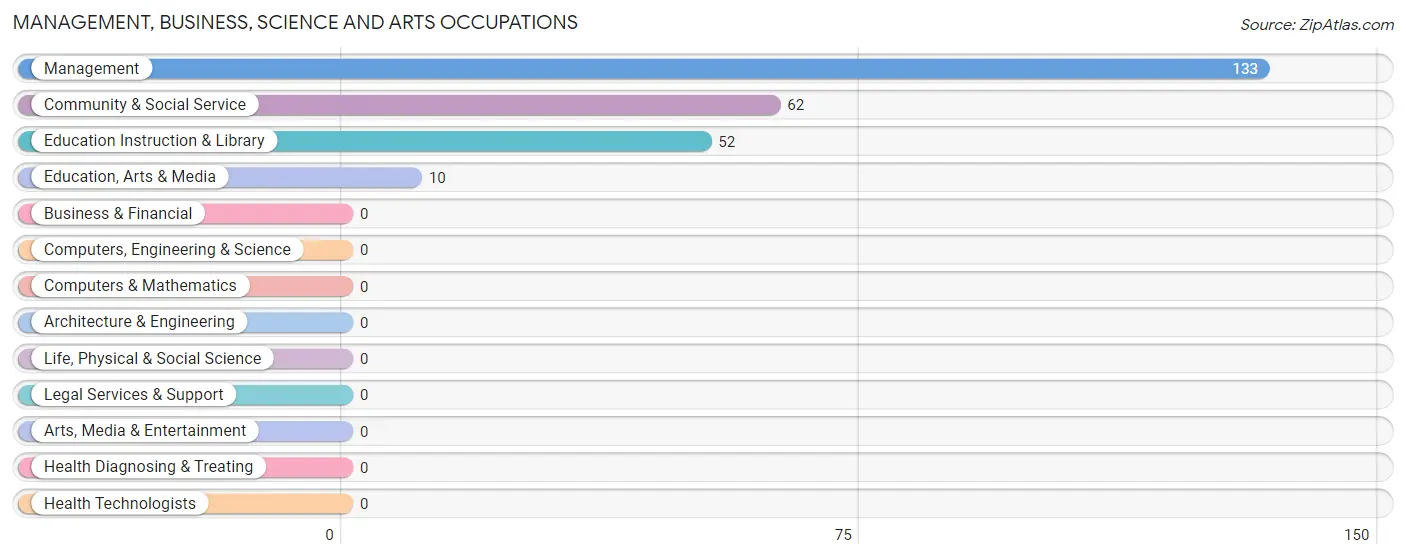
Management, Business, Science and Arts Occupations
The most common Management, Business, Science and Arts occupations in Holiday Island are Management (133 | 13.6%), Community & Social Service (62 | 6.4%), Education Instruction & Library (52 | 5.3%), and Education, Arts & Media (10 | 1.0%).
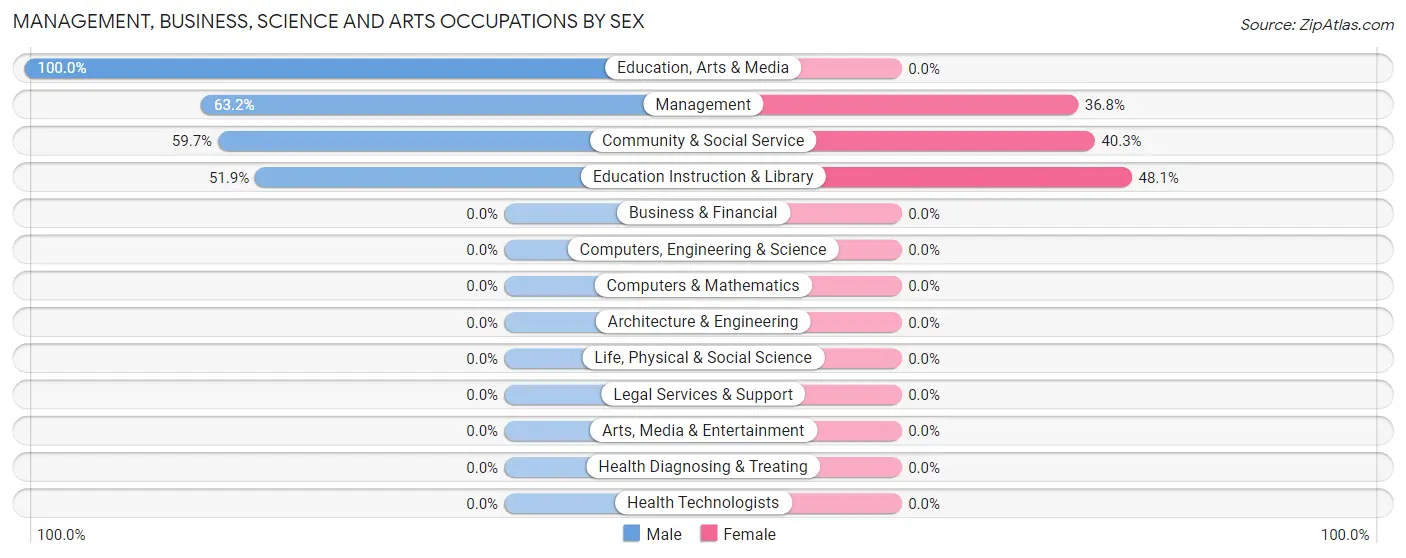
Management, Business, Science and Arts Occupations by Sex
Within the Management, Business, Science and Arts occupations in Holiday Island, the most male-oriented occupations are Education, Arts & Media (100.0%), Management (63.2%), and Community & Social Service (59.7%), while the most female-oriented occupations are Education Instruction & Library (48.1%), Community & Social Service (40.3%), and Management (36.8%).
| Occupation | Male | Female |
| Management | 84 (63.2%) | 49 (36.8%) |
| Business & Financial | 0 (0.0%) | 0 (0.0%) |
| Computers, Engineering & Science | 0 (0.0%) | 0 (0.0%) |
| Computers & Mathematics | 0 (0.0%) | 0 (0.0%) |
| Architecture & Engineering | 0 (0.0%) | 0 (0.0%) |
| Life, Physical & Social Science | 0 (0.0%) | 0 (0.0%) |
| Community & Social Service | 37 (59.7%) | 25 (40.3%) |
| Education, Arts & Media | 10 (100.0%) | 0 (0.0%) |
| Legal Services & Support | 0 (0.0%) | 0 (0.0%) |
| Education Instruction & Library | 27 (51.9%) | 25 (48.1%) |
| Arts, Media & Entertainment | 0 (0.0%) | 0 (0.0%) |
| Health Diagnosing & Treating | 0 (0.0%) | 0 (0.0%) |
| Health Technologists | 0 (0.0%) | 0 (0.0%) |
| Total (Category) | 121 (62.1%) | 74 (38.0%) |
| Total (Overall) | 569 (58.2%) | 408 (41.8%) |
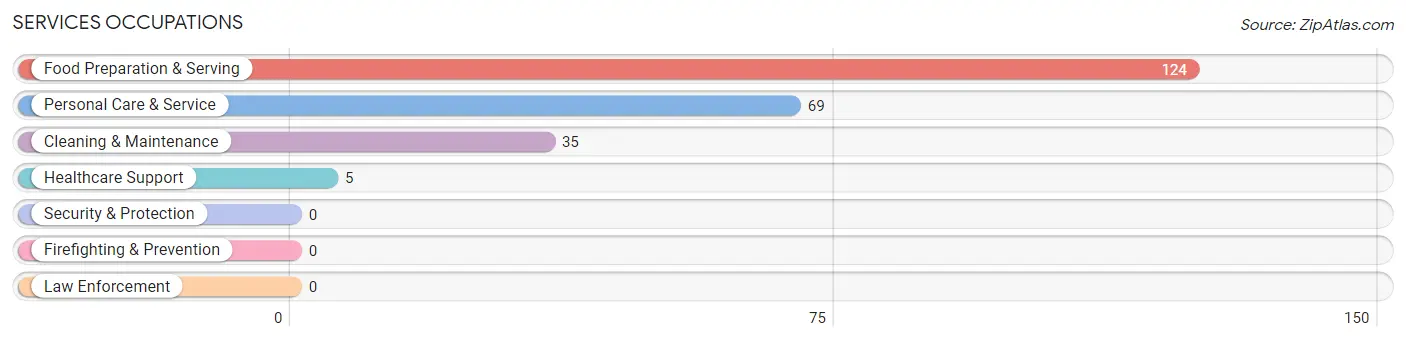
Services Occupations
The most common Services occupations in Holiday Island are Food Preparation & Serving (124 | 12.7%), Personal Care & Service (69 | 7.1%), Cleaning & Maintenance (35 | 3.6%), and Healthcare Support (5 | 0.5%).
Services Occupations by Sex
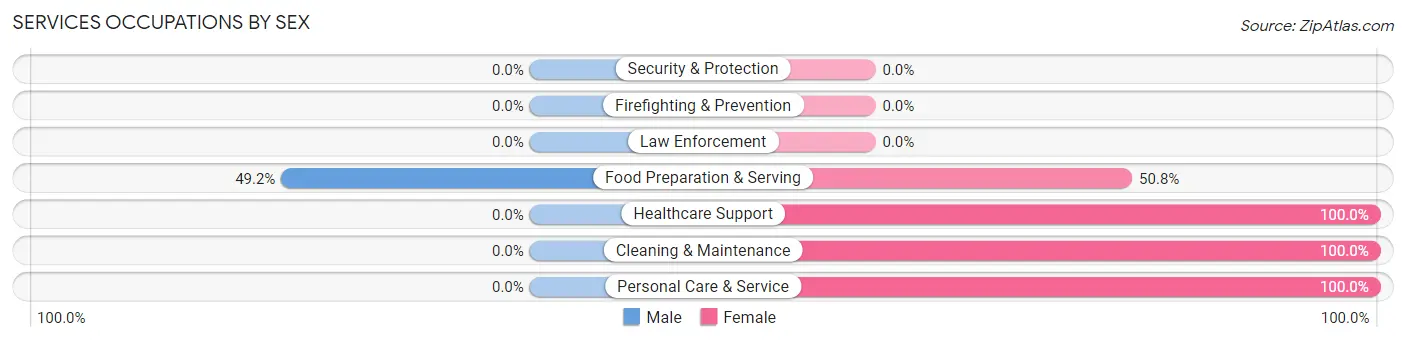
| Occupation | Male | Female |
| Healthcare Support | 0 (0.0%) | 5 (100.0%) |
| Security & Protection | 0 (0.0%) | 0 (0.0%) |
| Firefighting & Prevention | 0 (0.0%) | 0 (0.0%) |
| Law Enforcement | 0 (0.0%) | 0 (0.0%) |
| Food Preparation & Serving | 61 (49.2%) | 63 (50.8%) |
| Cleaning & Maintenance | 0 (0.0%) | 35 (100.0%) |
| Personal Care & Service | 0 (0.0%) | 69 (100.0%) |
| Total (Category) | 61 (26.2%) | 172 (73.8%) |
| Total (Overall) | 569 (58.2%) | 408 (41.8%) |
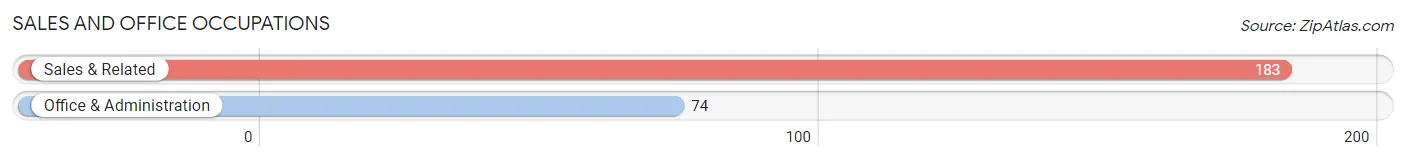
Sales and Office Occupations
The most common Sales and Office occupations in Holiday Island are Sales & Related (183 | 18.7%), and Office & Administration (74 | 7.6%).
Sales and Office Occupations by Sex
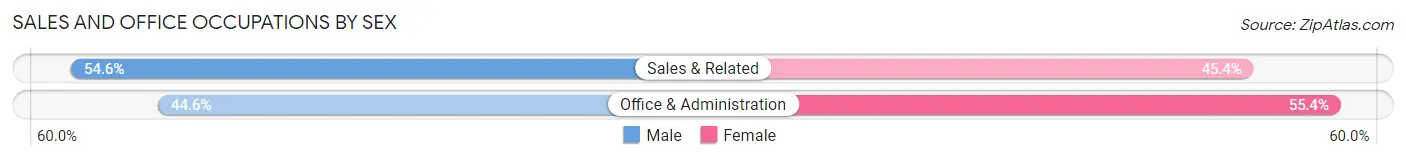
| Occupation | Male | Female |
| Sales & Related | 100 (54.6%) | 83 (45.4%) |
| Office & Administration | 33 (44.6%) | 41 (55.4%) |
| Total (Category) | 133 (51.7%) | 124 (48.2%) |
| Total (Overall) | 569 (58.2%) | 408 (41.8%) |
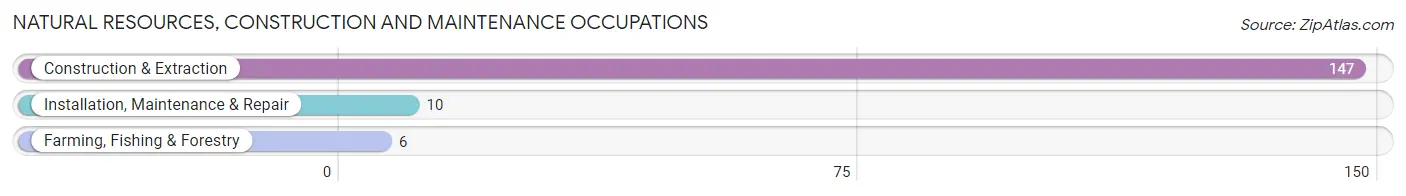
Natural Resources, Construction and Maintenance Occupations
The most common Natural Resources, Construction and Maintenance occupations in Holiday Island are Construction & Extraction (147 | 15.0%), Installation, Maintenance & Repair (10 | 1.0%), and Farming, Fishing & Forestry (6 | 0.6%).
Natural Resources, Construction and Maintenance Occupations by Sex
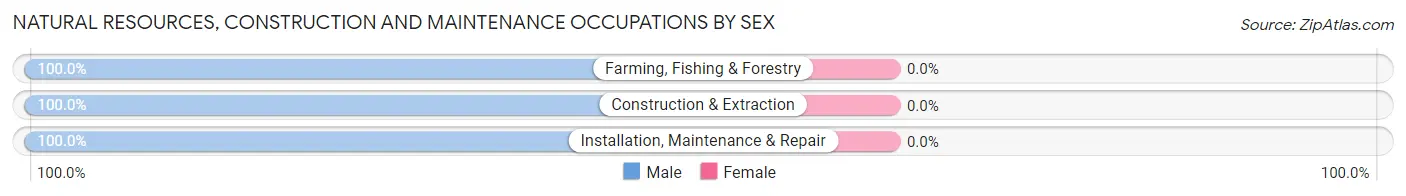
| Occupation | Male | Female |
| Farming, Fishing & Forestry | 6 (100.0%) | 0 (0.0%) |
| Construction & Extraction | 147 (100.0%) | 0 (0.0%) |
| Installation, Maintenance & Repair | 10 (100.0%) | 0 (0.0%) |
| Total (Category) | 163 (100.0%) | 0 (0.0%) |
| Total (Overall) | 569 (58.2%) | 408 (41.8%) |
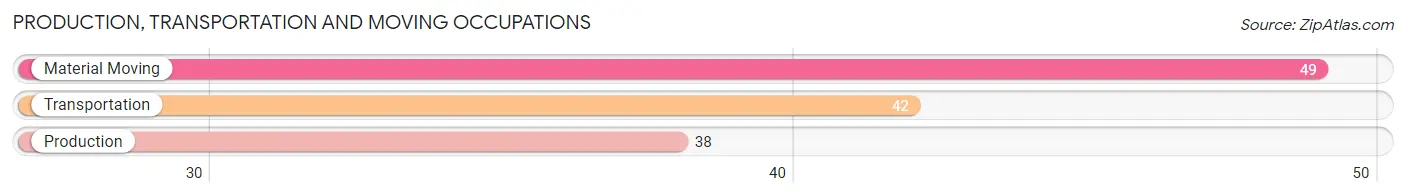
Production, Transportation and Moving Occupations
The most common Production, Transportation and Moving occupations in Holiday Island are Material Moving (49 | 5.0%), Transportation (42 | 4.3%), and Production (38 | 3.9%).
Production, Transportation and Moving Occupations by Sex
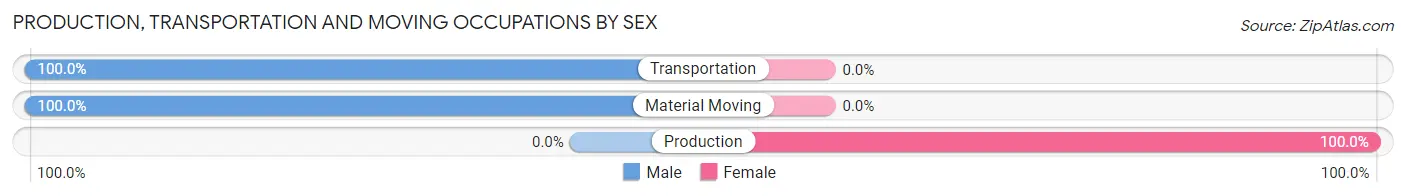
| Occupation | Male | Female |
| Production | 0 (0.0%) | 38 (100.0%) |
| Transportation | 42 (100.0%) | 0 (0.0%) |
| Material Moving | 49 (100.0%) | 0 (0.0%) |
| Total (Category) | 91 (70.5%) | 38 (29.5%) |
| Total (Overall) | 569 (58.2%) | 408 (41.8%) |
Employment Industries by Sex in Holiday Island
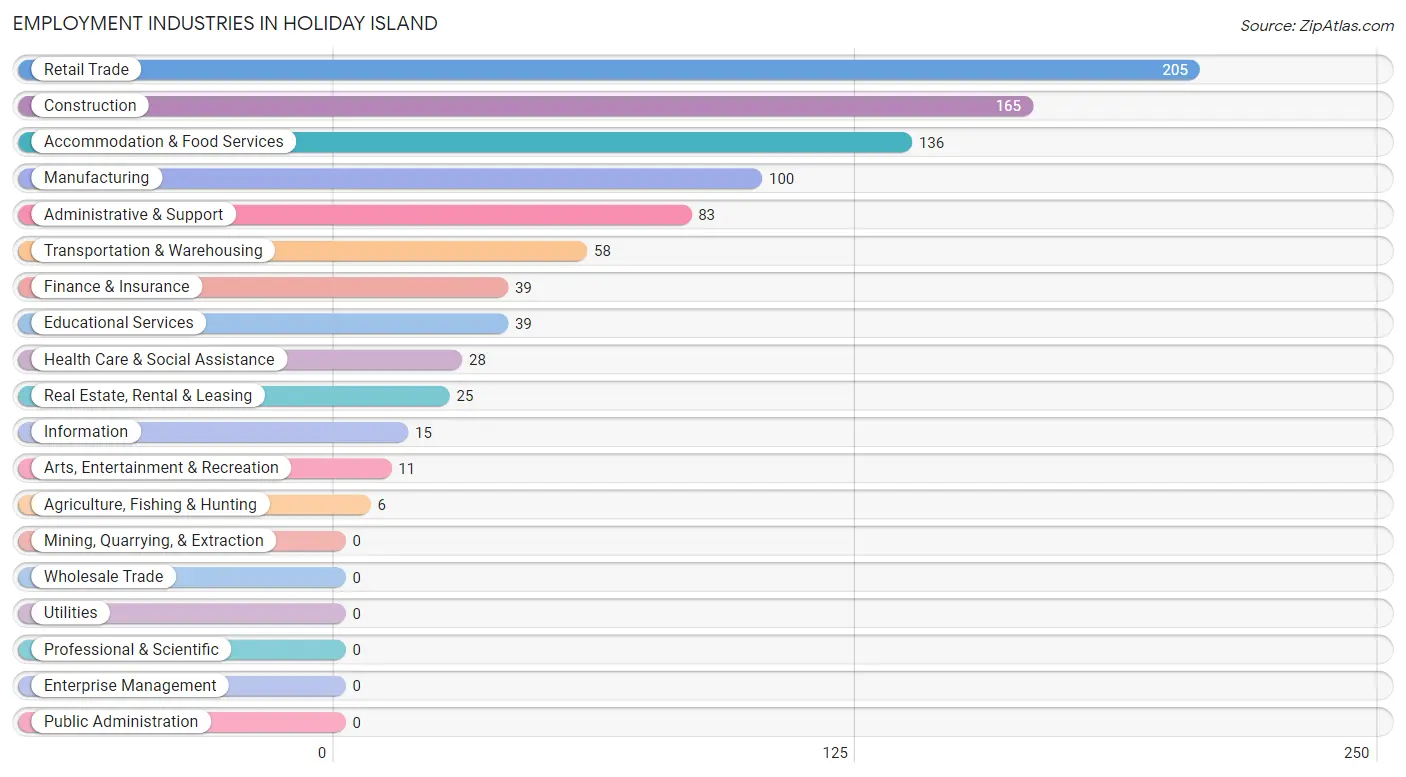
Employment Industries in Holiday Island
The major employment industries in Holiday Island include Retail Trade (205 | 21.0%), Construction (165 | 16.9%), Accommodation & Food Services (136 | 13.9%), Manufacturing (100 | 10.2%), and Administrative & Support (83 | 8.5%).
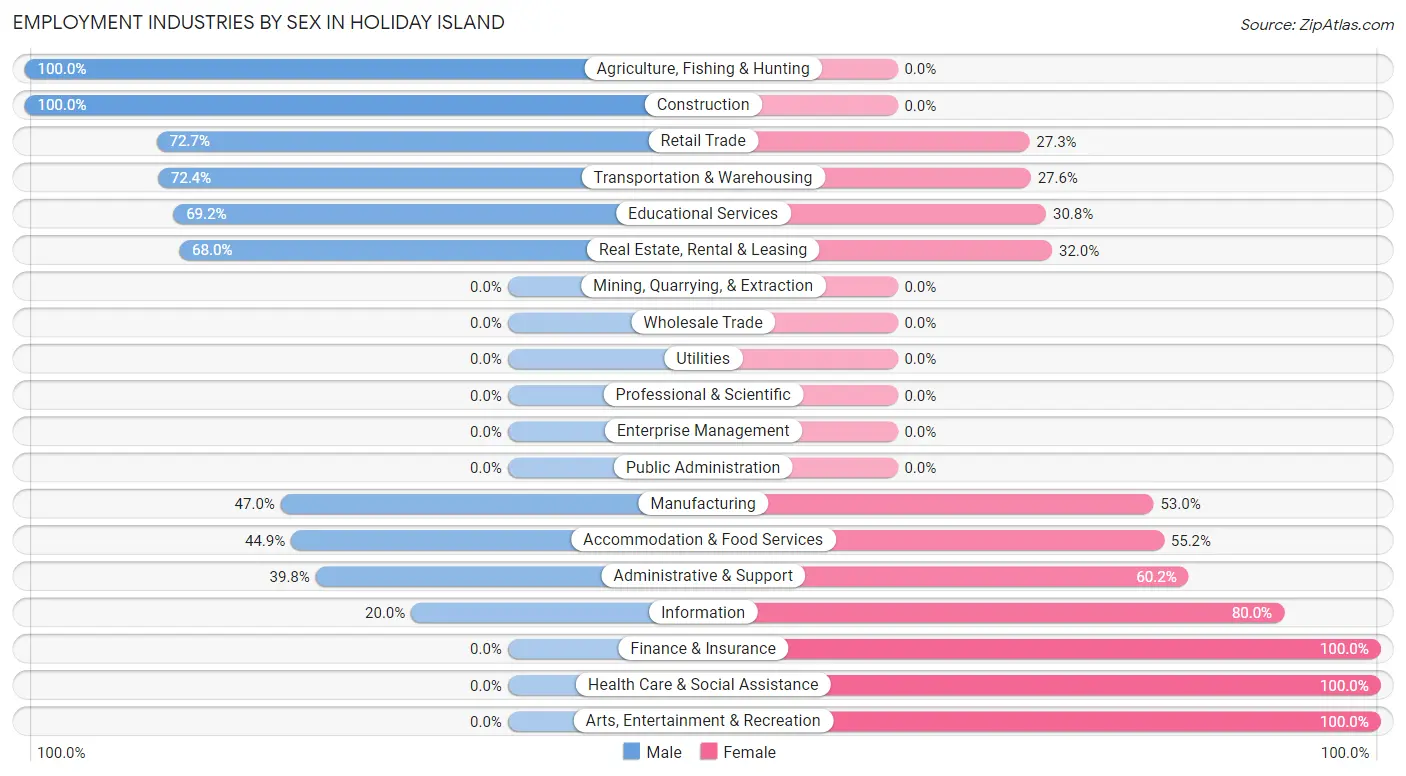
Employment Industries by Sex in Holiday Island
The Holiday Island industries that see more men than women are Agriculture, Fishing & Hunting (100.0%), Construction (100.0%), and Retail Trade (72.7%), whereas the industries that tend to have a higher number of women are Finance & Insurance (100.0%), Health Care & Social Assistance (100.0%), and Arts, Entertainment & Recreation (100.0%).
| Industry | Male | Female |
| Agriculture, Fishing & Hunting | 6 (100.0%) | 0 (0.0%) |
| Mining, Quarrying, & Extraction | 0 (0.0%) | 0 (0.0%) |
| Construction | 165 (100.0%) | 0 (0.0%) |
| Manufacturing | 47 (47.0%) | 53 (53.0%) |
| Wholesale Trade | 0 (0.0%) | 0 (0.0%) |
| Retail Trade | 149 (72.7%) | 56 (27.3%) |
| Transportation & Warehousing | 42 (72.4%) | 16 (27.6%) |
| Utilities | 0 (0.0%) | 0 (0.0%) |
| Information | 3 (20.0%) | 12 (80.0%) |
| Finance & Insurance | 0 (0.0%) | 39 (100.0%) |
| Real Estate, Rental & Leasing | 17 (68.0%) | 8 (32.0%) |
| Professional & Scientific | 0 (0.0%) | 0 (0.0%) |
| Enterprise Management | 0 (0.0%) | 0 (0.0%) |
| Administrative & Support | 33 (39.8%) | 50 (60.2%) |
| Educational Services | 27 (69.2%) | 12 (30.8%) |
| Health Care & Social Assistance | 0 (0.0%) | 28 (100.0%) |
| Arts, Entertainment & Recreation | 0 (0.0%) | 11 (100.0%) |
| Accommodation & Food Services | 61 (44.9%) | 75 (55.1%) |
| Public Administration | 0 (0.0%) | 0 (0.0%) |
| Total | 569 (58.2%) | 408 (41.8%) |
Education in Holiday Island
School Enrollment in Holiday Island
The most common levels of schooling among the 174 students in Holiday Island are middle school (70 | 40.2%), high school (59 | 33.9%), and kindergarten (32 | 18.4%).
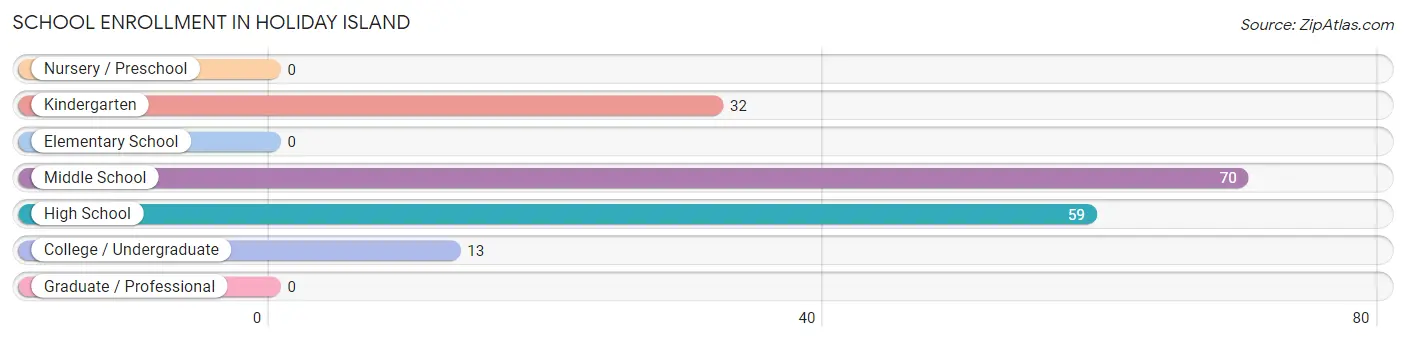
| School Level | # Students | % Students |
| Nursery / Preschool | 0 | 0.0% |
| Kindergarten | 32 | 18.4% |
| Elementary School | 0 | 0.0% |
| Middle School | 70 | 40.2% |
| High School | 59 | 33.9% |
| College / Undergraduate | 13 | 7.5% |
| Graduate / Professional | 0 | 0.0% |
| Total | 174 | 100.0% |
School Enrollment by Age by Funding Source in Holiday Island
Out of a total of 174 students who are enrolled in schools in Holiday Island, 68 (39.1%) attend a private institution, while the remaining 106 (60.9%) are enrolled in public schools. The age group of 15 to 17 year olds has the highest likelihood of being enrolled in private schools, with 59 (100.0% in the age bracket) enrolled. Conversely, the age group of 5 to 9 year old has the lowest likelihood of being enrolled in a private school, with 32 (100.0% in the age bracket) attending a public institution.
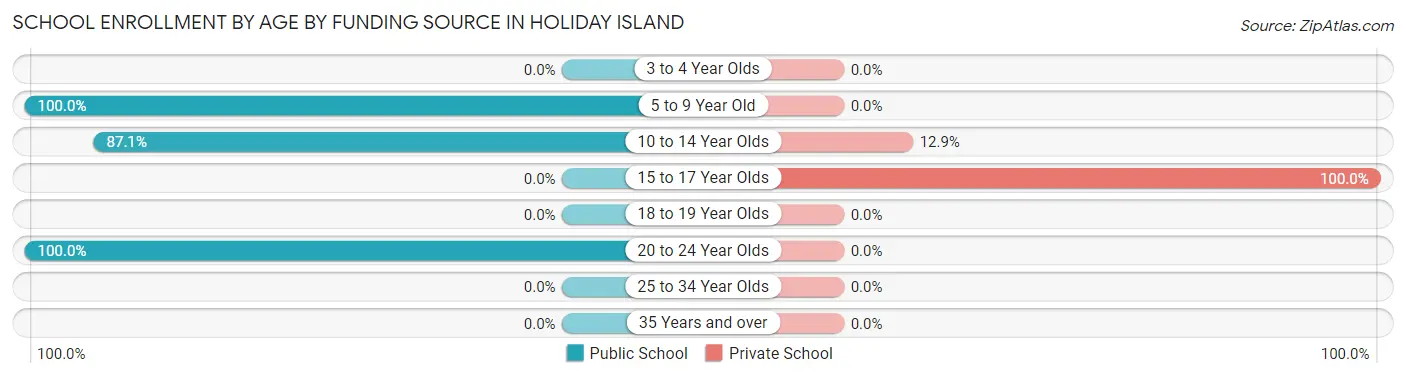
| Age Bracket | Public School | Private School |
| 3 to 4 Year Olds | 0 (0.0%) | 0 (0.0%) |
| 5 to 9 Year Old | 32 (100.0%) | 0 (0.0%) |
| 10 to 14 Year Olds | 61 (87.1%) | 9 (12.9%) |
| 15 to 17 Year Olds | 0 (0.0%) | 59 (100.0%) |
| 18 to 19 Year Olds | 0 (0.0%) | 0 (0.0%) |
| 20 to 24 Year Olds | 13 (100.0%) | 0 (0.0%) |
| 25 to 34 Year Olds | 0 (0.0%) | 0 (0.0%) |
| 35 Years and over | 0 (0.0%) | 0 (0.0%) |
| Total | 106 (60.9%) | 68 (39.1%) |
Educational Attainment by Field of Study in Holiday Island
Business (171 | 28.2%), education (154 | 25.4%), liberal arts & history (79 | 13.0%), social sciences (52 | 8.6%), and psychology (30 | 4.9%) are the most common fields of study among 607 individuals in Holiday Island who have obtained a bachelor's degree or higher.
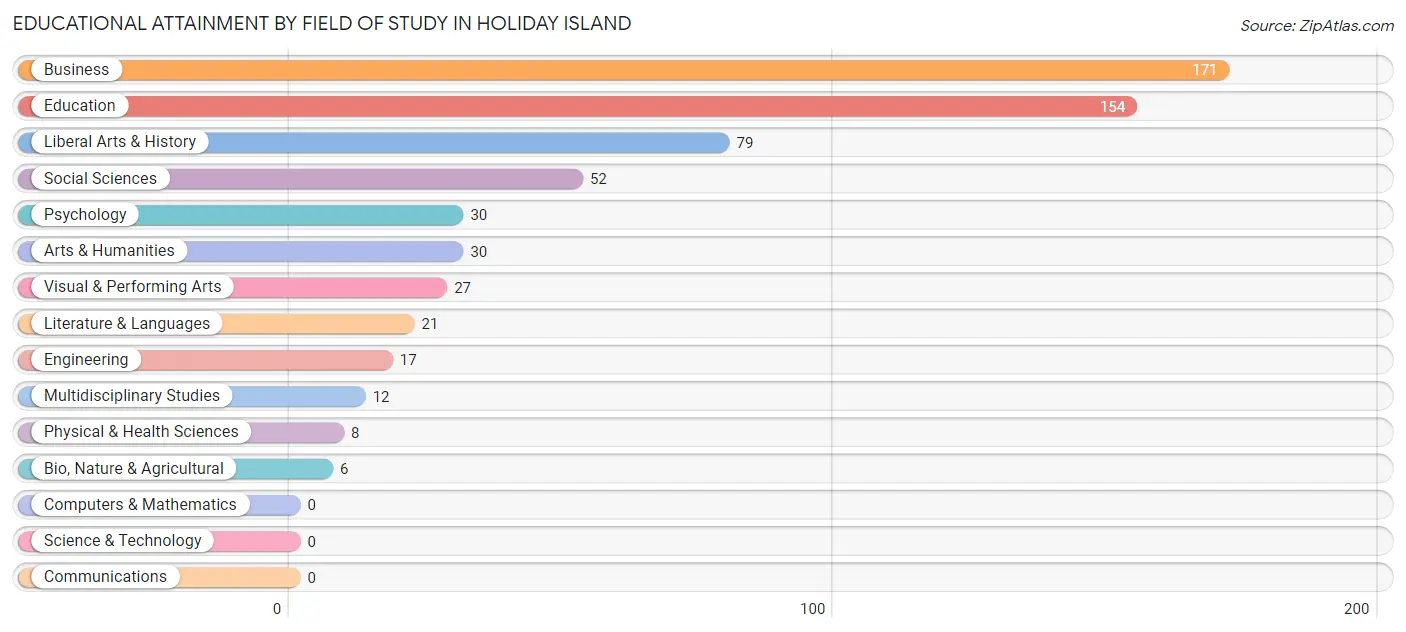
| Field of Study | # Graduates | % Graduates |
| Computers & Mathematics | 0 | 0.0% |
| Bio, Nature & Agricultural | 6 | 1.0% |
| Physical & Health Sciences | 8 | 1.3% |
| Psychology | 30 | 4.9% |
| Social Sciences | 52 | 8.6% |
| Engineering | 17 | 2.8% |
| Multidisciplinary Studies | 12 | 2.0% |
| Science & Technology | 0 | 0.0% |
| Business | 171 | 28.2% |
| Education | 154 | 25.4% |
| Literature & Languages | 21 | 3.5% |
| Liberal Arts & History | 79 | 13.0% |
| Visual & Performing Arts | 27 | 4.4% |
| Communications | 0 | 0.0% |
| Arts & Humanities | 30 | 4.9% |
| Total | 607 | 100.0% |
Transportation & Commute in Holiday Island
Vehicle Availability by Sex in Holiday Island
The most prevalent vehicle ownership categories in Holiday Island are males with 3 vehicles (269, accounting for 47.3%) and females with 3 vehicles (100, making up 68.8%).
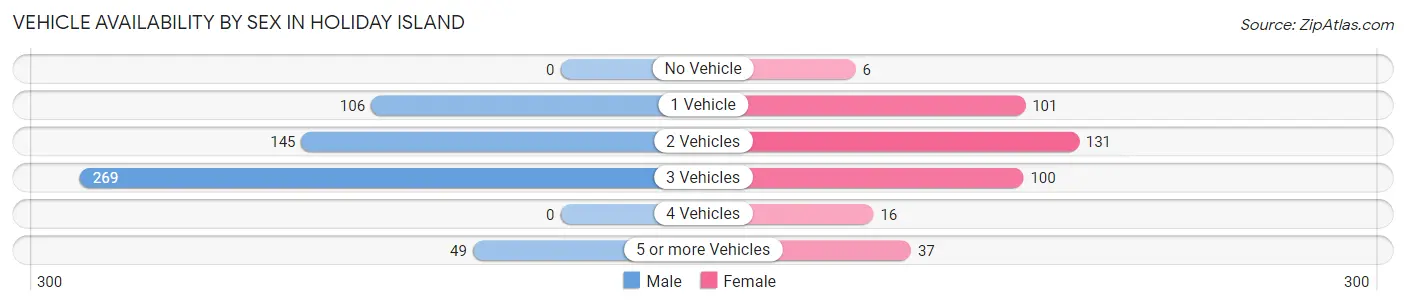
| Vehicles Available | Male | Female |
| No Vehicle | 0 (0.0%) | 6 (1.5%) |
| 1 Vehicle | 106 (18.6%) | 101 (25.8%) |
| 2 Vehicles | 145 (25.5%) | 131 (33.5%) |
| 3 Vehicles | 269 (47.3%) | 100 (25.6%) |
| 4 Vehicles | 0 (0.0%) | 16 (4.1%) |
| 5 or more Vehicles | 49 (8.6%) | 37 (9.5%) |
| Total | 569 (100.0%) | 391 (100.0%) |
Commute Time in Holiday Island
The most frequently occuring commute durations in Holiday Island are 20 to 24 minutes (195 commuters, 22.2%), 15 to 19 minutes (137 commuters, 15.6%), and 10 to 14 minutes (126 commuters, 14.4%).
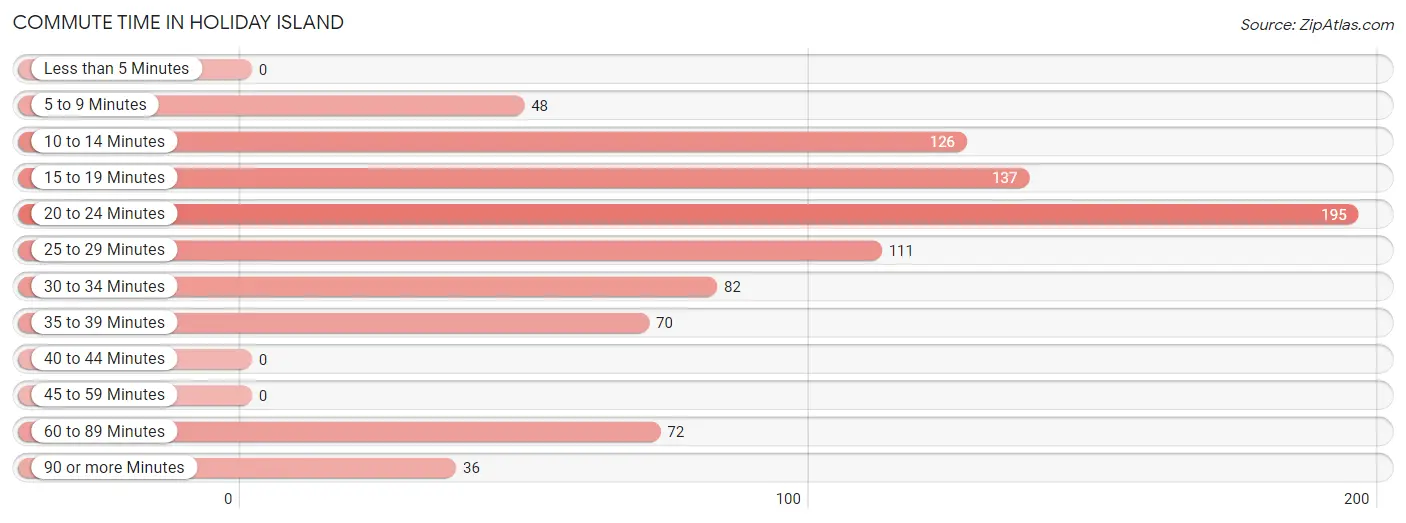
| Commute Time | # Commuters | % Commuters |
| Less than 5 Minutes | 0 | 0.0% |
| 5 to 9 Minutes | 48 | 5.5% |
| 10 to 14 Minutes | 126 | 14.4% |
| 15 to 19 Minutes | 137 | 15.6% |
| 20 to 24 Minutes | 195 | 22.2% |
| 25 to 29 Minutes | 111 | 12.7% |
| 30 to 34 Minutes | 82 | 9.3% |
| 35 to 39 Minutes | 70 | 8.0% |
| 40 to 44 Minutes | 0 | 0.0% |
| 45 to 59 Minutes | 0 | 0.0% |
| 60 to 89 Minutes | 72 | 8.2% |
| 90 or more Minutes | 36 | 4.1% |
Commute Time by Sex in Holiday Island
The most common commute times in Holiday Island are 20 to 24 minutes (144 commuters, 26.0%) for males and 15 to 19 minutes (107 commuters, 33.0%) for females.
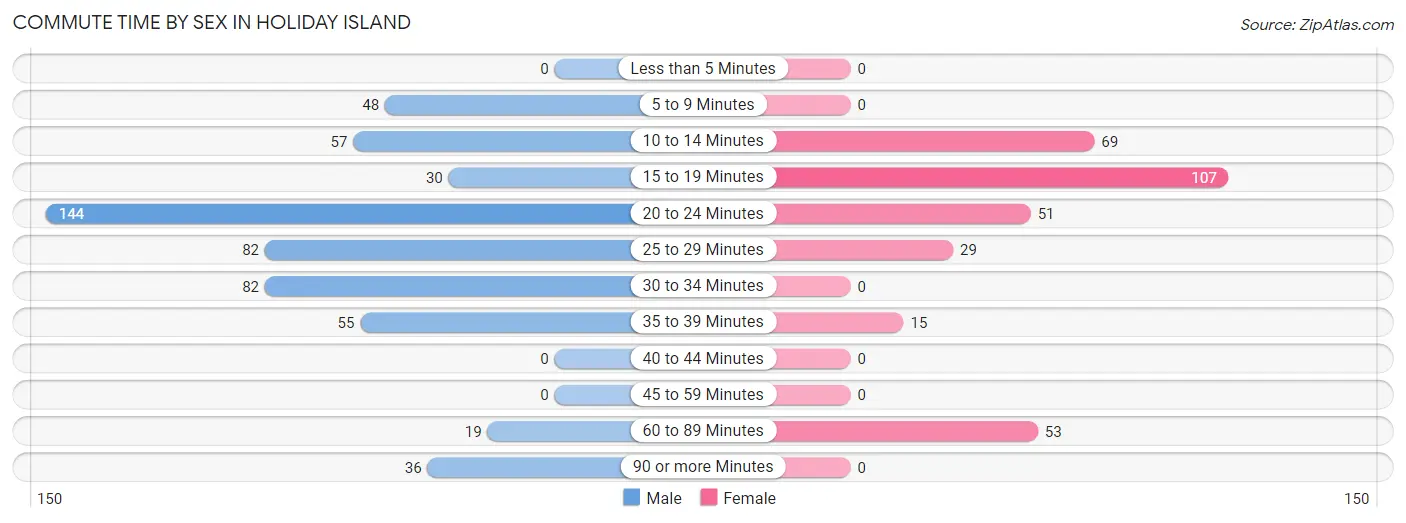
| Commute Time | Male | Female |
| Less than 5 Minutes | 0 (0.0%) | 0 (0.0%) |
| 5 to 9 Minutes | 48 (8.7%) | 0 (0.0%) |
| 10 to 14 Minutes | 57 (10.3%) | 69 (21.3%) |
| 15 to 19 Minutes | 30 (5.4%) | 107 (33.0%) |
| 20 to 24 Minutes | 144 (26.0%) | 51 (15.7%) |
| 25 to 29 Minutes | 82 (14.8%) | 29 (8.9%) |
| 30 to 34 Minutes | 82 (14.8%) | 0 (0.0%) |
| 35 to 39 Minutes | 55 (10.0%) | 15 (4.6%) |
| 40 to 44 Minutes | 0 (0.0%) | 0 (0.0%) |
| 45 to 59 Minutes | 0 (0.0%) | 0 (0.0%) |
| 60 to 89 Minutes | 19 (3.4%) | 53 (16.4%) |
| 90 or more Minutes | 36 (6.5%) | 0 (0.0%) |
Time of Departure to Work by Sex in Holiday Island
The most frequent times of departure to work in Holiday Island are 8:00 AM to 8:29 AM (143, 25.9%) for males and 10:00 AM to 10:59 AM (62, 19.1%) for females.
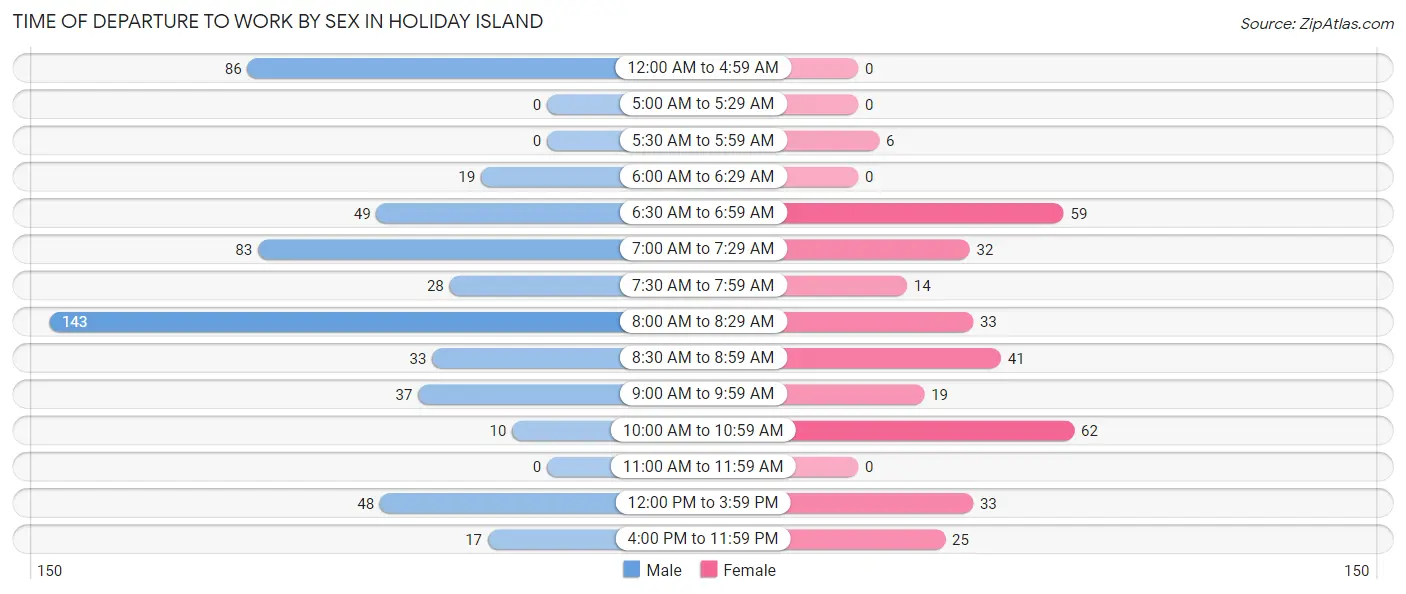
| Time of Departure | Male | Female |
| 12:00 AM to 4:59 AM | 86 (15.5%) | 0 (0.0%) |
| 5:00 AM to 5:29 AM | 0 (0.0%) | 0 (0.0%) |
| 5:30 AM to 5:59 AM | 0 (0.0%) | 6 (1.8%) |
| 6:00 AM to 6:29 AM | 19 (3.4%) | 0 (0.0%) |
| 6:30 AM to 6:59 AM | 49 (8.9%) | 59 (18.2%) |
| 7:00 AM to 7:29 AM | 83 (15.0%) | 32 (9.9%) |
| 7:30 AM to 7:59 AM | 28 (5.1%) | 14 (4.3%) |
| 8:00 AM to 8:29 AM | 143 (25.9%) | 33 (10.2%) |
| 8:30 AM to 8:59 AM | 33 (6.0%) | 41 (12.7%) |
| 9:00 AM to 9:59 AM | 37 (6.7%) | 19 (5.9%) |
| 10:00 AM to 10:59 AM | 10 (1.8%) | 62 (19.1%) |
| 11:00 AM to 11:59 AM | 0 (0.0%) | 0 (0.0%) |
| 12:00 PM to 3:59 PM | 48 (8.7%) | 33 (10.2%) |
| 4:00 PM to 11:59 PM | 17 (3.1%) | 25 (7.7%) |
| Total | 553 (100.0%) | 324 (100.0%) |
Housing Occupancy in Holiday Island
Occupancy by Ownership in Holiday Island
Of the total 1,199 dwellings in Holiday Island, owner-occupied units account for 946 (78.9%), while renter-occupied units make up 253 (21.1%).
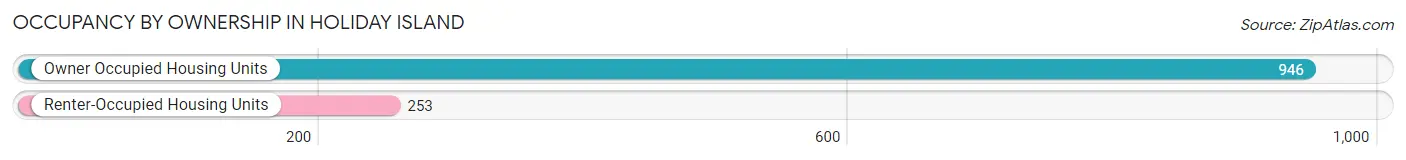
| Occupancy | # Housing Units | % Housing Units |
| Owner Occupied Housing Units | 946 | 78.9% |
| Renter-Occupied Housing Units | 253 | 21.1% |
| Total Occupied Housing Units | 1,199 | 100.0% |
Occupancy by Household Size in Holiday Island
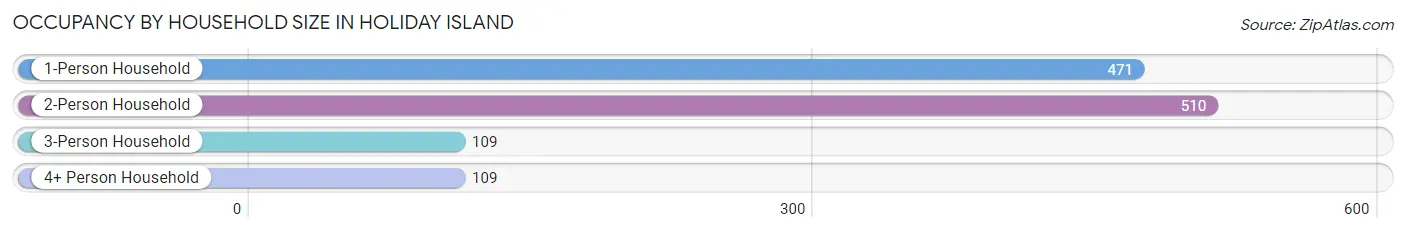
| Household Size | # Housing Units | % Housing Units |
| 1-Person Household | 471 | 39.3% |
| 2-Person Household | 510 | 42.5% |
| 3-Person Household | 109 | 9.1% |
| 4+ Person Household | 109 | 9.1% |
| Total Housing Units | 1,199 | 100.0% |
Occupancy by Ownership by Household Size in Holiday Island
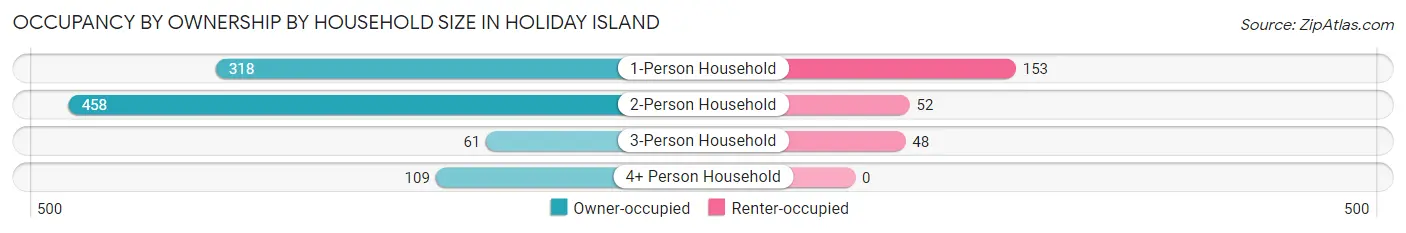
| Household Size | Owner-occupied | Renter-occupied |
| 1-Person Household | 318 (67.5%) | 153 (32.5%) |
| 2-Person Household | 458 (89.8%) | 52 (10.2%) |
| 3-Person Household | 61 (56.0%) | 48 (44.0%) |
| 4+ Person Household | 109 (100.0%) | 0 (0.0%) |
| Total Housing Units | 946 (78.9%) | 253 (21.1%) |
Occupancy by Educational Attainment in Holiday Island
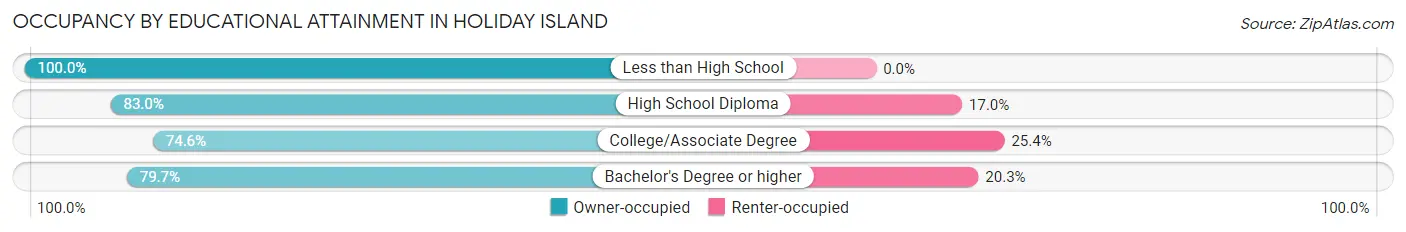
| Household Size | Owner-occupied | Renter-occupied |
| Less than High School | 39 (100.0%) | 0 (0.0%) |
| High School Diploma | 224 (83.0%) | 46 (17.0%) |
| College/Associate Degree | 384 (74.6%) | 131 (25.4%) |
| Bachelor's Degree or higher | 299 (79.7%) | 76 (20.3%) |
Occupancy by Age of Householder in Holiday Island
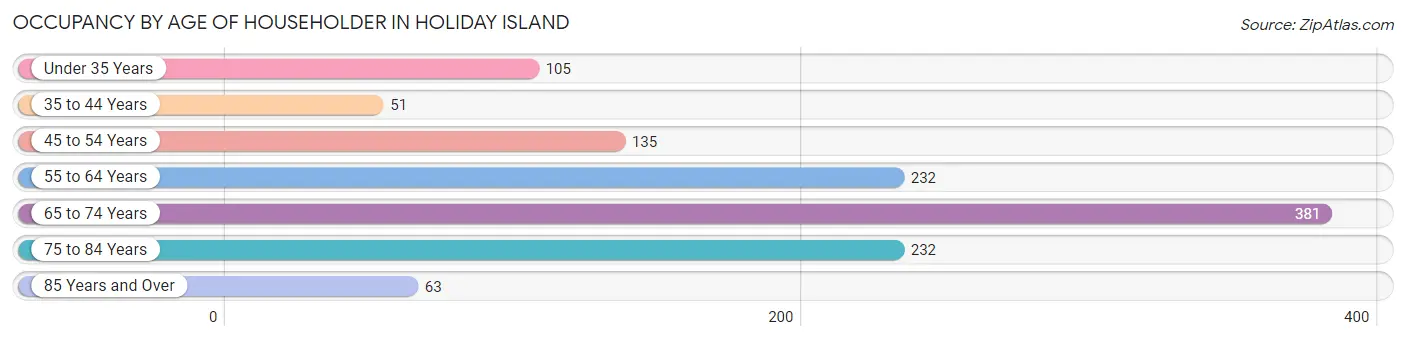
| Age Bracket | # Households | % Households |
| Under 35 Years | 105 | 8.8% |
| 35 to 44 Years | 51 | 4.3% |
| 45 to 54 Years | 135 | 11.3% |
| 55 to 64 Years | 232 | 19.4% |
| 65 to 74 Years | 381 | 31.8% |
| 75 to 84 Years | 232 | 19.4% |
| 85 Years and Over | 63 | 5.2% |
| Total | 1,199 | 100.0% |
Housing Finances in Holiday Island
Median Income by Occupancy in Holiday Island
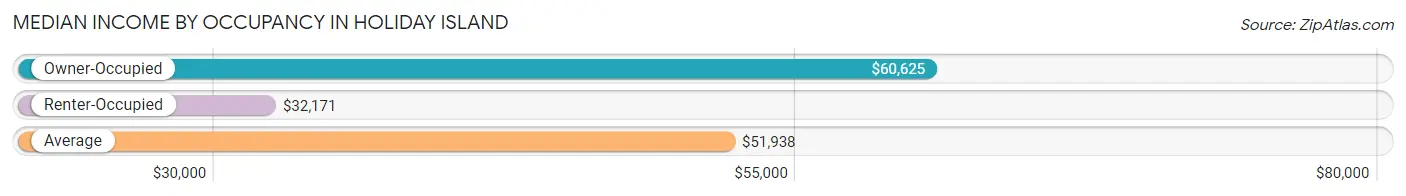
| Occupancy Type | # Households | Median Income |
| Owner-Occupied | 946 (78.9%) | $60,625 |
| Renter-Occupied | 253 (21.1%) | $32,171 |
| Average | 1,199 (100.0%) | $51,938 |
Occupancy by Householder Income Bracket in Holiday Island
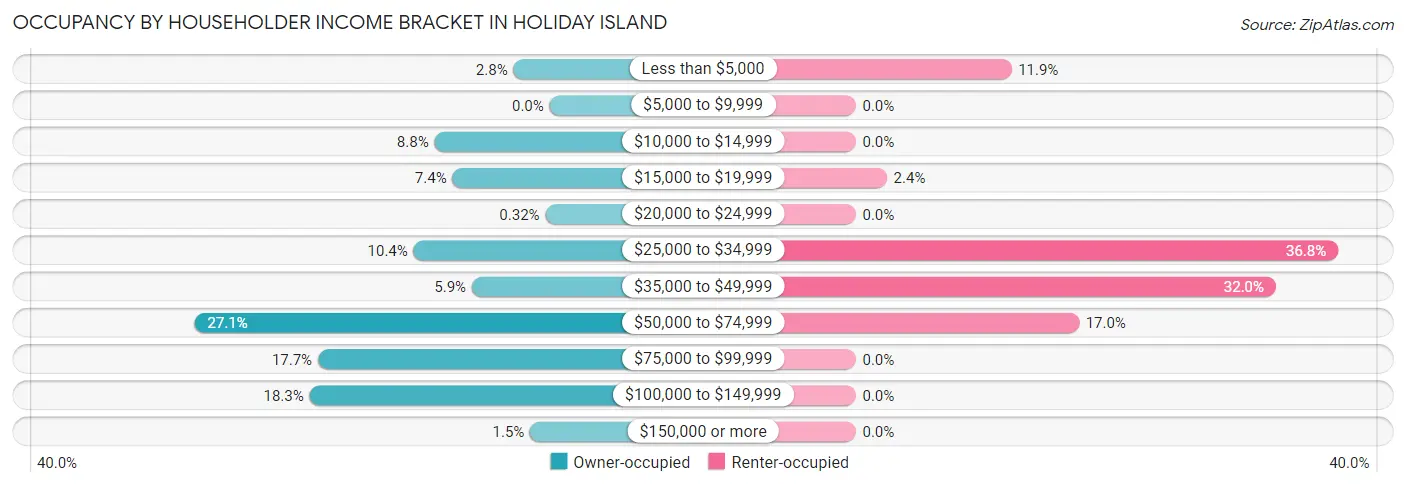
| Income Bracket | Owner-occupied | Renter-occupied |
| Less than $5,000 | 26 (2.8%) | 30 (11.9%) |
| $5,000 to $9,999 | 0 (0.0%) | 0 (0.0%) |
| $10,000 to $14,999 | 83 (8.8%) | 0 (0.0%) |
| $15,000 to $19,999 | 70 (7.4%) | 6 (2.4%) |
| $20,000 to $24,999 | 3 (0.3%) | 0 (0.0%) |
| $25,000 to $34,999 | 98 (10.4%) | 93 (36.8%) |
| $35,000 to $49,999 | 56 (5.9%) | 81 (32.0%) |
| $50,000 to $74,999 | 256 (27.1%) | 43 (17.0%) |
| $75,000 to $99,999 | 167 (17.6%) | 0 (0.0%) |
| $100,000 to $149,999 | 173 (18.3%) | 0 (0.0%) |
| $150,000 or more | 14 (1.5%) | 0 (0.0%) |
| Total | 946 (100.0%) | 253 (100.0%) |
Monthly Housing Cost Tiers in Holiday Island
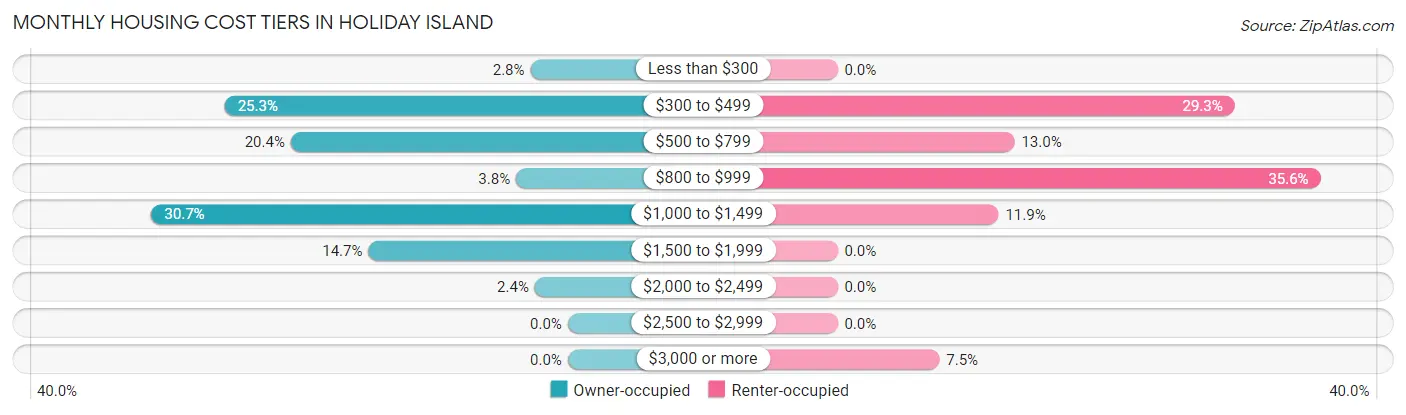
| Monthly Cost | Owner-occupied | Renter-occupied |
| Less than $300 | 26 (2.8%) | 0 (0.0%) |
| $300 to $499 | 239 (25.3%) | 74 (29.2%) |
| $500 to $799 | 193 (20.4%) | 33 (13.0%) |
| $800 to $999 | 36 (3.8%) | 90 (35.6%) |
| $1,000 to $1,499 | 290 (30.7%) | 30 (11.9%) |
| $1,500 to $1,999 | 139 (14.7%) | 0 (0.0%) |
| $2,000 to $2,499 | 23 (2.4%) | 0 (0.0%) |
| $2,500 to $2,999 | 0 (0.0%) | 0 (0.0%) |
| $3,000 or more | 0 (0.0%) | 19 (7.5%) |
| Total | 946 (100.0%) | 253 (100.0%) |
Physical Housing Characteristics in Holiday Island
Housing Structures in Holiday Island
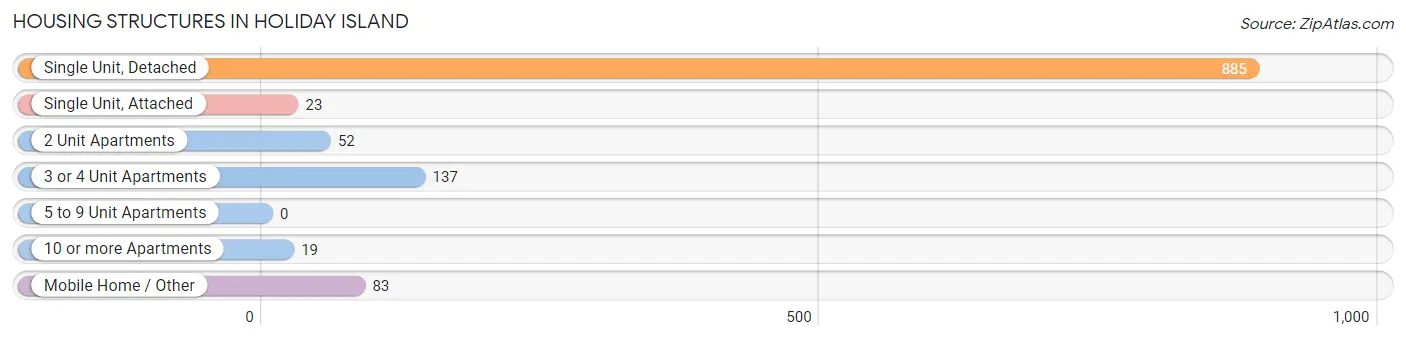
| Structure Type | # Housing Units | % Housing Units |
| Single Unit, Detached | 885 | 73.8% |
| Single Unit, Attached | 23 | 1.9% |
| 2 Unit Apartments | 52 | 4.3% |
| 3 or 4 Unit Apartments | 137 | 11.4% |
| 5 to 9 Unit Apartments | 0 | 0.0% |
| 10 or more Apartments | 19 | 1.6% |
| Mobile Home / Other | 83 | 6.9% |
| Total | 1,199 | 100.0% |
Housing Structures by Occupancy in Holiday Island
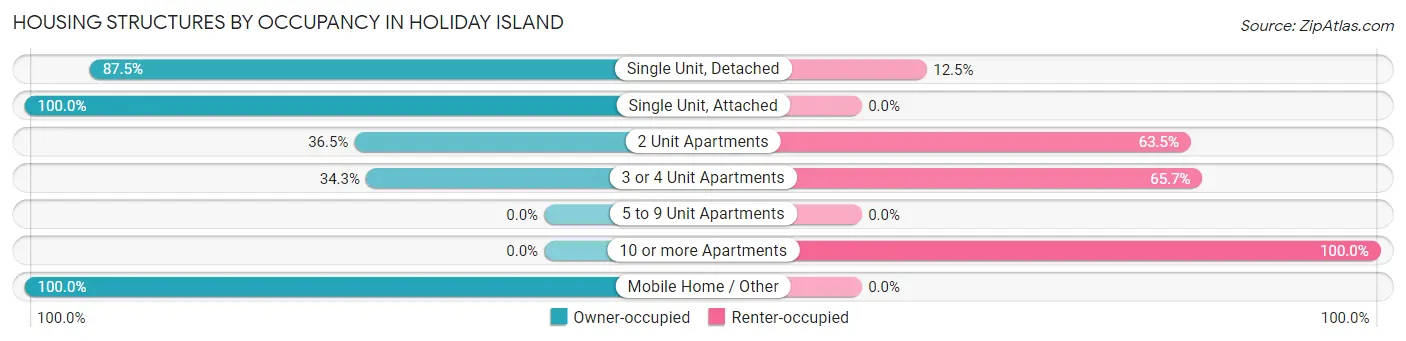
| Structure Type | Owner-occupied | Renter-occupied |
| Single Unit, Detached | 774 (87.5%) | 111 (12.5%) |
| Single Unit, Attached | 23 (100.0%) | 0 (0.0%) |
| 2 Unit Apartments | 19 (36.5%) | 33 (63.5%) |
| 3 or 4 Unit Apartments | 47 (34.3%) | 90 (65.7%) |
| 5 to 9 Unit Apartments | 0 (0.0%) | 0 (0.0%) |
| 10 or more Apartments | 0 (0.0%) | 19 (100.0%) |
| Mobile Home / Other | 83 (100.0%) | 0 (0.0%) |
| Total | 946 (78.9%) | 253 (21.1%) |
Housing Structures by Number of Rooms in Holiday Island
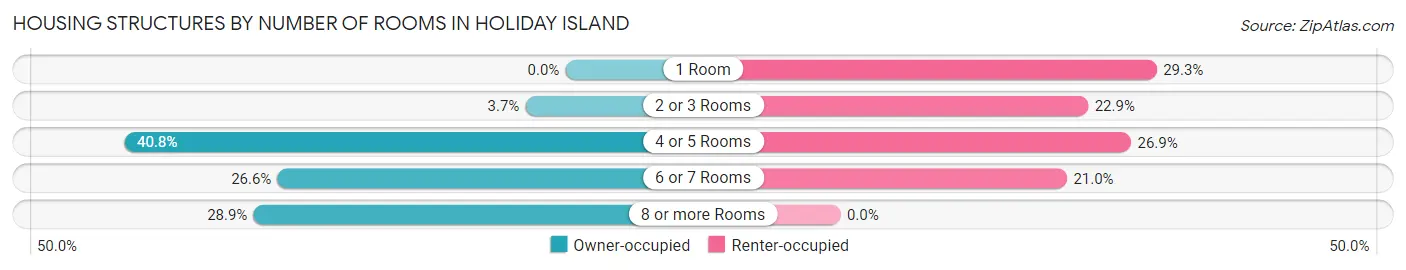
| Number of Rooms | Owner-occupied | Renter-occupied |
| 1 Room | 0 (0.0%) | 74 (29.2%) |
| 2 or 3 Rooms | 35 (3.7%) | 58 (22.9%) |
| 4 or 5 Rooms | 386 (40.8%) | 68 (26.9%) |
| 6 or 7 Rooms | 252 (26.6%) | 53 (20.9%) |
| 8 or more Rooms | 273 (28.9%) | 0 (0.0%) |
| Total | 946 (100.0%) | 253 (100.0%) |
Housing Structure by Heating Type in Holiday Island
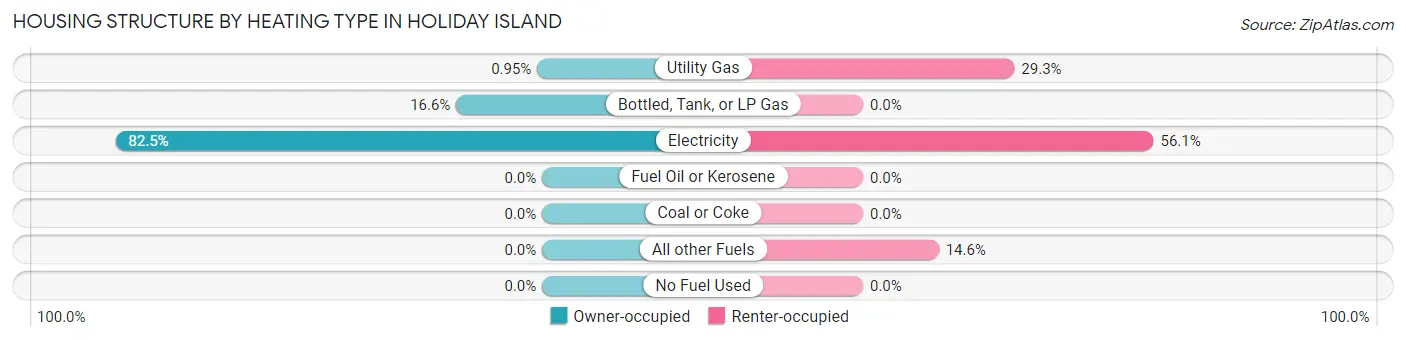
| Heating Type | Owner-occupied | Renter-occupied |
| Utility Gas | 9 (0.9%) | 74 (29.2%) |
| Bottled, Tank, or LP Gas | 157 (16.6%) | 0 (0.0%) |
| Electricity | 780 (82.5%) | 142 (56.1%) |
| Fuel Oil or Kerosene | 0 (0.0%) | 0 (0.0%) |
| Coal or Coke | 0 (0.0%) | 0 (0.0%) |
| All other Fuels | 0 (0.0%) | 37 (14.6%) |
| No Fuel Used | 0 (0.0%) | 0 (0.0%) |
| Total | 946 (100.0%) | 253 (100.0%) |
Household Vehicle Usage in Holiday Island
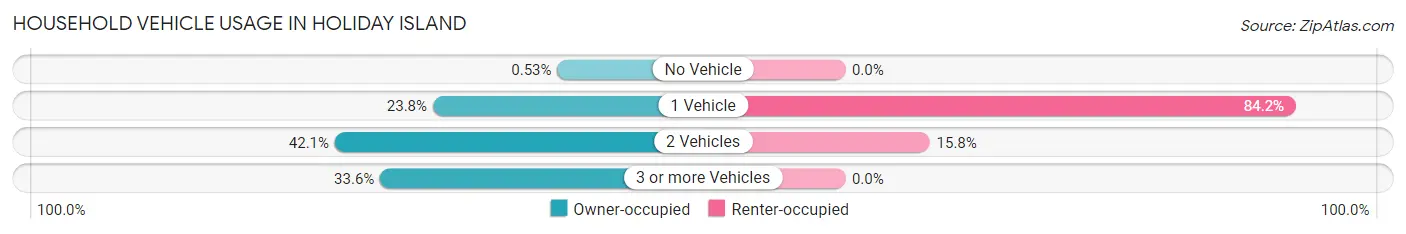
| Vehicles per Household | Owner-occupied | Renter-occupied |
| No Vehicle | 5 (0.5%) | 0 (0.0%) |
| 1 Vehicle | 225 (23.8%) | 213 (84.2%) |
| 2 Vehicles | 398 (42.1%) | 40 (15.8%) |
| 3 or more Vehicles | 318 (33.6%) | 0 (0.0%) |
| Total | 946 (100.0%) | 253 (100.0%) |
Real Estate & Mortgages in Holiday Island
Real Estate and Mortgage Overview in Holiday Island
| Characteristic | Without Mortgage | With Mortgage |
| Housing Units | 478 | 468 |
| Median Property Value | $186,600 | $190,600 |
| Median Household Income | $50,047 | $0 |
| Monthly Housing Costs | $483 | $0 |
| Real Estate Taxes | $1,312 | $0 |
Property Value by Mortgage Status in Holiday Island
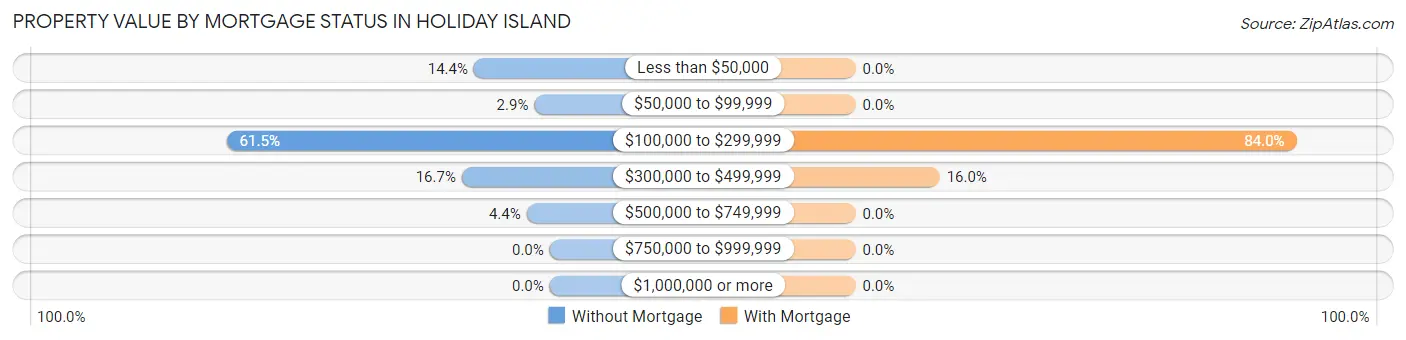
| Property Value | Without Mortgage | With Mortgage |
| Less than $50,000 | 69 (14.4%) | 0 (0.0%) |
| $50,000 to $99,999 | 14 (2.9%) | 0 (0.0%) |
| $100,000 to $299,999 | 294 (61.5%) | 393 (84.0%) |
| $300,000 to $499,999 | 80 (16.7%) | 75 (16.0%) |
| $500,000 to $749,999 | 21 (4.4%) | 0 (0.0%) |
| $750,000 to $999,999 | 0 (0.0%) | 0 (0.0%) |
| $1,000,000 or more | 0 (0.0%) | 0 (0.0%) |
| Total | 478 (100.0%) | 468 (100.0%) |
Household Income by Mortgage Status in Holiday Island
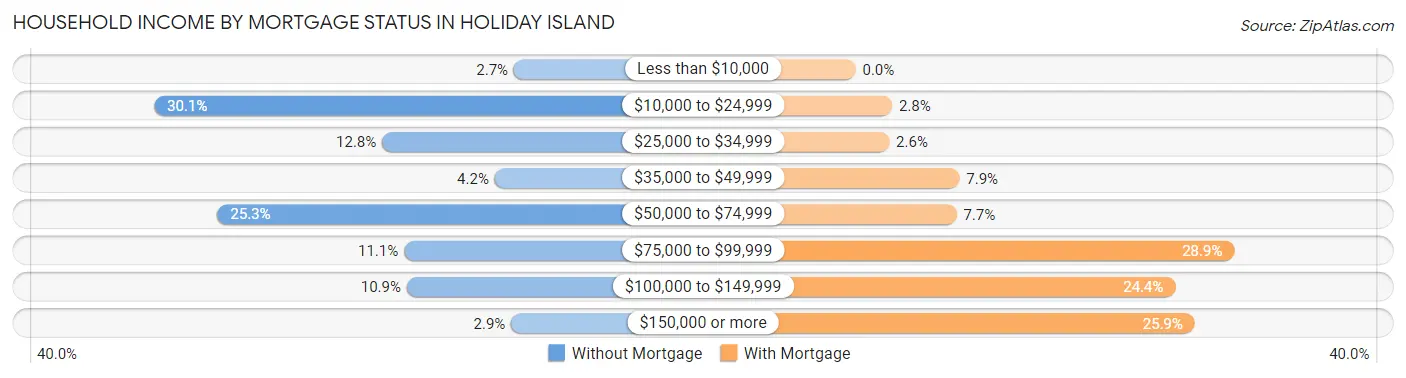
| Household Income | Without Mortgage | With Mortgage |
| Less than $10,000 | 13 (2.7%) | 0 (0.0%) |
| $10,000 to $24,999 | 144 (30.1%) | 13 (2.8%) |
| $25,000 to $34,999 | 61 (12.8%) | 12 (2.6%) |
| $35,000 to $49,999 | 20 (4.2%) | 37 (7.9%) |
| $50,000 to $74,999 | 121 (25.3%) | 36 (7.7%) |
| $75,000 to $99,999 | 53 (11.1%) | 135 (28.8%) |
| $100,000 to $149,999 | 52 (10.9%) | 114 (24.4%) |
| $150,000 or more | 14 (2.9%) | 121 (25.9%) |
| Total | 478 (100.0%) | 468 (100.0%) |
Property Value to Household Income Ratio in Holiday Island
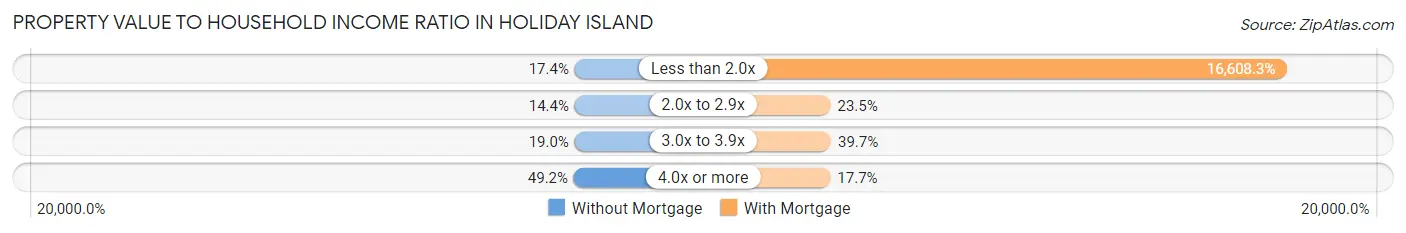
| Value-to-Income Ratio | Without Mortgage | With Mortgage |
| Less than 2.0x | 83 (17.4%) | 77,727 (16,608.3%) |
| 2.0x to 2.9x | 69 (14.4%) | 110 (23.5%) |
| 3.0x to 3.9x | 91 (19.0%) | 186 (39.7%) |
| 4.0x or more | 235 (49.2%) | 83 (17.7%) |
| Total | 478 (100.0%) | 468 (100.0%) |
Real Estate Taxes by Mortgage Status in Holiday Island
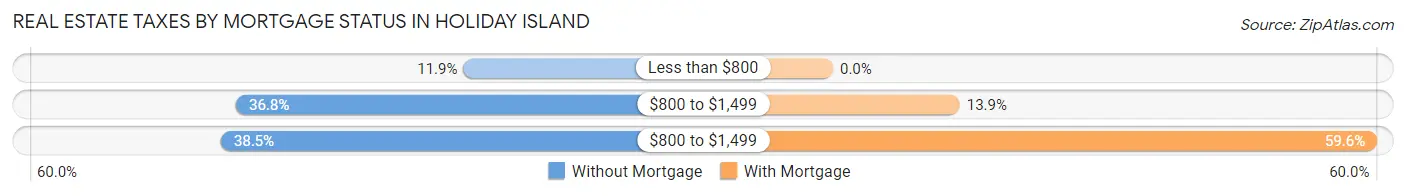
| Property Taxes | Without Mortgage | With Mortgage |
| Less than $800 | 57 (11.9%) | 0 (0.0%) |
| $800 to $1,499 | 176 (36.8%) | 65 (13.9%) |
| $800 to $1,499 | 184 (38.5%) | 279 (59.6%) |
| Total | 478 (100.0%) | 468 (100.0%) |
Health & Disability in Holiday Island
Health Insurance Coverage by Age in Holiday Island
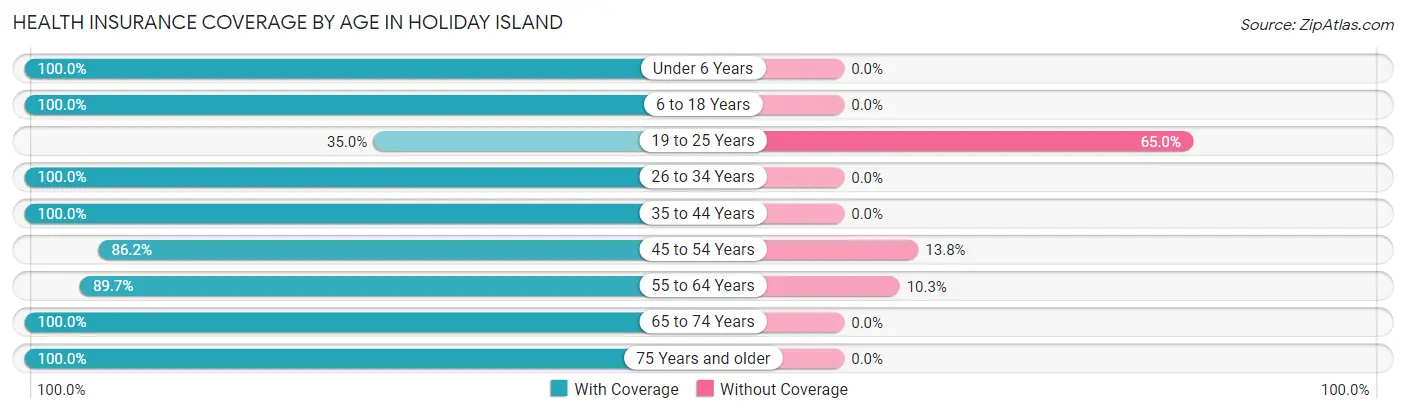
| Age Bracket | With Coverage | Without Coverage |
| Under 6 Years | 57 (100.0%) | 0 (0.0%) |
| 6 to 18 Years | 180 (100.0%) | 0 (0.0%) |
| 19 to 25 Years | 69 (35.0%) | 128 (65.0%) |
| 26 to 34 Years | 87 (100.0%) | 0 (0.0%) |
| 35 to 44 Years | 126 (100.0%) | 0 (0.0%) |
| 45 to 54 Years | 187 (86.2%) | 30 (13.8%) |
| 55 to 64 Years | 356 (89.7%) | 41 (10.3%) |
| 65 to 74 Years | 565 (100.0%) | 0 (0.0%) |
| 75 Years and older | 511 (100.0%) | 0 (0.0%) |
| Total | 2,138 (91.5%) | 199 (8.5%) |
Health Insurance Coverage by Citizenship Status in Holiday Island
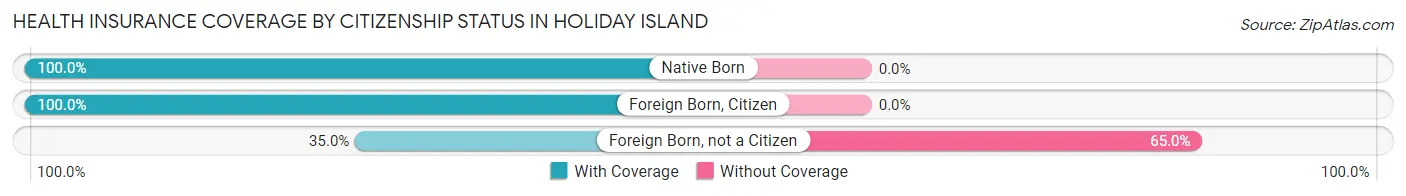
| Citizenship Status | With Coverage | Without Coverage |
| Native Born | 57 (100.0%) | 0 (0.0%) |
| Foreign Born, Citizen | 180 (100.0%) | 0 (0.0%) |
| Foreign Born, not a Citizen | 69 (35.0%) | 128 (65.0%) |
Health Insurance Coverage by Household Income in Holiday Island
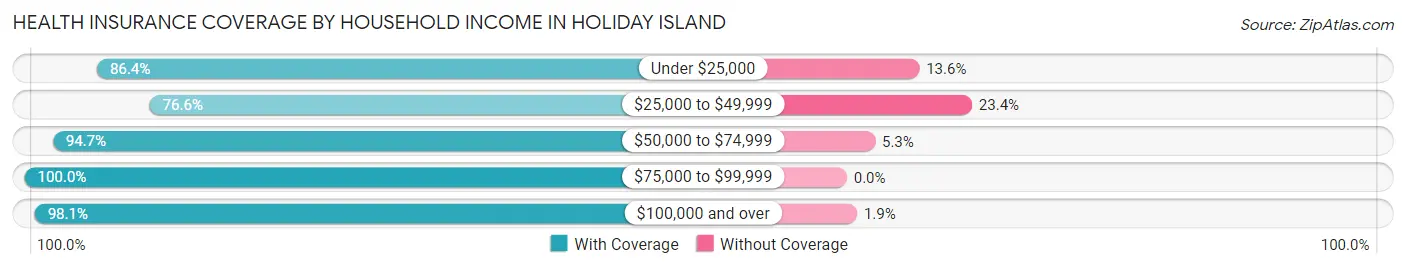
| Household Income | With Coverage | Without Coverage |
| Under $25,000 | 191 (86.4%) | 30 (13.6%) |
| $25,000 to $49,999 | 418 (76.6%) | 128 (23.4%) |
| $50,000 to $74,999 | 555 (94.7%) | 31 (5.3%) |
| $75,000 to $99,999 | 459 (100.0%) | 0 (0.0%) |
| $100,000 and over | 515 (98.1%) | 10 (1.9%) |
Public vs Private Health Insurance Coverage by Age in Holiday Island
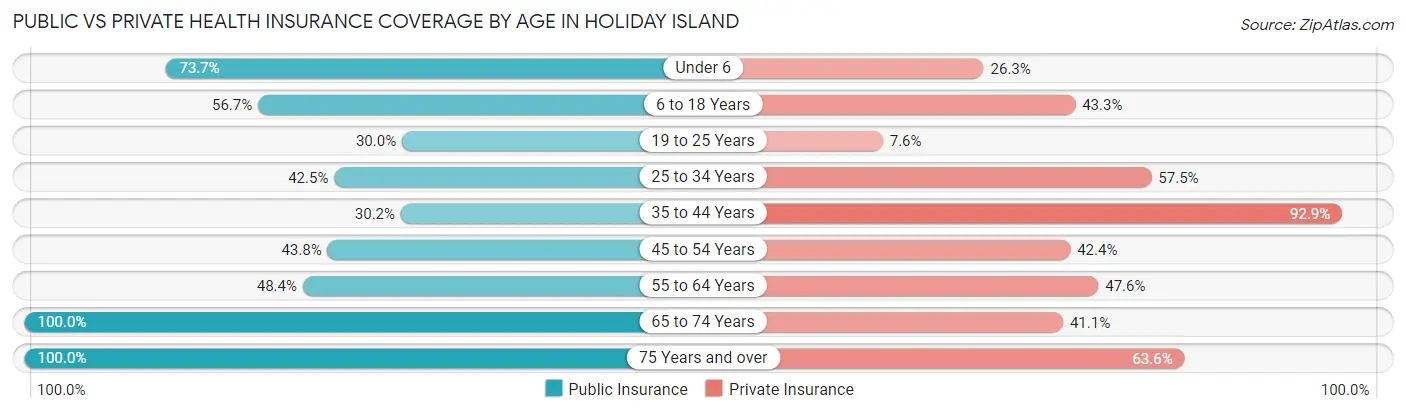
| Age Bracket | Public Insurance | Private Insurance |
| Under 6 | 42 (73.7%) | 15 (26.3%) |
| 6 to 18 Years | 102 (56.7%) | 78 (43.3%) |
| 19 to 25 Years | 59 (29.9%) | 15 (7.6%) |
| 25 to 34 Years | 37 (42.5%) | 50 (57.5%) |
| 35 to 44 Years | 38 (30.2%) | 117 (92.9%) |
| 45 to 54 Years | 95 (43.8%) | 92 (42.4%) |
| 55 to 64 Years | 192 (48.4%) | 189 (47.6%) |
| 65 to 74 Years | 565 (100.0%) | 232 (41.1%) |
| 75 Years and over | 511 (100.0%) | 325 (63.6%) |
| Total | 1,641 (70.2%) | 1,113 (47.6%) |
Disability Status by Sex by Age in Holiday Island
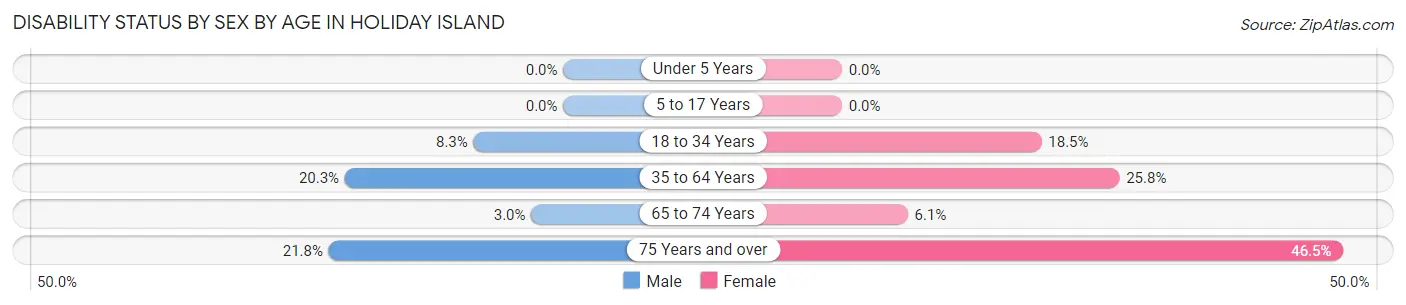
| Age Bracket | Male | Female |
| Under 5 Years | 0 (0.0%) | 0 (0.0%) |
| 5 to 17 Years | 0 (0.0%) | 0 (0.0%) |
| 18 to 34 Years | 13 (8.3%) | 30 (18.5%) |
| 35 to 64 Years | 76 (20.3%) | 94 (25.8%) |
| 65 to 74 Years | 9 (3.0%) | 16 (6.1%) |
| 75 Years and over | 64 (21.8%) | 101 (46.5%) |
Disability Class by Sex by Age in Holiday Island
Disability Class: Hearing Difficulty
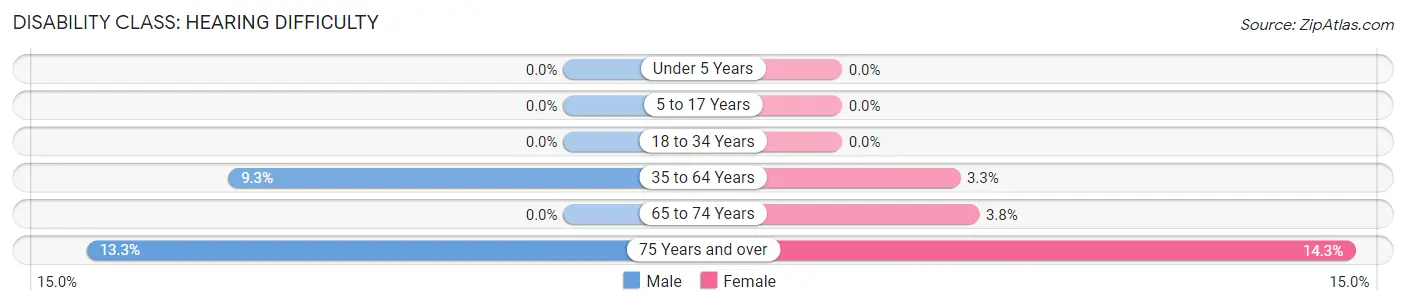
| Age Bracket | Male | Female |
| Under 5 Years | 0 (0.0%) | 0 (0.0%) |
| 5 to 17 Years | 0 (0.0%) | 0 (0.0%) |
| 18 to 34 Years | 0 (0.0%) | 0 (0.0%) |
| 35 to 64 Years | 35 (9.3%) | 12 (3.3%) |
| 65 to 74 Years | 0 (0.0%) | 10 (3.8%) |
| 75 Years and over | 39 (13.3%) | 31 (14.3%) |
Disability Class: Vision Difficulty
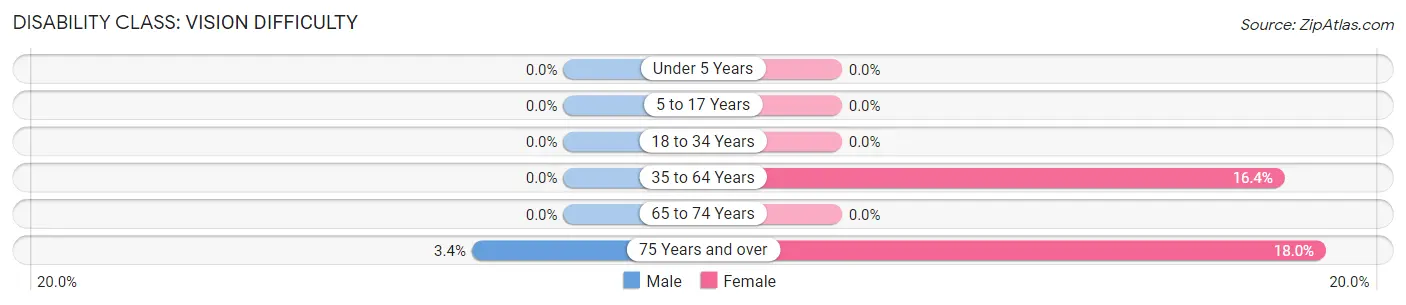
| Age Bracket | Male | Female |
| Under 5 Years | 0 (0.0%) | 0 (0.0%) |
| 5 to 17 Years | 0 (0.0%) | 0 (0.0%) |
| 18 to 34 Years | 0 (0.0%) | 0 (0.0%) |
| 35 to 64 Years | 0 (0.0%) | 60 (16.4%) |
| 65 to 74 Years | 0 (0.0%) | 0 (0.0%) |
| 75 Years and over | 10 (3.4%) | 39 (18.0%) |
Disability Class: Cognitive Difficulty
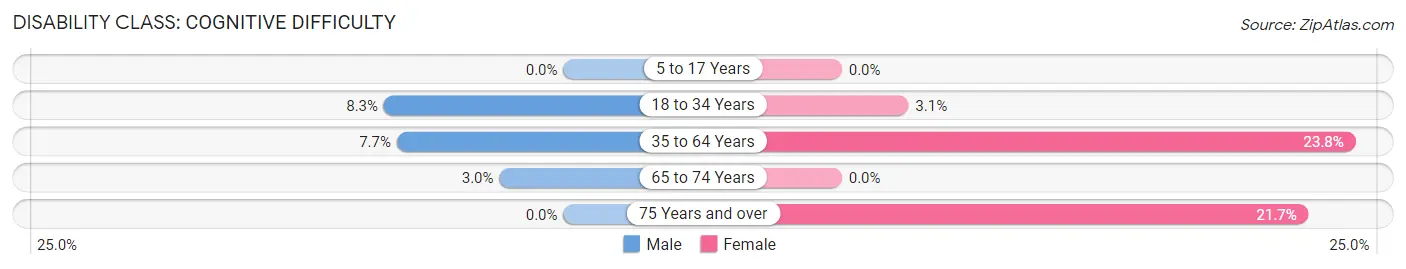
| Age Bracket | Male | Female |
| 5 to 17 Years | 0 (0.0%) | 0 (0.0%) |
| 18 to 34 Years | 13 (8.3%) | 5 (3.1%) |
| 35 to 64 Years | 29 (7.7%) | 87 (23.8%) |
| 65 to 74 Years | 9 (3.0%) | 0 (0.0%) |
| 75 Years and over | 0 (0.0%) | 47 (21.7%) |
Disability Class: Ambulatory Difficulty
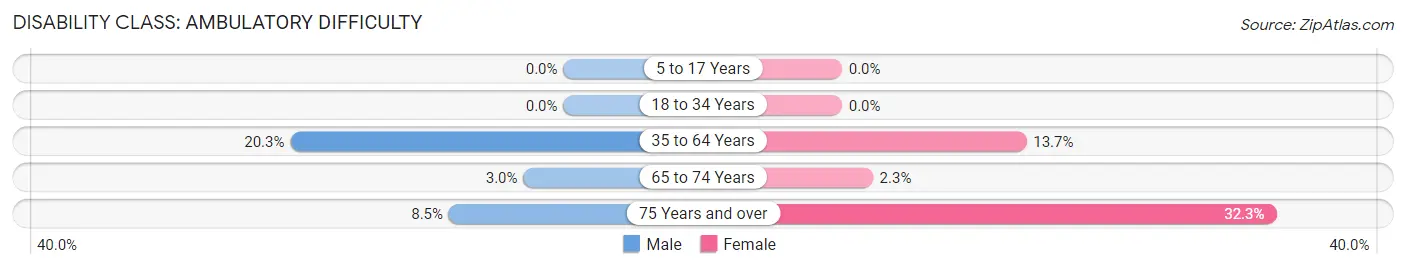
| Age Bracket | Male | Female |
| 5 to 17 Years | 0 (0.0%) | 0 (0.0%) |
| 18 to 34 Years | 0 (0.0%) | 0 (0.0%) |
| 35 to 64 Years | 76 (20.3%) | 50 (13.7%) |
| 65 to 74 Years | 9 (3.0%) | 6 (2.3%) |
| 75 Years and over | 25 (8.5%) | 70 (32.3%) |
Disability Class: Self-Care Difficulty
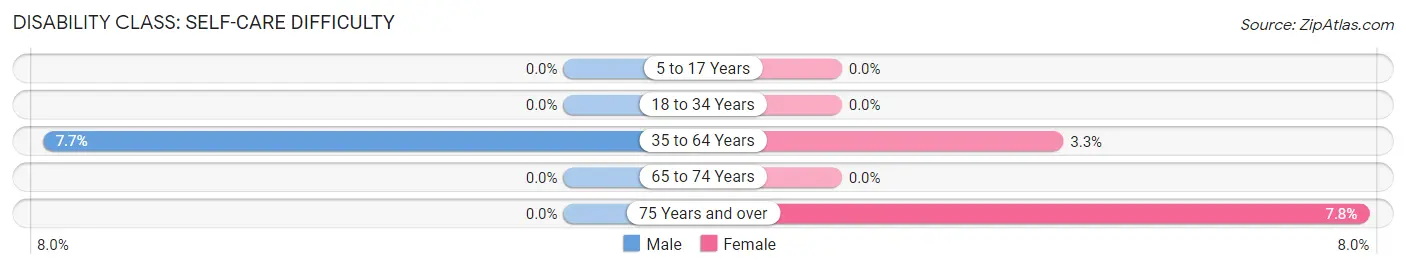
| Age Bracket | Male | Female |
| 5 to 17 Years | 0 (0.0%) | 0 (0.0%) |
| 18 to 34 Years | 0 (0.0%) | 0 (0.0%) |
| 35 to 64 Years | 29 (7.7%) | 12 (3.3%) |
| 65 to 74 Years | 0 (0.0%) | 0 (0.0%) |
| 75 Years and over | 0 (0.0%) | 17 (7.8%) |
Technology Access in Holiday Island
Computing Device Access in Holiday Island
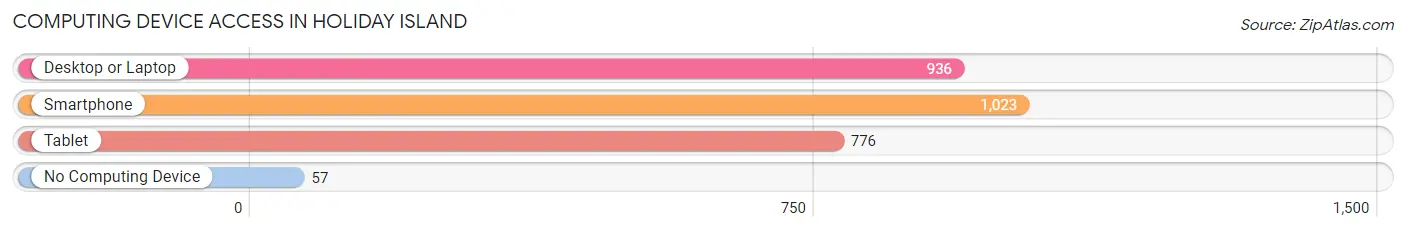
| Device Type | # Households | % Households |
| Desktop or Laptop | 936 | 78.1% |
| Smartphone | 1,023 | 85.3% |
| Tablet | 776 | 64.7% |
| No Computing Device | 57 | 4.8% |
| Total | 1,199 | 100.0% |
Internet Access in Holiday Island
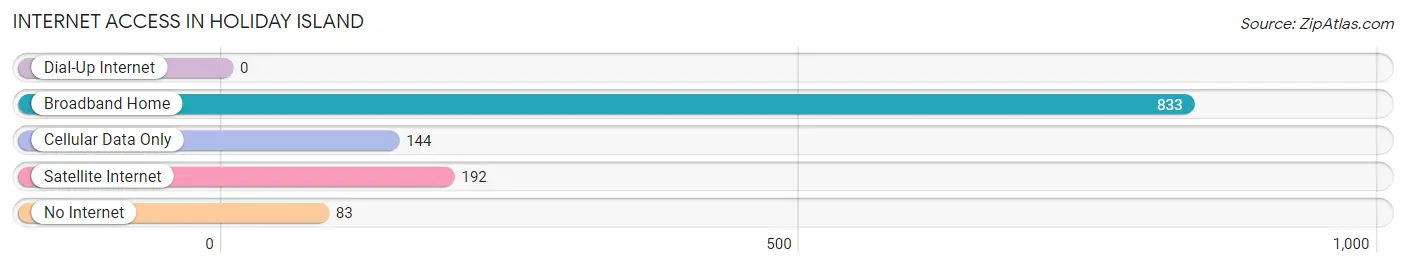
| Internet Type | # Households | % Households |
| Dial-Up Internet | 0 | 0.0% |
| Broadband Home | 833 | 69.5% |
| Cellular Data Only | 144 | 12.0% |
| Satellite Internet | 192 | 16.0% |
| No Internet | 83 | 6.9% |
| Total | 1,199 | 100.0% |
Holiday Island Summary
Holiday Island is a census-designated place (CDP) located in Carroll County, Arkansas, United States. It is situated in the Ozark Mountains, near the Arkansas-Missouri border. The population was 1,845 at the 2010 census.
History
Holiday Island was founded in the late 1960s by the Holiday Island Development Corporation. The corporation purchased the land from the United States Army Corps of Engineers, which had acquired it from the original owners in the 1950s. The development corporation planned to create a resort community, and the area was incorporated as a town in 1971.
The town was named after the Holiday Island Resort, which was built in the late 1960s. The resort was a popular destination for vacationers, and it included a golf course, tennis courts, and a marina. The resort was eventually sold to a private developer in the late 1990s, and the town was disincorporated in 2000.
Geography
Holiday Island is located in the Ozark Mountains of northwestern Arkansas, near the Arkansas-Missouri border. It is situated on the south shore of Table Rock Lake, a reservoir created by the damming of the White River. The CDP has a total area of 8.3 square miles, all of which is land.
Economy
The economy of Holiday Island is largely based on tourism. The area is a popular destination for vacationers, and it is home to several resorts, campgrounds, and marinas. The town also has several restaurants, shops, and other businesses catering to tourists.
Demographics
As of the 2010 census, there were 1,845 people, 845 households, and 545 families residing in the CDP. The population density was 222.2 people per square mile. There were 1,093 housing units at an average density of 131.7 per square mile. The racial makeup of the CDP was 97.2% White, 0.3% African American, 0.2% Native American, 0.4% Asian, 0.1% Pacific Islander, 0.7% from other races, and 1.1% from two or more races. Hispanic or Latino of any race were 2.2% of the population.
There were 845 households, out of which 16.2% had children under the age of 18 living with them, 54.2% were married couples living together, 7.2% had a female householder with no husband present, and 35.2% were non-families. 29.2% of all households were made up of individuals, and 11.2% had someone living alone who was 65 years of age or older. The average household size was 2.17 and the average family size was 2.63.
In the CDP, the population was spread out, with 16.2% under the age of 18, 5.2% from 18 to 24, 19.2% from 25 to 44, 34.2% from 45 to 64, and 25.2% who were 65 years of age or older. The median age was 51 years. For every 100 females, there were 97.2 males. For every 100 females age 18 and over, there were 95.2 males.
The median income for a household in the CDP was $41,250, and the median income for a family was $50,000. Males had a median income of $35,000 versus $25,000 for females. The per capita income for the CDP was $25,845. About 4.2% of families and 6.2% of the population were below the poverty line, including 8.2% of those under age 18 and 4.2% of those age 65 or over.
Common Questions
What is Per Capita Income in Holiday Island?
Per Capita income in Holiday Island is $31,522.
What is the Median Family Income in Holiday Island?
Median Family Income in Holiday Island is $71,806.
What is the Median Household income in Holiday Island?
Median Household Income in Holiday Island is $51,938.
What is Income or Wage Gap in Holiday Island?
Income or Wage Gap in Holiday Island is 33.1%.
Women in Holiday Island earn 66.9 cents for every dollar earned by a man.
What is Inequality or Gini Index in Holiday Island?
Inequality or Gini Index in Holiday Island is 0.38.
What is the Total Population of Holiday Island?
Total Population of Holiday Island is 2,358.
What is the Total Male Population of Holiday Island?
Total Male Population of Holiday Island is 1,288.
What is the Total Female Population of Holiday Island?
Total Female Population of Holiday Island is 1,070.
What is the Ratio of Males per 100 Females in Holiday Island?
There are 120.37 Males per 100 Females in Holiday Island.
What is the Ratio of Females per 100 Males in Holiday Island?
There are 83.07 Females per 100 Males in Holiday Island.
What is the Median Population Age in Holiday Island?
Median Population Age in Holiday Island is 63.4 Years.
What is the Average Family Size in Holiday Island
Average Family Size in Holiday Island is 2.5 People.
What is the Average Household Size in Holiday Island
Average Household Size in Holiday Island is 1.9 People.
How Large is the Labor Force in Holiday Island?
There are 1,014 People in the Labor Forcein in Holiday Island.
What is the Percentage of People in the Labor Force in Holiday Island?
45.8% of People are in the Labor Force in Holiday Island.
What is the Unemployment Rate in Holiday Island?
Unemployment Rate in Holiday Island is 3.7%.