Lake Hamilton, AR Map & Demographics
Lake Hamilton Map
Lake Hamilton Overview
$50,741
PER CAPITA INCOME
$85,296
AVG FAMILY INCOME
$62,130
AVG HOUSEHOLD INCOME
0.52
INEQUALITY / GINI INDEX
2,031
TOTAL POPULATION
920
MALE POPULATION
1,111
FEMALE POPULATION
82.81
MALES / 100 FEMALES
120.76
FEMALES / 100 MALES
42.6
MEDIAN AGE
2.7
AVG FAMILY SIZE
2.3
AVG HOUSEHOLD SIZE
825
LABOR FORCE [ PEOPLE ]
52.4%
PERCENT IN LABOR FORCE
Lake Hamilton Area Codes
Income in Lake Hamilton
Income Overview in Lake Hamilton
Per Capita Income in Lake Hamilton is $50,741, while median incomes of families and households are $85,296 and $62,130 respectively.
| Characteristic | Number | Measure |
| Per Capita Income | 2,031 | $50,741 |
| Median Family Income | 555 | $85,296 |
| Mean Family Income | 555 | $144,230 |
| Median Household Income | 892 | $62,130 |
| Mean Household Income | 892 | $119,396 |
| Income Deficit | 555 | $0 |
| Wage / Income Gap (%) | 2,031 | 0.00% |
| Wage / Income Gap ($) | 2,031 | 100.00¢ per $1 |
| Gini / Inequality Index | 2,031 | 0.52 |
Earnings by Sex in Lake Hamilton
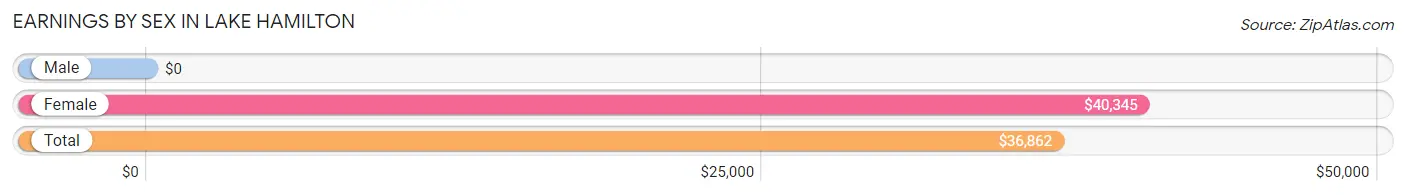
| Sex | Number | Average Earnings |
| Male | 481 (57.3%) | $0 |
| Female | 358 (42.7%) | $40,345 |
| Total | 839 (100.0%) | $36,862 |
Earnings by Sex by Income Bracket in Lake Hamilton
The most common earnings brackets in Lake Hamilton are $75,000 to $99,999 for men (97 | 20.2%) and $22,500 to $24,999 for women (95 | 26.5%).
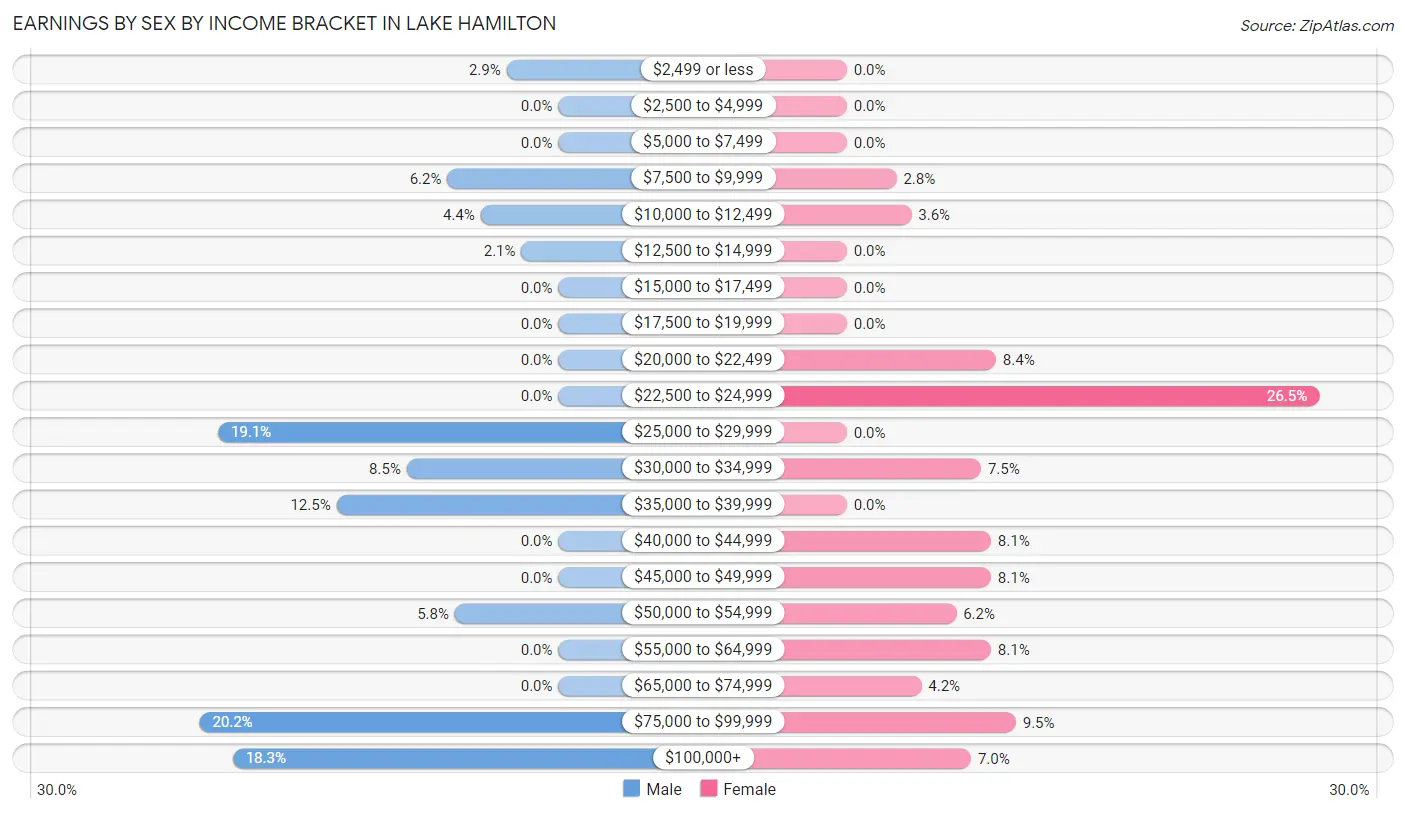
| Income | Male | Female |
| $2,499 or less | 14 (2.9%) | 0 (0.0%) |
| $2,500 to $4,999 | 0 (0.0%) | 0 (0.0%) |
| $5,000 to $7,499 | 0 (0.0%) | 0 (0.0%) |
| $7,500 to $9,999 | 30 (6.2%) | 10 (2.8%) |
| $10,000 to $12,499 | 21 (4.4%) | 13 (3.6%) |
| $12,500 to $14,999 | 10 (2.1%) | 0 (0.0%) |
| $15,000 to $17,499 | 0 (0.0%) | 0 (0.0%) |
| $17,500 to $19,999 | 0 (0.0%) | 0 (0.0%) |
| $20,000 to $22,499 | 0 (0.0%) | 30 (8.4%) |
| $22,500 to $24,999 | 0 (0.0%) | 95 (26.5%) |
| $25,000 to $29,999 | 92 (19.1%) | 0 (0.0%) |
| $30,000 to $34,999 | 41 (8.5%) | 27 (7.5%) |
| $35,000 to $39,999 | 60 (12.5%) | 0 (0.0%) |
| $40,000 to $44,999 | 0 (0.0%) | 29 (8.1%) |
| $45,000 to $49,999 | 0 (0.0%) | 29 (8.1%) |
| $50,000 to $54,999 | 28 (5.8%) | 22 (6.1%) |
| $55,000 to $64,999 | 0 (0.0%) | 29 (8.1%) |
| $65,000 to $74,999 | 0 (0.0%) | 15 (4.2%) |
| $75,000 to $99,999 | 97 (20.2%) | 34 (9.5%) |
| $100,000+ | 88 (18.3%) | 25 (7.0%) |
| Total | 481 (100.0%) | 358 (100.0%) |
Earnings by Sex by Educational Attainment in Lake Hamilton
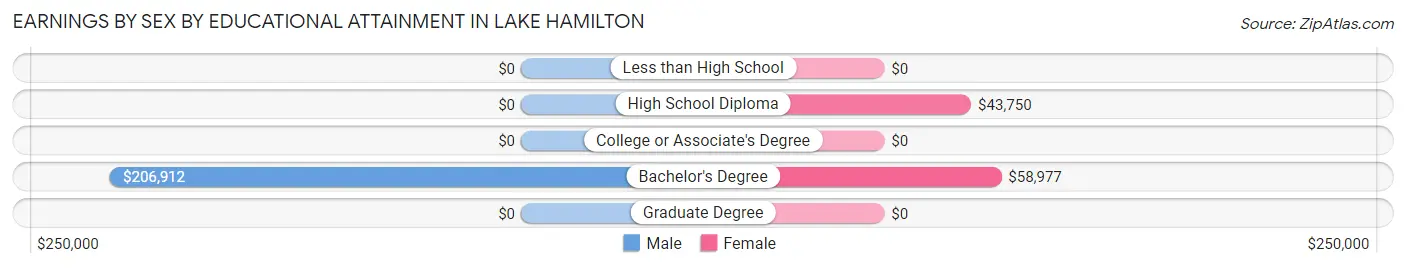
| Educational Attainment | Male Income | Female Income |
| Less than High School | - | - |
| High School Diploma | - | - |
| College or Associate's Degree | - | - |
| Bachelor's Degree | $206,912 | $58,977 |
| Graduate Degree | - | - |
| Total | - | - |
Family Income in Lake Hamilton
Family Income Brackets in Lake Hamilton
According to the Lake Hamilton family income data, there are 144 families falling into the $35,000 to $49,999 income range, which is the most common income bracket and makes up 26.0% of all families.
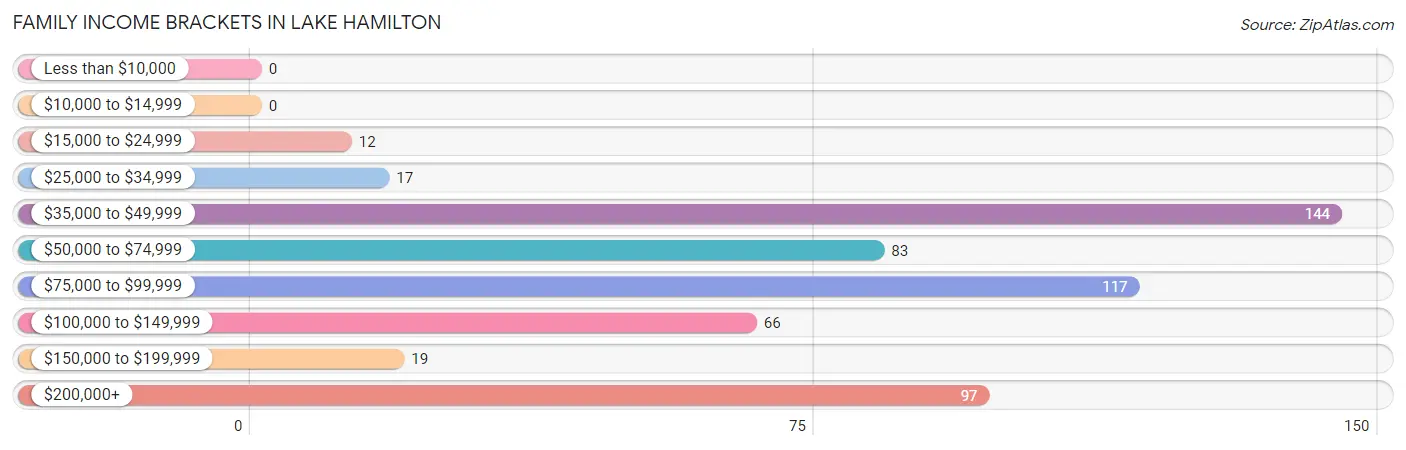
| Income Bracket | # Families | % Families |
| Less than $10,000 | 0 | 0.0% |
| $10,000 to $14,999 | 0 | 0.0% |
| $15,000 to $24,999 | 12 | 2.2% |
| $25,000 to $34,999 | 17 | 3.1% |
| $35,000 to $49,999 | 144 | 25.9% |
| $50,000 to $74,999 | 83 | 15.0% |
| $75,000 to $99,999 | 117 | 21.1% |
| $100,000 to $149,999 | 66 | 11.9% |
| $150,000 to $199,999 | 19 | 3.4% |
| $200,000+ | 97 | 17.5% |
Family Income by Famaliy Size in Lake Hamilton
2-person families (386 | 69.6%) account for the highest median family income in Lake Hamilton with $54,773 per family, while 2-person families (386 | 69.6%) have the highest median income of $27,386 per family member.
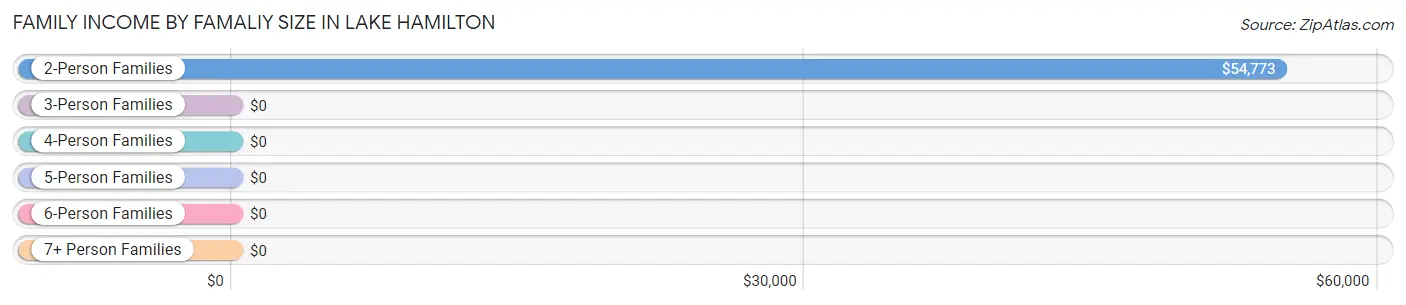
| Income Bracket | # Families | Median Income |
| 2-Person Families | 386 (69.6%) | $54,773 |
| 3-Person Families | 13 (2.3%) | $0 |
| 4-Person Families | 59 (10.6%) | $0 |
| 5-Person Families | 0 (0.0%) | $0 |
| 6-Person Families | 0 (0.0%) | $0 |
| 7+ Person Families | 97 (17.5%) | $0 |
| Total | 555 (100.0%) | $85,296 |
Family Income by Number of Earners in Lake Hamilton
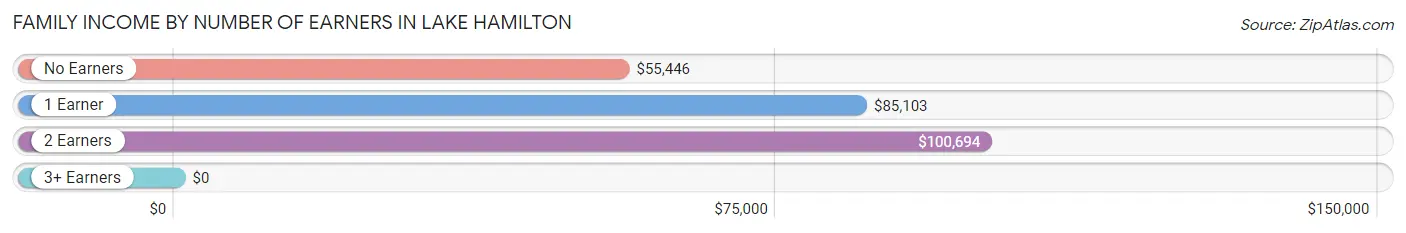
| Number of Earners | # Families | Median Income |
| No Earners | 83 (14.9%) | $55,446 |
| 1 Earner | 366 (65.9%) | $85,103 |
| 2 Earners | 79 (14.2%) | $100,694 |
| 3+ Earners | 27 (4.9%) | $0 |
| Total | 555 (100.0%) | $85,296 |
Household Income in Lake Hamilton
Household Income Brackets in Lake Hamilton
With 199 households falling in the category, the $35,000 to $49,999 income range is the most frequent in Lake Hamilton, accounting for 22.3% of all households.
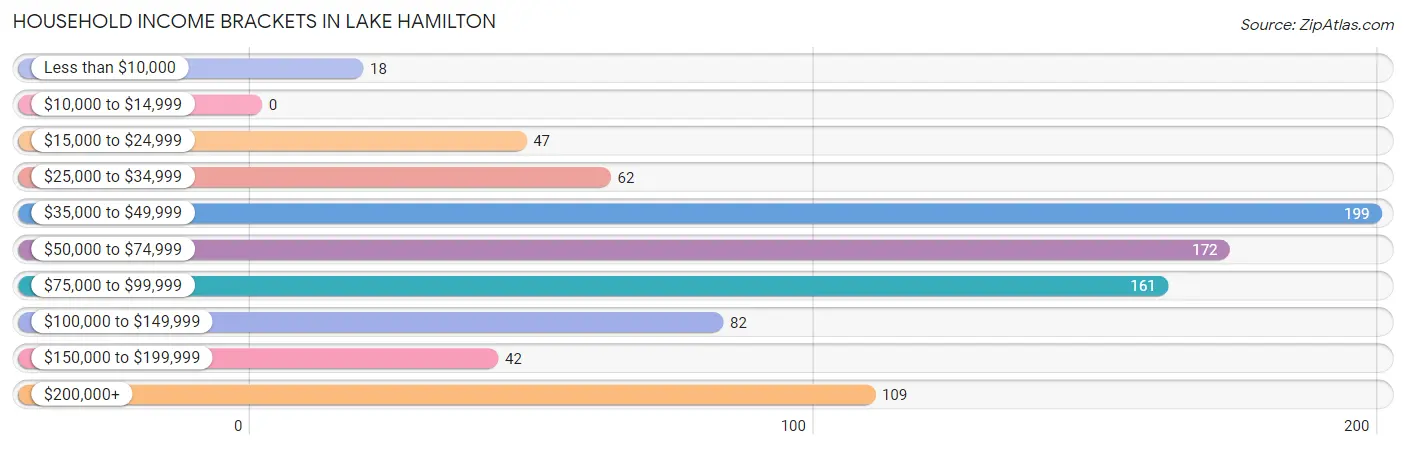
| Income Bracket | # Households | % Households |
| Less than $10,000 | 18 | 2.0% |
| $10,000 to $14,999 | 0 | 0.0% |
| $15,000 to $24,999 | 47 | 5.3% |
| $25,000 to $34,999 | 62 | 7.0% |
| $35,000 to $49,999 | 199 | 22.3% |
| $50,000 to $74,999 | 172 | 19.3% |
| $75,000 to $99,999 | 161 | 18.0% |
| $100,000 to $149,999 | 82 | 9.2% |
| $150,000 to $199,999 | 42 | 4.7% |
| $200,000+ | 109 | 12.2% |
Household Income by Householder Age in Lake Hamilton
The median household income in Lake Hamilton is $62,130, with the highest median household income of $101,450 found in the 45 to 64 years age bracket for the primary householder. A total of 193 households (21.6%) fall into this category.
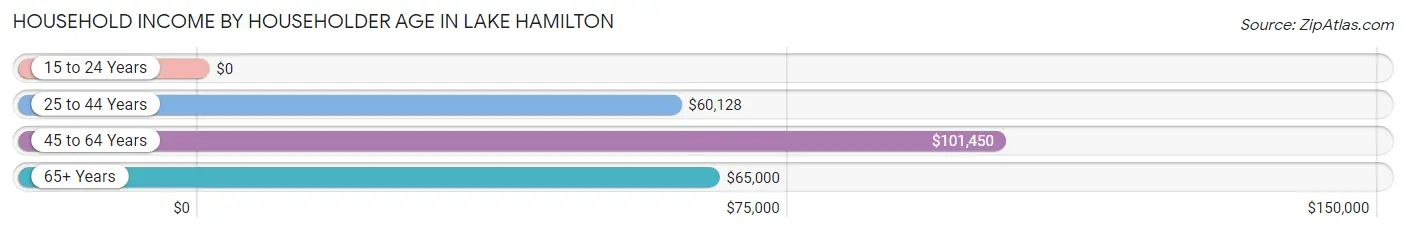
| Income Bracket | # Households | Median Income |
| 15 to 24 Years | 0 (0.0%) | $0 |
| 25 to 44 Years | 323 (36.2%) | $60,128 |
| 45 to 64 Years | 193 (21.6%) | $101,450 |
| 65+ Years | 376 (42.1%) | $65,000 |
| Total | 892 (100.0%) | $62,130 |
Poverty in Lake Hamilton
Income Below Poverty by Sex and Age in Lake Hamilton
With 2.5% poverty level for males and 10.5% for females among the residents of Lake Hamilton, 55 to 64 year old males and 35 to 44 year old females are the most vulnerable to poverty, with 23 males (16.4%) and 99 females (55.0%) in their respective age groups living below the poverty level.
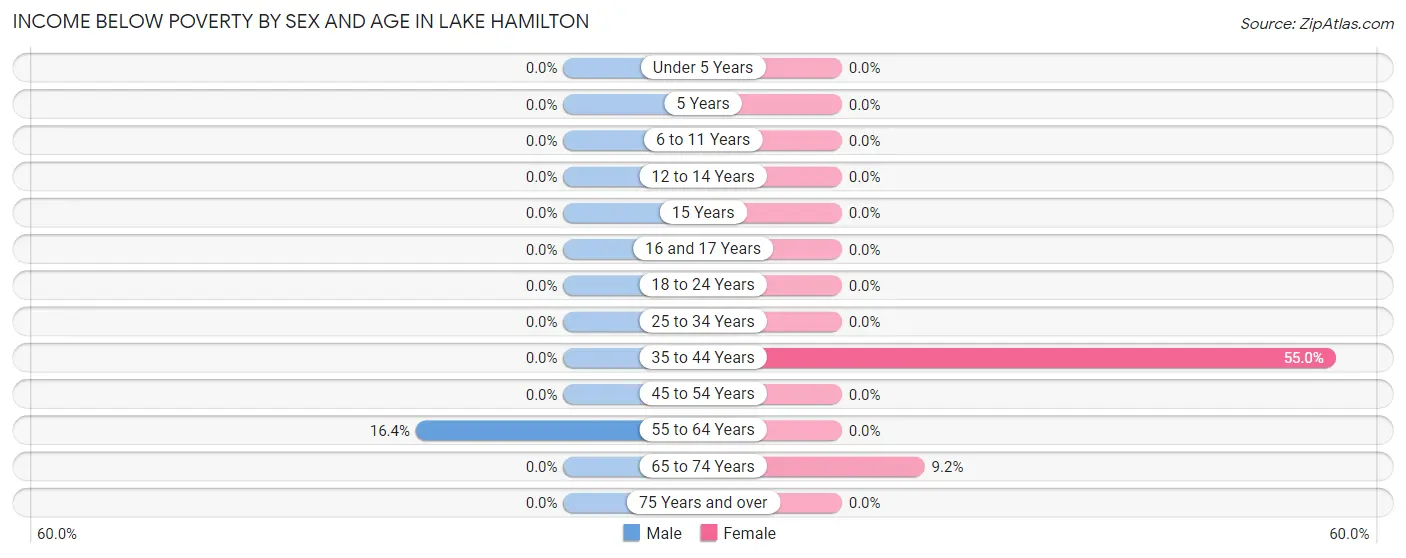
| Age Bracket | Male | Female |
| Under 5 Years | 0 (0.0%) | 0 (0.0%) |
| 5 Years | 0 (0.0%) | 0 (0.0%) |
| 6 to 11 Years | 0 (0.0%) | 0 (0.0%) |
| 12 to 14 Years | 0 (0.0%) | 0 (0.0%) |
| 15 Years | 0 (0.0%) | 0 (0.0%) |
| 16 and 17 Years | 0 (0.0%) | 0 (0.0%) |
| 18 to 24 Years | 0 (0.0%) | 0 (0.0%) |
| 25 to 34 Years | 0 (0.0%) | 0 (0.0%) |
| 35 to 44 Years | 0 (0.0%) | 99 (55.0%) |
| 45 to 54 Years | 0 (0.0%) | 0 (0.0%) |
| 55 to 64 Years | 23 (16.4%) | 0 (0.0%) |
| 65 to 74 Years | 0 (0.0%) | 18 (9.2%) |
| 75 Years and over | 0 (0.0%) | 0 (0.0%) |
| Total | 23 (2.5%) | 117 (10.5%) |
Income Above Poverty by Sex and Age in Lake Hamilton
According to the poverty statistics in Lake Hamilton, males aged under 5 years and females aged 6 to 11 years are the age groups that are most secure financially, with 100.0% of males and 100.0% of females in these age groups living above the poverty line.
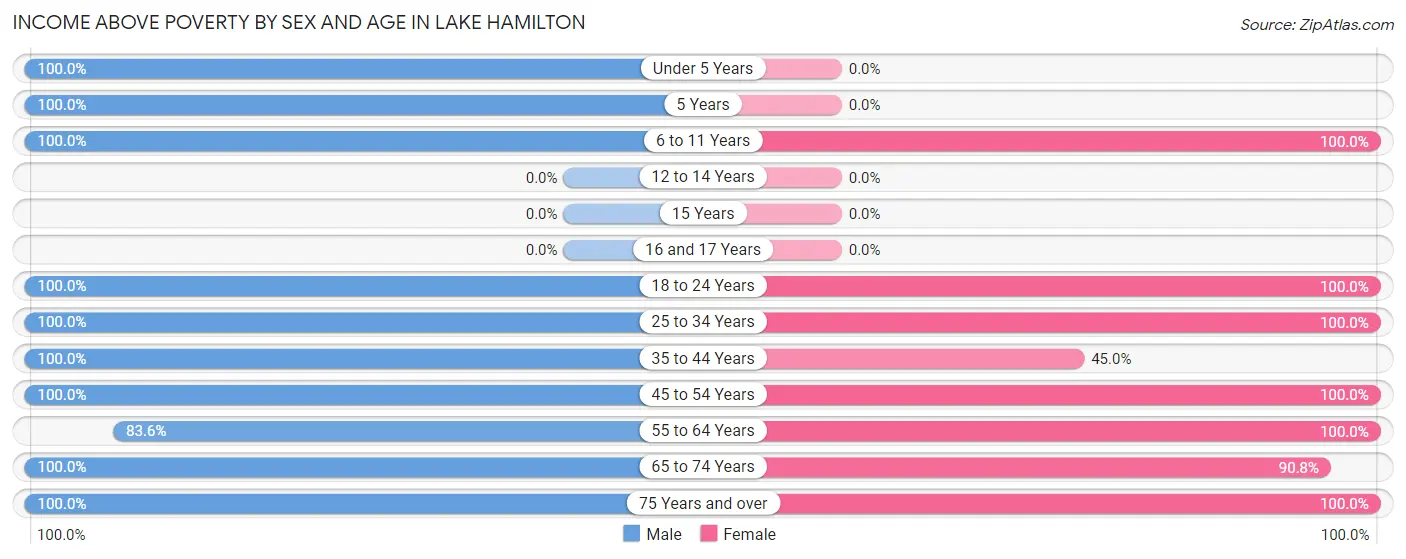
| Age Bracket | Male | Female |
| Under 5 Years | 26 (100.0%) | 0 (0.0%) |
| 5 Years | 25 (100.0%) | 0 (0.0%) |
| 6 to 11 Years | 167 (100.0%) | 238 (100.0%) |
| 12 to 14 Years | 0 (0.0%) | 0 (0.0%) |
| 15 Years | 0 (0.0%) | 0 (0.0%) |
| 16 and 17 Years | 0 (0.0%) | 0 (0.0%) |
| 18 to 24 Years | 14 (100.0%) | 42 (100.0%) |
| 25 to 34 Years | 38 (100.0%) | 77 (100.0%) |
| 35 to 44 Years | 251 (100.0%) | 81 (45.0%) |
| 45 to 54 Years | 20 (100.0%) | 51 (100.0%) |
| 55 to 64 Years | 117 (83.6%) | 211 (100.0%) |
| 65 to 74 Years | 131 (100.0%) | 177 (90.8%) |
| 75 Years and over | 108 (100.0%) | 117 (100.0%) |
| Total | 897 (97.5%) | 994 (89.5%) |
Income Below Poverty Among Married-Couple Families in Lake Hamilton
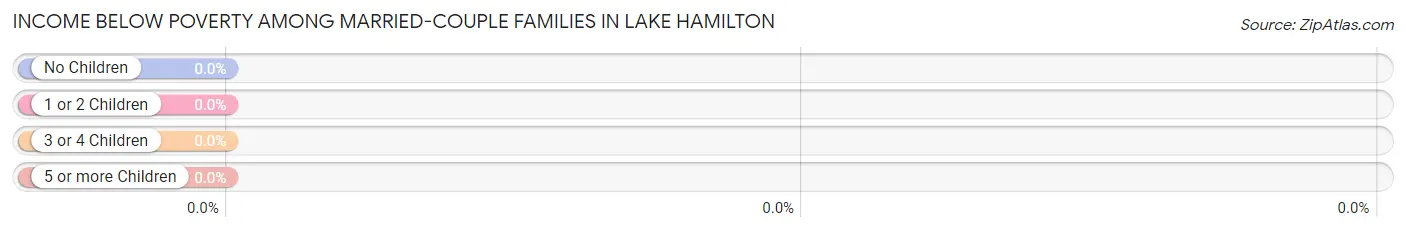
| Children | Above Poverty | Below Poverty |
| No Children | 286 (100.0%) | 0 (0.0%) |
| 1 or 2 Children | 45 (100.0%) | 0 (0.0%) |
| 3 or 4 Children | 0 (0.0%) | 0 (0.0%) |
| 5 or more Children | 0 (0.0%) | 0 (0.0%) |
| Total | 331 (100.0%) | 0 (0.0%) |
Income Below Poverty Among Single-Parent Households in Lake Hamilton
| Children | Single Father | Single Mother |
| No Children | 0 (0.0%) | 0 (0.0%) |
| 1 or 2 Children | 0 (0.0%) | 0 (0.0%) |
| 3 or 4 Children | 0 (0.0%) | 0 (0.0%) |
| 5 or more Children | 0 (0.0%) | 0 (0.0%) |
| Total | 0 (0.0%) | 0 (0.0%) |
Income Below Poverty Among Married-Couple vs Single-Parent Households in Lake Hamilton
| Children | Married-Couple Families | Single-Parent Households |
| No Children | 0 (0.0%) | 0 (0.0%) |
| 1 or 2 Children | 0 (0.0%) | 0 (0.0%) |
| 3 or 4 Children | 0 (0.0%) | 0 (0.0%) |
| 5 or more Children | 0 (0.0%) | 0 (0.0%) |
| Total | 0 (0.0%) | 0 (0.0%) |
Race in Lake Hamilton
The most populous races in Lake Hamilton are White / Caucasian (1,938 | 95.4%), Asian (40 | 2.0%), and Two or more Races (36 | 1.8%).
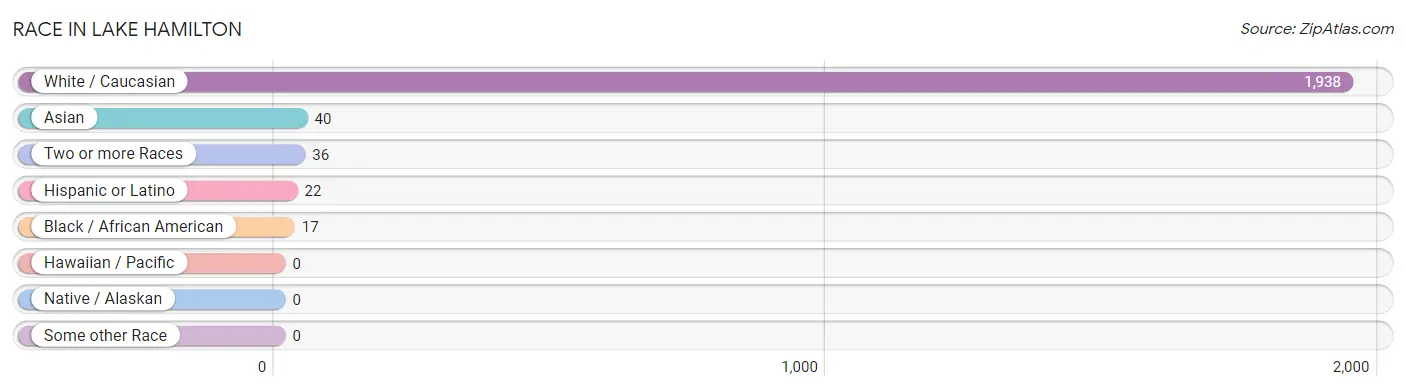
| Race | # Population | % Population |
| Asian | 40 | 2.0% |
| Black / African American | 17 | 0.8% |
| Hawaiian / Pacific | 0 | 0.0% |
| Hispanic or Latino | 22 | 1.1% |
| Native / Alaskan | 0 | 0.0% |
| White / Caucasian | 1,938 | 95.4% |
| Two or more Races | 36 | 1.8% |
| Some other Race | 0 | 0.0% |
| Total | 2,031 | 100.0% |
Ancestry in Lake Hamilton
The most populous ancestries reported in Lake Hamilton are American (322 | 15.9%), English (165 | 8.1%), Irish (108 | 5.3%), German (64 | 3.2%), and Polish (53 | 2.6%), together accounting for 35.1% of all Lake Hamilton residents.
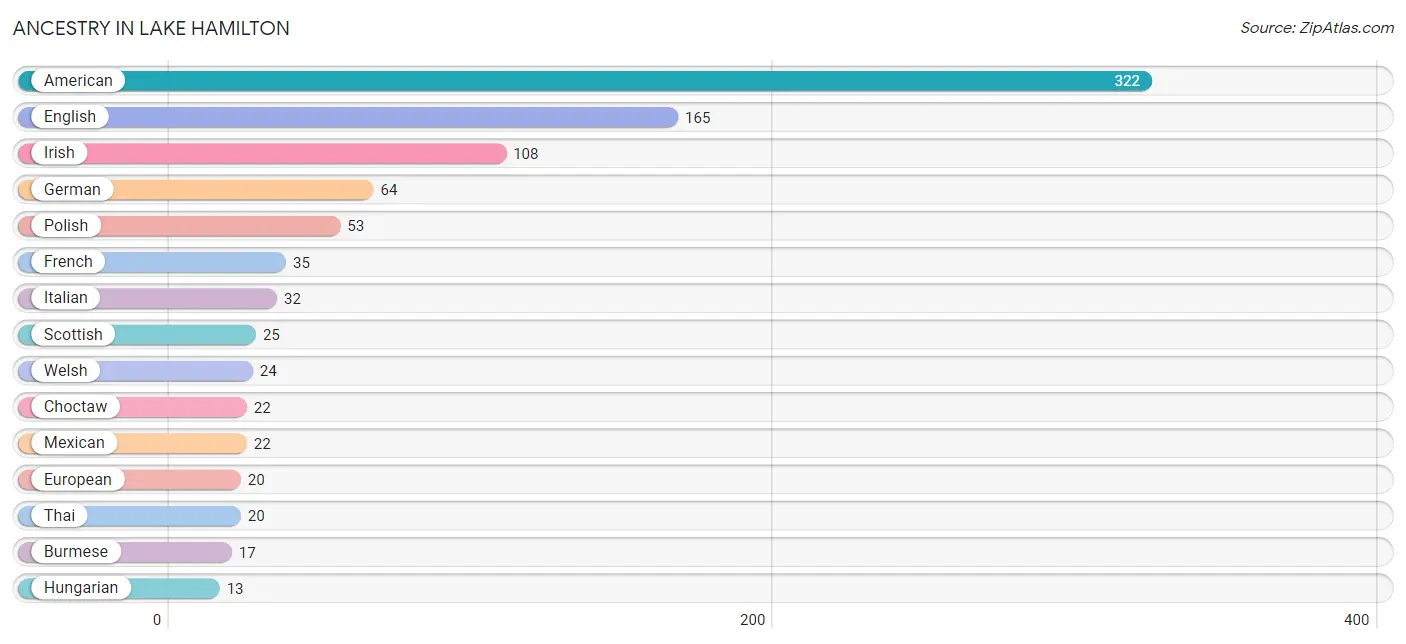
| Ancestry | # Population | % Population |
| African | 6 | 0.3% |
| American | 322 | 15.9% |
| British | 10 | 0.5% |
| Burmese | 17 | 0.8% |
| Cherokee | 7 | 0.3% |
| Choctaw | 22 | 1.1% |
| Dutch | 11 | 0.5% |
| English | 165 | 8.1% |
| European | 20 | 1.0% |
| Filipino | 3 | 0.2% |
| French | 35 | 1.7% |
| French Canadian | 11 | 0.5% |
| German | 64 | 3.2% |
| Hungarian | 13 | 0.6% |
| Irish | 108 | 5.3% |
| Italian | 32 | 1.6% |
| Mexican | 22 | 1.1% |
| Polish | 53 | 2.6% |
| Scotch-Irish | 13 | 0.6% |
| Scottish | 25 | 1.2% |
| Subsaharan African | 6 | 0.3% |
| Thai | 20 | 1.0% |
| Welsh | 24 | 1.2% | View All 23 Rows |
Immigrants in Lake Hamilton
The most numerous immigrant groups reported in Lake Hamilton came from Africa (20 | 1.0%), Asia (20 | 1.0%), Eastern Africa (20 | 1.0%), Eastern Asia (20 | 1.0%), and Kenya (20 | 1.0%), together accounting for 4.9% of all Lake Hamilton residents.
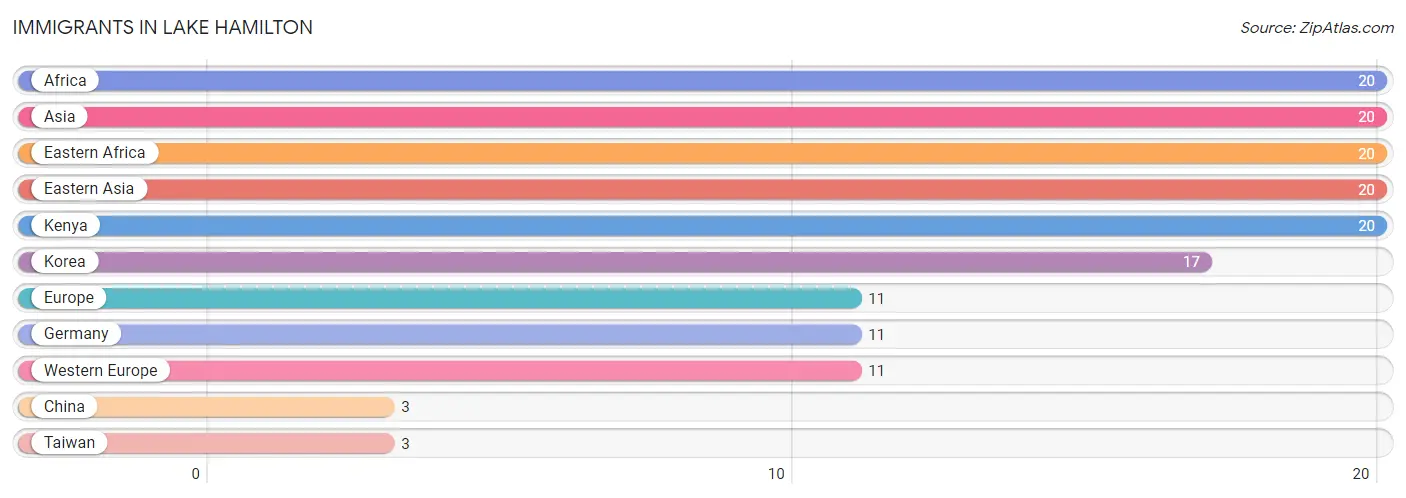
| Immigration Origin | # Population | % Population |
| Africa | 20 | 1.0% |
| Asia | 20 | 1.0% |
| China | 3 | 0.2% |
| Eastern Africa | 20 | 1.0% |
| Eastern Asia | 20 | 1.0% |
| Europe | 11 | 0.5% |
| Germany | 11 | 0.5% |
| Kenya | 20 | 1.0% |
| Korea | 17 | 0.8% |
| Taiwan | 3 | 0.2% |
| Western Europe | 11 | 0.5% | View All 11 Rows |
Sex and Age in Lake Hamilton
Sex and Age in Lake Hamilton
The most populous age groups in Lake Hamilton are 5 to 9 Years (192 | 20.9%) for men and 5 to 9 Years (172 | 15.5%) for women.
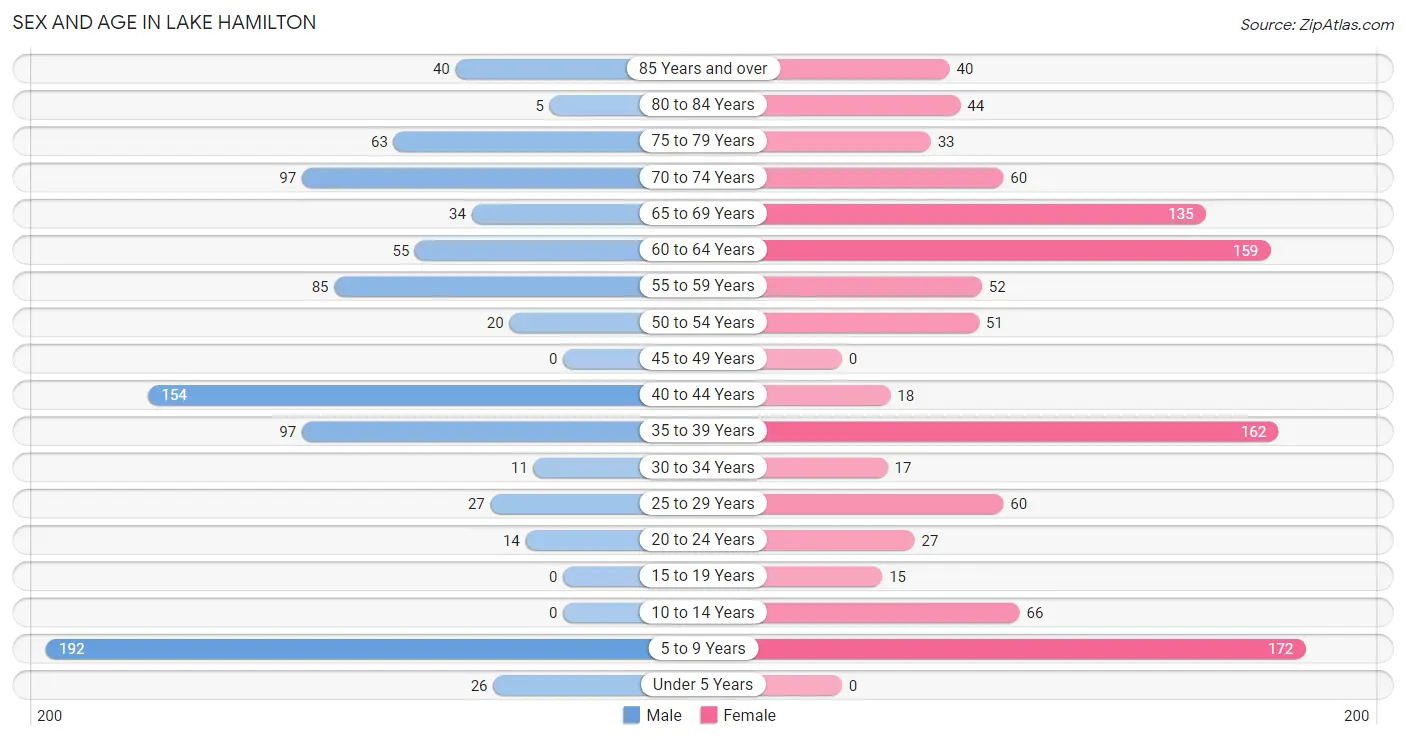
| Age Bracket | Male | Female |
| Under 5 Years | 26 (2.8%) | 0 (0.0%) |
| 5 to 9 Years | 192 (20.9%) | 172 (15.5%) |
| 10 to 14 Years | 0 (0.0%) | 66 (5.9%) |
| 15 to 19 Years | 0 (0.0%) | 15 (1.3%) |
| 20 to 24 Years | 14 (1.5%) | 27 (2.4%) |
| 25 to 29 Years | 27 (2.9%) | 60 (5.4%) |
| 30 to 34 Years | 11 (1.2%) | 17 (1.5%) |
| 35 to 39 Years | 97 (10.5%) | 162 (14.6%) |
| 40 to 44 Years | 154 (16.7%) | 18 (1.6%) |
| 45 to 49 Years | 0 (0.0%) | 0 (0.0%) |
| 50 to 54 Years | 20 (2.2%) | 51 (4.6%) |
| 55 to 59 Years | 85 (9.2%) | 52 (4.7%) |
| 60 to 64 Years | 55 (6.0%) | 159 (14.3%) |
| 65 to 69 Years | 34 (3.7%) | 135 (12.1%) |
| 70 to 74 Years | 97 (10.5%) | 60 (5.4%) |
| 75 to 79 Years | 63 (6.9%) | 33 (3.0%) |
| 80 to 84 Years | 5 (0.5%) | 44 (4.0%) |
| 85 Years and over | 40 (4.3%) | 40 (3.6%) |
| Total | 920 (100.0%) | 1,111 (100.0%) |
Families and Households in Lake Hamilton
Median Family Size in Lake Hamilton
The median family size in Lake Hamilton is 2.72 persons per family, with single male/father families (189 | 34.1%) accounting for the largest median family size of 3.59 persons per family. On the other hand, single female/mother families (35 | 6.3%) represent the smallest median family size with 2.26 persons per family.
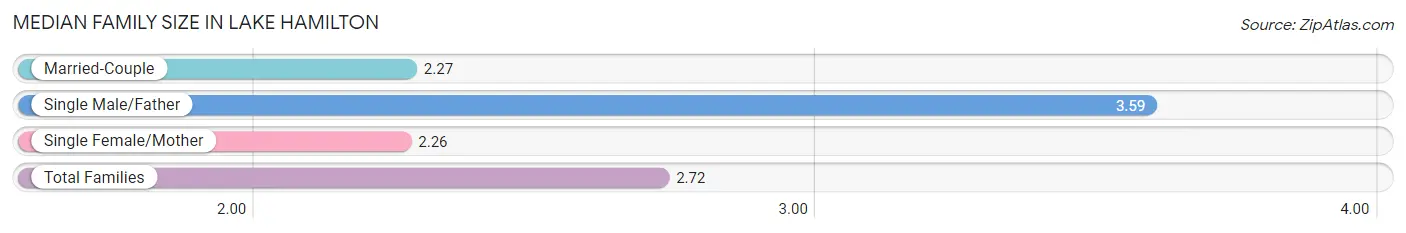
| Family Type | # Families | Family Size |
| Married-Couple | 331 (59.6%) | 2.27 |
| Single Male/Father | 189 (34.1%) | 3.59 |
| Single Female/Mother | 35 (6.3%) | 2.26 |
| Total Families | 555 (100.0%) | 2.72 |
Median Household Size in Lake Hamilton
The median household size in Lake Hamilton is 2.28 persons per household, with single male/father households (189 | 21.2%) accounting for the largest median household size of 4.12 persons per household. non-family households (337 | 37.8%) represent the smallest median household size with 1.23 persons per household.
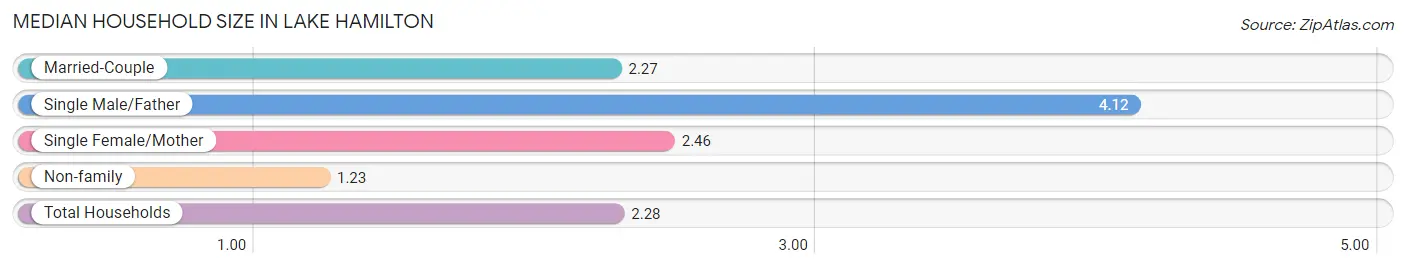
| Household Type | # Households | Household Size |
| Married-Couple | 331 (37.1%) | 2.27 |
| Single Male/Father | 189 (21.2%) | 4.12 |
| Single Female/Mother | 35 (3.9%) | 2.46 |
| Non-family | 337 (37.8%) | 1.23 |
| Total Households | 892 (100.0%) | 2.28 |
Household Size by Marriage Status in Lake Hamilton
Out of a total of 892 households in Lake Hamilton, 555 (62.2%) are family households, while 337 (37.8%) are nonfamily households. The most numerous type of family households are 2-person households, comprising 377, and the most common type of nonfamily households are 1-person households, comprising 269.
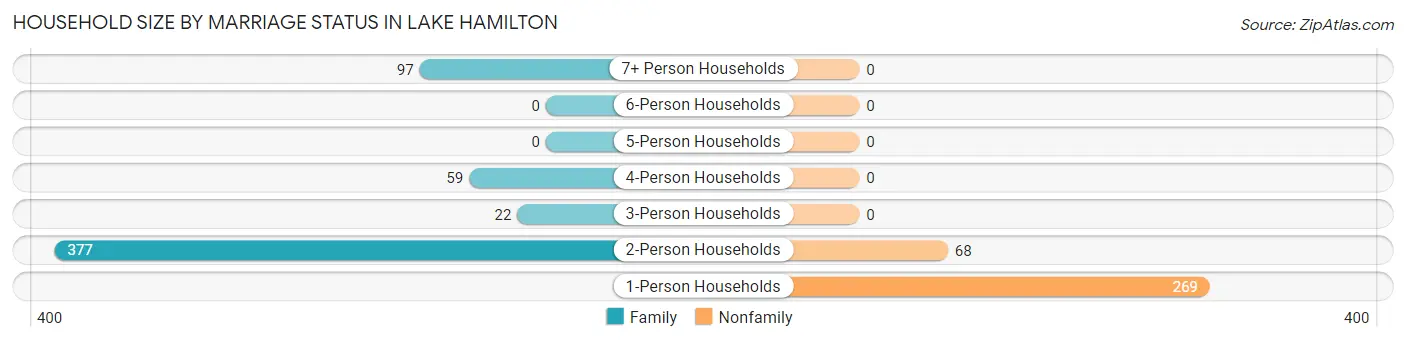
| Household Size | Family Households | Nonfamily Households |
| 1-Person Households | - | 269 (30.2%) |
| 2-Person Households | 377 (42.3%) | 68 (7.6%) |
| 3-Person Households | 22 (2.5%) | 0 (0.0%) |
| 4-Person Households | 59 (6.6%) | 0 (0.0%) |
| 5-Person Households | 0 (0.0%) | 0 (0.0%) |
| 6-Person Households | 0 (0.0%) | 0 (0.0%) |
| 7+ Person Households | 97 (10.9%) | 0 (0.0%) |
| Total | 555 (62.2%) | 337 (37.8%) |
Female Fertility in Lake Hamilton
Fertility by Age in Lake Hamilton
| Age Bracket | Women with Births | Births / 1,000 Women |
| 15 to 19 years | 0 (0.0%) | 0.0 |
| 20 to 34 years | 0 (0.0%) | 0.0 |
| 35 to 50 years | 0 (0.0%) | 0.0 |
| Total | 0 (0.0%) | 0.0 |
Fertility by Age by Marriage Status in Lake Hamilton
| Age Bracket | Married | Unmarried |
| 15 to 19 years | 0 (0.0%) | 0 (0.0%) |
| 20 to 34 years | 0 (0.0%) | 0 (0.0%) |
| 35 to 50 years | 0 (0.0%) | 0 (0.0%) |
| Total | 0 (0.0%) | 0 (0.0%) |
Fertility by Education in Lake Hamilton
| Educational Attainment | Women with Births | Births / 1,000 Women |
| Less than High School | 0 (0.0%) | 0.0 |
| High School Diploma | 0 (0.0%) | 0.0 |
| College or Associate's Degree | 0 (0.0%) | 0.0 |
| Bachelor's Degree | 0 (0.0%) | 0.0 |
| Graduate Degree | 0 (0.0%) | 0.0 |
| Total | 0 (0.0%) | 0.0 |
Fertility by Education by Marriage Status in Lake Hamilton
| Educational Attainment | Married | Unmarried |
| Less than High School | 0 (0.0%) | 0 (0.0%) |
| High School Diploma | 0 (0.0%) | 0 (0.0%) |
| College or Associate's Degree | 0 (0.0%) | 0 (0.0%) |
| Bachelor's Degree | 0 (0.0%) | 0 (0.0%) |
| Graduate Degree | 0 (0.0%) | 0 (0.0%) |
| Total | 0 (0.0%) | 0 (0.0%) |
Employment Characteristics in Lake Hamilton
Employment by Class of Employer in Lake Hamilton
Among the 825 employed individuals in Lake Hamilton, private company employees (508 | 61.6%), self-employed (not incorporated) (187 | 22.7%), and federal government employees (47 | 5.7%) make up the most common classes of employment.

| Employer Class | # Employees | % Employees |
| Private Company Employees | 508 | 61.6% |
| Self-Employed (Incorporated) | 0 | 0.0% |
| Self-Employed (Not Incorporated) | 187 | 22.7% |
| Not-for-profit Organizations | 45 | 5.4% |
| Local Government Employees | 8 | 1.0% |
| State Government Employees | 30 | 3.6% |
| Federal Government Employees | 47 | 5.7% |
| Unpaid Family Workers | 0 | 0.0% |
| Total | 825 | 100.0% |
Employment Status by Age in Lake Hamilton
| Age Bracket | In Labor Force | Unemployed |
| 16 to 19 Years | 0 (0.0%) | 0 (0.0%) |
| 20 to 24 Years | 27 (65.9%) | 0 (0.0%) |
| 25 to 29 Years | 87 (100.0%) | 0 (0.0%) |
| 30 to 34 Years | 28 (100.0%) | 0 (0.0%) |
| 35 to 44 Years | 332 (77.0%) | 0 (0.0%) |
| 45 to 54 Years | 54 (76.1%) | 0 (0.0%) |
| 55 to 59 Years | 92 (67.2%) | 0 (0.0%) |
| 60 to 64 Years | 55 (25.7%) | 0 (0.0%) |
| 65 to 74 Years | 90 (27.6%) | 0 (0.0%) |
| 75 Years and over | 60 (26.7%) | 0 (0.0%) |
| Total | 825 (52.4%) | 0 (0.0%) |
Employment Status by Educational Attainment in Lake Hamilton
| Educational Attainment | In Labor Force | Unemployed |
| Less than High School | 0 (0.0%) | 0 (0.0%) |
| High School Diploma | 401 (65.3%) | 0 (0.0%) |
| College / Associate Degree | 97 (89.0%) | 0 (0.0%) |
| Bachelor's Degree or higher | 150 (72.1%) | 0 (0.0%) |
| Total | 648 (66.9%) | 0 (0.0%) |
Employment Occupations by Sex in Lake Hamilton
Management, Business, Science and Arts Occupations
The most common Management, Business, Science and Arts occupations in Lake Hamilton are Management (117 | 14.2%), Community & Social Service (62 | 7.5%), Health Diagnosing & Treating (43 | 5.2%), Health Technologists (43 | 5.2%), and Education Instruction & Library (36 | 4.4%).
Management, Business, Science and Arts Occupations by Sex
Within the Management, Business, Science and Arts occupations in Lake Hamilton, the most male-oriented occupations are Computers, Engineering & Science (100.0%), Life, Physical & Social Science (100.0%), and Health Diagnosing & Treating (79.1%), while the most female-oriented occupations are Business & Financial (100.0%), Arts, Media & Entertainment (57.7%), and Management (53.8%).
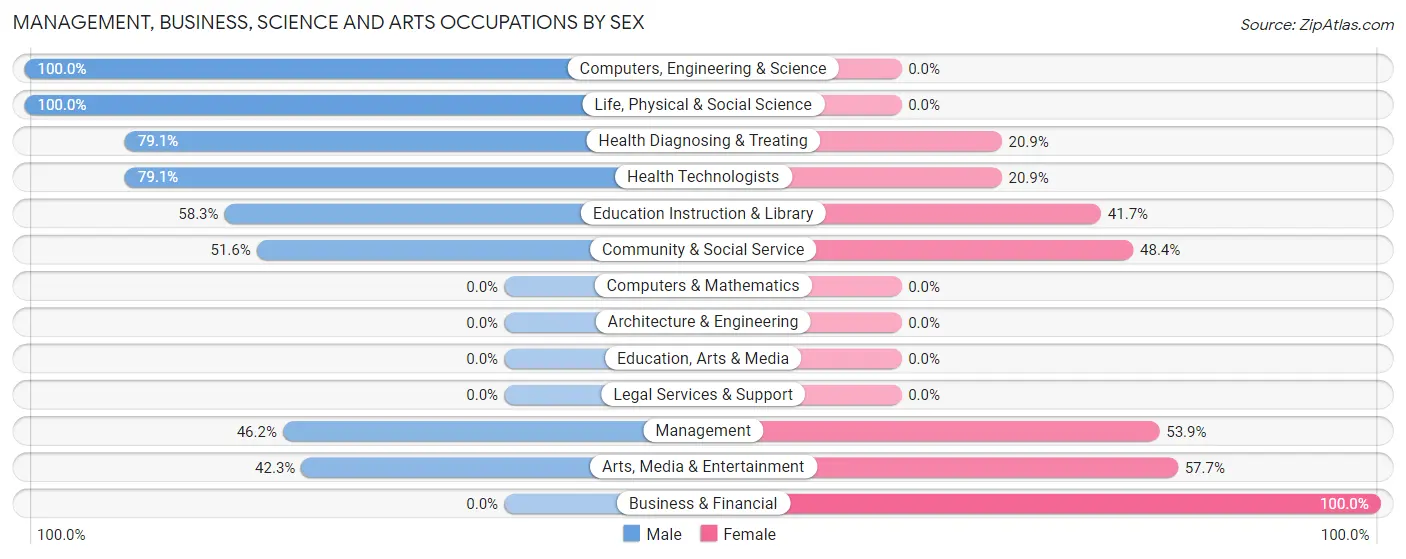
| Occupation | Male | Female |
| Management | 54 (46.2%) | 63 (53.8%) |
| Business & Financial | 0 (0.0%) | 13 (100.0%) |
| Computers, Engineering & Science | 15 (100.0%) | 0 (0.0%) |
| Computers & Mathematics | 0 (0.0%) | 0 (0.0%) |
| Architecture & Engineering | 0 (0.0%) | 0 (0.0%) |
| Life, Physical & Social Science | 15 (100.0%) | 0 (0.0%) |
| Community & Social Service | 32 (51.6%) | 30 (48.4%) |
| Education, Arts & Media | 0 (0.0%) | 0 (0.0%) |
| Legal Services & Support | 0 (0.0%) | 0 (0.0%) |
| Education Instruction & Library | 21 (58.3%) | 15 (41.7%) |
| Arts, Media & Entertainment | 11 (42.3%) | 15 (57.7%) |
| Health Diagnosing & Treating | 34 (79.1%) | 9 (20.9%) |
| Health Technologists | 34 (79.1%) | 9 (20.9%) |
| Total (Category) | 135 (54.0%) | 115 (46.0%) |
| Total (Overall) | 467 (56.6%) | 358 (43.4%) |
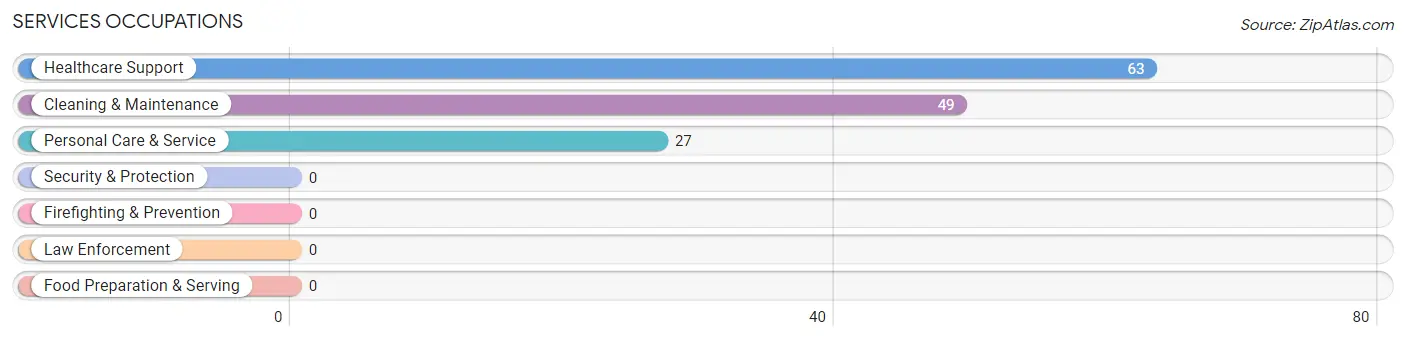
Services Occupations
The most common Services occupations in Lake Hamilton are Healthcare Support (63 | 7.6%), Cleaning & Maintenance (49 | 5.9%), and Personal Care & Service (27 | 3.3%).
Services Occupations by Sex
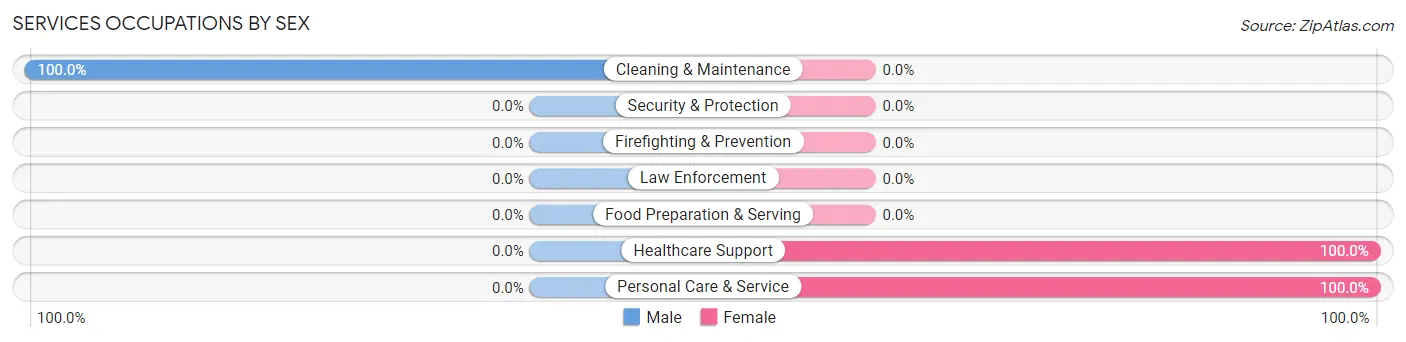
| Occupation | Male | Female |
| Healthcare Support | 0 (0.0%) | 63 (100.0%) |
| Security & Protection | 0 (0.0%) | 0 (0.0%) |
| Firefighting & Prevention | 0 (0.0%) | 0 (0.0%) |
| Law Enforcement | 0 (0.0%) | 0 (0.0%) |
| Food Preparation & Serving | 0 (0.0%) | 0 (0.0%) |
| Cleaning & Maintenance | 49 (100.0%) | 0 (0.0%) |
| Personal Care & Service | 0 (0.0%) | 27 (100.0%) |
| Total (Category) | 49 (35.2%) | 90 (64.7%) |
| Total (Overall) | 467 (56.6%) | 358 (43.4%) |
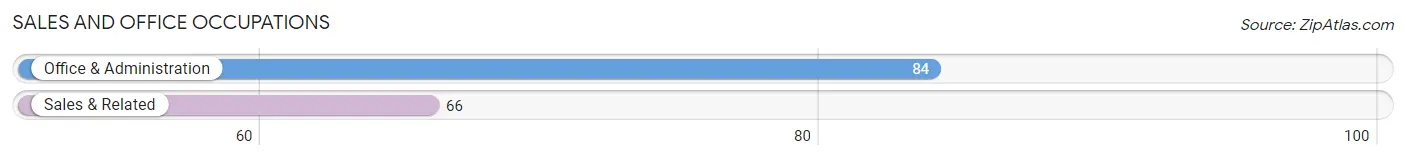
Sales and Office Occupations
The most common Sales and Office occupations in Lake Hamilton are Office & Administration (84 | 10.2%), and Sales & Related (66 | 8.0%).
Sales and Office Occupations by Sex
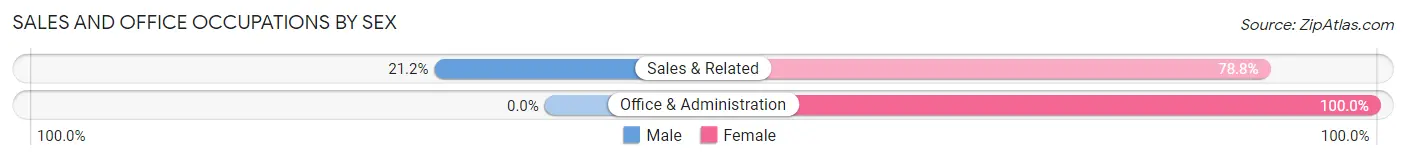
| Occupation | Male | Female |
| Sales & Related | 14 (21.2%) | 52 (78.8%) |
| Office & Administration | 0 (0.0%) | 84 (100.0%) |
| Total (Category) | 14 (9.3%) | 136 (90.7%) |
| Total (Overall) | 467 (56.6%) | 358 (43.4%) |
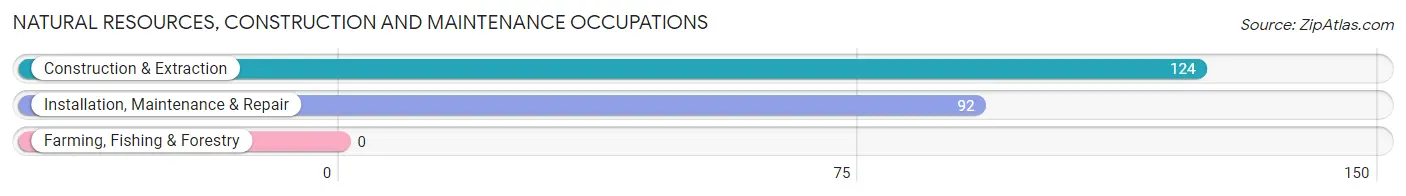
Natural Resources, Construction and Maintenance Occupations
The most common Natural Resources, Construction and Maintenance occupations in Lake Hamilton are Construction & Extraction (124 | 15.0%), and Installation, Maintenance & Repair (92 | 11.2%).
Natural Resources, Construction and Maintenance Occupations by Sex
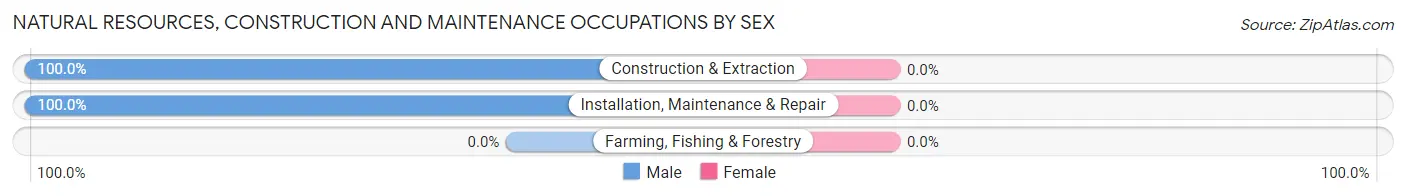
| Occupation | Male | Female |
| Farming, Fishing & Forestry | 0 (0.0%) | 0 (0.0%) |
| Construction & Extraction | 124 (100.0%) | 0 (0.0%) |
| Installation, Maintenance & Repair | 92 (100.0%) | 0 (0.0%) |
| Total (Category) | 216 (100.0%) | 0 (0.0%) |
| Total (Overall) | 467 (56.6%) | 358 (43.4%) |
Production, Transportation and Moving Occupations
The most common Production, Transportation and Moving occupations in Lake Hamilton are Production (30 | 3.6%), Transportation (30 | 3.6%), and Material Moving (10 | 1.2%).
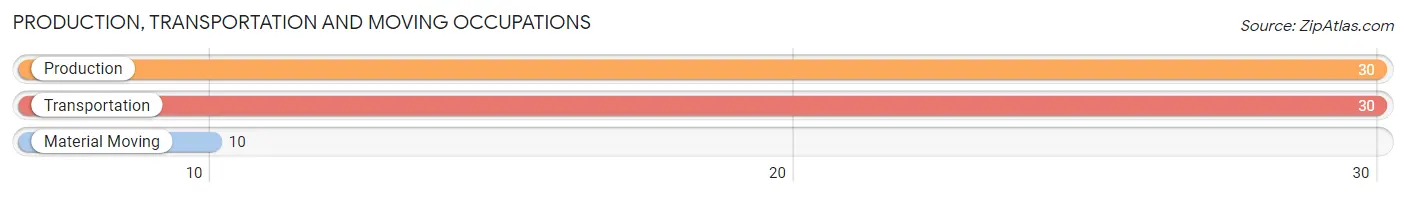
Production, Transportation and Moving Occupations by Sex
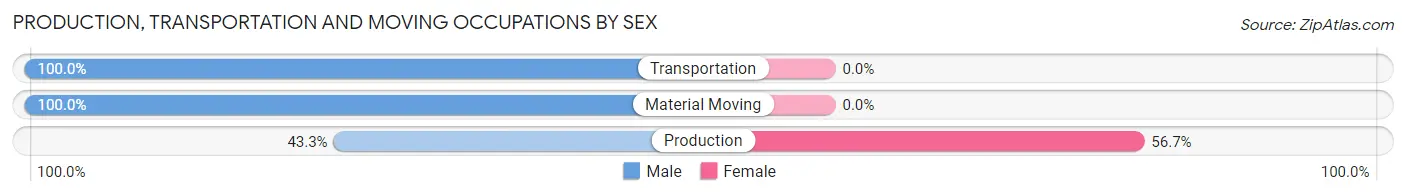
| Occupation | Male | Female |
| Production | 13 (43.3%) | 17 (56.7%) |
| Transportation | 30 (100.0%) | 0 (0.0%) |
| Material Moving | 10 (100.0%) | 0 (0.0%) |
| Total (Category) | 53 (75.7%) | 17 (24.3%) |
| Total (Overall) | 467 (56.6%) | 358 (43.4%) |
Employment Industries by Sex in Lake Hamilton
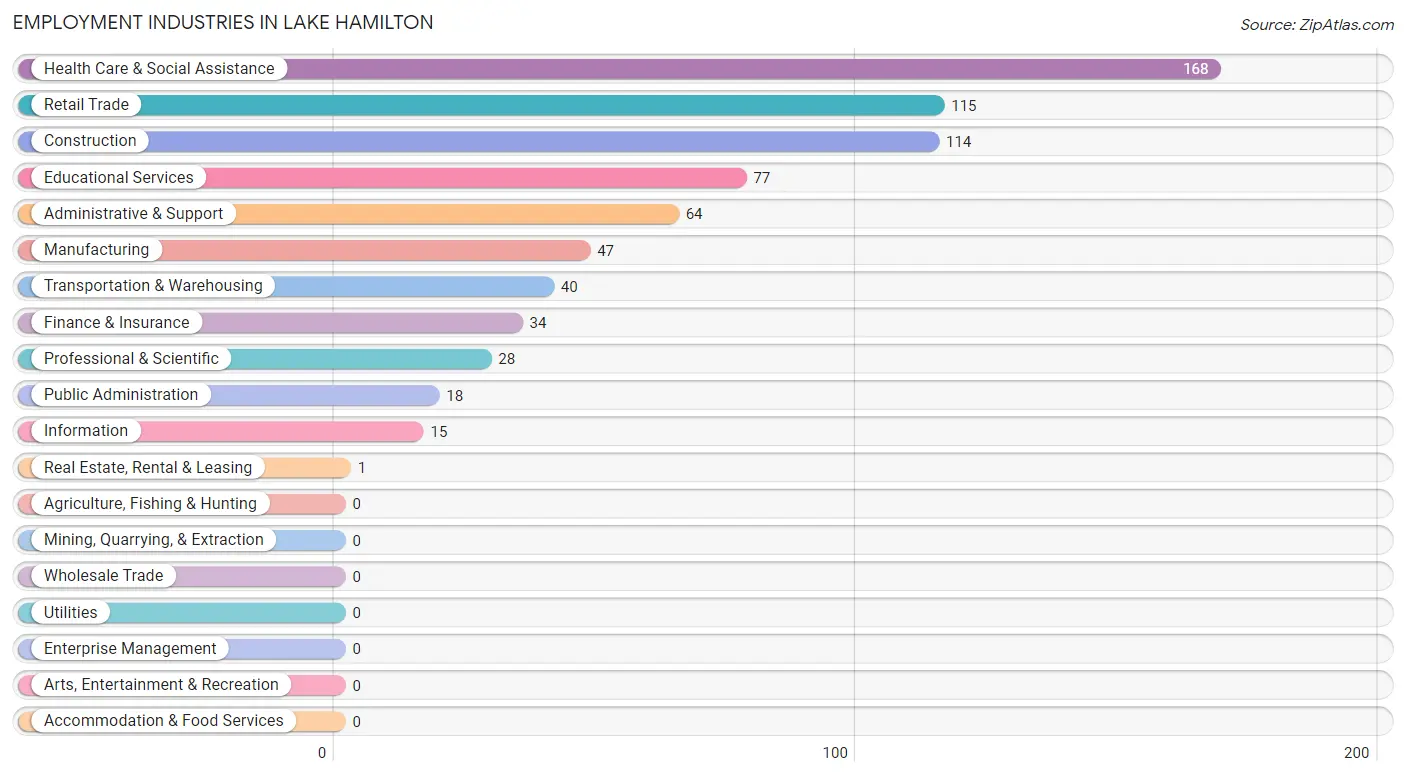
Employment Industries in Lake Hamilton
The major employment industries in Lake Hamilton include Health Care & Social Assistance (168 | 20.4%), Retail Trade (115 | 13.9%), Construction (114 | 13.8%), Educational Services (77 | 9.3%), and Administrative & Support (64 | 7.8%).
Employment Industries by Sex in Lake Hamilton
The Lake Hamilton industries that see more men than women are Real Estate, Rental & Leasing (100.0%), Construction (88.6%), and Educational Services (80.5%), whereas the industries that tend to have a higher number of women are Transportation & Warehousing (100.0%), Information (100.0%), and Public Administration (100.0%).
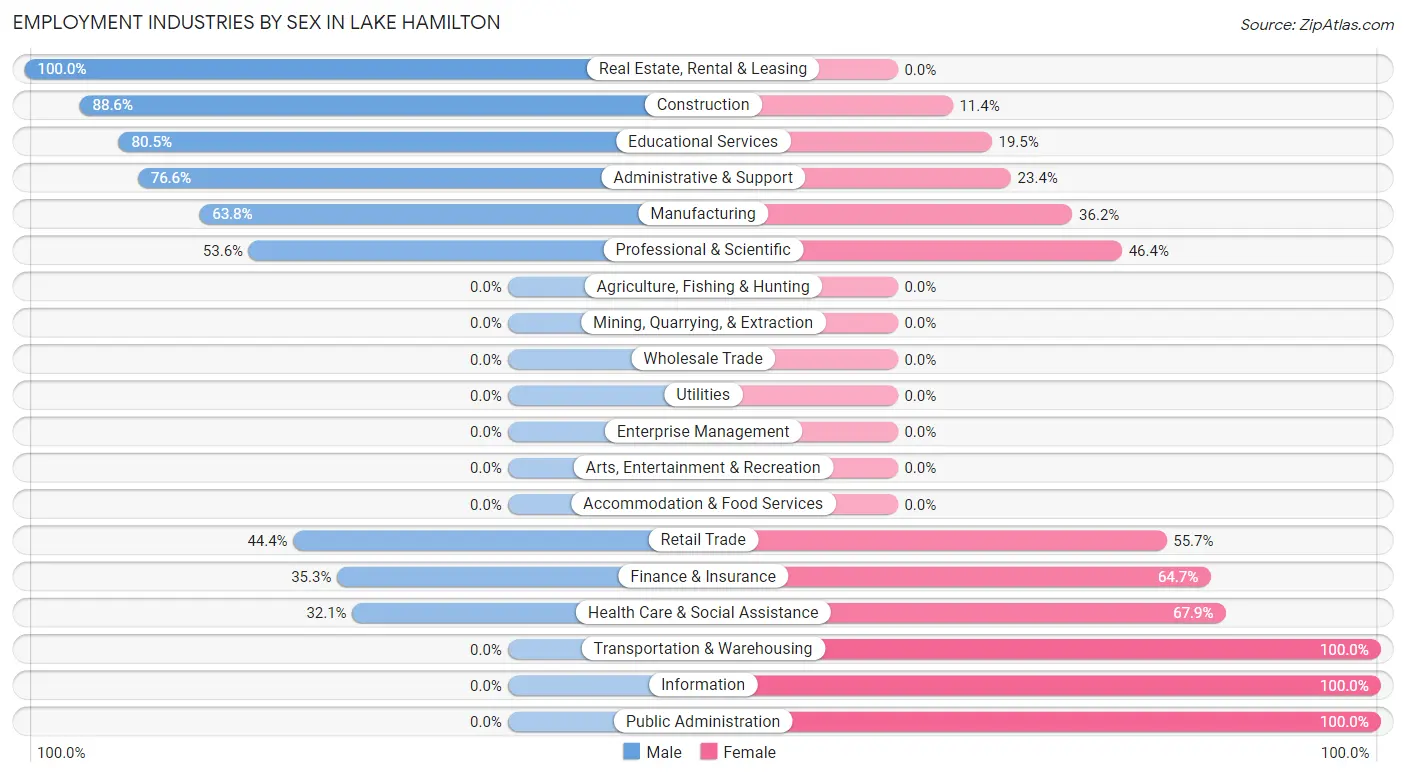
| Industry | Male | Female |
| Agriculture, Fishing & Hunting | 0 (0.0%) | 0 (0.0%) |
| Mining, Quarrying, & Extraction | 0 (0.0%) | 0 (0.0%) |
| Construction | 101 (88.6%) | 13 (11.4%) |
| Manufacturing | 30 (63.8%) | 17 (36.2%) |
| Wholesale Trade | 0 (0.0%) | 0 (0.0%) |
| Retail Trade | 51 (44.4%) | 64 (55.6%) |
| Transportation & Warehousing | 0 (0.0%) | 40 (100.0%) |
| Utilities | 0 (0.0%) | 0 (0.0%) |
| Information | 0 (0.0%) | 15 (100.0%) |
| Finance & Insurance | 12 (35.3%) | 22 (64.7%) |
| Real Estate, Rental & Leasing | 1 (100.0%) | 0 (0.0%) |
| Professional & Scientific | 15 (53.6%) | 13 (46.4%) |
| Enterprise Management | 0 (0.0%) | 0 (0.0%) |
| Administrative & Support | 49 (76.6%) | 15 (23.4%) |
| Educational Services | 62 (80.5%) | 15 (19.5%) |
| Health Care & Social Assistance | 54 (32.1%) | 114 (67.9%) |
| Arts, Entertainment & Recreation | 0 (0.0%) | 0 (0.0%) |
| Accommodation & Food Services | 0 (0.0%) | 0 (0.0%) |
| Public Administration | 0 (0.0%) | 18 (100.0%) |
| Total | 467 (56.6%) | 358 (43.4%) |
Education in Lake Hamilton
School Enrollment in Lake Hamilton
The most common levels of schooling among the 478 students in Lake Hamilton are elementary school (225 | 47.1%), kindergarten (120 | 25.1%), and middle school (60 | 12.6%).
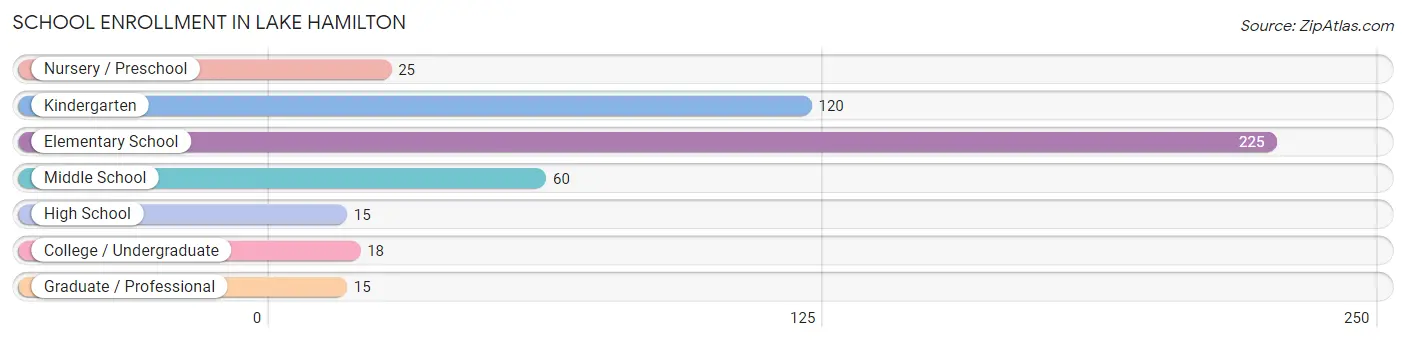
| School Level | # Students | % Students |
| Nursery / Preschool | 25 | 5.2% |
| Kindergarten | 120 | 25.1% |
| Elementary School | 225 | 47.1% |
| Middle School | 60 | 12.6% |
| High School | 15 | 3.1% |
| College / Undergraduate | 18 | 3.8% |
| Graduate / Professional | 15 | 3.1% |
| Total | 478 | 100.0% |
School Enrollment by Age by Funding Source in Lake Hamilton
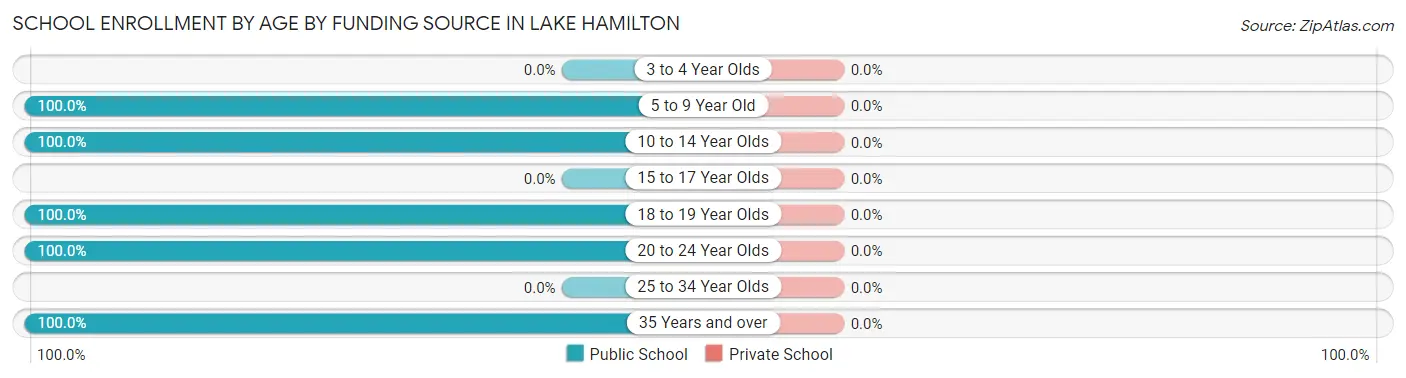
| Age Bracket | Public School | Private School |
| 3 to 4 Year Olds | 0 (0.0%) | 0 (0.0%) |
| 5 to 9 Year Old | 364 (100.0%) | 0 (0.0%) |
| 10 to 14 Year Olds | 66 (100.0%) | 0 (0.0%) |
| 15 to 17 Year Olds | 0 (0.0%) | 0 (0.0%) |
| 18 to 19 Year Olds | 15 (100.0%) | 0 (0.0%) |
| 20 to 24 Year Olds | 14 (100.0%) | 0 (0.0%) |
| 25 to 34 Year Olds | 0 (0.0%) | 0 (0.0%) |
| 35 Years and over | 19 (100.0%) | 0 (0.0%) |
| Total | 478 (100.0%) | 0 (0.0%) |
Educational Attainment by Field of Study in Lake Hamilton
Education (110 | 23.7%), business (67 | 14.4%), physical & health sciences (49 | 10.6%), psychology (49 | 10.6%), and science & technology (41 | 8.8%) are the most common fields of study among 464 individuals in Lake Hamilton who have obtained a bachelor's degree or higher.
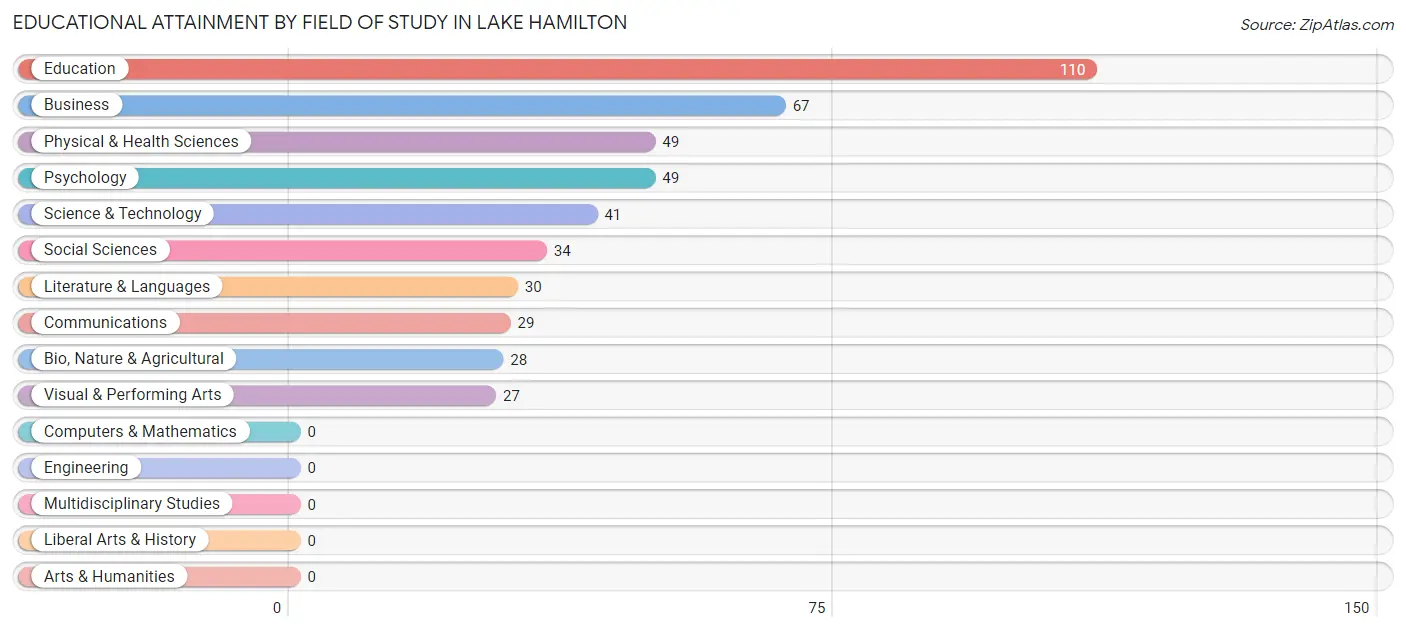
| Field of Study | # Graduates | % Graduates |
| Computers & Mathematics | 0 | 0.0% |
| Bio, Nature & Agricultural | 28 | 6.0% |
| Physical & Health Sciences | 49 | 10.6% |
| Psychology | 49 | 10.6% |
| Social Sciences | 34 | 7.3% |
| Engineering | 0 | 0.0% |
| Multidisciplinary Studies | 0 | 0.0% |
| Science & Technology | 41 | 8.8% |
| Business | 67 | 14.4% |
| Education | 110 | 23.7% |
| Literature & Languages | 30 | 6.5% |
| Liberal Arts & History | 0 | 0.0% |
| Visual & Performing Arts | 27 | 5.8% |
| Communications | 29 | 6.2% |
| Arts & Humanities | 0 | 0.0% |
| Total | 464 | 100.0% |
Transportation & Commute in Lake Hamilton
Vehicle Availability by Sex in Lake Hamilton
The most prevalent vehicle ownership categories in Lake Hamilton are males with 2 vehicles (239, accounting for 51.2%) and females with 2 vehicles (125, making up 66.8%).
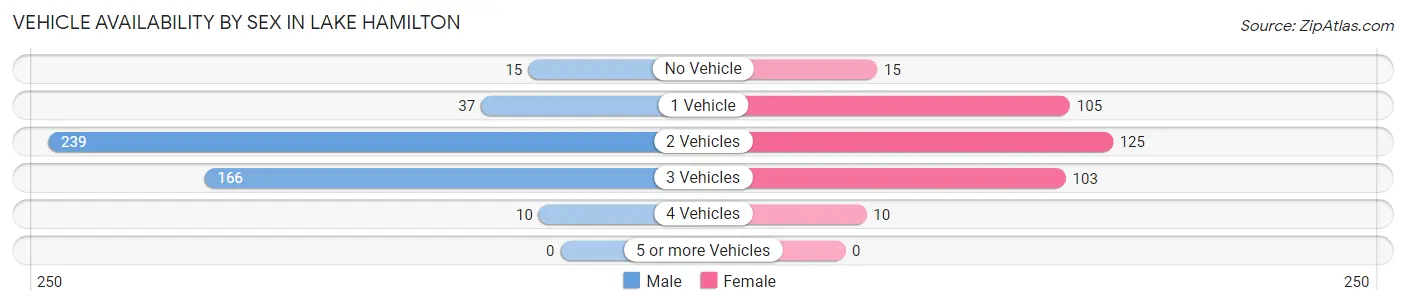
| Vehicles Available | Male | Female |
| No Vehicle | 15 (3.2%) | 15 (4.2%) |
| 1 Vehicle | 37 (7.9%) | 105 (29.3%) |
| 2 Vehicles | 239 (51.2%) | 125 (34.9%) |
| 3 Vehicles | 166 (35.5%) | 103 (28.8%) |
| 4 Vehicles | 10 (2.1%) | 10 (2.8%) |
| 5 or more Vehicles | 0 (0.0%) | 0 (0.0%) |
| Total | 467 (100.0%) | 358 (100.0%) |
Commute Time in Lake Hamilton
The most frequently occuring commute durations in Lake Hamilton are 20 to 24 minutes (219 commuters, 30.2%), 10 to 14 minutes (157 commuters, 21.6%), and 25 to 29 minutes (74 commuters, 10.2%).
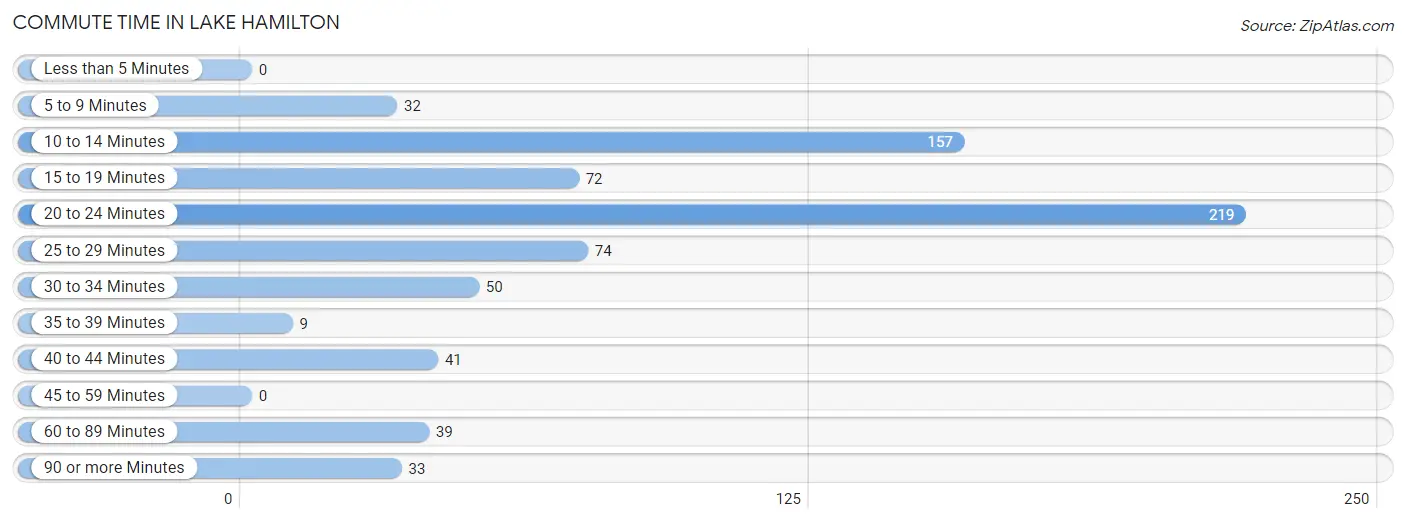
| Commute Time | # Commuters | % Commuters |
| Less than 5 Minutes | 0 | 0.0% |
| 5 to 9 Minutes | 32 | 4.4% |
| 10 to 14 Minutes | 157 | 21.6% |
| 15 to 19 Minutes | 72 | 9.9% |
| 20 to 24 Minutes | 219 | 30.2% |
| 25 to 29 Minutes | 74 | 10.2% |
| 30 to 34 Minutes | 50 | 6.9% |
| 35 to 39 Minutes | 9 | 1.2% |
| 40 to 44 Minutes | 41 | 5.7% |
| 45 to 59 Minutes | 0 | 0.0% |
| 60 to 89 Minutes | 39 | 5.4% |
| 90 or more Minutes | 33 | 4.5% |
Commute Time by Sex in Lake Hamilton
The most common commute times in Lake Hamilton are 10 to 14 minutes (157 commuters, 37.6%) for males and 20 to 24 minutes (101 commuters, 32.8%) for females.
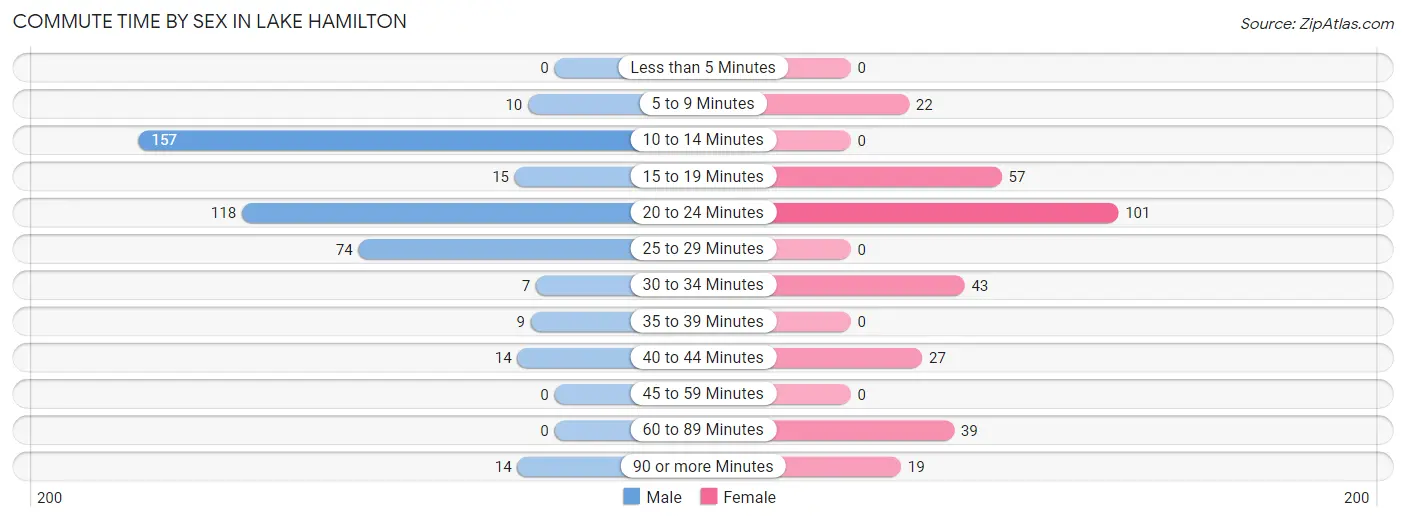
| Commute Time | Male | Female |
| Less than 5 Minutes | 0 (0.0%) | 0 (0.0%) |
| 5 to 9 Minutes | 10 (2.4%) | 22 (7.1%) |
| 10 to 14 Minutes | 157 (37.6%) | 0 (0.0%) |
| 15 to 19 Minutes | 15 (3.6%) | 57 (18.5%) |
| 20 to 24 Minutes | 118 (28.2%) | 101 (32.8%) |
| 25 to 29 Minutes | 74 (17.7%) | 0 (0.0%) |
| 30 to 34 Minutes | 7 (1.7%) | 43 (14.0%) |
| 35 to 39 Minutes | 9 (2.1%) | 0 (0.0%) |
| 40 to 44 Minutes | 14 (3.4%) | 27 (8.8%) |
| 45 to 59 Minutes | 0 (0.0%) | 0 (0.0%) |
| 60 to 89 Minutes | 0 (0.0%) | 39 (12.7%) |
| 90 or more Minutes | 14 (3.4%) | 19 (6.2%) |
Time of Departure to Work by Sex in Lake Hamilton
The most frequent times of departure to work in Lake Hamilton are 7:00 AM to 7:29 AM (150, 35.9%) for males and 7:00 AM to 7:29 AM (84, 27.3%) for females.
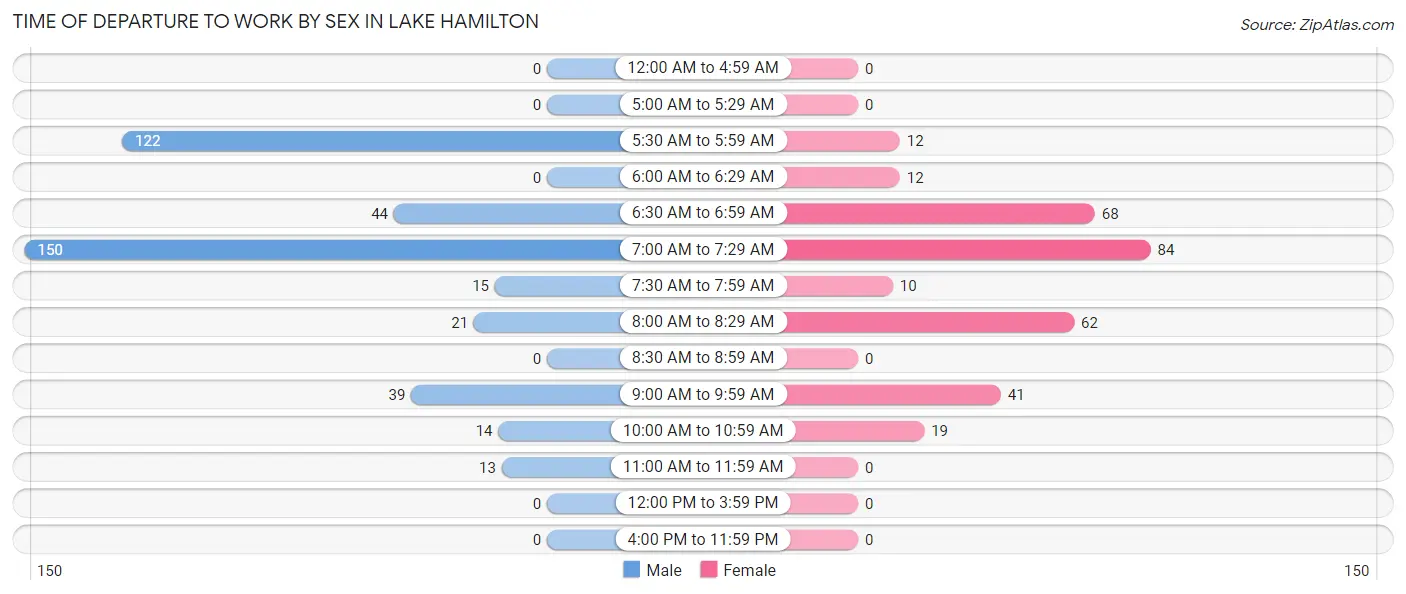
| Time of Departure | Male | Female |
| 12:00 AM to 4:59 AM | 0 (0.0%) | 0 (0.0%) |
| 5:00 AM to 5:29 AM | 0 (0.0%) | 0 (0.0%) |
| 5:30 AM to 5:59 AM | 122 (29.2%) | 12 (3.9%) |
| 6:00 AM to 6:29 AM | 0 (0.0%) | 12 (3.9%) |
| 6:30 AM to 6:59 AM | 44 (10.5%) | 68 (22.1%) |
| 7:00 AM to 7:29 AM | 150 (35.9%) | 84 (27.3%) |
| 7:30 AM to 7:59 AM | 15 (3.6%) | 10 (3.3%) |
| 8:00 AM to 8:29 AM | 21 (5.0%) | 62 (20.1%) |
| 8:30 AM to 8:59 AM | 0 (0.0%) | 0 (0.0%) |
| 9:00 AM to 9:59 AM | 39 (9.3%) | 41 (13.3%) |
| 10:00 AM to 10:59 AM | 14 (3.4%) | 19 (6.2%) |
| 11:00 AM to 11:59 AM | 13 (3.1%) | 0 (0.0%) |
| 12:00 PM to 3:59 PM | 0 (0.0%) | 0 (0.0%) |
| 4:00 PM to 11:59 PM | 0 (0.0%) | 0 (0.0%) |
| Total | 418 (100.0%) | 308 (100.0%) |
Housing Occupancy in Lake Hamilton
Occupancy by Ownership in Lake Hamilton
Of the total 892 dwellings in Lake Hamilton, owner-occupied units account for 671 (75.2%), while renter-occupied units make up 221 (24.8%).
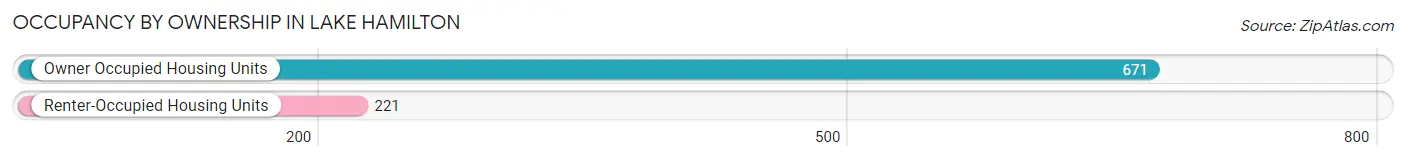
| Occupancy | # Housing Units | % Housing Units |
| Owner Occupied Housing Units | 671 | 75.2% |
| Renter-Occupied Housing Units | 221 | 24.8% |
| Total Occupied Housing Units | 892 | 100.0% |
Occupancy by Household Size in Lake Hamilton
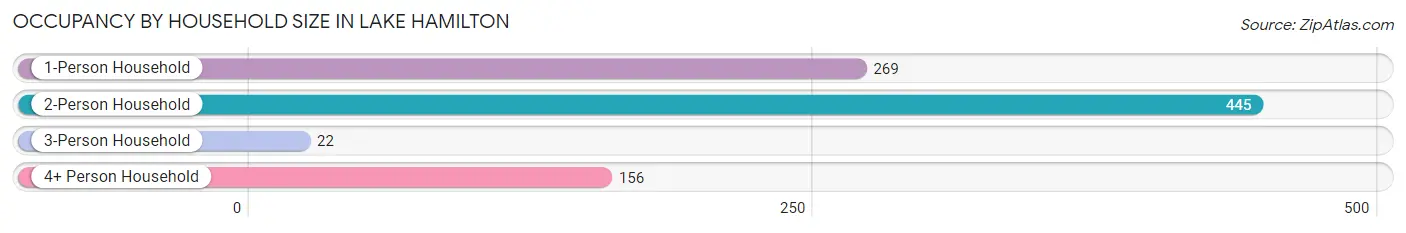
| Household Size | # Housing Units | % Housing Units |
| 1-Person Household | 269 | 30.2% |
| 2-Person Household | 445 | 49.9% |
| 3-Person Household | 22 | 2.5% |
| 4+ Person Household | 156 | 17.5% |
| Total Housing Units | 892 | 100.0% |
Occupancy by Ownership by Household Size in Lake Hamilton
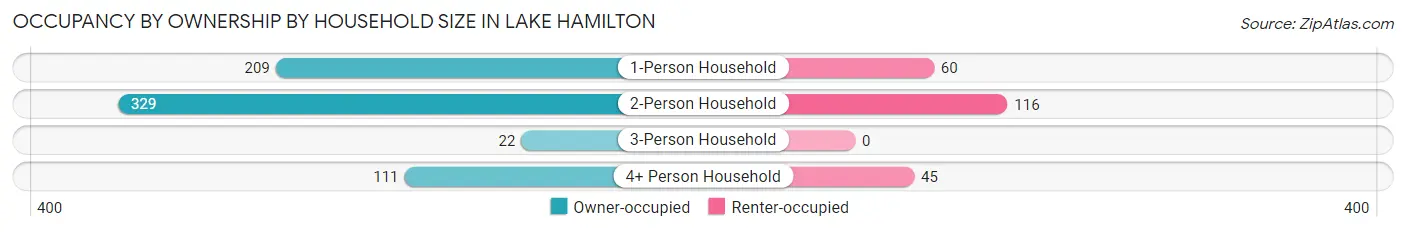
| Household Size | Owner-occupied | Renter-occupied |
| 1-Person Household | 209 (77.7%) | 60 (22.3%) |
| 2-Person Household | 329 (73.9%) | 116 (26.1%) |
| 3-Person Household | 22 (100.0%) | 0 (0.0%) |
| 4+ Person Household | 111 (71.2%) | 45 (28.8%) |
| Total Housing Units | 671 (75.2%) | 221 (24.8%) |
Occupancy by Educational Attainment in Lake Hamilton
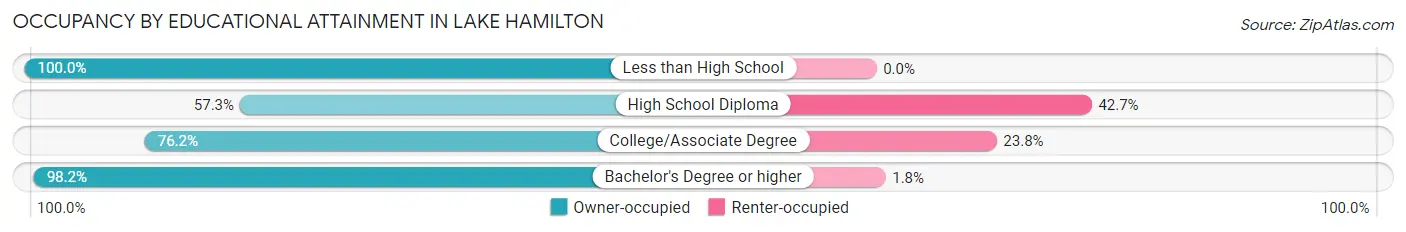
| Household Size | Owner-occupied | Renter-occupied |
| Less than High School | 33 (100.0%) | 0 (0.0%) |
| High School Diploma | 235 (57.3%) | 175 (42.7%) |
| College/Associate Degree | 131 (76.2%) | 41 (23.8%) |
| Bachelor's Degree or higher | 272 (98.2%) | 5 (1.8%) |
Occupancy by Age of Householder in Lake Hamilton
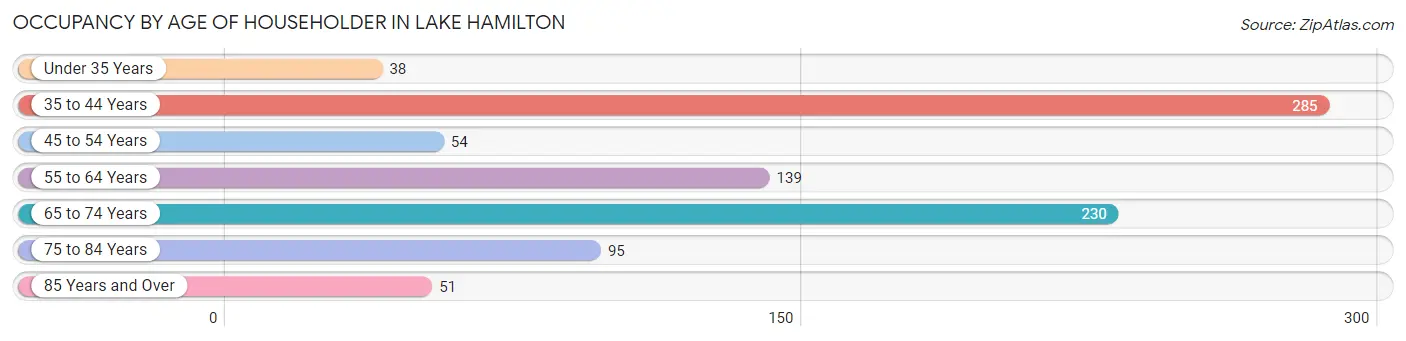
| Age Bracket | # Households | % Households |
| Under 35 Years | 38 | 4.3% |
| 35 to 44 Years | 285 | 32.0% |
| 45 to 54 Years | 54 | 6.0% |
| 55 to 64 Years | 139 | 15.6% |
| 65 to 74 Years | 230 | 25.8% |
| 75 to 84 Years | 95 | 10.6% |
| 85 Years and Over | 51 | 5.7% |
| Total | 892 | 100.0% |
Housing Finances in Lake Hamilton
Median Income by Occupancy in Lake Hamilton
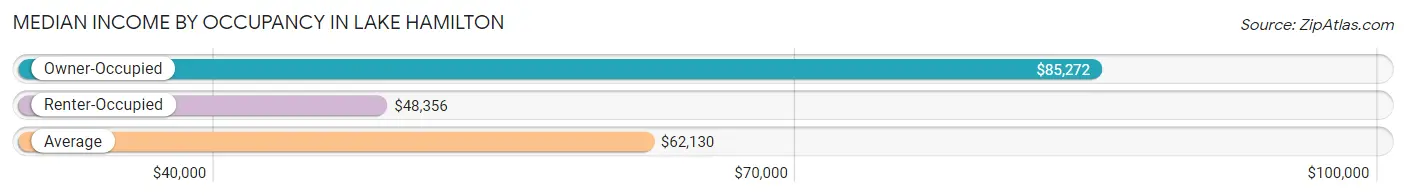
| Occupancy Type | # Households | Median Income |
| Owner-Occupied | 671 (75.2%) | $85,272 |
| Renter-Occupied | 221 (24.8%) | $48,356 |
| Average | 892 (100.0%) | $62,130 |
Occupancy by Householder Income Bracket in Lake Hamilton
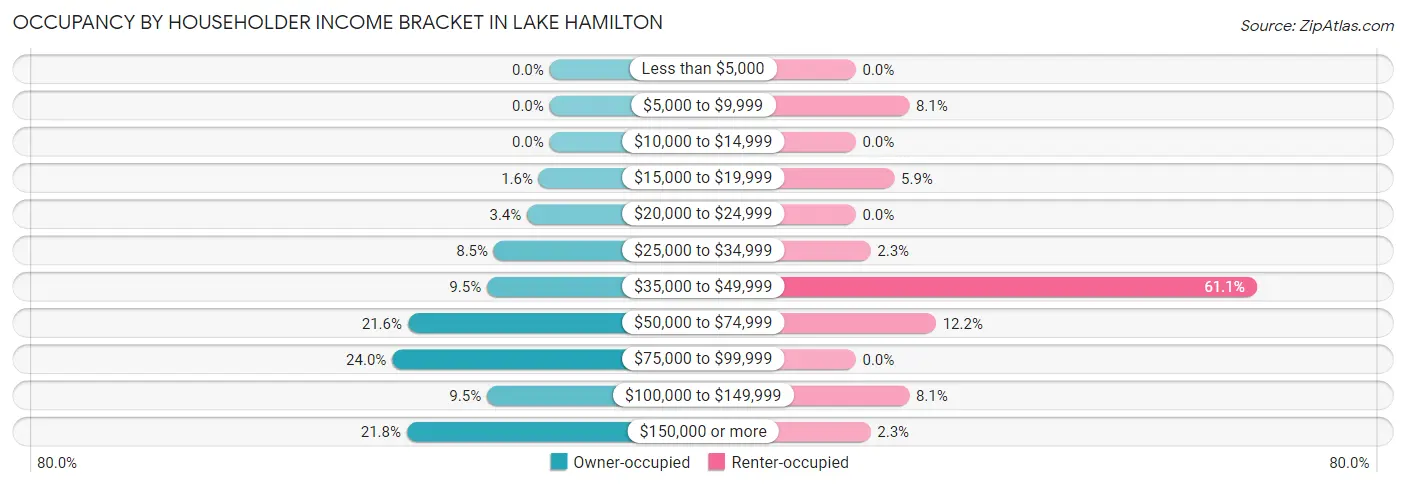
| Income Bracket | Owner-occupied | Renter-occupied |
| Less than $5,000 | 0 (0.0%) | 0 (0.0%) |
| $5,000 to $9,999 | 0 (0.0%) | 18 (8.1%) |
| $10,000 to $14,999 | 0 (0.0%) | 0 (0.0%) |
| $15,000 to $19,999 | 11 (1.6%) | 13 (5.9%) |
| $20,000 to $24,999 | 23 (3.4%) | 0 (0.0%) |
| $25,000 to $34,999 | 57 (8.5%) | 5 (2.3%) |
| $35,000 to $49,999 | 64 (9.5%) | 135 (61.1%) |
| $50,000 to $74,999 | 145 (21.6%) | 27 (12.2%) |
| $75,000 to $99,999 | 161 (24.0%) | 0 (0.0%) |
| $100,000 to $149,999 | 64 (9.5%) | 18 (8.1%) |
| $150,000 or more | 146 (21.8%) | 5 (2.3%) |
| Total | 671 (100.0%) | 221 (100.0%) |
Monthly Housing Cost Tiers in Lake Hamilton
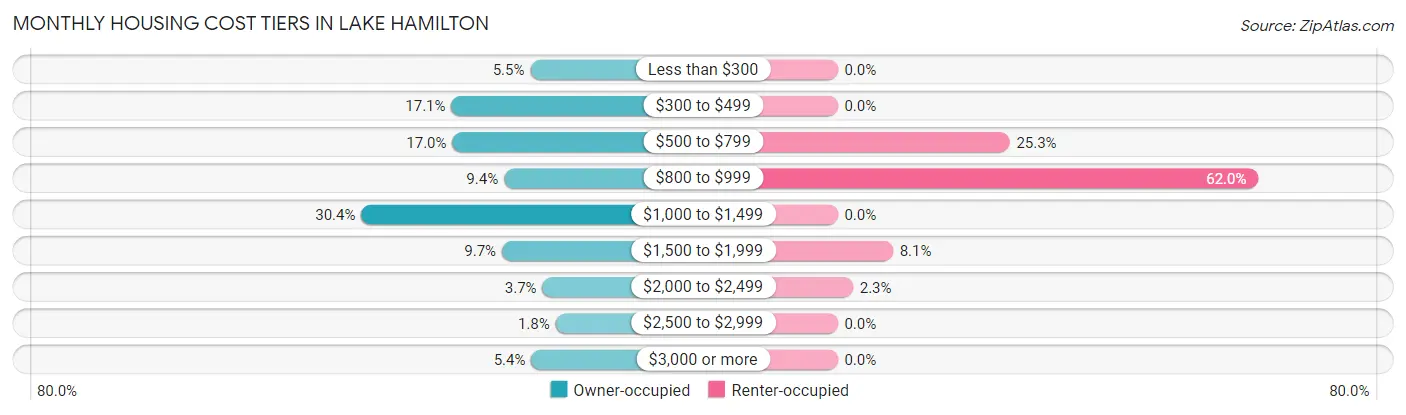
| Monthly Cost | Owner-occupied | Renter-occupied |
| Less than $300 | 37 (5.5%) | 0 (0.0%) |
| $300 to $499 | 115 (17.1%) | 0 (0.0%) |
| $500 to $799 | 114 (17.0%) | 56 (25.3%) |
| $800 to $999 | 63 (9.4%) | 137 (62.0%) |
| $1,000 to $1,499 | 204 (30.4%) | 0 (0.0%) |
| $1,500 to $1,999 | 65 (9.7%) | 18 (8.1%) |
| $2,000 to $2,499 | 25 (3.7%) | 5 (2.3%) |
| $2,500 to $2,999 | 12 (1.8%) | 0 (0.0%) |
| $3,000 or more | 36 (5.4%) | 0 (0.0%) |
| Total | 671 (100.0%) | 221 (100.0%) |
Physical Housing Characteristics in Lake Hamilton
Housing Structures in Lake Hamilton
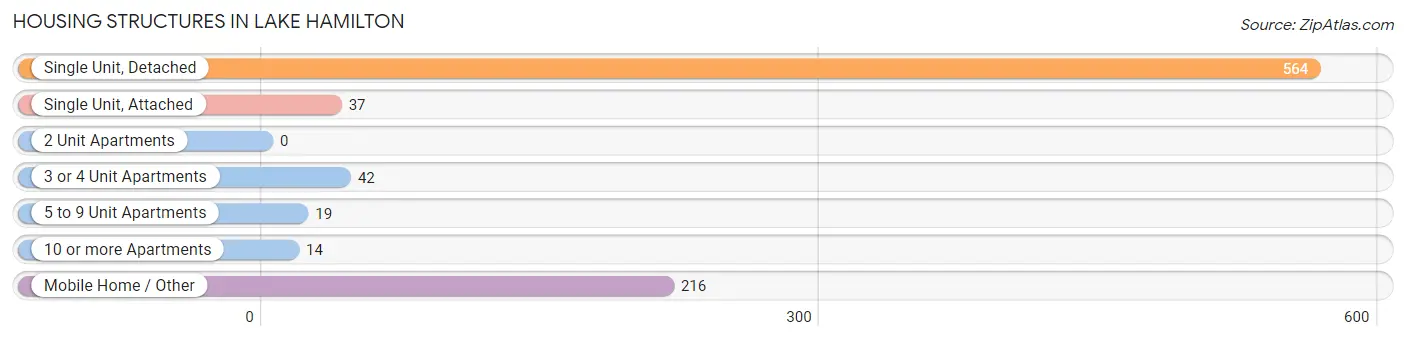
| Structure Type | # Housing Units | % Housing Units |
| Single Unit, Detached | 564 | 63.2% |
| Single Unit, Attached | 37 | 4.2% |
| 2 Unit Apartments | 0 | 0.0% |
| 3 or 4 Unit Apartments | 42 | 4.7% |
| 5 to 9 Unit Apartments | 19 | 2.1% |
| 10 or more Apartments | 14 | 1.6% |
| Mobile Home / Other | 216 | 24.2% |
| Total | 892 | 100.0% |
Housing Structures by Occupancy in Lake Hamilton
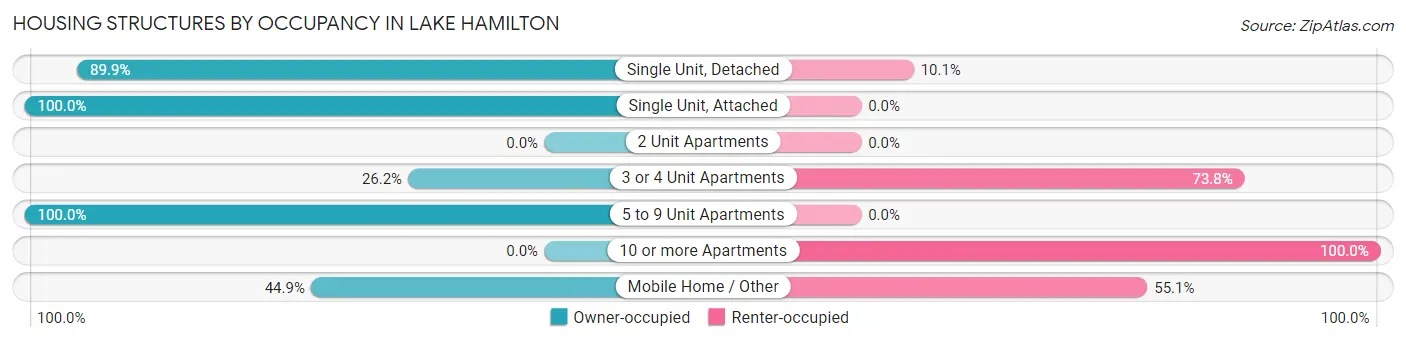
| Structure Type | Owner-occupied | Renter-occupied |
| Single Unit, Detached | 507 (89.9%) | 57 (10.1%) |
| Single Unit, Attached | 37 (100.0%) | 0 (0.0%) |
| 2 Unit Apartments | 0 (0.0%) | 0 (0.0%) |
| 3 or 4 Unit Apartments | 11 (26.2%) | 31 (73.8%) |
| 5 to 9 Unit Apartments | 19 (100.0%) | 0 (0.0%) |
| 10 or more Apartments | 0 (0.0%) | 14 (100.0%) |
| Mobile Home / Other | 97 (44.9%) | 119 (55.1%) |
| Total | 671 (75.2%) | 221 (24.8%) |
Housing Structures by Number of Rooms in Lake Hamilton
| Number of Rooms | Owner-occupied | Renter-occupied |
| 1 Room | 0 (0.0%) | 29 (13.1%) |
| 2 or 3 Rooms | 12 (1.8%) | 27 (12.2%) |
| 4 or 5 Rooms | 209 (31.1%) | 129 (58.4%) |
| 6 or 7 Rooms | 166 (24.7%) | 0 (0.0%) |
| 8 or more Rooms | 284 (42.3%) | 36 (16.3%) |
| Total | 671 (100.0%) | 221 (100.0%) |
Housing Structure by Heating Type in Lake Hamilton
| Heating Type | Owner-occupied | Renter-occupied |
| Utility Gas | 439 (65.4%) | 0 (0.0%) |
| Bottled, Tank, or LP Gas | 0 (0.0%) | 0 (0.0%) |
| Electricity | 232 (34.6%) | 221 (100.0%) |
| Fuel Oil or Kerosene | 0 (0.0%) | 0 (0.0%) |
| Coal or Coke | 0 (0.0%) | 0 (0.0%) |
| All other Fuels | 0 (0.0%) | 0 (0.0%) |
| No Fuel Used | 0 (0.0%) | 0 (0.0%) |
| Total | 671 (100.0%) | 221 (100.0%) |
Household Vehicle Usage in Lake Hamilton
| Vehicles per Household | Owner-occupied | Renter-occupied |
| No Vehicle | 15 (2.2%) | 0 (0.0%) |
| 1 Vehicle | 176 (26.2%) | 74 (33.5%) |
| 2 Vehicles | 305 (45.5%) | 129 (58.4%) |
| 3 or more Vehicles | 175 (26.1%) | 18 (8.1%) |
| Total | 671 (100.0%) | 221 (100.0%) |
Real Estate & Mortgages in Lake Hamilton
Real Estate and Mortgage Overview in Lake Hamilton
| Characteristic | Without Mortgage | With Mortgage |
| Housing Units | 300 | 371 |
| Median Property Value | $452,300 | $322,200 |
| Median Household Income | $68,790 | $94 |
| Monthly Housing Costs | $498 | $36 |
| Real Estate Taxes | $1,897 | $13 |
Property Value by Mortgage Status in Lake Hamilton
| Property Value | Without Mortgage | With Mortgage |
| Less than $50,000 | 66 (22.0%) | 35 (9.4%) |
| $50,000 to $99,999 | 0 (0.0%) | 16 (4.3%) |
| $100,000 to $299,999 | 10 (3.3%) | 101 (27.2%) |
| $300,000 to $499,999 | 126 (42.0%) | 151 (40.7%) |
| $500,000 to $749,999 | 26 (8.7%) | 12 (3.2%) |
| $750,000 to $999,999 | 72 (24.0%) | 56 (15.1%) |
| $1,000,000 or more | 0 (0.0%) | 0 (0.0%) |
| Total | 300 (100.0%) | 371 (100.0%) |
Household Income by Mortgage Status in Lake Hamilton
| Household Income | Without Mortgage | With Mortgage |
| Less than $10,000 | 0 (0.0%) | 0 (0.0%) |
| $10,000 to $24,999 | 23 (7.7%) | 0 (0.0%) |
| $25,000 to $34,999 | 57 (19.0%) | 11 (3.0%) |
| $35,000 to $49,999 | 0 (0.0%) | 0 (0.0%) |
| $50,000 to $74,999 | 85 (28.3%) | 64 (17.2%) |
| $75,000 to $99,999 | 44 (14.7%) | 60 (16.2%) |
| $100,000 to $149,999 | 39 (13.0%) | 117 (31.5%) |
| $150,000 or more | 52 (17.3%) | 25 (6.7%) |
| Total | 300 (100.0%) | 371 (100.0%) |
Property Value to Household Income Ratio in Lake Hamilton
| Value-to-Income Ratio | Without Mortgage | With Mortgage |
| Less than 2.0x | 117 (39.0%) | 86,214 (23,238.3%) |
| 2.0x to 2.9x | 11 (3.7%) | 115 (31.0%) |
| 3.0x to 3.9x | 22 (7.3%) | 51 (13.8%) |
| 4.0x or more | 150 (50.0%) | 97 (26.2%) |
| Total | 300 (100.0%) | 371 (100.0%) |
Real Estate Taxes by Mortgage Status in Lake Hamilton
| Property Taxes | Without Mortgage | With Mortgage |
| Less than $800 | 89 (29.7%) | 0 (0.0%) |
| $800 to $1,499 | 24 (8.0%) | 116 (31.3%) |
| $800 to $1,499 | 175 (58.3%) | 31 (8.4%) |
| Total | 300 (100.0%) | 371 (100.0%) |
Health & Disability in Lake Hamilton
Health Insurance Coverage by Age in Lake Hamilton
| Age Bracket | With Coverage | Without Coverage |
| Under 6 Years | 51 (100.0%) | 0 (0.0%) |
| 6 to 18 Years | 420 (100.0%) | 0 (0.0%) |
| 19 to 25 Years | 68 (100.0%) | 0 (0.0%) |
| 26 to 34 Years | 77 (87.5%) | 11 (12.5%) |
| 35 to 44 Years | 431 (100.0%) | 0 (0.0%) |
| 45 to 54 Years | 71 (100.0%) | 0 (0.0%) |
| 55 to 64 Years | 329 (93.7%) | 22 (6.3%) |
| 65 to 74 Years | 326 (100.0%) | 0 (0.0%) |
| 75 Years and older | 225 (100.0%) | 0 (0.0%) |
| Total | 1,998 (98.4%) | 33 (1.6%) |
Health Insurance Coverage by Citizenship Status in Lake Hamilton
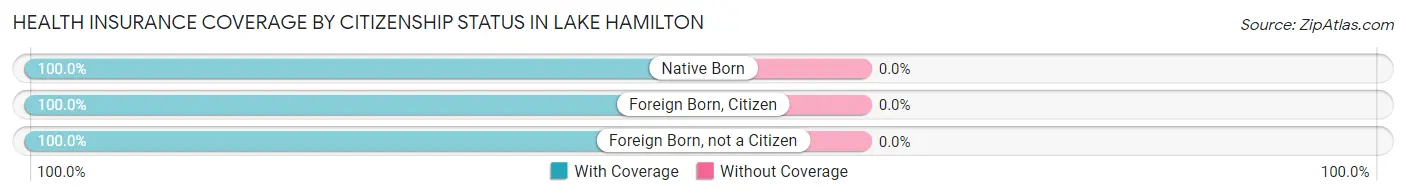
| Citizenship Status | With Coverage | Without Coverage |
| Native Born | 51 (100.0%) | 0 (0.0%) |
| Foreign Born, Citizen | 420 (100.0%) | 0 (0.0%) |
| Foreign Born, not a Citizen | 68 (100.0%) | 0 (0.0%) |
Health Insurance Coverage by Household Income in Lake Hamilton
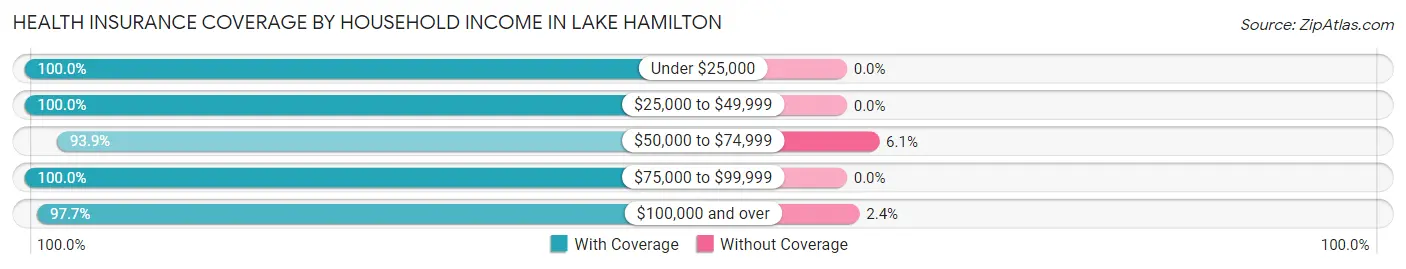
| Household Income | With Coverage | Without Coverage |
| Under $25,000 | 80 (100.0%) | 0 (0.0%) |
| $25,000 to $49,999 | 438 (100.0%) | 0 (0.0%) |
| $50,000 to $74,999 | 341 (93.9%) | 22 (6.1%) |
| $75,000 to $99,999 | 682 (100.0%) | 0 (0.0%) |
| $100,000 and over | 457 (97.7%) | 11 (2.4%) |
Public vs Private Health Insurance Coverage by Age in Lake Hamilton
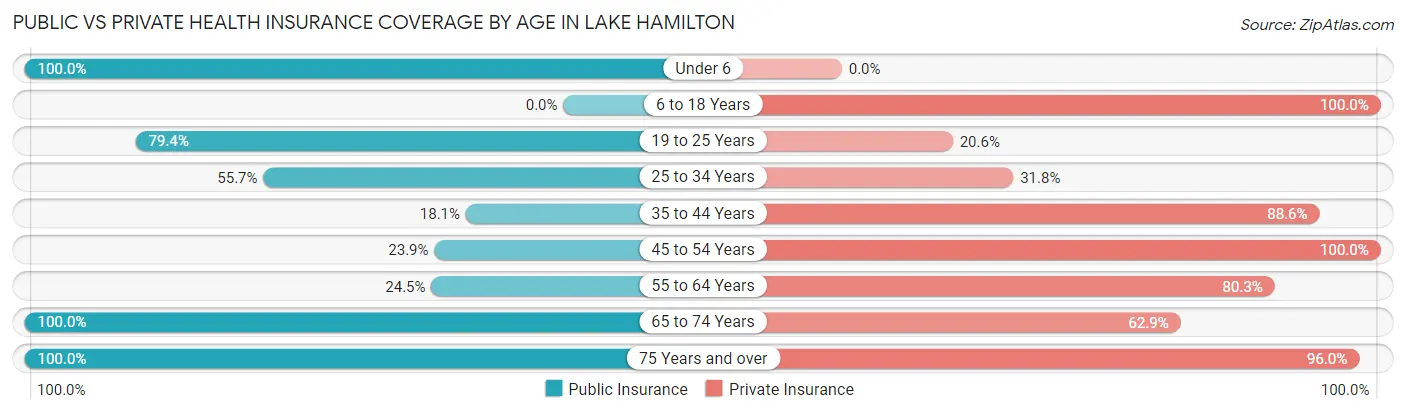
| Age Bracket | Public Insurance | Private Insurance |
| Under 6 | 51 (100.0%) | 0 (0.0%) |
| 6 to 18 Years | 0 (0.0%) | 420 (100.0%) |
| 19 to 25 Years | 54 (79.4%) | 14 (20.6%) |
| 25 to 34 Years | 49 (55.7%) | 28 (31.8%) |
| 35 to 44 Years | 78 (18.1%) | 382 (88.6%) |
| 45 to 54 Years | 17 (23.9%) | 71 (100.0%) |
| 55 to 64 Years | 86 (24.5%) | 282 (80.3%) |
| 65 to 74 Years | 326 (100.0%) | 205 (62.9%) |
| 75 Years and over | 225 (100.0%) | 216 (96.0%) |
| Total | 886 (43.6%) | 1,618 (79.7%) |
Disability Status by Sex by Age in Lake Hamilton
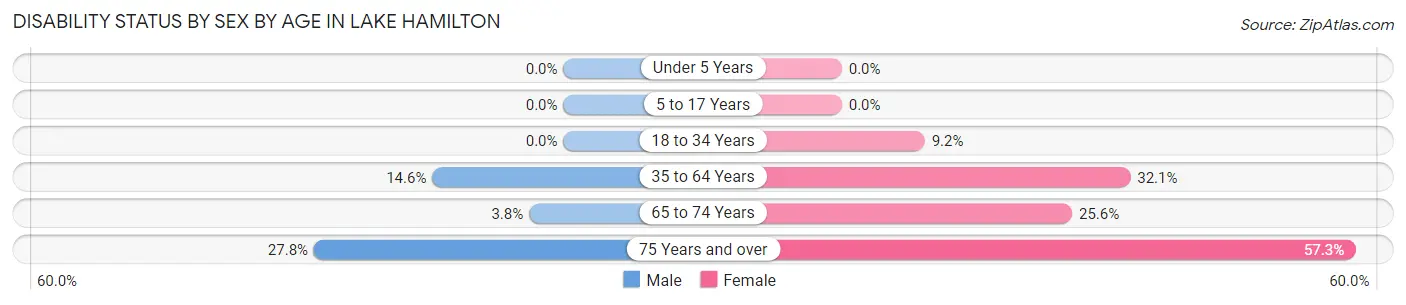
| Age Bracket | Male | Female |
| Under 5 Years | 0 (0.0%) | 0 (0.0%) |
| 5 to 17 Years | 0 (0.0%) | 0 (0.0%) |
| 18 to 34 Years | 0 (0.0%) | 11 (9.2%) |
| 35 to 64 Years | 60 (14.6%) | 142 (32.1%) |
| 65 to 74 Years | 5 (3.8%) | 50 (25.6%) |
| 75 Years and over | 30 (27.8%) | 67 (57.3%) |
Disability Class by Sex by Age in Lake Hamilton
Disability Class: Hearing Difficulty
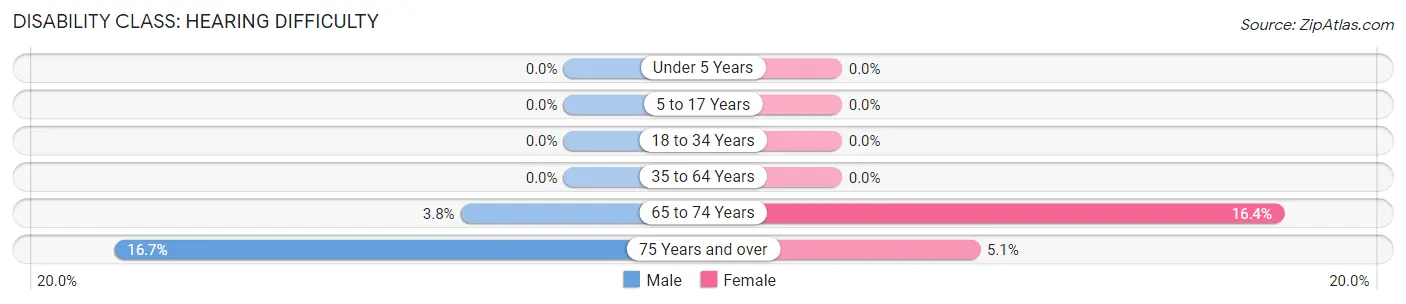
| Age Bracket | Male | Female |
| Under 5 Years | 0 (0.0%) | 0 (0.0%) |
| 5 to 17 Years | 0 (0.0%) | 0 (0.0%) |
| 18 to 34 Years | 0 (0.0%) | 0 (0.0%) |
| 35 to 64 Years | 0 (0.0%) | 0 (0.0%) |
| 65 to 74 Years | 5 (3.8%) | 32 (16.4%) |
| 75 Years and over | 18 (16.7%) | 6 (5.1%) |
Disability Class: Vision Difficulty
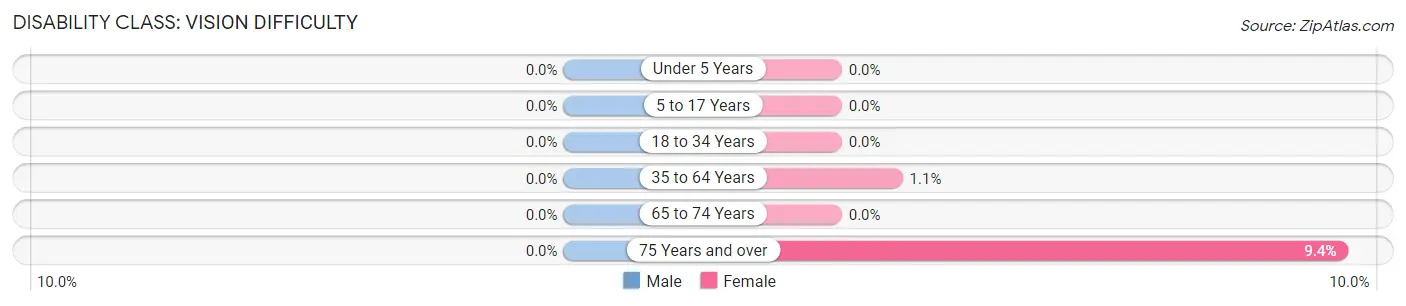
| Age Bracket | Male | Female |
| Under 5 Years | 0 (0.0%) | 0 (0.0%) |
| 5 to 17 Years | 0 (0.0%) | 0 (0.0%) |
| 18 to 34 Years | 0 (0.0%) | 0 (0.0%) |
| 35 to 64 Years | 0 (0.0%) | 5 (1.1%) |
| 65 to 74 Years | 0 (0.0%) | 0 (0.0%) |
| 75 Years and over | 0 (0.0%) | 11 (9.4%) |
Disability Class: Cognitive Difficulty
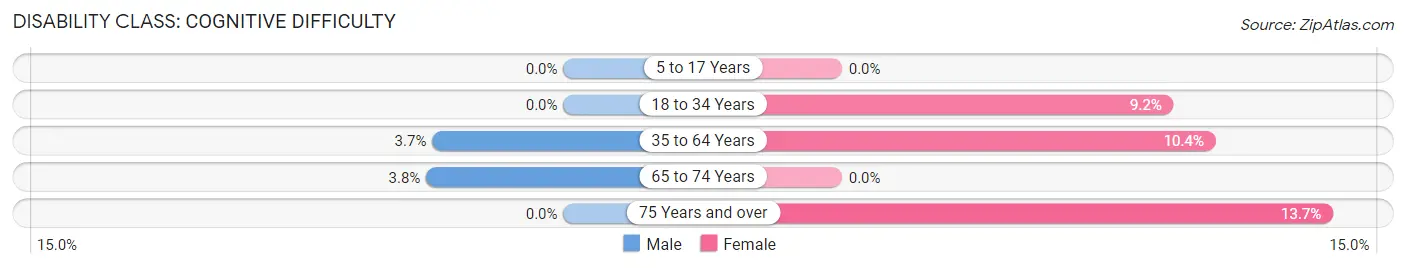
| Age Bracket | Male | Female |
| 5 to 17 Years | 0 (0.0%) | 0 (0.0%) |
| 18 to 34 Years | 0 (0.0%) | 11 (9.2%) |
| 35 to 64 Years | 15 (3.6%) | 46 (10.4%) |
| 65 to 74 Years | 5 (3.8%) | 0 (0.0%) |
| 75 Years and over | 0 (0.0%) | 16 (13.7%) |
Disability Class: Ambulatory Difficulty
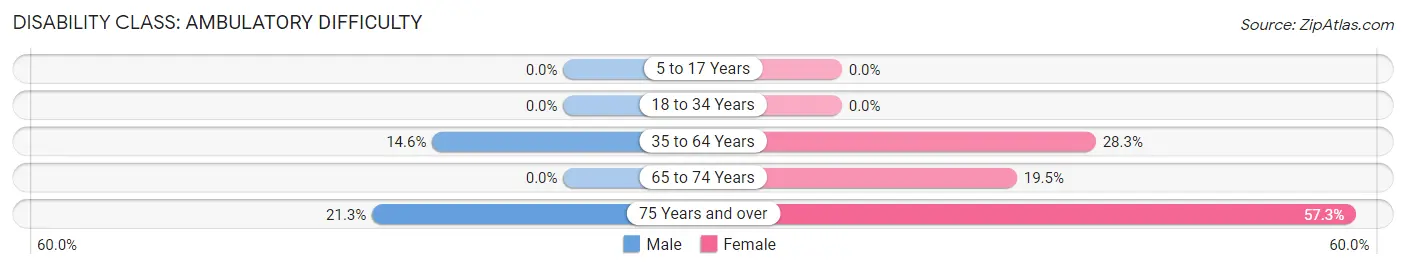
| Age Bracket | Male | Female |
| 5 to 17 Years | 0 (0.0%) | 0 (0.0%) |
| 18 to 34 Years | 0 (0.0%) | 0 (0.0%) |
| 35 to 64 Years | 60 (14.6%) | 125 (28.3%) |
| 65 to 74 Years | 0 (0.0%) | 38 (19.5%) |
| 75 Years and over | 23 (21.3%) | 67 (57.3%) |
Disability Class: Self-Care Difficulty
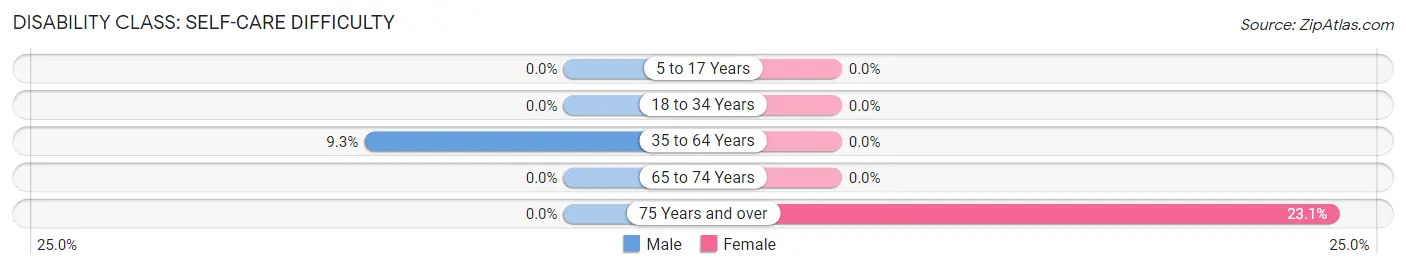
| Age Bracket | Male | Female |
| 5 to 17 Years | 0 (0.0%) | 0 (0.0%) |
| 18 to 34 Years | 0 (0.0%) | 0 (0.0%) |
| 35 to 64 Years | 38 (9.2%) | 0 (0.0%) |
| 65 to 74 Years | 0 (0.0%) | 0 (0.0%) |
| 75 Years and over | 0 (0.0%) | 27 (23.1%) |
Technology Access in Lake Hamilton
Computing Device Access in Lake Hamilton
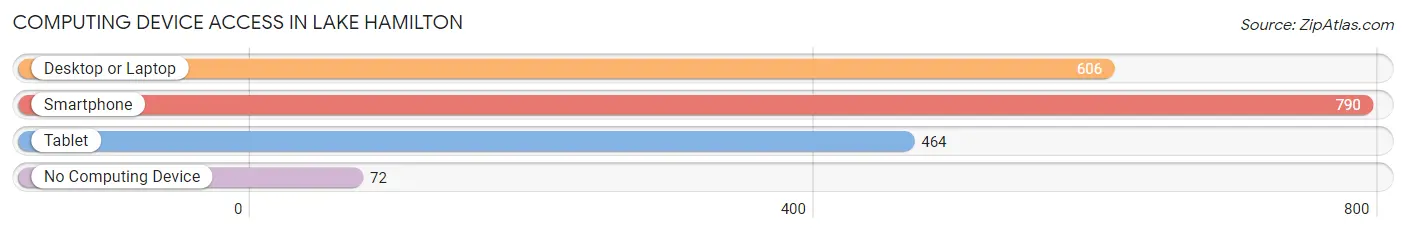
| Device Type | # Households | % Households |
| Desktop or Laptop | 606 | 67.9% |
| Smartphone | 790 | 88.6% |
| Tablet | 464 | 52.0% |
| No Computing Device | 72 | 8.1% |
| Total | 892 | 100.0% |
Internet Access in Lake Hamilton
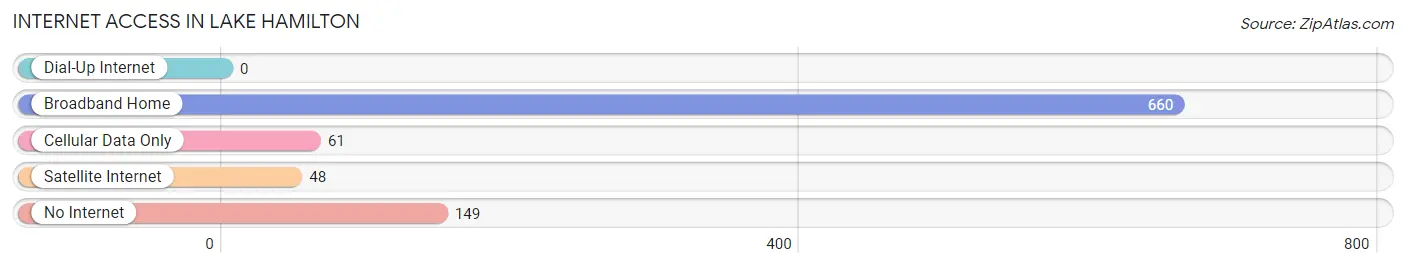
| Internet Type | # Households | % Households |
| Dial-Up Internet | 0 | 0.0% |
| Broadband Home | 660 | 74.0% |
| Cellular Data Only | 61 | 6.8% |
| Satellite Internet | 48 | 5.4% |
| No Internet | 149 | 16.7% |
| Total | 892 | 100.0% |
Lake Hamilton Summary
History
Lake Hamilton is a town located in Garland County, Arkansas. It is situated on the western shore of Lake Hamilton, a 7,200-acre reservoir created by the construction of Carpenter Dam in 1932. The town was founded in the early 1930s as a resort community and has since grown to become a popular tourist destination.
The area around Lake Hamilton has a long history of human habitation. Archaeological evidence suggests that the area was inhabited by Native Americans as early as the Archaic period, around 8,000 years ago. The Caddo, Osage, and Quapaw tribes were all known to have lived in the area at various times.
The first Europeans to explore the area were French fur traders, who arrived in the late 1700s. The area was later explored by the Spanish, who established a trading post near the lake in the early 1800s.
In the early 1900s, the area around Lake Hamilton was largely undeveloped. The land was mostly used for timber and cattle ranching. In 1932, the Arkansas Power and Light Company (AP&L) began construction on Carpenter Dam, which created Lake Hamilton. The dam was completed in 1934, and the lake quickly became a popular destination for fishing, boating, and swimming.
In the late 1930s, the AP&L began to develop the area around the lake as a resort community. The company built a number of cabins and cottages, as well as a hotel and a golf course. The town of Lake Hamilton was officially incorporated in 1941.
Geography
Lake Hamilton is located in the Ouachita Mountains of western Arkansas. The town is situated on the western shore of Lake Hamilton, a 7,200-acre reservoir created by the construction of Carpenter Dam in 1932. The lake is fed by the Ouachita River and is surrounded by the Ouachita National Forest.
The town of Lake Hamilton is located approximately 10 miles south of Hot Springs, Arkansas. It is situated at an elevation of 590 feet above sea level. The town has a total area of 4.2 square miles, all of which is land.
Economy
The economy of Lake Hamilton is largely based on tourism. The town is a popular destination for fishing, boating, and swimming. There are also several resorts and hotels in the area, as well as a golf course.
The town is also home to several businesses, including restaurants, retail stores, and a marina. The town is also home to a number of manufacturing companies, including a furniture factory and a plastics factory.
Demographics
As of the 2010 census, the population of Lake Hamilton was 2,945. The racial makeup of the town was 95.3% White, 0.7% African American, 0.3% Native American, 0.7% Asian, 0.1% Pacific Islander, and 2.0% from other races. Hispanic or Latino of any race were 2.7% of the population.
The median household income in Lake Hamilton was $41,944, and the median family income was $50,000. The per capita income for the town was $21,945. About 8.3% of families and 11.2% of the population were below the poverty line, including 16.2% of those under age 18 and 8.2% of those age 65 or over.
Common Questions
What is Per Capita Income in Lake Hamilton?
Per Capita income in Lake Hamilton is $50,741.
What is the Median Family Income in Lake Hamilton?
Median Family Income in Lake Hamilton is $85,296.
What is the Median Household income in Lake Hamilton?
Median Household Income in Lake Hamilton is $62,130.
What is Inequality or Gini Index in Lake Hamilton?
Inequality or Gini Index in Lake Hamilton is 0.52.
What is the Total Population of Lake Hamilton?
Total Population of Lake Hamilton is 2,031.
What is the Total Male Population of Lake Hamilton?
Total Male Population of Lake Hamilton is 920.
What is the Total Female Population of Lake Hamilton?
Total Female Population of Lake Hamilton is 1,111.
What is the Ratio of Males per 100 Females in Lake Hamilton?
There are 82.81 Males per 100 Females in Lake Hamilton.
What is the Ratio of Females per 100 Males in Lake Hamilton?
There are 120.76 Females per 100 Males in Lake Hamilton.
What is the Median Population Age in Lake Hamilton?
Median Population Age in Lake Hamilton is 42.6 Years.
What is the Average Family Size in Lake Hamilton
Average Family Size in Lake Hamilton is 2.7 People.
What is the Average Household Size in Lake Hamilton
Average Household Size in Lake Hamilton is 2.3 People.
How Large is the Labor Force in Lake Hamilton?
There are 825 People in the Labor Forcein in Lake Hamilton.
What is the Percentage of People in the Labor Force in Lake Hamilton?
52.4% of People are in the Labor Force in Lake Hamilton.