Zip Codes with the Highest Percentage of Population with a Degree in Visual and Performing Arts in North Little Rock, AR
RELATED REPORTS & OPTIONS
Visual and Performing Arts
North Little Rock
Compare Zip Codes
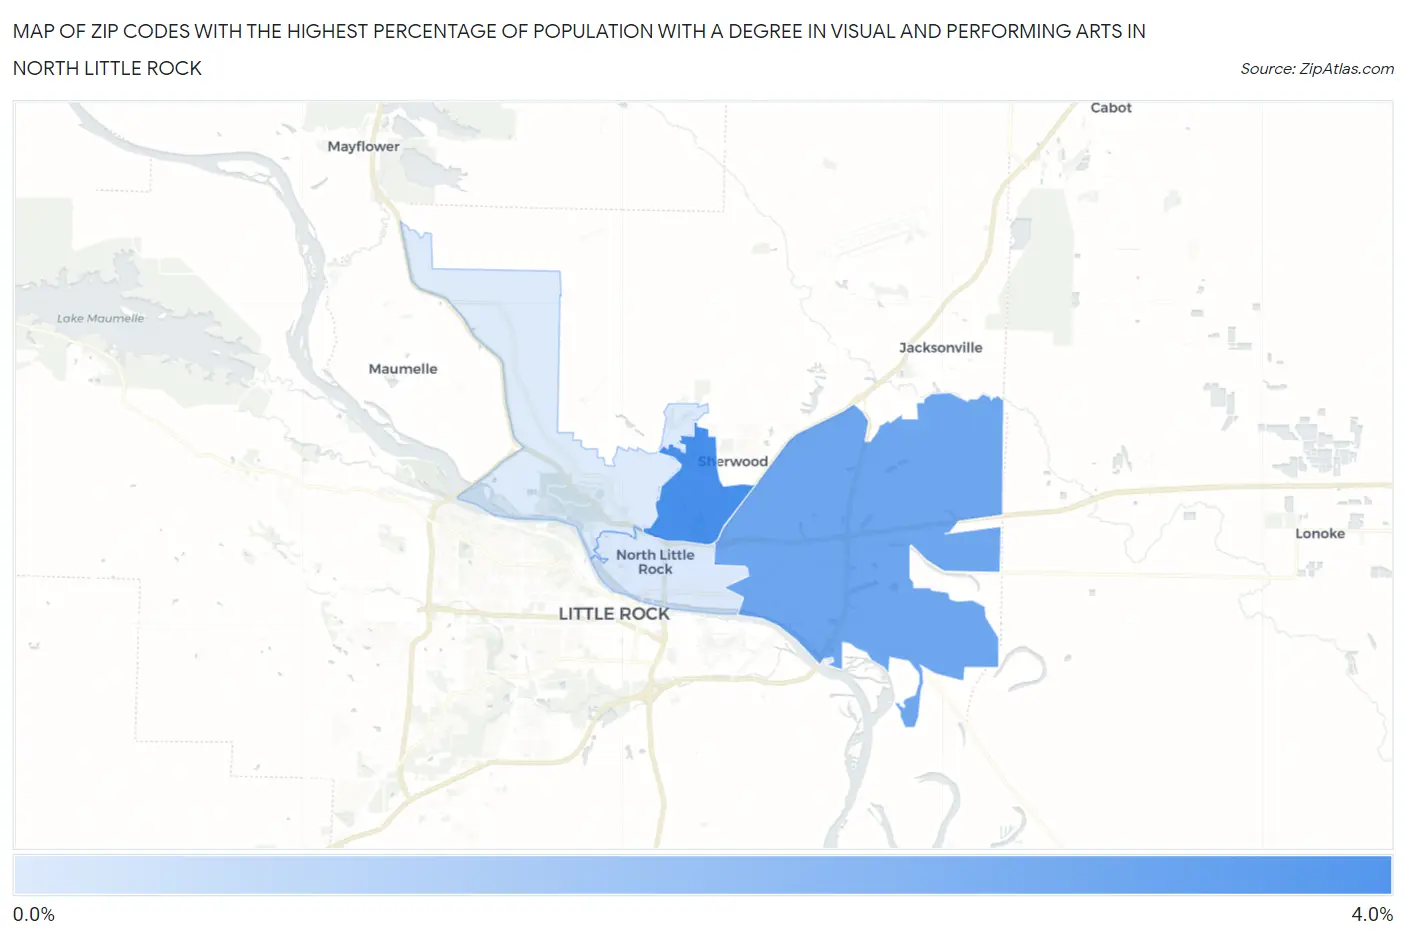
Map of Zip Codes with the Highest Percentage of Population with a Degree in Visual and Performing Arts in North Little Rock
0.75%
3.6%
Zip Codes with the Highest Percentage of Population with a Degree in Visual and Performing Arts in North Little Rock, AR
| Zip Code | % Graduates | vs State | vs National | |
| 1. | 72116 | 3.6% | 3.1%(+0.557)#112 | 4.3%(-0.622)#10,402 |
| 2. | 72117 | 2.9% | 3.1%(-0.211)#138 | 4.3%(-1.39)#13,246 |
| 3. | 72114 | 0.78% | 3.1%(-2.30)#217 | 4.3%(-3.48)#20,198 |
| 4. | 72118 | 0.75% | 3.1%(-2.33)#219 | 4.3%(-3.51)#20,271 |
1
Common Questions
What are the Top 3 Zip Codes with the Highest Percentage of Population with a Degree in Visual and Performing Arts in North Little Rock, AR?
Top 3 Zip Codes with the Highest Percentage of Population with a Degree in Visual and Performing Arts in North Little Rock, AR are:
What zip code has the Highest Percentage of Population with a Degree in Visual and Performing Arts in North Little Rock, AR?
72116 has the Highest Percentage of Population with a Degree in Visual and Performing Arts in North Little Rock, AR with 3.6%.
What is the Percentage of Population with a Degree in Visual and Performing Arts in North Little Rock, AR?
Percentage of Population with a Degree in Visual and Performing Arts in North Little Rock is 3.2%.
What is the Percentage of Population with a Degree in Visual and Performing Arts in Arkansas?
Percentage of Population with a Degree in Visual and Performing Arts in Arkansas is 3.1%.
What is the Percentage of Population with a Degree in Visual and Performing Arts in the United States?
Percentage of Population with a Degree in Visual and Performing Arts in the United States is 4.3%.