Delight, AR Map & Demographics
Delight Map
Delight Overview
$23,609
PER CAPITA INCOME
$46,500
AVG FAMILY INCOME
$30,682
AVG HOUSEHOLD INCOME
42.3%
WAGE / INCOME GAP [ % ]
57.7¢/ $1
WAGE / INCOME GAP [ $ ]
0.45
INEQUALITY / GINI INDEX
259
TOTAL POPULATION
115
MALE POPULATION
144
FEMALE POPULATION
79.86
MALES / 100 FEMALES
125.22
FEMALES / 100 MALES
51.8
MEDIAN AGE
2.8
AVG FAMILY SIZE
1.9
AVG HOUSEHOLD SIZE
94
LABOR FORCE [ PEOPLE ]
44.8%
PERCENT IN LABOR FORCE
16.0%
UNEMPLOYMENT RATE
Delight Zip Codes
Delight Area Codes
Income in Delight
Income Overview in Delight
Per Capita Income in Delight is $23,609, while median incomes of families and households are $46,500 and $30,682 respectively.
| Characteristic | Number | Measure |
| Per Capita Income | 259 | $23,609 |
| Median Family Income | 66 | $46,500 |
| Mean Family Income | 66 | $58,080 |
| Median Household Income | 136 | $30,682 |
| Mean Household Income | 136 | $45,660 |
| Income Deficit | 66 | $0 |
| Wage / Income Gap (%) | 259 | 42.32% |
| Wage / Income Gap ($) | 259 | 57.68¢ per $1 |
| Gini / Inequality Index | 259 | 0.45 |
Earnings by Sex in Delight
Average Earnings in Delight are $31,071, $33,125 for men and $19,107 for women, a difference of 42.3%.
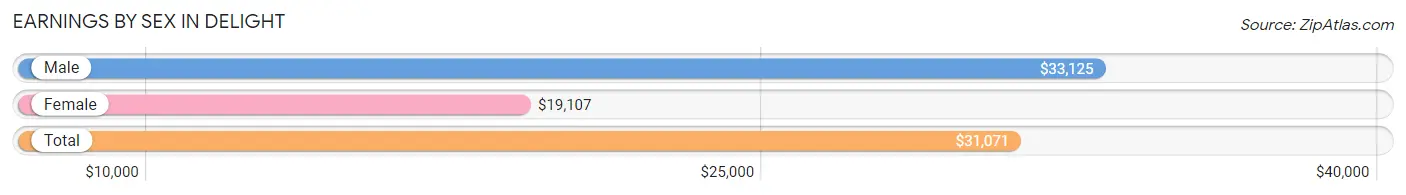
| Sex | Number | Average Earnings |
| Male | 55 (56.1%) | $33,125 |
| Female | 43 (43.9%) | $19,107 |
| Total | 98 (100.0%) | $31,071 |
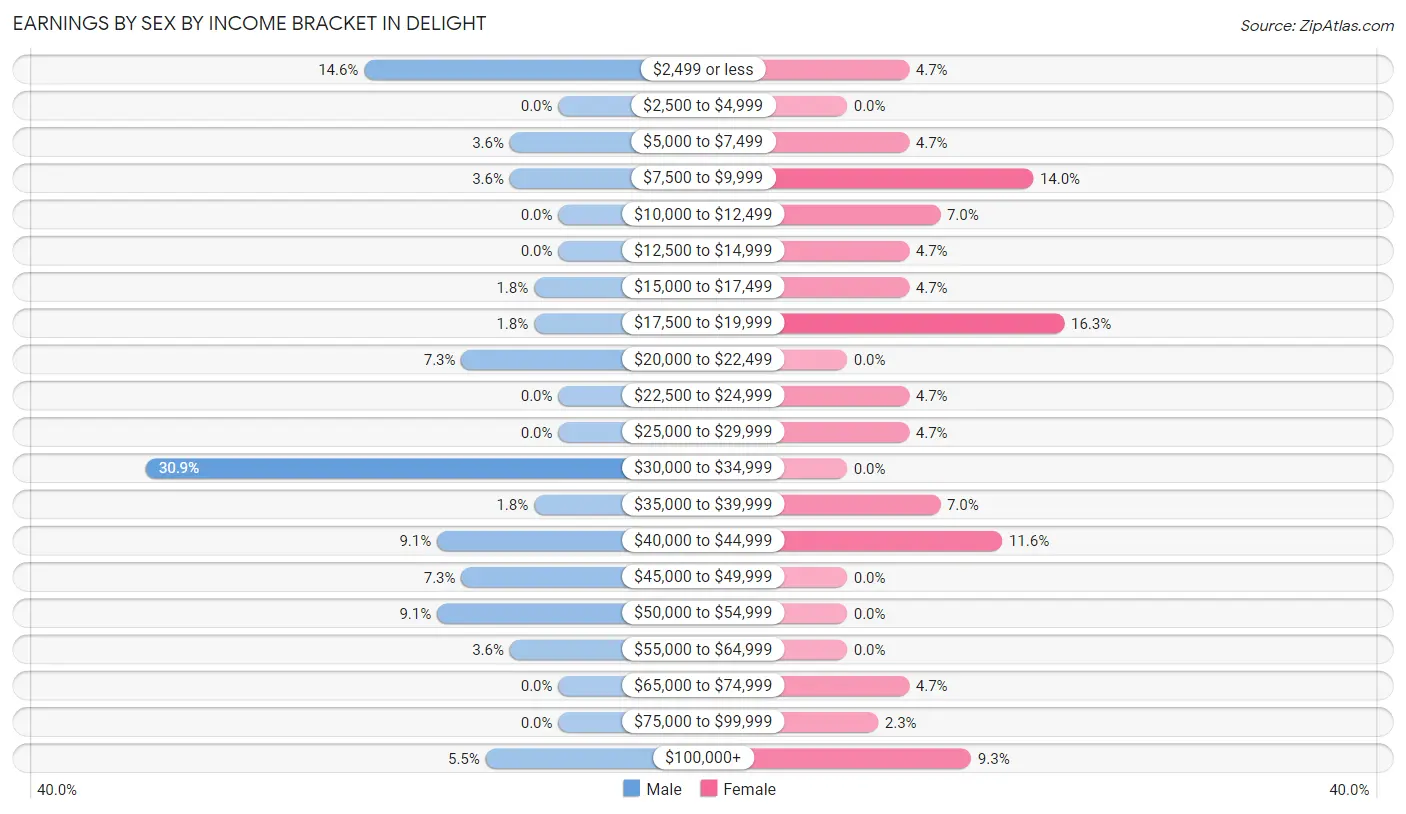
Earnings by Sex by Income Bracket in Delight
The most common earnings brackets in Delight are $30,000 to $34,999 for men (17 | 30.9%) and $17,500 to $19,999 for women (7 | 16.3%).
| Income | Male | Female |
| $2,499 or less | 8 (14.5%) | 2 (4.6%) |
| $2,500 to $4,999 | 0 (0.0%) | 0 (0.0%) |
| $5,000 to $7,499 | 2 (3.6%) | 2 (4.6%) |
| $7,500 to $9,999 | 2 (3.6%) | 6 (14.0%) |
| $10,000 to $12,499 | 0 (0.0%) | 3 (7.0%) |
| $12,500 to $14,999 | 0 (0.0%) | 2 (4.6%) |
| $15,000 to $17,499 | 1 (1.8%) | 2 (4.6%) |
| $17,500 to $19,999 | 1 (1.8%) | 7 (16.3%) |
| $20,000 to $22,499 | 4 (7.3%) | 0 (0.0%) |
| $22,500 to $24,999 | 0 (0.0%) | 2 (4.6%) |
| $25,000 to $29,999 | 0 (0.0%) | 2 (4.6%) |
| $30,000 to $34,999 | 17 (30.9%) | 0 (0.0%) |
| $35,000 to $39,999 | 1 (1.8%) | 3 (7.0%) |
| $40,000 to $44,999 | 5 (9.1%) | 5 (11.6%) |
| $45,000 to $49,999 | 4 (7.3%) | 0 (0.0%) |
| $50,000 to $54,999 | 5 (9.1%) | 0 (0.0%) |
| $55,000 to $64,999 | 2 (3.6%) | 0 (0.0%) |
| $65,000 to $74,999 | 0 (0.0%) | 2 (4.6%) |
| $75,000 to $99,999 | 0 (0.0%) | 1 (2.3%) |
| $100,000+ | 3 (5.4%) | 4 (9.3%) |
| Total | 55 (100.0%) | 43 (100.0%) |
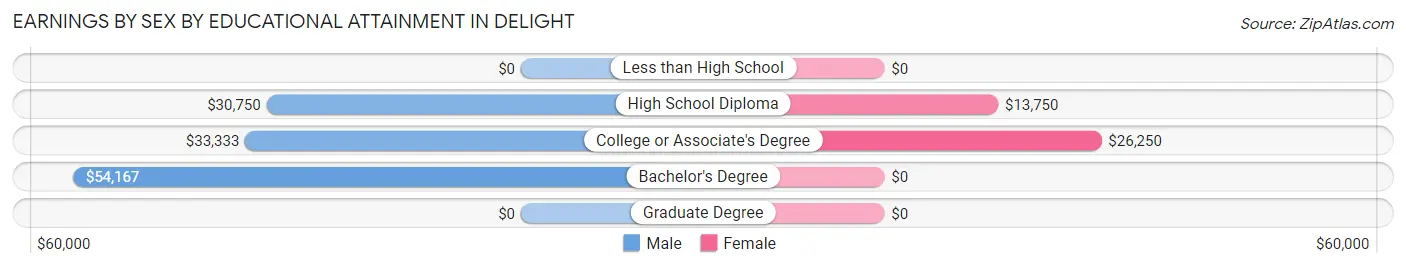
Earnings by Sex by Educational Attainment in Delight
Average earnings in Delight are $33,625 for men and $18,929 for women, a difference of 43.7%. Men with an educational attainment of bachelor's degree enjoy the highest average annual earnings of $54,167, while those with high school diploma education earn the least with $30,750. Women with an educational attainment of college or associate's degree earn the most with the average annual earnings of $26,250, while those with high school diploma education have the smallest earnings of $13,750.
| Educational Attainment | Male Income | Female Income |
| Less than High School | - | - |
| High School Diploma | $30,750 | $13,750 |
| College or Associate's Degree | $33,333 | $26,250 |
| Bachelor's Degree | $54,167 | $0 |
| Graduate Degree | - | - |
| Total | $33,625 | $18,929 |
Family Income in Delight
Family Income Brackets in Delight
According to the Delight family income data, there are 17 families falling into the $25,000 to $34,999 income range, which is the most common income bracket and makes up 25.8% of all families.
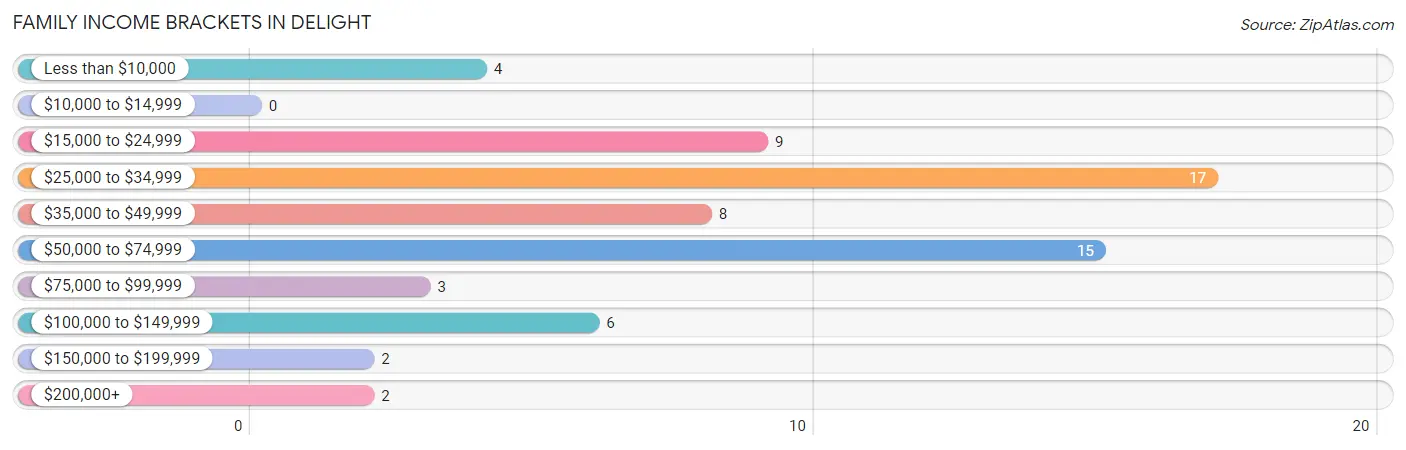
| Income Bracket | # Families | % Families |
| Less than $10,000 | 4 | 6.1% |
| $10,000 to $14,999 | 0 | 0.0% |
| $15,000 to $24,999 | 9 | 13.6% |
| $25,000 to $34,999 | 17 | 25.8% |
| $35,000 to $49,999 | 8 | 12.1% |
| $50,000 to $74,999 | 15 | 22.7% |
| $75,000 to $99,999 | 3 | 4.5% |
| $100,000 to $149,999 | 6 | 9.1% |
| $150,000 to $199,999 | 2 | 3.0% |
| $200,000+ | 2 | 3.0% |
Family Income by Famaliy Size in Delight
3-person families (10 | 15.1%) account for the highest median family income in Delight with $48,333 per family, while 2-person families (39 | 59.1%) have the highest median income of $23,542 per family member.
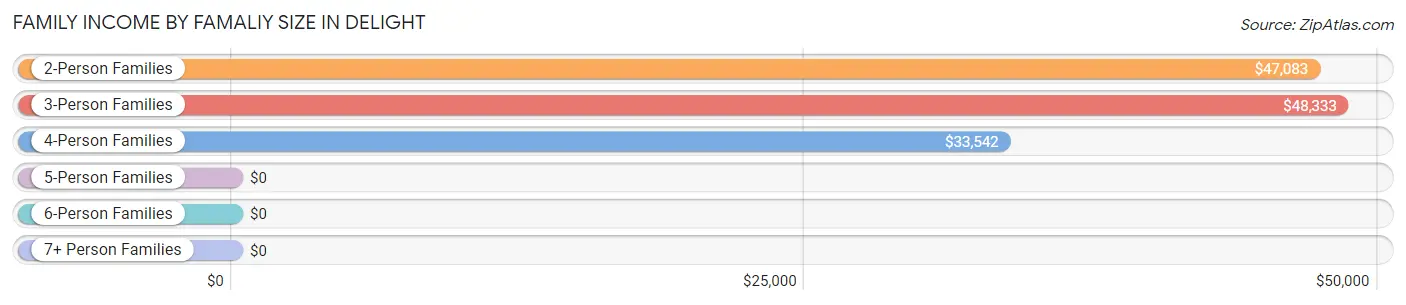
| Income Bracket | # Families | Median Income |
| 2-Person Families | 39 (59.1%) | $47,083 |
| 3-Person Families | 10 (15.1%) | $48,333 |
| 4-Person Families | 13 (19.7%) | $33,542 |
| 5-Person Families | 1 (1.5%) | $0 |
| 6-Person Families | 3 (4.5%) | $0 |
| 7+ Person Families | 0 (0.0%) | $0 |
| Total | 66 (100.0%) | $46,500 |
Family Income by Number of Earners in Delight
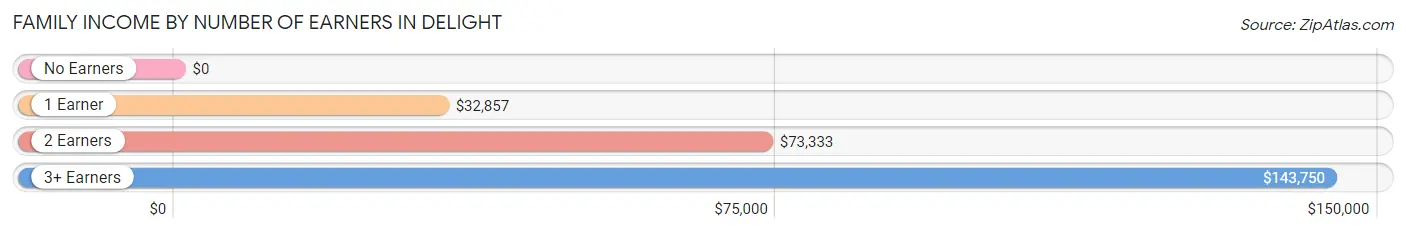
| Number of Earners | # Families | Median Income |
| No Earners | 16 (24.2%) | $0 |
| 1 Earner | 28 (42.4%) | $32,857 |
| 2 Earners | 16 (24.2%) | $73,333 |
| 3+ Earners | 6 (9.1%) | $143,750 |
| Total | 66 (100.0%) | $46,500 |
Household Income in Delight
Household Income Brackets in Delight
With 36 households falling in the category, the $25,000 to $34,999 income range is the most frequent in Delight, accounting for 26.5% of all households. In contrast, only 2 households (1.5%) fall into the $200,000+ income bracket, making it the least populous group.
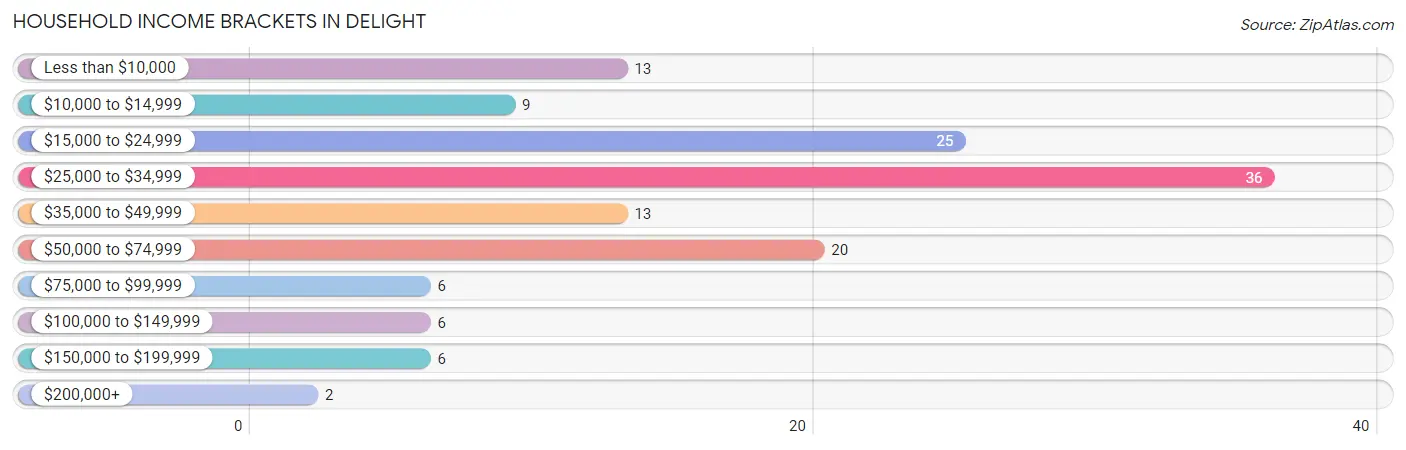
| Income Bracket | # Households | % Households |
| Less than $10,000 | 13 | 9.6% |
| $10,000 to $14,999 | 9 | 6.6% |
| $15,000 to $24,999 | 25 | 18.4% |
| $25,000 to $34,999 | 36 | 26.5% |
| $35,000 to $49,999 | 13 | 9.6% |
| $50,000 to $74,999 | 20 | 14.7% |
| $75,000 to $99,999 | 6 | 4.4% |
| $100,000 to $149,999 | 6 | 4.4% |
| $150,000 to $199,999 | 6 | 4.4% |
| $200,000+ | 2 | 1.5% |
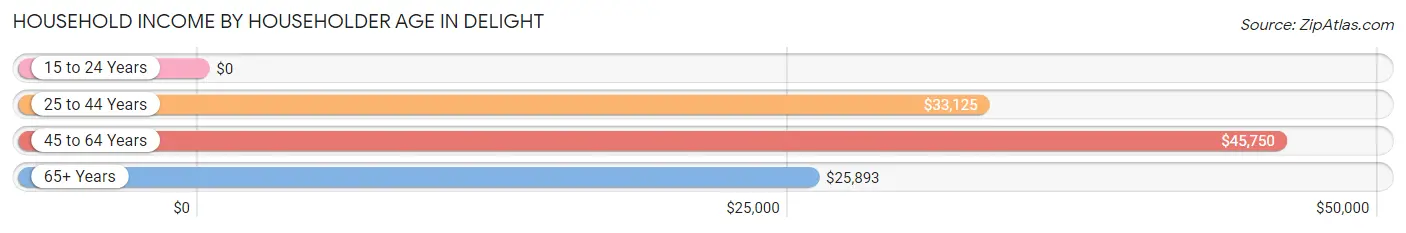
Household Income by Householder Age in Delight
The median household income in Delight is $30,682, with the highest median household income of $45,750 found in the 45 to 64 years age bracket for the primary householder. A total of 29 households (21.3%) fall into this category. Meanwhile, the 15 to 24 years age bracket for the primary householder has the lowest median household income of $0, with 3 households (2.2%) in this group.
| Income Bracket | # Households | Median Income |
| 15 to 24 Years | 3 (2.2%) | $0 |
| 25 to 44 Years | 29 (21.3%) | $33,125 |
| 45 to 64 Years | 29 (21.3%) | $45,750 |
| 65+ Years | 75 (55.1%) | $25,893 |
| Total | 136 (100.0%) | $30,682 |
Poverty in Delight
Income Below Poverty by Sex and Age in Delight
With 24.3% poverty level for males and 31.2% for females among the residents of Delight, 6 to 11 year old males and 12 to 14 year old females are the most vulnerable to poverty, with 9 males (69.2%) and 8 females (100.0%) in their respective age groups living below the poverty level.
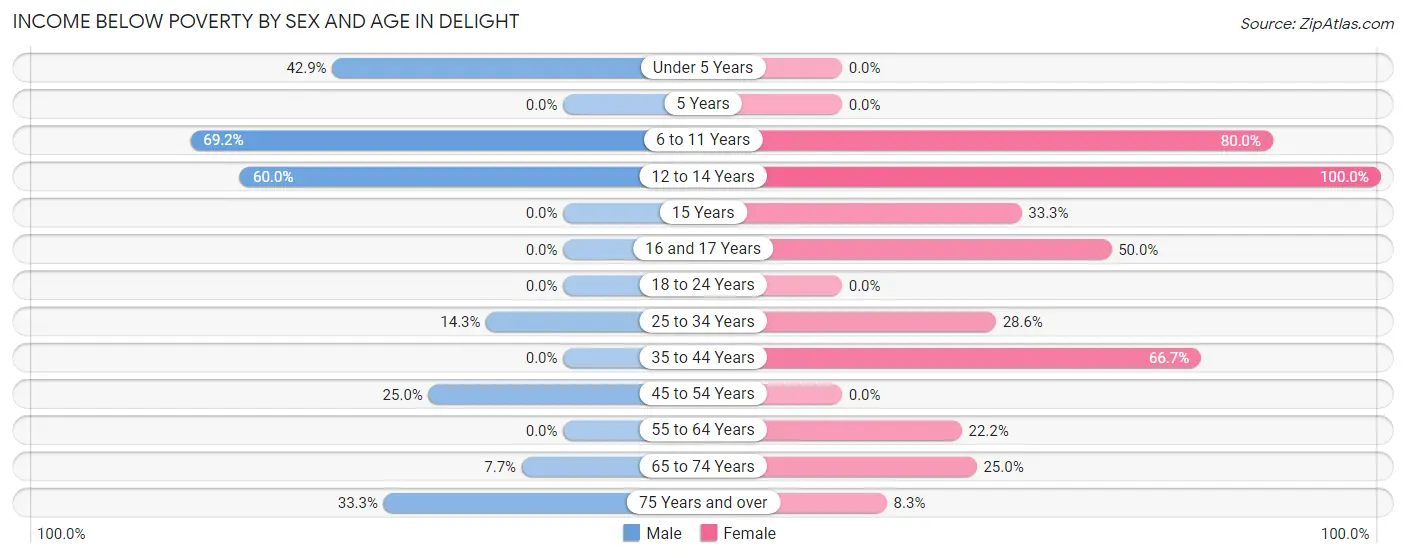
| Age Bracket | Male | Female |
| Under 5 Years | 3 (42.9%) | 0 (0.0%) |
| 5 Years | 0 (0.0%) | 0 (0.0%) |
| 6 to 11 Years | 9 (69.2%) | 8 (80.0%) |
| 12 to 14 Years | 3 (60.0%) | 8 (100.0%) |
| 15 Years | 0 (0.0%) | 1 (33.3%) |
| 16 and 17 Years | 0 (0.0%) | 2 (50.0%) |
| 18 to 24 Years | 0 (0.0%) | 0 (0.0%) |
| 25 to 34 Years | 2 (14.3%) | 6 (28.6%) |
| 35 to 44 Years | 0 (0.0%) | 6 (66.7%) |
| 45 to 54 Years | 3 (25.0%) | 0 (0.0%) |
| 55 to 64 Years | 0 (0.0%) | 4 (22.2%) |
| 65 to 74 Years | 1 (7.7%) | 8 (25.0%) |
| 75 Years and over | 7 (33.3%) | 2 (8.3%) |
| Total | 28 (24.3%) | 45 (31.2%) |
Income Above Poverty by Sex and Age in Delight
According to the poverty statistics in Delight, males aged 16 and 17 years and females aged under 5 years are the age groups that are most secure financially, with 100.0% of males and 100.0% of females in these age groups living above the poverty line.
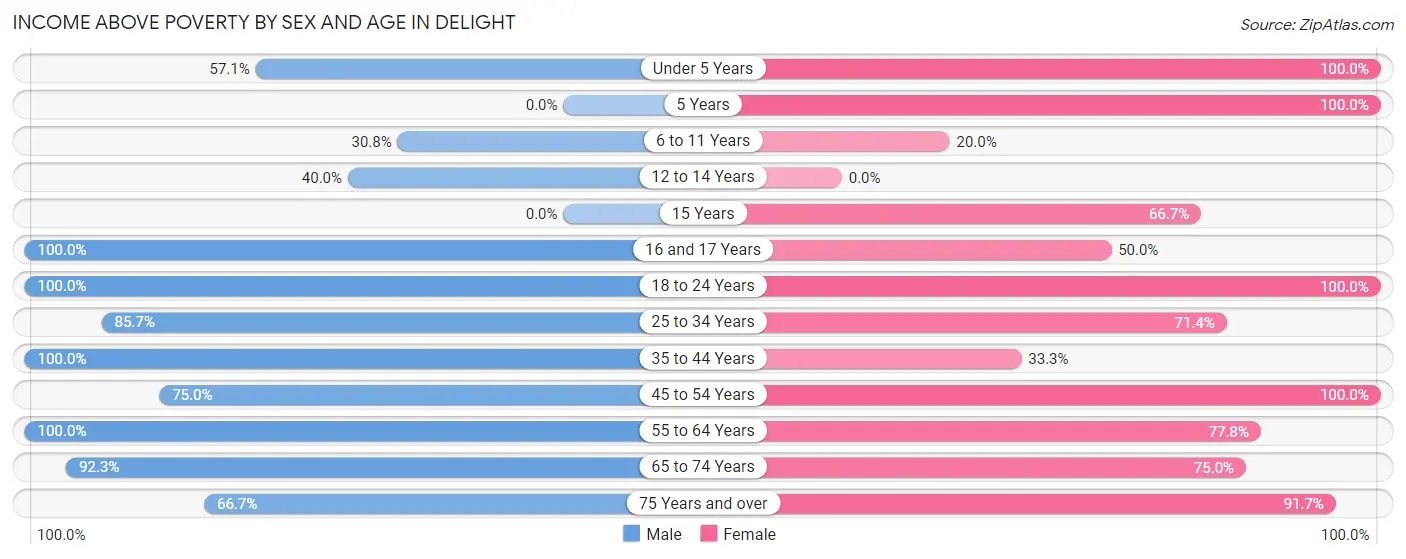
| Age Bracket | Male | Female |
| Under 5 Years | 4 (57.1%) | 1 (100.0%) |
| 5 Years | 0 (0.0%) | 2 (100.0%) |
| 6 to 11 Years | 4 (30.8%) | 2 (20.0%) |
| 12 to 14 Years | 2 (40.0%) | 0 (0.0%) |
| 15 Years | 0 (0.0%) | 2 (66.7%) |
| 16 and 17 Years | 2 (100.0%) | 2 (50.0%) |
| 18 to 24 Years | 2 (100.0%) | 5 (100.0%) |
| 25 to 34 Years | 12 (85.7%) | 15 (71.4%) |
| 35 to 44 Years | 10 (100.0%) | 3 (33.3%) |
| 45 to 54 Years | 9 (75.0%) | 7 (100.0%) |
| 55 to 64 Years | 16 (100.0%) | 14 (77.8%) |
| 65 to 74 Years | 12 (92.3%) | 24 (75.0%) |
| 75 Years and over | 14 (66.7%) | 22 (91.7%) |
| Total | 87 (75.6%) | 99 (68.8%) |
Income Below Poverty Among Married-Couple Families in Delight
The poverty statistics for married-couple families in Delight show that 5.7% or 3 of the total 53 families live below the poverty line. Families with 1 or 2 children have the highest poverty rate of 14.3%, comprising of 2 families. On the other hand, families with 3 or 4 children have the lowest poverty rate of 0.0%, which includes 0 families.
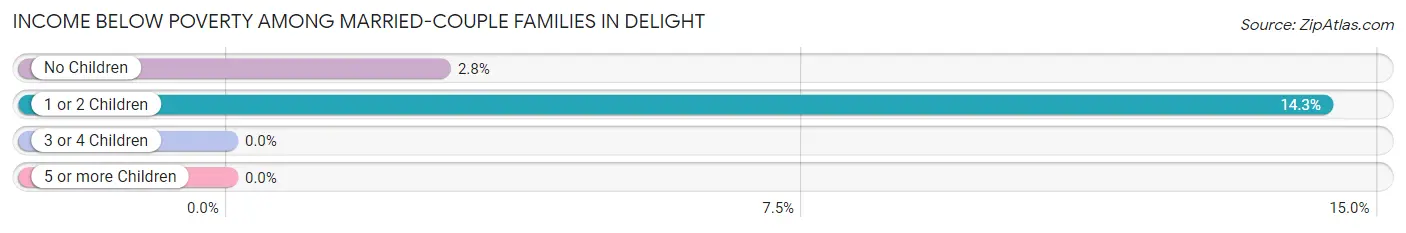
| Children | Above Poverty | Below Poverty |
| No Children | 35 (97.2%) | 1 (2.8%) |
| 1 or 2 Children | 12 (85.7%) | 2 (14.3%) |
| 3 or 4 Children | 3 (100.0%) | 0 (0.0%) |
| 5 or more Children | 0 (0.0%) | 0 (0.0%) |
| Total | 50 (94.3%) | 3 (5.7%) |
Income Below Poverty Among Single-Parent Households in Delight
According to the poverty data in Delight, 75.0% or 3 single-father households and 100.0% or 9 single-mother households are living below the poverty line. Among single-father households, those with 1 or 2 children have the highest poverty rate, with 3 households (100.0%) experiencing poverty. Likewise, among single-mother households, those with 1 or 2 children have the highest poverty rate, with 6 households (100.0%) falling below the poverty line.
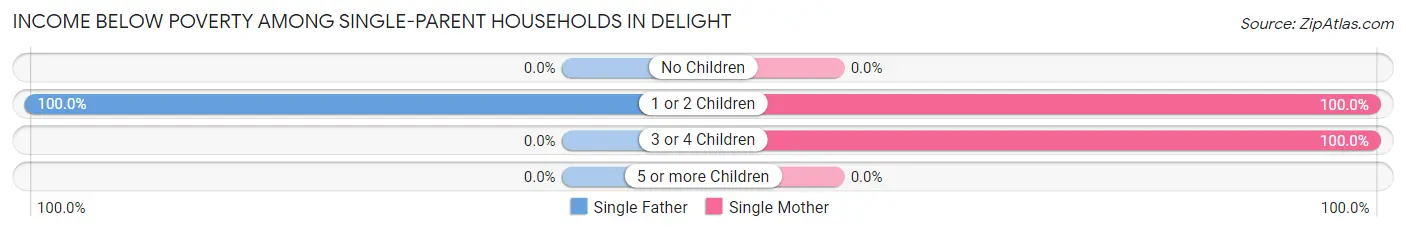
| Children | Single Father | Single Mother |
| No Children | 0 (0.0%) | 0 (0.0%) |
| 1 or 2 Children | 3 (100.0%) | 6 (100.0%) |
| 3 or 4 Children | 0 (0.0%) | 3 (100.0%) |
| 5 or more Children | 0 (0.0%) | 0 (0.0%) |
| Total | 3 (75.0%) | 9 (100.0%) |
Income Below Poverty Among Married-Couple vs Single-Parent Households in Delight
The poverty data for Delight shows that 3 of the married-couple family households (5.7%) and 12 of the single-parent households (92.3%) are living below the poverty level. Within the married-couple family households, those with 1 or 2 children have the highest poverty rate, with 2 households (14.3%) falling below the poverty line. Among the single-parent households, those with 1 or 2 children have the highest poverty rate, with 9 household (100.0%) living below poverty.
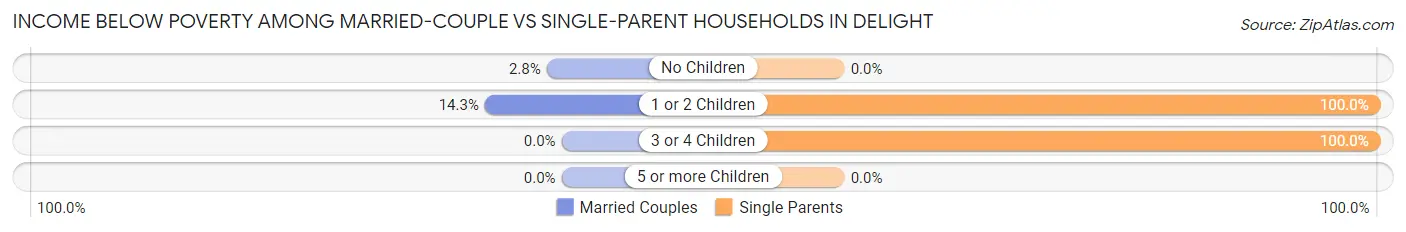
| Children | Married-Couple Families | Single-Parent Households |
| No Children | 1 (2.8%) | 0 (0.0%) |
| 1 or 2 Children | 2 (14.3%) | 9 (100.0%) |
| 3 or 4 Children | 0 (0.0%) | 3 (100.0%) |
| 5 or more Children | 0 (0.0%) | 0 (0.0%) |
| Total | 3 (5.7%) | 12 (92.3%) |
Race in Delight
The most populous races in Delight are White / Caucasian (224 | 86.5%), Black / African American (15 | 5.8%), and Two or more Races (13 | 5.0%).
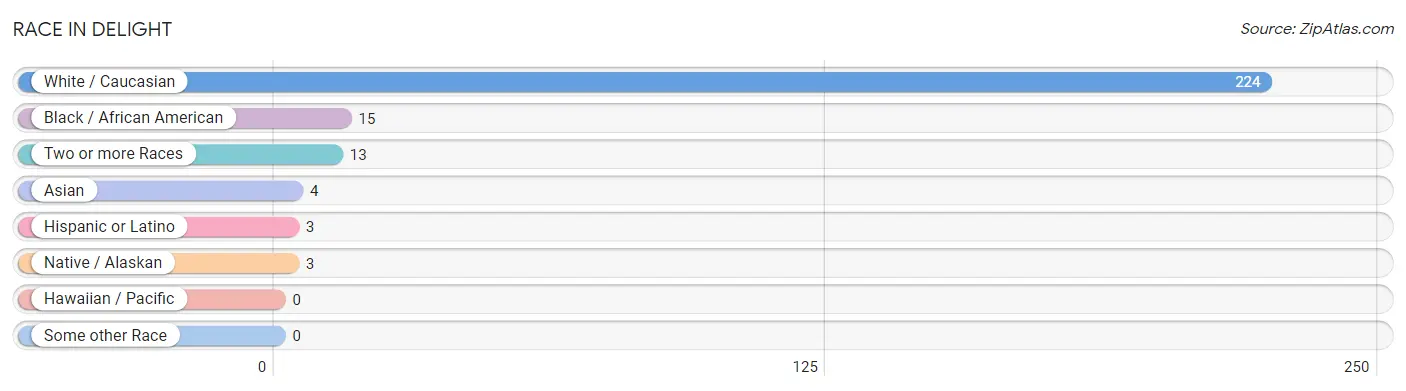
| Race | # Population | % Population |
| Asian | 4 | 1.5% |
| Black / African American | 15 | 5.8% |
| Hawaiian / Pacific | 0 | 0.0% |
| Hispanic or Latino | 3 | 1.2% |
| Native / Alaskan | 3 | 1.2% |
| White / Caucasian | 224 | 86.5% |
| Two or more Races | 13 | 5.0% |
| Some other Race | 0 | 0.0% |
| Total | 259 | 100.0% |
Ancestry in Delight
The most populous ancestries reported in Delight are English (45 | 17.4%), American (35 | 13.5%), Irish (21 | 8.1%), German (19 | 7.3%), and Scottish (17 | 6.6%), together accounting for 52.9% of all Delight residents.
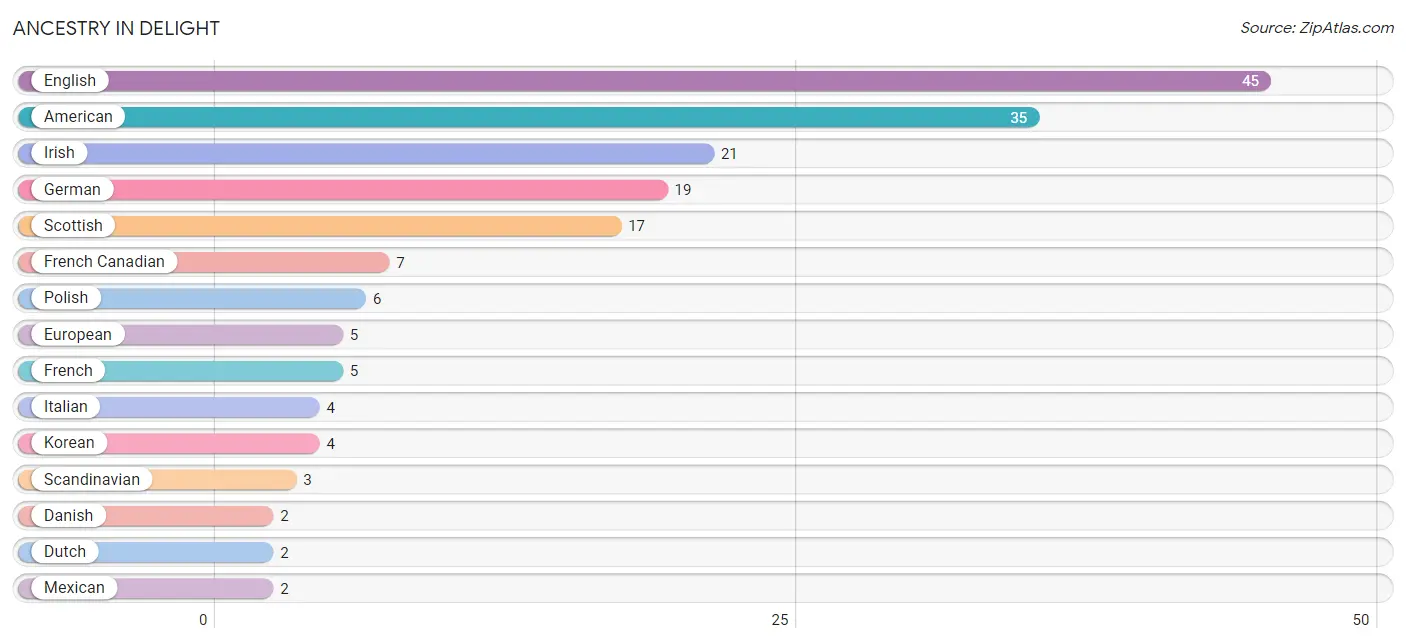
| Ancestry | # Population | % Population |
| American | 35 | 13.5% |
| Cuban | 1 | 0.4% |
| Danish | 2 | 0.8% |
| Dutch | 2 | 0.8% |
| English | 45 | 17.4% |
| European | 5 | 1.9% |
| French | 5 | 1.9% |
| French Canadian | 7 | 2.7% |
| German | 19 | 7.3% |
| Irish | 21 | 8.1% |
| Italian | 4 | 1.5% |
| Korean | 4 | 1.5% |
| Mexican | 2 | 0.8% |
| Polish | 6 | 2.3% |
| Scandinavian | 3 | 1.2% |
| Scottish | 17 | 6.6% | View All 16 Rows |
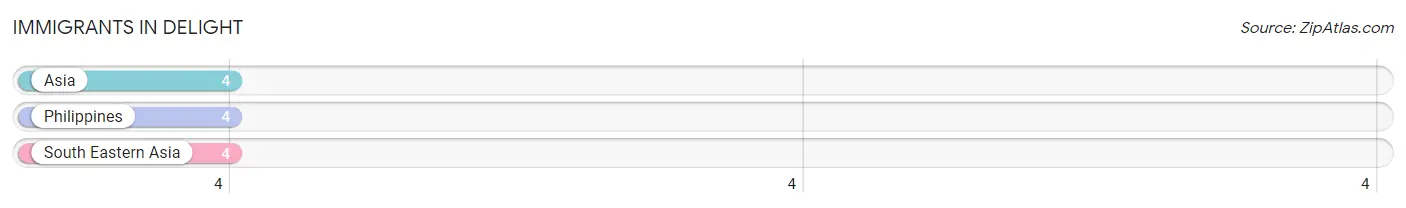
Immigrants in Delight
The most numerous immigrant groups reported in Delight came from Asia (4 | 1.5%), Philippines (4 | 1.5%), and South Eastern Asia (4 | 1.5%), together accounting for 4.6% of all Delight residents.
| Immigration Origin | # Population | % Population |
| Asia | 4 | 1.5% |
| Philippines | 4 | 1.5% |
| South Eastern Asia | 4 | 1.5% | View All 3 Rows |
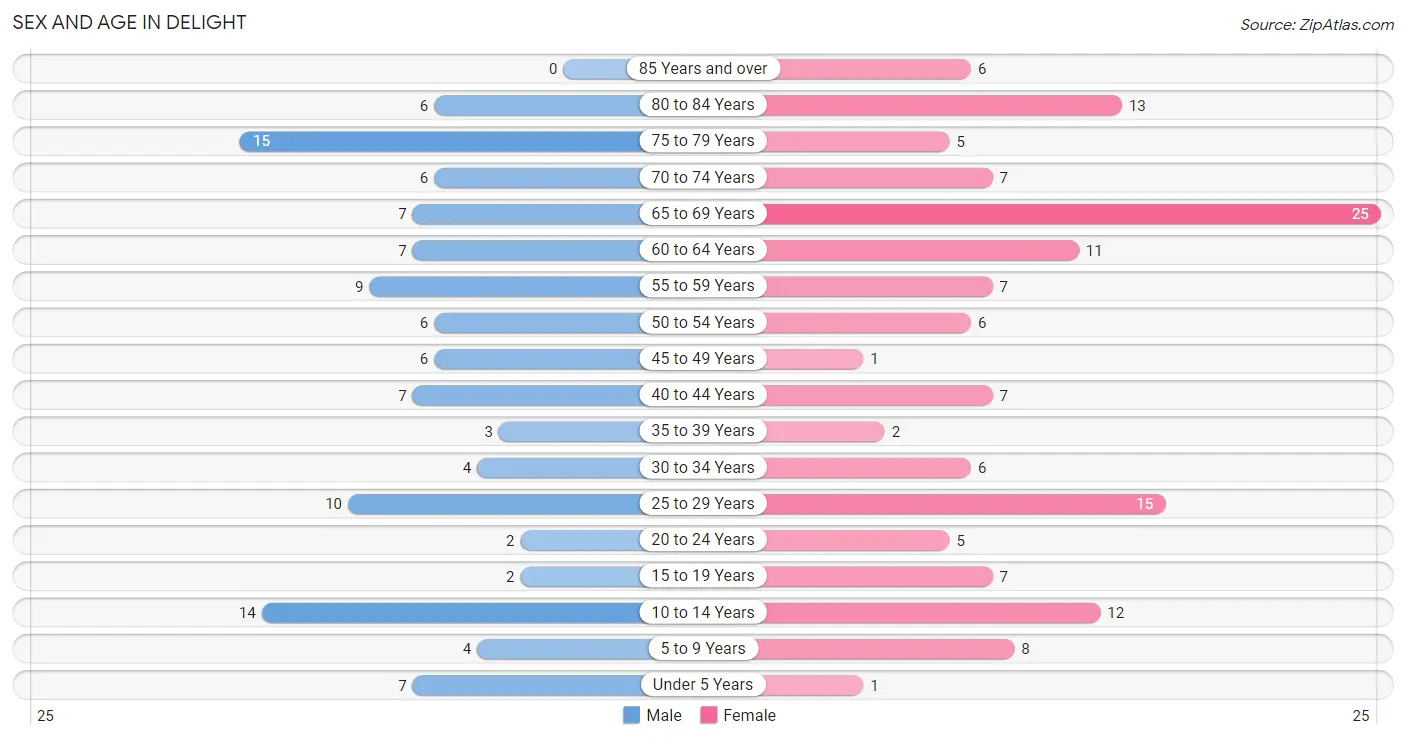
Sex and Age in Delight
Sex and Age in Delight
The most populous age groups in Delight are 75 to 79 Years (15 | 13.0%) for men and 65 to 69 Years (25 | 17.4%) for women.
| Age Bracket | Male | Female |
| Under 5 Years | 7 (6.1%) | 1 (0.7%) |
| 5 to 9 Years | 4 (3.5%) | 8 (5.6%) |
| 10 to 14 Years | 14 (12.2%) | 12 (8.3%) |
| 15 to 19 Years | 2 (1.7%) | 7 (4.9%) |
| 20 to 24 Years | 2 (1.7%) | 5 (3.5%) |
| 25 to 29 Years | 10 (8.7%) | 15 (10.4%) |
| 30 to 34 Years | 4 (3.5%) | 6 (4.2%) |
| 35 to 39 Years | 3 (2.6%) | 2 (1.4%) |
| 40 to 44 Years | 7 (6.1%) | 7 (4.9%) |
| 45 to 49 Years | 6 (5.2%) | 1 (0.7%) |
| 50 to 54 Years | 6 (5.2%) | 6 (4.2%) |
| 55 to 59 Years | 9 (7.8%) | 7 (4.9%) |
| 60 to 64 Years | 7 (6.1%) | 11 (7.6%) |
| 65 to 69 Years | 7 (6.1%) | 25 (17.4%) |
| 70 to 74 Years | 6 (5.2%) | 7 (4.9%) |
| 75 to 79 Years | 15 (13.0%) | 5 (3.5%) |
| 80 to 84 Years | 6 (5.2%) | 13 (9.0%) |
| 85 Years and over | 0 (0.0%) | 6 (4.2%) |
| Total | 115 (100.0%) | 144 (100.0%) |
Families and Households in Delight
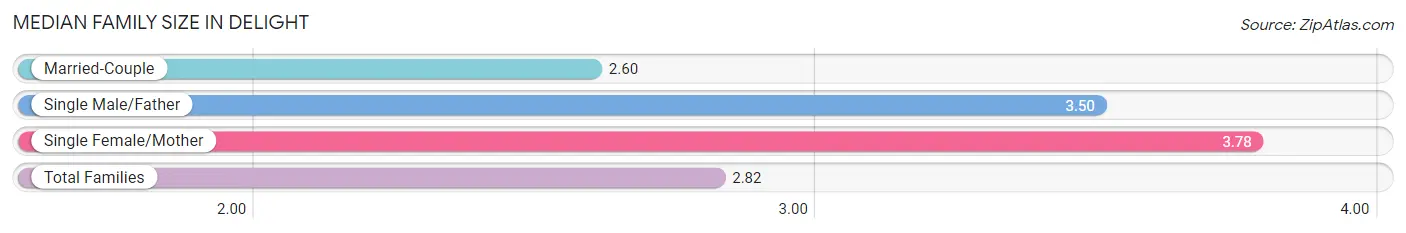
Median Family Size in Delight
The median family size in Delight is 2.82 persons per family, with single female/mother families (9 | 13.6%) accounting for the largest median family size of 3.78 persons per family. On the other hand, married-couple families (53 | 80.3%) represent the smallest median family size with 2.60 persons per family.
| Family Type | # Families | Family Size |
| Married-Couple | 53 (80.3%) | 2.60 |
| Single Male/Father | 4 (6.1%) | 3.50 |
| Single Female/Mother | 9 (13.6%) | 3.78 |
| Total Families | 66 (100.0%) | 2.82 |
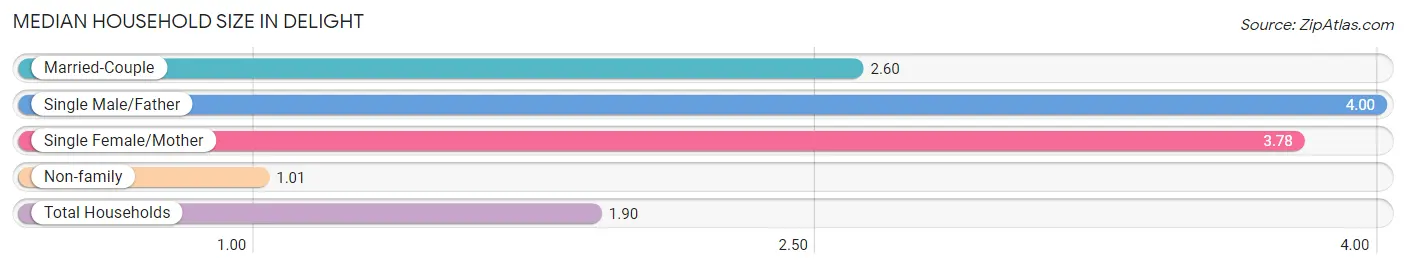
Median Household Size in Delight
The median household size in Delight is 1.90 persons per household, with single male/father households (4 | 2.9%) accounting for the largest median household size of 4 persons per household. non-family households (70 | 51.5%) represent the smallest median household size with 1.01 persons per household.
| Household Type | # Households | Household Size |
| Married-Couple | 53 (39.0%) | 2.60 |
| Single Male/Father | 4 (2.9%) | 4.00 |
| Single Female/Mother | 9 (6.6%) | 3.78 |
| Non-family | 70 (51.5%) | 1.01 |
| Total Households | 136 (100.0%) | 1.90 |
Household Size by Marriage Status in Delight
Out of a total of 136 households in Delight, 66 (48.5%) are family households, while 70 (51.5%) are nonfamily households. The most numerous type of family households are 2-person households, comprising 39, and the most common type of nonfamily households are 1-person households, comprising 69.
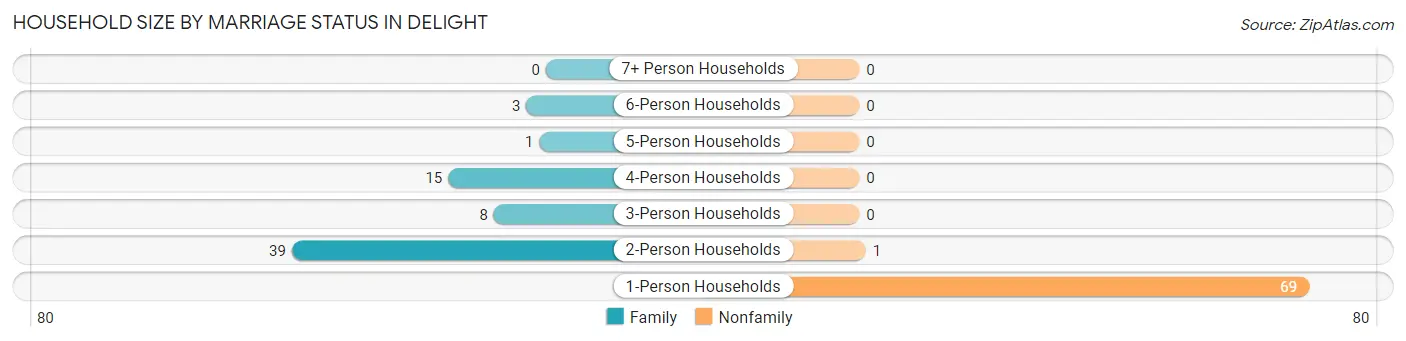
| Household Size | Family Households | Nonfamily Households |
| 1-Person Households | - | 69 (50.7%) |
| 2-Person Households | 39 (28.7%) | 1 (0.7%) |
| 3-Person Households | 8 (5.9%) | 0 (0.0%) |
| 4-Person Households | 15 (11.0%) | 0 (0.0%) |
| 5-Person Households | 1 (0.7%) | 0 (0.0%) |
| 6-Person Households | 3 (2.2%) | 0 (0.0%) |
| 7+ Person Households | 0 (0.0%) | 0 (0.0%) |
| Total | 66 (48.5%) | 70 (51.5%) |
Female Fertility in Delight
Fertility by Age in Delight
Average fertility rate in Delight is 152.0 births per 1,000 women. Women in the age bracket of 20 to 34 years have the highest fertility rate with 269.0 births per 1,000 women. Women in the age bracket of 20 to 34 years acount for 100.0% of all women with births.
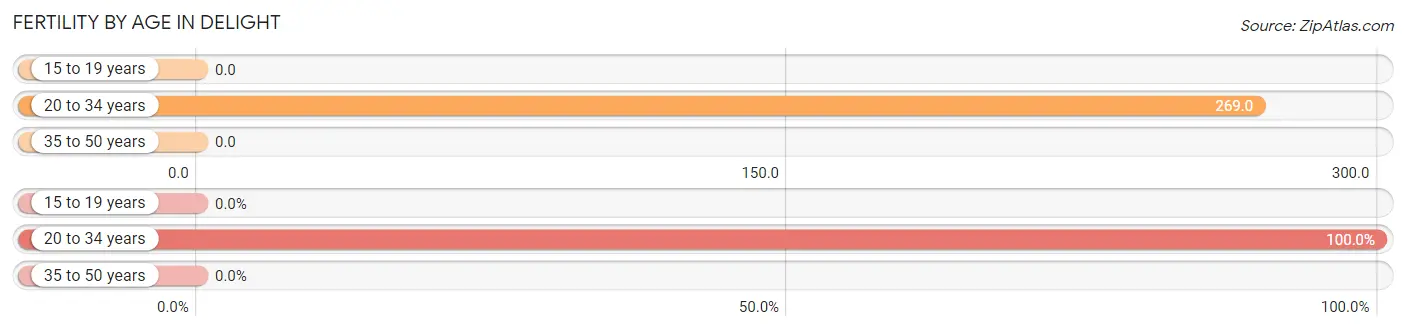
| Age Bracket | Women with Births | Births / 1,000 Women |
| 15 to 19 years | 0 (0.0%) | 0.0 |
| 20 to 34 years | 7 (100.0%) | 269.0 |
| 35 to 50 years | 0 (0.0%) | 0.0 |
| Total | 7 (100.0%) | 152.0 |
Fertility by Age by Marriage Status in Delight
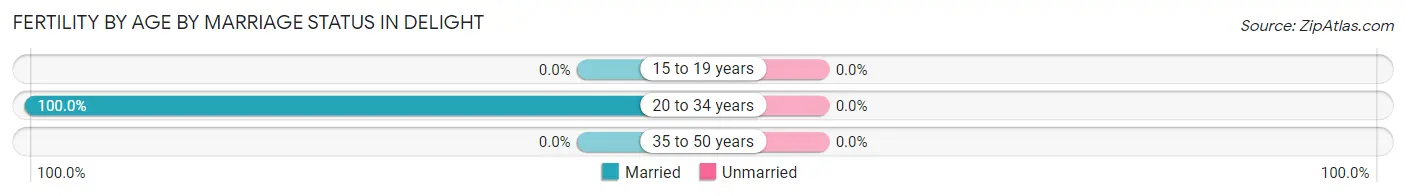
| Age Bracket | Married | Unmarried |
| 15 to 19 years | 0 (0.0%) | 0 (0.0%) |
| 20 to 34 years | 7 (100.0%) | 0 (0.0%) |
| 35 to 50 years | 0 (0.0%) | 0 (0.0%) |
| Total | 7 (100.0%) | 0 (0.0%) |
Fertility by Education in Delight
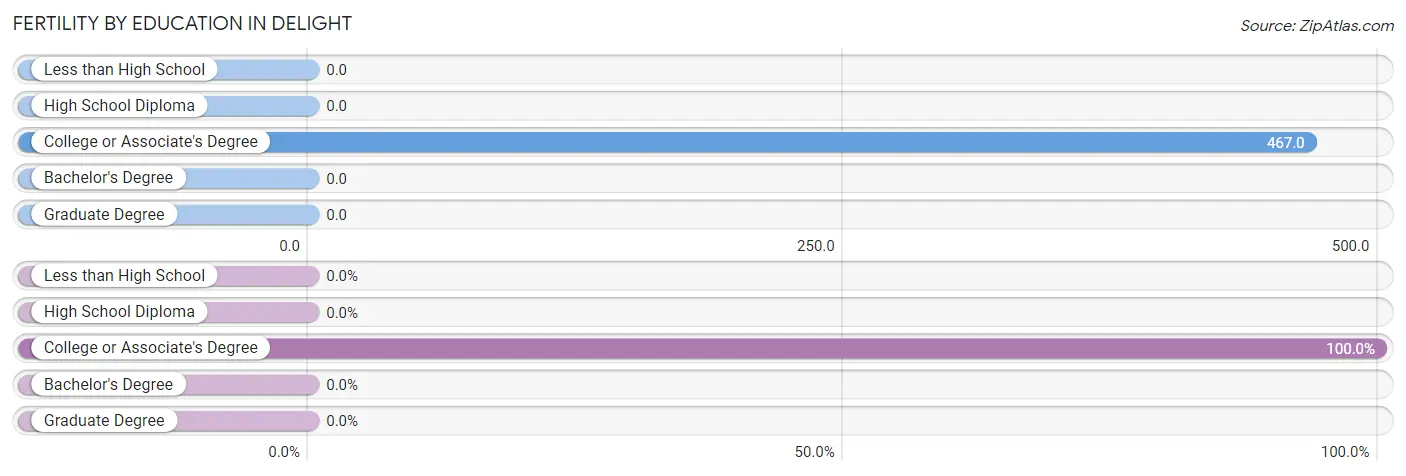
| Educational Attainment | Women with Births | Births / 1,000 Women |
| Less than High School | 0 (0.0%) | 0.0 |
| High School Diploma | 0 (0.0%) | 0.0 |
| College or Associate's Degree | 7 (100.0%) | 467.0 |
| Bachelor's Degree | 0 (0.0%) | 0.0 |
| Graduate Degree | 0 (0.0%) | 0.0 |
| Total | 7 (100.0%) | 152.0 |
Fertility by Education by Marriage Status in Delight
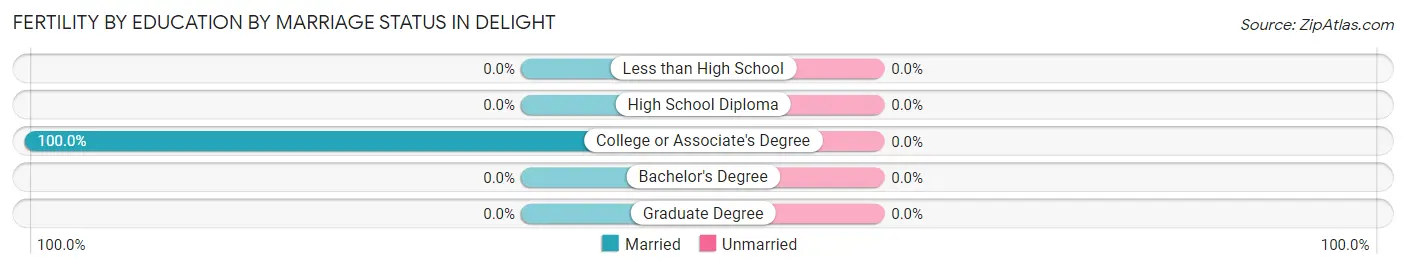
| Educational Attainment | Married | Unmarried |
| Less than High School | 0 (0.0%) | 0 (0.0%) |
| High School Diploma | 0 (0.0%) | 0 (0.0%) |
| College or Associate's Degree | 7 (100.0%) | 0 (0.0%) |
| Bachelor's Degree | 0 (0.0%) | 0 (0.0%) |
| Graduate Degree | 0 (0.0%) | 0 (0.0%) |
| Total | 7 (100.0%) | 0 (0.0%) |
Employment Characteristics in Delight
Employment by Class of Employer in Delight
Among the 77 employed individuals in Delight, private company employees (50 | 64.9%), not-for-profit organizations (8 | 10.4%), and local government employees (7 | 9.1%) make up the most common classes of employment.
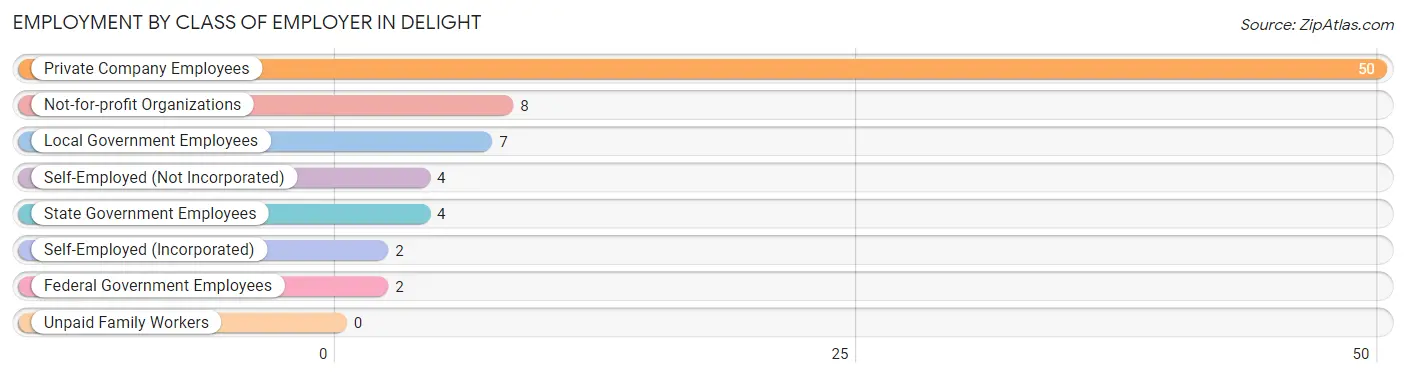
| Employer Class | # Employees | % Employees |
| Private Company Employees | 50 | 64.9% |
| Self-Employed (Incorporated) | 2 | 2.6% |
| Self-Employed (Not Incorporated) | 4 | 5.2% |
| Not-for-profit Organizations | 8 | 10.4% |
| Local Government Employees | 7 | 9.1% |
| State Government Employees | 4 | 5.2% |
| Federal Government Employees | 2 | 2.6% |
| Unpaid Family Workers | 0 | 0.0% |
| Total | 77 | 100.0% |
Employment Status by Age in Delight
According to the labor force statistics for Delight, out of the total population over 16 years of age (210), 44.8% or 94 individuals are in the labor force, with 16.0% or 15 of them unemployed. The age group with the highest labor force participation rate is 30 to 34 years, with 100.0% or 10 individuals in the labor force. Within the labor force, the 30 to 34 years age range has the highest percentage of unemployed individuals, with 60.0% or 6 of them being unemployed.
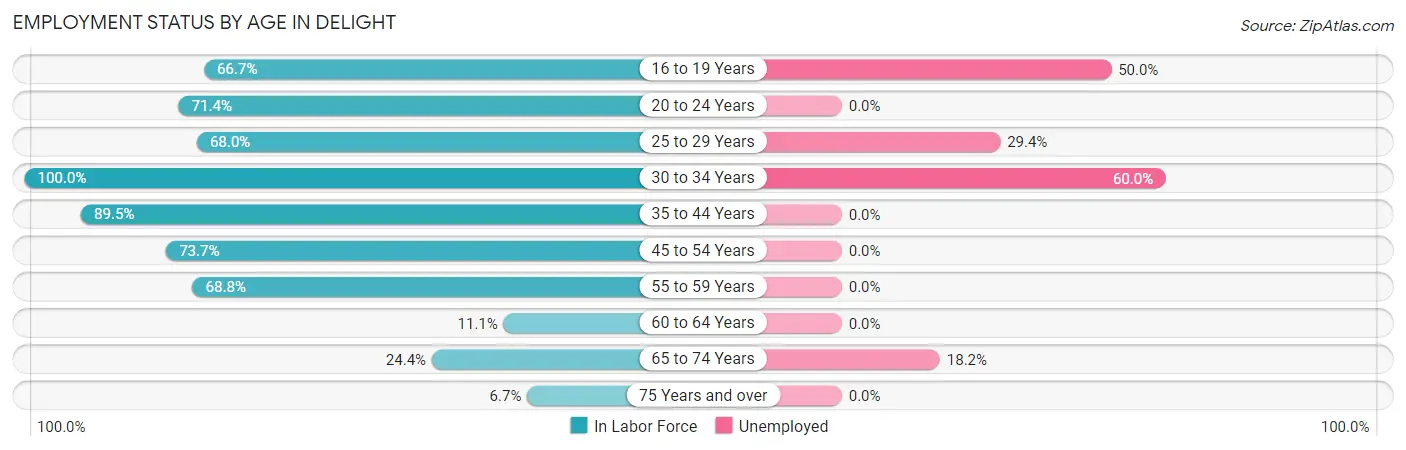
| Age Bracket | In Labor Force | Unemployed |
| 16 to 19 Years | 4 (66.7%) | 2 (50.0%) |
| 20 to 24 Years | 5 (71.4%) | 0 (0.0%) |
| 25 to 29 Years | 17 (68.0%) | 5 (29.4%) |
| 30 to 34 Years | 10 (100.0%) | 6 (60.0%) |
| 35 to 44 Years | 17 (89.5%) | 0 (0.0%) |
| 45 to 54 Years | 14 (73.7%) | 0 (0.0%) |
| 55 to 59 Years | 11 (68.8%) | 0 (0.0%) |
| 60 to 64 Years | 2 (11.1%) | 0 (0.0%) |
| 65 to 74 Years | 11 (24.4%) | 2 (18.2%) |
| 75 Years and over | 3 (6.7%) | 0 (0.0%) |
| Total | 94 (44.8%) | 15 (16.0%) |
Employment Status by Educational Attainment in Delight
According to labor force statistics for Delight, 66.4% of individuals (71) out of the total population between 25 and 64 years of age (107) are in the labor force, with 15.5% or 11 of them being unemployed. The group with the highest labor force participation rate are those with the educational attainment of high school diploma, with 78.0% or 32 individuals in the labor force. Within the labor force, individuals with college / associate degree education have the highest percentage of unemployment, with 21.7% or 5 of them being unemployed.
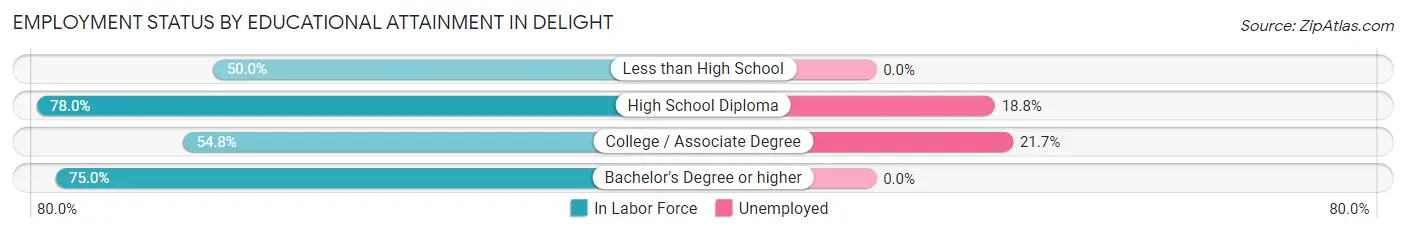
| Educational Attainment | In Labor Force | Unemployed |
| Less than High School | 4 (50.0%) | 0 (0.0%) |
| High School Diploma | 32 (78.0%) | 8 (18.8%) |
| College / Associate Degree | 23 (54.8%) | 9 (21.7%) |
| Bachelor's Degree or higher | 12 (75.0%) | 0 (0.0%) |
| Total | 71 (66.4%) | 17 (15.5%) |
Employment Occupations by Sex in Delight
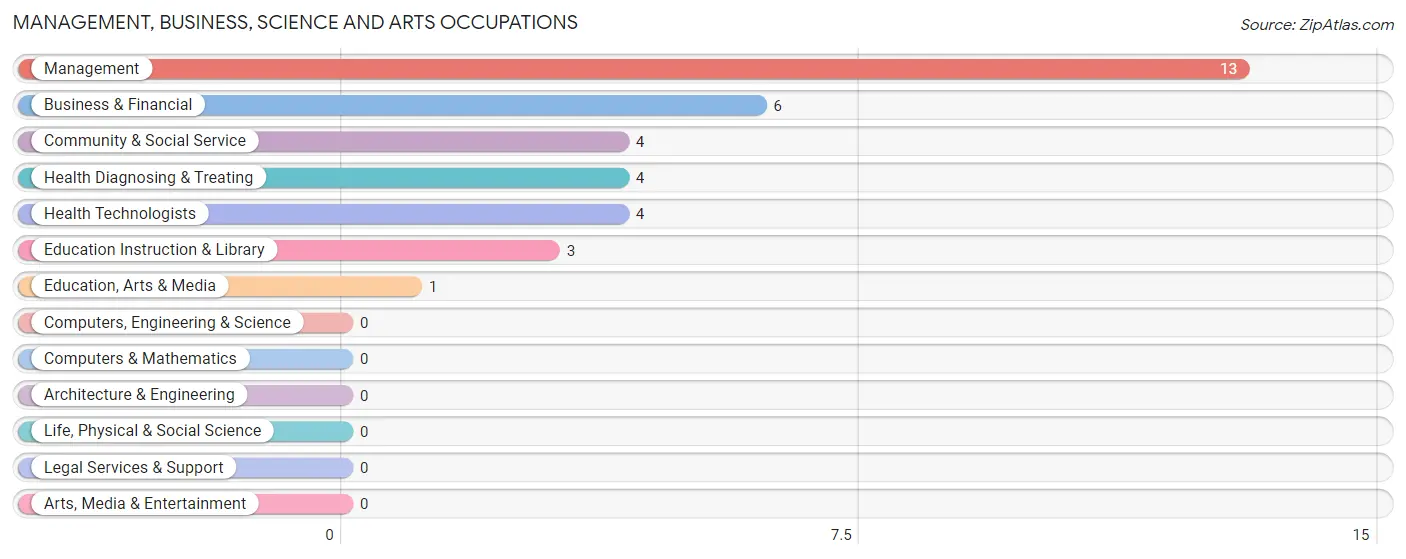
Management, Business, Science and Arts Occupations
The most common Management, Business, Science and Arts occupations in Delight are Management (13 | 16.5%), Business & Financial (6 | 7.6%), Community & Social Service (4 | 5.1%), Health Diagnosing & Treating (4 | 5.1%), and Health Technologists (4 | 5.1%).
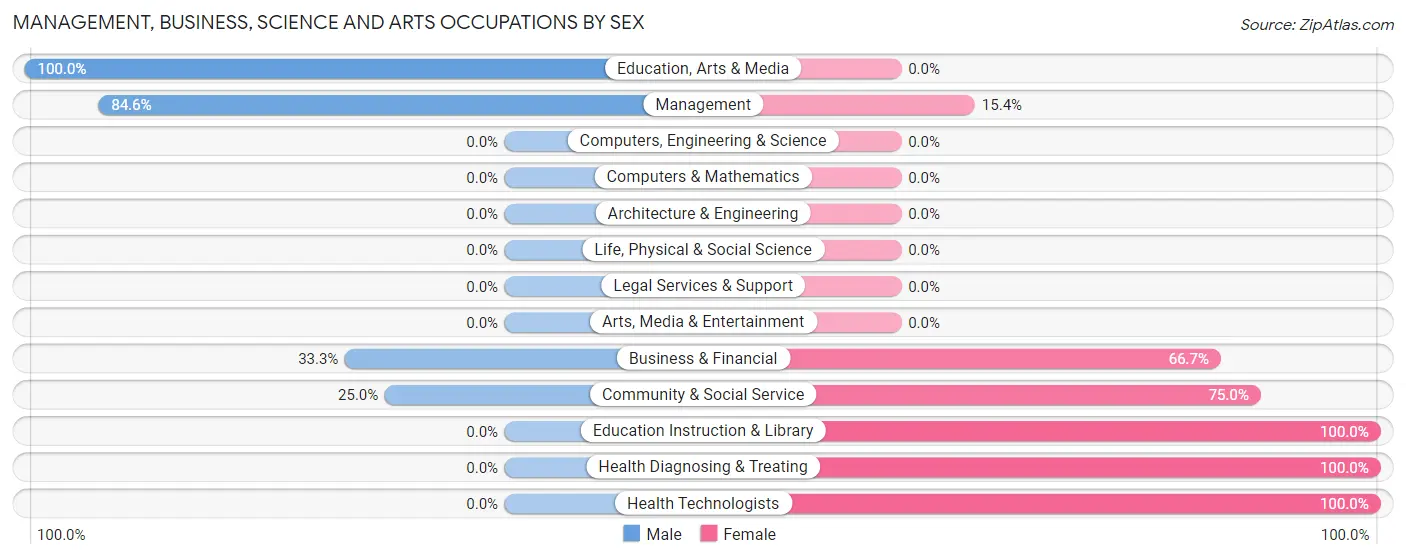
Management, Business, Science and Arts Occupations by Sex
Within the Management, Business, Science and Arts occupations in Delight, the most male-oriented occupations are Education, Arts & Media (100.0%), Management (84.6%), and Business & Financial (33.3%), while the most female-oriented occupations are Education Instruction & Library (100.0%), Health Diagnosing & Treating (100.0%), and Health Technologists (100.0%).
| Occupation | Male | Female |
| Management | 11 (84.6%) | 2 (15.4%) |
| Business & Financial | 2 (33.3%) | 4 (66.7%) |
| Computers, Engineering & Science | 0 (0.0%) | 0 (0.0%) |
| Computers & Mathematics | 0 (0.0%) | 0 (0.0%) |
| Architecture & Engineering | 0 (0.0%) | 0 (0.0%) |
| Life, Physical & Social Science | 0 (0.0%) | 0 (0.0%) |
| Community & Social Service | 1 (25.0%) | 3 (75.0%) |
| Education, Arts & Media | 1 (100.0%) | 0 (0.0%) |
| Legal Services & Support | 0 (0.0%) | 0 (0.0%) |
| Education Instruction & Library | 0 (0.0%) | 3 (100.0%) |
| Arts, Media & Entertainment | 0 (0.0%) | 0 (0.0%) |
| Health Diagnosing & Treating | 0 (0.0%) | 4 (100.0%) |
| Health Technologists | 0 (0.0%) | 4 (100.0%) |
| Total (Category) | 14 (51.8%) | 13 (48.1%) |
| Total (Overall) | 46 (58.2%) | 33 (41.8%) |
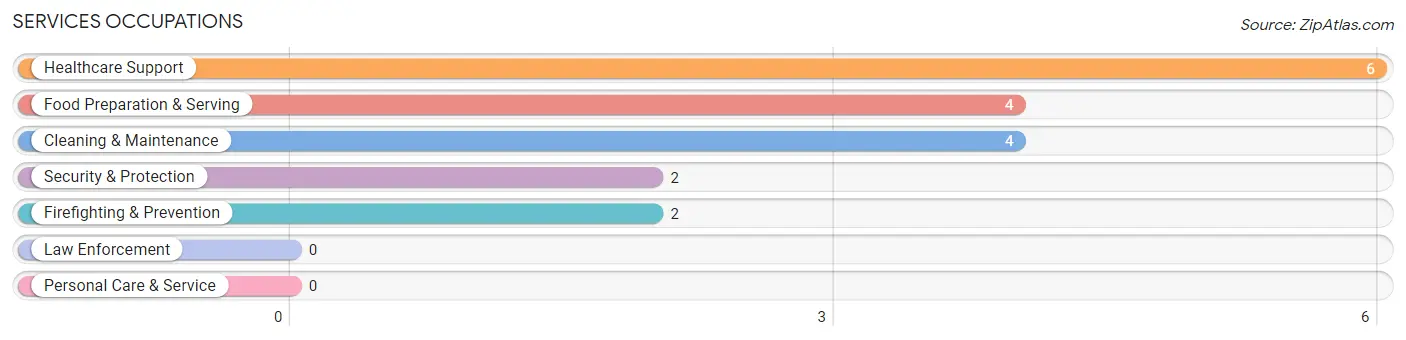
Services Occupations
The most common Services occupations in Delight are Healthcare Support (6 | 7.6%), Food Preparation & Serving (4 | 5.1%), Cleaning & Maintenance (4 | 5.1%), Security & Protection (2 | 2.5%), and Firefighting & Prevention (2 | 2.5%).
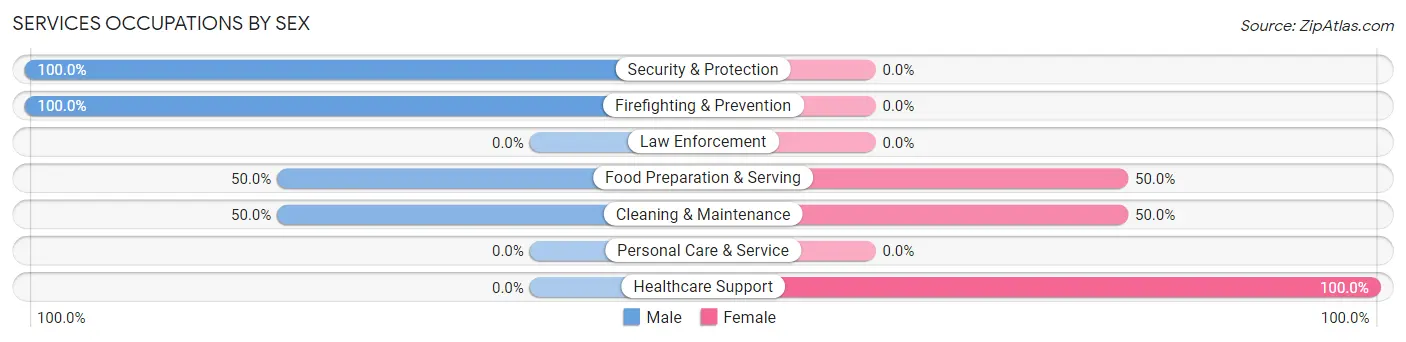
Services Occupations by Sex
Within the Services occupations in Delight, the most male-oriented occupations are Security & Protection (100.0%), Firefighting & Prevention (100.0%), and Food Preparation & Serving (50.0%), while the most female-oriented occupations are Healthcare Support (100.0%), Food Preparation & Serving (50.0%), and Cleaning & Maintenance (50.0%).
| Occupation | Male | Female |
| Healthcare Support | 0 (0.0%) | 6 (100.0%) |
| Security & Protection | 2 (100.0%) | 0 (0.0%) |
| Firefighting & Prevention | 2 (100.0%) | 0 (0.0%) |
| Law Enforcement | 0 (0.0%) | 0 (0.0%) |
| Food Preparation & Serving | 2 (50.0%) | 2 (50.0%) |
| Cleaning & Maintenance | 2 (50.0%) | 2 (50.0%) |
| Personal Care & Service | 0 (0.0%) | 0 (0.0%) |
| Total (Category) | 6 (37.5%) | 10 (62.5%) |
| Total (Overall) | 46 (58.2%) | 33 (41.8%) |
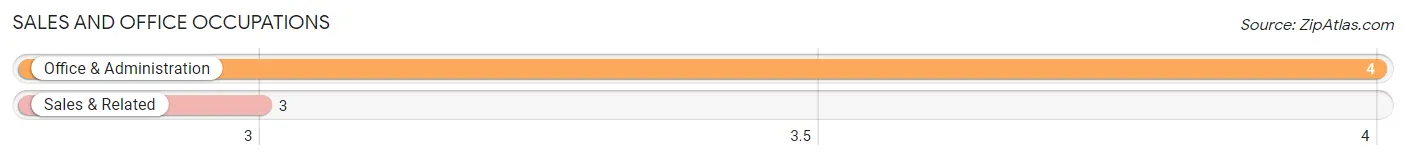
Sales and Office Occupations
The most common Sales and Office occupations in Delight are Office & Administration (4 | 5.1%), and Sales & Related (3 | 3.8%).
Sales and Office Occupations by Sex
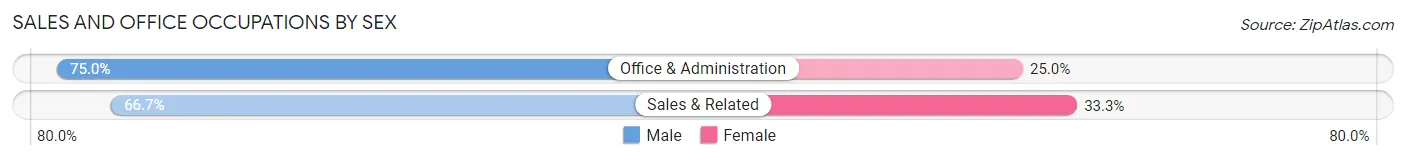
| Occupation | Male | Female |
| Sales & Related | 2 (66.7%) | 1 (33.3%) |
| Office & Administration | 3 (75.0%) | 1 (25.0%) |
| Total (Category) | 5 (71.4%) | 2 (28.6%) |
| Total (Overall) | 46 (58.2%) | 33 (41.8%) |
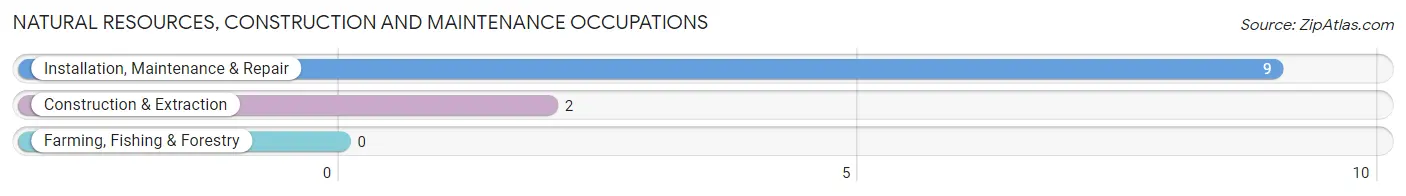
Natural Resources, Construction and Maintenance Occupations
The most common Natural Resources, Construction and Maintenance occupations in Delight are Installation, Maintenance & Repair (9 | 11.4%), and Construction & Extraction (2 | 2.5%).
Natural Resources, Construction and Maintenance Occupations by Sex
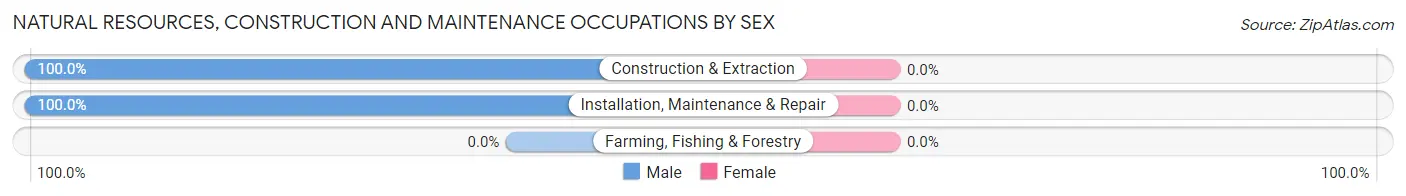
| Occupation | Male | Female |
| Farming, Fishing & Forestry | 0 (0.0%) | 0 (0.0%) |
| Construction & Extraction | 2 (100.0%) | 0 (0.0%) |
| Installation, Maintenance & Repair | 9 (100.0%) | 0 (0.0%) |
| Total (Category) | 11 (100.0%) | 0 (0.0%) |
| Total (Overall) | 46 (58.2%) | 33 (41.8%) |
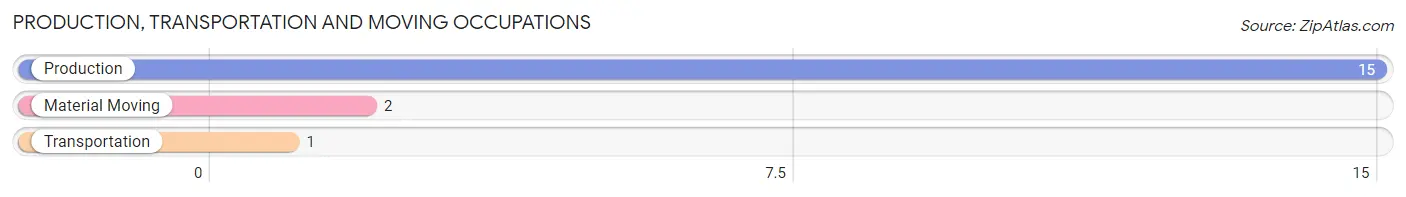
Production, Transportation and Moving Occupations
The most common Production, Transportation and Moving occupations in Delight are Production (15 | 19.0%), Material Moving (2 | 2.5%), and Transportation (1 | 1.3%).
Production, Transportation and Moving Occupations by Sex
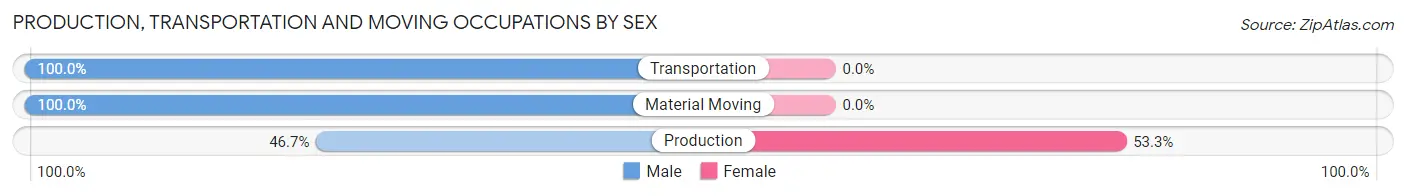
| Occupation | Male | Female |
| Production | 7 (46.7%) | 8 (53.3%) |
| Transportation | 1 (100.0%) | 0 (0.0%) |
| Material Moving | 2 (100.0%) | 0 (0.0%) |
| Total (Category) | 10 (55.6%) | 8 (44.4%) |
| Total (Overall) | 46 (58.2%) | 33 (41.8%) |
Employment Industries by Sex in Delight
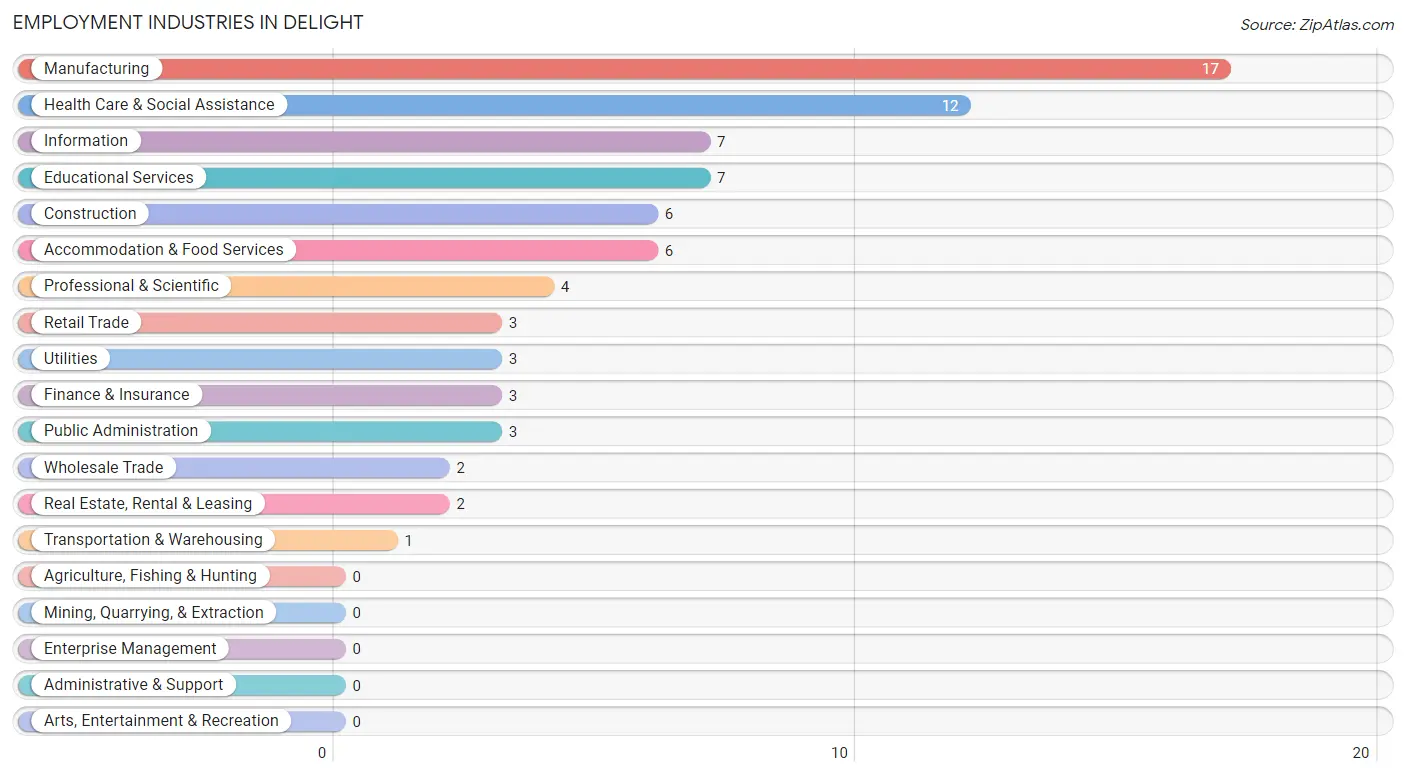
Employment Industries in Delight
The major employment industries in Delight include Manufacturing (17 | 21.5%), Health Care & Social Assistance (12 | 15.2%), Information (7 | 8.9%), Educational Services (7 | 8.9%), and Construction (6 | 7.6%).
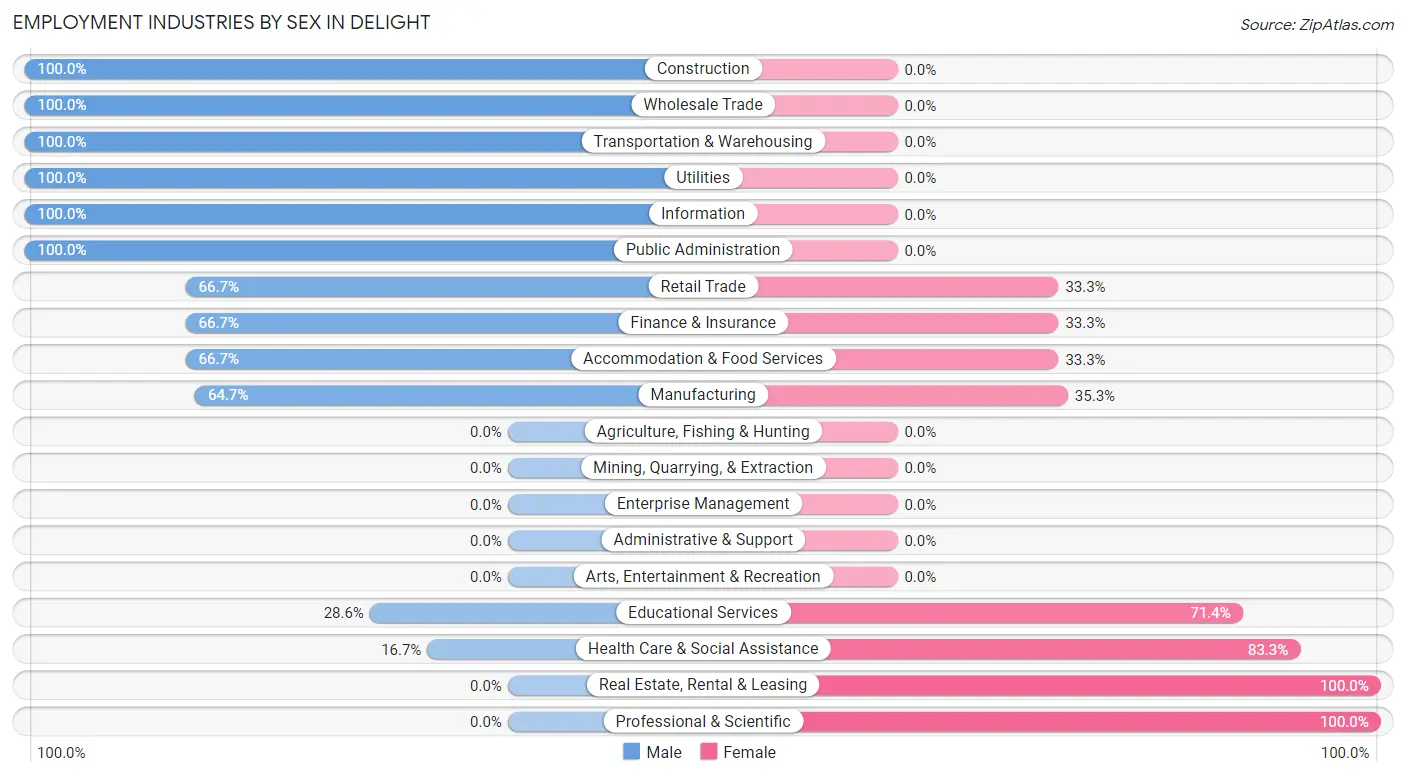
Employment Industries by Sex in Delight
The Delight industries that see more men than women are Construction (100.0%), Wholesale Trade (100.0%), and Transportation & Warehousing (100.0%), whereas the industries that tend to have a higher number of women are Real Estate, Rental & Leasing (100.0%), Professional & Scientific (100.0%), and Health Care & Social Assistance (83.3%).
| Industry | Male | Female |
| Agriculture, Fishing & Hunting | 0 (0.0%) | 0 (0.0%) |
| Mining, Quarrying, & Extraction | 0 (0.0%) | 0 (0.0%) |
| Construction | 6 (100.0%) | 0 (0.0%) |
| Manufacturing | 11 (64.7%) | 6 (35.3%) |
| Wholesale Trade | 2 (100.0%) | 0 (0.0%) |
| Retail Trade | 2 (66.7%) | 1 (33.3%) |
| Transportation & Warehousing | 1 (100.0%) | 0 (0.0%) |
| Utilities | 3 (100.0%) | 0 (0.0%) |
| Information | 7 (100.0%) | 0 (0.0%) |
| Finance & Insurance | 2 (66.7%) | 1 (33.3%) |
| Real Estate, Rental & Leasing | 0 (0.0%) | 2 (100.0%) |
| Professional & Scientific | 0 (0.0%) | 4 (100.0%) |
| Enterprise Management | 0 (0.0%) | 0 (0.0%) |
| Administrative & Support | 0 (0.0%) | 0 (0.0%) |
| Educational Services | 2 (28.6%) | 5 (71.4%) |
| Health Care & Social Assistance | 2 (16.7%) | 10 (83.3%) |
| Arts, Entertainment & Recreation | 0 (0.0%) | 0 (0.0%) |
| Accommodation & Food Services | 4 (66.7%) | 2 (33.3%) |
| Public Administration | 3 (100.0%) | 0 (0.0%) |
| Total | 46 (58.2%) | 33 (41.8%) |
Education in Delight
School Enrollment in Delight
The most common levels of schooling among the 49 students in Delight are elementary school (17 | 34.7%), middle school (17 | 34.7%), and high school (9 | 18.4%).
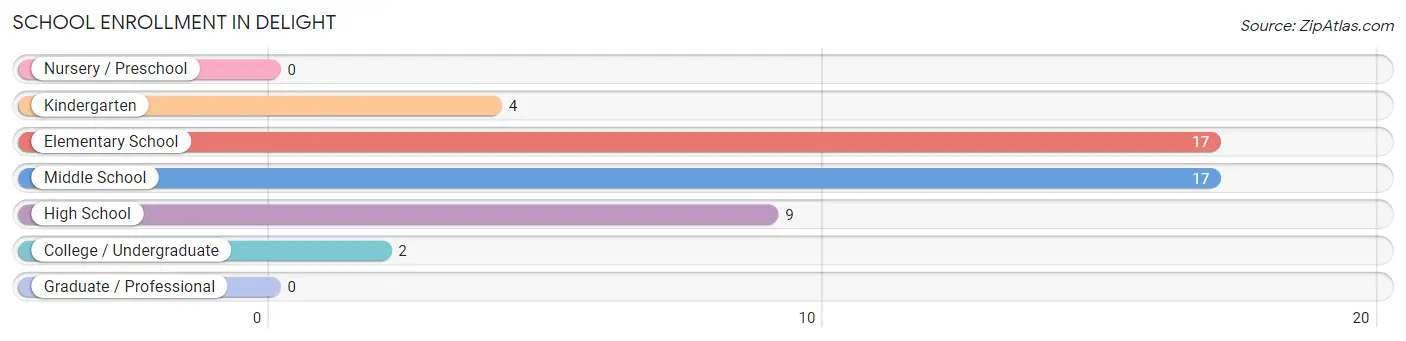
| School Level | # Students | % Students |
| Nursery / Preschool | 0 | 0.0% |
| Kindergarten | 4 | 8.2% |
| Elementary School | 17 | 34.7% |
| Middle School | 17 | 34.7% |
| High School | 9 | 18.4% |
| College / Undergraduate | 2 | 4.1% |
| Graduate / Professional | 0 | 0.0% |
| Total | 49 | 100.0% |
School Enrollment by Age by Funding Source in Delight
Out of a total of 49 students who are enrolled in schools in Delight, 4 (8.2%) attend a private institution, while the remaining 45 (91.8%) are enrolled in public schools. The age group of 25 to 34 year olds has the highest likelihood of being enrolled in private schools, with 1 (100.0% in the age bracket) enrolled. Conversely, the age group of 5 to 9 year old has the lowest likelihood of being enrolled in a private school, with 12 (100.0% in the age bracket) attending a public institution.
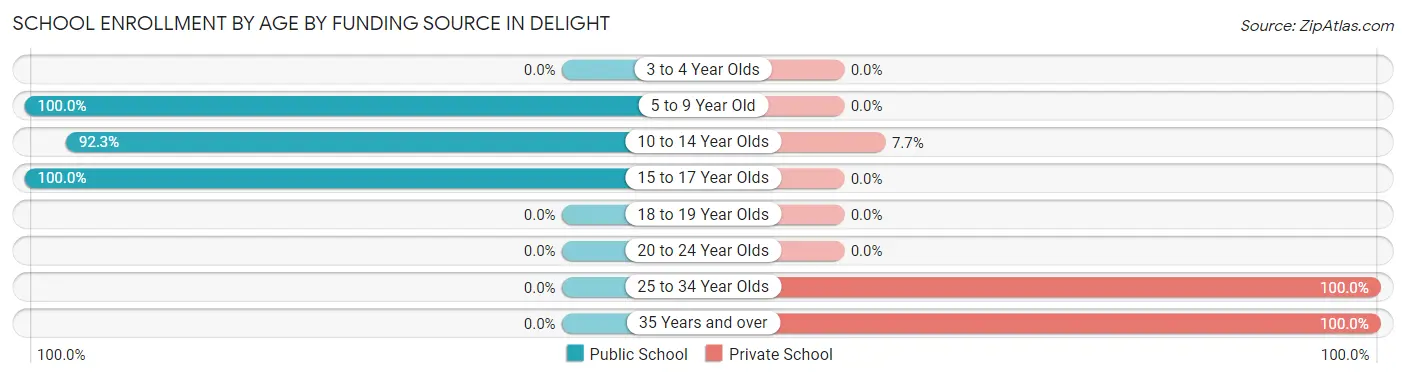
| Age Bracket | Public School | Private School |
| 3 to 4 Year Olds | 0 (0.0%) | 0 (0.0%) |
| 5 to 9 Year Old | 12 (100.0%) | 0 (0.0%) |
| 10 to 14 Year Olds | 24 (92.3%) | 2 (7.7%) |
| 15 to 17 Year Olds | 9 (100.0%) | 0 (0.0%) |
| 18 to 19 Year Olds | 0 (0.0%) | 0 (0.0%) |
| 20 to 24 Year Olds | 0 (0.0%) | 0 (0.0%) |
| 25 to 34 Year Olds | 0 (0.0%) | 1 (100.0%) |
| 35 Years and over | 0 (0.0%) | 1 (100.0%) |
| Total | 45 (91.8%) | 4 (8.2%) |
Educational Attainment by Field of Study in Delight
Business (8 | 32.0%), education (8 | 32.0%), communications (3 | 12.0%), bio, nature & agricultural (2 | 8.0%), and visual & performing arts (2 | 8.0%) are the most common fields of study among 25 individuals in Delight who have obtained a bachelor's degree or higher.
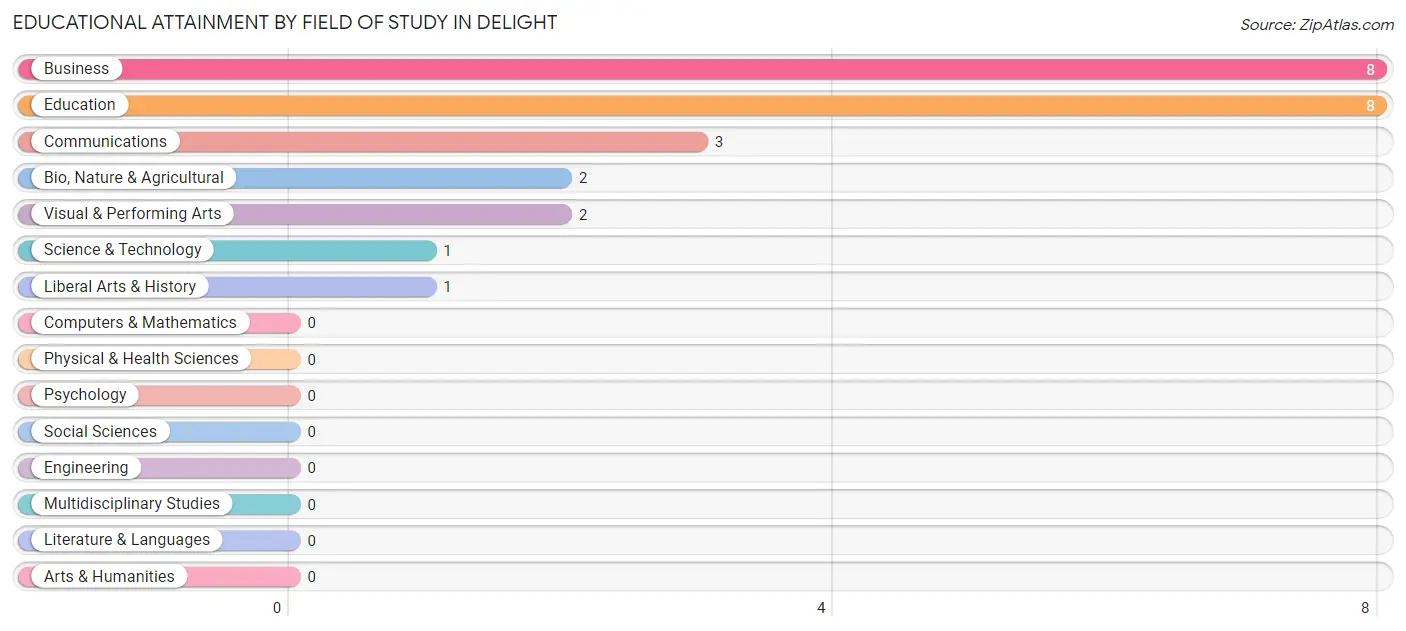
| Field of Study | # Graduates | % Graduates |
| Computers & Mathematics | 0 | 0.0% |
| Bio, Nature & Agricultural | 2 | 8.0% |
| Physical & Health Sciences | 0 | 0.0% |
| Psychology | 0 | 0.0% |
| Social Sciences | 0 | 0.0% |
| Engineering | 0 | 0.0% |
| Multidisciplinary Studies | 0 | 0.0% |
| Science & Technology | 1 | 4.0% |
| Business | 8 | 32.0% |
| Education | 8 | 32.0% |
| Literature & Languages | 0 | 0.0% |
| Liberal Arts & History | 1 | 4.0% |
| Visual & Performing Arts | 2 | 8.0% |
| Communications | 3 | 12.0% |
| Arts & Humanities | 0 | 0.0% |
| Total | 25 | 100.0% |
Transportation & Commute in Delight
Vehicle Availability by Sex in Delight
The most prevalent vehicle ownership categories in Delight are males with 2 vehicles (17, accounting for 37.0%) and females with 2 vehicles (18, making up 54.8%).
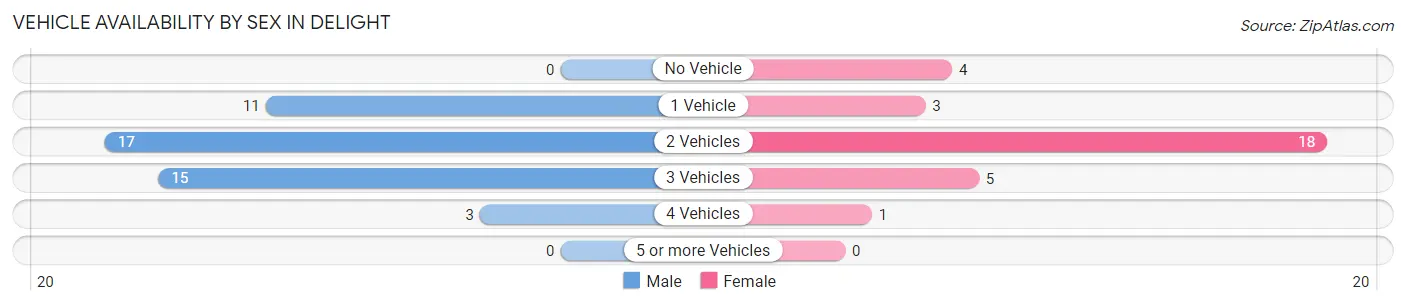
| Vehicles Available | Male | Female |
| No Vehicle | 0 (0.0%) | 4 (12.9%) |
| 1 Vehicle | 11 (23.9%) | 3 (9.7%) |
| 2 Vehicles | 17 (37.0%) | 18 (58.1%) |
| 3 Vehicles | 15 (32.6%) | 5 (16.1%) |
| 4 Vehicles | 3 (6.5%) | 1 (3.2%) |
| 5 or more Vehicles | 0 (0.0%) | 0 (0.0%) |
| Total | 46 (100.0%) | 31 (100.0%) |
Commute Time in Delight
The most frequently occuring commute durations in Delight are less than 5 minutes (12 commuters, 15.8%), 30 to 34 minutes (11 commuters, 14.5%), and 5 to 9 minutes (10 commuters, 13.2%).
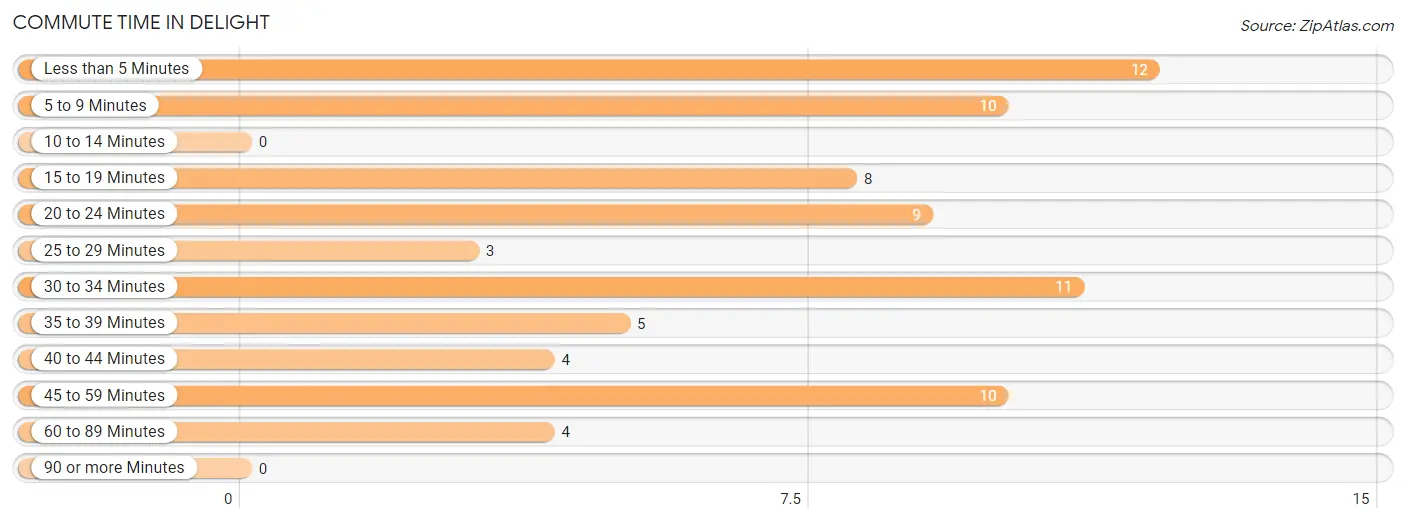
| Commute Time | # Commuters | % Commuters |
| Less than 5 Minutes | 12 | 15.8% |
| 5 to 9 Minutes | 10 | 13.2% |
| 10 to 14 Minutes | 0 | 0.0% |
| 15 to 19 Minutes | 8 | 10.5% |
| 20 to 24 Minutes | 9 | 11.8% |
| 25 to 29 Minutes | 3 | 4.0% |
| 30 to 34 Minutes | 11 | 14.5% |
| 35 to 39 Minutes | 5 | 6.6% |
| 40 to 44 Minutes | 4 | 5.3% |
| 45 to 59 Minutes | 10 | 13.2% |
| 60 to 89 Minutes | 4 | 5.3% |
| 90 or more Minutes | 0 | 0.0% |
Commute Time by Sex in Delight
The most common commute times in Delight are 15 to 19 minutes (8 commuters, 17.4%) for males and 5 to 9 minutes (8 commuters, 26.7%) for females.
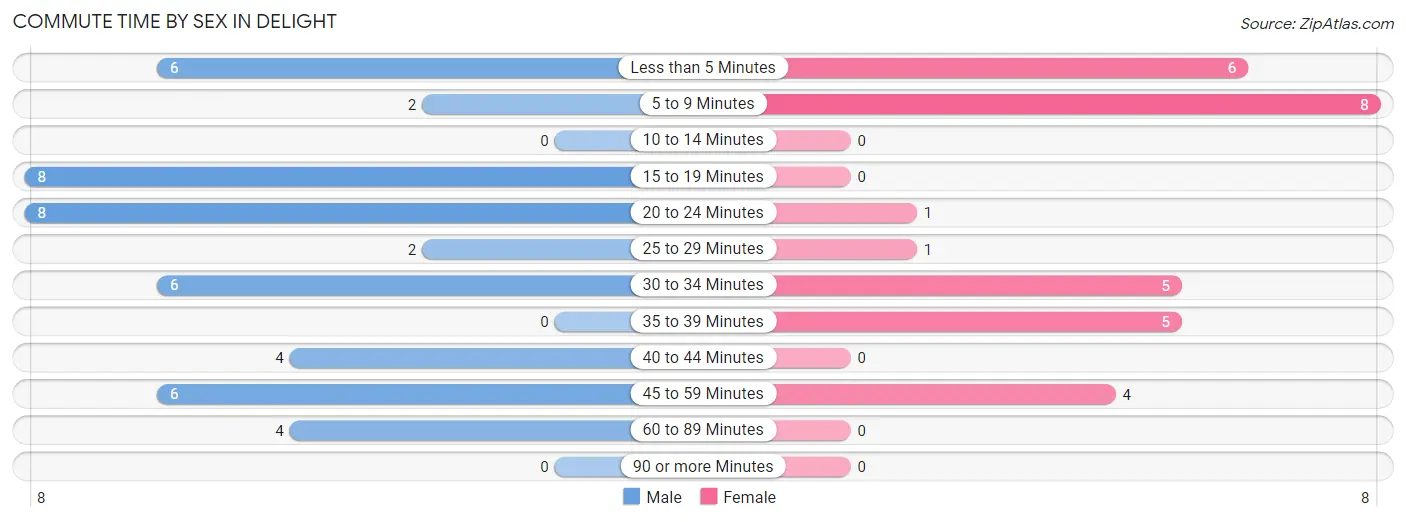
| Commute Time | Male | Female |
| Less than 5 Minutes | 6 (13.0%) | 6 (20.0%) |
| 5 to 9 Minutes | 2 (4.3%) | 8 (26.7%) |
| 10 to 14 Minutes | 0 (0.0%) | 0 (0.0%) |
| 15 to 19 Minutes | 8 (17.4%) | 0 (0.0%) |
| 20 to 24 Minutes | 8 (17.4%) | 1 (3.3%) |
| 25 to 29 Minutes | 2 (4.3%) | 1 (3.3%) |
| 30 to 34 Minutes | 6 (13.0%) | 5 (16.7%) |
| 35 to 39 Minutes | 0 (0.0%) | 5 (16.7%) |
| 40 to 44 Minutes | 4 (8.7%) | 0 (0.0%) |
| 45 to 59 Minutes | 6 (13.0%) | 4 (13.3%) |
| 60 to 89 Minutes | 4 (8.7%) | 0 (0.0%) |
| 90 or more Minutes | 0 (0.0%) | 0 (0.0%) |
Time of Departure to Work by Sex in Delight
The most frequent times of departure to work in Delight are 6:30 AM to 6:59 AM (12, 26.1%) for males and 8:00 AM to 8:29 AM (10, 33.3%) for females.
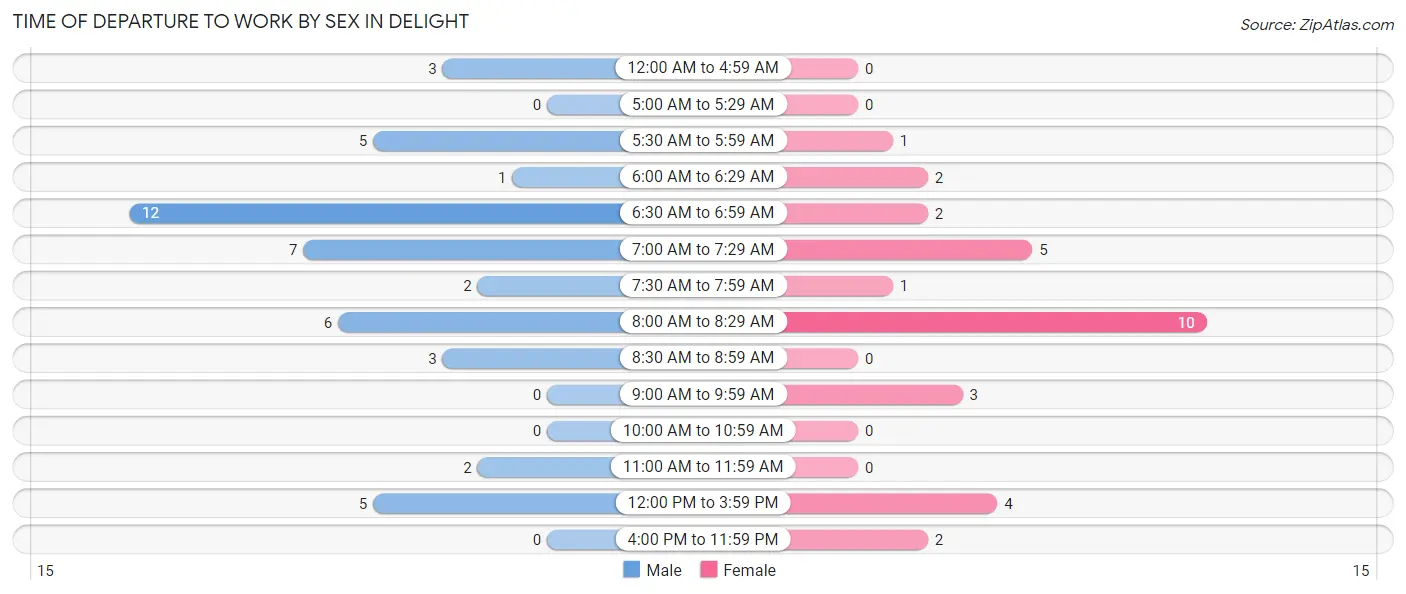
| Time of Departure | Male | Female |
| 12:00 AM to 4:59 AM | 3 (6.5%) | 0 (0.0%) |
| 5:00 AM to 5:29 AM | 0 (0.0%) | 0 (0.0%) |
| 5:30 AM to 5:59 AM | 5 (10.9%) | 1 (3.3%) |
| 6:00 AM to 6:29 AM | 1 (2.2%) | 2 (6.7%) |
| 6:30 AM to 6:59 AM | 12 (26.1%) | 2 (6.7%) |
| 7:00 AM to 7:29 AM | 7 (15.2%) | 5 (16.7%) |
| 7:30 AM to 7:59 AM | 2 (4.3%) | 1 (3.3%) |
| 8:00 AM to 8:29 AM | 6 (13.0%) | 10 (33.3%) |
| 8:30 AM to 8:59 AM | 3 (6.5%) | 0 (0.0%) |
| 9:00 AM to 9:59 AM | 0 (0.0%) | 3 (10.0%) |
| 10:00 AM to 10:59 AM | 0 (0.0%) | 0 (0.0%) |
| 11:00 AM to 11:59 AM | 2 (4.3%) | 0 (0.0%) |
| 12:00 PM to 3:59 PM | 5 (10.9%) | 4 (13.3%) |
| 4:00 PM to 11:59 PM | 0 (0.0%) | 2 (6.7%) |
| Total | 46 (100.0%) | 30 (100.0%) |
Housing Occupancy in Delight
Occupancy by Ownership in Delight
Of the total 136 dwellings in Delight, owner-occupied units account for 100 (73.5%), while renter-occupied units make up 36 (26.5%).
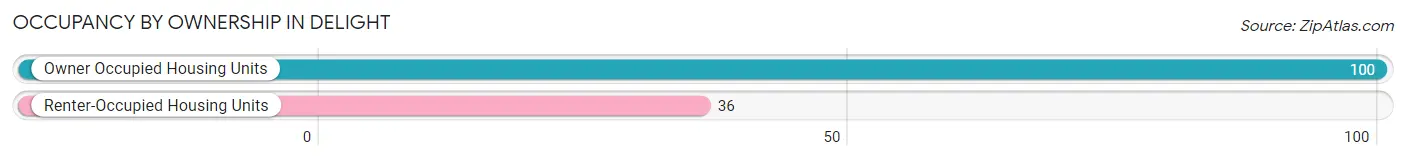
| Occupancy | # Housing Units | % Housing Units |
| Owner Occupied Housing Units | 100 | 73.5% |
| Renter-Occupied Housing Units | 36 | 26.5% |
| Total Occupied Housing Units | 136 | 100.0% |
Occupancy by Household Size in Delight
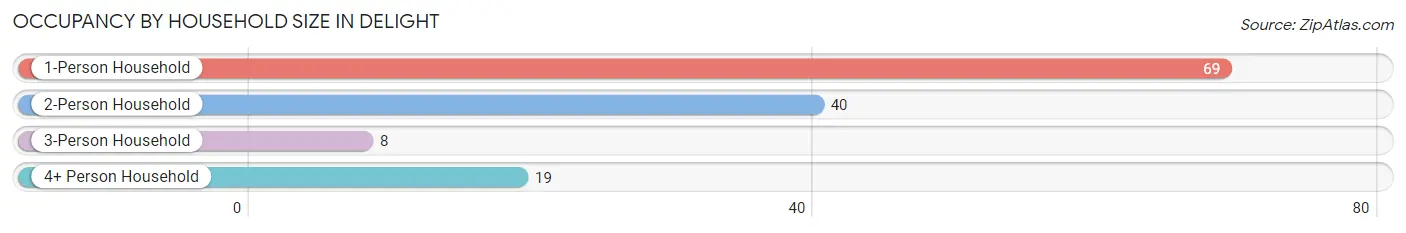
| Household Size | # Housing Units | % Housing Units |
| 1-Person Household | 69 | 50.7% |
| 2-Person Household | 40 | 29.4% |
| 3-Person Household | 8 | 5.9% |
| 4+ Person Household | 19 | 14.0% |
| Total Housing Units | 136 | 100.0% |
Occupancy by Ownership by Household Size in Delight
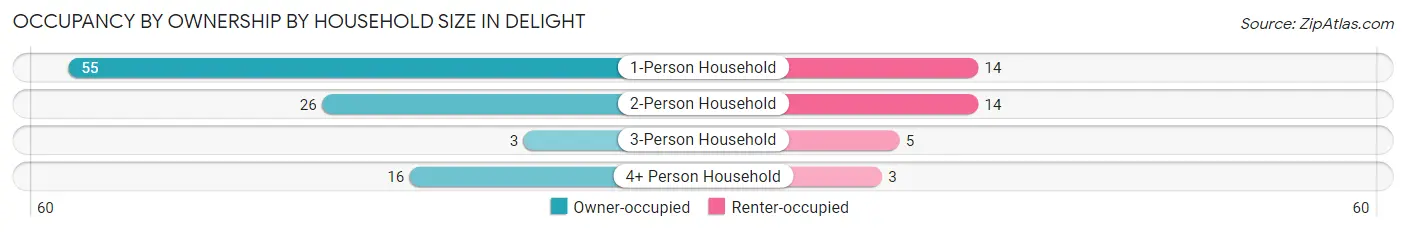
| Household Size | Owner-occupied | Renter-occupied |
| 1-Person Household | 55 (79.7%) | 14 (20.3%) |
| 2-Person Household | 26 (65.0%) | 14 (35.0%) |
| 3-Person Household | 3 (37.5%) | 5 (62.5%) |
| 4+ Person Household | 16 (84.2%) | 3 (15.8%) |
| Total Housing Units | 100 (73.5%) | 36 (26.5%) |
Occupancy by Educational Attainment in Delight
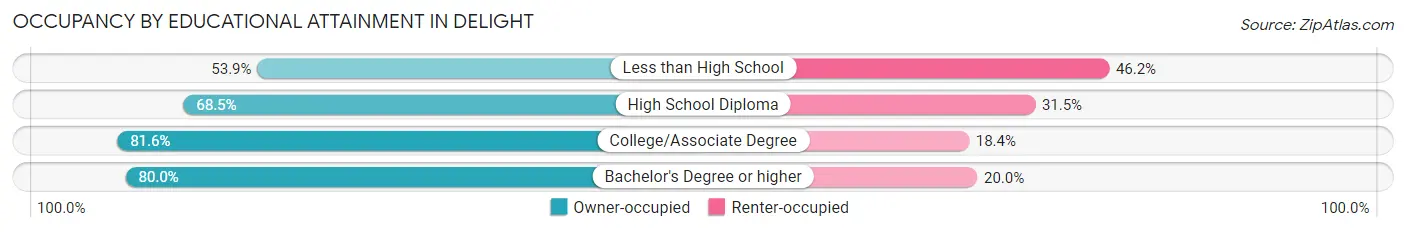
| Household Size | Owner-occupied | Renter-occupied |
| Less than High School | 7 (53.8%) | 6 (46.2%) |
| High School Diploma | 37 (68.5%) | 17 (31.5%) |
| College/Associate Degree | 40 (81.6%) | 9 (18.4%) |
| Bachelor's Degree or higher | 16 (80.0%) | 4 (20.0%) |
Occupancy by Age of Householder in Delight
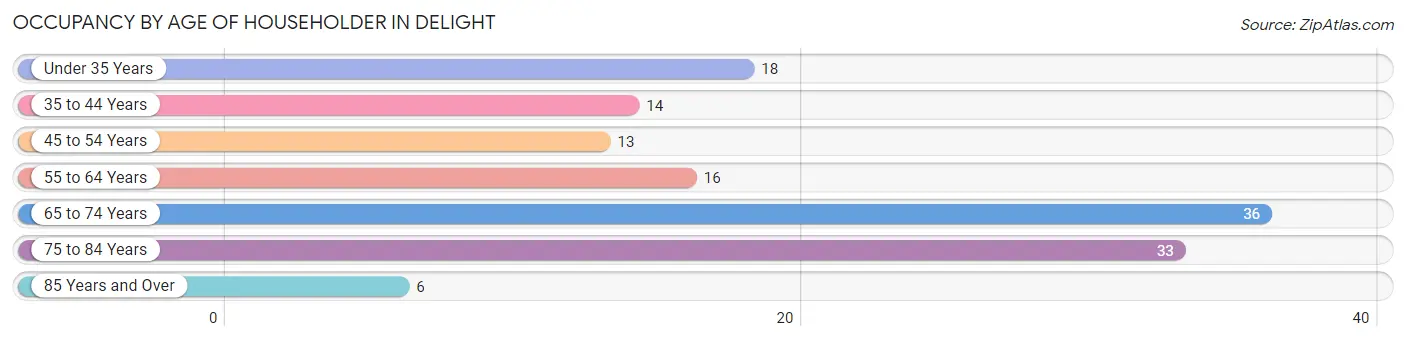
| Age Bracket | # Households | % Households |
| Under 35 Years | 18 | 13.2% |
| 35 to 44 Years | 14 | 10.3% |
| 45 to 54 Years | 13 | 9.6% |
| 55 to 64 Years | 16 | 11.8% |
| 65 to 74 Years | 36 | 26.5% |
| 75 to 84 Years | 33 | 24.3% |
| 85 Years and Over | 6 | 4.4% |
| Total | 136 | 100.0% |
Housing Finances in Delight
Median Income by Occupancy in Delight
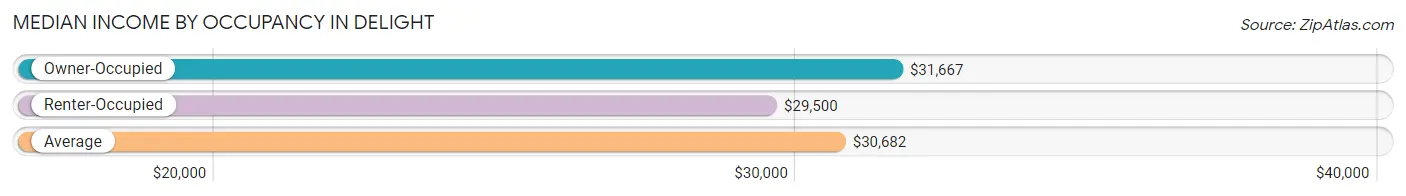
| Occupancy Type | # Households | Median Income |
| Owner-Occupied | 100 (73.5%) | $31,667 |
| Renter-Occupied | 36 (26.5%) | $29,500 |
| Average | 136 (100.0%) | $30,682 |
Occupancy by Householder Income Bracket in Delight
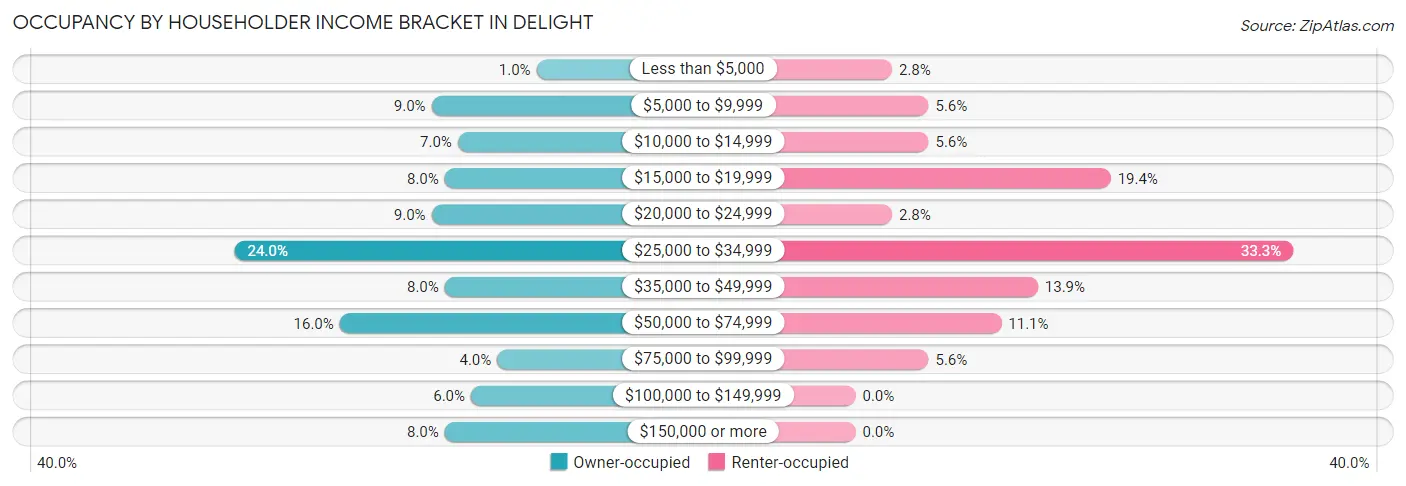
| Income Bracket | Owner-occupied | Renter-occupied |
| Less than $5,000 | 1 (1.0%) | 1 (2.8%) |
| $5,000 to $9,999 | 9 (9.0%) | 2 (5.6%) |
| $10,000 to $14,999 | 7 (7.0%) | 2 (5.6%) |
| $15,000 to $19,999 | 8 (8.0%) | 7 (19.4%) |
| $20,000 to $24,999 | 9 (9.0%) | 1 (2.8%) |
| $25,000 to $34,999 | 24 (24.0%) | 12 (33.3%) |
| $35,000 to $49,999 | 8 (8.0%) | 5 (13.9%) |
| $50,000 to $74,999 | 16 (16.0%) | 4 (11.1%) |
| $75,000 to $99,999 | 4 (4.0%) | 2 (5.6%) |
| $100,000 to $149,999 | 6 (6.0%) | 0 (0.0%) |
| $150,000 or more | 8 (8.0%) | 0 (0.0%) |
| Total | 100 (100.0%) | 36 (100.0%) |
Monthly Housing Cost Tiers in Delight
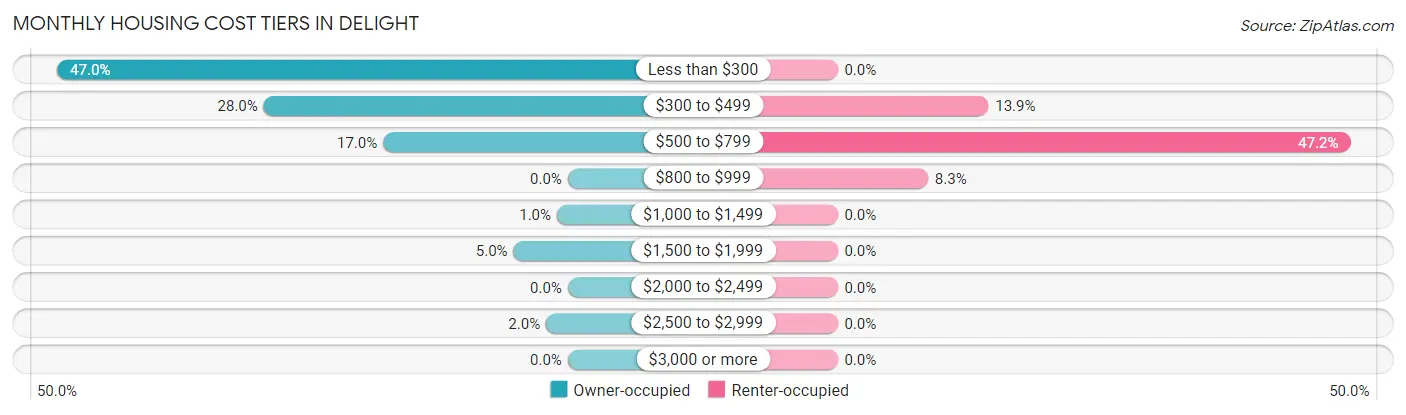
| Monthly Cost | Owner-occupied | Renter-occupied |
| Less than $300 | 47 (47.0%) | 0 (0.0%) |
| $300 to $499 | 28 (28.0%) | 5 (13.9%) |
| $500 to $799 | 17 (17.0%) | 17 (47.2%) |
| $800 to $999 | 0 (0.0%) | 3 (8.3%) |
| $1,000 to $1,499 | 1 (1.0%) | 0 (0.0%) |
| $1,500 to $1,999 | 5 (5.0%) | 0 (0.0%) |
| $2,000 to $2,499 | 0 (0.0%) | 0 (0.0%) |
| $2,500 to $2,999 | 2 (2.0%) | 0 (0.0%) |
| $3,000 or more | 0 (0.0%) | 0 (0.0%) |
| Total | 100 (100.0%) | 36 (100.0%) |
Physical Housing Characteristics in Delight
Housing Structures in Delight
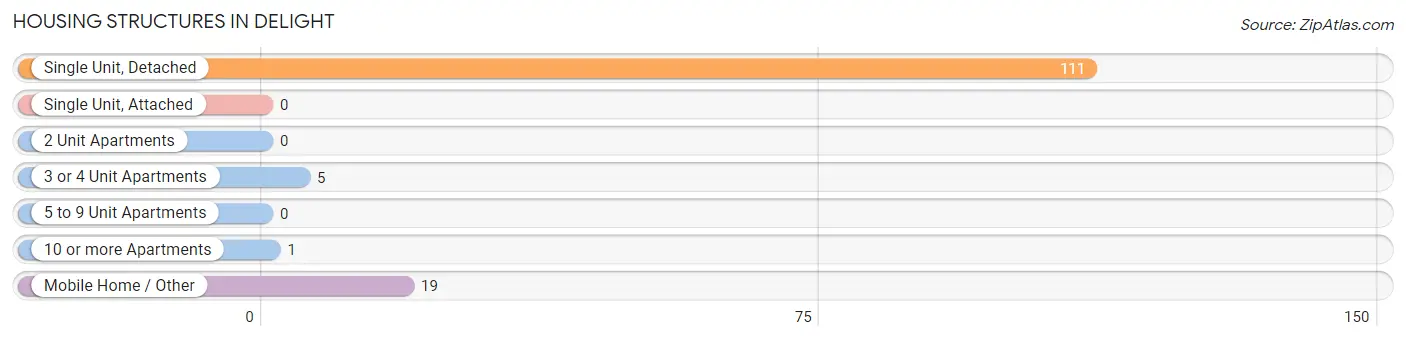
| Structure Type | # Housing Units | % Housing Units |
| Single Unit, Detached | 111 | 81.6% |
| Single Unit, Attached | 0 | 0.0% |
| 2 Unit Apartments | 0 | 0.0% |
| 3 or 4 Unit Apartments | 5 | 3.7% |
| 5 to 9 Unit Apartments | 0 | 0.0% |
| 10 or more Apartments | 1 | 0.7% |
| Mobile Home / Other | 19 | 14.0% |
| Total | 136 | 100.0% |
Housing Structures by Occupancy in Delight
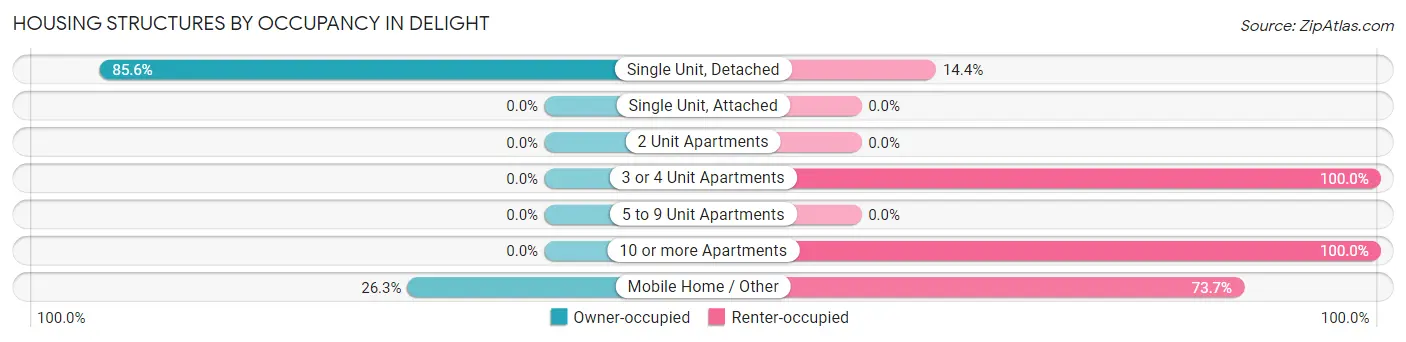
| Structure Type | Owner-occupied | Renter-occupied |
| Single Unit, Detached | 95 (85.6%) | 16 (14.4%) |
| Single Unit, Attached | 0 (0.0%) | 0 (0.0%) |
| 2 Unit Apartments | 0 (0.0%) | 0 (0.0%) |
| 3 or 4 Unit Apartments | 0 (0.0%) | 5 (100.0%) |
| 5 to 9 Unit Apartments | 0 (0.0%) | 0 (0.0%) |
| 10 or more Apartments | 0 (0.0%) | 1 (100.0%) |
| Mobile Home / Other | 5 (26.3%) | 14 (73.7%) |
| Total | 100 (73.5%) | 36 (26.5%) |
Housing Structures by Number of Rooms in Delight
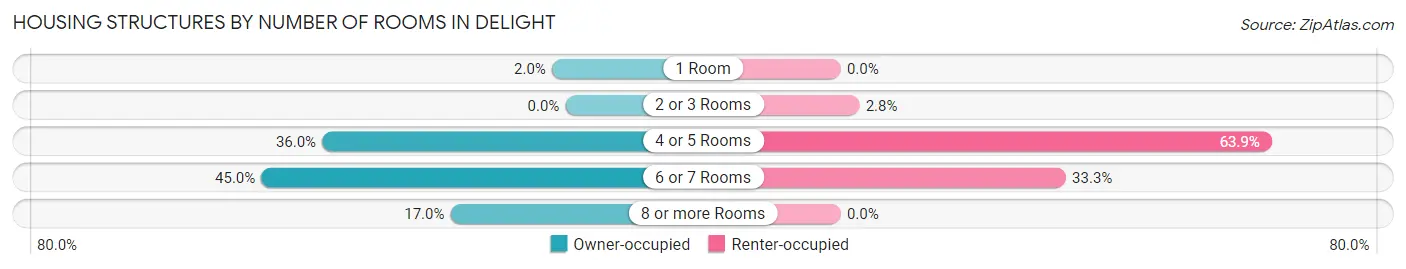
| Number of Rooms | Owner-occupied | Renter-occupied |
| 1 Room | 2 (2.0%) | 0 (0.0%) |
| 2 or 3 Rooms | 0 (0.0%) | 1 (2.8%) |
| 4 or 5 Rooms | 36 (36.0%) | 23 (63.9%) |
| 6 or 7 Rooms | 45 (45.0%) | 12 (33.3%) |
| 8 or more Rooms | 17 (17.0%) | 0 (0.0%) |
| Total | 100 (100.0%) | 36 (100.0%) |
Housing Structure by Heating Type in Delight
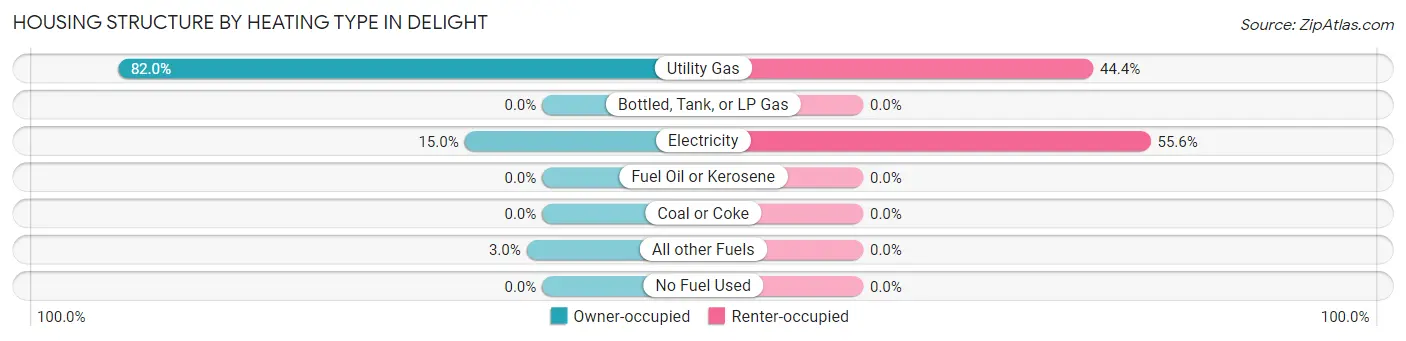
| Heating Type | Owner-occupied | Renter-occupied |
| Utility Gas | 82 (82.0%) | 16 (44.4%) |
| Bottled, Tank, or LP Gas | 0 (0.0%) | 0 (0.0%) |
| Electricity | 15 (15.0%) | 20 (55.6%) |
| Fuel Oil or Kerosene | 0 (0.0%) | 0 (0.0%) |
| Coal or Coke | 0 (0.0%) | 0 (0.0%) |
| All other Fuels | 3 (3.0%) | 0 (0.0%) |
| No Fuel Used | 0 (0.0%) | 0 (0.0%) |
| Total | 100 (100.0%) | 36 (100.0%) |
Household Vehicle Usage in Delight
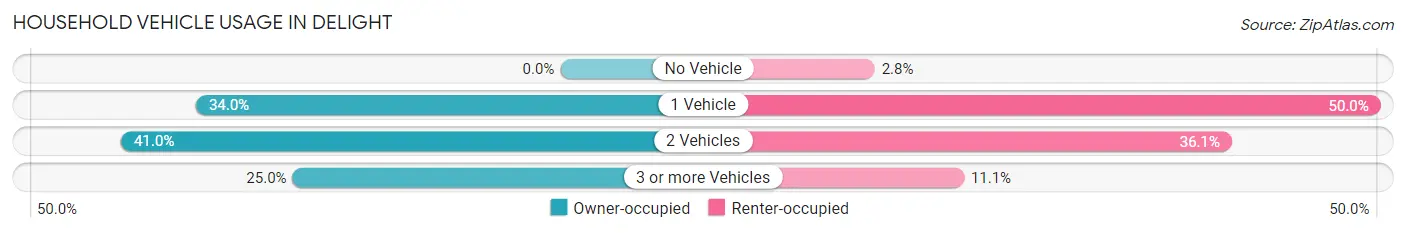
| Vehicles per Household | Owner-occupied | Renter-occupied |
| No Vehicle | 0 (0.0%) | 1 (2.8%) |
| 1 Vehicle | 34 (34.0%) | 18 (50.0%) |
| 2 Vehicles | 41 (41.0%) | 13 (36.1%) |
| 3 or more Vehicles | 25 (25.0%) | 4 (11.1%) |
| Total | 100 (100.0%) | 36 (100.0%) |
Real Estate & Mortgages in Delight
Real Estate and Mortgage Overview in Delight
| Characteristic | Without Mortgage | With Mortgage |
| Housing Units | 79 | 21 |
| Median Property Value | $55,000 | $0 |
| Median Household Income | $26,375 | $2 |
| Monthly Housing Costs | $244 | $0 |
| Real Estate Taxes | $199 | $0 |
Property Value by Mortgage Status in Delight
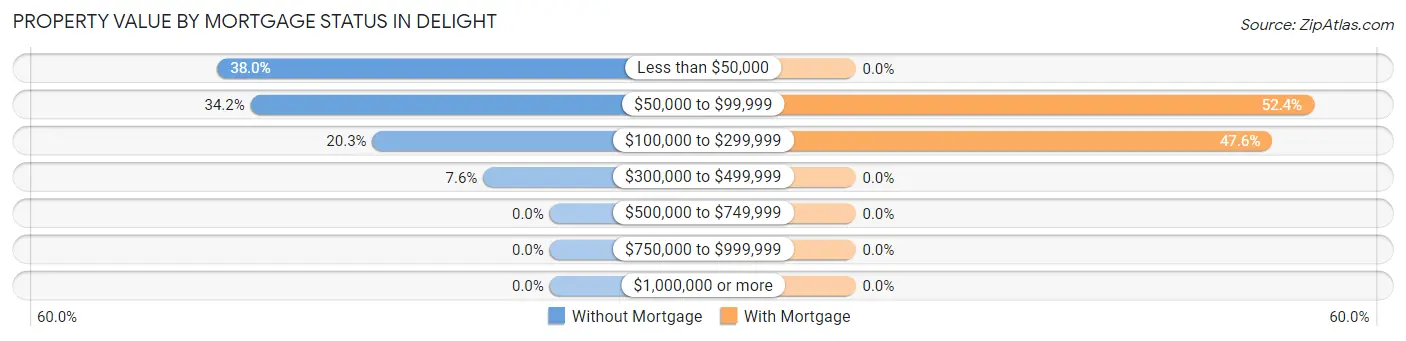
| Property Value | Without Mortgage | With Mortgage |
| Less than $50,000 | 30 (38.0%) | 0 (0.0%) |
| $50,000 to $99,999 | 27 (34.2%) | 11 (52.4%) |
| $100,000 to $299,999 | 16 (20.3%) | 10 (47.6%) |
| $300,000 to $499,999 | 6 (7.6%) | 0 (0.0%) |
| $500,000 to $749,999 | 0 (0.0%) | 0 (0.0%) |
| $750,000 to $999,999 | 0 (0.0%) | 0 (0.0%) |
| $1,000,000 or more | 0 (0.0%) | 0 (0.0%) |
| Total | 79 (100.0%) | 21 (100.0%) |
Household Income by Mortgage Status in Delight
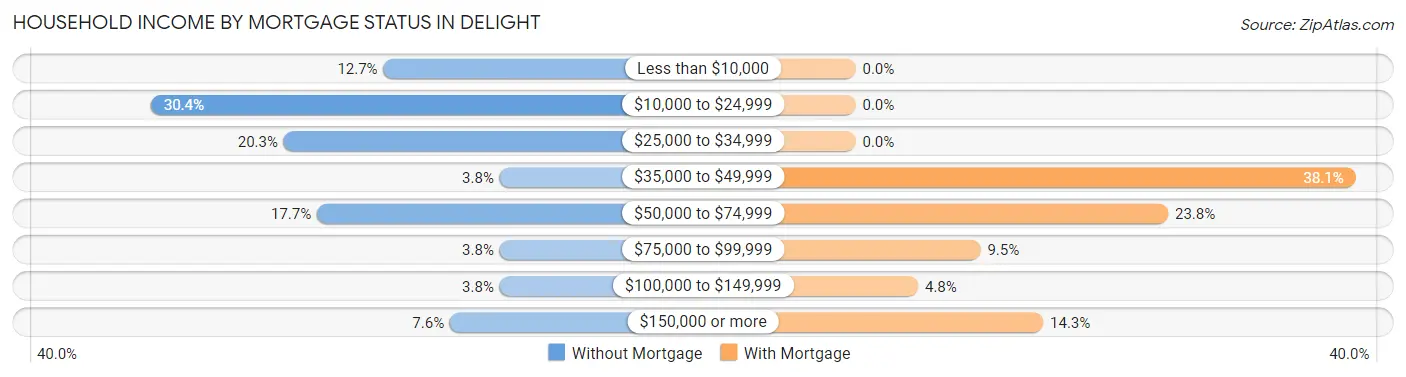
| Household Income | Without Mortgage | With Mortgage |
| Less than $10,000 | 10 (12.7%) | 0 (0.0%) |
| $10,000 to $24,999 | 24 (30.4%) | 0 (0.0%) |
| $25,000 to $34,999 | 16 (20.3%) | 0 (0.0%) |
| $35,000 to $49,999 | 3 (3.8%) | 8 (38.1%) |
| $50,000 to $74,999 | 14 (17.7%) | 5 (23.8%) |
| $75,000 to $99,999 | 3 (3.8%) | 2 (9.5%) |
| $100,000 to $149,999 | 3 (3.8%) | 1 (4.8%) |
| $150,000 or more | 6 (7.6%) | 3 (14.3%) |
| Total | 79 (100.0%) | 21 (100.0%) |
Property Value to Household Income Ratio in Delight
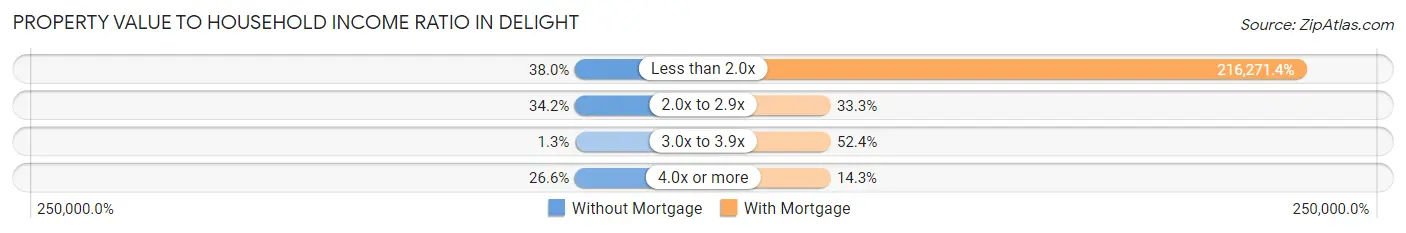
| Value-to-Income Ratio | Without Mortgage | With Mortgage |
| Less than 2.0x | 30 (38.0%) | 45,417 (216,271.4%) |
| 2.0x to 2.9x | 27 (34.2%) | 7 (33.3%) |
| 3.0x to 3.9x | 1 (1.3%) | 11 (52.4%) |
| 4.0x or more | 21 (26.6%) | 3 (14.3%) |
| Total | 79 (100.0%) | 21 (100.0%) |
Real Estate Taxes by Mortgage Status in Delight
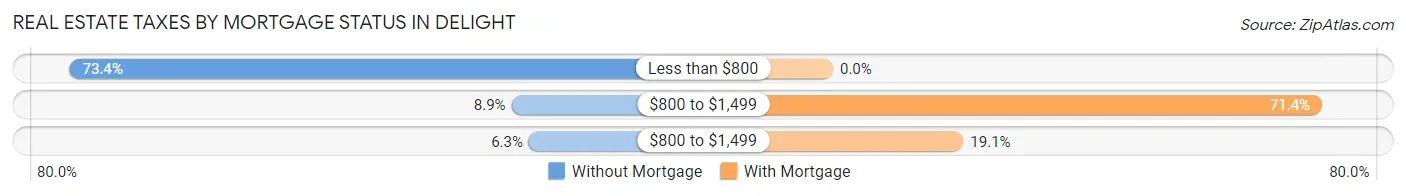
| Property Taxes | Without Mortgage | With Mortgage |
| Less than $800 | 58 (73.4%) | 0 (0.0%) |
| $800 to $1,499 | 7 (8.9%) | 15 (71.4%) |
| $800 to $1,499 | 5 (6.3%) | 4 (19.1%) |
| Total | 79 (100.0%) | 21 (100.0%) |
Health & Disability in Delight
Health Insurance Coverage by Age in Delight
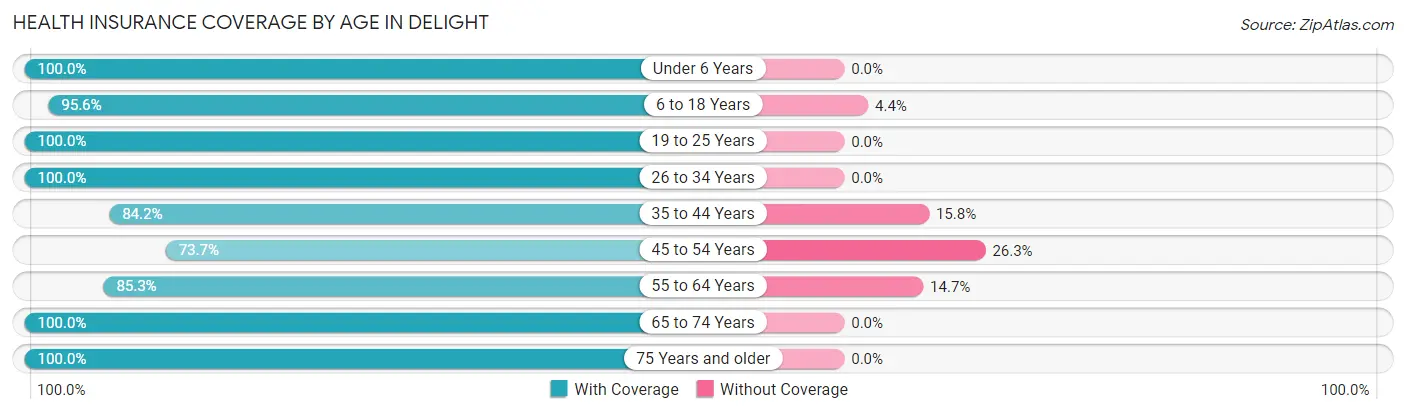
| Age Bracket | With Coverage | Without Coverage |
| Under 6 Years | 10 (100.0%) | 0 (0.0%) |
| 6 to 18 Years | 43 (95.6%) | 2 (4.4%) |
| 19 to 25 Years | 13 (100.0%) | 0 (0.0%) |
| 26 to 34 Years | 29 (100.0%) | 0 (0.0%) |
| 35 to 44 Years | 16 (84.2%) | 3 (15.8%) |
| 45 to 54 Years | 14 (73.7%) | 5 (26.3%) |
| 55 to 64 Years | 29 (85.3%) | 5 (14.7%) |
| 65 to 74 Years | 45 (100.0%) | 0 (0.0%) |
| 75 Years and older | 45 (100.0%) | 0 (0.0%) |
| Total | 244 (94.2%) | 15 (5.8%) |
Health Insurance Coverage by Citizenship Status in Delight
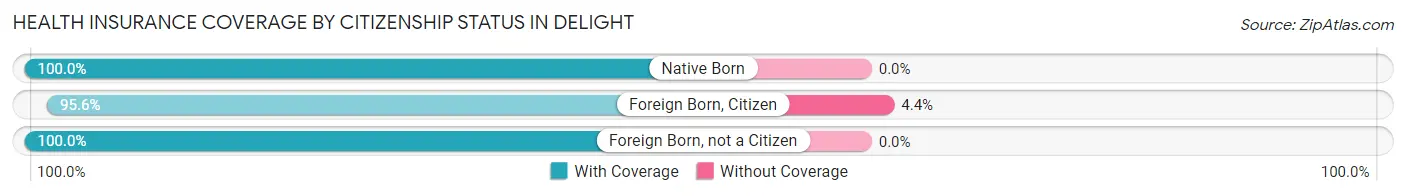
| Citizenship Status | With Coverage | Without Coverage |
| Native Born | 10 (100.0%) | 0 (0.0%) |
| Foreign Born, Citizen | 43 (95.6%) | 2 (4.4%) |
| Foreign Born, not a Citizen | 13 (100.0%) | 0 (0.0%) |
Health Insurance Coverage by Household Income in Delight
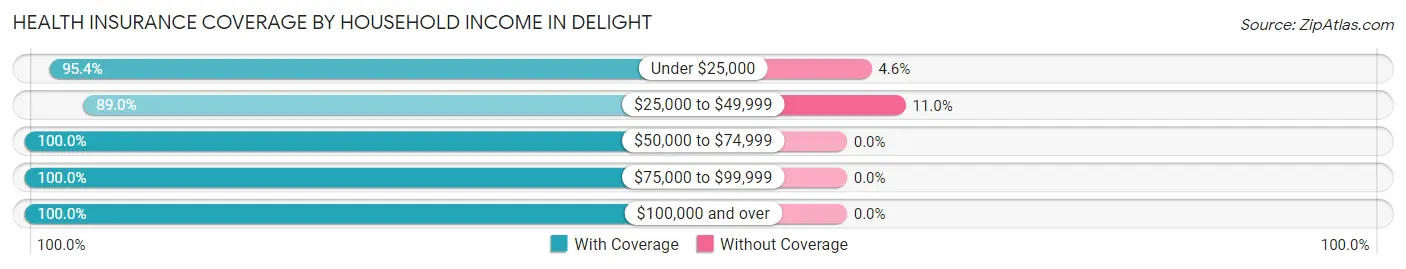
| Household Income | With Coverage | Without Coverage |
| Under $25,000 | 62 (95.4%) | 3 (4.6%) |
| $25,000 to $49,999 | 97 (89.0%) | 12 (11.0%) |
| $50,000 to $74,999 | 37 (100.0%) | 0 (0.0%) |
| $75,000 to $99,999 | 11 (100.0%) | 0 (0.0%) |
| $100,000 and over | 37 (100.0%) | 0 (0.0%) |
Public vs Private Health Insurance Coverage by Age in Delight
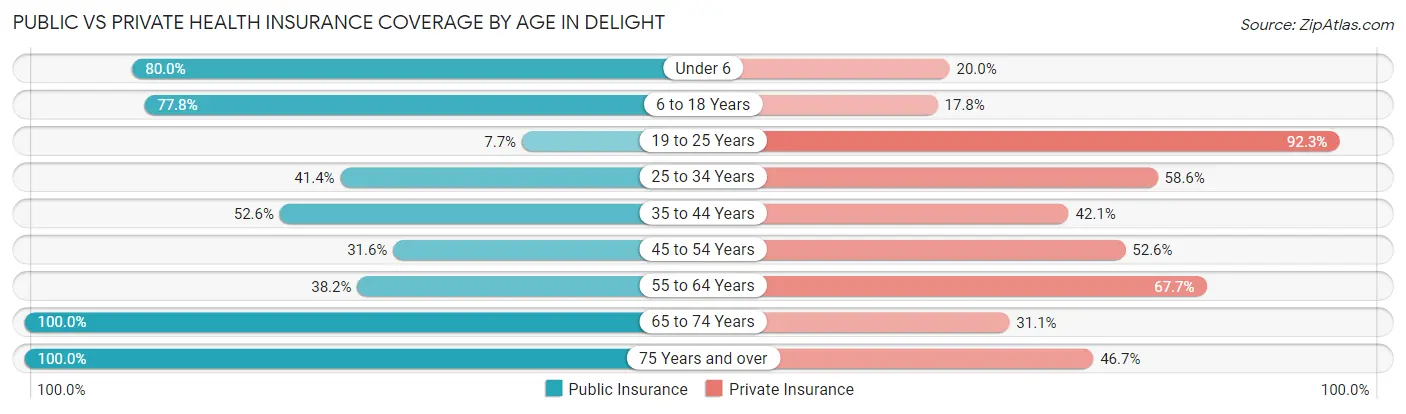
| Age Bracket | Public Insurance | Private Insurance |
| Under 6 | 8 (80.0%) | 2 (20.0%) |
| 6 to 18 Years | 35 (77.8%) | 8 (17.8%) |
| 19 to 25 Years | 1 (7.7%) | 12 (92.3%) |
| 25 to 34 Years | 12 (41.4%) | 17 (58.6%) |
| 35 to 44 Years | 10 (52.6%) | 8 (42.1%) |
| 45 to 54 Years | 6 (31.6%) | 10 (52.6%) |
| 55 to 64 Years | 13 (38.2%) | 23 (67.6%) |
| 65 to 74 Years | 45 (100.0%) | 14 (31.1%) |
| 75 Years and over | 45 (100.0%) | 21 (46.7%) |
| Total | 175 (67.6%) | 115 (44.4%) |
Disability Status by Sex by Age in Delight
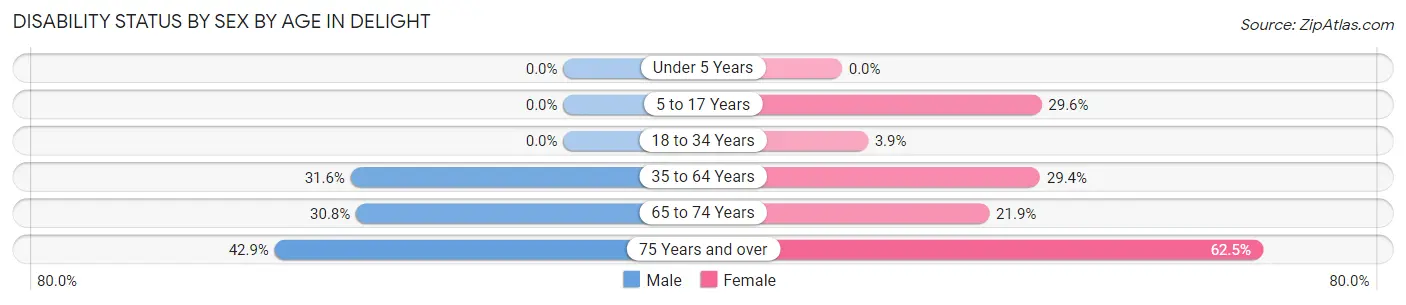
| Age Bracket | Male | Female |
| Under 5 Years | 0 (0.0%) | 0 (0.0%) |
| 5 to 17 Years | 0 (0.0%) | 8 (29.6%) |
| 18 to 34 Years | 0 (0.0%) | 1 (3.8%) |
| 35 to 64 Years | 12 (31.6%) | 10 (29.4%) |
| 65 to 74 Years | 4 (30.8%) | 7 (21.9%) |
| 75 Years and over | 9 (42.9%) | 15 (62.5%) |
Disability Class by Sex by Age in Delight
Disability Class: Hearing Difficulty
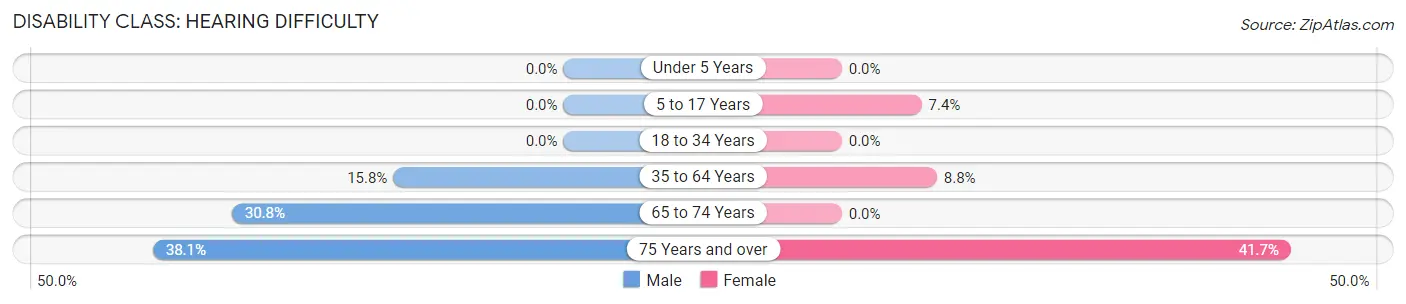
| Age Bracket | Male | Female |
| Under 5 Years | 0 (0.0%) | 0 (0.0%) |
| 5 to 17 Years | 0 (0.0%) | 2 (7.4%) |
| 18 to 34 Years | 0 (0.0%) | 0 (0.0%) |
| 35 to 64 Years | 6 (15.8%) | 3 (8.8%) |
| 65 to 74 Years | 4 (30.8%) | 0 (0.0%) |
| 75 Years and over | 8 (38.1%) | 10 (41.7%) |
Disability Class: Vision Difficulty
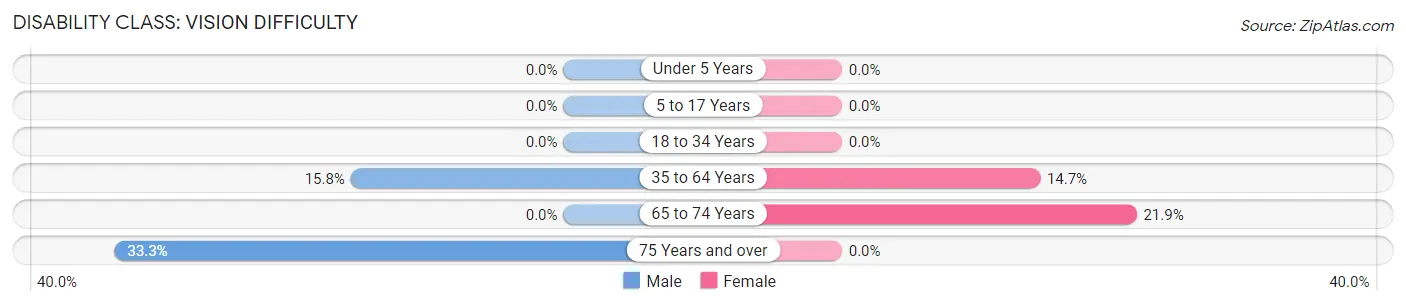
| Age Bracket | Male | Female |
| Under 5 Years | 0 (0.0%) | 0 (0.0%) |
| 5 to 17 Years | 0 (0.0%) | 0 (0.0%) |
| 18 to 34 Years | 0 (0.0%) | 0 (0.0%) |
| 35 to 64 Years | 6 (15.8%) | 5 (14.7%) |
| 65 to 74 Years | 0 (0.0%) | 7 (21.9%) |
| 75 Years and over | 7 (33.3%) | 0 (0.0%) |
Disability Class: Cognitive Difficulty
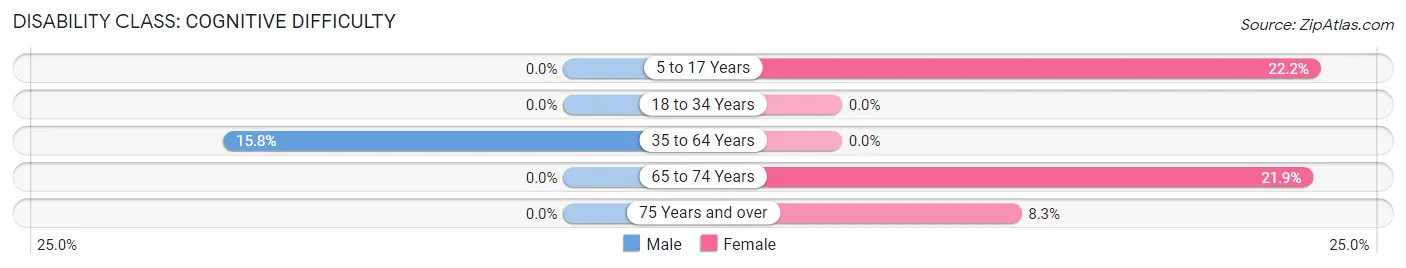
| Age Bracket | Male | Female |
| 5 to 17 Years | 0 (0.0%) | 6 (22.2%) |
| 18 to 34 Years | 0 (0.0%) | 0 (0.0%) |
| 35 to 64 Years | 6 (15.8%) | 0 (0.0%) |
| 65 to 74 Years | 0 (0.0%) | 7 (21.9%) |
| 75 Years and over | 0 (0.0%) | 2 (8.3%) |
Disability Class: Ambulatory Difficulty
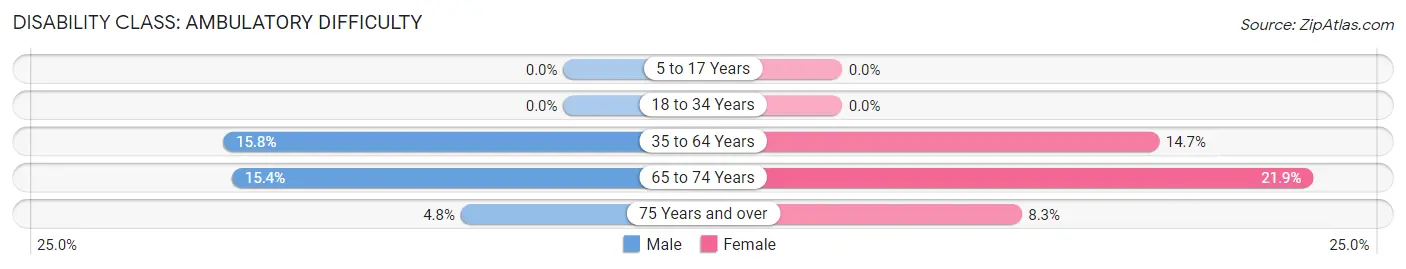
| Age Bracket | Male | Female |
| 5 to 17 Years | 0 (0.0%) | 0 (0.0%) |
| 18 to 34 Years | 0 (0.0%) | 0 (0.0%) |
| 35 to 64 Years | 6 (15.8%) | 5 (14.7%) |
| 65 to 74 Years | 2 (15.4%) | 7 (21.9%) |
| 75 Years and over | 1 (4.8%) | 2 (8.3%) |
Disability Class: Self-Care Difficulty
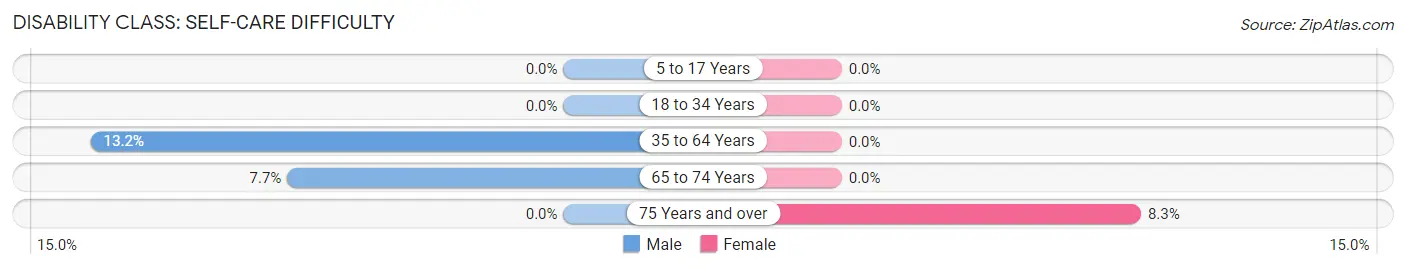
| Age Bracket | Male | Female |
| 5 to 17 Years | 0 (0.0%) | 0 (0.0%) |
| 18 to 34 Years | 0 (0.0%) | 0 (0.0%) |
| 35 to 64 Years | 5 (13.2%) | 0 (0.0%) |
| 65 to 74 Years | 1 (7.7%) | 0 (0.0%) |
| 75 Years and over | 0 (0.0%) | 2 (8.3%) |
Technology Access in Delight
Computing Device Access in Delight
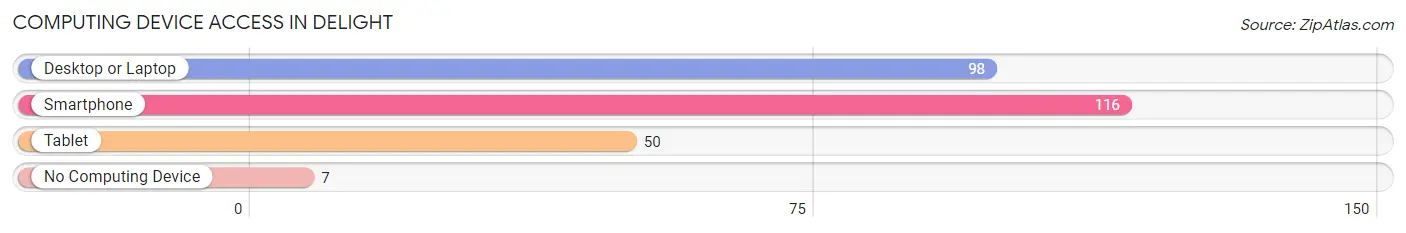
| Device Type | # Households | % Households |
| Desktop or Laptop | 98 | 72.1% |
| Smartphone | 116 | 85.3% |
| Tablet | 50 | 36.8% |
| No Computing Device | 7 | 5.1% |
| Total | 136 | 100.0% |
Internet Access in Delight
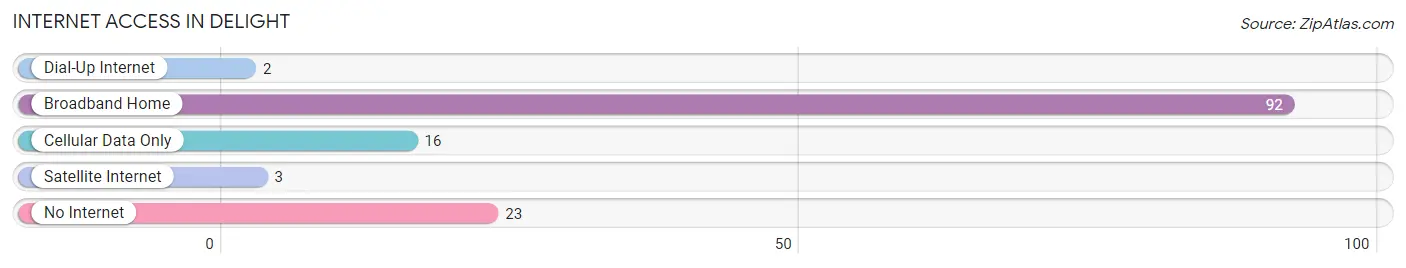
| Internet Type | # Households | % Households |
| Dial-Up Internet | 2 | 1.5% |
| Broadband Home | 92 | 67.6% |
| Cellular Data Only | 16 | 11.8% |
| Satellite Internet | 3 | 2.2% |
| No Internet | 23 | 16.9% |
| Total | 136 | 100.0% |
Delight Summary
AR History
Arkansas is a state located in the southern region of the United States. It is bordered by six states: Missouri to the north, Tennessee and Mississippi to the east, Louisiana to the south, Texas to the southwest, and Oklahoma to the west. Arkansas is the 33rd largest state by area and the 25th most populous state in the United States. The state was admitted to the Union on June 15, 1836, as the 25th state.
The history of Arkansas is closely tied to the history of the United States. The first inhabitants of the area were Native Americans, including the Caddo, Osage, and Quapaw tribes. The first Europeans to explore the area were the Spanish, who arrived in the 16th century. The French and Spanish both established colonies in the area, and the French eventually gained control of the region.
In 1803, the United States acquired the area as part of the Louisiana Purchase. Arkansas became a territory in 1819 and was admitted to the Union as the 25th state in 1836. During the Civil War, Arkansas was a Confederate state and was the site of several battles. After the war, the state experienced a period of Reconstruction, during which the state was readmitted to the Union in 1868.
In the late 19th century, Arkansas experienced a period of economic growth, fueled by the timber and cotton industries. The state also experienced a period of political turmoil, as the Democratic Party and the Republican Party fought for control of the state. In the early 20th century, Arkansas experienced a period of economic decline, as the timber and cotton industries declined.
In the late 20th century, Arkansas experienced a period of economic growth, fueled by the growth of the service and manufacturing industries. The state also experienced a period of political stability, as the Democratic Party maintained control of the state.
Geography
Arkansas is located in the southern region of the United States. It is bordered by six states: Missouri to the north, Tennessee and Mississippi to the east, Louisiana to the south, Texas to the southwest, and Oklahoma to the west. Arkansas is the 33rd largest state by area and the 25th most populous state in the United States.
The geography of Arkansas is diverse, with mountains, plains, and rivers. The Ozark Mountains are located in the northwest corner of the state, while the Ouachita Mountains are located in the southwest corner. The Arkansas River runs through the center of the state, and the Mississippi River forms the eastern border.
Economy
The economy of Arkansas is diverse and includes agriculture, manufacturing, and services. The state is a major producer of cotton, rice, soybeans, and poultry. Arkansas is also a major producer of timber, and the state is home to several large paper mills.
Manufacturing is an important part of the Arkansas economy. The state is home to several large automotive and aerospace manufacturers, as well as food processing plants. The service sector is also an important part of the economy, and the state is home to several large banks and insurance companies.
Demographics
As of the 2010 census, the population of Arkansas was 2,915,918. The population is made up of a variety of ethnic and racial groups, including White (76.9%), Black or African American (15.4%), American Indian and Alaska Native (1.2%), Asian (1.7%), and Hispanic or Latino (6.3%).
The median household income in Arkansas is $41,371, and the median family income is $50,919. The poverty rate in the state is 17.2%, and the unemployment rate is 4.2%. The largest cities in Arkansas are Little Rock, Fort Smith, Fayetteville, Springdale, Jonesboro, North Little Rock, Conway, Rogers, Pine Bluff, and Bentonville.
Common Questions
What is Per Capita Income in Delight?
Per Capita income in Delight is $23,609.
What is the Median Family Income in Delight?
Median Family Income in Delight is $46,500.
What is the Median Household income in Delight?
Median Household Income in Delight is $30,682.
What is Income or Wage Gap in Delight?
Income or Wage Gap in Delight is 42.3%.
Women in Delight earn 57.7 cents for every dollar earned by a man.
What is Inequality or Gini Index in Delight?
Inequality or Gini Index in Delight is 0.45.
What is the Total Population of Delight?
Total Population of Delight is 259.
What is the Total Male Population of Delight?
Total Male Population of Delight is 115.
What is the Total Female Population of Delight?
Total Female Population of Delight is 144.
What is the Ratio of Males per 100 Females in Delight?
There are 79.86 Males per 100 Females in Delight.
What is the Ratio of Females per 100 Males in Delight?
There are 125.22 Females per 100 Males in Delight.
What is the Median Population Age in Delight?
Median Population Age in Delight is 51.8 Years.
What is the Average Family Size in Delight
Average Family Size in Delight is 2.8 People.
What is the Average Household Size in Delight
Average Household Size in Delight is 1.9 People.
How Large is the Labor Force in Delight?
There are 94 People in the Labor Forcein in Delight.
What is the Percentage of People in the Labor Force in Delight?
44.8% of People are in the Labor Force in Delight.
What is the Unemployment Rate in Delight?
Unemployment Rate in Delight is 16.0%.