Dutch vs Swiss 2 or more Vehicles in Household
COMPARE
Dutch
Swiss
2 or more Vehicles in Household
2 or more Vehicles in Household Comparison
Dutch
Swiss
61.6%
2 OR MORE VEHICLES IN HOUSEHOLD
100.0/ 100
METRIC RATING
11th/ 347
METRIC RANK
61.0%
2 OR MORE VEHICLES IN HOUSEHOLD
100.0/ 100
METRIC RATING
22nd/ 347
METRIC RANK
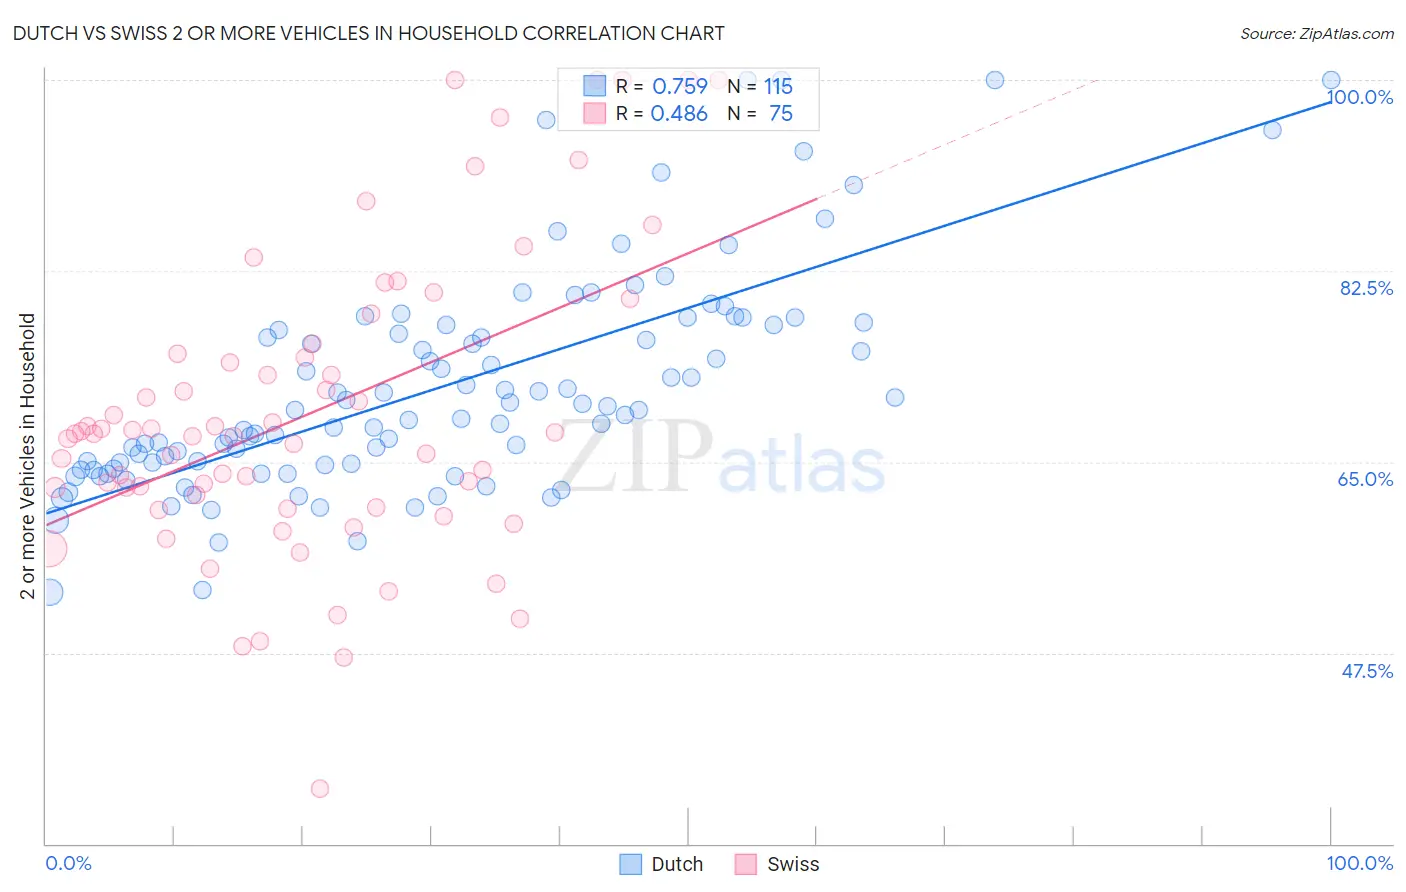
Dutch vs Swiss 2 or more Vehicles in Household Correlation Chart
The statistical analysis conducted on geographies consisting of 553,922,403 people shows a strong positive correlation between the proportion of Dutch and percentage of households with 2 or more vehicles available in the United States with a correlation coefficient (R) of 0.759 and weighted average of 61.6%. Similarly, the statistical analysis conducted on geographies consisting of 464,799,641 people shows a moderate positive correlation between the proportion of Swiss and percentage of households with 2 or more vehicles available in the United States with a correlation coefficient (R) of 0.486 and weighted average of 61.0%, a difference of 1.1%.
2 or more Vehicles in Household Correlation Summary
| Measurement | Dutch | Swiss |
| Minimum | 53.0% | 35.0% |
| Maximum | 100.0% | 100.0% |
| Range | 47.0% | 65.0% |
| Mean | 71.8% | 69.3% |
| Median | 69.7% | 67.5% |
| Interquartile 25% (IQ1) | 64.7% | 60.8% |
| Interquartile 75% (IQ3) | 77.5% | 75.0% |
| Interquartile Range (IQR) | 12.8% | 14.2% |
| Standard Deviation (Sample) | 10.0% | 13.7% |
| Standard Deviation (Population) | 10.0% | 13.6% |
Demographics Similar to Dutch and Swiss by 2 or more Vehicles in Household
In terms of 2 or more vehicles in household, the demographic groups most similar to Dutch are Mexican (61.7%, a difference of 0.050%), German (61.6%, a difference of 0.11%), Samoan (61.5%, a difference of 0.23%), Czech (61.5%, a difference of 0.28%), and Swedish (61.8%, a difference of 0.33%). Similarly, the demographic groups most similar to Swiss are Korean (61.0%, a difference of 0.040%), Scotch-Irish (60.9%, a difference of 0.040%), Immigrants from Vietnam (60.9%, a difference of 0.070%), Sri Lankan (61.0%, a difference of 0.080%), and White/Caucasian (60.8%, a difference of 0.23%).
| Demographics | Rating | Rank | 2 or more Vehicles in Household |
| Scandinavians | 100.0 /100 | #6 | Exceptional 62.1% |
| Puget Sound Salish | 100.0 /100 | #7 | Exceptional 62.1% |
| English | 100.0 /100 | #8 | Exceptional 61.9% |
| Swedes | 100.0 /100 | #9 | Exceptional 61.8% |
| Mexicans | 100.0 /100 | #10 | Exceptional 61.7% |
| Dutch | 100.0 /100 | #11 | Exceptional 61.6% |
| Germans | 100.0 /100 | #12 | Exceptional 61.6% |
| Samoans | 100.0 /100 | #13 | Exceptional 61.5% |
| Czechs | 100.0 /100 | #14 | Exceptional 61.5% |
| Nepalese | 100.0 /100 | #15 | Exceptional 61.4% |
| Native Hawaiians | 100.0 /100 | #16 | Exceptional 61.4% |
| Basques | 100.0 /100 | #17 | Exceptional 61.4% |
| Europeans | 100.0 /100 | #18 | Exceptional 61.4% |
| Scottish | 100.0 /100 | #19 | Exceptional 61.2% |
| Sri Lankans | 100.0 /100 | #20 | Exceptional 61.0% |
| Koreans | 100.0 /100 | #21 | Exceptional 61.0% |
| Swiss | 100.0 /100 | #22 | Exceptional 61.0% |
| Scotch-Irish | 100.0 /100 | #23 | Exceptional 60.9% |
| Immigrants | Vietnam | 100.0 /100 | #24 | Exceptional 60.9% |
| Whites/Caucasians | 100.0 /100 | #25 | Exceptional 60.8% |
| Welsh | 100.0 /100 | #26 | Exceptional 60.8% |