Dutch vs Arab 2 or more Vehicles in Household
COMPARE
Dutch
Arab
2 or more Vehicles in Household
2 or more Vehicles in Household Comparison
Dutch
Arabs
61.6%
2 OR MORE VEHICLES IN HOUSEHOLD
100.0/ 100
METRIC RATING
11th/ 347
METRIC RANK
55.0%
2 OR MORE VEHICLES IN HOUSEHOLD
35.9/ 100
METRIC RATING
185th/ 347
METRIC RANK
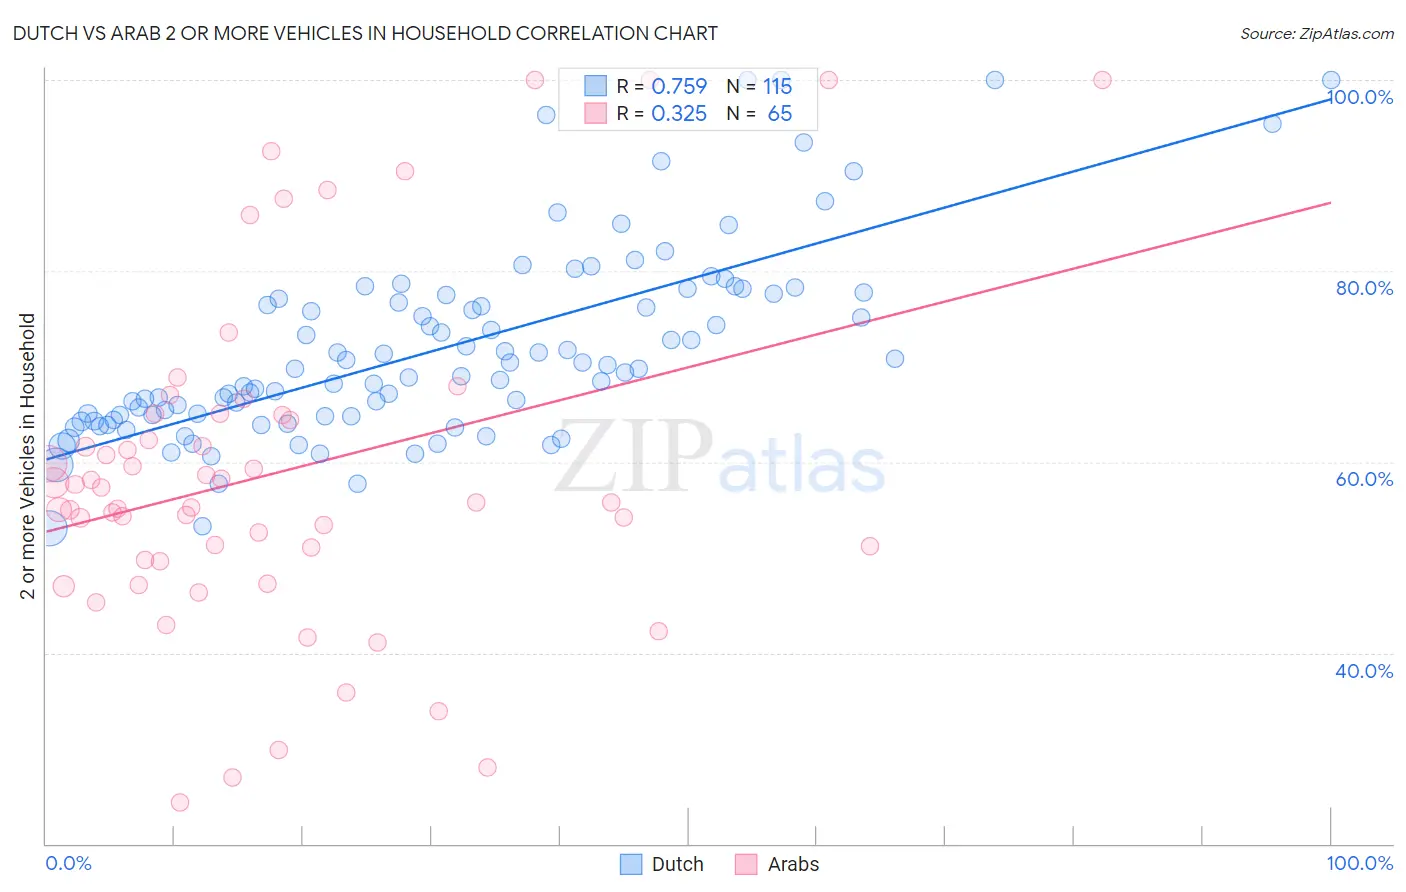
Dutch vs Arab 2 or more Vehicles in Household Correlation Chart
The statistical analysis conducted on geographies consisting of 553,922,403 people shows a strong positive correlation between the proportion of Dutch and percentage of households with 2 or more vehicles available in the United States with a correlation coefficient (R) of 0.759 and weighted average of 61.6%. Similarly, the statistical analysis conducted on geographies consisting of 486,450,180 people shows a mild positive correlation between the proportion of Arabs and percentage of households with 2 or more vehicles available in the United States with a correlation coefficient (R) of 0.325 and weighted average of 55.0%, a difference of 12.0%.
2 or more Vehicles in Household Correlation Summary
| Measurement | Dutch | Arab |
| Minimum | 53.0% | 24.3% |
| Maximum | 100.0% | 100.0% |
| Range | 47.0% | 75.7% |
| Mean | 71.8% | 58.8% |
| Median | 69.7% | 55.8% |
| Interquartile 25% (IQ1) | 64.7% | 49.7% |
| Interquartile 75% (IQ3) | 77.5% | 64.9% |
| Interquartile Range (IQR) | 12.8% | 15.2% |
| Standard Deviation (Sample) | 10.0% | 17.5% |
| Standard Deviation (Population) | 10.0% | 17.4% |
Similar Demographics by 2 or more Vehicles in Household
Demographics Similar to Dutch by 2 or more Vehicles in Household
In terms of 2 or more vehicles in household, the demographic groups most similar to Dutch are Mexican (61.7%, a difference of 0.050%), German (61.6%, a difference of 0.11%), Samoan (61.5%, a difference of 0.23%), Czech (61.5%, a difference of 0.28%), and Swedish (61.8%, a difference of 0.33%).
| Demographics | Rating | Rank | 2 or more Vehicles in Household |
| Norwegians | 100.0 /100 | #4 | Exceptional 62.8% |
| Immigrants | Fiji | 100.0 /100 | #5 | Exceptional 62.3% |
| Scandinavians | 100.0 /100 | #6 | Exceptional 62.1% |
| Puget Sound Salish | 100.0 /100 | #7 | Exceptional 62.1% |
| English | 100.0 /100 | #8 | Exceptional 61.9% |
| Swedes | 100.0 /100 | #9 | Exceptional 61.8% |
| Mexicans | 100.0 /100 | #10 | Exceptional 61.7% |
| Dutch | 100.0 /100 | #11 | Exceptional 61.6% |
| Germans | 100.0 /100 | #12 | Exceptional 61.6% |
| Samoans | 100.0 /100 | #13 | Exceptional 61.5% |
| Czechs | 100.0 /100 | #14 | Exceptional 61.5% |
| Nepalese | 100.0 /100 | #15 | Exceptional 61.4% |
| Native Hawaiians | 100.0 /100 | #16 | Exceptional 61.4% |
| Basques | 100.0 /100 | #17 | Exceptional 61.4% |
| Europeans | 100.0 /100 | #18 | Exceptional 61.4% |
Demographics Similar to Arabs by 2 or more Vehicles in Household
In terms of 2 or more vehicles in household, the demographic groups most similar to Arabs are Apache (55.1%, a difference of 0.030%), Immigrants from Cameroon (55.1%, a difference of 0.060%), Immigrants from Micronesia (55.1%, a difference of 0.10%), Cree (55.1%, a difference of 0.10%), and Peruvian (55.0%, a difference of 0.10%).
| Demographics | Rating | Rank | 2 or more Vehicles in Household |
| Immigrants | Sweden | 45.3 /100 | #178 | Average 55.2% |
| Alaskan Athabascans | 42.9 /100 | #179 | Average 55.2% |
| Immigrants | Kenya | 40.4 /100 | #180 | Average 55.1% |
| Immigrants | Micronesia | 38.2 /100 | #181 | Fair 55.1% |
| Cree | 38.2 /100 | #182 | Fair 55.1% |
| Immigrants | Cameroon | 37.3 /100 | #183 | Fair 55.1% |
| Apache | 36.7 /100 | #184 | Fair 55.1% |
| Arabs | 35.9 /100 | #185 | Fair 55.0% |
| Peruvians | 33.7 /100 | #186 | Fair 55.0% |
| Immigrants | Uganda | 33.4 /100 | #187 | Fair 55.0% |
| Marshallese | 30.5 /100 | #188 | Fair 54.9% |
| Eastern Europeans | 27.5 /100 | #189 | Fair 54.8% |
| Russians | 26.3 /100 | #190 | Fair 54.8% |
| Immigrants | Immigrants | 25.0 /100 | #191 | Fair 54.7% |
| Immigrants | Romania | 23.8 /100 | #192 | Fair 54.7% |