Perry County, TN Map & Demographics
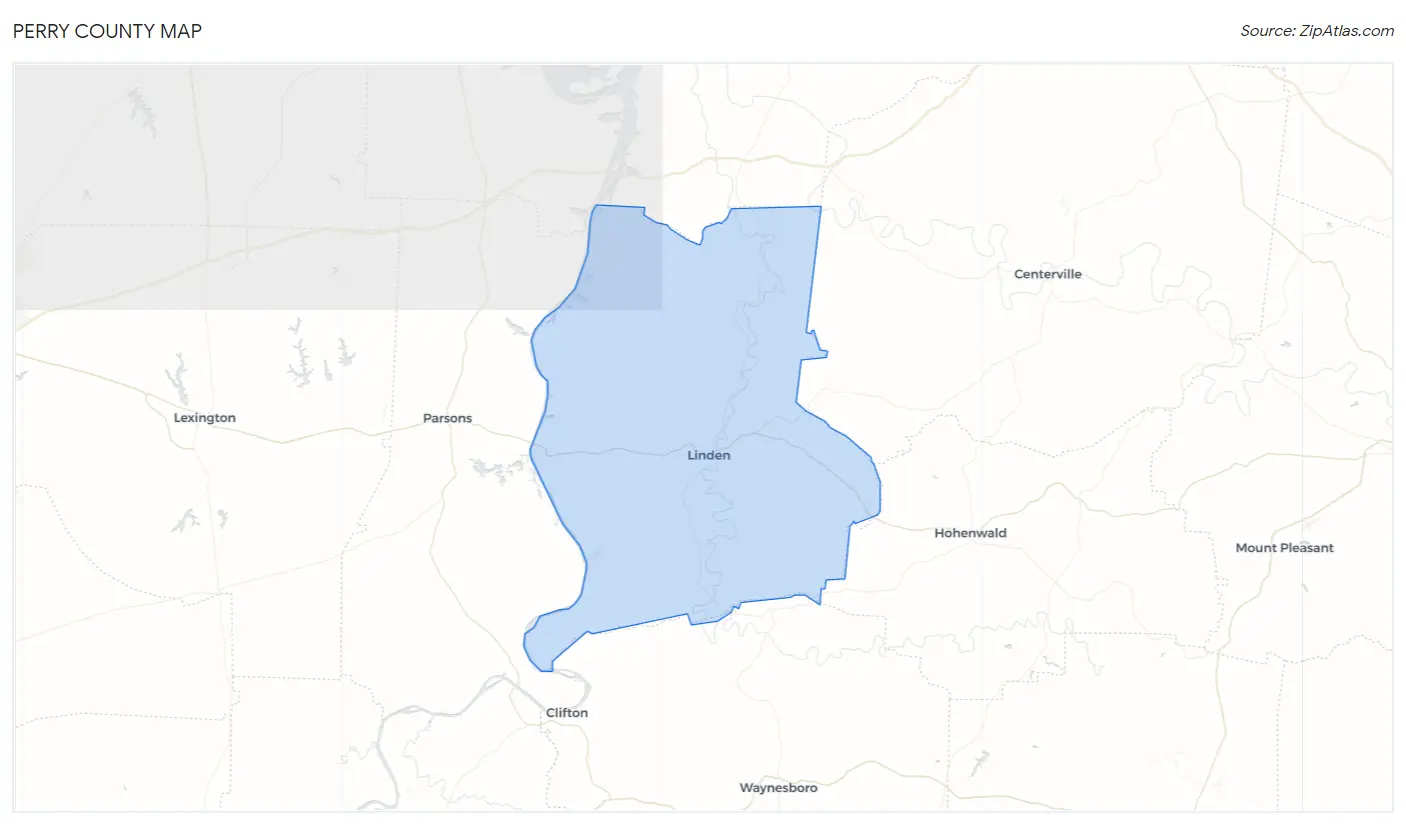
Perry County Map
Perry County Overview
$30,870
PER CAPITA INCOME
$61,881
AVG FAMILY INCOME
$55,978
AVG HOUSEHOLD INCOME
33.9%
WAGE / INCOME GAP [ % ]
66.1¢/ $1
WAGE / INCOME GAP [ $ ]
0.53
INEQUALITY / GINI INDEX
8,432
TOTAL POPULATION
4,197
MALE POPULATION
4,235
FEMALE POPULATION
99.10
MALES / 100 FEMALES
100.91
FEMALES / 100 MALES
42.8
MEDIAN AGE
3.2
AVG FAMILY SIZE
2.8
AVG HOUSEHOLD SIZE
3,478
LABOR FORCE [ PEOPLE ]
51.3%
PERCENT IN LABOR FORCE
10.9%
UNEMPLOYMENT RATE
Perry County Area Codes
Income in Perry County
Income Overview in Perry County
Per Capita Income in Perry County is $30,870, while median incomes of families and households are $61,881 and $55,978 respectively.
| Characteristic | Number | Measure |
| Per Capita Income | 8,432 | $30,870 |
| Median Family Income | 2,219 | $61,881 |
| Mean Family Income | 2,219 | $96,412 |
| Median Household Income | 2,954 | $55,978 |
| Mean Household Income | 2,954 | $82,094 |
| Income Deficit | 2,219 | $0 |
| Wage / Income Gap (%) | 8,432 | 33.88% |
| Wage / Income Gap ($) | 8,432 | 66.12¢ per $1 |
| Gini / Inequality Index | 8,432 | 0.53 |
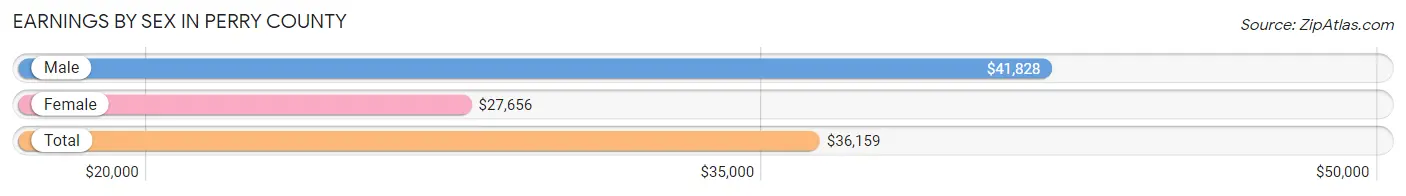
Earnings by Sex in Perry County
Average Earnings in Perry County are $36,159, $41,828 for men and $27,656 for women, a difference of 33.9%.
| Sex | Number | Average Earnings |
| Male | 1,762 (51.9%) | $41,828 |
| Female | 1,632 (48.1%) | $27,656 |
| Total | 3,394 (100.0%) | $36,159 |
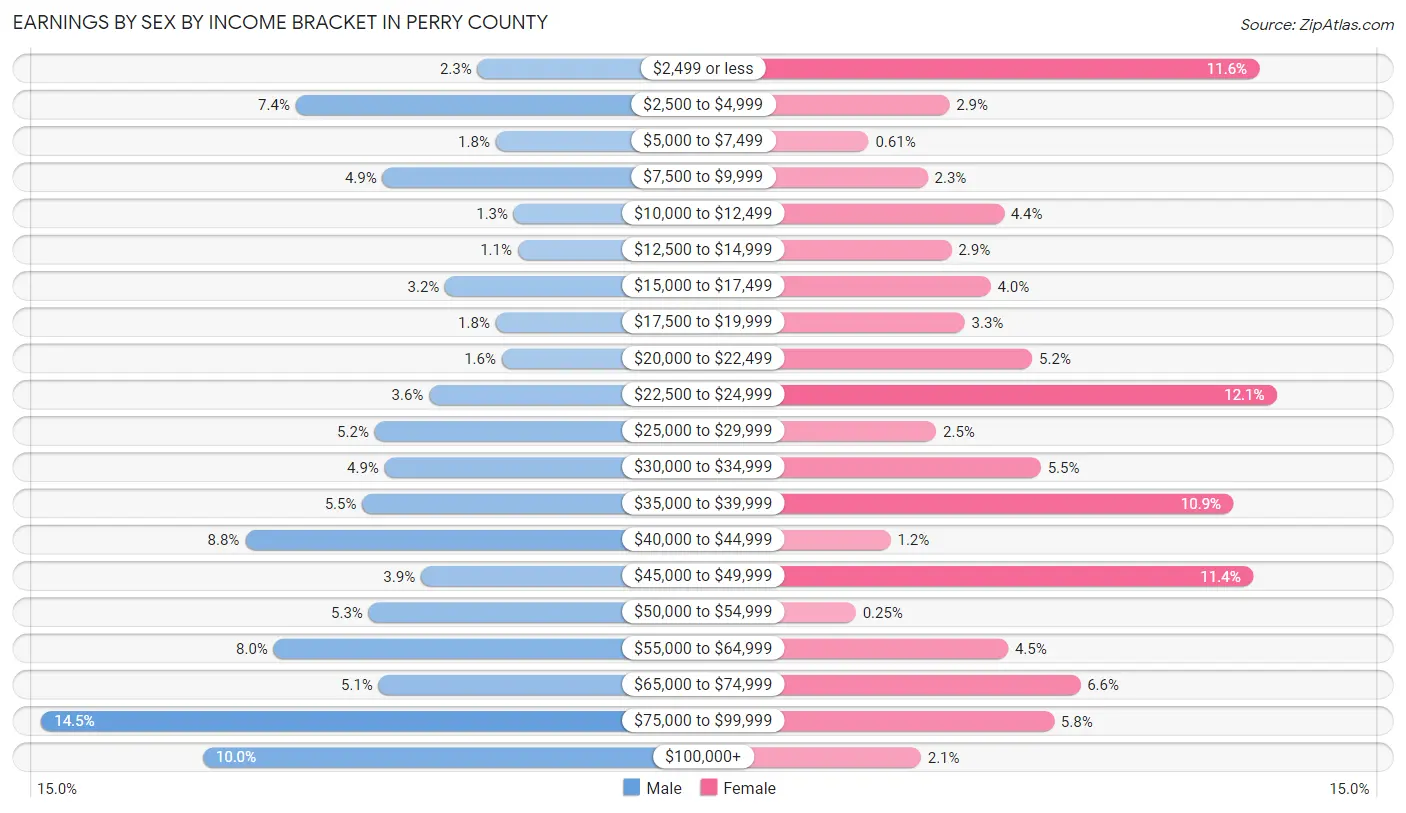
Earnings by Sex by Income Bracket in Perry County
The most common earnings brackets in Perry County are $75,000 to $99,999 for men (256 | 14.5%) and $22,500 to $24,999 for women (197 | 12.1%).
| Income | Male | Female |
| $2,499 or less | 40 (2.3%) | 189 (11.6%) |
| $2,500 to $4,999 | 130 (7.4%) | 47 (2.9%) |
| $5,000 to $7,499 | 31 (1.8%) | 10 (0.6%) |
| $7,500 to $9,999 | 87 (4.9%) | 37 (2.3%) |
| $10,000 to $12,499 | 22 (1.3%) | 72 (4.4%) |
| $12,500 to $14,999 | 20 (1.1%) | 48 (2.9%) |
| $15,000 to $17,499 | 56 (3.2%) | 66 (4.0%) |
| $17,500 to $19,999 | 31 (1.8%) | 54 (3.3%) |
| $20,000 to $22,499 | 28 (1.6%) | 85 (5.2%) |
| $22,500 to $24,999 | 64 (3.6%) | 197 (12.1%) |
| $25,000 to $29,999 | 91 (5.2%) | 41 (2.5%) |
| $30,000 to $34,999 | 86 (4.9%) | 89 (5.4%) |
| $35,000 to $39,999 | 97 (5.5%) | 177 (10.8%) |
| $40,000 to $44,999 | 155 (8.8%) | 20 (1.2%) |
| $45,000 to $49,999 | 68 (3.9%) | 186 (11.4%) |
| $50,000 to $54,999 | 94 (5.3%) | 4 (0.3%) |
| $55,000 to $64,999 | 141 (8.0%) | 74 (4.5%) |
| $65,000 to $74,999 | 89 (5.1%) | 107 (6.6%) |
| $75,000 to $99,999 | 256 (14.5%) | 95 (5.8%) |
| $100,000+ | 176 (10.0%) | 34 (2.1%) |
| Total | 1,762 (100.0%) | 1,632 (100.0%) |
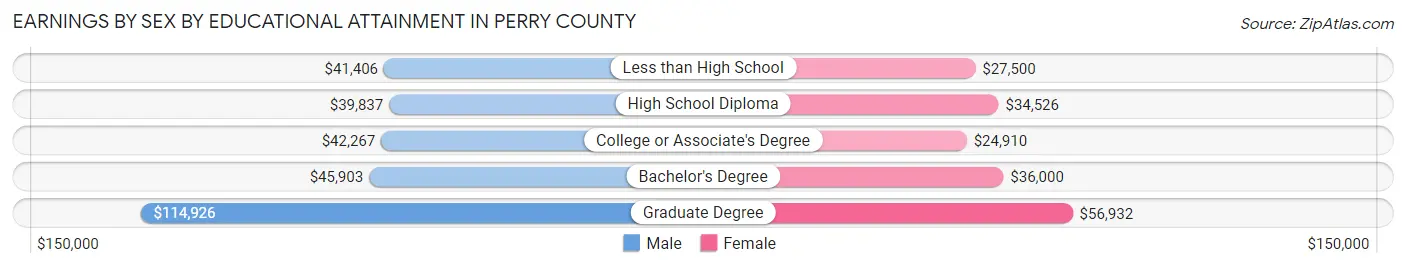
Earnings by Sex by Educational Attainment in Perry County
Average earnings in Perry County are $44,167 for men and $33,952 for women, a difference of 23.1%. Men with an educational attainment of graduate degree enjoy the highest average annual earnings of $114,926, while those with high school diploma education earn the least with $39,837. Women with an educational attainment of graduate degree earn the most with the average annual earnings of $56,932, while those with college or associate's degree education have the smallest earnings of $24,910.
| Educational Attainment | Male Income | Female Income |
| Less than High School | $41,406 | $27,500 |
| High School Diploma | $39,837 | $34,526 |
| College or Associate's Degree | $42,267 | $24,910 |
| Bachelor's Degree | $45,903 | $36,000 |
| Graduate Degree | $114,926 | $56,932 |
| Total | $44,167 | $33,952 |
Family Income in Perry County
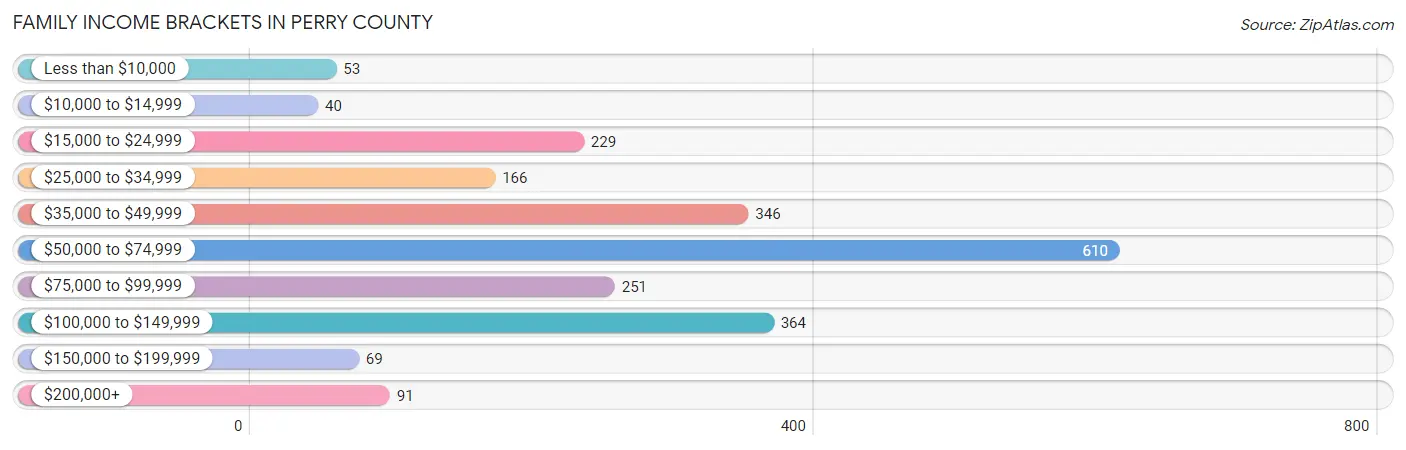
Family Income Brackets in Perry County
According to the Perry County family income data, there are 610 families falling into the $50,000 to $74,999 income range, which is the most common income bracket and makes up 27.5% of all families. Conversely, the $10,000 to $14,999 income bracket is the least frequent group with only 40 families (1.8%) belonging to this category.
| Income Bracket | # Families | % Families |
| Less than $10,000 | 53 | 2.4% |
| $10,000 to $14,999 | 40 | 1.8% |
| $15,000 to $24,999 | 229 | 10.3% |
| $25,000 to $34,999 | 166 | 7.5% |
| $35,000 to $49,999 | 346 | 15.6% |
| $50,000 to $74,999 | 610 | 27.5% |
| $75,000 to $99,999 | 251 | 11.3% |
| $100,000 to $149,999 | 364 | 16.4% |
| $150,000 to $199,999 | 69 | 3.1% |
| $200,000+ | 91 | 4.1% |
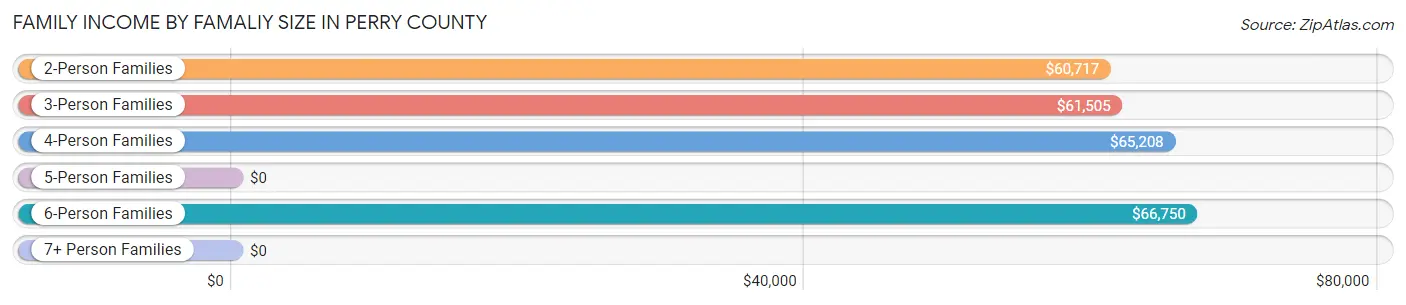
Family Income by Famaliy Size in Perry County
6-person families (21 | 0.9%) account for the highest median family income in Perry County with $66,750 per family, while 2-person families (1,295 | 58.4%) have the highest median income of $30,358 per family member.
| Income Bracket | # Families | Median Income |
| 2-Person Families | 1,295 (58.4%) | $60,717 |
| 3-Person Families | 474 (21.4%) | $61,505 |
| 4-Person Families | 158 (7.1%) | $65,208 |
| 5-Person Families | 255 (11.5%) | $0 |
| 6-Person Families | 21 (0.9%) | $66,750 |
| 7+ Person Families | 16 (0.7%) | $0 |
| Total | 2,219 (100.0%) | $61,881 |
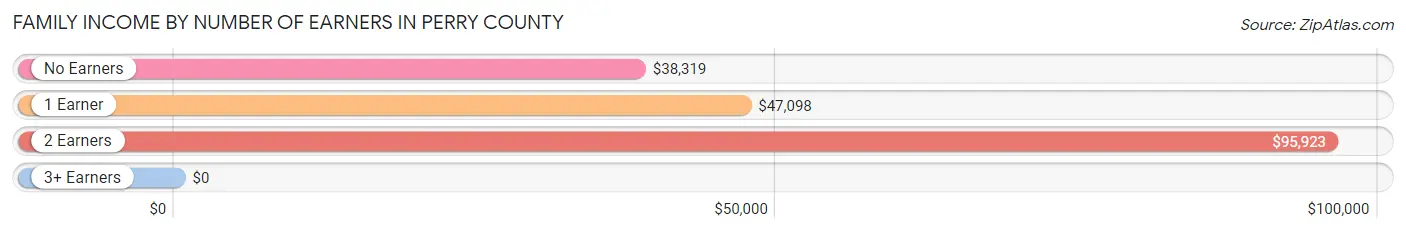
Family Income by Number of Earners in Perry County
| Number of Earners | # Families | Median Income |
| No Earners | 593 (26.7%) | $38,319 |
| 1 Earner | 750 (33.8%) | $47,098 |
| 2 Earners | 709 (32.0%) | $95,923 |
| 3+ Earners | 167 (7.5%) | $0 |
| Total | 2,219 (100.0%) | $61,881 |
Household Income in Perry County
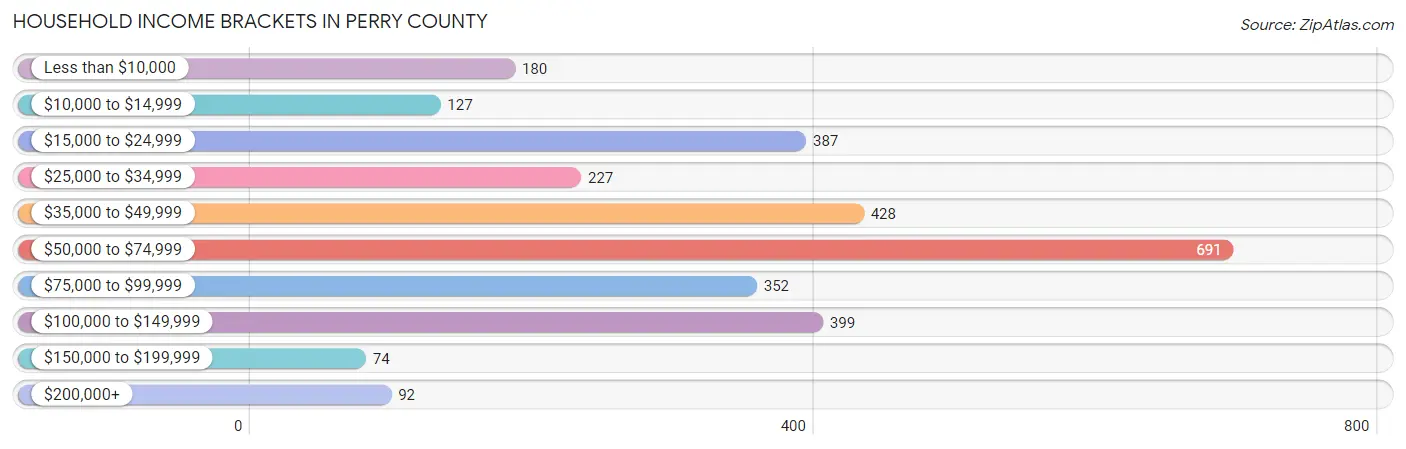
Household Income Brackets in Perry County
With 691 households falling in the category, the $50,000 to $74,999 income range is the most frequent in Perry County, accounting for 23.4% of all households. In contrast, only 74 households (2.5%) fall into the $150,000 to $199,999 income bracket, making it the least populous group.
| Income Bracket | # Households | % Households |
| Less than $10,000 | 180 | 6.1% |
| $10,000 to $14,999 | 127 | 4.3% |
| $15,000 to $24,999 | 387 | 13.1% |
| $25,000 to $34,999 | 227 | 7.7% |
| $35,000 to $49,999 | 428 | 14.5% |
| $50,000 to $74,999 | 691 | 23.4% |
| $75,000 to $99,999 | 352 | 11.9% |
| $100,000 to $149,999 | 399 | 13.5% |
| $150,000 to $199,999 | 74 | 2.5% |
| $200,000+ | 92 | 3.1% |
Household Income by Householder Age in Perry County
The median household income in Perry County is $55,978, with the highest median household income of $62,781 found in the 45 to 64 years age bracket for the primary householder. A total of 1,057 households (35.8%) fall into this category. Meanwhile, the 65+ years age bracket for the primary householder has the lowest median household income of $38,594, with 1,107 households (37.5%) in this group.
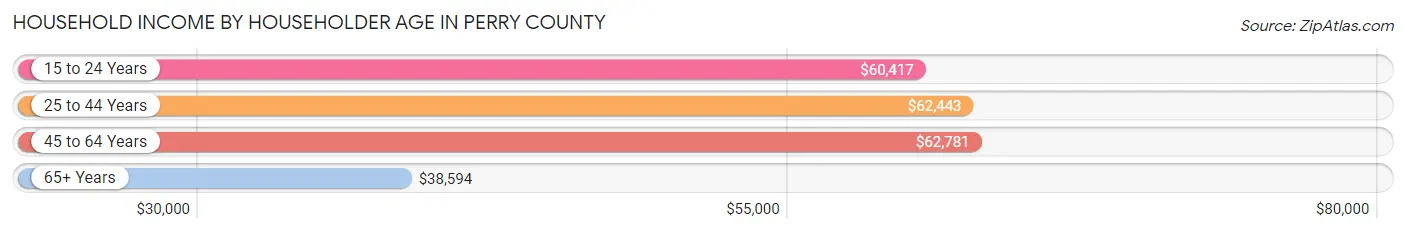
| Income Bracket | # Households | Median Income |
| 15 to 24 Years | 51 (1.7%) | $60,417 |
| 25 to 44 Years | 739 (25.0%) | $62,443 |
| 45 to 64 Years | 1,057 (35.8%) | $62,781 |
| 65+ Years | 1,107 (37.5%) | $38,594 |
| Total | 2,954 (100.0%) | $55,978 |
Poverty in Perry County
Income Below Poverty by Sex and Age in Perry County
With 10.6% poverty level for males and 17.8% for females among the residents of Perry County, 6 to 11 year old males and 12 to 14 year old females are the most vulnerable to poverty, with 46 males (20.3%) and 54 females (58.1%) in their respective age groups living below the poverty level.
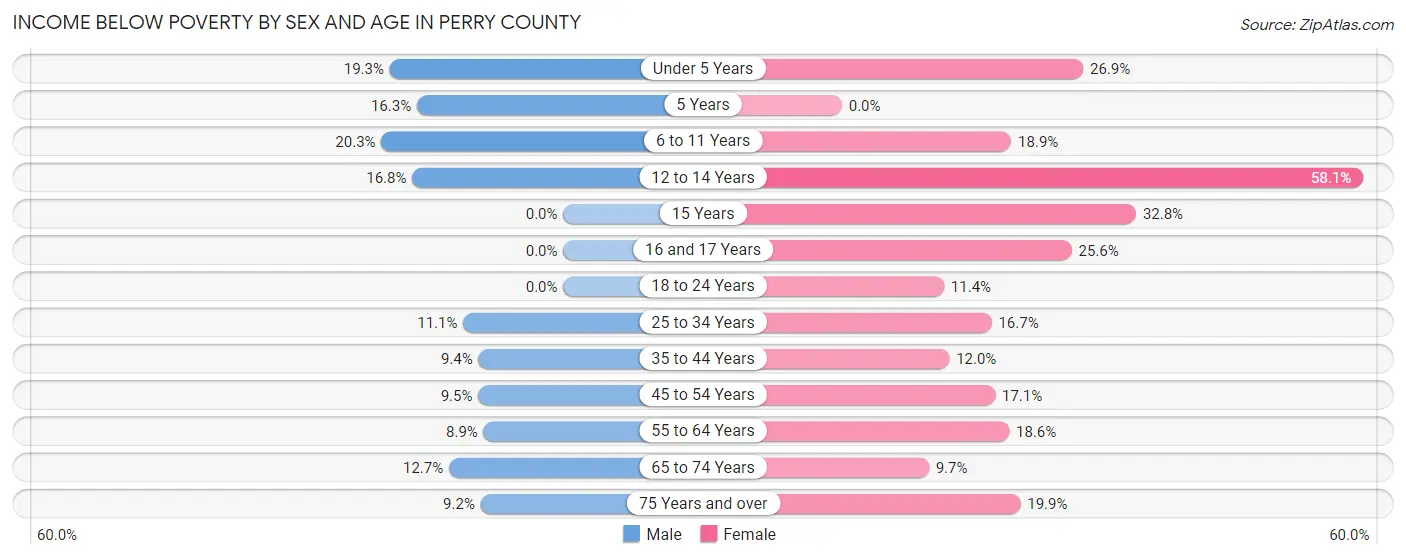
| Age Bracket | Male | Female |
| Under 5 Years | 52 (19.3%) | 61 (26.9%) |
| 5 Years | 15 (16.3%) | 0 (0.0%) |
| 6 to 11 Years | 46 (20.3%) | 63 (18.9%) |
| 12 to 14 Years | 36 (16.8%) | 54 (58.1%) |
| 15 Years | 0 (0.0%) | 38 (32.8%) |
| 16 and 17 Years | 0 (0.0%) | 54 (25.6%) |
| 18 to 24 Years | 0 (0.0%) | 34 (11.4%) |
| 25 to 34 Years | 42 (11.1%) | 83 (16.7%) |
| 35 to 44 Years | 42 (9.4%) | 61 (12.0%) |
| 45 to 54 Years | 48 (9.5%) | 78 (17.1%) |
| 55 to 64 Years | 51 (8.9%) | 98 (18.6%) |
| 65 to 74 Years | 62 (12.7%) | 48 (9.7%) |
| 75 Years and over | 39 (9.2%) | 67 (19.9%) |
| Total | 433 (10.6%) | 739 (17.8%) |
Income Above Poverty by Sex and Age in Perry County
According to the poverty statistics in Perry County, males aged 16 and 17 years and females aged 5 years are the age groups that are most secure financially, with 100.0% of males and 100.0% of females in these age groups living above the poverty line.
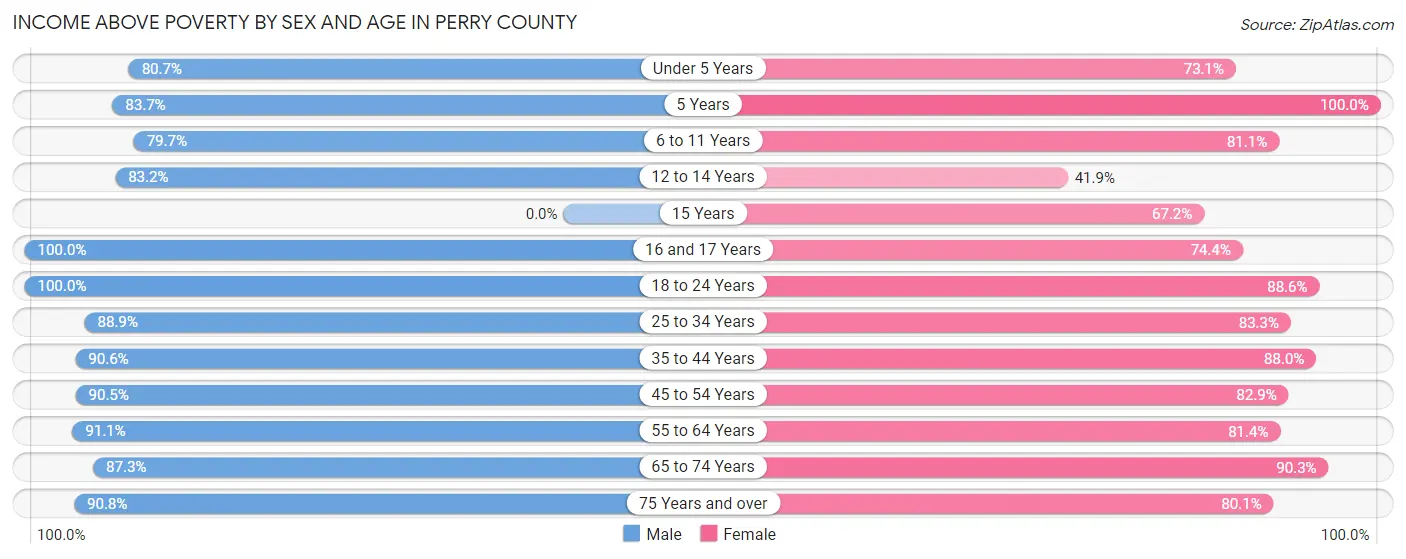
| Age Bracket | Male | Female |
| Under 5 Years | 217 (80.7%) | 166 (73.1%) |
| 5 Years | 77 (83.7%) | 36 (100.0%) |
| 6 to 11 Years | 181 (79.7%) | 271 (81.1%) |
| 12 to 14 Years | 178 (83.2%) | 39 (41.9%) |
| 15 Years | 0 (0.0%) | 78 (67.2%) |
| 16 and 17 Years | 19 (100.0%) | 157 (74.4%) |
| 18 to 24 Years | 453 (100.0%) | 265 (88.6%) |
| 25 to 34 Years | 335 (88.9%) | 415 (83.3%) |
| 35 to 44 Years | 403 (90.6%) | 449 (88.0%) |
| 45 to 54 Years | 459 (90.5%) | 379 (82.9%) |
| 55 to 64 Years | 524 (91.1%) | 428 (81.4%) |
| 65 to 74 Years | 425 (87.3%) | 448 (90.3%) |
| 75 Years and over | 385 (90.8%) | 270 (80.1%) |
| Total | 3,656 (89.4%) | 3,401 (82.2%) |
Income Below Poverty Among Married-Couple Families in Perry County
The poverty statistics for married-couple families in Perry County show that 6.7% or 128 of the total 1,901 families live below the poverty line. Families with 3 or 4 children have the highest poverty rate of 38.8%, comprising of 47 families. On the other hand, families with 5 or more children have the lowest poverty rate of 0.0%, which includes 0 families.
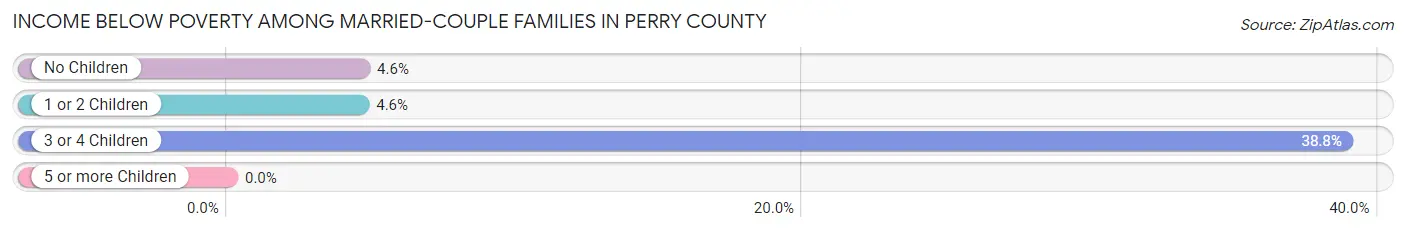
| Children | Above Poverty | Below Poverty |
| No Children | 1,307 (95.4%) | 63 (4.6%) |
| 1 or 2 Children | 376 (95.4%) | 18 (4.6%) |
| 3 or 4 Children | 74 (61.2%) | 47 (38.8%) |
| 5 or more Children | 16 (100.0%) | 0 (0.0%) |
| Total | 1,773 (93.3%) | 128 (6.7%) |
Income Below Poverty Among Single-Parent Households in Perry County
According to the poverty data in Perry County, 7.6% or 15 single-father households and 39.7% or 48 single-mother households are living below the poverty line. Among single-father households, those with no children have the highest poverty rate, with 15 households (9.5%) experiencing poverty. Likewise, among single-mother households, those with 1 or 2 children have the highest poverty rate, with 40 households (67.8%) falling below the poverty line.
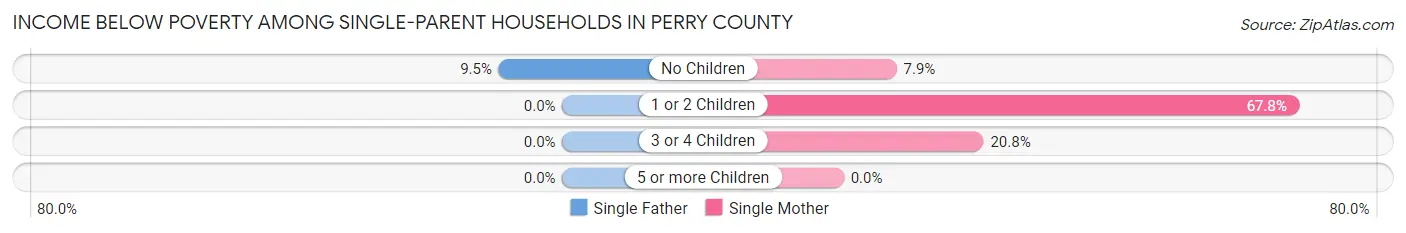
| Children | Single Father | Single Mother |
| No Children | 15 (9.5%) | 3 (7.9%) |
| 1 or 2 Children | 0 (0.0%) | 40 (67.8%) |
| 3 or 4 Children | 0 (0.0%) | 5 (20.8%) |
| 5 or more Children | 0 (0.0%) | 0 (0.0%) |
| Total | 15 (7.6%) | 48 (39.7%) |
Income Below Poverty Among Married-Couple vs Single-Parent Households in Perry County
The poverty data for Perry County shows that 128 of the married-couple family households (6.7%) and 63 of the single-parent households (19.8%) are living below the poverty level. Within the married-couple family households, those with 3 or 4 children have the highest poverty rate, with 47 households (38.8%) falling below the poverty line. Among the single-parent households, those with 1 or 2 children have the highest poverty rate, with 40 household (40.8%) living below poverty.
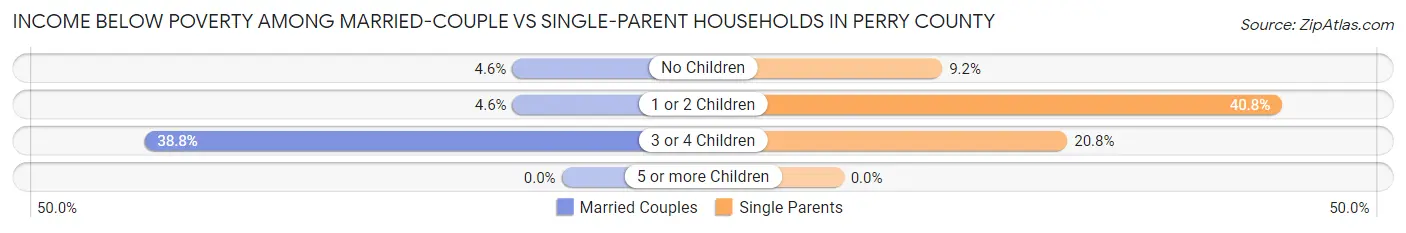
| Children | Married-Couple Families | Single-Parent Households |
| No Children | 63 (4.6%) | 18 (9.2%) |
| 1 or 2 Children | 18 (4.6%) | 40 (40.8%) |
| 3 or 4 Children | 47 (38.8%) | 5 (20.8%) |
| 5 or more Children | 0 (0.0%) | 0 (0.0%) |
| Total | 128 (6.7%) | 63 (19.8%) |
Race in Perry County
The most populous races in Perry County are White / Caucasian (7,700 | 91.3%), Two or more Races (420 | 5.0%), and Asian (186 | 2.2%).
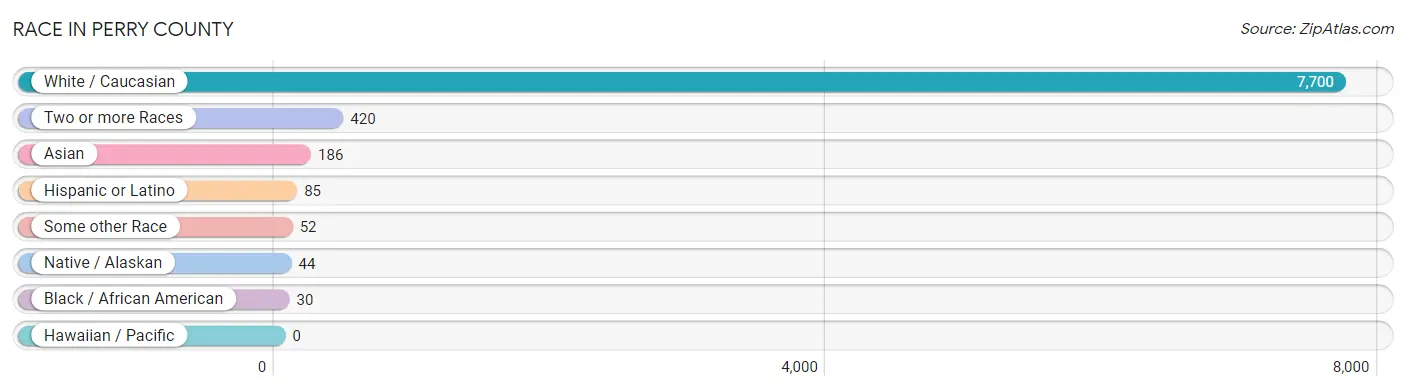
| Race | # Population | % Population |
| Asian | 186 | 2.2% |
| Black / African American | 30 | 0.4% |
| Hawaiian / Pacific | 0 | 0.0% |
| Hispanic or Latino | 85 | 1.0% |
| Native / Alaskan | 44 | 0.5% |
| White / Caucasian | 7,700 | 91.3% |
| Two or more Races | 420 | 5.0% |
| Some other Race | 52 | 0.6% |
| Total | 8,432 | 100.0% |
Ancestry in Perry County
The most populous ancestries reported in Perry County are American (1,977 | 23.4%), German (1,095 | 13.0%), Irish (671 | 8.0%), English (614 | 7.3%), and European (207 | 2.5%), together accounting for 54.1% of all Perry County residents.
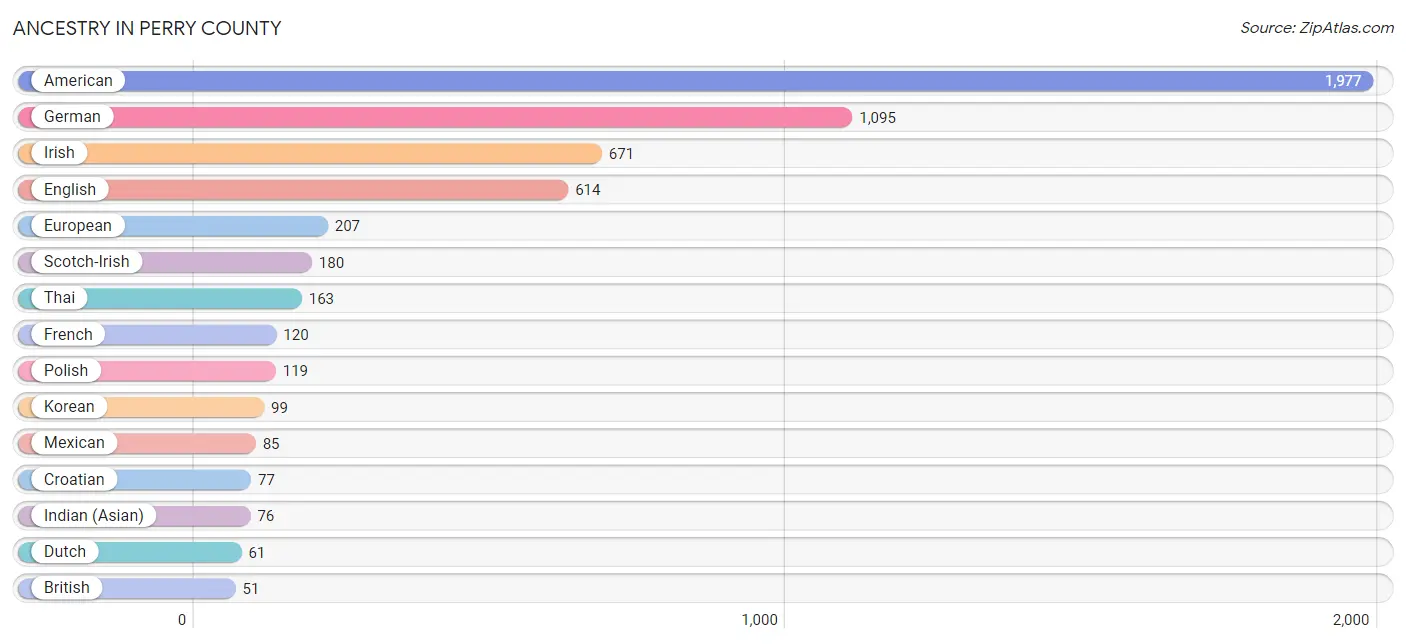
| Ancestry | # Population | % Population |
| African | 7 | 0.1% |
| American | 1,977 | 23.4% |
| Apache | 1 | 0.0% |
| British | 51 | 0.6% |
| Canadian | 8 | 0.1% |
| Cherokee | 1 | 0.0% |
| Croatian | 77 | 0.9% |
| Czech | 37 | 0.4% |
| Dutch | 61 | 0.7% |
| English | 614 | 7.3% |
| European | 207 | 2.5% |
| French | 120 | 1.4% |
| German | 1,095 | 13.0% |
| Houma | 44 | 0.5% |
| Hungarian | 47 | 0.6% |
| Indian (Asian) | 76 | 0.9% |
| Irish | 671 | 8.0% |
| Italian | 35 | 0.4% |
| Korean | 99 | 1.2% |
| Mexican | 85 | 1.0% |
| Norwegian | 29 | 0.3% |
| Pennsylvania German | 9 | 0.1% |
| Polish | 119 | 1.4% |
| Portuguese | 6 | 0.1% |
| Russian | 10 | 0.1% |
| Scandinavian | 9 | 0.1% |
| Scotch-Irish | 180 | 2.1% |
| Scottish | 45 | 0.5% |
| Subsaharan African | 7 | 0.1% |
| Swedish | 9 | 0.1% |
| Swiss | 6 | 0.1% |
| Thai | 163 | 1.9% |
| Turkish | 26 | 0.3% |
| Ukrainian | 8 | 0.1% |
| Welsh | 10 | 0.1% | View All 35 Rows |
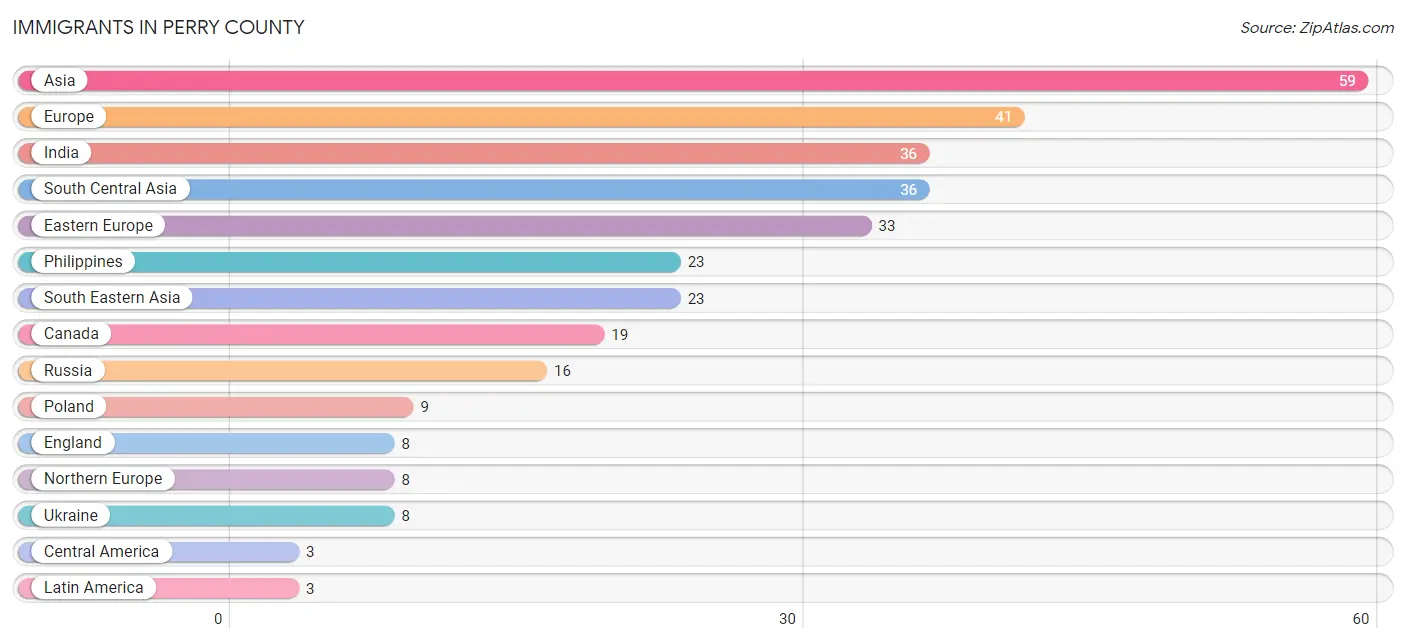
Immigrants in Perry County
The most numerous immigrant groups reported in Perry County came from Asia (59 | 0.7%), Europe (41 | 0.5%), India (36 | 0.4%), South Central Asia (36 | 0.4%), and Eastern Europe (33 | 0.4%), together accounting for 2.4% of all Perry County residents.
| Immigration Origin | # Population | % Population |
| Asia | 59 | 0.7% |
| Canada | 19 | 0.2% |
| Central America | 3 | 0.0% |
| Eastern Europe | 33 | 0.4% |
| England | 8 | 0.1% |
| Europe | 41 | 0.5% |
| India | 36 | 0.4% |
| Latin America | 3 | 0.0% |
| Mexico | 3 | 0.0% |
| Northern Europe | 8 | 0.1% |
| Philippines | 23 | 0.3% |
| Poland | 9 | 0.1% |
| Russia | 16 | 0.2% |
| South Central Asia | 36 | 0.4% |
| South Eastern Asia | 23 | 0.3% |
| Ukraine | 8 | 0.1% | View All 16 Rows |
Sex and Age in Perry County
Sex and Age in Perry County
The most populous age groups in Perry County are 60 to 64 Years (399 | 9.5%) for men and 15 to 19 Years (381 | 9.0%) for women.
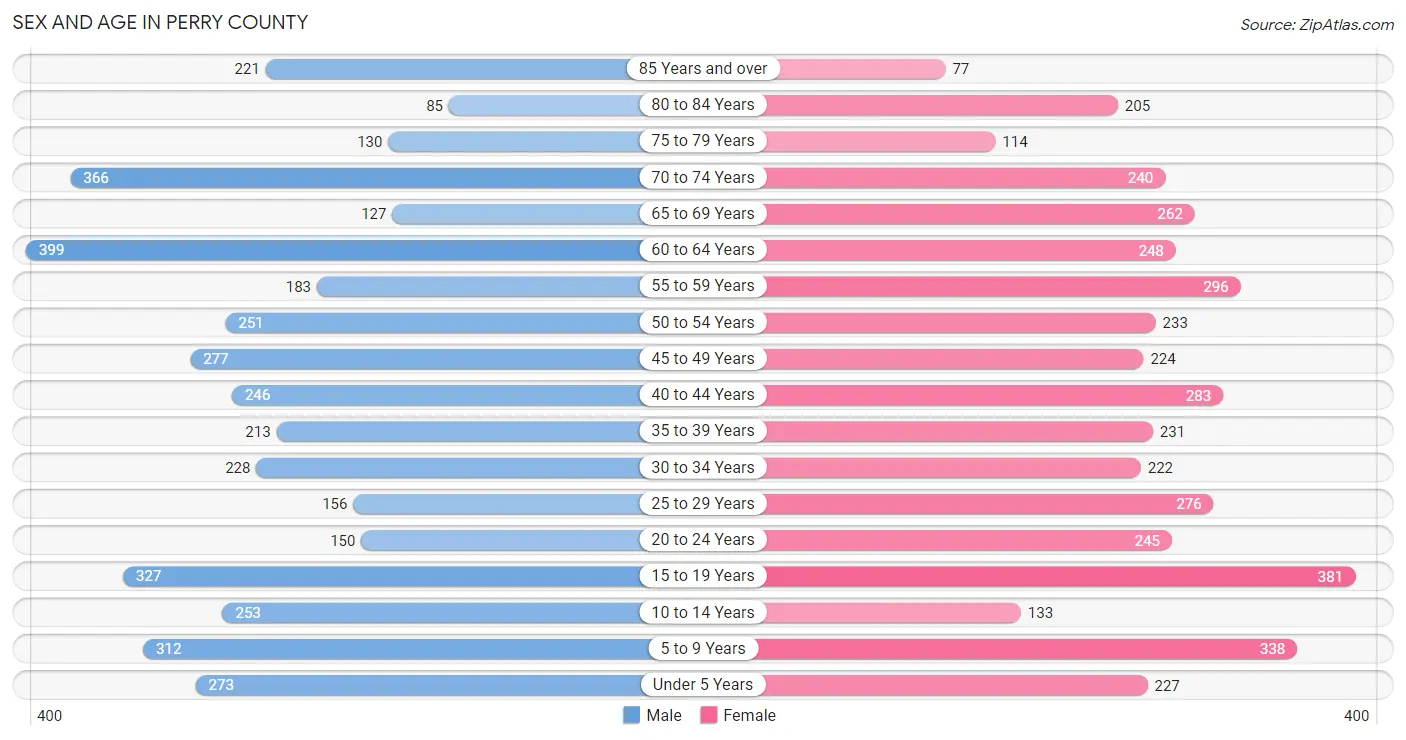
| Age Bracket | Male | Female |
| Under 5 Years | 273 (6.5%) | 227 (5.4%) |
| 5 to 9 Years | 312 (7.4%) | 338 (8.0%) |
| 10 to 14 Years | 253 (6.0%) | 133 (3.1%) |
| 15 to 19 Years | 327 (7.8%) | 381 (9.0%) |
| 20 to 24 Years | 150 (3.6%) | 245 (5.8%) |
| 25 to 29 Years | 156 (3.7%) | 276 (6.5%) |
| 30 to 34 Years | 228 (5.4%) | 222 (5.2%) |
| 35 to 39 Years | 213 (5.1%) | 231 (5.4%) |
| 40 to 44 Years | 246 (5.9%) | 283 (6.7%) |
| 45 to 49 Years | 277 (6.6%) | 224 (5.3%) |
| 50 to 54 Years | 251 (6.0%) | 233 (5.5%) |
| 55 to 59 Years | 183 (4.4%) | 296 (7.0%) |
| 60 to 64 Years | 399 (9.5%) | 248 (5.9%) |
| 65 to 69 Years | 127 (3.0%) | 262 (6.2%) |
| 70 to 74 Years | 366 (8.7%) | 240 (5.7%) |
| 75 to 79 Years | 130 (3.1%) | 114 (2.7%) |
| 80 to 84 Years | 85 (2.0%) | 205 (4.8%) |
| 85 Years and over | 221 (5.3%) | 77 (1.8%) |
| Total | 4,197 (100.0%) | 4,235 (100.0%) |
Families and Households in Perry County
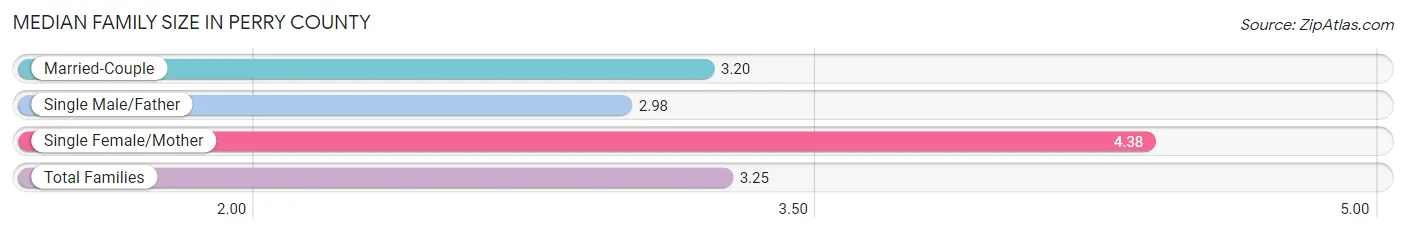
Median Family Size in Perry County
The median family size in Perry County is 3.25 persons per family, with single female/mother families (121 | 5.4%) accounting for the largest median family size of 4.38 persons per family. On the other hand, single male/father families (197 | 8.9%) represent the smallest median family size with 2.98 persons per family.
| Family Type | # Families | Family Size |
| Married-Couple | 1,901 (85.7%) | 3.20 |
| Single Male/Father | 197 (8.9%) | 2.98 |
| Single Female/Mother | 121 (5.4%) | 4.38 |
| Total Families | 2,219 (100.0%) | 3.25 |
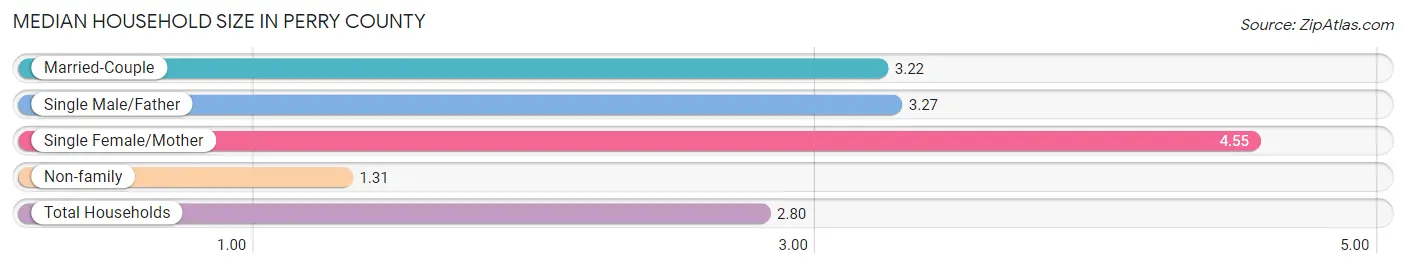
Median Household Size in Perry County
The median household size in Perry County is 2.80 persons per household, with single female/mother households (121 | 4.1%) accounting for the largest median household size of 4.55 persons per household. non-family households (735 | 24.9%) represent the smallest median household size with 1.31 persons per household.
| Household Type | # Households | Household Size |
| Married-Couple | 1,901 (64.3%) | 3.22 |
| Single Male/Father | 197 (6.7%) | 3.27 |
| Single Female/Mother | 121 (4.1%) | 4.55 |
| Non-family | 735 (24.9%) | 1.31 |
| Total Households | 2,954 (100.0%) | 2.80 |
Household Size by Marriage Status in Perry County
Out of a total of 2,954 households in Perry County, 2,219 (75.1%) are family households, while 735 (24.9%) are nonfamily households. The most numerous type of family households are 2-person households, comprising 1,256, and the most common type of nonfamily households are 1-person households, comprising 639.
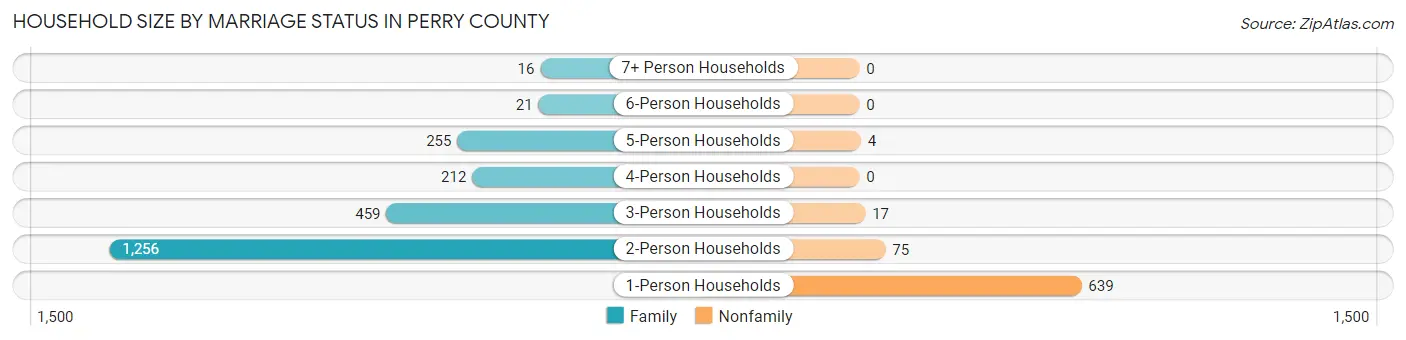
| Household Size | Family Households | Nonfamily Households |
| 1-Person Households | - | 639 (21.6%) |
| 2-Person Households | 1,256 (42.5%) | 75 (2.5%) |
| 3-Person Households | 459 (15.5%) | 17 (0.6%) |
| 4-Person Households | 212 (7.2%) | 0 (0.0%) |
| 5-Person Households | 255 (8.6%) | 4 (0.1%) |
| 6-Person Households | 21 (0.7%) | 0 (0.0%) |
| 7+ Person Households | 16 (0.5%) | 0 (0.0%) |
| Total | 2,219 (75.1%) | 735 (24.9%) |
Female Fertility in Perry County
Fertility by Age in Perry County
Average fertility rate in Perry County is 54.0 births per 1,000 women. Women in the age bracket of 20 to 34 years have the highest fertility rate with 116.0 births per 1,000 women. Women in the age bracket of 20 to 34 years acount for 84.3% of all women with births.
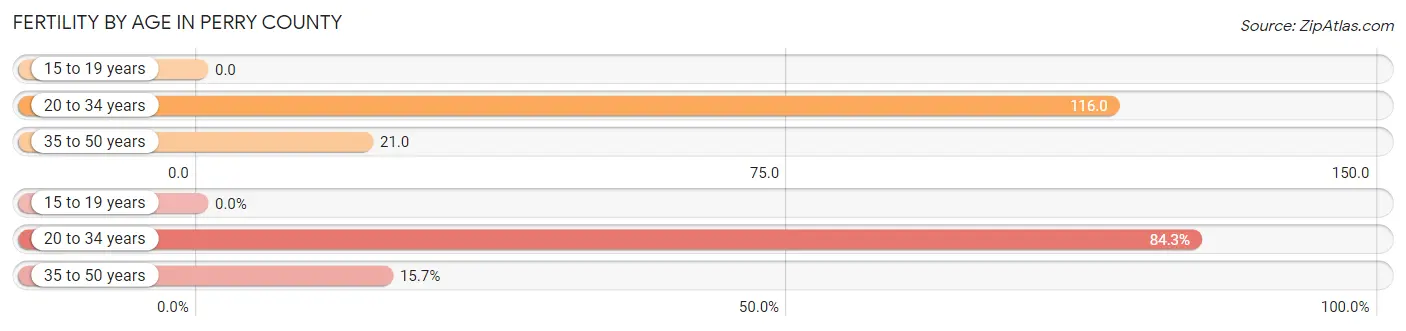
| Age Bracket | Women with Births | Births / 1,000 Women |
| 15 to 19 years | 0 (0.0%) | 0.0 |
| 20 to 34 years | 86 (84.3%) | 116.0 |
| 35 to 50 years | 16 (15.7%) | 21.0 |
| Total | 102 (100.0%) | 54.0 |
Fertility by Age by Marriage Status in Perry County
96.1% of women with births (102) in Perry County are married. The highest percentage of unmarried women with births falls into 20 to 34 years age bracket with 4.6% of them unmarried at the time of birth, while the lowest percentage of unmarried women with births belong to 35 to 50 years age bracket with 0.0% of them unmarried.
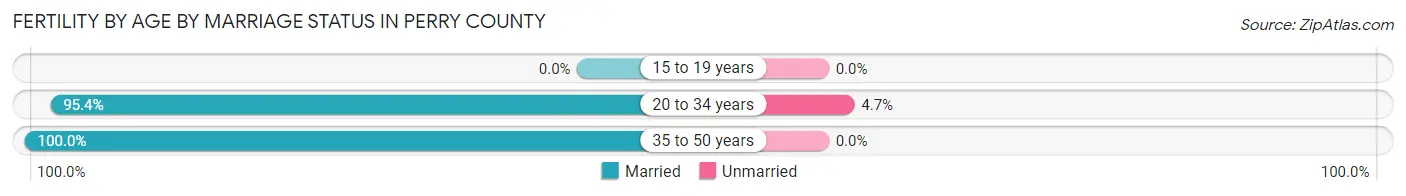
| Age Bracket | Married | Unmarried |
| 15 to 19 years | 0 (0.0%) | 0 (0.0%) |
| 20 to 34 years | 82 (95.4%) | 4 (4.6%) |
| 35 to 50 years | 16 (100.0%) | 0 (0.0%) |
| Total | 98 (96.1%) | 4 (3.9%) |
Fertility by Education in Perry County
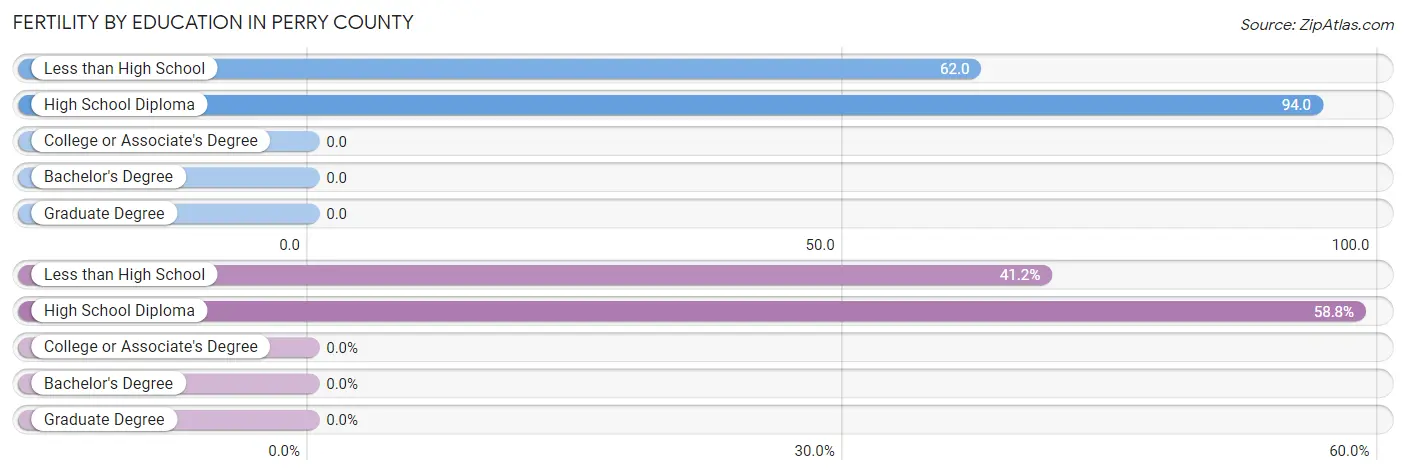
| Educational Attainment | Women with Births | Births / 1,000 Women |
| Less than High School | 42 (41.2%) | 62.0 |
| High School Diploma | 60 (58.8%) | 94.0 |
| College or Associate's Degree | 0 (0.0%) | 0.0 |
| Bachelor's Degree | 0 (0.0%) | 0.0 |
| Graduate Degree | 0 (0.0%) | 0.0 |
| Total | 102 (100.0%) | 54.0 |
Fertility by Education by Marriage Status in Perry County
3.9% of women with births in Perry County are unmarried. Women with the educational attainment of less than high school are most likely to be married with 100.0% of them married at childbirth, while women with the educational attainment of high school diploma are least likely to be married with 6.7% of them unmarried at childbirth.
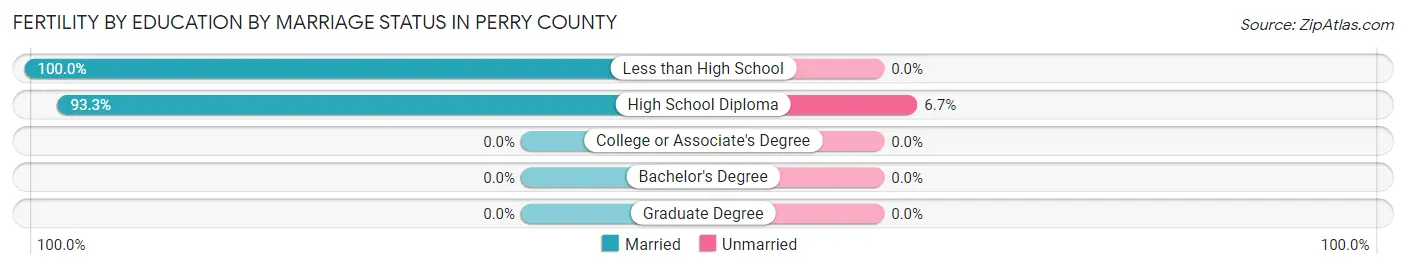
| Educational Attainment | Married | Unmarried |
| Less than High School | 42 (100.0%) | 0 (0.0%) |
| High School Diploma | 56 (93.3%) | 4 (6.7%) |
| College or Associate's Degree | 0 (0.0%) | 0 (0.0%) |
| Bachelor's Degree | 0 (0.0%) | 0 (0.0%) |
| Graduate Degree | 0 (0.0%) | 0 (0.0%) |
| Total | 98 (96.1%) | 4 (3.9%) |
Employment Characteristics in Perry County
Employment by Class of Employer in Perry County
Among the 3,057 employed individuals in Perry County, private company employees (2,001 | 65.5%), self-employed (not incorporated) (374 | 12.2%), and state government employees (252 | 8.2%) make up the most common classes of employment.
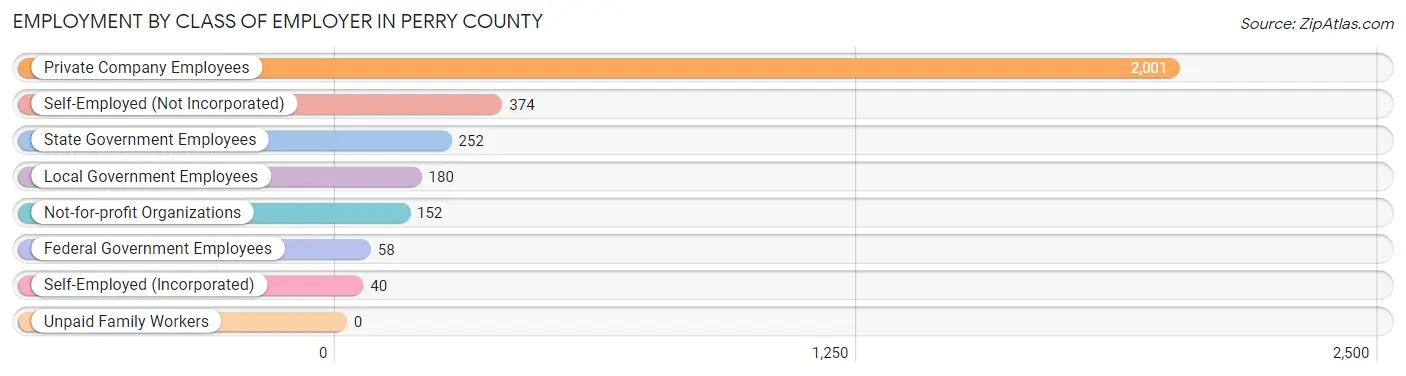
| Employer Class | # Employees | % Employees |
| Private Company Employees | 2,001 | 65.5% |
| Self-Employed (Incorporated) | 40 | 1.3% |
| Self-Employed (Not Incorporated) | 374 | 12.2% |
| Not-for-profit Organizations | 152 | 5.0% |
| Local Government Employees | 180 | 5.9% |
| State Government Employees | 252 | 8.2% |
| Federal Government Employees | 58 | 1.9% |
| Unpaid Family Workers | 0 | 0.0% |
| Total | 3,057 | 100.0% |
Employment Status by Age in Perry County
According to the labor force statistics for Perry County, out of the total population over 16 years of age (6,780), 51.3% or 3,478 individuals are in the labor force, with 10.9% or 379 of them unemployed. The age group with the highest labor force participation rate is 35 to 44 years, with 82.3% or 801 individuals in the labor force. Within the labor force, the 30 to 34 years age range has the highest percentage of unemployed individuals, with 30.2% or 79 of them being unemployed.
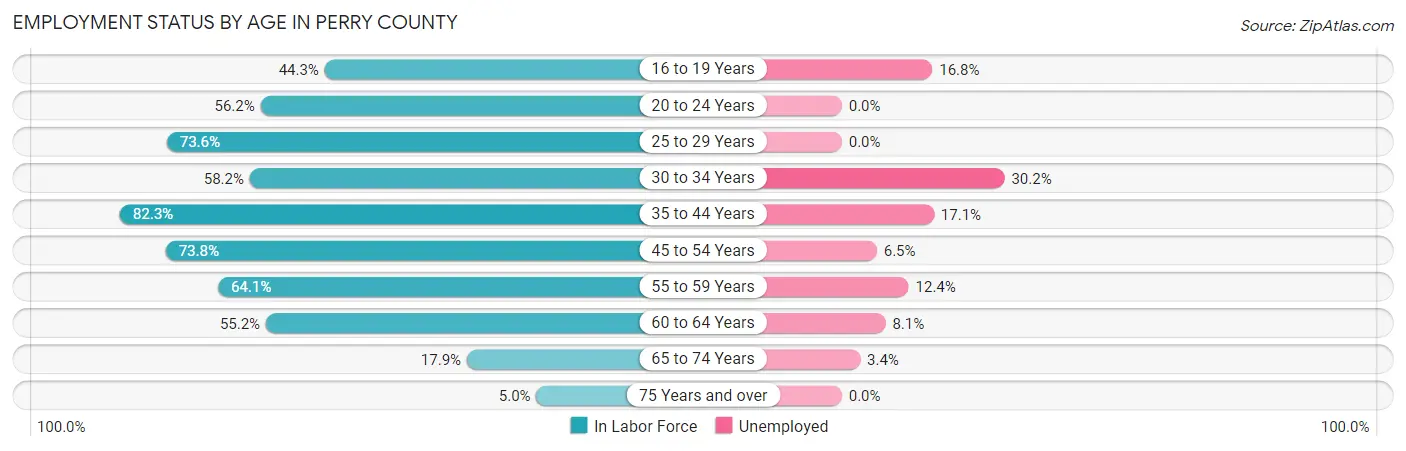
| Age Bracket | In Labor Force | Unemployed |
| 16 to 19 Years | 262 (44.3%) | 44 (16.8%) |
| 20 to 24 Years | 222 (56.2%) | 0 (0.0%) |
| 25 to 29 Years | 318 (73.6%) | 0 (0.0%) |
| 30 to 34 Years | 262 (58.2%) | 79 (30.2%) |
| 35 to 44 Years | 801 (82.3%) | 137 (17.1%) |
| 45 to 54 Years | 727 (73.8%) | 47 (6.5%) |
| 55 to 59 Years | 307 (64.1%) | 38 (12.4%) |
| 60 to 64 Years | 357 (55.2%) | 29 (8.1%) |
| 65 to 74 Years | 178 (17.9%) | 6 (3.4%) |
| 75 Years and over | 42 (5.0%) | 0 (0.0%) |
| Total | 3,478 (51.3%) | 379 (10.9%) |
Employment Status by Educational Attainment in Perry County
According to labor force statistics for Perry County, 69.9% of individuals (2,772) out of the total population between 25 and 64 years of age (3,966) are in the labor force, with 11.9% or 330 of them being unemployed. The group with the highest labor force participation rate are those with the educational attainment of bachelor's degree or higher, with 85.2% or 392 individuals in the labor force. Within the labor force, individuals with high school diploma education have the highest percentage of unemployment, with 18.3% or 243 of them being unemployed.
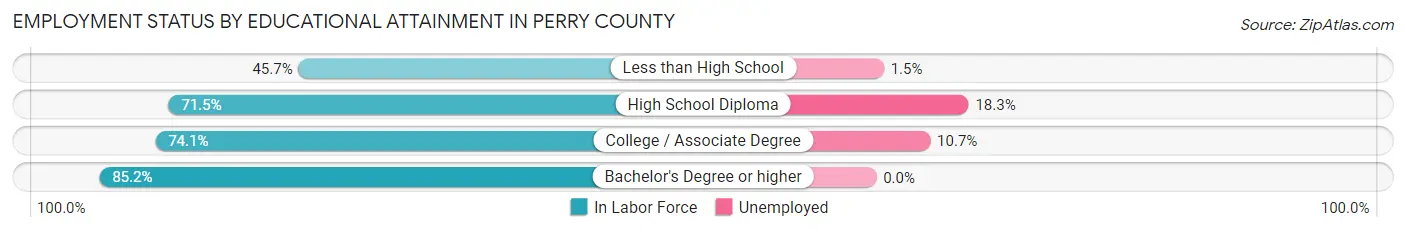
| Educational Attainment | In Labor Force | Unemployed |
| Less than High School | 274 (45.7%) | 9 (1.5%) |
| High School Diploma | 1,326 (71.5%) | 339 (18.3%) |
| College / Associate Degree | 779 (74.1%) | 112 (10.7%) |
| Bachelor's Degree or higher | 392 (85.2%) | 0 (0.0%) |
| Total | 2,772 (69.9%) | 472 (11.9%) |
Employment Occupations by Sex in Perry County
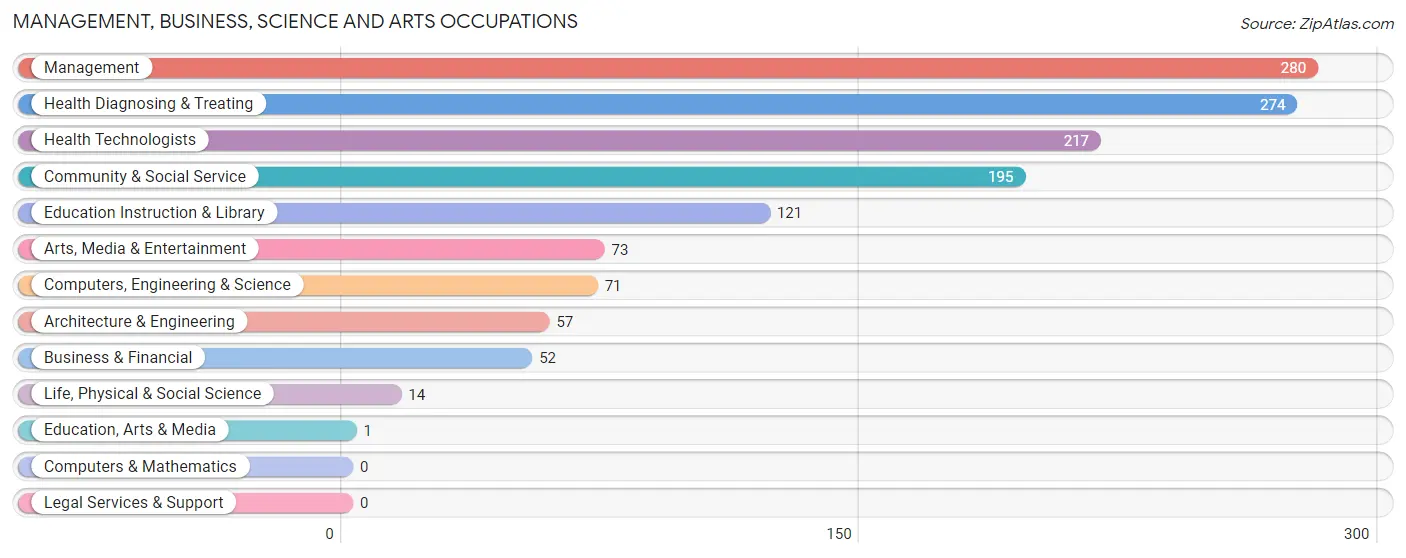
Management, Business, Science and Arts Occupations
The most common Management, Business, Science and Arts occupations in Perry County are Management (280 | 9.0%), Health Diagnosing & Treating (274 | 8.8%), Health Technologists (217 | 7.0%), Community & Social Service (195 | 6.3%), and Education Instruction & Library (121 | 3.9%).
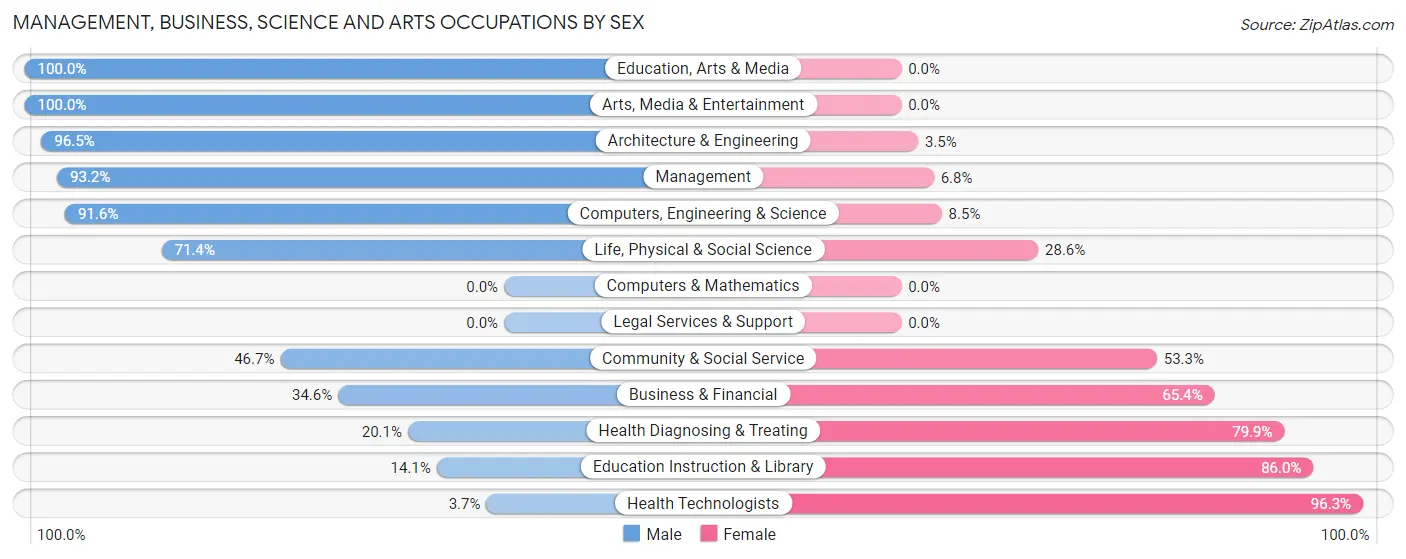
Management, Business, Science and Arts Occupations by Sex
Within the Management, Business, Science and Arts occupations in Perry County, the most male-oriented occupations are Education, Arts & Media (100.0%), Arts, Media & Entertainment (100.0%), and Architecture & Engineering (96.5%), while the most female-oriented occupations are Health Technologists (96.3%), Education Instruction & Library (86.0%), and Health Diagnosing & Treating (79.9%).
| Occupation | Male | Female |
| Management | 261 (93.2%) | 19 (6.8%) |
| Business & Financial | 18 (34.6%) | 34 (65.4%) |
| Computers, Engineering & Science | 65 (91.5%) | 6 (8.5%) |
| Computers & Mathematics | 0 (0.0%) | 0 (0.0%) |
| Architecture & Engineering | 55 (96.5%) | 2 (3.5%) |
| Life, Physical & Social Science | 10 (71.4%) | 4 (28.6%) |
| Community & Social Service | 91 (46.7%) | 104 (53.3%) |
| Education, Arts & Media | 1 (100.0%) | 0 (0.0%) |
| Legal Services & Support | 0 (0.0%) | 0 (0.0%) |
| Education Instruction & Library | 17 (14.1%) | 104 (86.0%) |
| Arts, Media & Entertainment | 73 (100.0%) | 0 (0.0%) |
| Health Diagnosing & Treating | 55 (20.1%) | 219 (79.9%) |
| Health Technologists | 8 (3.7%) | 209 (96.3%) |
| Total (Category) | 490 (56.2%) | 382 (43.8%) |
| Total (Overall) | 1,647 (53.2%) | 1,449 (46.8%) |
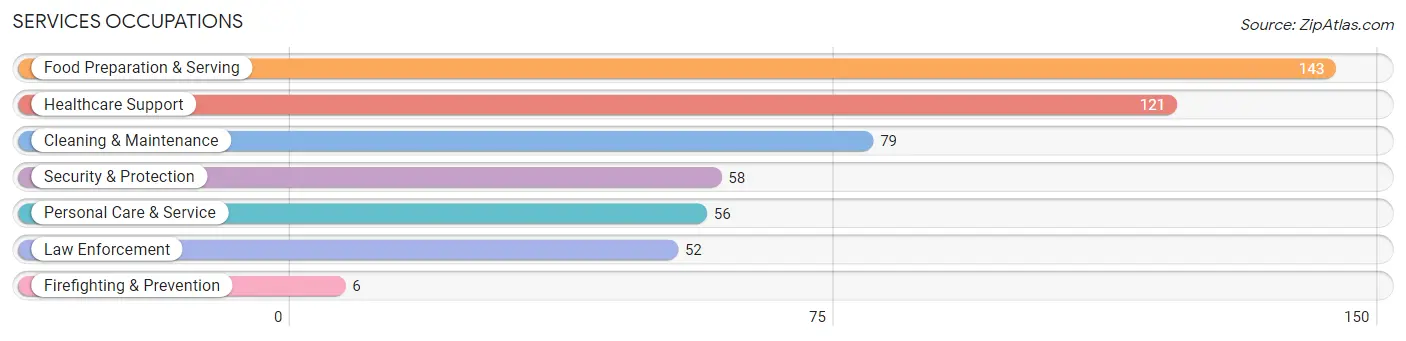
Services Occupations
The most common Services occupations in Perry County are Food Preparation & Serving (143 | 4.6%), Healthcare Support (121 | 3.9%), Cleaning & Maintenance (79 | 2.5%), Security & Protection (58 | 1.9%), and Personal Care & Service (56 | 1.8%).
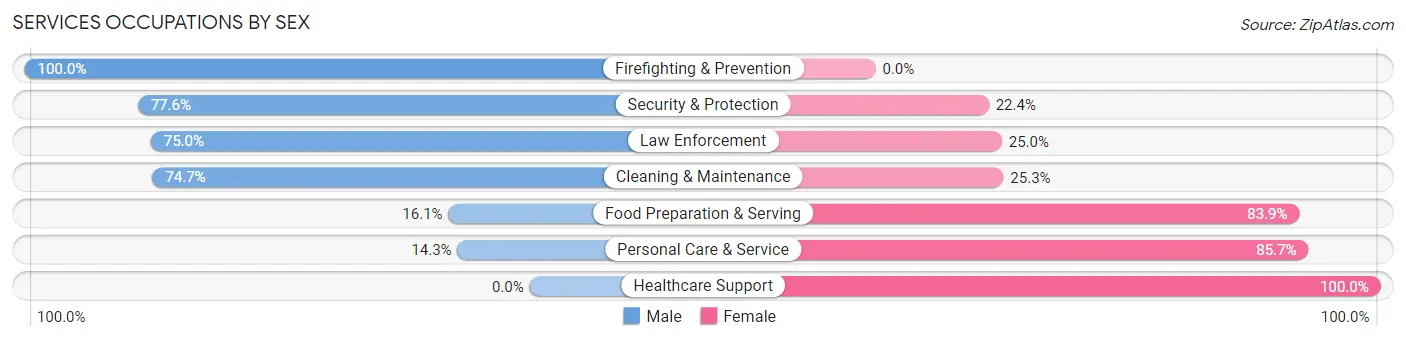
Services Occupations by Sex
Within the Services occupations in Perry County, the most male-oriented occupations are Firefighting & Prevention (100.0%), Security & Protection (77.6%), and Law Enforcement (75.0%), while the most female-oriented occupations are Healthcare Support (100.0%), Personal Care & Service (85.7%), and Food Preparation & Serving (83.9%).
| Occupation | Male | Female |
| Healthcare Support | 0 (0.0%) | 121 (100.0%) |
| Security & Protection | 45 (77.6%) | 13 (22.4%) |
| Firefighting & Prevention | 6 (100.0%) | 0 (0.0%) |
| Law Enforcement | 39 (75.0%) | 13 (25.0%) |
| Food Preparation & Serving | 23 (16.1%) | 120 (83.9%) |
| Cleaning & Maintenance | 59 (74.7%) | 20 (25.3%) |
| Personal Care & Service | 8 (14.3%) | 48 (85.7%) |
| Total (Category) | 135 (29.5%) | 322 (70.5%) |
| Total (Overall) | 1,647 (53.2%) | 1,449 (46.8%) |
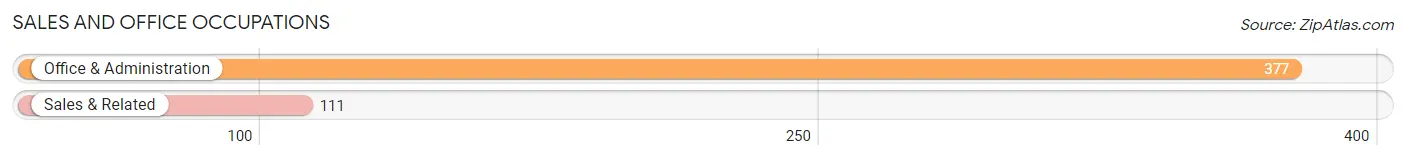
Sales and Office Occupations
The most common Sales and Office occupations in Perry County are Office & Administration (377 | 12.2%), and Sales & Related (111 | 3.6%).
Sales and Office Occupations by Sex
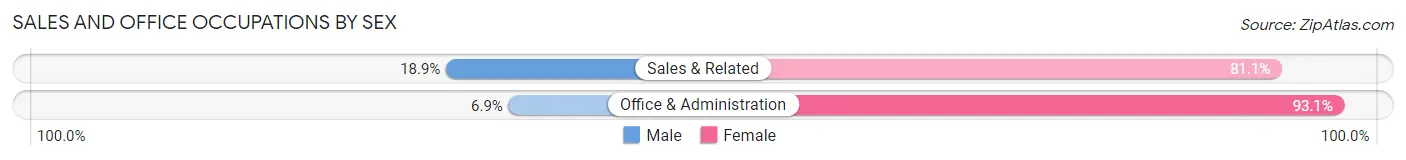
| Occupation | Male | Female |
| Sales & Related | 21 (18.9%) | 90 (81.1%) |
| Office & Administration | 26 (6.9%) | 351 (93.1%) |
| Total (Category) | 47 (9.6%) | 441 (90.4%) |
| Total (Overall) | 1,647 (53.2%) | 1,449 (46.8%) |
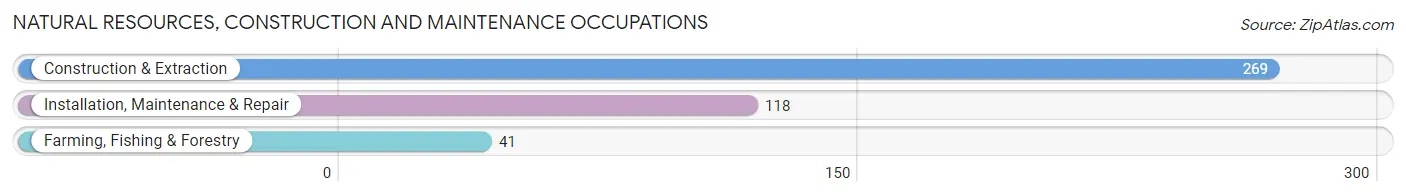
Natural Resources, Construction and Maintenance Occupations
The most common Natural Resources, Construction and Maintenance occupations in Perry County are Construction & Extraction (269 | 8.7%), Installation, Maintenance & Repair (118 | 3.8%), and Farming, Fishing & Forestry (41 | 1.3%).
Natural Resources, Construction and Maintenance Occupations by Sex
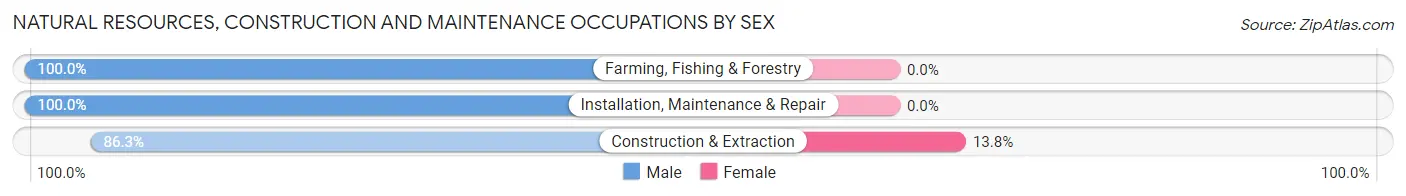
| Occupation | Male | Female |
| Farming, Fishing & Forestry | 41 (100.0%) | 0 (0.0%) |
| Construction & Extraction | 232 (86.3%) | 37 (13.8%) |
| Installation, Maintenance & Repair | 118 (100.0%) | 0 (0.0%) |
| Total (Category) | 391 (91.4%) | 37 (8.6%) |
| Total (Overall) | 1,647 (53.2%) | 1,449 (46.8%) |
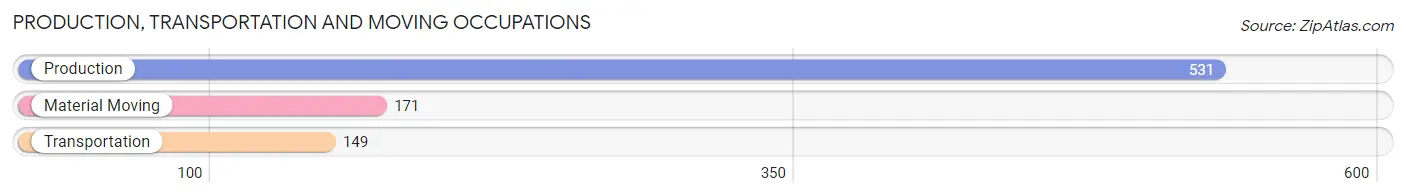
Production, Transportation and Moving Occupations
The most common Production, Transportation and Moving occupations in Perry County are Production (531 | 17.2%), Material Moving (171 | 5.5%), and Transportation (149 | 4.8%).
Production, Transportation and Moving Occupations by Sex
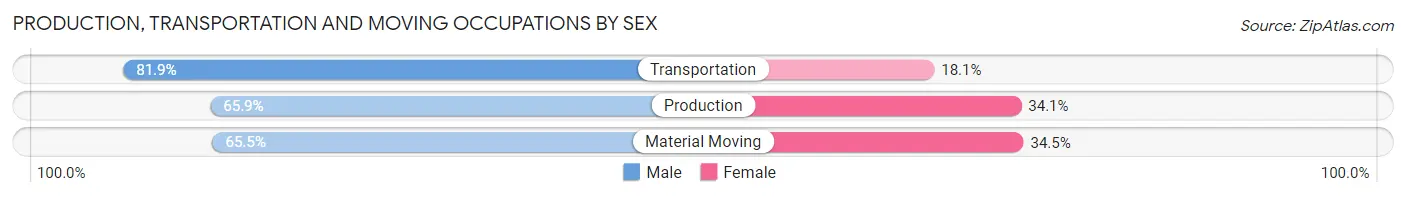
| Occupation | Male | Female |
| Production | 350 (65.9%) | 181 (34.1%) |
| Transportation | 122 (81.9%) | 27 (18.1%) |
| Material Moving | 112 (65.5%) | 59 (34.5%) |
| Total (Category) | 584 (68.6%) | 267 (31.4%) |
| Total (Overall) | 1,647 (53.2%) | 1,449 (46.8%) |
Employment Industries by Sex in Perry County
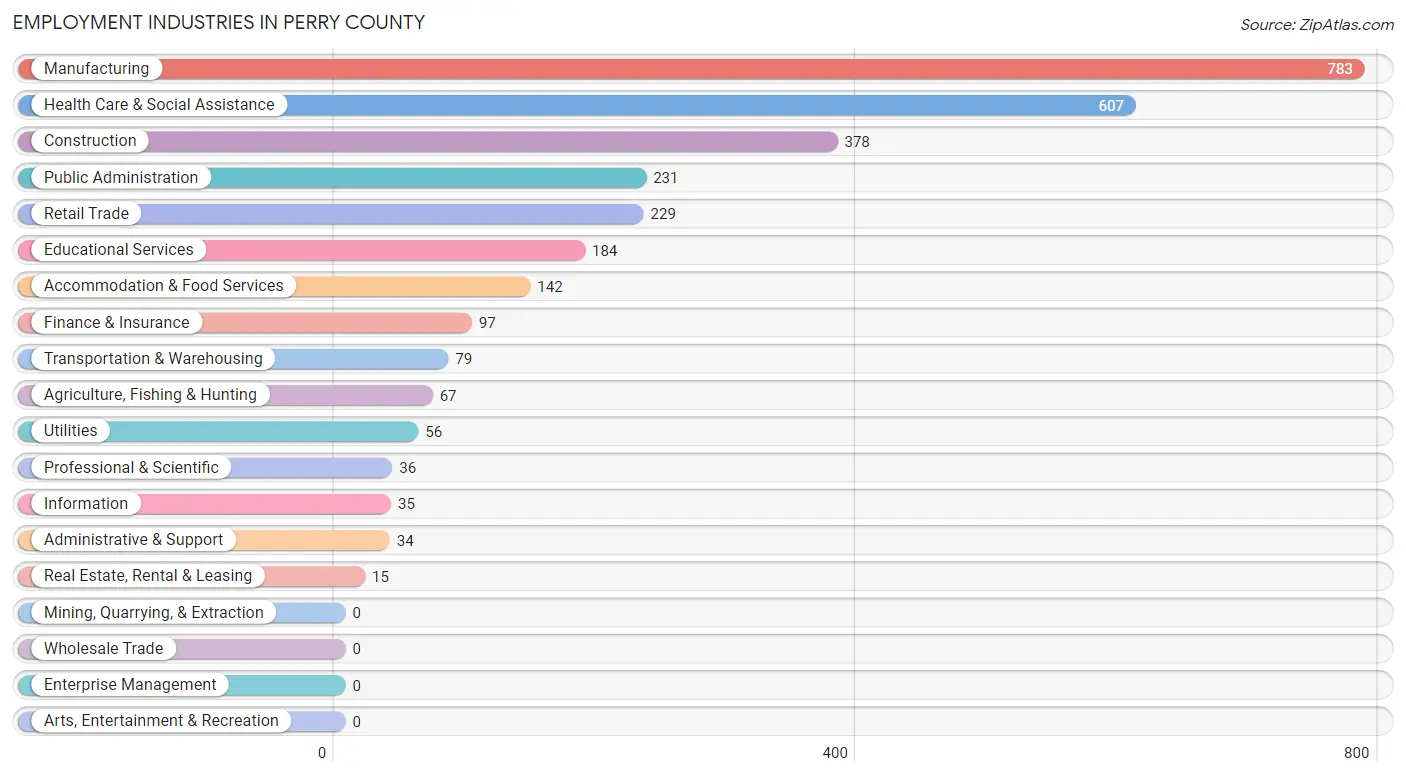
Employment Industries in Perry County
The major employment industries in Perry County include Manufacturing (783 | 25.3%), Health Care & Social Assistance (607 | 19.6%), Construction (378 | 12.2%), Public Administration (231 | 7.5%), and Retail Trade (229 | 7.4%).
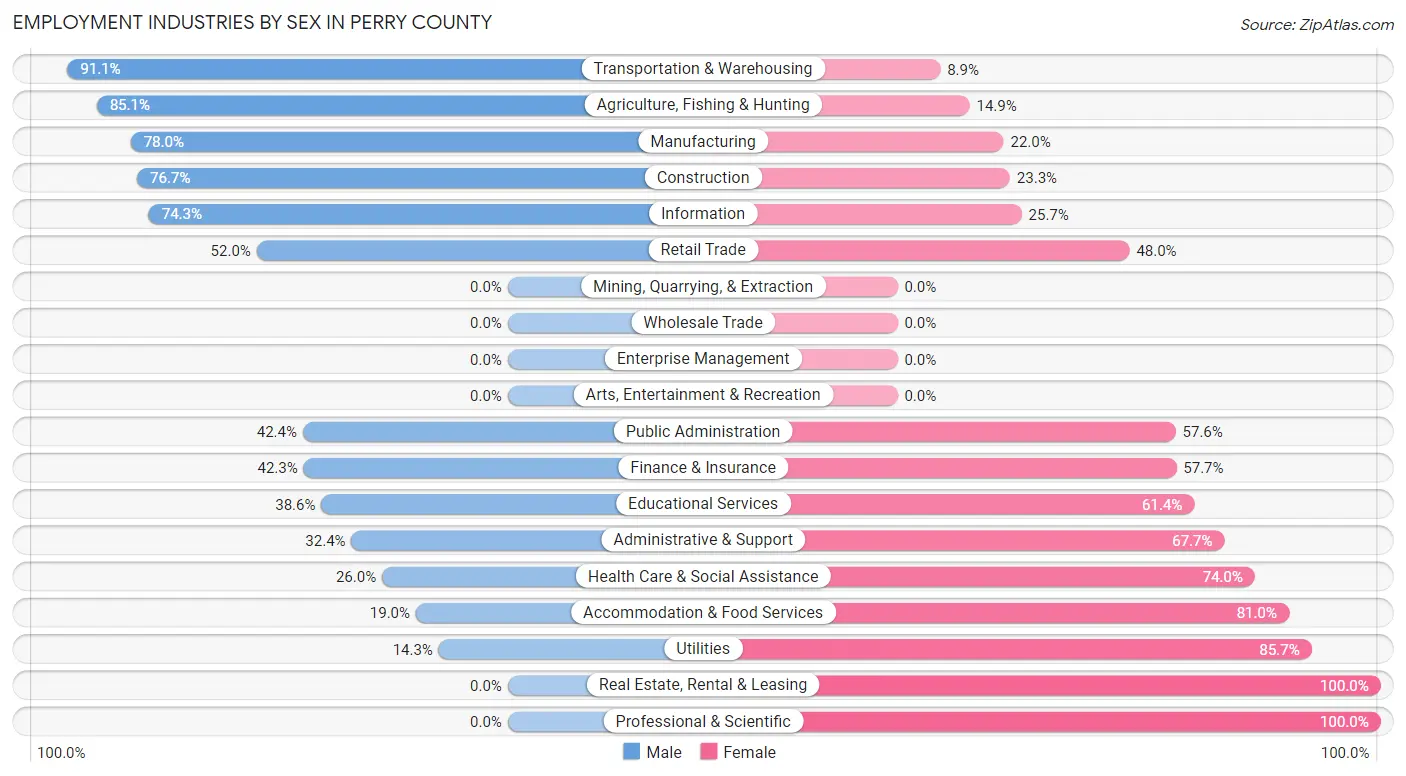
Employment Industries by Sex in Perry County
The Perry County industries that see more men than women are Transportation & Warehousing (91.1%), Agriculture, Fishing & Hunting (85.1%), and Manufacturing (78.0%), whereas the industries that tend to have a higher number of women are Real Estate, Rental & Leasing (100.0%), Professional & Scientific (100.0%), and Utilities (85.7%).
| Industry | Male | Female |
| Agriculture, Fishing & Hunting | 57 (85.1%) | 10 (14.9%) |
| Mining, Quarrying, & Extraction | 0 (0.0%) | 0 (0.0%) |
| Construction | 290 (76.7%) | 88 (23.3%) |
| Manufacturing | 611 (78.0%) | 172 (22.0%) |
| Wholesale Trade | 0 (0.0%) | 0 (0.0%) |
| Retail Trade | 119 (52.0%) | 110 (48.0%) |
| Transportation & Warehousing | 72 (91.1%) | 7 (8.9%) |
| Utilities | 8 (14.3%) | 48 (85.7%) |
| Information | 26 (74.3%) | 9 (25.7%) |
| Finance & Insurance | 41 (42.3%) | 56 (57.7%) |
| Real Estate, Rental & Leasing | 0 (0.0%) | 15 (100.0%) |
| Professional & Scientific | 0 (0.0%) | 36 (100.0%) |
| Enterprise Management | 0 (0.0%) | 0 (0.0%) |
| Administrative & Support | 11 (32.4%) | 23 (67.6%) |
| Educational Services | 71 (38.6%) | 113 (61.4%) |
| Health Care & Social Assistance | 158 (26.0%) | 449 (74.0%) |
| Arts, Entertainment & Recreation | 0 (0.0%) | 0 (0.0%) |
| Accommodation & Food Services | 27 (19.0%) | 115 (81.0%) |
| Public Administration | 98 (42.4%) | 133 (57.6%) |
| Total | 1,647 (53.2%) | 1,449 (46.8%) |
Education in Perry County
School Enrollment in Perry County
The most common levels of schooling among the 1,919 students in Perry County are high school (502 | 26.2%), elementary school (459 | 23.9%), and middle school (346 | 18.0%).
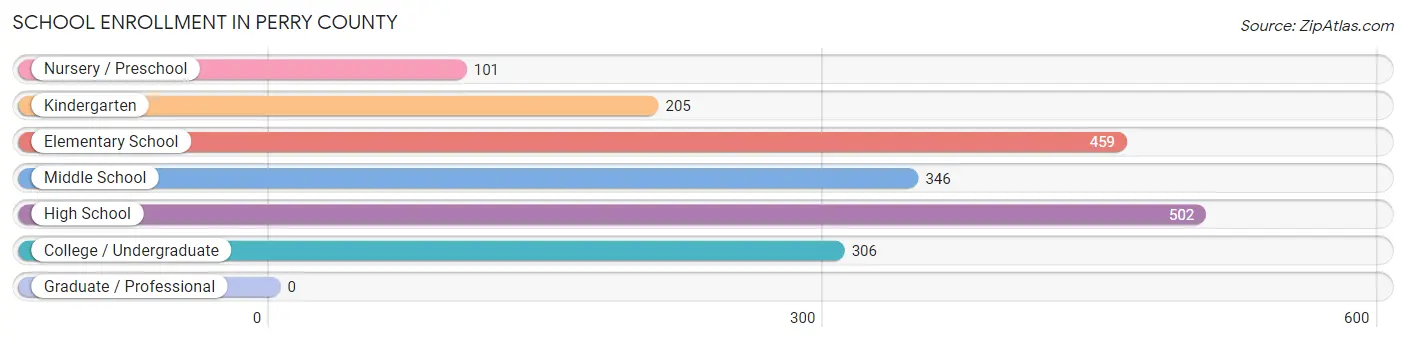
| School Level | # Students | % Students |
| Nursery / Preschool | 101 | 5.3% |
| Kindergarten | 205 | 10.7% |
| Elementary School | 459 | 23.9% |
| Middle School | 346 | 18.0% |
| High School | 502 | 26.2% |
| College / Undergraduate | 306 | 16.0% |
| Graduate / Professional | 0 | 0.0% |
| Total | 1,919 | 100.0% |
School Enrollment by Age by Funding Source in Perry County
Out of a total of 1,919 students who are enrolled in schools in Perry County, 351 (18.3%) attend a private institution, while the remaining 1,568 (81.7%) are enrolled in public schools. The age group of 10 to 14 year olds has the highest likelihood of being enrolled in private schools, with 129 (33.4% in the age bracket) enrolled. Conversely, the age group of 15 to 17 year olds has the lowest likelihood of being enrolled in a private school, with 237 (100.0% in the age bracket) attending a public institution.
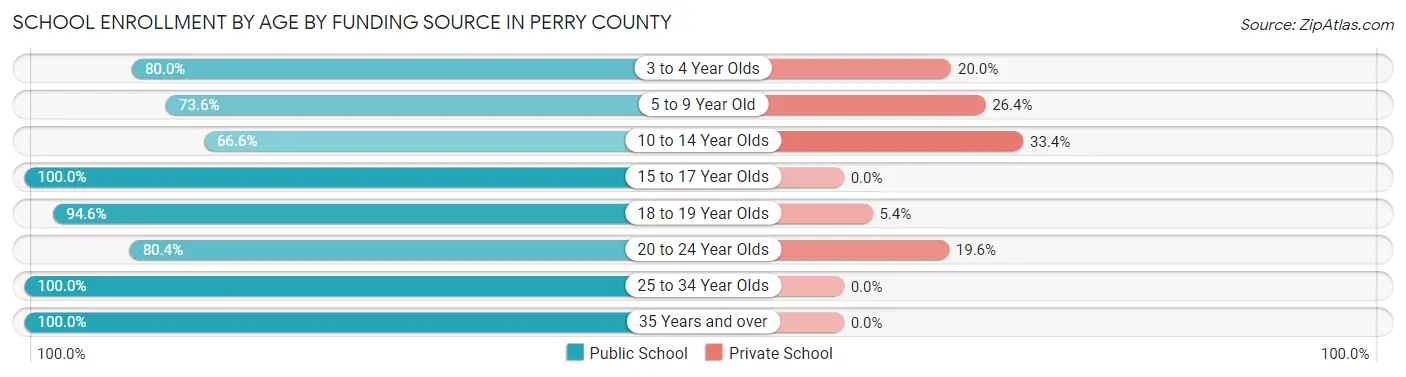
| Age Bracket | Public School | Private School |
| 3 to 4 Year Olds | 92 (80.0%) | 23 (20.0%) |
| 5 to 9 Year Old | 458 (73.6%) | 164 (26.4%) |
| 10 to 14 Year Olds | 257 (66.6%) | 129 (33.4%) |
| 15 to 17 Year Olds | 237 (100.0%) | 0 (0.0%) |
| 18 to 19 Year Olds | 300 (94.6%) | 17 (5.4%) |
| 20 to 24 Year Olds | 78 (80.4%) | 19 (19.6%) |
| 25 to 34 Year Olds | 94 (100.0%) | 0 (0.0%) |
| 35 Years and over | 51 (100.0%) | 0 (0.0%) |
| Total | 1,568 (81.7%) | 351 (18.3%) |
Educational Attainment by Field of Study in Perry County
Education (232 | 37.2%), science & technology (136 | 21.8%), business (113 | 18.1%), bio, nature & agricultural (47 | 7.5%), and physical & health sciences (27 | 4.3%) are the most common fields of study among 623 individuals in Perry County who have obtained a bachelor's degree or higher.
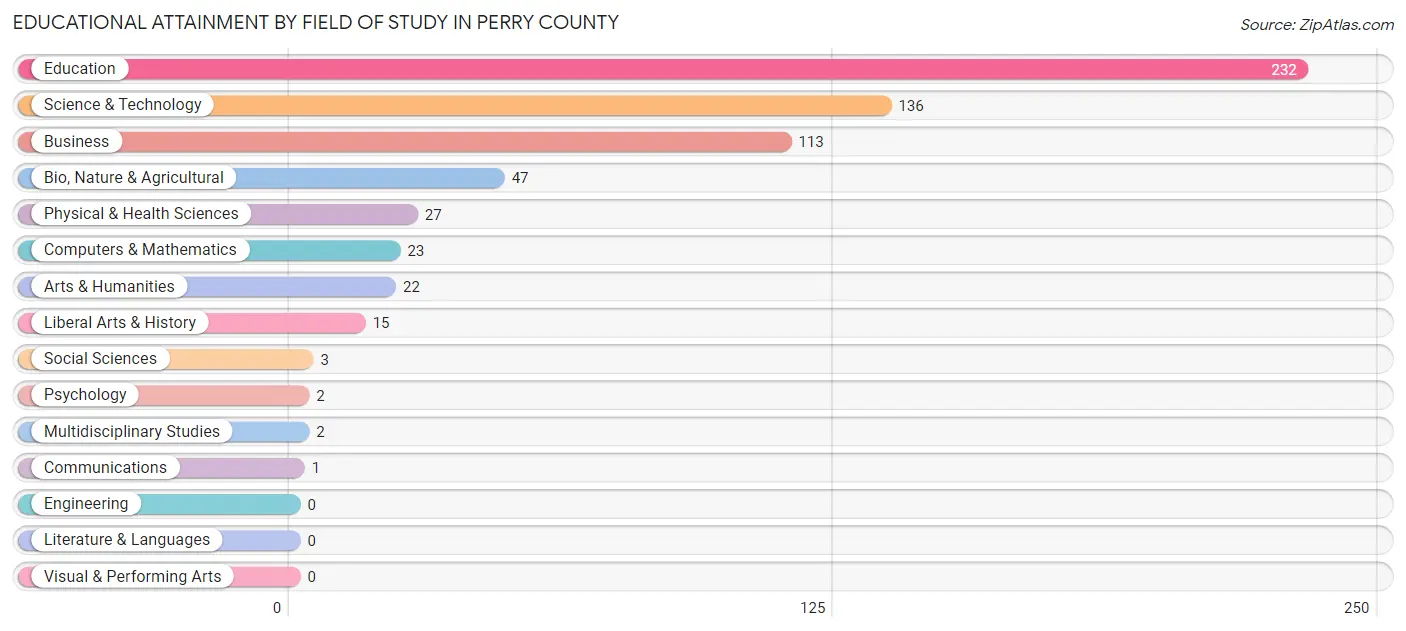
| Field of Study | # Graduates | % Graduates |
| Computers & Mathematics | 23 | 3.7% |
| Bio, Nature & Agricultural | 47 | 7.5% |
| Physical & Health Sciences | 27 | 4.3% |
| Psychology | 2 | 0.3% |
| Social Sciences | 3 | 0.5% |
| Engineering | 0 | 0.0% |
| Multidisciplinary Studies | 2 | 0.3% |
| Science & Technology | 136 | 21.8% |
| Business | 113 | 18.1% |
| Education | 232 | 37.2% |
| Literature & Languages | 0 | 0.0% |
| Liberal Arts & History | 15 | 2.4% |
| Visual & Performing Arts | 0 | 0.0% |
| Communications | 1 | 0.2% |
| Arts & Humanities | 22 | 3.5% |
| Total | 623 | 100.0% |
Transportation & Commute in Perry County
Vehicle Availability by Sex in Perry County
The most prevalent vehicle ownership categories in Perry County are males with 3 vehicles (652, accounting for 40.2%) and females with 3 vehicles (532, making up 45.5%).
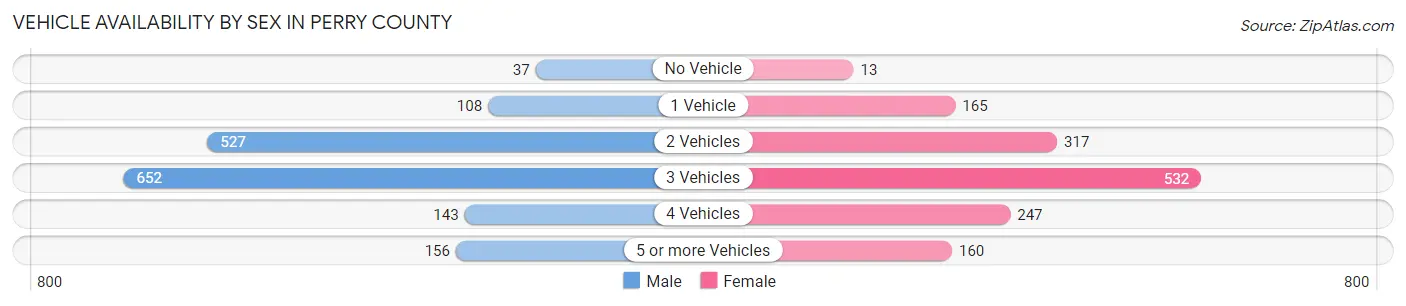
| Vehicles Available | Male | Female |
| No Vehicle | 37 (2.3%) | 13 (0.9%) |
| 1 Vehicle | 108 (6.7%) | 165 (11.5%) |
| 2 Vehicles | 527 (32.5%) | 317 (22.1%) |
| 3 Vehicles | 652 (40.2%) | 532 (37.1%) |
| 4 Vehicles | 143 (8.8%) | 247 (17.2%) |
| 5 or more Vehicles | 156 (9.6%) | 160 (11.2%) |
| Total | 1,623 (100.0%) | 1,434 (100.0%) |
Commute Time in Perry County
The most frequently occuring commute durations in Perry County are 15 to 19 minutes (476 commuters, 16.5%), 20 to 24 minutes (345 commuters, 11.9%), and 10 to 14 minutes (317 commuters, 11.0%).
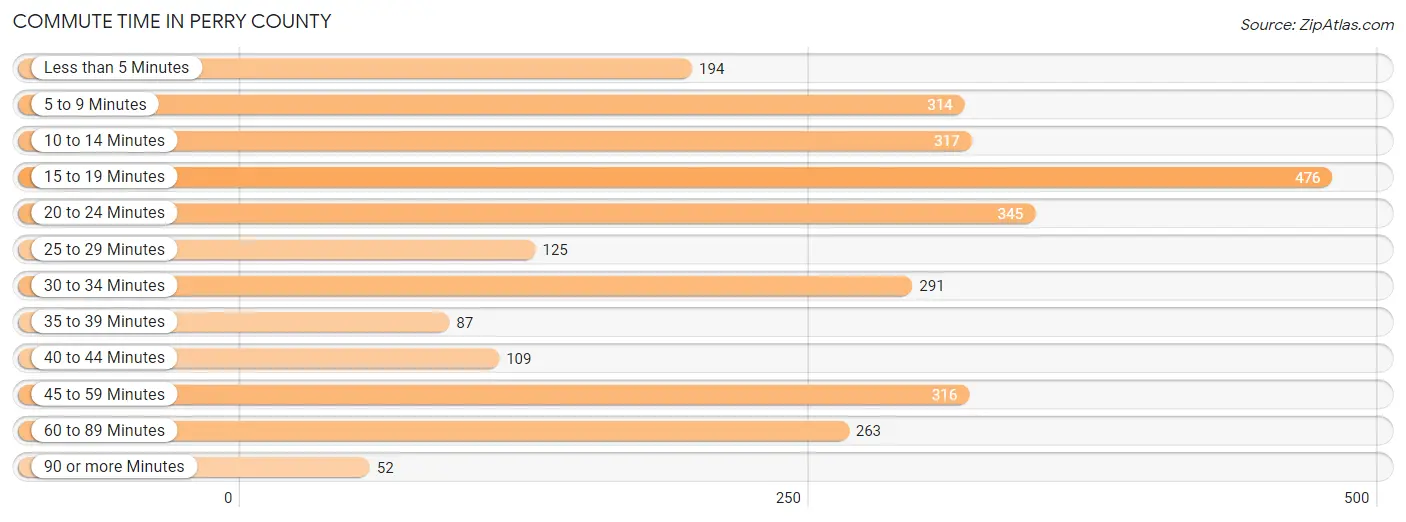
| Commute Time | # Commuters | % Commuters |
| Less than 5 Minutes | 194 | 6.7% |
| 5 to 9 Minutes | 314 | 10.9% |
| 10 to 14 Minutes | 317 | 11.0% |
| 15 to 19 Minutes | 476 | 16.5% |
| 20 to 24 Minutes | 345 | 11.9% |
| 25 to 29 Minutes | 125 | 4.3% |
| 30 to 34 Minutes | 291 | 10.1% |
| 35 to 39 Minutes | 87 | 3.0% |
| 40 to 44 Minutes | 109 | 3.8% |
| 45 to 59 Minutes | 316 | 10.9% |
| 60 to 89 Minutes | 263 | 9.1% |
| 90 or more Minutes | 52 | 1.8% |
Commute Time by Sex in Perry County
The most common commute times in Perry County are 20 to 24 minutes (269 commuters, 18.3%) for males and 15 to 19 minutes (278 commuters, 19.6%) for females.
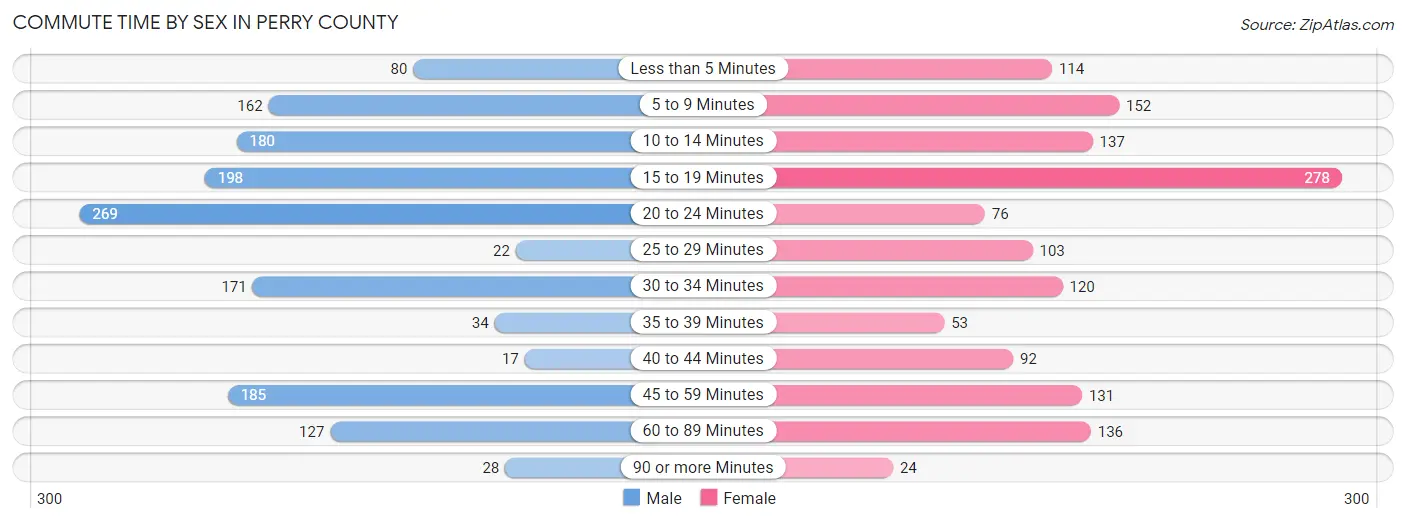
| Commute Time | Male | Female |
| Less than 5 Minutes | 80 (5.4%) | 114 (8.1%) |
| 5 to 9 Minutes | 162 (11.0%) | 152 (10.7%) |
| 10 to 14 Minutes | 180 (12.2%) | 137 (9.7%) |
| 15 to 19 Minutes | 198 (13.4%) | 278 (19.6%) |
| 20 to 24 Minutes | 269 (18.3%) | 76 (5.4%) |
| 25 to 29 Minutes | 22 (1.5%) | 103 (7.3%) |
| 30 to 34 Minutes | 171 (11.6%) | 120 (8.5%) |
| 35 to 39 Minutes | 34 (2.3%) | 53 (3.7%) |
| 40 to 44 Minutes | 17 (1.1%) | 92 (6.5%) |
| 45 to 59 Minutes | 185 (12.6%) | 131 (9.2%) |
| 60 to 89 Minutes | 127 (8.6%) | 136 (9.6%) |
| 90 or more Minutes | 28 (1.9%) | 24 (1.7%) |
Time of Departure to Work by Sex in Perry County
The most frequent times of departure to work in Perry County are 7:00 AM to 7:29 AM (291, 19.8%) for males and 7:00 AM to 7:29 AM (334, 23.6%) for females.
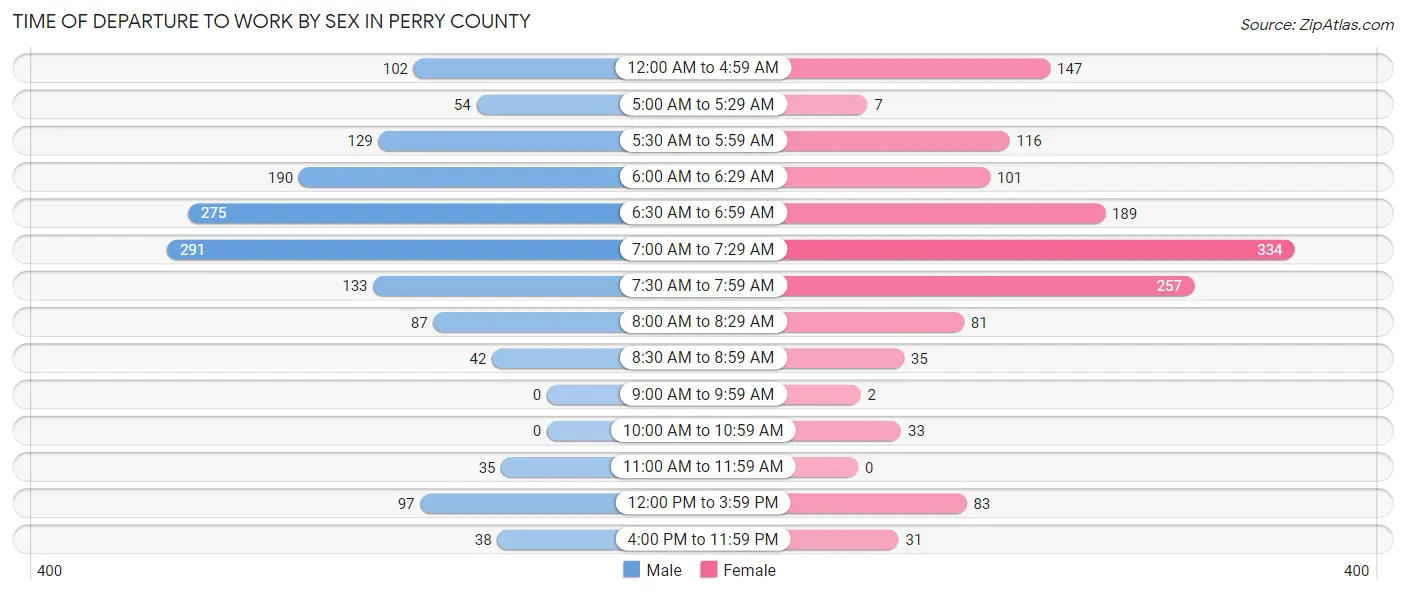
| Time of Departure | Male | Female |
| 12:00 AM to 4:59 AM | 102 (6.9%) | 147 (10.4%) |
| 5:00 AM to 5:29 AM | 54 (3.7%) | 7 (0.5%) |
| 5:30 AM to 5:59 AM | 129 (8.8%) | 116 (8.2%) |
| 6:00 AM to 6:29 AM | 190 (12.9%) | 101 (7.1%) |
| 6:30 AM to 6:59 AM | 275 (18.7%) | 189 (13.4%) |
| 7:00 AM to 7:29 AM | 291 (19.8%) | 334 (23.6%) |
| 7:30 AM to 7:59 AM | 133 (9.0%) | 257 (18.1%) |
| 8:00 AM to 8:29 AM | 87 (5.9%) | 81 (5.7%) |
| 8:30 AM to 8:59 AM | 42 (2.9%) | 35 (2.5%) |
| 9:00 AM to 9:59 AM | 0 (0.0%) | 2 (0.1%) |
| 10:00 AM to 10:59 AM | 0 (0.0%) | 33 (2.3%) |
| 11:00 AM to 11:59 AM | 35 (2.4%) | 0 (0.0%) |
| 12:00 PM to 3:59 PM | 97 (6.6%) | 83 (5.9%) |
| 4:00 PM to 11:59 PM | 38 (2.6%) | 31 (2.2%) |
| Total | 1,473 (100.0%) | 1,416 (100.0%) |
Housing Occupancy in Perry County
Occupancy by Ownership in Perry County
Of the total 2,954 dwellings in Perry County, owner-occupied units account for 2,251 (76.2%), while renter-occupied units make up 703 (23.8%).
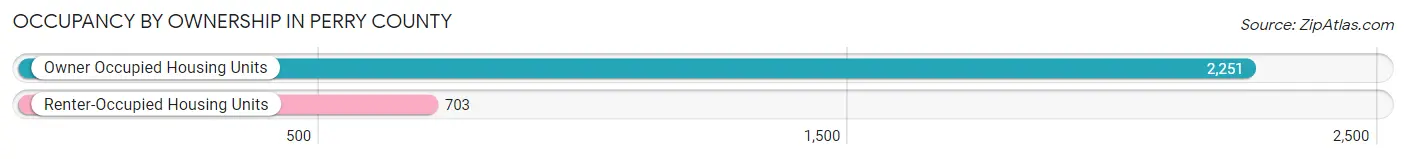
| Occupancy | # Housing Units | % Housing Units |
| Owner Occupied Housing Units | 2,251 | 76.2% |
| Renter-Occupied Housing Units | 703 | 23.8% |
| Total Occupied Housing Units | 2,954 | 100.0% |
Occupancy by Household Size in Perry County
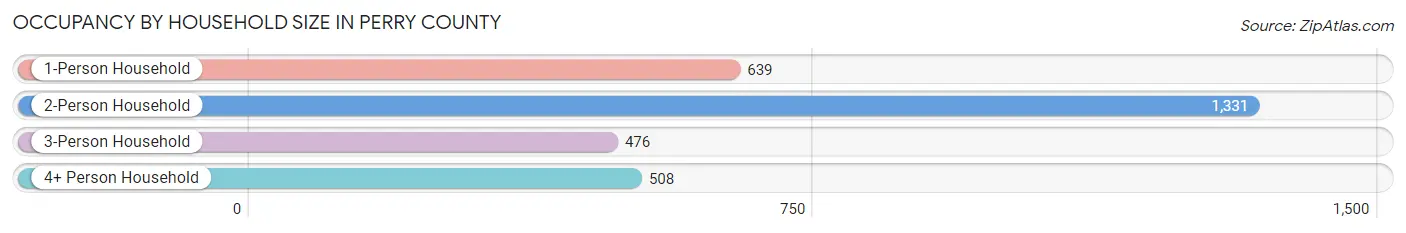
| Household Size | # Housing Units | % Housing Units |
| 1-Person Household | 639 | 21.6% |
| 2-Person Household | 1,331 | 45.1% |
| 3-Person Household | 476 | 16.1% |
| 4+ Person Household | 508 | 17.2% |
| Total Housing Units | 2,954 | 100.0% |
Occupancy by Ownership by Household Size in Perry County
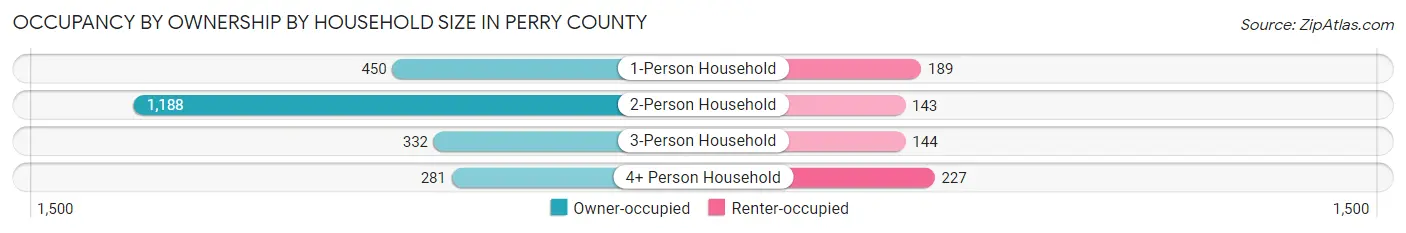
| Household Size | Owner-occupied | Renter-occupied |
| 1-Person Household | 450 (70.4%) | 189 (29.6%) |
| 2-Person Household | 1,188 (89.3%) | 143 (10.7%) |
| 3-Person Household | 332 (69.8%) | 144 (30.2%) |
| 4+ Person Household | 281 (55.3%) | 227 (44.7%) |
| Total Housing Units | 2,251 (76.2%) | 703 (23.8%) |
Occupancy by Educational Attainment in Perry County
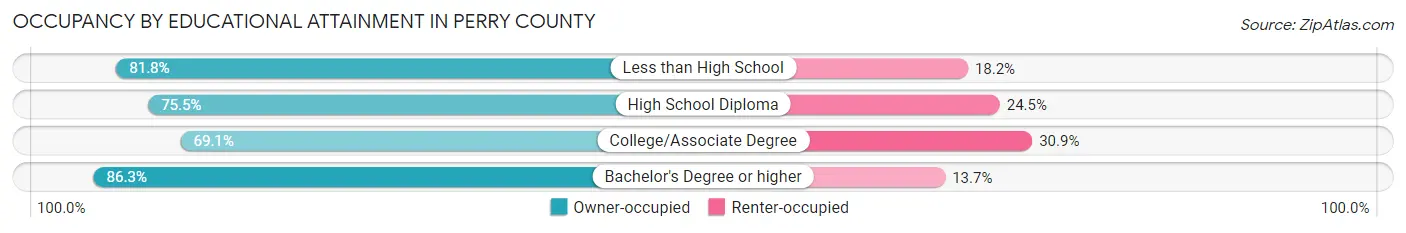
| Household Size | Owner-occupied | Renter-occupied |
| Less than High School | 454 (81.8%) | 101 (18.2%) |
| High School Diploma | 921 (75.5%) | 299 (24.5%) |
| College/Associate Degree | 567 (69.1%) | 254 (30.9%) |
| Bachelor's Degree or higher | 309 (86.3%) | 49 (13.7%) |
Occupancy by Age of Householder in Perry County
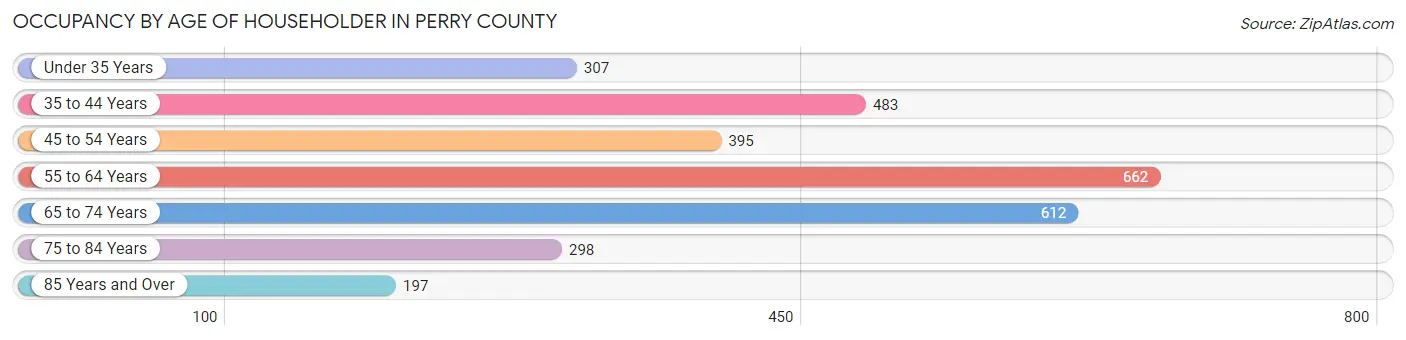
| Age Bracket | # Households | % Households |
| Under 35 Years | 307 | 10.4% |
| 35 to 44 Years | 483 | 16.4% |
| 45 to 54 Years | 395 | 13.4% |
| 55 to 64 Years | 662 | 22.4% |
| 65 to 74 Years | 612 | 20.7% |
| 75 to 84 Years | 298 | 10.1% |
| 85 Years and Over | 197 | 6.7% |
| Total | 2,954 | 100.0% |
Housing Finances in Perry County
Median Income by Occupancy in Perry County
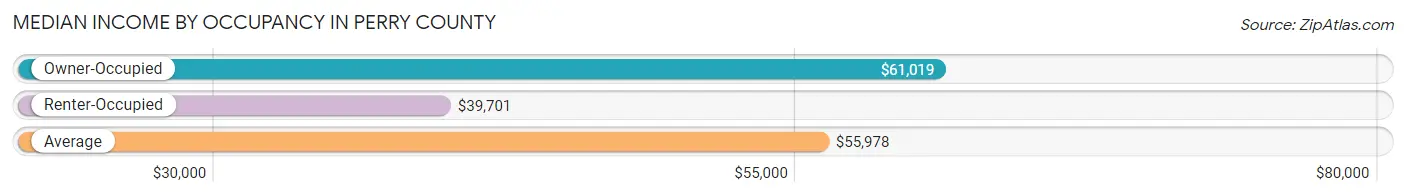
| Occupancy Type | # Households | Median Income |
| Owner-Occupied | 2,251 (76.2%) | $61,019 |
| Renter-Occupied | 703 (23.8%) | $39,701 |
| Average | 2,954 (100.0%) | $55,978 |
Occupancy by Householder Income Bracket in Perry County
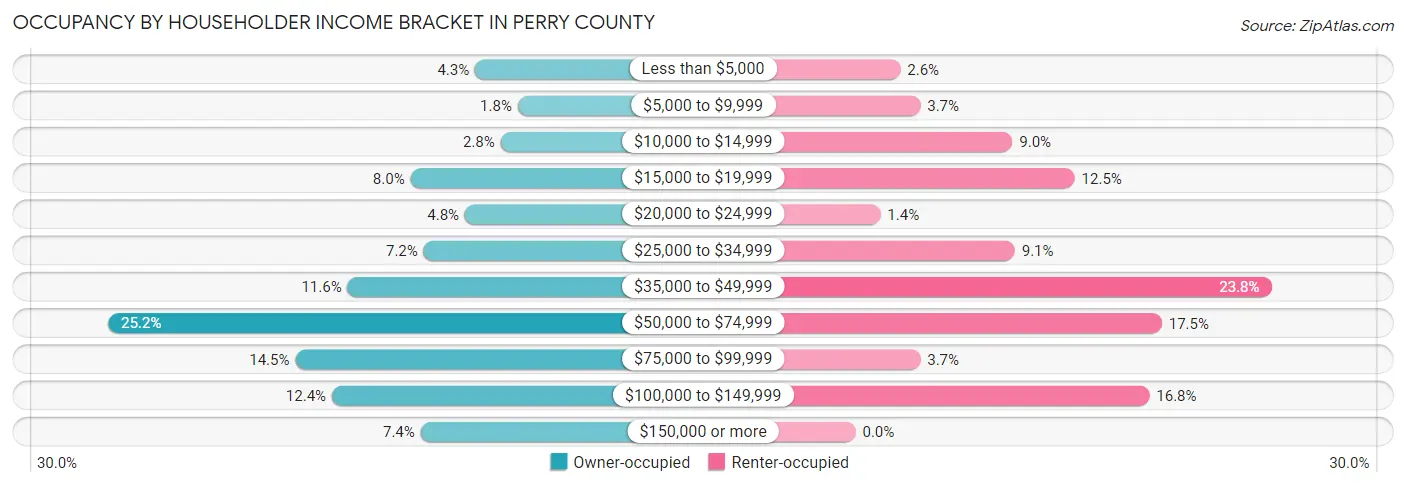
| Income Bracket | Owner-occupied | Renter-occupied |
| Less than $5,000 | 96 (4.3%) | 18 (2.6%) |
| $5,000 to $9,999 | 41 (1.8%) | 26 (3.7%) |
| $10,000 to $14,999 | 63 (2.8%) | 63 (9.0%) |
| $15,000 to $19,999 | 179 (8.0%) | 88 (12.5%) |
| $20,000 to $24,999 | 109 (4.8%) | 10 (1.4%) |
| $25,000 to $34,999 | 162 (7.2%) | 64 (9.1%) |
| $35,000 to $49,999 | 260 (11.6%) | 167 (23.8%) |
| $50,000 to $74,999 | 568 (25.2%) | 123 (17.5%) |
| $75,000 to $99,999 | 327 (14.5%) | 26 (3.7%) |
| $100,000 to $149,999 | 280 (12.4%) | 118 (16.8%) |
| $150,000 or more | 166 (7.4%) | 0 (0.0%) |
| Total | 2,251 (100.0%) | 703 (100.0%) |
Monthly Housing Cost Tiers in Perry County
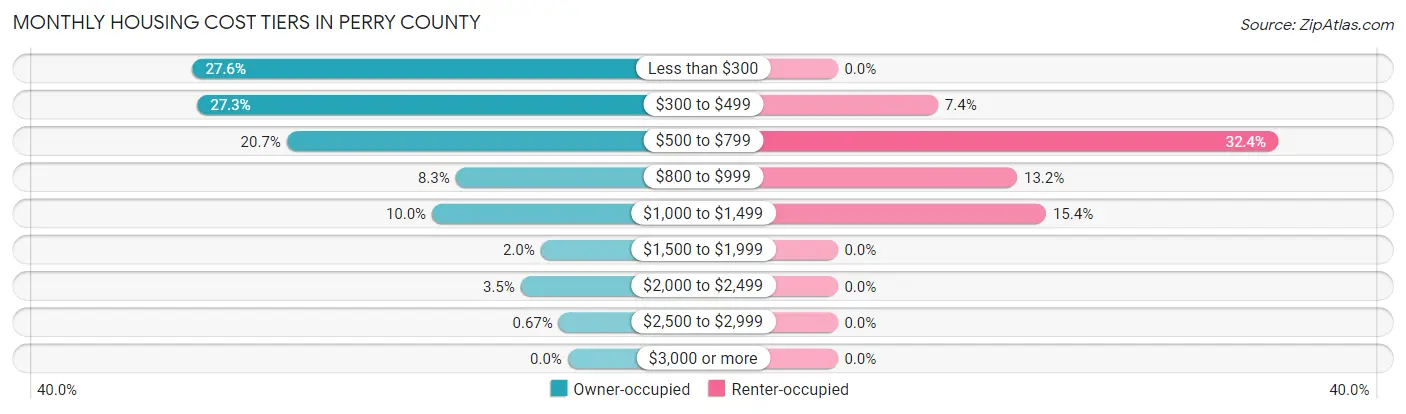
| Monthly Cost | Owner-occupied | Renter-occupied |
| Less than $300 | 622 (27.6%) | 0 (0.0%) |
| $300 to $499 | 614 (27.3%) | 52 (7.4%) |
| $500 to $799 | 466 (20.7%) | 228 (32.4%) |
| $800 to $999 | 186 (8.3%) | 93 (13.2%) |
| $1,000 to $1,499 | 225 (10.0%) | 108 (15.4%) |
| $1,500 to $1,999 | 45 (2.0%) | 0 (0.0%) |
| $2,000 to $2,499 | 78 (3.5%) | 0 (0.0%) |
| $2,500 to $2,999 | 15 (0.7%) | 0 (0.0%) |
| $3,000 or more | 0 (0.0%) | 0 (0.0%) |
| Total | 2,251 (100.0%) | 703 (100.0%) |
Physical Housing Characteristics in Perry County
Housing Structures in Perry County
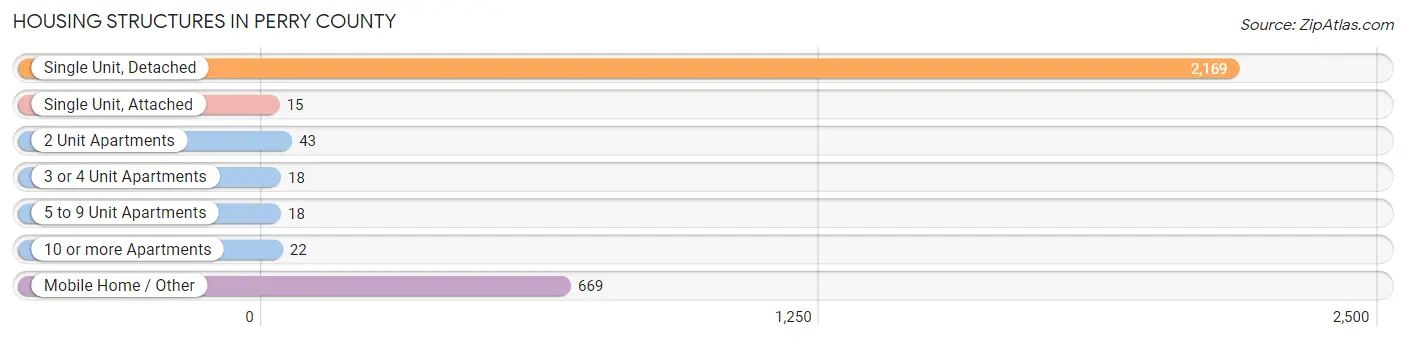
| Structure Type | # Housing Units | % Housing Units |
| Single Unit, Detached | 2,169 | 73.4% |
| Single Unit, Attached | 15 | 0.5% |
| 2 Unit Apartments | 43 | 1.5% |
| 3 or 4 Unit Apartments | 18 | 0.6% |
| 5 to 9 Unit Apartments | 18 | 0.6% |
| 10 or more Apartments | 22 | 0.7% |
| Mobile Home / Other | 669 | 22.7% |
| Total | 2,954 | 100.0% |
Housing Structures by Occupancy in Perry County
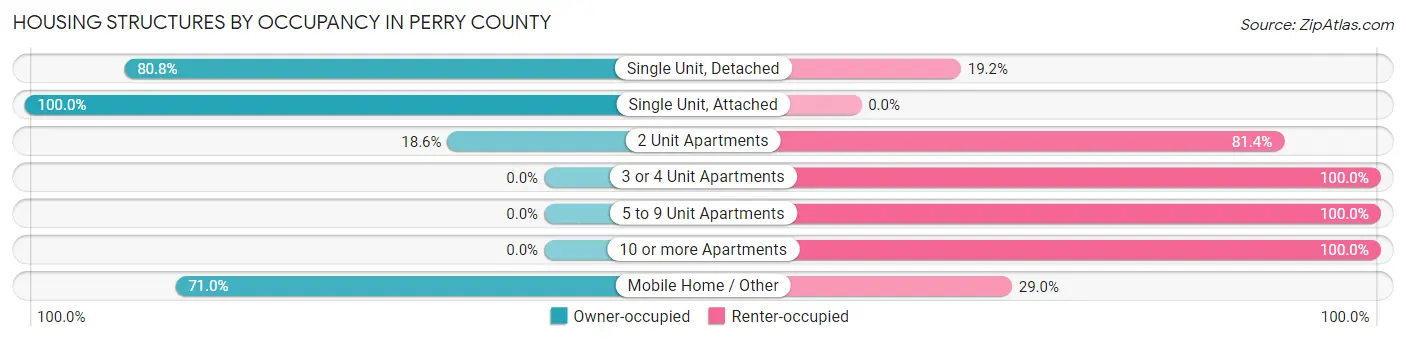
| Structure Type | Owner-occupied | Renter-occupied |
| Single Unit, Detached | 1,753 (80.8%) | 416 (19.2%) |
| Single Unit, Attached | 15 (100.0%) | 0 (0.0%) |
| 2 Unit Apartments | 8 (18.6%) | 35 (81.4%) |
| 3 or 4 Unit Apartments | 0 (0.0%) | 18 (100.0%) |
| 5 to 9 Unit Apartments | 0 (0.0%) | 18 (100.0%) |
| 10 or more Apartments | 0 (0.0%) | 22 (100.0%) |
| Mobile Home / Other | 475 (71.0%) | 194 (29.0%) |
| Total | 2,251 (76.2%) | 703 (23.8%) |
Housing Structures by Number of Rooms in Perry County
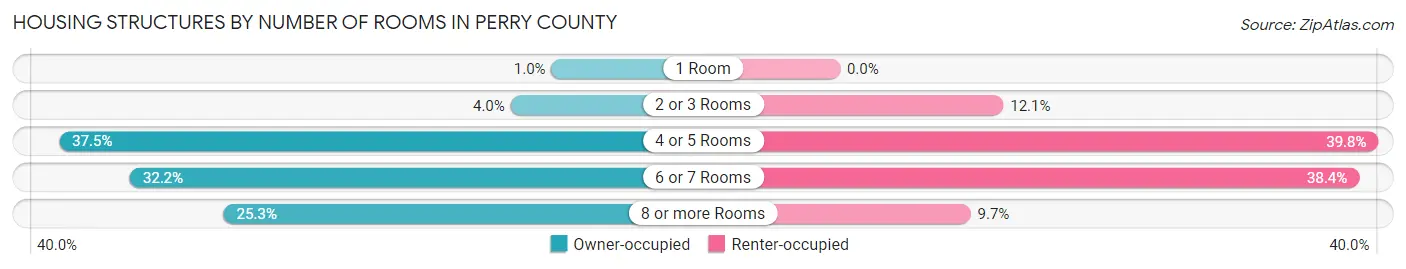
| Number of Rooms | Owner-occupied | Renter-occupied |
| 1 Room | 23 (1.0%) | 0 (0.0%) |
| 2 or 3 Rooms | 91 (4.0%) | 85 (12.1%) |
| 4 or 5 Rooms | 843 (37.4%) | 280 (39.8%) |
| 6 or 7 Rooms | 725 (32.2%) | 270 (38.4%) |
| 8 or more Rooms | 569 (25.3%) | 68 (9.7%) |
| Total | 2,251 (100.0%) | 703 (100.0%) |
Housing Structure by Heating Type in Perry County
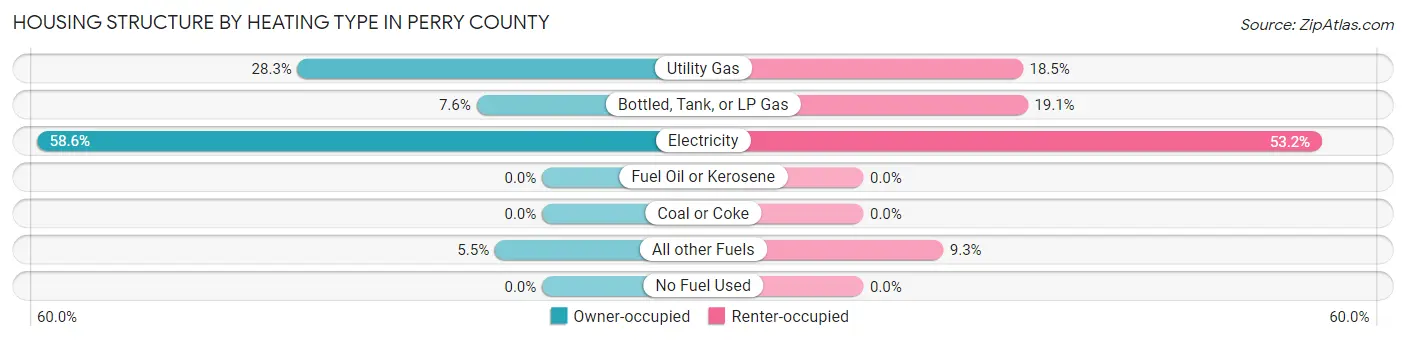
| Heating Type | Owner-occupied | Renter-occupied |
| Utility Gas | 638 (28.3%) | 130 (18.5%) |
| Bottled, Tank, or LP Gas | 171 (7.6%) | 134 (19.1%) |
| Electricity | 1,319 (58.6%) | 374 (53.2%) |
| Fuel Oil or Kerosene | 0 (0.0%) | 0 (0.0%) |
| Coal or Coke | 0 (0.0%) | 0 (0.0%) |
| All other Fuels | 123 (5.5%) | 65 (9.2%) |
| No Fuel Used | 0 (0.0%) | 0 (0.0%) |
| Total | 2,251 (100.0%) | 703 (100.0%) |
Household Vehicle Usage in Perry County
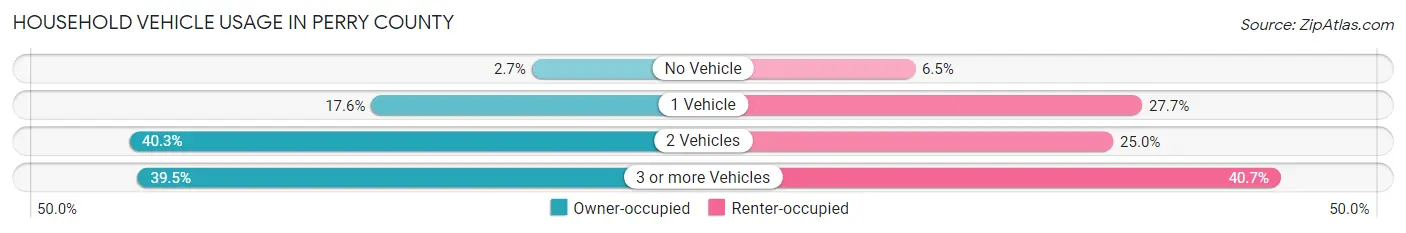
| Vehicles per Household | Owner-occupied | Renter-occupied |
| No Vehicle | 60 (2.7%) | 46 (6.5%) |
| 1 Vehicle | 397 (17.6%) | 195 (27.7%) |
| 2 Vehicles | 906 (40.3%) | 176 (25.0%) |
| 3 or more Vehicles | 888 (39.5%) | 286 (40.7%) |
| Total | 2,251 (100.0%) | 703 (100.0%) |
Real Estate & Mortgages in Perry County
Real Estate and Mortgage Overview in Perry County
| Characteristic | Without Mortgage | With Mortgage |
| Housing Units | 1,612 | 639 |
| Median Property Value | $123,900 | $121,900 |
| Median Household Income | $52,875 | $56 |
| Monthly Housing Costs | $368 | $0 |
| Real Estate Taxes | $726 | $10 |
Property Value by Mortgage Status in Perry County
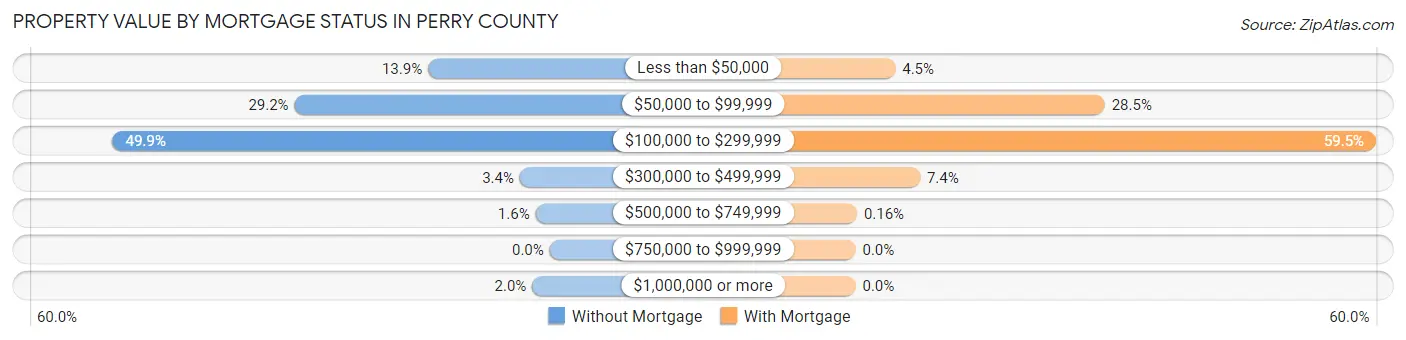
| Property Value | Without Mortgage | With Mortgage |
| Less than $50,000 | 224 (13.9%) | 29 (4.5%) |
| $50,000 to $99,999 | 470 (29.2%) | 182 (28.5%) |
| $100,000 to $299,999 | 805 (49.9%) | 380 (59.5%) |
| $300,000 to $499,999 | 55 (3.4%) | 47 (7.4%) |
| $500,000 to $749,999 | 26 (1.6%) | 1 (0.2%) |
| $750,000 to $999,999 | 0 (0.0%) | 0 (0.0%) |
| $1,000,000 or more | 32 (2.0%) | 0 (0.0%) |
| Total | 1,612 (100.0%) | 639 (100.0%) |
Household Income by Mortgage Status in Perry County
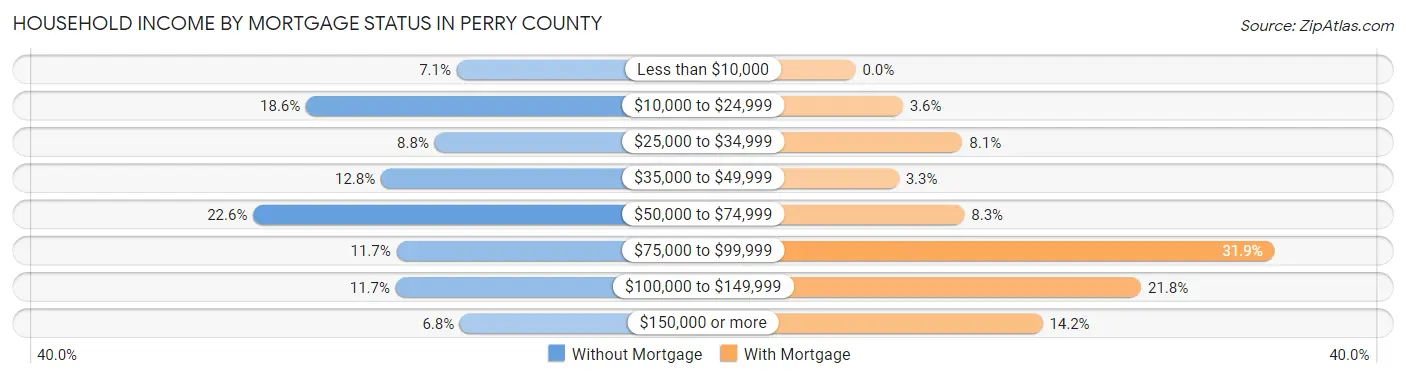
| Household Income | Without Mortgage | With Mortgage |
| Less than $10,000 | 114 (7.1%) | 0 (0.0%) |
| $10,000 to $24,999 | 299 (18.5%) | 23 (3.6%) |
| $25,000 to $34,999 | 141 (8.7%) | 52 (8.1%) |
| $35,000 to $49,999 | 207 (12.8%) | 21 (3.3%) |
| $50,000 to $74,999 | 364 (22.6%) | 53 (8.3%) |
| $75,000 to $99,999 | 188 (11.7%) | 204 (31.9%) |
| $100,000 to $149,999 | 189 (11.7%) | 139 (21.7%) |
| $150,000 or more | 110 (6.8%) | 91 (14.2%) |
| Total | 1,612 (100.0%) | 639 (100.0%) |
Property Value to Household Income Ratio in Perry County
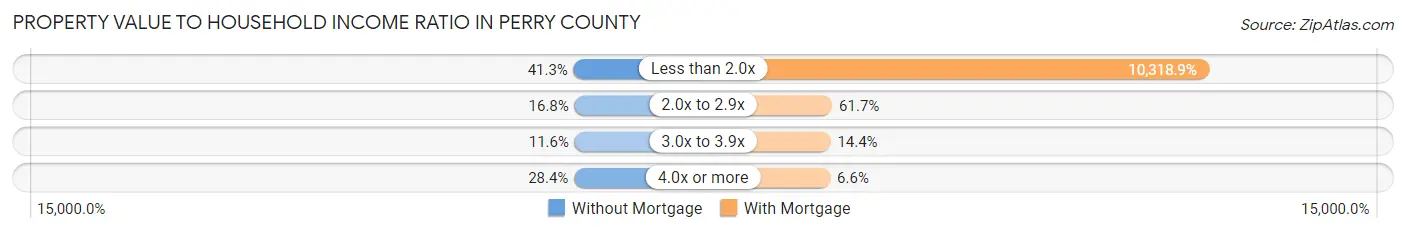
| Value-to-Income Ratio | Without Mortgage | With Mortgage |
| Less than 2.0x | 666 (41.3%) | 65,938 (10,318.9%) |
| 2.0x to 2.9x | 271 (16.8%) | 394 (61.7%) |
| 3.0x to 3.9x | 187 (11.6%) | 92 (14.4%) |
| 4.0x or more | 457 (28.3%) | 42 (6.6%) |
| Total | 1,612 (100.0%) | 639 (100.0%) |
Real Estate Taxes by Mortgage Status in Perry County
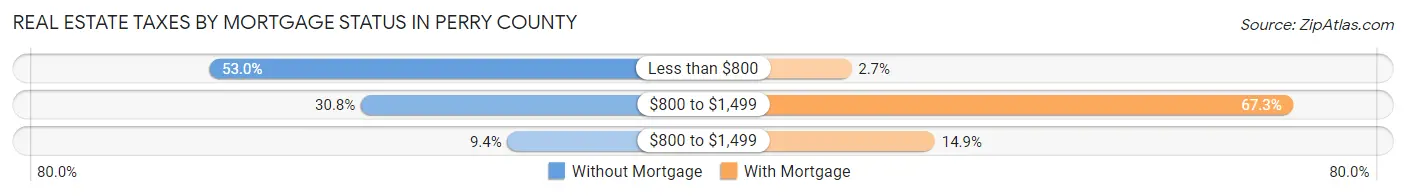
| Property Taxes | Without Mortgage | With Mortgage |
| Less than $800 | 855 (53.0%) | 17 (2.7%) |
| $800 to $1,499 | 497 (30.8%) | 430 (67.3%) |
| $800 to $1,499 | 152 (9.4%) | 95 (14.9%) |
| Total | 1,612 (100.0%) | 639 (100.0%) |
Health & Disability in Perry County
Health Insurance Coverage by Age in Perry County
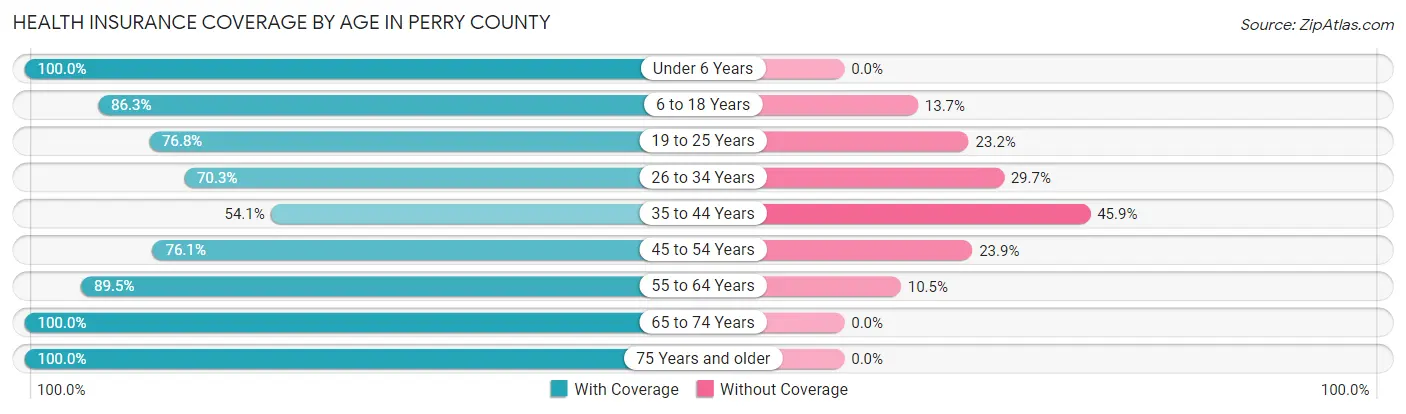
| Age Bracket | With Coverage | Without Coverage |
| Under 6 Years | 628 (100.0%) | 0 (0.0%) |
| 6 to 18 Years | 1,283 (86.3%) | 204 (13.7%) |
| 19 to 25 Years | 510 (76.8%) | 154 (23.2%) |
| 26 to 34 Years | 513 (70.3%) | 217 (29.7%) |
| 35 to 44 Years | 517 (54.1%) | 438 (45.9%) |
| 45 to 54 Years | 734 (76.1%) | 230 (23.9%) |
| 55 to 64 Years | 985 (89.5%) | 116 (10.5%) |
| 65 to 74 Years | 983 (100.0%) | 0 (0.0%) |
| 75 Years and older | 761 (100.0%) | 0 (0.0%) |
| Total | 6,914 (83.6%) | 1,359 (16.4%) |
Health Insurance Coverage by Citizenship Status in Perry County
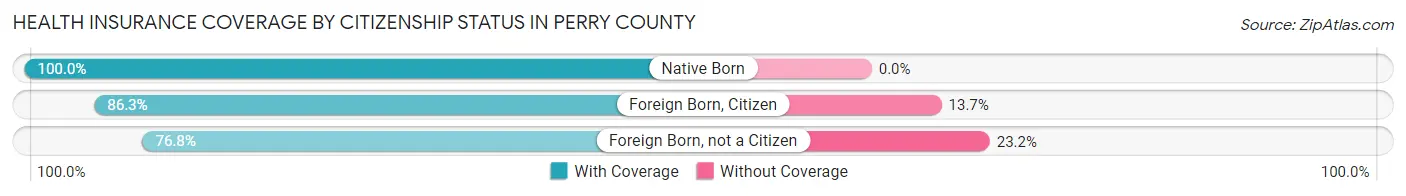
| Citizenship Status | With Coverage | Without Coverage |
| Native Born | 628 (100.0%) | 0 (0.0%) |
| Foreign Born, Citizen | 1,283 (86.3%) | 204 (13.7%) |
| Foreign Born, not a Citizen | 510 (76.8%) | 154 (23.2%) |
Health Insurance Coverage by Household Income in Perry County
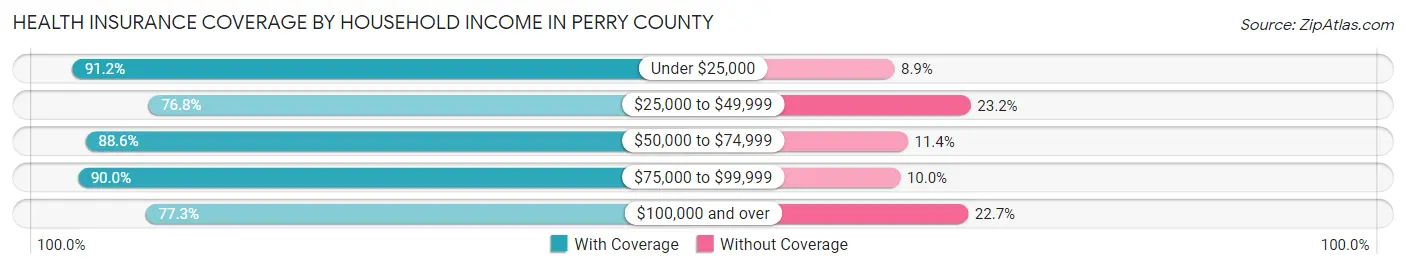
| Household Income | With Coverage | Without Coverage |
| Under $25,000 | 1,257 (91.1%) | 122 (8.8%) |
| $25,000 to $49,999 | 1,354 (76.8%) | 408 (23.2%) |
| $50,000 to $74,999 | 1,706 (88.6%) | 219 (11.4%) |
| $75,000 to $99,999 | 832 (90.0%) | 92 (10.0%) |
| $100,000 and over | 1,765 (77.3%) | 518 (22.7%) |
Public vs Private Health Insurance Coverage by Age in Perry County
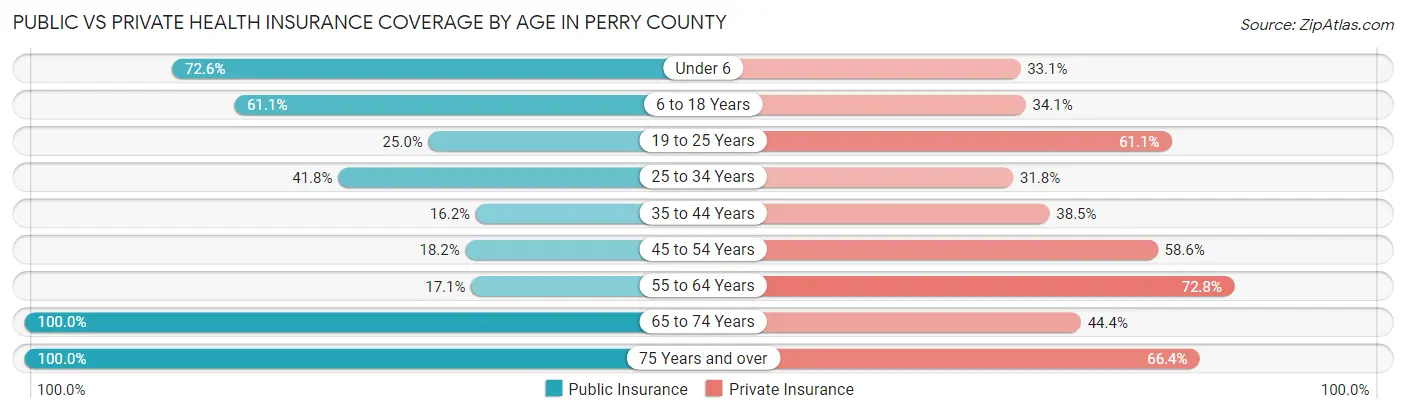
| Age Bracket | Public Insurance | Private Insurance |
| Under 6 | 456 (72.6%) | 208 (33.1%) |
| 6 to 18 Years | 909 (61.1%) | 507 (34.1%) |
| 19 to 25 Years | 166 (25.0%) | 406 (61.1%) |
| 25 to 34 Years | 305 (41.8%) | 232 (31.8%) |
| 35 to 44 Years | 155 (16.2%) | 368 (38.5%) |
| 45 to 54 Years | 175 (18.1%) | 565 (58.6%) |
| 55 to 64 Years | 188 (17.1%) | 801 (72.8%) |
| 65 to 74 Years | 983 (100.0%) | 436 (44.4%) |
| 75 Years and over | 761 (100.0%) | 505 (66.4%) |
| Total | 4,098 (49.5%) | 4,028 (48.7%) |
Disability Status by Sex by Age in Perry County
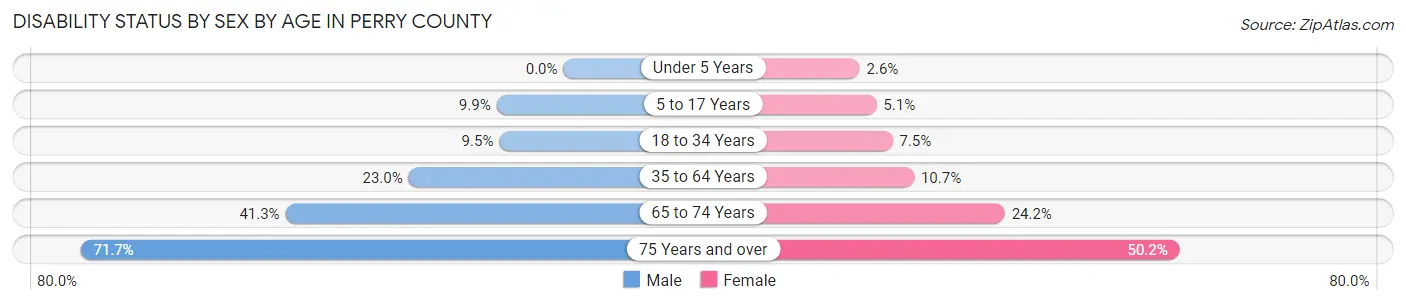
| Age Bracket | Male | Female |
| Under 5 Years | 0 (0.0%) | 6 (2.6%) |
| 5 to 17 Years | 58 (9.9%) | 41 (5.1%) |
| 18 to 34 Years | 79 (9.5%) | 60 (7.5%) |
| 35 to 64 Years | 351 (23.0%) | 160 (10.7%) |
| 65 to 74 Years | 201 (41.3%) | 120 (24.2%) |
| 75 Years and over | 304 (71.7%) | 169 (50.1%) |
Disability Class by Sex by Age in Perry County
Disability Class: Hearing Difficulty
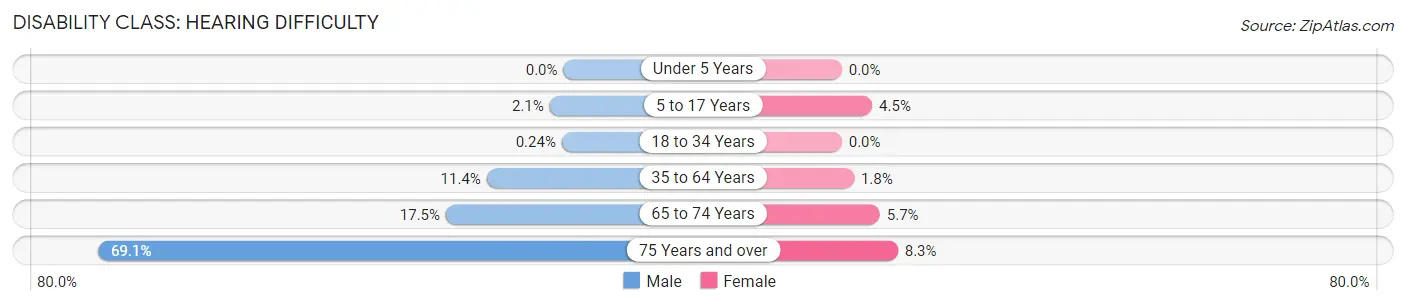
| Age Bracket | Male | Female |
| Under 5 Years | 0 (0.0%) | 0 (0.0%) |
| 5 to 17 Years | 12 (2.1%) | 36 (4.5%) |
| 18 to 34 Years | 2 (0.2%) | 0 (0.0%) |
| 35 to 64 Years | 174 (11.4%) | 27 (1.8%) |
| 65 to 74 Years | 85 (17.4%) | 28 (5.7%) |
| 75 Years and over | 293 (69.1%) | 28 (8.3%) |
Disability Class: Vision Difficulty
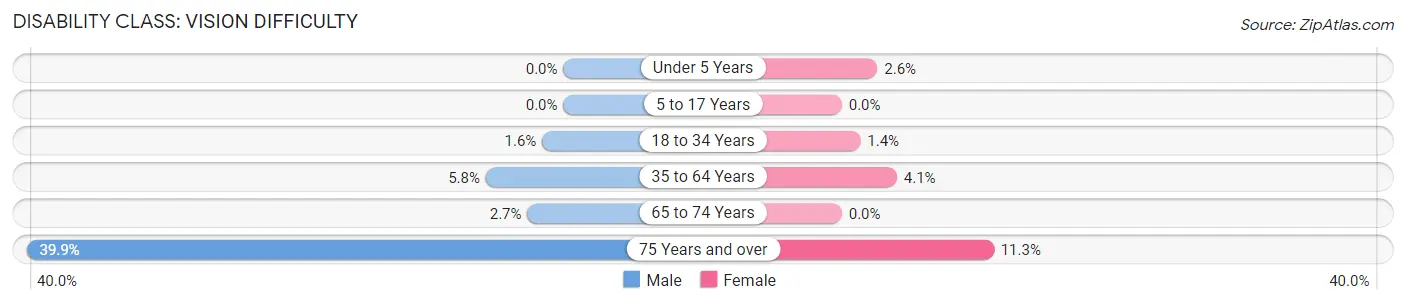
| Age Bracket | Male | Female |
| Under 5 Years | 0 (0.0%) | 6 (2.6%) |
| 5 to 17 Years | 0 (0.0%) | 0 (0.0%) |
| 18 to 34 Years | 13 (1.6%) | 11 (1.4%) |
| 35 to 64 Years | 88 (5.8%) | 61 (4.1%) |
| 65 to 74 Years | 13 (2.7%) | 0 (0.0%) |
| 75 Years and over | 169 (39.9%) | 38 (11.3%) |
Disability Class: Cognitive Difficulty
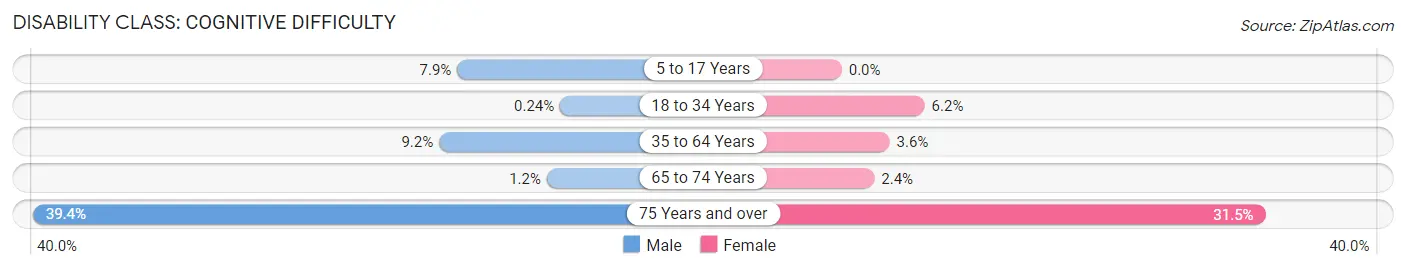
| Age Bracket | Male | Female |
| 5 to 17 Years | 46 (7.9%) | 0 (0.0%) |
| 18 to 34 Years | 2 (0.2%) | 49 (6.1%) |
| 35 to 64 Years | 141 (9.2%) | 53 (3.5%) |
| 65 to 74 Years | 6 (1.2%) | 12 (2.4%) |
| 75 Years and over | 167 (39.4%) | 106 (31.5%) |
Disability Class: Ambulatory Difficulty
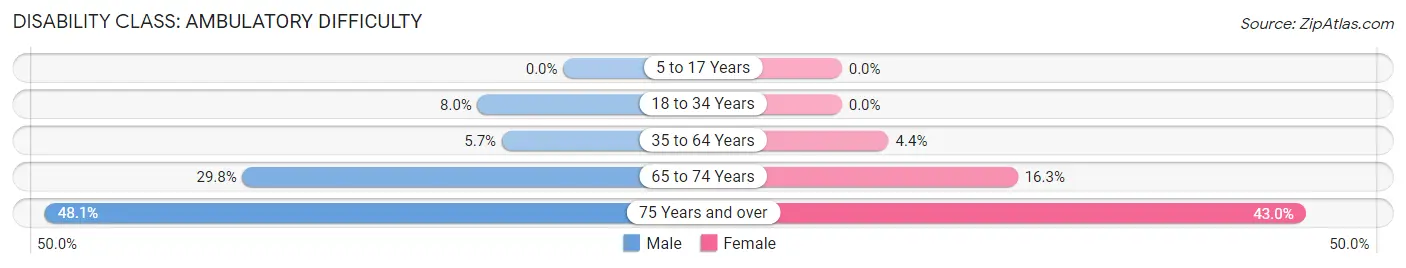
| Age Bracket | Male | Female |
| 5 to 17 Years | 0 (0.0%) | 0 (0.0%) |
| 18 to 34 Years | 66 (8.0%) | 0 (0.0%) |
| 35 to 64 Years | 87 (5.7%) | 65 (4.3%) |
| 65 to 74 Years | 145 (29.8%) | 81 (16.3%) |
| 75 Years and over | 204 (48.1%) | 145 (43.0%) |
Disability Class: Self-Care Difficulty
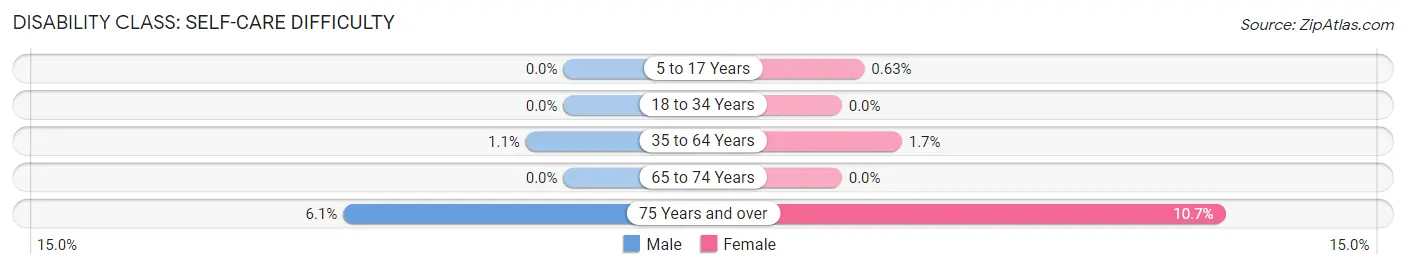
| Age Bracket | Male | Female |
| 5 to 17 Years | 0 (0.0%) | 5 (0.6%) |
| 18 to 34 Years | 0 (0.0%) | 0 (0.0%) |
| 35 to 64 Years | 16 (1.1%) | 25 (1.7%) |
| 65 to 74 Years | 0 (0.0%) | 0 (0.0%) |
| 75 Years and over | 26 (6.1%) | 36 (10.7%) |
Technology Access in Perry County
Computing Device Access in Perry County
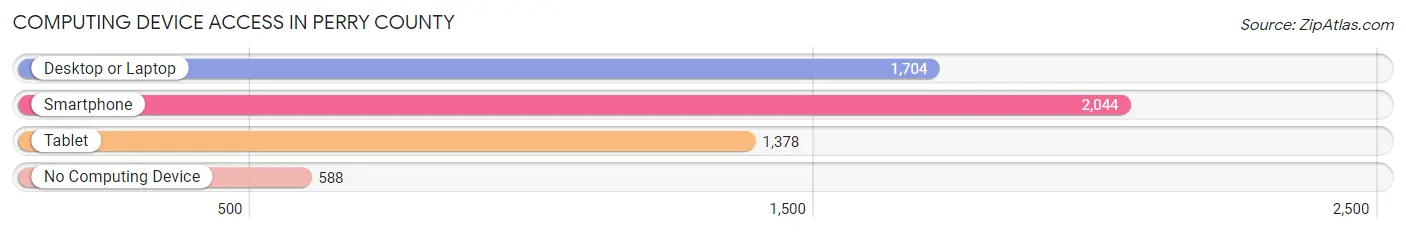
| Device Type | # Households | % Households |
| Desktop or Laptop | 1,704 | 57.7% |
| Smartphone | 2,044 | 69.2% |
| Tablet | 1,378 | 46.7% |
| No Computing Device | 588 | 19.9% |
| Total | 2,954 | 100.0% |
Internet Access in Perry County
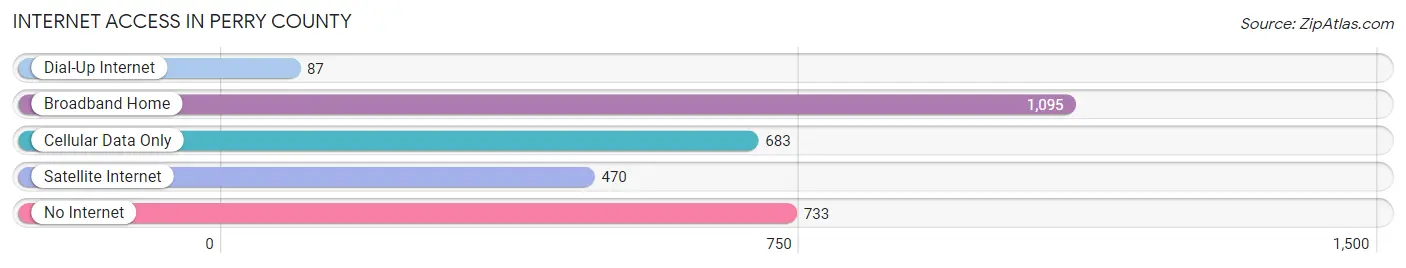
| Internet Type | # Households | % Households |
| Dial-Up Internet | 87 | 2.9% |
| Broadband Home | 1,095 | 37.1% |
| Cellular Data Only | 683 | 23.1% |
| Satellite Internet | 470 | 15.9% |
| No Internet | 733 | 24.8% |
| Total | 2,954 | 100.0% |
Perry County Summary
Perry County is located in the western part of Tennessee, in the Appalachian region of the United States. It is bordered by the counties of Decatur, Hickman, Humphreys, Lewis, and Wayne. The county seat is Linden, and the largest city is Lobelville. The county was established in 1819 and named for Oliver Hazard Perry, a naval hero of the War of 1812.
Geography
Perry County is located in the western part of Tennessee, in the Appalachian region of the United States. It is bordered by the counties of Decatur, Hickman, Humphreys, Lewis, and Wayne. The county has a total area of 517 square miles, of which 514 square miles is land and 3 square miles is water. The terrain is mostly hilly, with some flat areas in the valleys. The highest point in the county is the summit of Big Hill, which has an elevation of 1,068 feet. The county is drained by the Buffalo River, which flows through the center of the county.
Climate
Perry County has a humid subtropical climate, with hot, humid summers and mild winters. The average annual temperature is around 63°F, and the average annual precipitation is around 45 inches.
Demographics
As of the 2010 census, there were 7,915 people, 3,093 households, and 2,097 families living in the county. The population density was 15.5 people per square mile. The racial makeup of the county was 95.3% White, 2.7% African American, 0.2% Native American, 0.2% Asian, 0.2% from other races, and 1.4% from two or more races. Hispanic or Latino of any race were 0.7% of the population.
The median income for a household in the county was $30,945, and the median income for a family was $37,917. The per capita income for the county was $15,945. About 17.2% of families and 21.2% of the population were below the poverty line, including 28.2% of those under age 18 and 18.2% of those age 65 or over.
Economy
Perry County's economy is largely based on agriculture and forestry. The county is home to several large farms, and the timber industry is also an important part of the local economy. Other industries in the county include manufacturing, retail, and tourism.
The county is home to several large employers, including the Lobelville Manufacturing Company, which produces furniture and other wood products, and the Perry County Correctional Facility, which employs over 200 people.
Education
Perry County is served by the Perry County School System, which consists of five elementary schools, two middle schools, and one high school. The county also has several private schools, including Perry County Christian Academy and Perry County Academy.
Conclusion
Perry County is a rural county located in the western part of Tennessee. It is home to a diverse population and a strong agricultural and forestry economy. The county is served by the Perry County School System, which provides quality education to the county's students.
Common Questions
What is Per Capita Income in Perry County?
Per Capita income in Perry County is $30,870.
What is the Median Family Income in Perry County?
Median Family Income in Perry County is $61,881.
What is the Median Household income in Perry County?
Median Household Income in Perry County is $55,978.
What is Income or Wage Gap in Perry County?
Income or Wage Gap in Perry County is 33.9%.
Women in Perry County earn 66.1 cents for every dollar earned by a man.
What is Inequality or Gini Index in Perry County?
Inequality or Gini Index in Perry County is 0.53.
What is the Total Population of Perry County?
Total Population of Perry County is 8,432.
What is the Total Male Population of Perry County?
Total Male Population of Perry County is 4,197.
What is the Total Female Population of Perry County?
Total Female Population of Perry County is 4,235.
What is the Ratio of Males per 100 Females in Perry County?
There are 99.10 Males per 100 Females in Perry County.
What is the Ratio of Females per 100 Males in Perry County?
There are 100.91 Females per 100 Males in Perry County.
What is the Median Population Age in Perry County?
Median Population Age in Perry County is 42.8 Years.
What is the Average Family Size in Perry County
Average Family Size in Perry County is 3.2 People.
What is the Average Household Size in Perry County
Average Household Size in Perry County is 2.8 People.
How Large is the Labor Force in Perry County?
There are 3,478 People in the Labor Forcein in Perry County.
What is the Percentage of People in the Labor Force in Perry County?
51.3% of People are in the Labor Force in Perry County.
What is the Unemployment Rate in Perry County?
Unemployment Rate in Perry County is 10.9%.