Jefferson County, TN Map & Demographics
Jefferson County Map
Jefferson County Overview
$31,947
PER CAPITA INCOME
$74,977
AVG FAMILY INCOME
$60,393
AVG HOUSEHOLD INCOME
30.0%
WAGE / INCOME GAP [ % ]
70.0¢/ $1
WAGE / INCOME GAP [ $ ]
$8,952
FAMILY INCOME DEFICIT
0.44
INEQUALITY / GINI INDEX
55,017
TOTAL POPULATION
27,186
MALE POPULATION
27,831
FEMALE POPULATION
97.68
MALES / 100 FEMALES
102.37
FEMALES / 100 MALES
44.4
MEDIAN AGE
3.0
AVG FAMILY SIZE
2.6
AVG HOUSEHOLD SIZE
26,738
LABOR FORCE [ PEOPLE ]
58.1%
PERCENT IN LABOR FORCE
5.4%
UNEMPLOYMENT RATE
Jefferson County Area Codes
Income in Jefferson County
Income Overview in Jefferson County
Per Capita Income in Jefferson County is $31,947, while median incomes of families and households are $74,977 and $60,393 respectively.
| Characteristic | Number | Measure |
| Per Capita Income | 55,017 | $31,947 |
| Median Family Income | 14,775 | $74,977 |
| Mean Family Income | 14,775 | $95,197 |
| Median Household Income | 20,813 | $60,393 |
| Mean Household Income | 20,813 | $81,062 |
| Income Deficit | 14,775 | $8,952 |
| Wage / Income Gap (%) | 55,017 | 29.97% |
| Wage / Income Gap ($) | 55,017 | 70.03¢ per $1 |
| Gini / Inequality Index | 55,017 | 0.44 |
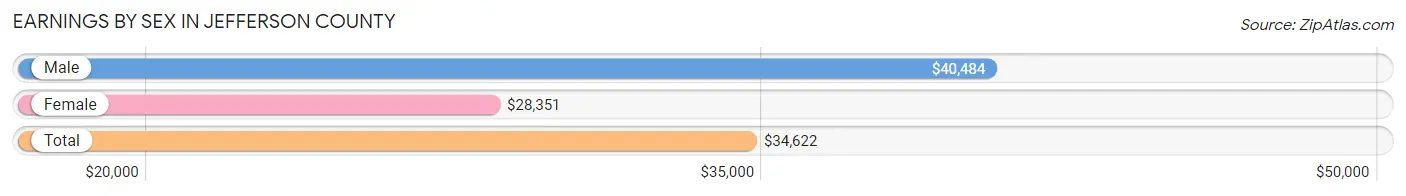
Earnings by Sex in Jefferson County
Average Earnings in Jefferson County are $34,622, $40,484 for men and $28,351 for women, a difference of 30.0%.
| Sex | Number | Average Earnings |
| Male | 15,146 (53.5%) | $40,484 |
| Female | 13,183 (46.5%) | $28,351 |
| Total | 28,329 (100.0%) | $34,622 |
Earnings by Sex by Income Bracket in Jefferson County
The most common earnings brackets in Jefferson County are $75,000 to $99,999 for men (1,960 | 12.9%) and $55,000 to $64,999 for women (1,018 | 7.7%).
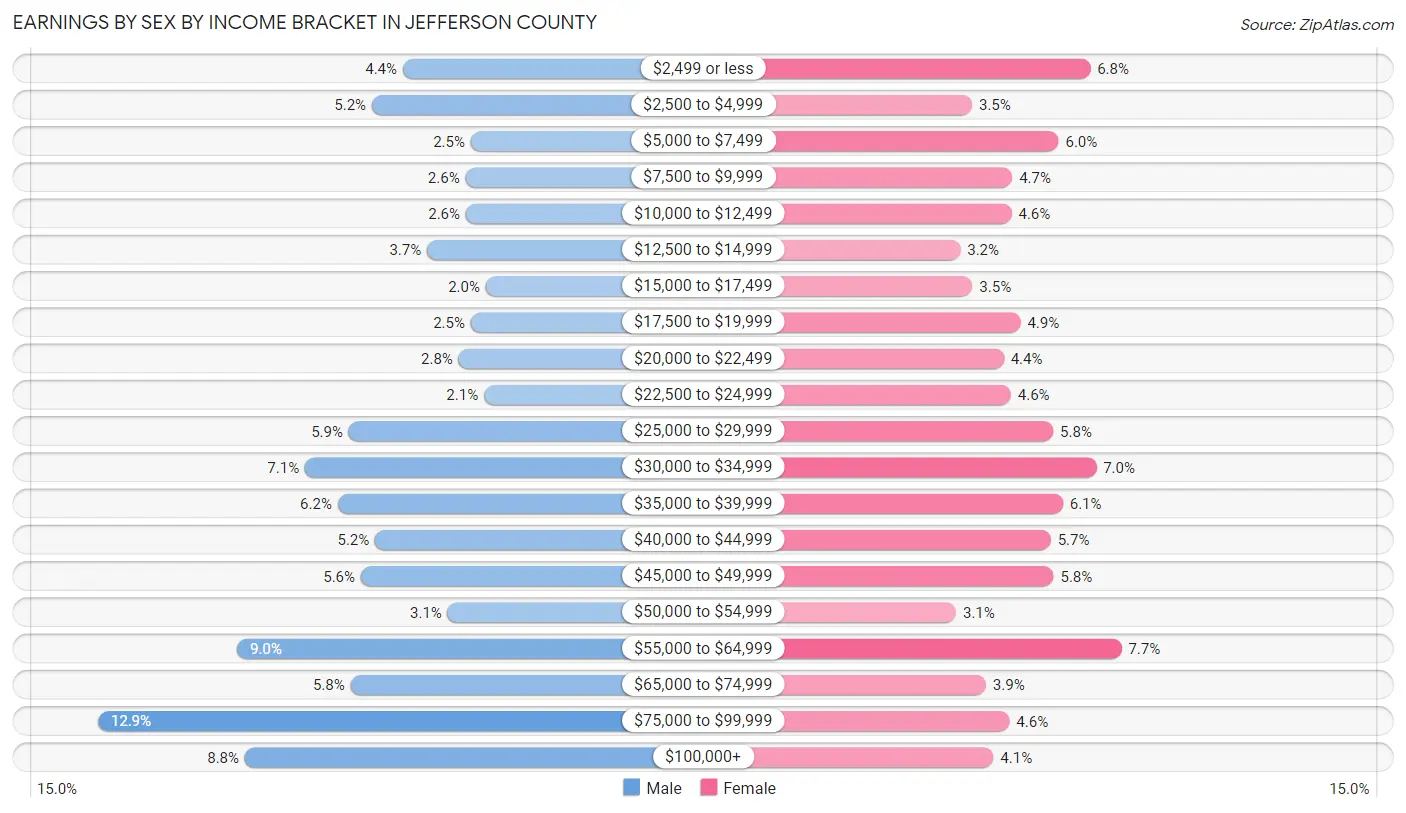
| Income | Male | Female |
| $2,499 or less | 662 (4.4%) | 902 (6.8%) |
| $2,500 to $4,999 | 793 (5.2%) | 464 (3.5%) |
| $5,000 to $7,499 | 372 (2.5%) | 784 (5.9%) |
| $7,500 to $9,999 | 395 (2.6%) | 613 (4.6%) |
| $10,000 to $12,499 | 394 (2.6%) | 610 (4.6%) |
| $12,500 to $14,999 | 559 (3.7%) | 420 (3.2%) |
| $15,000 to $17,499 | 309 (2.0%) | 465 (3.5%) |
| $17,500 to $19,999 | 373 (2.5%) | 643 (4.9%) |
| $20,000 to $22,499 | 424 (2.8%) | 581 (4.4%) |
| $22,500 to $24,999 | 316 (2.1%) | 608 (4.6%) |
| $25,000 to $29,999 | 892 (5.9%) | 764 (5.8%) |
| $30,000 to $34,999 | 1,079 (7.1%) | 924 (7.0%) |
| $35,000 to $39,999 | 939 (6.2%) | 800 (6.1%) |
| $40,000 to $44,999 | 780 (5.1%) | 755 (5.7%) |
| $45,000 to $49,999 | 841 (5.6%) | 766 (5.8%) |
| $50,000 to $54,999 | 471 (3.1%) | 405 (3.1%) |
| $55,000 to $64,999 | 1,368 (9.0%) | 1,018 (7.7%) |
| $65,000 to $74,999 | 885 (5.8%) | 515 (3.9%) |
| $75,000 to $99,999 | 1,960 (12.9%) | 603 (4.6%) |
| $100,000+ | 1,334 (8.8%) | 543 (4.1%) |
| Total | 15,146 (100.0%) | 13,183 (100.0%) |
Earnings by Sex by Educational Attainment in Jefferson County
Average earnings in Jefferson County are $47,837 for men and $34,137 for women, a difference of 28.6%. Men with an educational attainment of graduate degree enjoy the highest average annual earnings of $73,750, while those with less than high school education earn the least with $30,169. Women with an educational attainment of graduate degree earn the most with the average annual earnings of $55,000, while those with high school diploma education have the smallest earnings of $23,928.
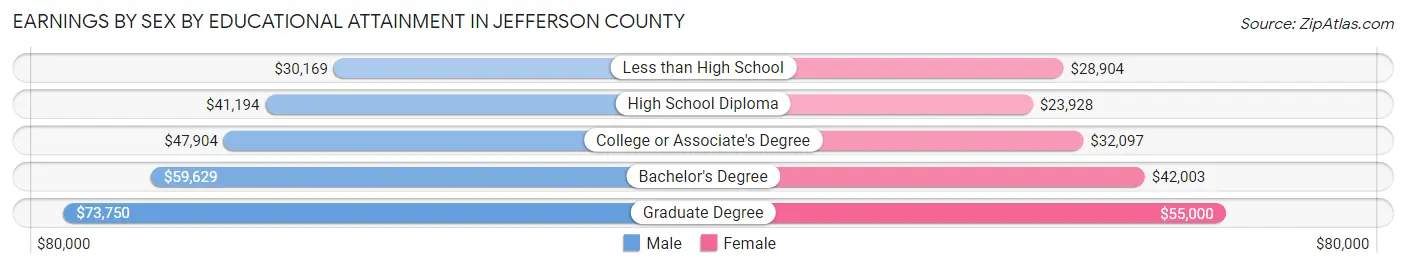
| Educational Attainment | Male Income | Female Income |
| Less than High School | $30,169 | $28,904 |
| High School Diploma | $41,194 | $23,928 |
| College or Associate's Degree | $47,904 | $32,097 |
| Bachelor's Degree | $59,629 | $42,003 |
| Graduate Degree | $73,750 | $55,000 |
| Total | $47,837 | $34,137 |
Family Income in Jefferson County
Family Income Brackets in Jefferson County
According to the Jefferson County family income data, there are 3,118 families falling into the $100,000 to $149,999 income range, which is the most common income bracket and makes up 21.1% of all families. Conversely, the less than $10,000 income bracket is the least frequent group with only 251 families (1.7%) belonging to this category.
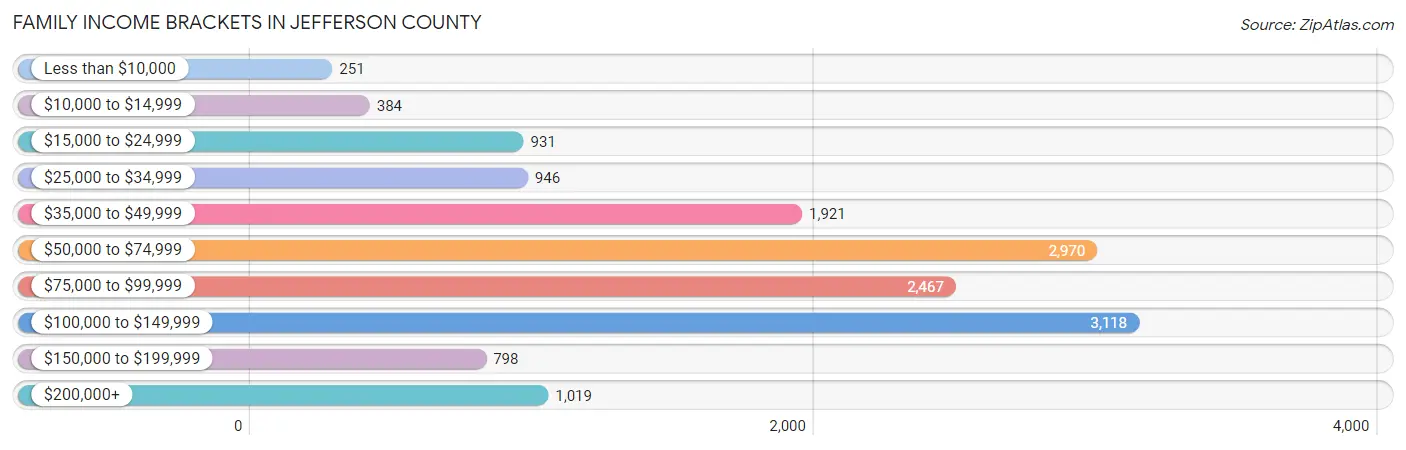
| Income Bracket | # Families | % Families |
| Less than $10,000 | 251 | 1.7% |
| $10,000 to $14,999 | 384 | 2.6% |
| $15,000 to $24,999 | 931 | 6.3% |
| $25,000 to $34,999 | 946 | 6.4% |
| $35,000 to $49,999 | 1,921 | 13.0% |
| $50,000 to $74,999 | 2,970 | 20.1% |
| $75,000 to $99,999 | 2,467 | 16.7% |
| $100,000 to $149,999 | 3,118 | 21.1% |
| $150,000 to $199,999 | 798 | 5.4% |
| $200,000+ | 1,019 | 6.9% |
Family Income by Famaliy Size in Jefferson County
7+ person families (298 | 2.0%) account for the highest median family income in Jefferson County with $111,333 per family, while 2-person families (7,425 | 50.2%) have the highest median income of $32,900 per family member.
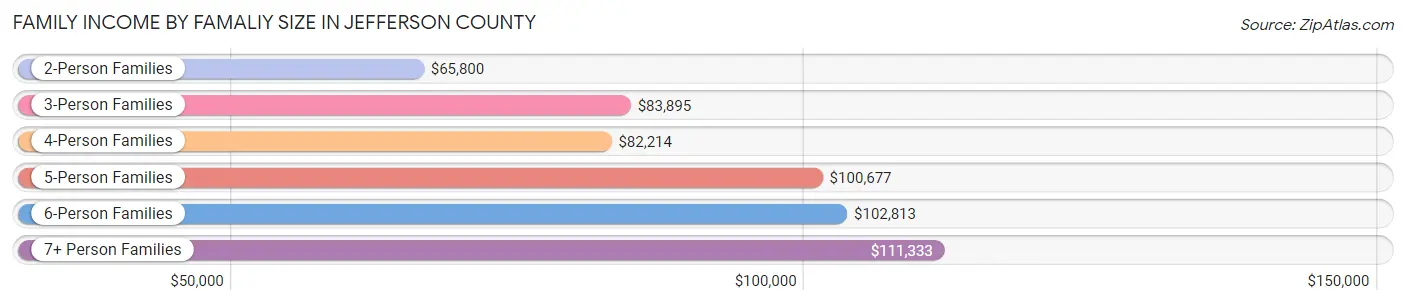
| Income Bracket | # Families | Median Income |
| 2-Person Families | 7,425 (50.2%) | $65,800 |
| 3-Person Families | 3,345 (22.6%) | $83,895 |
| 4-Person Families | 2,355 (15.9%) | $82,214 |
| 5-Person Families | 1,077 (7.3%) | $100,677 |
| 6-Person Families | 275 (1.9%) | $102,813 |
| 7+ Person Families | 298 (2.0%) | $111,333 |
| Total | 14,775 (100.0%) | $74,977 |
Family Income by Number of Earners in Jefferson County
The median family income in Jefferson County is $74,977, with families comprising 3+ earners (1,822) having the highest median family income of $124,657, while families with no earners (2,602) have the lowest median family income of $43,740, accounting for 12.3% and 17.6% of families, respectively.
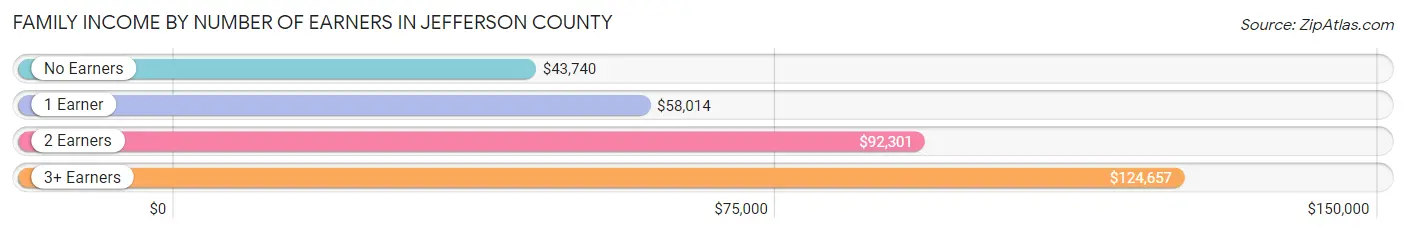
| Number of Earners | # Families | Median Income |
| No Earners | 2,602 (17.6%) | $43,740 |
| 1 Earner | 5,146 (34.8%) | $58,014 |
| 2 Earners | 5,205 (35.2%) | $92,301 |
| 3+ Earners | 1,822 (12.3%) | $124,657 |
| Total | 14,775 (100.0%) | $74,977 |
Household Income in Jefferson County
Household Income Brackets in Jefferson County
With 3,767 households falling in the category, the $50,000 to $74,999 income range is the most frequent in Jefferson County, accounting for 18.1% of all households. In contrast, only 500 households (2.4%) fall into the less than $10,000 income bracket, making it the least populous group.
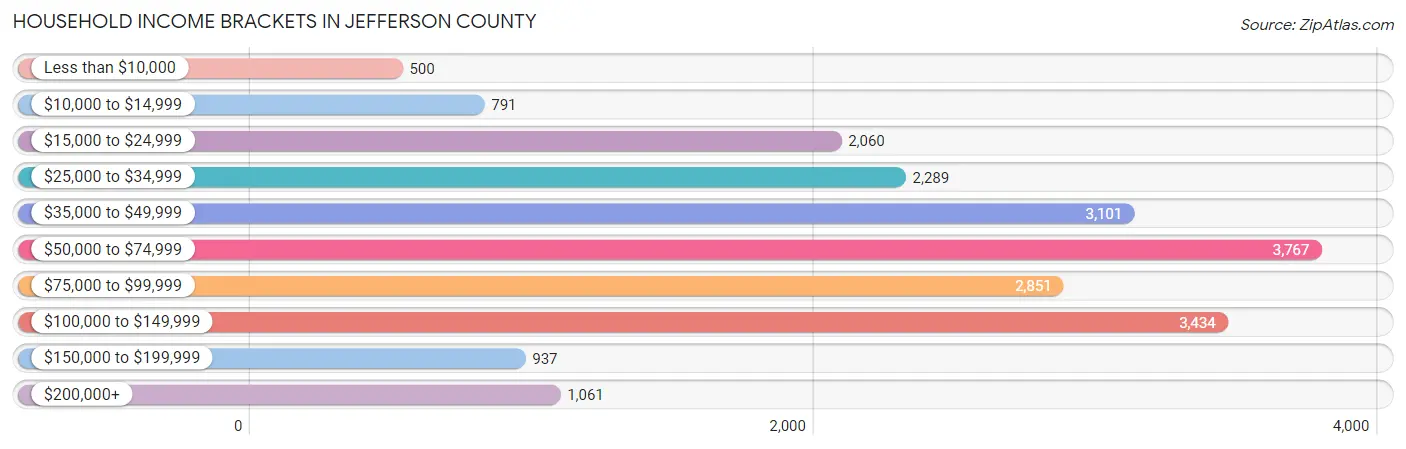
| Income Bracket | # Households | % Households |
| Less than $10,000 | 500 | 2.4% |
| $10,000 to $14,999 | 791 | 3.8% |
| $15,000 to $24,999 | 2,060 | 9.9% |
| $25,000 to $34,999 | 2,289 | 11.0% |
| $35,000 to $49,999 | 3,101 | 14.9% |
| $50,000 to $74,999 | 3,767 | 18.1% |
| $75,000 to $99,999 | 2,851 | 13.7% |
| $100,000 to $149,999 | 3,434 | 16.5% |
| $150,000 to $199,999 | 937 | 4.5% |
| $200,000+ | 1,061 | 5.1% |
Household Income by Householder Age in Jefferson County
The median household income in Jefferson County is $60,393, with the highest median household income of $77,533 found in the 45 to 64 years age bracket for the primary householder. A total of 8,368 households (40.2%) fall into this category. Meanwhile, the 15 to 24 years age bracket for the primary householder has the lowest median household income of $26,902, with 555 households (2.7%) in this group.
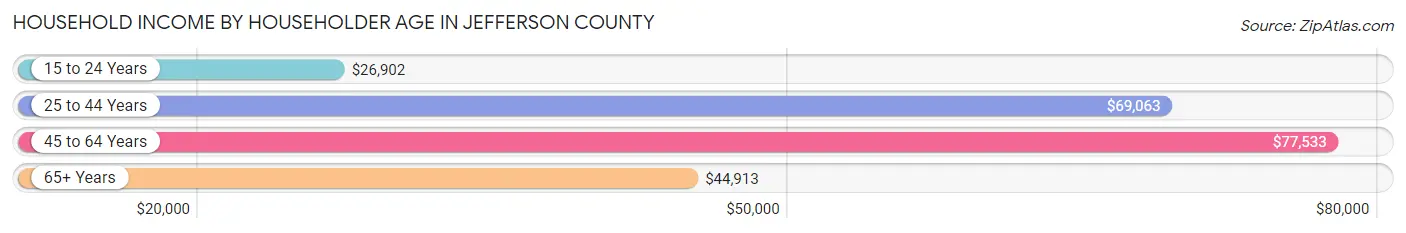
| Income Bracket | # Households | Median Income |
| 15 to 24 Years | 555 (2.7%) | $26,902 |
| 25 to 44 Years | 5,144 (24.7%) | $69,063 |
| 45 to 64 Years | 8,368 (40.2%) | $77,533 |
| 65+ Years | 6,746 (32.4%) | $44,913 |
| Total | 20,813 (100.0%) | $60,393 |
Poverty in Jefferson County
Income Below Poverty by Sex and Age in Jefferson County
With 9.7% poverty level for males and 12.6% for females among the residents of Jefferson County, 12 to 14 year old males and 5 year old females are the most vulnerable to poverty, with 252 males (29.2%) and 34 females (26.8%) in their respective age groups living below the poverty level.
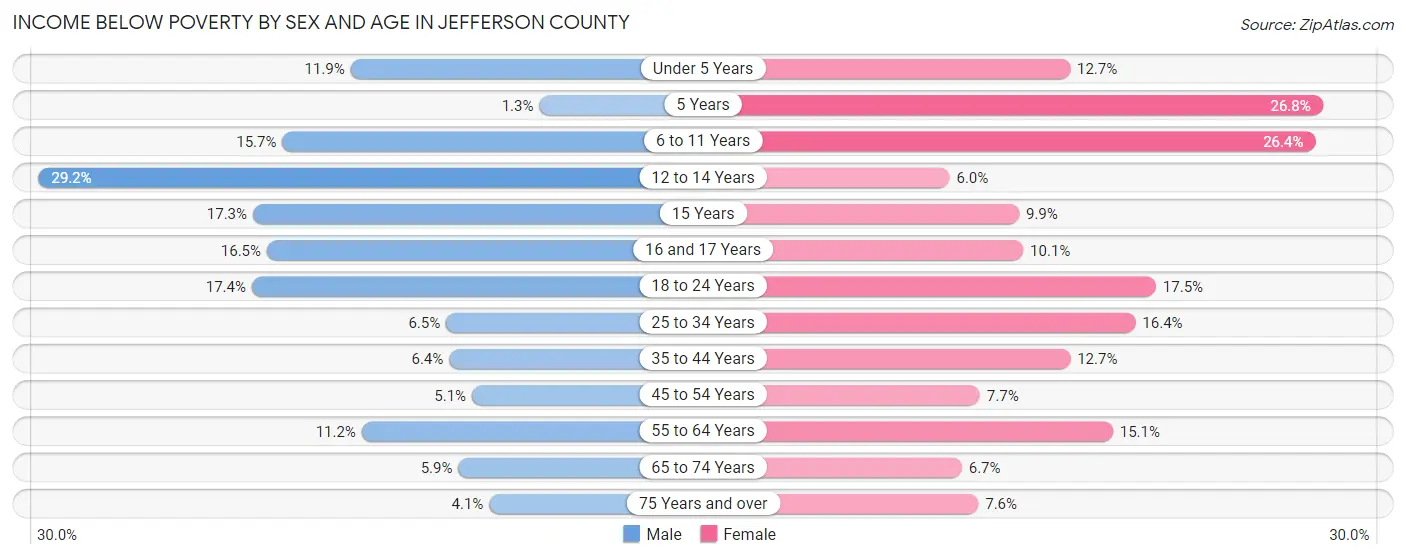
| Age Bracket | Male | Female |
| Under 5 Years | 138 (11.8%) | 164 (12.7%) |
| 5 Years | 4 (1.3%) | 34 (26.8%) |
| 6 to 11 Years | 274 (15.7%) | 480 (26.4%) |
| 12 to 14 Years | 252 (29.2%) | 55 (6.0%) |
| 15 Years | 23 (17.3%) | 38 (9.9%) |
| 16 and 17 Years | 145 (16.5%) | 61 (10.1%) |
| 18 to 24 Years | 382 (17.3%) | 345 (17.5%) |
| 25 to 34 Years | 200 (6.5%) | 477 (16.4%) |
| 35 to 44 Years | 186 (6.4%) | 391 (12.7%) |
| 45 to 54 Years | 190 (5.1%) | 285 (7.7%) |
| 55 to 64 Years | 474 (11.2%) | 653 (15.1%) |
| 65 to 74 Years | 179 (5.9%) | 227 (6.7%) |
| 75 Years and over | 76 (4.1%) | 187 (7.6%) |
| Total | 2,523 (9.7%) | 3,397 (12.6%) |
Income Above Poverty by Sex and Age in Jefferson County
According to the poverty statistics in Jefferson County, males aged 5 years and females aged 12 to 14 years are the age groups that are most secure financially, with 98.7% of males and 94.0% of females in these age groups living above the poverty line.
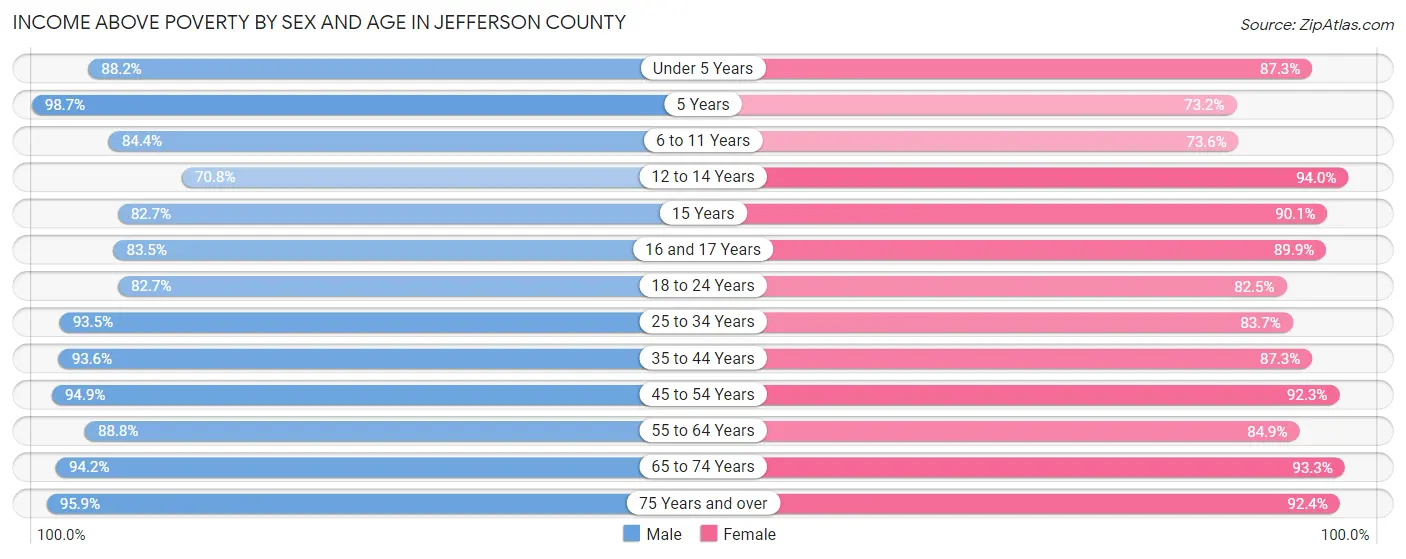
| Age Bracket | Male | Female |
| Under 5 Years | 1,027 (88.1%) | 1,126 (87.3%) |
| 5 Years | 295 (98.7%) | 93 (73.2%) |
| 6 to 11 Years | 1,477 (84.4%) | 1,341 (73.6%) |
| 12 to 14 Years | 610 (70.8%) | 862 (94.0%) |
| 15 Years | 110 (82.7%) | 347 (90.1%) |
| 16 and 17 Years | 733 (83.5%) | 543 (89.9%) |
| 18 to 24 Years | 1,820 (82.7%) | 1,627 (82.5%) |
| 25 to 34 Years | 2,861 (93.5%) | 2,441 (83.7%) |
| 35 to 44 Years | 2,737 (93.6%) | 2,682 (87.3%) |
| 45 to 54 Years | 3,544 (94.9%) | 3,423 (92.3%) |
| 55 to 64 Years | 3,747 (88.8%) | 3,673 (84.9%) |
| 65 to 74 Years | 2,880 (94.2%) | 3,173 (93.3%) |
| 75 Years and over | 1,766 (95.9%) | 2,274 (92.4%) |
| Total | 23,607 (90.3%) | 23,605 (87.4%) |
Income Below Poverty Among Married-Couple Families in Jefferson County
The poverty statistics for married-couple families in Jefferson County show that 3.8% or 434 of the total 11,510 families live below the poverty line. Families with 5 or more children have the highest poverty rate of 14.3%, comprising of 13 families. On the other hand, families with 3 or 4 children have the lowest poverty rate of 2.5%, which includes 18 families.
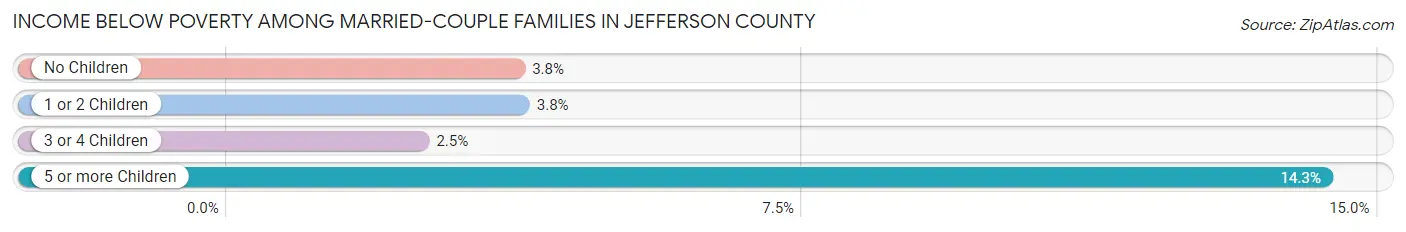
| Children | Above Poverty | Below Poverty |
| No Children | 6,960 (96.3%) | 271 (3.7%) |
| 1 or 2 Children | 3,336 (96.2%) | 132 (3.8%) |
| 3 or 4 Children | 702 (97.5%) | 18 (2.5%) |
| 5 or more Children | 78 (85.7%) | 13 (14.3%) |
| Total | 11,076 (96.2%) | 434 (3.8%) |
Income Below Poverty Among Single-Parent Households in Jefferson County
According to the poverty data in Jefferson County, 16.6% or 165 single-father households and 30.9% or 701 single-mother households are living below the poverty line. Among single-father households, those with 3 or 4 children have the highest poverty rate, with 26 households (70.3%) experiencing poverty. Likewise, among single-mother households, those with 3 or 4 children have the highest poverty rate, with 255 households (83.1%) falling below the poverty line.
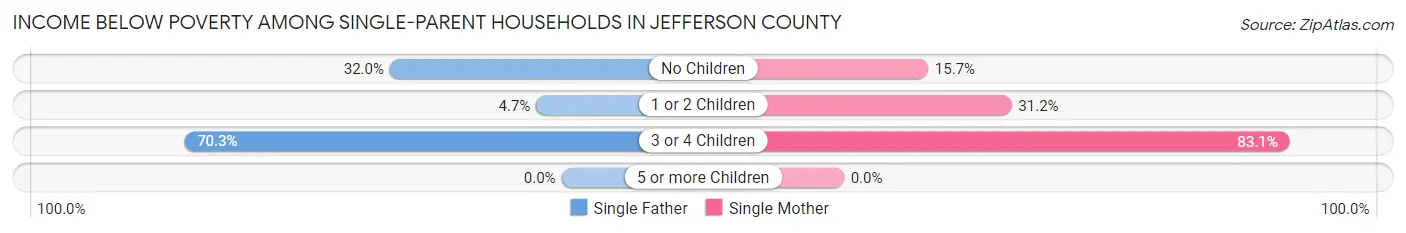
| Children | Single Father | Single Mother |
| No Children | 110 (32.0%) | 168 (15.7%) |
| 1 or 2 Children | 29 (4.7%) | 278 (31.2%) |
| 3 or 4 Children | 26 (70.3%) | 255 (83.1%) |
| 5 or more Children | 0 (0.0%) | 0 (0.0%) |
| Total | 165 (16.6%) | 701 (30.9%) |
Income Below Poverty Among Married-Couple vs Single-Parent Households in Jefferson County
The poverty data for Jefferson County shows that 434 of the married-couple family households (3.8%) and 866 of the single-parent households (26.5%) are living below the poverty level. Within the married-couple family households, those with 5 or more children have the highest poverty rate, with 13 households (14.3%) falling below the poverty line. Among the single-parent households, those with 3 or 4 children have the highest poverty rate, with 281 household (81.7%) living below poverty.
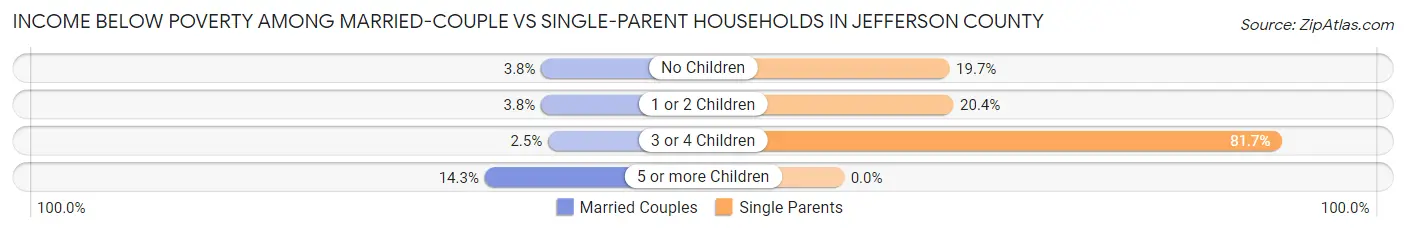
| Children | Married-Couple Families | Single-Parent Households |
| No Children | 271 (3.7%) | 278 (19.7%) |
| 1 or 2 Children | 132 (3.8%) | 307 (20.4%) |
| 3 or 4 Children | 18 (2.5%) | 281 (81.7%) |
| 5 or more Children | 13 (14.3%) | 0 (0.0%) |
| Total | 434 (3.8%) | 866 (26.5%) |
Race in Jefferson County
The most populous races in Jefferson County are White / Caucasian (51,100 | 92.9%), Two or more Races (2,288 | 4.2%), and Hispanic or Latino (2,128 | 3.9%).
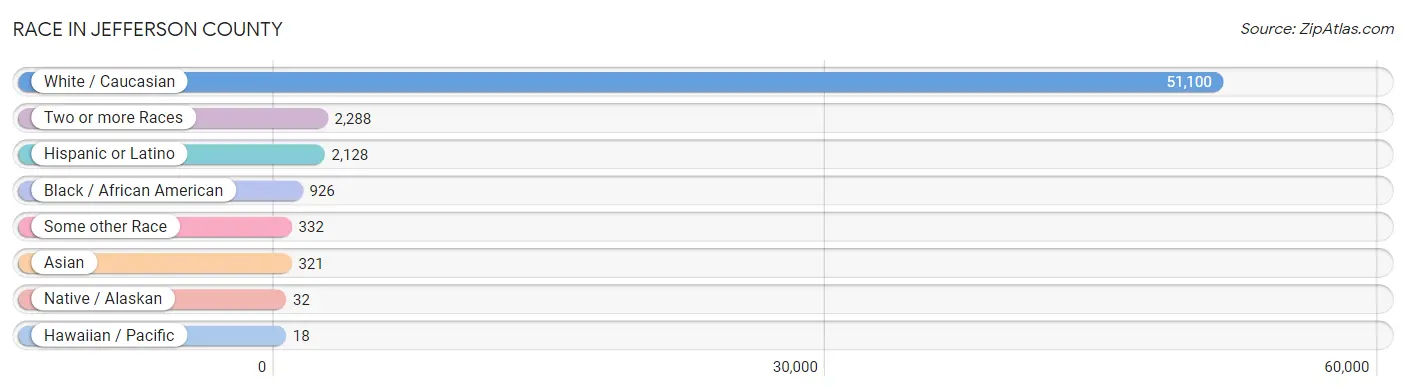
| Race | # Population | % Population |
| Asian | 321 | 0.6% |
| Black / African American | 926 | 1.7% |
| Hawaiian / Pacific | 18 | 0.0% |
| Hispanic or Latino | 2,128 | 3.9% |
| Native / Alaskan | 32 | 0.1% |
| White / Caucasian | 51,100 | 92.9% |
| Two or more Races | 2,288 | 4.2% |
| Some other Race | 332 | 0.6% |
| Total | 55,017 | 100.0% |
Ancestry in Jefferson County
The most populous ancestries reported in Jefferson County are American (10,858 | 19.7%), English (8,223 | 14.9%), German (6,242 | 11.4%), Irish (5,536 | 10.1%), and Scottish (2,639 | 4.8%), together accounting for 60.9% of all Jefferson County residents.
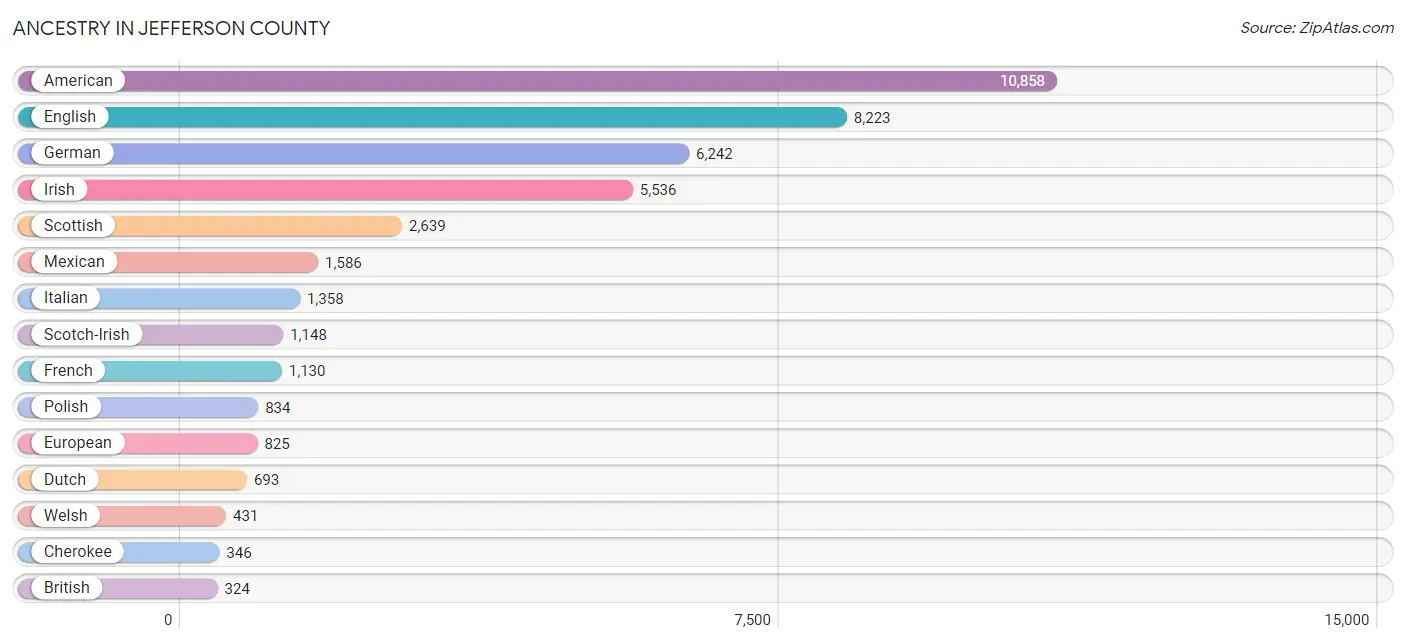
| Ancestry | # Population | % Population |
| African | 11 | 0.0% |
| American | 10,858 | 19.7% |
| Austrian | 15 | 0.0% |
| Belgian | 16 | 0.0% |
| Bhutanese | 10 | 0.0% |
| Blackfeet | 22 | 0.0% |
| British | 324 | 0.6% |
| British West Indian | 31 | 0.1% |
| Burmese | 26 | 0.1% |
| Cajun | 54 | 0.1% |
| Canadian | 28 | 0.1% |
| Central American | 207 | 0.4% |
| Cherokee | 346 | 0.6% |
| Crow | 2 | 0.0% |
| Cuban | 116 | 0.2% |
| Czech | 6 | 0.0% |
| Danish | 20 | 0.0% |
| Dominican | 82 | 0.2% |
| Dutch | 693 | 1.3% |
| Eastern European | 14 | 0.0% |
| English | 8,223 | 14.9% |
| European | 825 | 1.5% |
| Finnish | 4 | 0.0% |
| French | 1,130 | 2.1% |
| French Canadian | 233 | 0.4% |
| German | 6,242 | 11.4% |
| Greek | 51 | 0.1% |
| Guamanian / Chamorro | 5 | 0.0% |
| Guatemalan | 108 | 0.2% |
| Haitian | 7 | 0.0% |
| Honduran | 89 | 0.2% |
| Hungarian | 97 | 0.2% |
| Icelander | 67 | 0.1% |
| Indian (Asian) | 110 | 0.2% |
| Irish | 5,536 | 10.1% |
| Iroquois | 15 | 0.0% |
| Italian | 1,358 | 2.5% |
| Jamaican | 3 | 0.0% |
| Korean | 163 | 0.3% |
| Liberian | 6 | 0.0% |
| Lithuanian | 13 | 0.0% |
| Lumbee | 7 | 0.0% |
| Malaysian | 21 | 0.0% |
| Mexican | 1,586 | 2.9% |
| Native Hawaiian | 24 | 0.0% |
| Nigerian | 3 | 0.0% |
| Northern European | 34 | 0.1% |
| Norwegian | 176 | 0.3% |
| Polish | 834 | 1.5% |
| Portuguese | 18 | 0.0% |
| Puerto Rican | 75 | 0.1% |
| Romanian | 59 | 0.1% |
| Russian | 159 | 0.3% |
| Salvadoran | 10 | 0.0% |
| Samoan | 9 | 0.0% |
| Scandinavian | 16 | 0.0% |
| Scotch-Irish | 1,148 | 2.1% |
| Scottish | 2,639 | 4.8% |
| Shoshone | 68 | 0.1% |
| Slavic | 37 | 0.1% |
| Slovak | 21 | 0.0% |
| South African | 4 | 0.0% |
| Spaniard | 56 | 0.1% |
| Sri Lankan | 23 | 0.0% |
| Subsaharan African | 38 | 0.1% |
| Swedish | 249 | 0.4% |
| Swiss | 128 | 0.2% |
| Thai | 104 | 0.2% |
| Ukrainian | 106 | 0.2% |
| Welsh | 431 | 0.8% |
| West Indian | 7 | 0.0% |
| Yugoslavian | 87 | 0.2% | View All 72 Rows |
Immigrants in Jefferson County
The most numerous immigrant groups reported in Jefferson County came from Latin America (681 | 1.2%), Central America (667 | 1.2%), Mexico (508 | 0.9%), Asia (233 | 0.4%), and Europe (218 | 0.4%), together accounting for 4.2% of all Jefferson County residents.
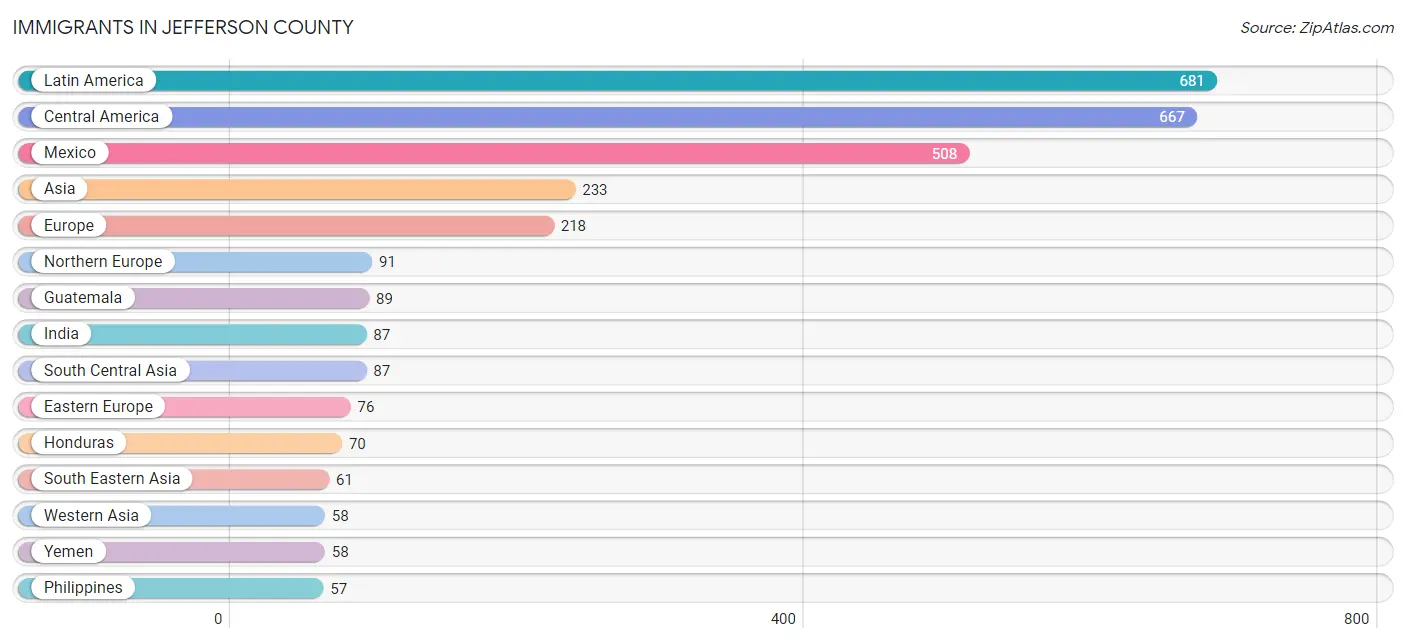
| Immigration Origin | # Population | % Population |
| Africa | 26 | 0.1% |
| Asia | 233 | 0.4% |
| Bosnia and Herzegovina | 39 | 0.1% |
| Canada | 21 | 0.0% |
| Caribbean | 9 | 0.0% |
| Central America | 667 | 1.2% |
| China | 5 | 0.0% |
| Colombia | 5 | 0.0% |
| Croatia | 7 | 0.0% |
| Cuba | 9 | 0.0% |
| Eastern Asia | 27 | 0.1% |
| Eastern Europe | 76 | 0.1% |
| England | 33 | 0.1% |
| Europe | 218 | 0.4% |
| Germany | 34 | 0.1% |
| Guatemala | 89 | 0.2% |
| Honduras | 70 | 0.1% |
| India | 87 | 0.2% |
| Korea | 22 | 0.0% |
| Latin America | 681 | 1.2% |
| Liberia | 6 | 0.0% |
| Mexico | 508 | 0.9% |
| Netherlands | 7 | 0.0% |
| Northern Europe | 91 | 0.2% |
| Philippines | 57 | 0.1% |
| South Africa | 20 | 0.0% |
| South America | 5 | 0.0% |
| South Central Asia | 87 | 0.2% |
| South Eastern Asia | 61 | 0.1% |
| Switzerland | 10 | 0.0% |
| Ukraine | 30 | 0.1% |
| Vietnam | 4 | 0.0% |
| Western Africa | 6 | 0.0% |
| Western Asia | 58 | 0.1% |
| Western Europe | 51 | 0.1% |
| Yemen | 58 | 0.1% | View All 36 Rows |
Sex and Age in Jefferson County
Sex and Age in Jefferson County
The most populous age groups in Jefferson County are 55 to 59 Years (2,285 | 8.4%) for men and 60 to 64 Years (2,311 | 8.3%) for women.
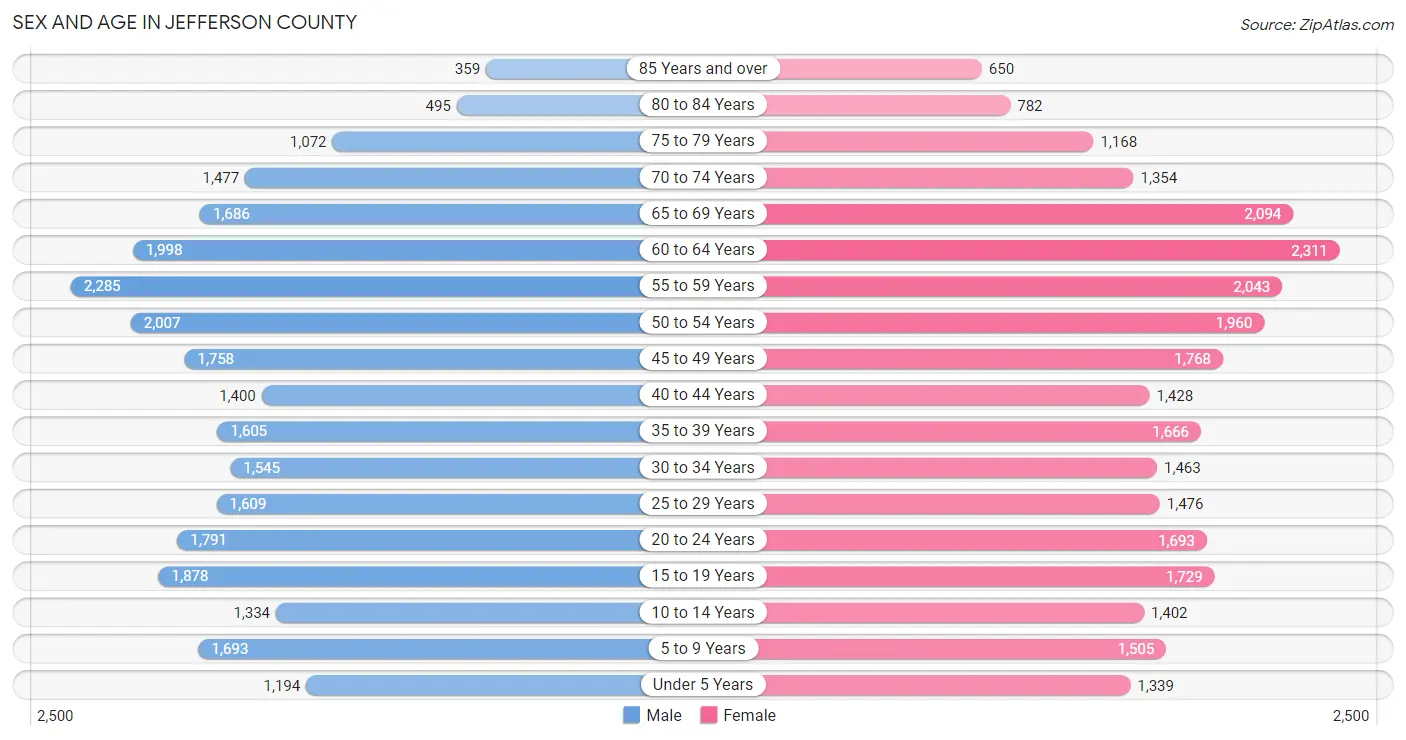
| Age Bracket | Male | Female |
| Under 5 Years | 1,194 (4.4%) | 1,339 (4.8%) |
| 5 to 9 Years | 1,693 (6.2%) | 1,505 (5.4%) |
| 10 to 14 Years | 1,334 (4.9%) | 1,402 (5.0%) |
| 15 to 19 Years | 1,878 (6.9%) | 1,729 (6.2%) |
| 20 to 24 Years | 1,791 (6.6%) | 1,693 (6.1%) |
| 25 to 29 Years | 1,609 (5.9%) | 1,476 (5.3%) |
| 30 to 34 Years | 1,545 (5.7%) | 1,463 (5.3%) |
| 35 to 39 Years | 1,605 (5.9%) | 1,666 (6.0%) |
| 40 to 44 Years | 1,400 (5.1%) | 1,428 (5.1%) |
| 45 to 49 Years | 1,758 (6.5%) | 1,768 (6.4%) |
| 50 to 54 Years | 2,007 (7.4%) | 1,960 (7.0%) |
| 55 to 59 Years | 2,285 (8.4%) | 2,043 (7.3%) |
| 60 to 64 Years | 1,998 (7.3%) | 2,311 (8.3%) |
| 65 to 69 Years | 1,686 (6.2%) | 2,094 (7.5%) |
| 70 to 74 Years | 1,477 (5.4%) | 1,354 (4.9%) |
| 75 to 79 Years | 1,072 (3.9%) | 1,168 (4.2%) |
| 80 to 84 Years | 495 (1.8%) | 782 (2.8%) |
| 85 Years and over | 359 (1.3%) | 650 (2.3%) |
| Total | 27,186 (100.0%) | 27,831 (100.0%) |
Families and Households in Jefferson County
Median Family Size in Jefferson County
The median family size in Jefferson County is 3.02 persons per family, with married-couple families (11,510 | 77.9%) accounting for the largest median family size of 3.04 persons per family. On the other hand, single female/mother families (2,268 | 15.3%) represent the smallest median family size with 2.90 persons per family.
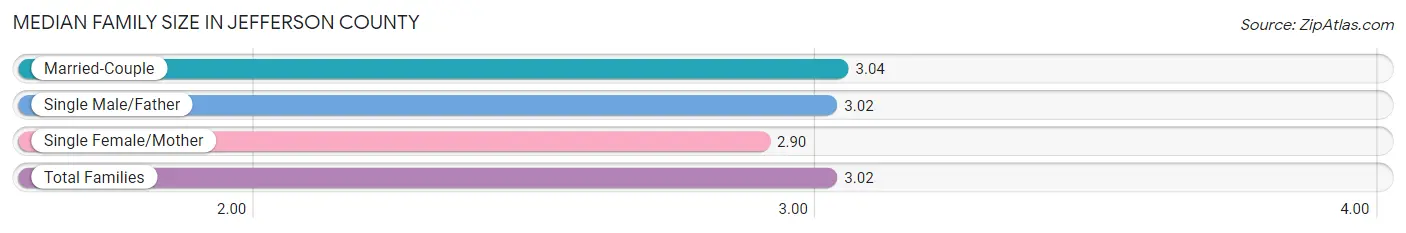
| Family Type | # Families | Family Size |
| Married-Couple | 11,510 (77.9%) | 3.04 |
| Single Male/Father | 997 (6.8%) | 3.02 |
| Single Female/Mother | 2,268 (15.3%) | 2.90 |
| Total Families | 14,775 (100.0%) | 3.02 |
Median Household Size in Jefferson County
The median household size in Jefferson County is 2.56 persons per household, with single male/father households (997 | 4.8%) accounting for the largest median household size of 3.47 persons per household. non-family households (6,038 | 29.0%) represent the smallest median household size with 1.23 persons per household.
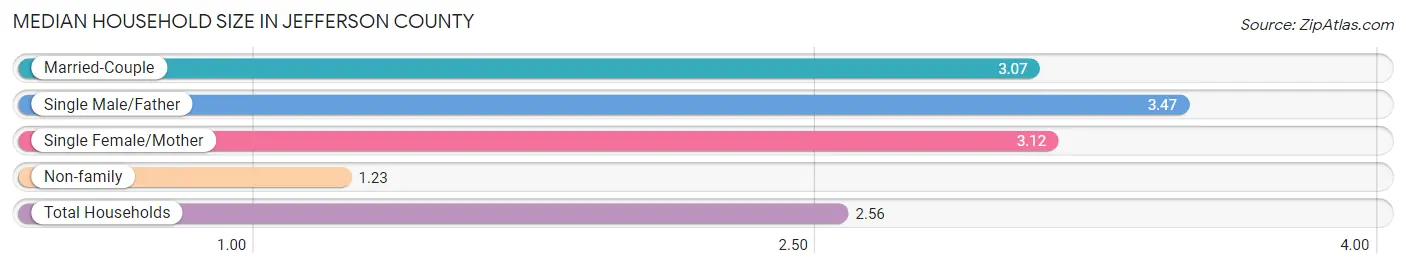
| Household Type | # Households | Household Size |
| Married-Couple | 11,510 (55.3%) | 3.07 |
| Single Male/Father | 997 (4.8%) | 3.47 |
| Single Female/Mother | 2,268 (10.9%) | 3.12 |
| Non-family | 6,038 (29.0%) | 1.23 |
| Total Households | 20,813 (100.0%) | 2.56 |
Household Size by Marriage Status in Jefferson County
Out of a total of 20,813 households in Jefferson County, 14,775 (71.0%) are family households, while 6,038 (29.0%) are nonfamily households. The most numerous type of family households are 2-person households, comprising 6,974, and the most common type of nonfamily households are 1-person households, comprising 5,191.
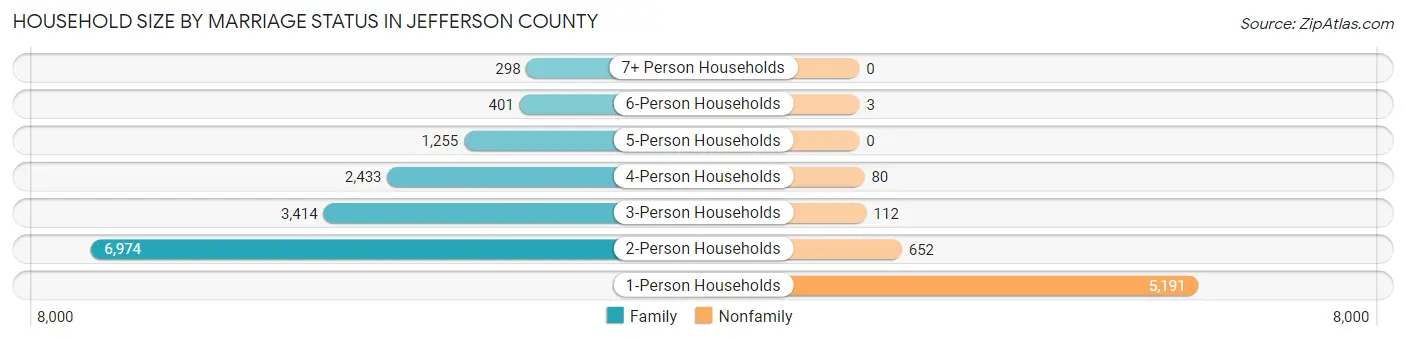
| Household Size | Family Households | Nonfamily Households |
| 1-Person Households | - | 5,191 (24.9%) |
| 2-Person Households | 6,974 (33.5%) | 652 (3.1%) |
| 3-Person Households | 3,414 (16.4%) | 112 (0.5%) |
| 4-Person Households | 2,433 (11.7%) | 80 (0.4%) |
| 5-Person Households | 1,255 (6.0%) | 0 (0.0%) |
| 6-Person Households | 401 (1.9%) | 3 (0.0%) |
| 7+ Person Households | 298 (1.4%) | 0 (0.0%) |
| Total | 14,775 (71.0%) | 6,038 (29.0%) |
Female Fertility in Jefferson County
Fertility by Age in Jefferson County
Average fertility rate in Jefferson County is 56.0 births per 1,000 women. Women in the age bracket of 20 to 34 years have the highest fertility rate with 110.0 births per 1,000 women. Women in the age bracket of 20 to 34 years acount for 78.7% of all women with births.
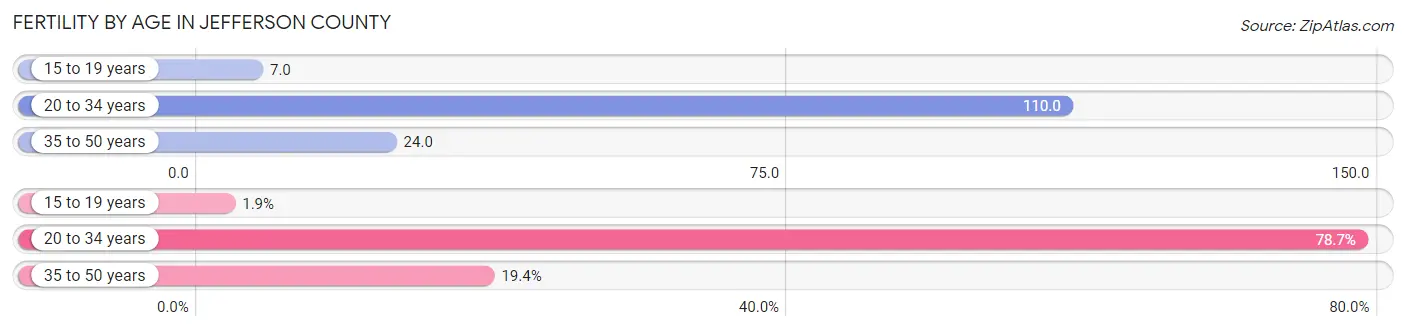
| Age Bracket | Women with Births | Births / 1,000 Women |
| 15 to 19 years | 12 (1.8%) | 7.0 |
| 20 to 34 years | 510 (78.7%) | 110.0 |
| 35 to 50 years | 126 (19.4%) | 24.0 |
| Total | 648 (100.0%) | 56.0 |
Fertility by Age by Marriage Status in Jefferson County
88.4% of women with births (648) in Jefferson County are married. The highest percentage of unmarried women with births falls into 15 to 19 years age bracket with 100.0% of them unmarried at the time of birth, while the lowest percentage of unmarried women with births belong to 20 to 34 years age bracket with 7.3% of them unmarried.
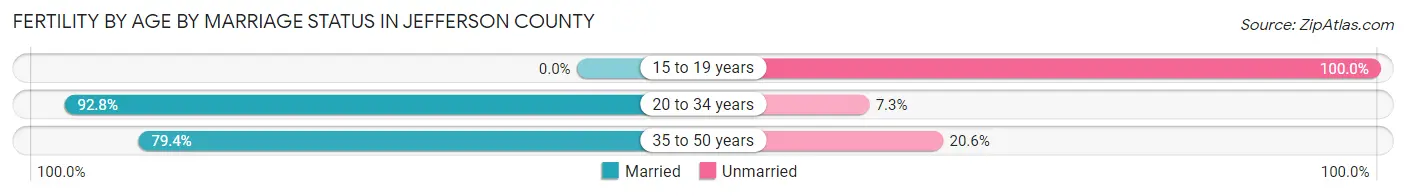
| Age Bracket | Married | Unmarried |
| 15 to 19 years | 0 (0.0%) | 12 (100.0%) |
| 20 to 34 years | 473 (92.7%) | 37 (7.2%) |
| 35 to 50 years | 100 (79.4%) | 26 (20.6%) |
| Total | 573 (88.4%) | 75 (11.6%) |
Fertility by Education in Jefferson County
Average fertility rate in Jefferson County is 56.0 births per 1,000 women. Women with the education attainment of bachelor's degree have the highest fertility rate of 154.0 births per 1,000 women, while women with the education attainment of less than high school have the lowest fertility at 10.0 births per 1,000 women. Women with the education attainment of college or associate's degree represent 38.3% of all women with births.
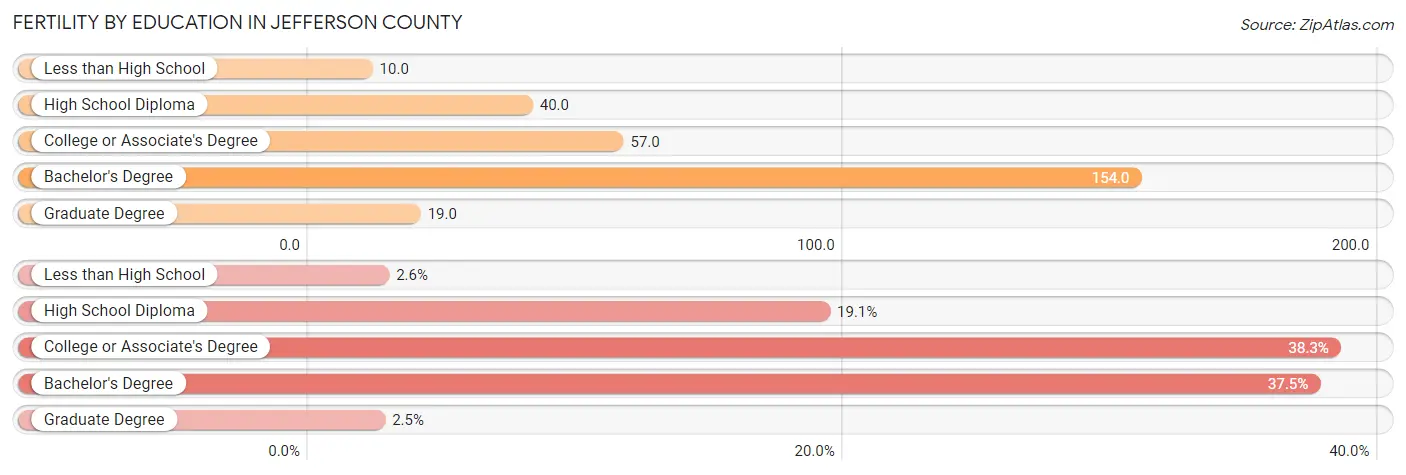
| Educational Attainment | Women with Births | Births / 1,000 Women |
| Less than High School | 17 (2.6%) | 10.0 |
| High School Diploma | 124 (19.1%) | 40.0 |
| College or Associate's Degree | 248 (38.3%) | 57.0 |
| Bachelor's Degree | 243 (37.5%) | 154.0 |
| Graduate Degree | 16 (2.5%) | 19.0 |
| Total | 648 (100.0%) | 56.0 |
Fertility by Education by Marriage Status in Jefferson County
11.6% of women with births in Jefferson County are unmarried. Women with the educational attainment of less than high school are most likely to be married with 100.0% of them married at childbirth, while women with the educational attainment of high school diploma are least likely to be married with 25.8% of them unmarried at childbirth.
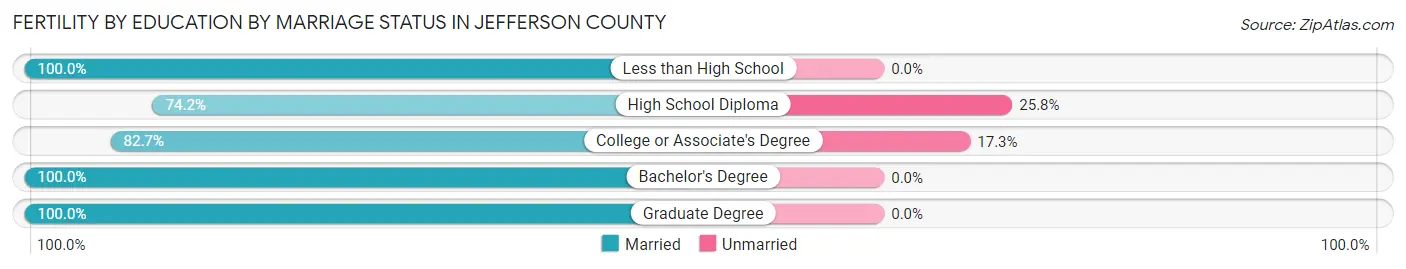
| Educational Attainment | Married | Unmarried |
| Less than High School | 17 (100.0%) | 0 (0.0%) |
| High School Diploma | 92 (74.2%) | 32 (25.8%) |
| College or Associate's Degree | 205 (82.7%) | 43 (17.3%) |
| Bachelor's Degree | 243 (100.0%) | 0 (0.0%) |
| Graduate Degree | 16 (100.0%) | 0 (0.0%) |
| Total | 573 (88.4%) | 75 (11.6%) |
Employment Characteristics in Jefferson County
Employment by Class of Employer in Jefferson County
Among the 24,606 employed individuals in Jefferson County, private company employees (17,379 | 70.6%), local government employees (2,063 | 8.4%), and self-employed (not incorporated) (1,806 | 7.3%) make up the most common classes of employment.
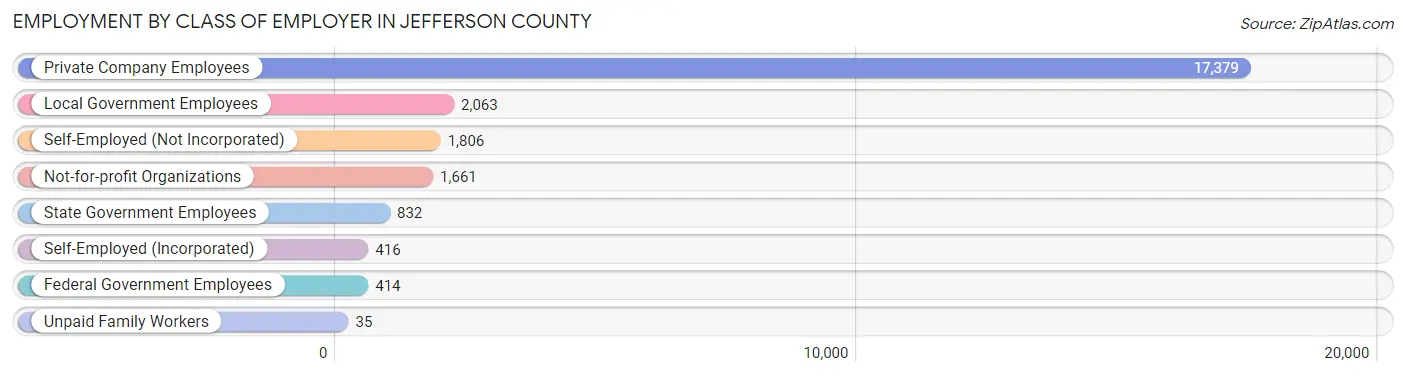
| Employer Class | # Employees | % Employees |
| Private Company Employees | 17,379 | 70.6% |
| Self-Employed (Incorporated) | 416 | 1.7% |
| Self-Employed (Not Incorporated) | 1,806 | 7.3% |
| Not-for-profit Organizations | 1,661 | 6.8% |
| Local Government Employees | 2,063 | 8.4% |
| State Government Employees | 832 | 3.4% |
| Federal Government Employees | 414 | 1.7% |
| Unpaid Family Workers | 35 | 0.1% |
| Total | 24,606 | 100.0% |
Employment Status by Age in Jefferson County
According to the labor force statistics for Jefferson County, out of the total population over 16 years of age (46,020), 58.1% or 26,738 individuals are in the labor force, with 5.4% or 1,444 of them unemployed. The age group with the highest labor force participation rate is 30 to 34 years, with 83.6% or 2,515 individuals in the labor force. Within the labor force, the 60 to 64 years age range has the highest percentage of unemployed individuals, with 9.9% or 190 of them being unemployed.
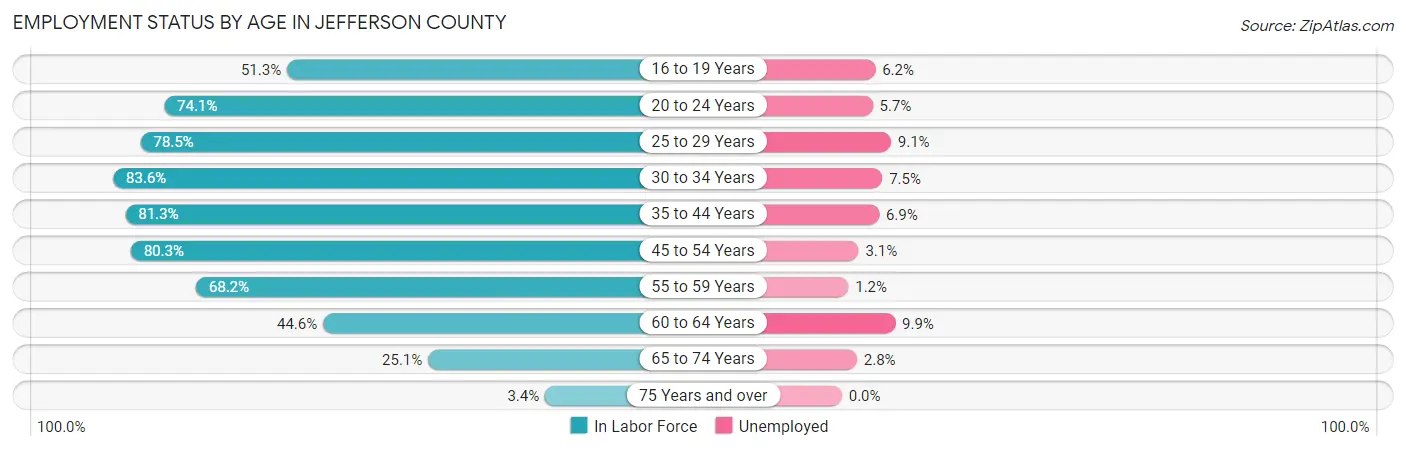
| Age Bracket | In Labor Force | Unemployed |
| 16 to 19 Years | 1,579 (51.3%) | 98 (6.2%) |
| 20 to 24 Years | 2,582 (74.1%) | 147 (5.7%) |
| 25 to 29 Years | 2,422 (78.5%) | 220 (9.1%) |
| 30 to 34 Years | 2,515 (83.6%) | 189 (7.5%) |
| 35 to 44 Years | 4,958 (81.3%) | 342 (6.9%) |
| 45 to 54 Years | 6,017 (80.3%) | 187 (3.1%) |
| 55 to 59 Years | 2,952 (68.2%) | 35 (1.2%) |
| 60 to 64 Years | 1,922 (44.6%) | 190 (9.9%) |
| 65 to 74 Years | 1,659 (25.1%) | 46 (2.8%) |
| 75 Years and over | 154 (3.4%) | 0 (0.0%) |
| Total | 26,738 (58.1%) | 1,444 (5.4%) |
Employment Status by Educational Attainment in Jefferson County
According to labor force statistics for Jefferson County, 73.4% of individuals (20,788) out of the total population between 25 and 64 years of age (28,322) are in the labor force, with 5.6% or 1,164 of them being unemployed. The group with the highest labor force participation rate are those with the educational attainment of bachelor's degree or higher, with 88.0% or 5,438 individuals in the labor force. Within the labor force, individuals with less than high school education have the highest percentage of unemployment, with 12.8% or 190 of them being unemployed.
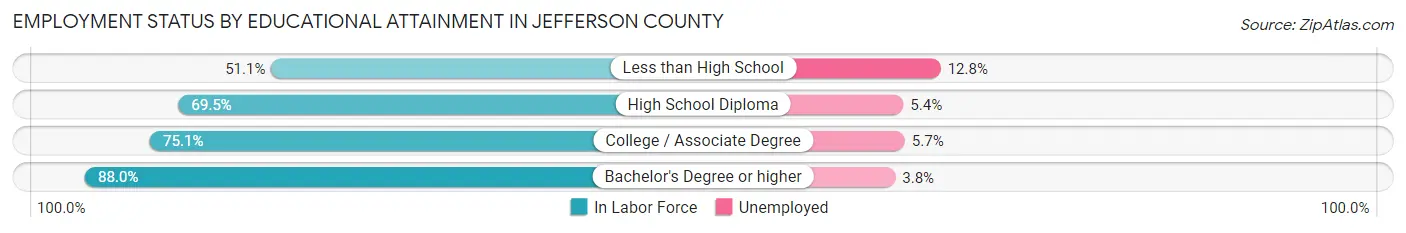
| Educational Attainment | In Labor Force | Unemployed |
| Less than High School | 1,488 (51.1%) | 373 (12.8%) |
| High School Diploma | 7,370 (69.5%) | 573 (5.4%) |
| College / Associate Degree | 6,478 (75.1%) | 492 (5.7%) |
| Bachelor's Degree or higher | 5,438 (88.0%) | 235 (3.8%) |
| Total | 20,788 (73.4%) | 1,586 (5.6%) |
Employment Occupations by Sex in Jefferson County
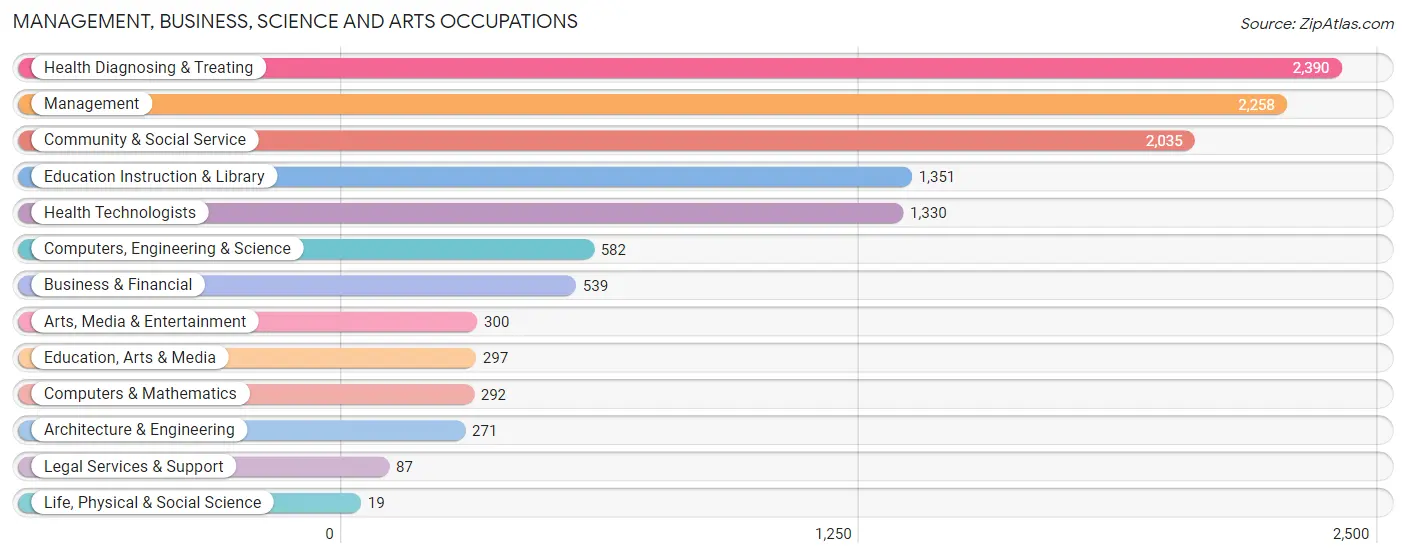
Management, Business, Science and Arts Occupations
The most common Management, Business, Science and Arts occupations in Jefferson County are Health Diagnosing & Treating (2,390 | 9.5%), Management (2,258 | 8.9%), Community & Social Service (2,035 | 8.1%), Education Instruction & Library (1,351 | 5.3%), and Health Technologists (1,330 | 5.3%).
Management, Business, Science and Arts Occupations by Sex
Within the Management, Business, Science and Arts occupations in Jefferson County, the most male-oriented occupations are Architecture & Engineering (85.2%), Computers, Engineering & Science (74.6%), and Life, Physical & Social Science (73.7%), while the most female-oriented occupations are Legal Services & Support (77.0%), Health Diagnosing & Treating (73.1%), and Health Technologists (69.5%).
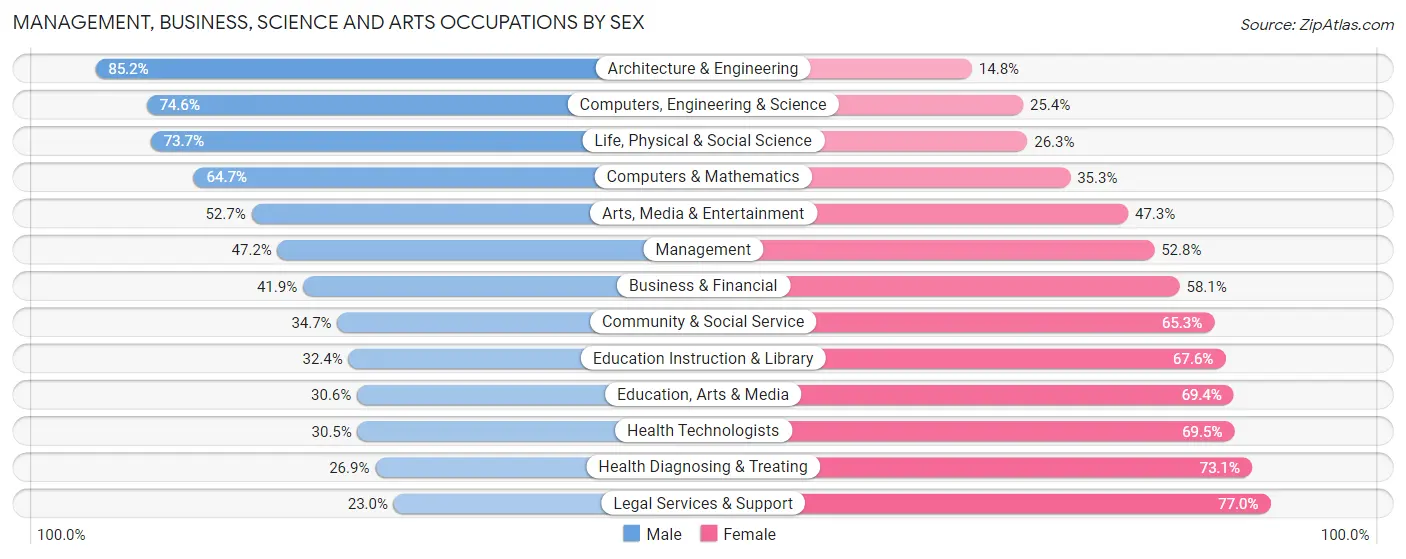
| Occupation | Male | Female |
| Management | 1,066 (47.2%) | 1,192 (52.8%) |
| Business & Financial | 226 (41.9%) | 313 (58.1%) |
| Computers, Engineering & Science | 434 (74.6%) | 148 (25.4%) |
| Computers & Mathematics | 189 (64.7%) | 103 (35.3%) |
| Architecture & Engineering | 231 (85.2%) | 40 (14.8%) |
| Life, Physical & Social Science | 14 (73.7%) | 5 (26.3%) |
| Community & Social Service | 707 (34.7%) | 1,328 (65.3%) |
| Education, Arts & Media | 91 (30.6%) | 206 (69.4%) |
| Legal Services & Support | 20 (23.0%) | 67 (77.0%) |
| Education Instruction & Library | 438 (32.4%) | 913 (67.6%) |
| Arts, Media & Entertainment | 158 (52.7%) | 142 (47.3%) |
| Health Diagnosing & Treating | 642 (26.9%) | 1,748 (73.1%) |
| Health Technologists | 406 (30.5%) | 924 (69.5%) |
| Total (Category) | 3,075 (39.4%) | 4,729 (60.6%) |
| Total (Overall) | 13,712 (54.2%) | 11,565 (45.8%) |
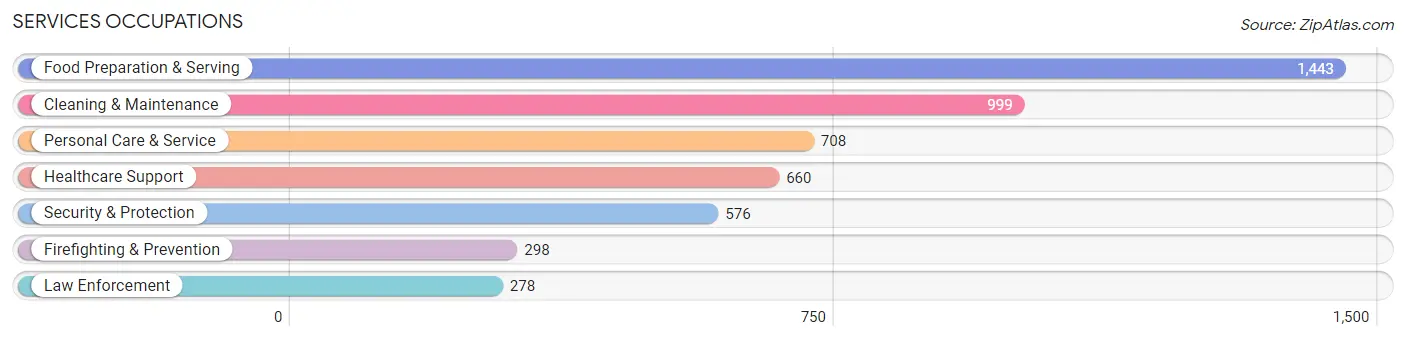
Services Occupations
The most common Services occupations in Jefferson County are Food Preparation & Serving (1,443 | 5.7%), Cleaning & Maintenance (999 | 4.0%), Personal Care & Service (708 | 2.8%), Healthcare Support (660 | 2.6%), and Security & Protection (576 | 2.3%).
Services Occupations by Sex
Within the Services occupations in Jefferson County, the most male-oriented occupations are Law Enforcement (87.4%), Cleaning & Maintenance (81.1%), and Security & Protection (75.9%), while the most female-oriented occupations are Healthcare Support (93.5%), Food Preparation & Serving (70.9%), and Personal Care & Service (66.7%).
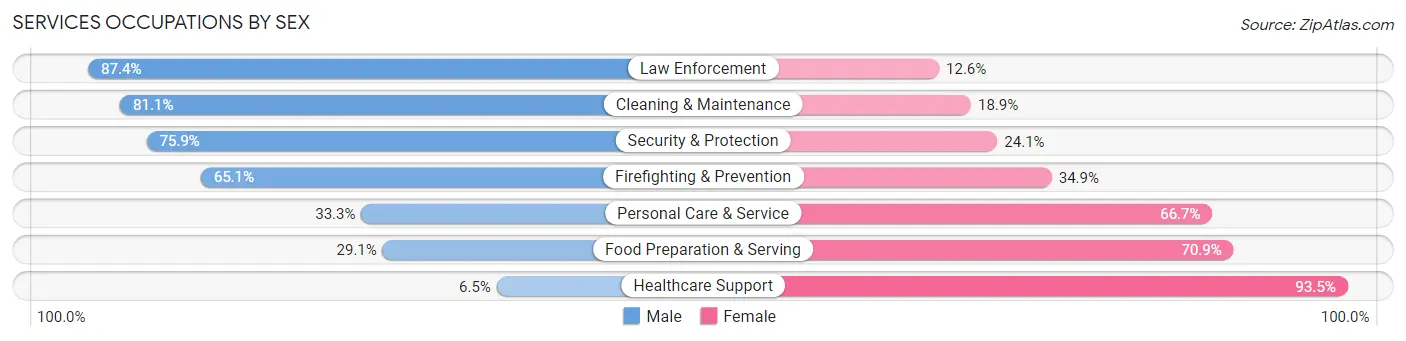
| Occupation | Male | Female |
| Healthcare Support | 43 (6.5%) | 617 (93.5%) |
| Security & Protection | 437 (75.9%) | 139 (24.1%) |
| Firefighting & Prevention | 194 (65.1%) | 104 (34.9%) |
| Law Enforcement | 243 (87.4%) | 35 (12.6%) |
| Food Preparation & Serving | 420 (29.1%) | 1,023 (70.9%) |
| Cleaning & Maintenance | 810 (81.1%) | 189 (18.9%) |
| Personal Care & Service | 236 (33.3%) | 472 (66.7%) |
| Total (Category) | 1,946 (44.4%) | 2,440 (55.6%) |
| Total (Overall) | 13,712 (54.2%) | 11,565 (45.8%) |
Sales and Office Occupations
The most common Sales and Office occupations in Jefferson County are Sales & Related (3,377 | 13.4%), and Office & Administration (2,077 | 8.2%).
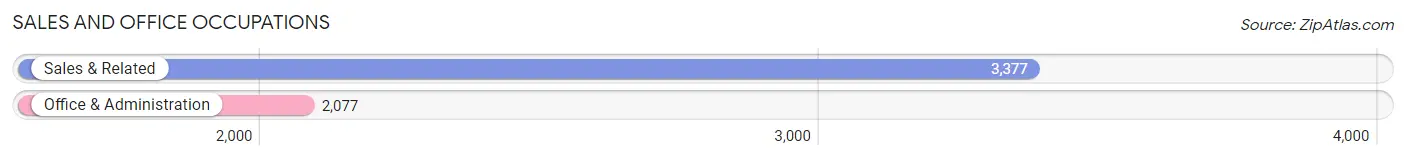
Sales and Office Occupations by Sex
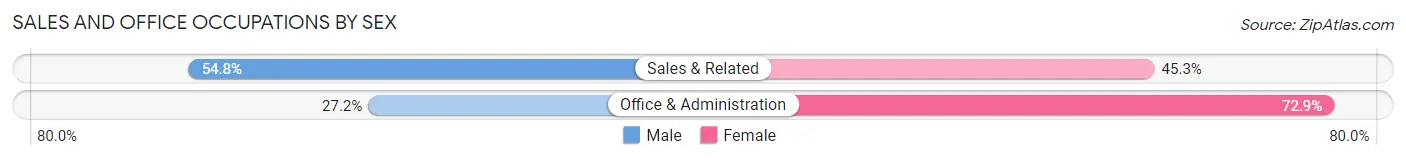
| Occupation | Male | Female |
| Sales & Related | 1,849 (54.7%) | 1,528 (45.3%) |
| Office & Administration | 564 (27.2%) | 1,513 (72.9%) |
| Total (Category) | 2,413 (44.2%) | 3,041 (55.8%) |
| Total (Overall) | 13,712 (54.2%) | 11,565 (45.8%) |
Natural Resources, Construction and Maintenance Occupations
The most common Natural Resources, Construction and Maintenance occupations in Jefferson County are Construction & Extraction (1,703 | 6.7%), Installation, Maintenance & Repair (1,113 | 4.4%), and Farming, Fishing & Forestry (85 | 0.3%).
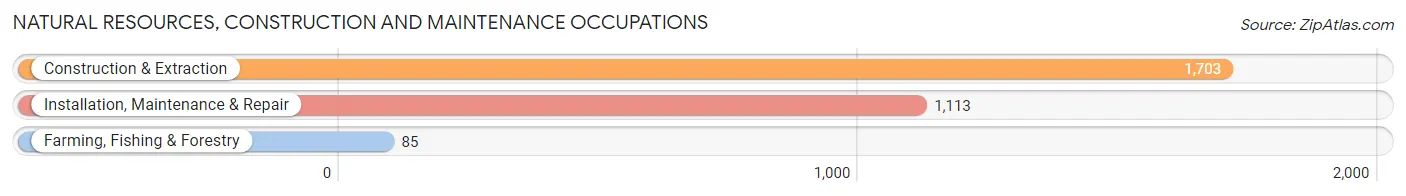
Natural Resources, Construction and Maintenance Occupations by Sex
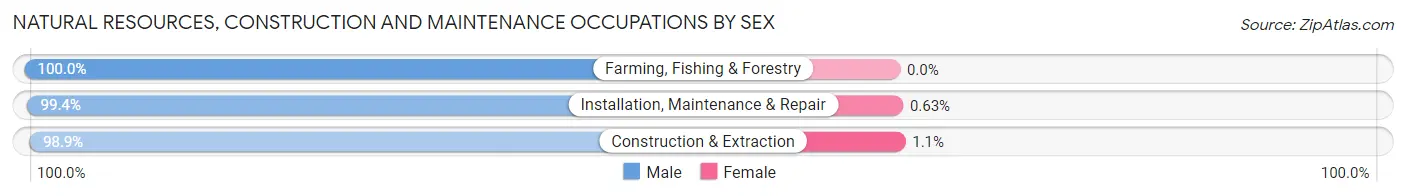
| Occupation | Male | Female |
| Farming, Fishing & Forestry | 85 (100.0%) | 0 (0.0%) |
| Construction & Extraction | 1,684 (98.9%) | 19 (1.1%) |
| Installation, Maintenance & Repair | 1,106 (99.4%) | 7 (0.6%) |
| Total (Category) | 2,875 (99.1%) | 26 (0.9%) |
| Total (Overall) | 13,712 (54.2%) | 11,565 (45.8%) |
Production, Transportation and Moving Occupations
The most common Production, Transportation and Moving occupations in Jefferson County are Production (2,246 | 8.9%), Transportation (1,314 | 5.2%), and Material Moving (1,172 | 4.6%).
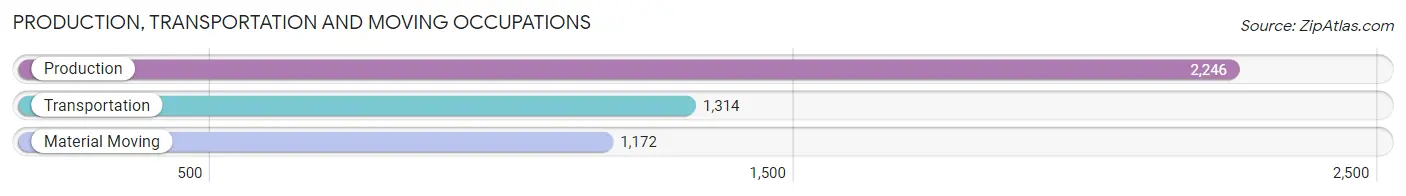
Production, Transportation and Moving Occupations by Sex
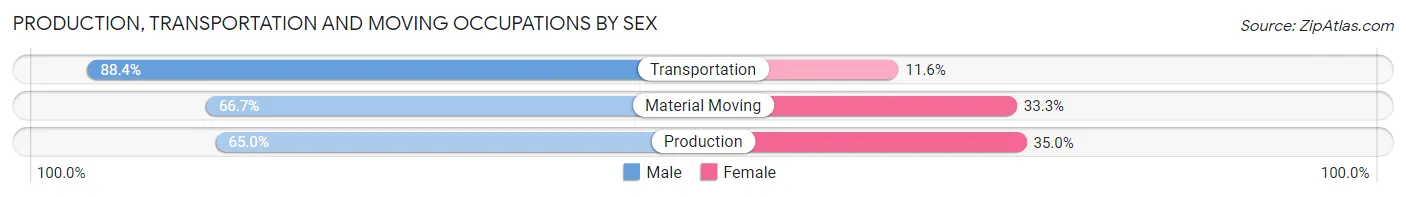
| Occupation | Male | Female |
| Production | 1,459 (65.0%) | 787 (35.0%) |
| Transportation | 1,162 (88.4%) | 152 (11.6%) |
| Material Moving | 782 (66.7%) | 390 (33.3%) |
| Total (Category) | 3,403 (71.9%) | 1,329 (28.1%) |
| Total (Overall) | 13,712 (54.2%) | 11,565 (45.8%) |
Employment Industries by Sex in Jefferson County
Employment Industries in Jefferson County
The major employment industries in Jefferson County include Retail Trade (4,197 | 16.6%), Health Care & Social Assistance (3,236 | 12.8%), Manufacturing (3,043 | 12.0%), Educational Services (2,175 | 8.6%), and Construction (2,055 | 8.1%).
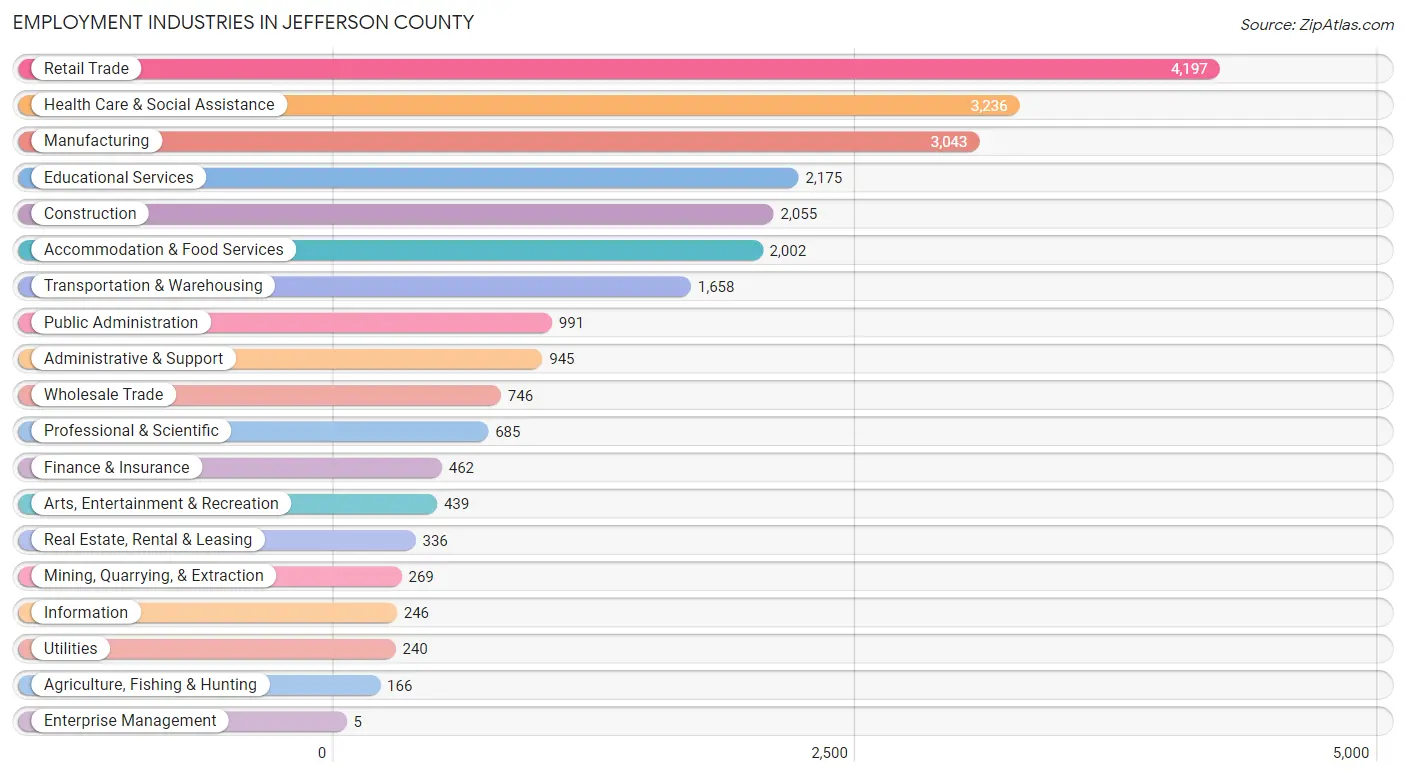
Employment Industries by Sex in Jefferson County
The Jefferson County industries that see more men than women are Mining, Quarrying, & Extraction (97.0%), Construction (96.6%), and Agriculture, Fishing & Hunting (90.4%), whereas the industries that tend to have a higher number of women are Enterprise Management (100.0%), Finance & Insurance (82.0%), and Health Care & Social Assistance (80.7%).
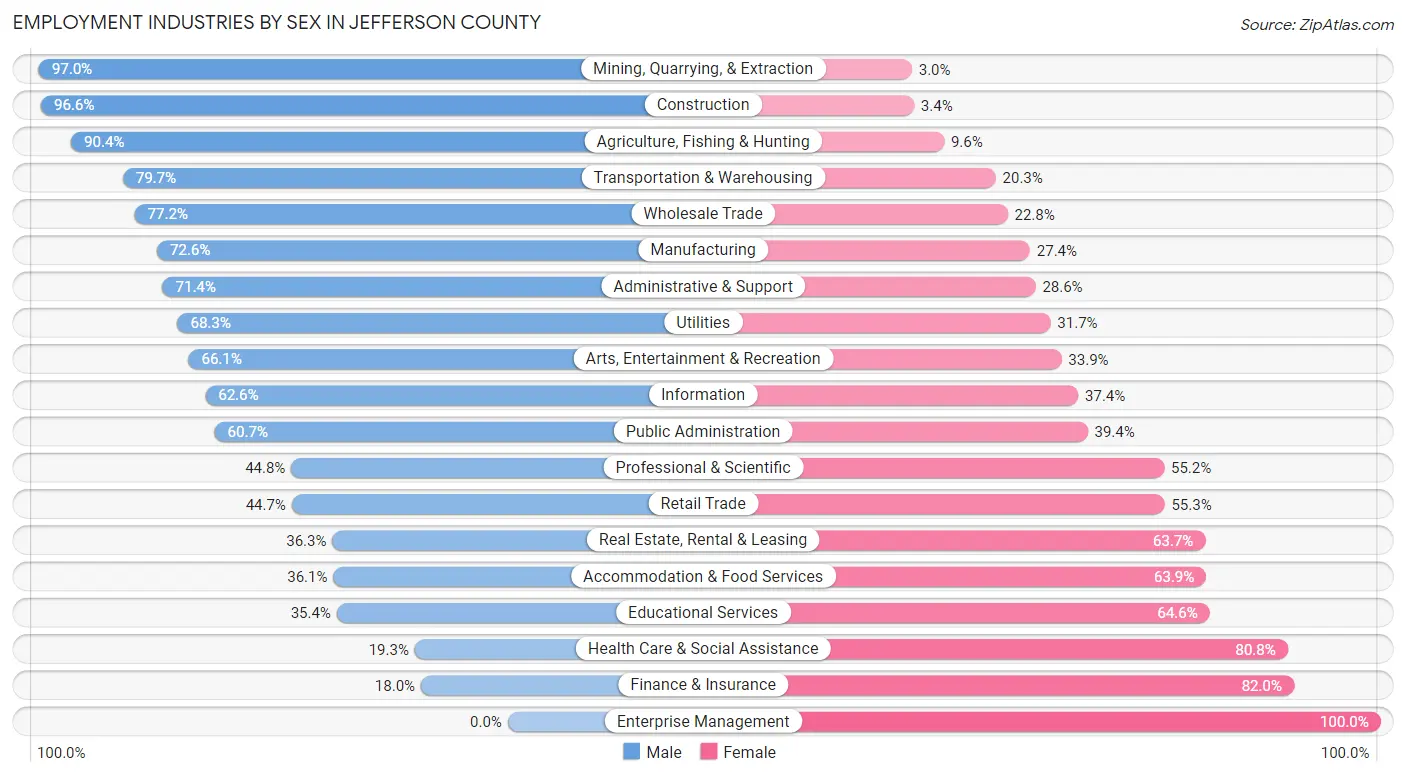
| Industry | Male | Female |
| Agriculture, Fishing & Hunting | 150 (90.4%) | 16 (9.6%) |
| Mining, Quarrying, & Extraction | 261 (97.0%) | 8 (3.0%) |
| Construction | 1,985 (96.6%) | 70 (3.4%) |
| Manufacturing | 2,209 (72.6%) | 834 (27.4%) |
| Wholesale Trade | 576 (77.2%) | 170 (22.8%) |
| Retail Trade | 1,877 (44.7%) | 2,320 (55.3%) |
| Transportation & Warehousing | 1,321 (79.7%) | 337 (20.3%) |
| Utilities | 164 (68.3%) | 76 (31.7%) |
| Information | 154 (62.6%) | 92 (37.4%) |
| Finance & Insurance | 83 (18.0%) | 379 (82.0%) |
| Real Estate, Rental & Leasing | 122 (36.3%) | 214 (63.7%) |
| Professional & Scientific | 307 (44.8%) | 378 (55.2%) |
| Enterprise Management | 0 (0.0%) | 5 (100.0%) |
| Administrative & Support | 675 (71.4%) | 270 (28.6%) |
| Educational Services | 770 (35.4%) | 1,405 (64.6%) |
| Health Care & Social Assistance | 623 (19.3%) | 2,613 (80.7%) |
| Arts, Entertainment & Recreation | 290 (66.1%) | 149 (33.9%) |
| Accommodation & Food Services | 723 (36.1%) | 1,279 (63.9%) |
| Public Administration | 601 (60.7%) | 390 (39.4%) |
| Total | 13,712 (54.2%) | 11,565 (45.8%) |
Education in Jefferson County
School Enrollment in Jefferson County
The most common levels of schooling among the 11,869 students in Jefferson County are college / undergraduate (3,022 | 25.5%), high school (2,473 | 20.8%), and elementary school (2,456 | 20.7%).
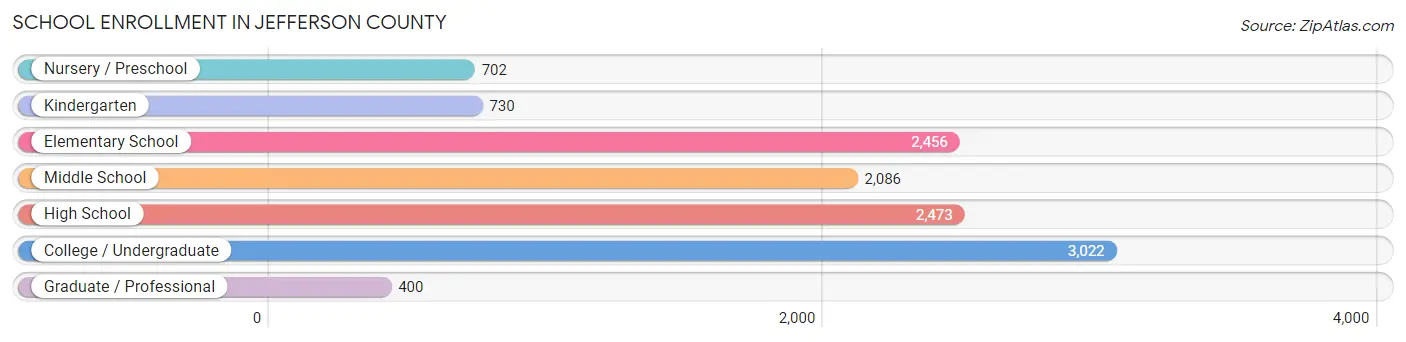
| School Level | # Students | % Students |
| Nursery / Preschool | 702 | 5.9% |
| Kindergarten | 730 | 6.1% |
| Elementary School | 2,456 | 20.7% |
| Middle School | 2,086 | 17.6% |
| High School | 2,473 | 20.8% |
| College / Undergraduate | 3,022 | 25.5% |
| Graduate / Professional | 400 | 3.4% |
| Total | 11,869 | 100.0% |
School Enrollment by Age by Funding Source in Jefferson County
Out of a total of 11,869 students who are enrolled in schools in Jefferson County, 2,860 (24.1%) attend a private institution, while the remaining 9,009 (75.9%) are enrolled in public schools. The age group of 20 to 24 year olds has the highest likelihood of being enrolled in private schools, with 994 (67.8% in the age bracket) enrolled. Conversely, the age group of 15 to 17 year olds has the lowest likelihood of being enrolled in a private school, with 1,830 (90.8% in the age bracket) attending a public institution.
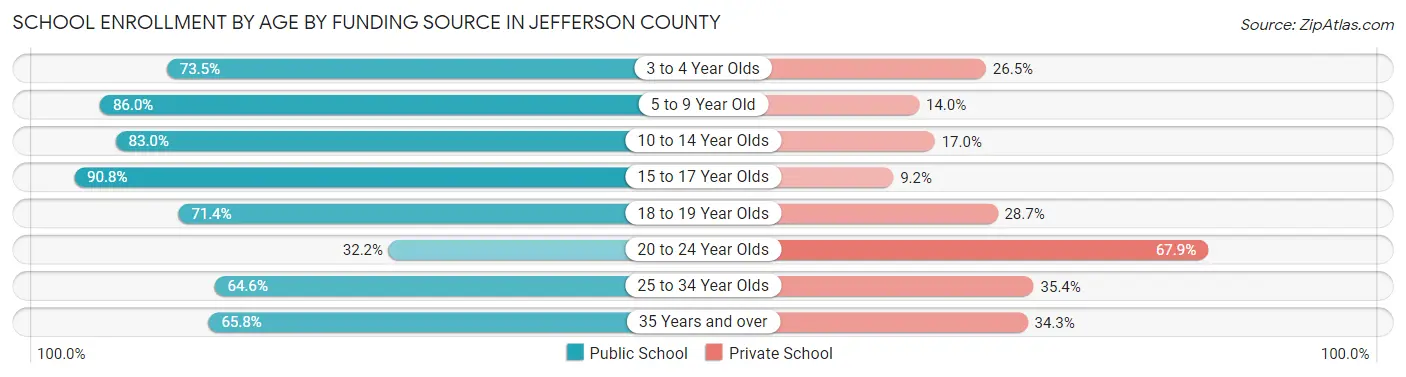
| Age Bracket | Public School | Private School |
| 3 to 4 Year Olds | 408 (73.5%) | 147 (26.5%) |
| 5 to 9 Year Old | 2,645 (86.0%) | 432 (14.0%) |
| 10 to 14 Year Olds | 2,199 (83.0%) | 449 (17.0%) |
| 15 to 17 Year Olds | 1,830 (90.8%) | 186 (9.2%) |
| 18 to 19 Year Olds | 859 (71.4%) | 345 (28.6%) |
| 20 to 24 Year Olds | 471 (32.2%) | 994 (67.8%) |
| 25 to 34 Year Olds | 137 (64.6%) | 75 (35.4%) |
| 35 Years and over | 455 (65.7%) | 237 (34.3%) |
| Total | 9,009 (75.9%) | 2,860 (24.1%) |
Educational Attainment by Field of Study in Jefferson County
Education (1,706 | 19.0%), business (1,437 | 16.0%), science & technology (1,167 | 13.0%), arts & humanities (780 | 8.7%), and bio, nature & agricultural (610 | 6.8%) are the most common fields of study among 8,998 individuals in Jefferson County who have obtained a bachelor's degree or higher.
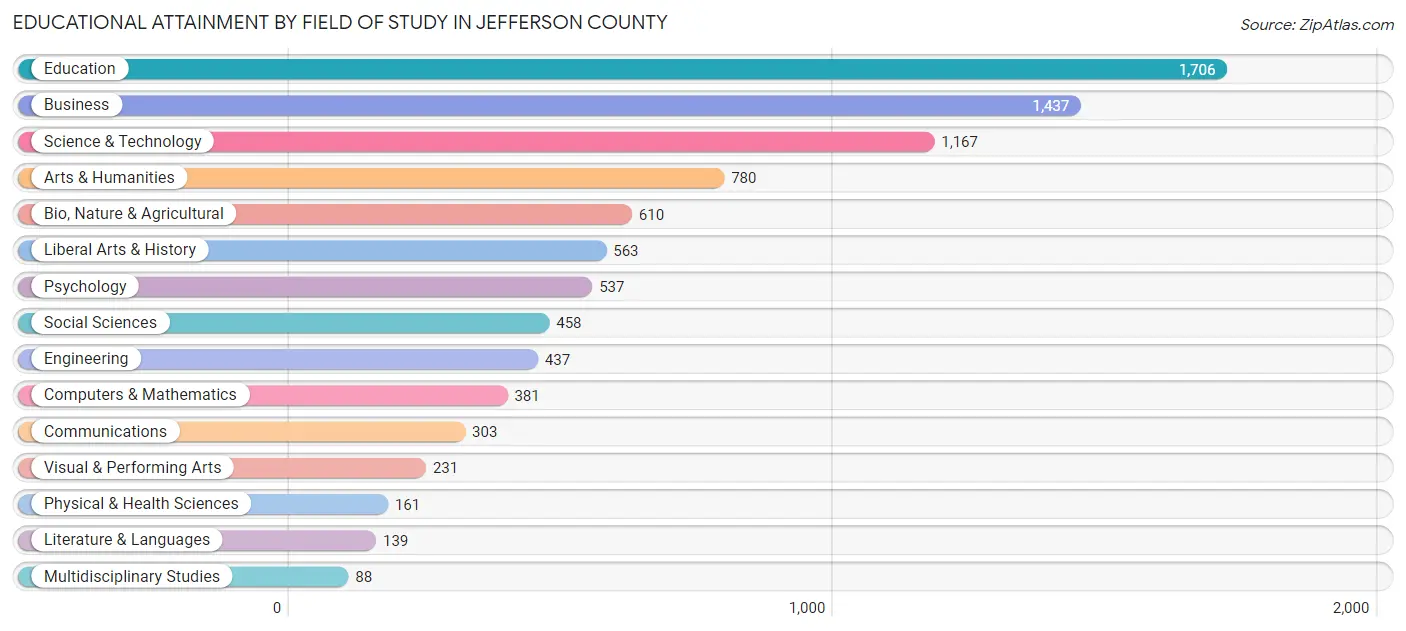
| Field of Study | # Graduates | % Graduates |
| Computers & Mathematics | 381 | 4.2% |
| Bio, Nature & Agricultural | 610 | 6.8% |
| Physical & Health Sciences | 161 | 1.8% |
| Psychology | 537 | 6.0% |
| Social Sciences | 458 | 5.1% |
| Engineering | 437 | 4.9% |
| Multidisciplinary Studies | 88 | 1.0% |
| Science & Technology | 1,167 | 13.0% |
| Business | 1,437 | 16.0% |
| Education | 1,706 | 19.0% |
| Literature & Languages | 139 | 1.5% |
| Liberal Arts & History | 563 | 6.3% |
| Visual & Performing Arts | 231 | 2.6% |
| Communications | 303 | 3.4% |
| Arts & Humanities | 780 | 8.7% |
| Total | 8,998 | 100.0% |
Transportation & Commute in Jefferson County
Vehicle Availability by Sex in Jefferson County
The most prevalent vehicle ownership categories in Jefferson County are males with 2 vehicles (5,237, accounting for 40.0%) and females with 2 vehicles (3,997, making up 47.3%).
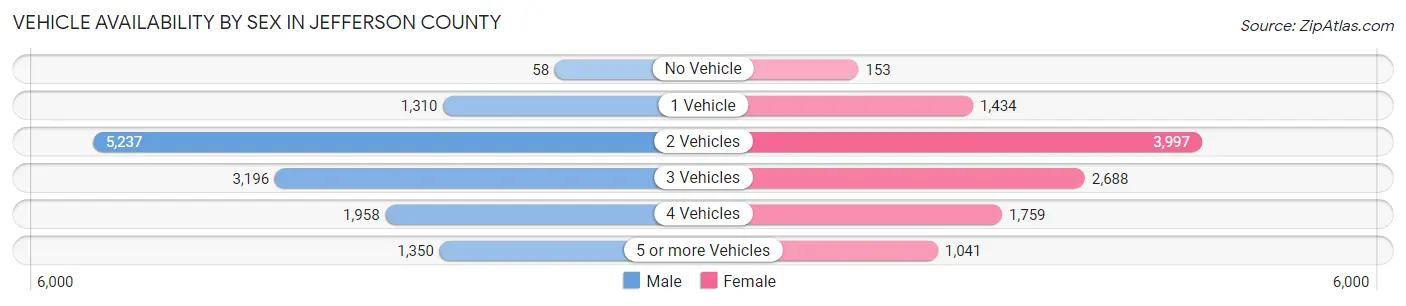
| Vehicles Available | Male | Female |
| No Vehicle | 58 (0.4%) | 153 (1.4%) |
| 1 Vehicle | 1,310 (10.0%) | 1,434 (13.0%) |
| 2 Vehicles | 5,237 (40.0%) | 3,997 (36.1%) |
| 3 Vehicles | 3,196 (24.4%) | 2,688 (24.3%) |
| 4 Vehicles | 1,958 (14.9%) | 1,759 (15.9%) |
| 5 or more Vehicles | 1,350 (10.3%) | 1,041 (9.4%) |
| Total | 13,109 (100.0%) | 11,072 (100.0%) |
Commute Time in Jefferson County
The most frequently occuring commute durations in Jefferson County are 30 to 34 minutes (3,668 commuters, 15.8%), 15 to 19 minutes (3,201 commuters, 13.8%), and 5 to 9 minutes (2,571 commuters, 11.1%).
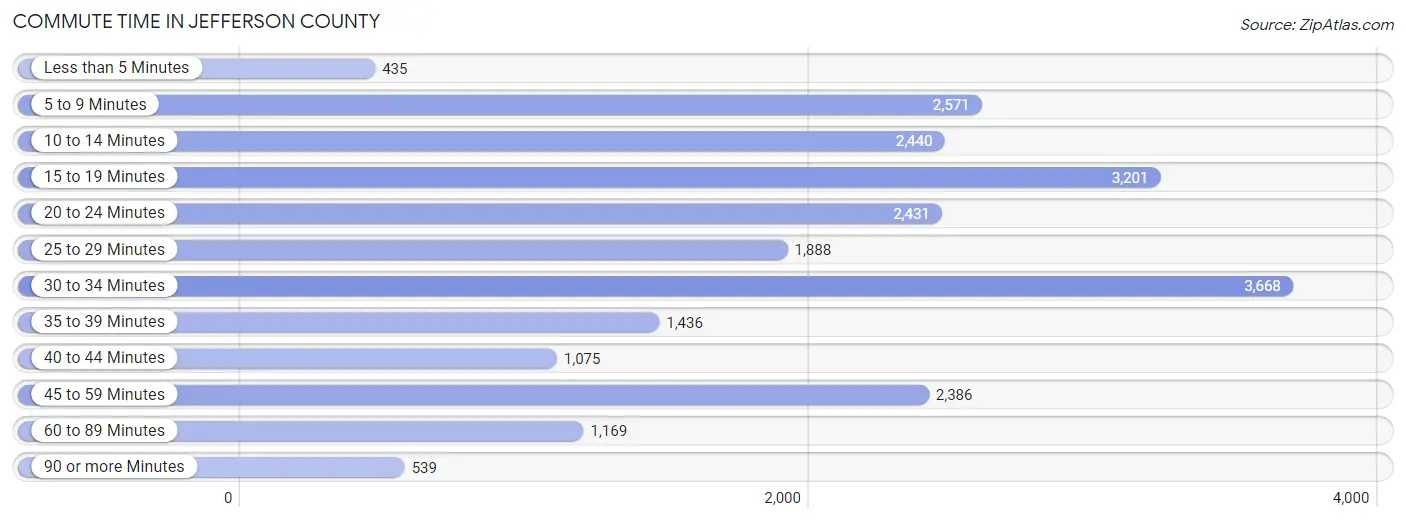
| Commute Time | # Commuters | % Commuters |
| Less than 5 Minutes | 435 | 1.9% |
| 5 to 9 Minutes | 2,571 | 11.1% |
| 10 to 14 Minutes | 2,440 | 10.5% |
| 15 to 19 Minutes | 3,201 | 13.8% |
| 20 to 24 Minutes | 2,431 | 10.5% |
| 25 to 29 Minutes | 1,888 | 8.1% |
| 30 to 34 Minutes | 3,668 | 15.8% |
| 35 to 39 Minutes | 1,436 | 6.2% |
| 40 to 44 Minutes | 1,075 | 4.6% |
| 45 to 59 Minutes | 2,386 | 10.3% |
| 60 to 89 Minutes | 1,169 | 5.0% |
| 90 or more Minutes | 539 | 2.3% |
Commute Time by Sex in Jefferson County
The most common commute times in Jefferson County are 30 to 34 minutes (1,977 commuters, 16.0%) for males and 30 to 34 minutes (1,691 commuters, 15.6%) for females.
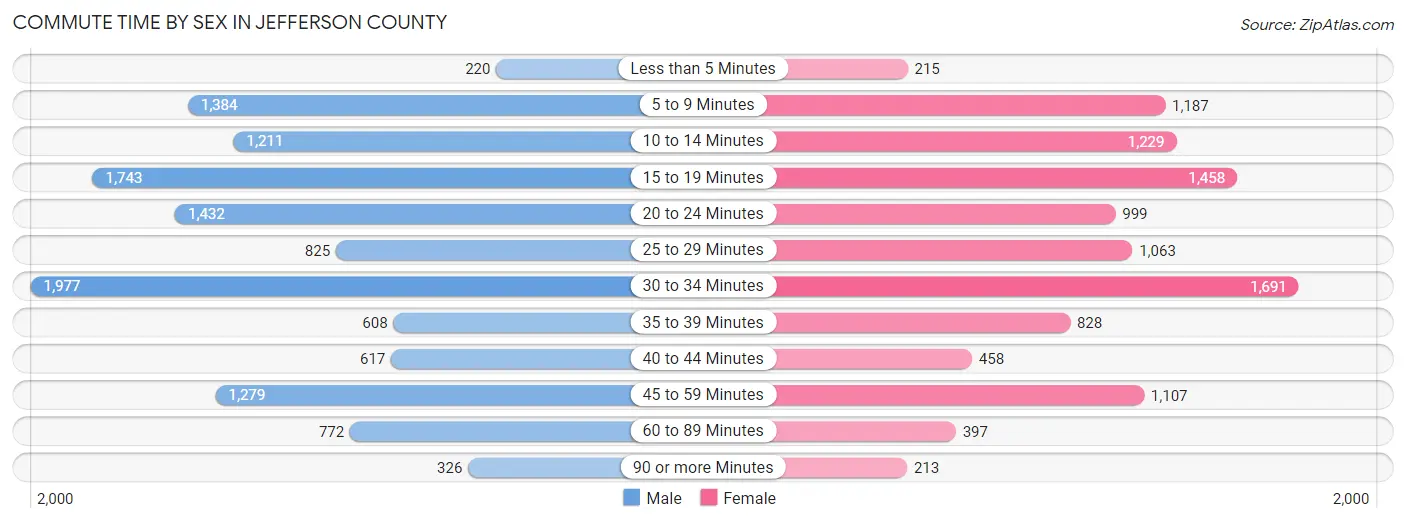
| Commute Time | Male | Female |
| Less than 5 Minutes | 220 (1.8%) | 215 (2.0%) |
| 5 to 9 Minutes | 1,384 (11.2%) | 1,187 (11.0%) |
| 10 to 14 Minutes | 1,211 (9.8%) | 1,229 (11.3%) |
| 15 to 19 Minutes | 1,743 (14.1%) | 1,458 (13.4%) |
| 20 to 24 Minutes | 1,432 (11.6%) | 999 (9.2%) |
| 25 to 29 Minutes | 825 (6.7%) | 1,063 (9.8%) |
| 30 to 34 Minutes | 1,977 (16.0%) | 1,691 (15.6%) |
| 35 to 39 Minutes | 608 (4.9%) | 828 (7.6%) |
| 40 to 44 Minutes | 617 (5.0%) | 458 (4.2%) |
| 45 to 59 Minutes | 1,279 (10.3%) | 1,107 (10.2%) |
| 60 to 89 Minutes | 772 (6.2%) | 397 (3.7%) |
| 90 or more Minutes | 326 (2.6%) | 213 (2.0%) |
Time of Departure to Work by Sex in Jefferson County
The most frequent times of departure to work in Jefferson County are 7:00 AM to 7:29 AM (1,564, 12.6%) for males and 7:00 AM to 7:29 AM (1,569, 14.5%) for females.
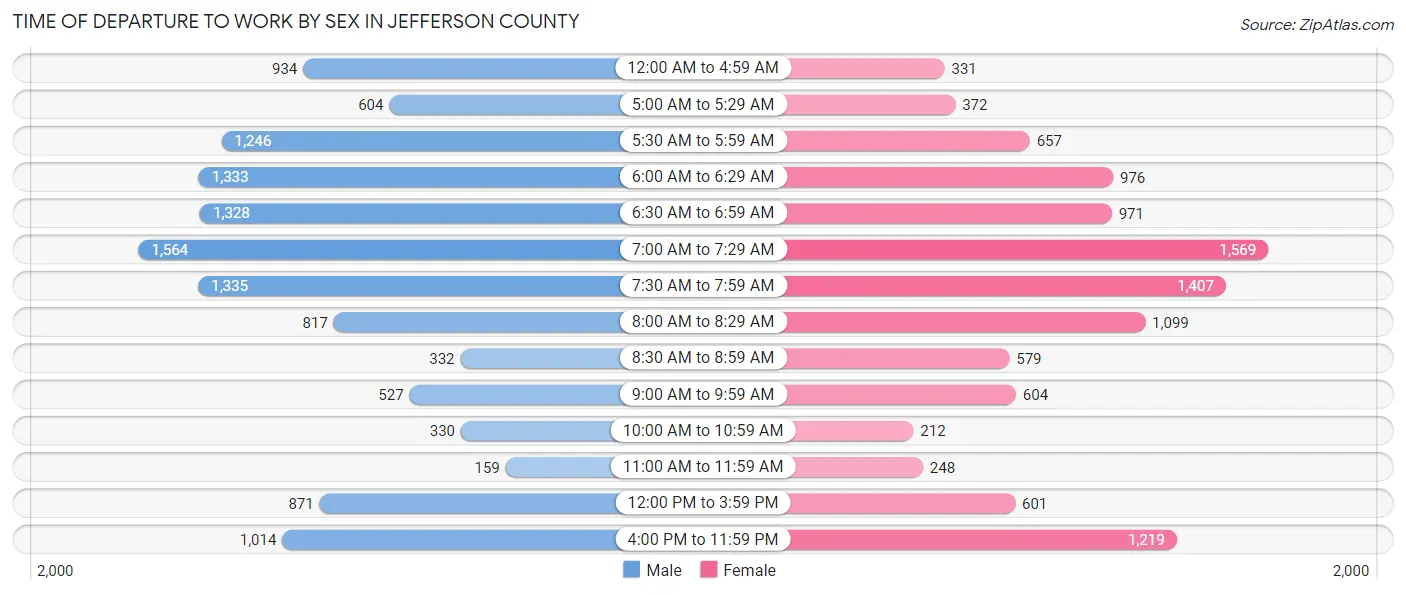
| Time of Departure | Male | Female |
| 12:00 AM to 4:59 AM | 934 (7.5%) | 331 (3.0%) |
| 5:00 AM to 5:29 AM | 604 (4.9%) | 372 (3.4%) |
| 5:30 AM to 5:59 AM | 1,246 (10.1%) | 657 (6.1%) |
| 6:00 AM to 6:29 AM | 1,333 (10.8%) | 976 (9.0%) |
| 6:30 AM to 6:59 AM | 1,328 (10.7%) | 971 (8.9%) |
| 7:00 AM to 7:29 AM | 1,564 (12.6%) | 1,569 (14.5%) |
| 7:30 AM to 7:59 AM | 1,335 (10.8%) | 1,407 (13.0%) |
| 8:00 AM to 8:29 AM | 817 (6.6%) | 1,099 (10.1%) |
| 8:30 AM to 8:59 AM | 332 (2.7%) | 579 (5.3%) |
| 9:00 AM to 9:59 AM | 527 (4.3%) | 604 (5.6%) |
| 10:00 AM to 10:59 AM | 330 (2.7%) | 212 (1.9%) |
| 11:00 AM to 11:59 AM | 159 (1.3%) | 248 (2.3%) |
| 12:00 PM to 3:59 PM | 871 (7.0%) | 601 (5.5%) |
| 4:00 PM to 11:59 PM | 1,014 (8.2%) | 1,219 (11.2%) |
| Total | 12,394 (100.0%) | 10,845 (100.0%) |
Housing Occupancy in Jefferson County
Occupancy by Ownership in Jefferson County
Of the total 20,813 dwellings in Jefferson County, owner-occupied units account for 15,505 (74.5%), while renter-occupied units make up 5,308 (25.5%).
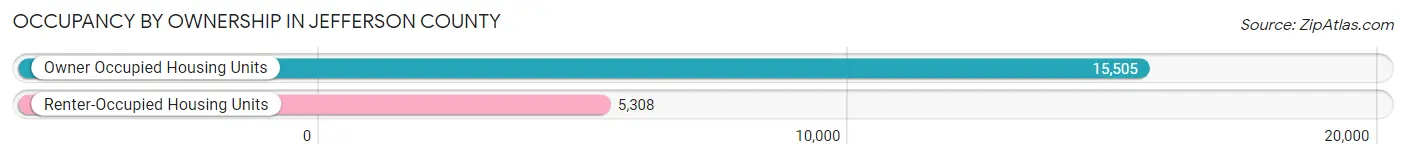
| Occupancy | # Housing Units | % Housing Units |
| Owner Occupied Housing Units | 15,505 | 74.5% |
| Renter-Occupied Housing Units | 5,308 | 25.5% |
| Total Occupied Housing Units | 20,813 | 100.0% |
Occupancy by Household Size in Jefferson County
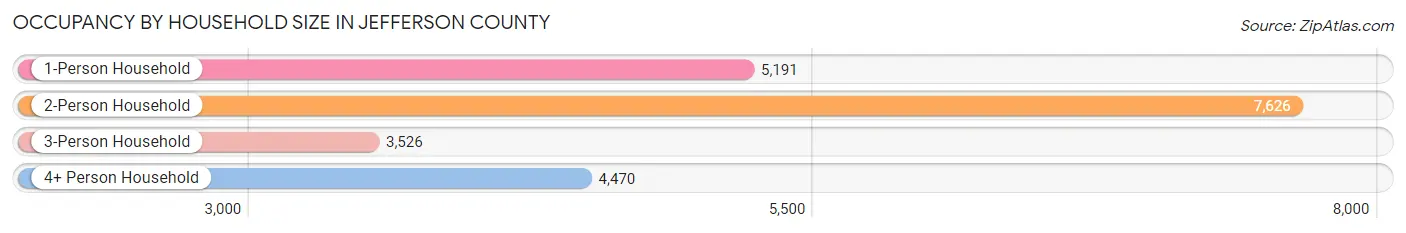
| Household Size | # Housing Units | % Housing Units |
| 1-Person Household | 5,191 | 24.9% |
| 2-Person Household | 7,626 | 36.6% |
| 3-Person Household | 3,526 | 16.9% |
| 4+ Person Household | 4,470 | 21.5% |
| Total Housing Units | 20,813 | 100.0% |
Occupancy by Ownership by Household Size in Jefferson County
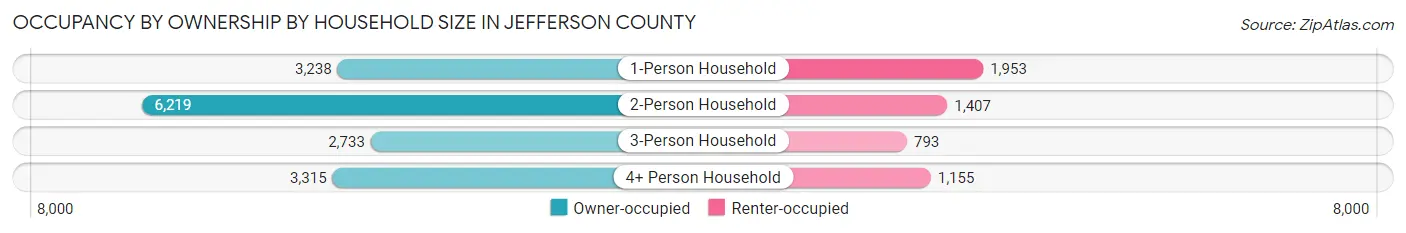
| Household Size | Owner-occupied | Renter-occupied |
| 1-Person Household | 3,238 (62.4%) | 1,953 (37.6%) |
| 2-Person Household | 6,219 (81.6%) | 1,407 (18.4%) |
| 3-Person Household | 2,733 (77.5%) | 793 (22.5%) |
| 4+ Person Household | 3,315 (74.2%) | 1,155 (25.8%) |
| Total Housing Units | 15,505 (74.5%) | 5,308 (25.5%) |
Occupancy by Educational Attainment in Jefferson County
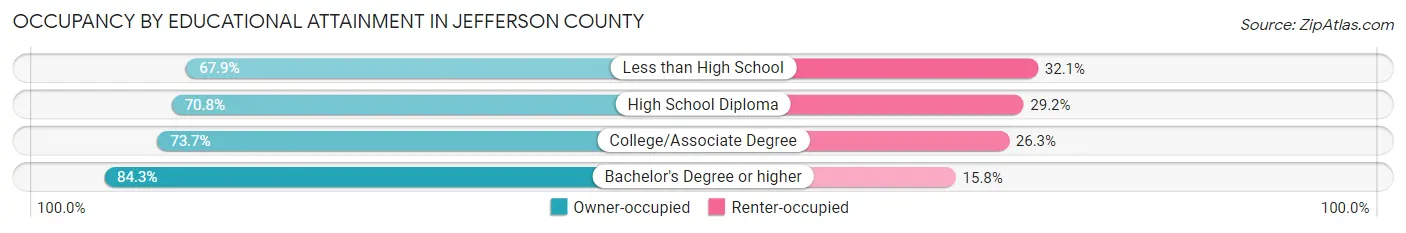
| Household Size | Owner-occupied | Renter-occupied |
| Less than High School | 1,511 (67.9%) | 713 (32.1%) |
| High School Diploma | 4,968 (70.8%) | 2,047 (29.2%) |
| College/Associate Degree | 5,058 (73.7%) | 1,806 (26.3%) |
| Bachelor's Degree or higher | 3,968 (84.3%) | 742 (15.8%) |
Occupancy by Age of Householder in Jefferson County
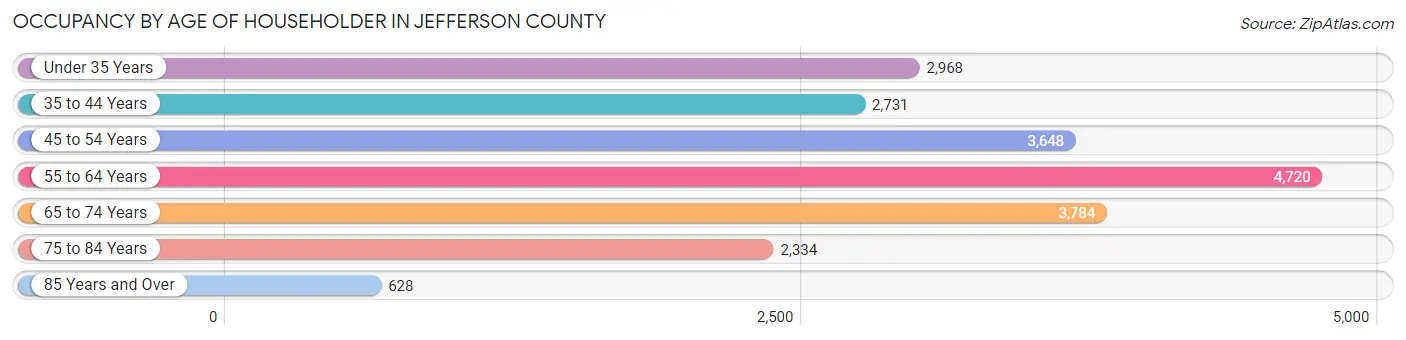
| Age Bracket | # Households | % Households |
| Under 35 Years | 2,968 | 14.3% |
| 35 to 44 Years | 2,731 | 13.1% |
| 45 to 54 Years | 3,648 | 17.5% |
| 55 to 64 Years | 4,720 | 22.7% |
| 65 to 74 Years | 3,784 | 18.2% |
| 75 to 84 Years | 2,334 | 11.2% |
| 85 Years and Over | 628 | 3.0% |
| Total | 20,813 | 100.0% |
Housing Finances in Jefferson County
Median Income by Occupancy in Jefferson County
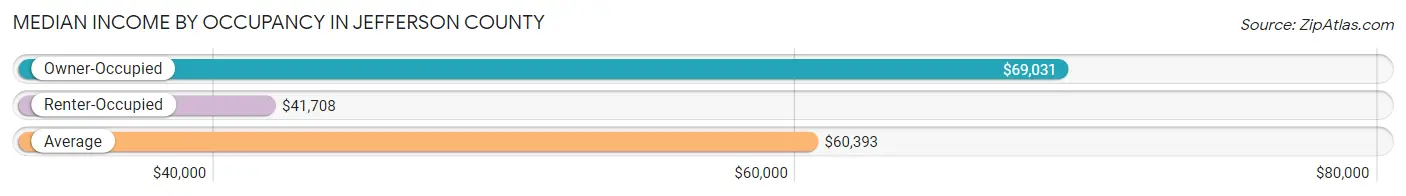
| Occupancy Type | # Households | Median Income |
| Owner-Occupied | 15,505 (74.5%) | $69,031 |
| Renter-Occupied | 5,308 (25.5%) | $41,708 |
| Average | 20,813 (100.0%) | $60,393 |
Occupancy by Householder Income Bracket in Jefferson County
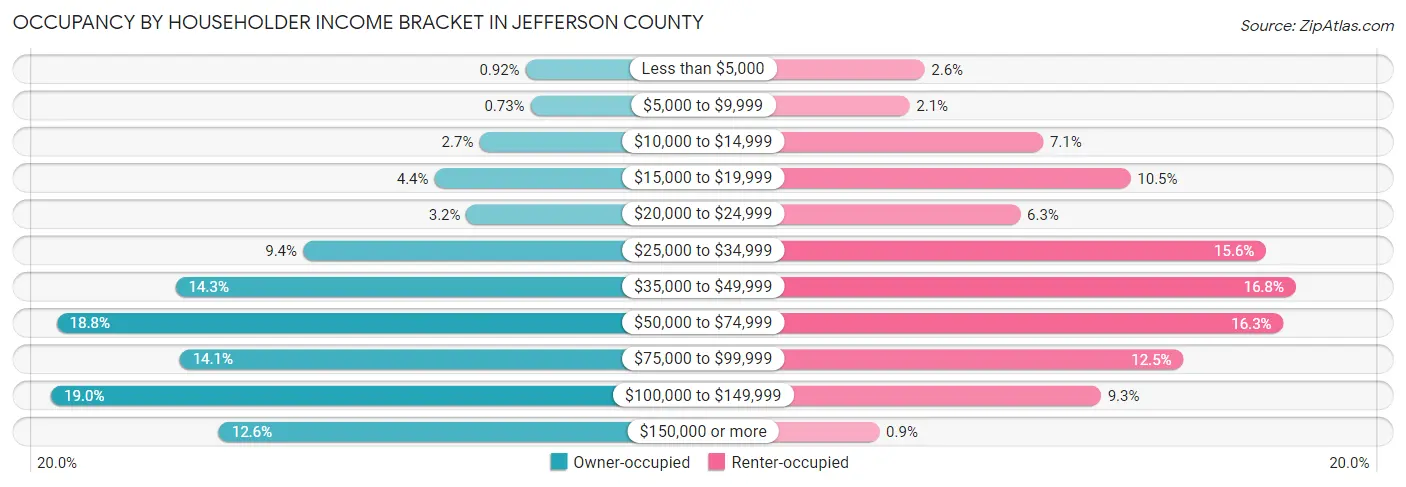
| Income Bracket | Owner-occupied | Renter-occupied |
| Less than $5,000 | 143 (0.9%) | 139 (2.6%) |
| $5,000 to $9,999 | 113 (0.7%) | 109 (2.1%) |
| $10,000 to $14,999 | 415 (2.7%) | 379 (7.1%) |
| $15,000 to $19,999 | 680 (4.4%) | 556 (10.5%) |
| $20,000 to $24,999 | 492 (3.2%) | 333 (6.3%) |
| $25,000 to $34,999 | 1,458 (9.4%) | 830 (15.6%) |
| $35,000 to $49,999 | 2,210 (14.2%) | 890 (16.8%) |
| $50,000 to $74,999 | 2,912 (18.8%) | 865 (16.3%) |
| $75,000 to $99,999 | 2,184 (14.1%) | 663 (12.5%) |
| $100,000 to $149,999 | 2,945 (19.0%) | 496 (9.3%) |
| $150,000 or more | 1,953 (12.6%) | 48 (0.9%) |
| Total | 15,505 (100.0%) | 5,308 (100.0%) |
Monthly Housing Cost Tiers in Jefferson County
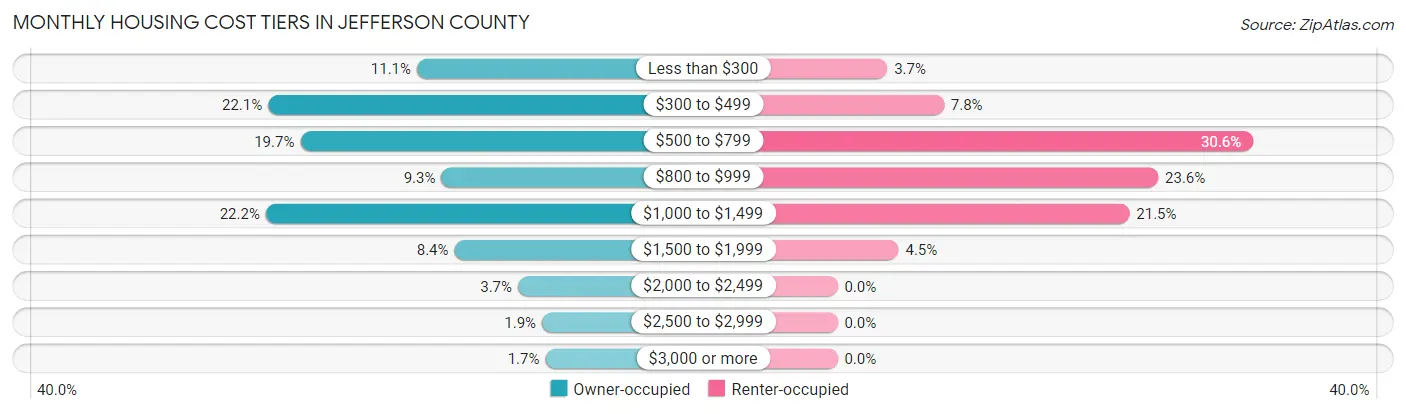
| Monthly Cost | Owner-occupied | Renter-occupied |
| Less than $300 | 1,723 (11.1%) | 195 (3.7%) |
| $300 to $499 | 3,422 (22.1%) | 416 (7.8%) |
| $500 to $799 | 3,054 (19.7%) | 1,625 (30.6%) |
| $800 to $999 | 1,443 (9.3%) | 1,254 (23.6%) |
| $1,000 to $1,499 | 3,449 (22.2%) | 1,141 (21.5%) |
| $1,500 to $1,999 | 1,294 (8.4%) | 239 (4.5%) |
| $2,000 to $2,499 | 569 (3.7%) | 0 (0.0%) |
| $2,500 to $2,999 | 295 (1.9%) | 0 (0.0%) |
| $3,000 or more | 256 (1.7%) | 0 (0.0%) |
| Total | 15,505 (100.0%) | 5,308 (100.0%) |
Physical Housing Characteristics in Jefferson County
Housing Structures in Jefferson County
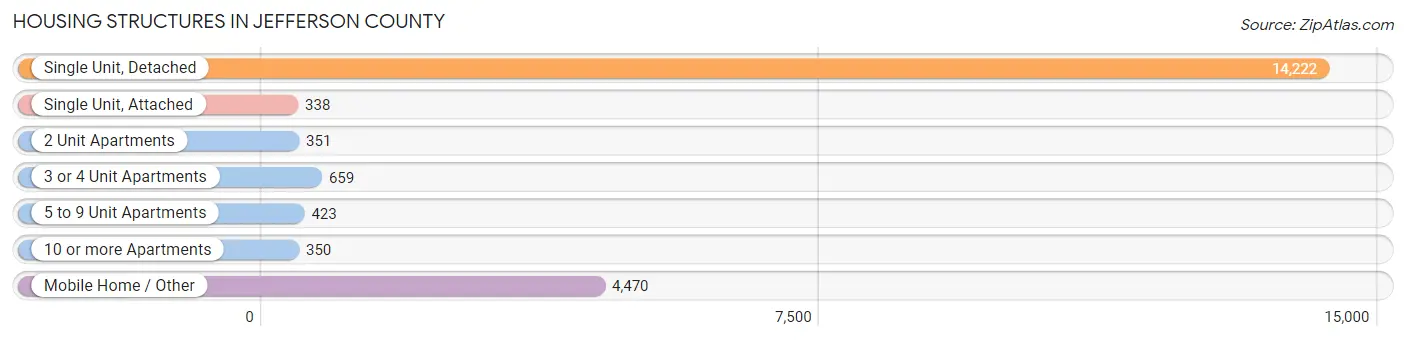
| Structure Type | # Housing Units | % Housing Units |
| Single Unit, Detached | 14,222 | 68.3% |
| Single Unit, Attached | 338 | 1.6% |
| 2 Unit Apartments | 351 | 1.7% |
| 3 or 4 Unit Apartments | 659 | 3.2% |
| 5 to 9 Unit Apartments | 423 | 2.0% |
| 10 or more Apartments | 350 | 1.7% |
| Mobile Home / Other | 4,470 | 21.5% |
| Total | 20,813 | 100.0% |
Housing Structures by Occupancy in Jefferson County
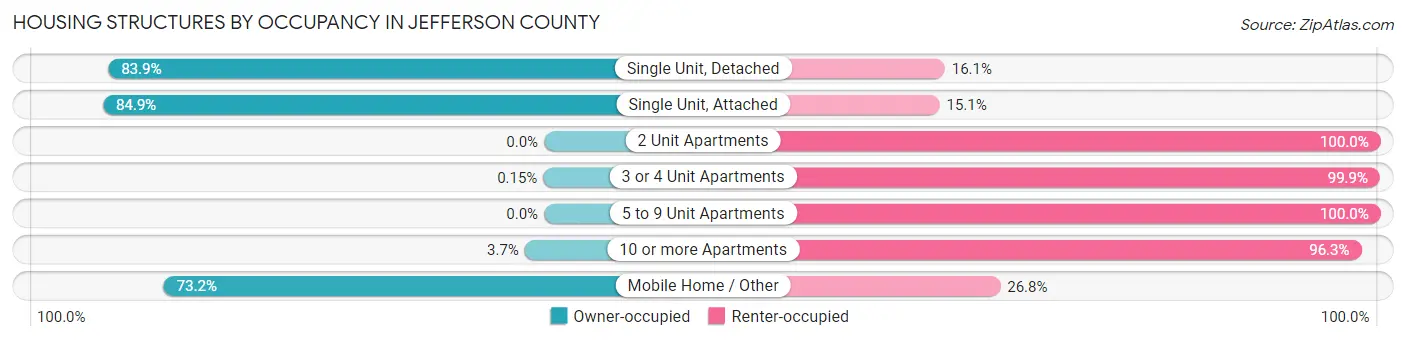
| Structure Type | Owner-occupied | Renter-occupied |
| Single Unit, Detached | 11,931 (83.9%) | 2,291 (16.1%) |
| Single Unit, Attached | 287 (84.9%) | 51 (15.1%) |
| 2 Unit Apartments | 0 (0.0%) | 351 (100.0%) |
| 3 or 4 Unit Apartments | 1 (0.2%) | 658 (99.9%) |
| 5 to 9 Unit Apartments | 0 (0.0%) | 423 (100.0%) |
| 10 or more Apartments | 13 (3.7%) | 337 (96.3%) |
| Mobile Home / Other | 3,273 (73.2%) | 1,197 (26.8%) |
| Total | 15,505 (74.5%) | 5,308 (25.5%) |
Housing Structures by Number of Rooms in Jefferson County
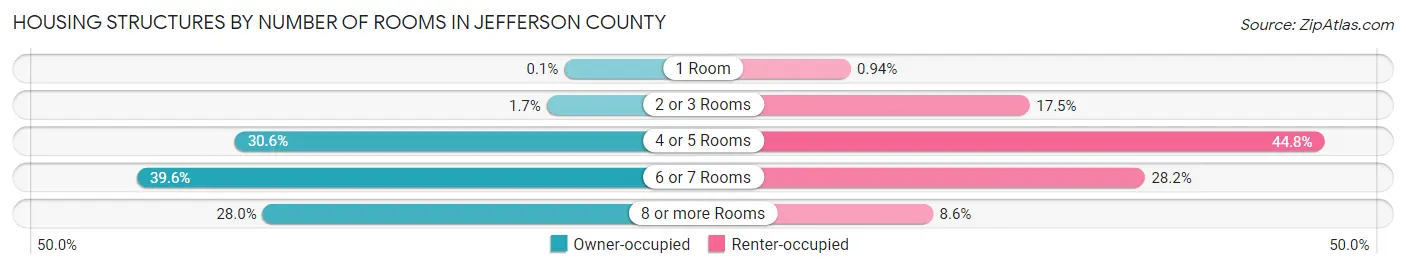
| Number of Rooms | Owner-occupied | Renter-occupied |
| 1 Room | 16 (0.1%) | 50 (0.9%) |
| 2 or 3 Rooms | 266 (1.7%) | 930 (17.5%) |
| 4 or 5 Rooms | 4,739 (30.6%) | 2,378 (44.8%) |
| 6 or 7 Rooms | 6,142 (39.6%) | 1,495 (28.2%) |
| 8 or more Rooms | 4,342 (28.0%) | 455 (8.6%) |
| Total | 15,505 (100.0%) | 5,308 (100.0%) |
Housing Structure by Heating Type in Jefferson County
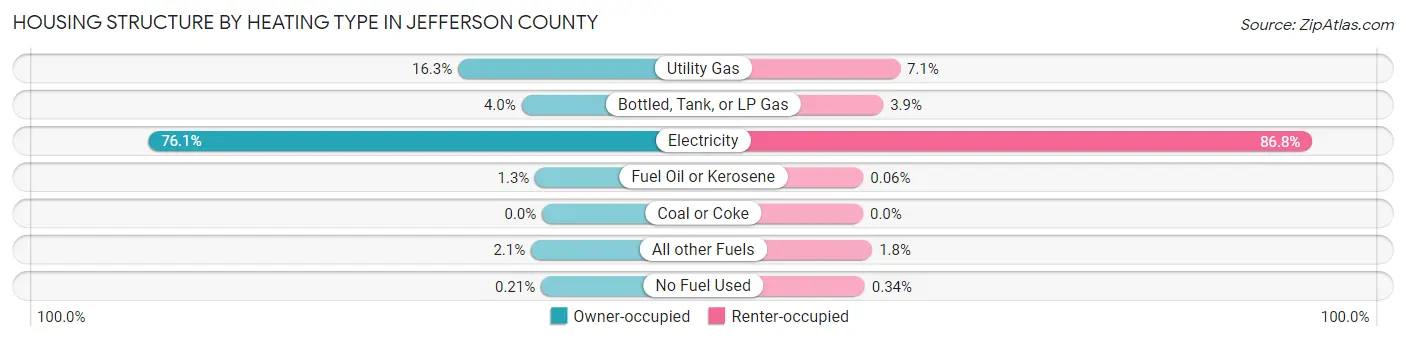
| Heating Type | Owner-occupied | Renter-occupied |
| Utility Gas | 2,519 (16.3%) | 379 (7.1%) |
| Bottled, Tank, or LP Gas | 615 (4.0%) | 207 (3.9%) |
| Electricity | 11,800 (76.1%) | 4,607 (86.8%) |
| Fuel Oil or Kerosene | 208 (1.3%) | 3 (0.1%) |
| Coal or Coke | 0 (0.0%) | 0 (0.0%) |
| All other Fuels | 331 (2.1%) | 94 (1.8%) |
| No Fuel Used | 32 (0.2%) | 18 (0.3%) |
| Total | 15,505 (100.0%) | 5,308 (100.0%) |
Household Vehicle Usage in Jefferson County
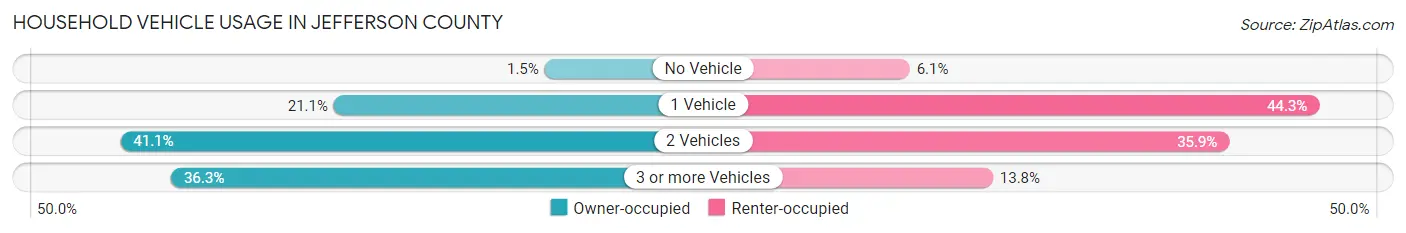
| Vehicles per Household | Owner-occupied | Renter-occupied |
| No Vehicle | 227 (1.5%) | 321 (6.0%) |
| 1 Vehicle | 3,278 (21.1%) | 2,350 (44.3%) |
| 2 Vehicles | 6,367 (41.1%) | 1,904 (35.9%) |
| 3 or more Vehicles | 5,633 (36.3%) | 733 (13.8%) |
| Total | 15,505 (100.0%) | 5,308 (100.0%) |
Real Estate & Mortgages in Jefferson County
Real Estate and Mortgage Overview in Jefferson County
| Characteristic | Without Mortgage | With Mortgage |
| Housing Units | 7,237 | 8,268 |
| Median Property Value | $183,000 | $184,300 |
| Median Household Income | $55,295 | $1,171 |
| Monthly Housing Costs | $395 | $256 |
| Real Estate Taxes | $942 | $210 |
Property Value by Mortgage Status in Jefferson County
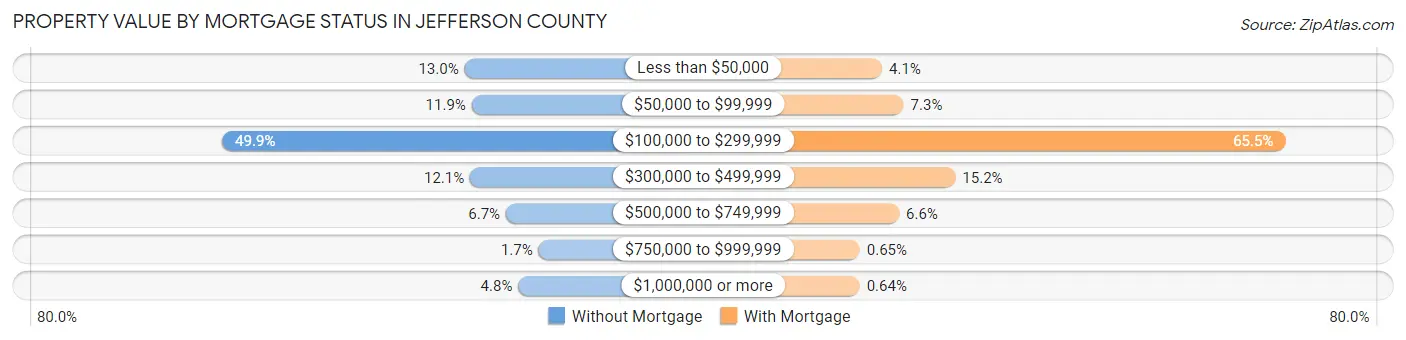
| Property Value | Without Mortgage | With Mortgage |
| Less than $50,000 | 939 (13.0%) | 335 (4.1%) |
| $50,000 to $99,999 | 860 (11.9%) | 606 (7.3%) |
| $100,000 to $299,999 | 3,611 (49.9%) | 5,413 (65.5%) |
| $300,000 to $499,999 | 877 (12.1%) | 1,258 (15.2%) |
| $500,000 to $749,999 | 482 (6.7%) | 549 (6.6%) |
| $750,000 to $999,999 | 122 (1.7%) | 54 (0.6%) |
| $1,000,000 or more | 346 (4.8%) | 53 (0.6%) |
| Total | 7,237 (100.0%) | 8,268 (100.0%) |
Household Income by Mortgage Status in Jefferson County
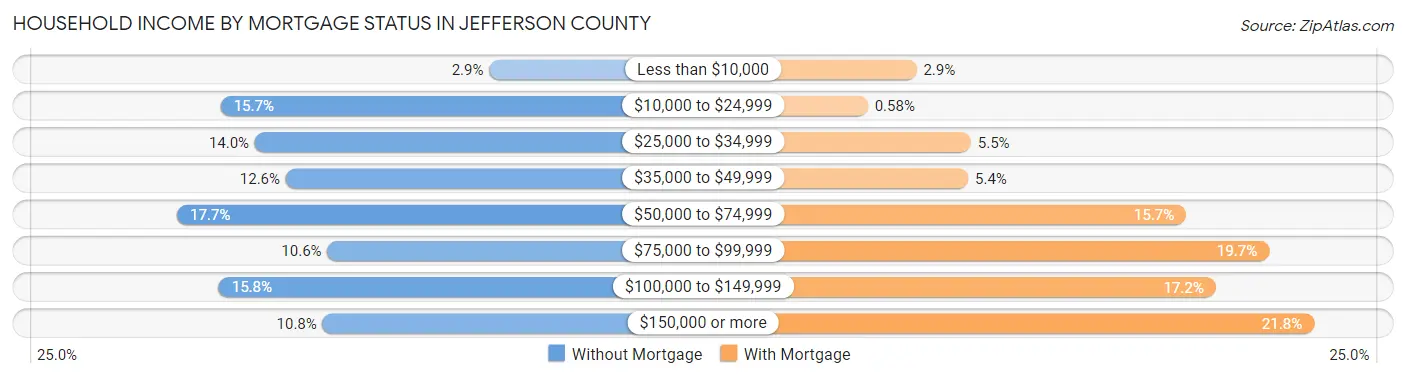
| Household Income | Without Mortgage | With Mortgage |
| Less than $10,000 | 208 (2.9%) | 240 (2.9%) |
| $10,000 to $24,999 | 1,133 (15.7%) | 48 (0.6%) |
| $25,000 to $34,999 | 1,015 (14.0%) | 454 (5.5%) |
| $35,000 to $49,999 | 909 (12.6%) | 443 (5.4%) |
| $50,000 to $74,999 | 1,284 (17.7%) | 1,301 (15.7%) |
| $75,000 to $99,999 | 766 (10.6%) | 1,628 (19.7%) |
| $100,000 to $149,999 | 1,140 (15.8%) | 1,418 (17.2%) |
| $150,000 or more | 782 (10.8%) | 1,805 (21.8%) |
| Total | 7,237 (100.0%) | 8,268 (100.0%) |
Property Value to Household Income Ratio in Jefferson County
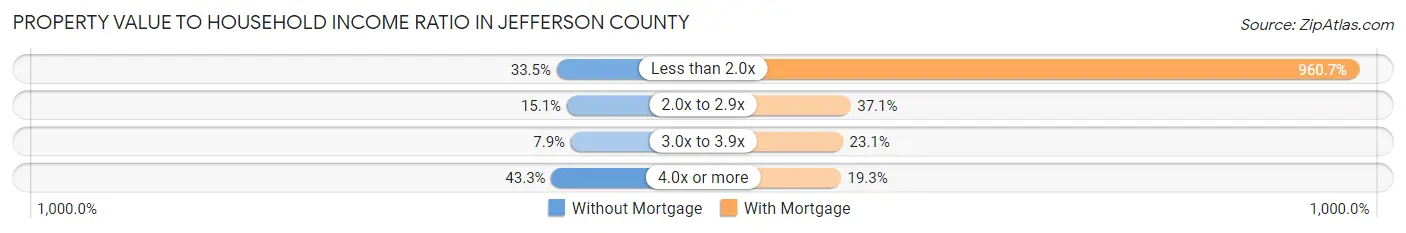
| Value-to-Income Ratio | Without Mortgage | With Mortgage |
| Less than 2.0x | 2,424 (33.5%) | 79,433 (960.7%) |
| 2.0x to 2.9x | 1,089 (15.0%) | 3,064 (37.1%) |
| 3.0x to 3.9x | 569 (7.9%) | 1,906 (23.1%) |
| 4.0x or more | 3,131 (43.3%) | 1,598 (19.3%) |
| Total | 7,237 (100.0%) | 8,268 (100.0%) |
Real Estate Taxes by Mortgage Status in Jefferson County
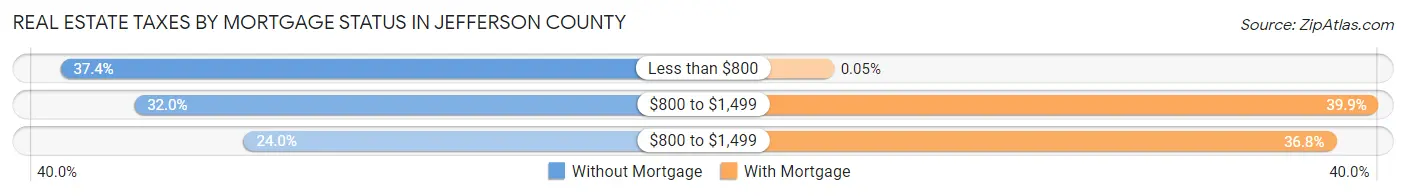
| Property Taxes | Without Mortgage | With Mortgage |
| Less than $800 | 2,705 (37.4%) | 4 (0.1%) |
| $800 to $1,499 | 2,315 (32.0%) | 3,296 (39.9%) |
| $800 to $1,499 | 1,737 (24.0%) | 3,039 (36.8%) |
| Total | 7,237 (100.0%) | 8,268 (100.0%) |
Health & Disability in Jefferson County
Health Insurance Coverage by Age in Jefferson County
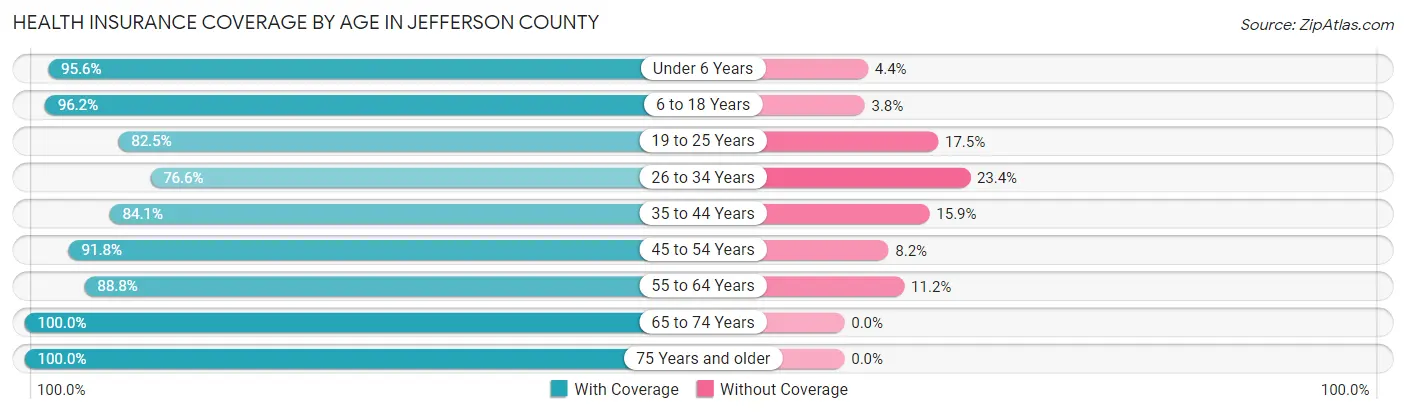
| Age Bracket | With Coverage | Without Coverage |
| Under 6 Years | 2,829 (95.6%) | 130 (4.4%) |
| 6 to 18 Years | 7,867 (96.2%) | 308 (3.8%) |
| 19 to 25 Years | 3,983 (82.5%) | 844 (17.5%) |
| 26 to 34 Years | 4,189 (76.6%) | 1,282 (23.4%) |
| 35 to 44 Years | 5,045 (84.1%) | 951 (15.9%) |
| 45 to 54 Years | 6,830 (91.8%) | 612 (8.2%) |
| 55 to 64 Years | 7,593 (88.8%) | 954 (11.2%) |
| 65 to 74 Years | 6,459 (100.0%) | 0 (0.0%) |
| 75 Years and older | 4,303 (100.0%) | 0 (0.0%) |
| Total | 49,098 (90.6%) | 5,081 (9.4%) |
Health Insurance Coverage by Citizenship Status in Jefferson County
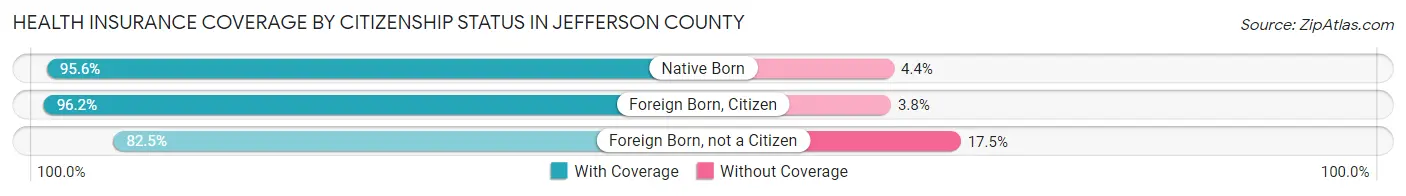
| Citizenship Status | With Coverage | Without Coverage |
| Native Born | 2,829 (95.6%) | 130 (4.4%) |
| Foreign Born, Citizen | 7,867 (96.2%) | 308 (3.8%) |
| Foreign Born, not a Citizen | 3,983 (82.5%) | 844 (17.5%) |
Health Insurance Coverage by Household Income in Jefferson County
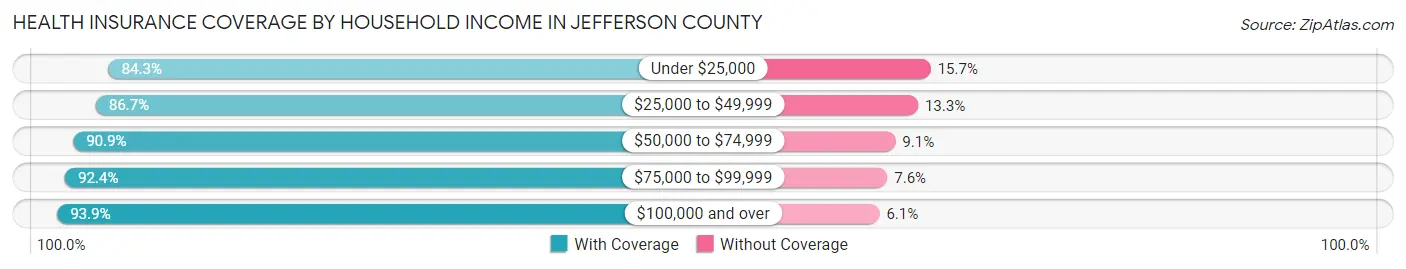
| Household Income | With Coverage | Without Coverage |
| Under $25,000 | 4,832 (84.3%) | 902 (15.7%) |
| $25,000 to $49,999 | 9,706 (86.7%) | 1,494 (13.3%) |
| $50,000 to $74,999 | 9,078 (90.9%) | 910 (9.1%) |
| $75,000 to $99,999 | 7,535 (92.4%) | 619 (7.6%) |
| $100,000 and over | 17,047 (93.9%) | 1,111 (6.1%) |
Public vs Private Health Insurance Coverage by Age in Jefferson County
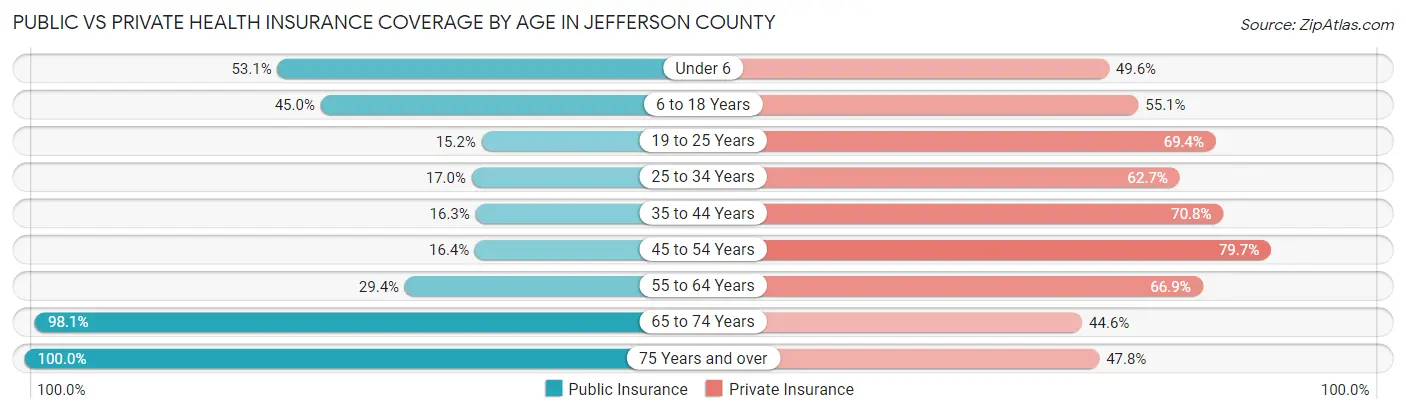
| Age Bracket | Public Insurance | Private Insurance |
| Under 6 | 1,570 (53.1%) | 1,467 (49.6%) |
| 6 to 18 Years | 3,681 (45.0%) | 4,500 (55.0%) |
| 19 to 25 Years | 732 (15.2%) | 3,351 (69.4%) |
| 25 to 34 Years | 930 (17.0%) | 3,431 (62.7%) |
| 35 to 44 Years | 977 (16.3%) | 4,245 (70.8%) |
| 45 to 54 Years | 1,219 (16.4%) | 5,928 (79.7%) |
| 55 to 64 Years | 2,514 (29.4%) | 5,721 (66.9%) |
| 65 to 74 Years | 6,333 (98.1%) | 2,882 (44.6%) |
| 75 Years and over | 4,303 (100.0%) | 2,056 (47.8%) |
| Total | 22,259 (41.1%) | 33,581 (62.0%) |
Disability Status by Sex by Age in Jefferson County
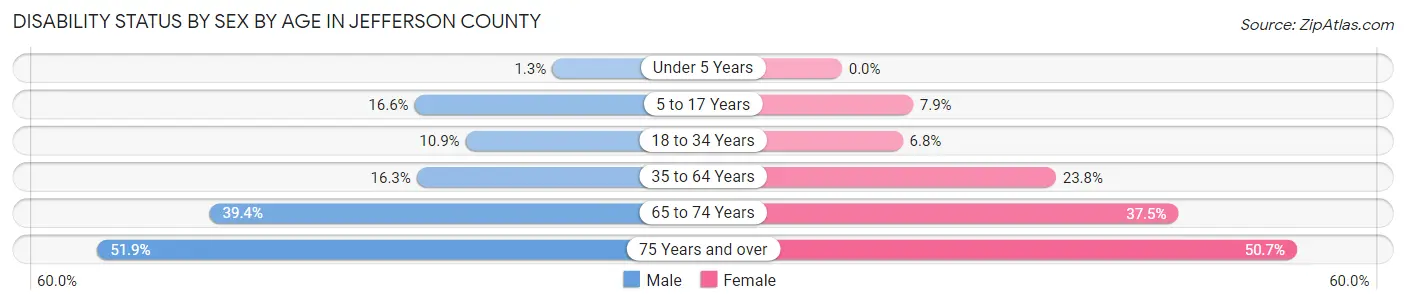
| Age Bracket | Male | Female |
| Under 5 Years | 15 (1.3%) | 0 (0.0%) |
| 5 to 17 Years | 667 (16.6%) | 309 (7.9%) |
| 18 to 34 Years | 614 (10.9%) | 362 (6.8%) |
| 35 to 64 Years | 1,777 (16.3%) | 2,647 (23.8%) |
| 65 to 74 Years | 1,205 (39.4%) | 1,274 (37.5%) |
| 75 Years and over | 956 (51.9%) | 1,247 (50.7%) |
Disability Class by Sex by Age in Jefferson County
Disability Class: Hearing Difficulty
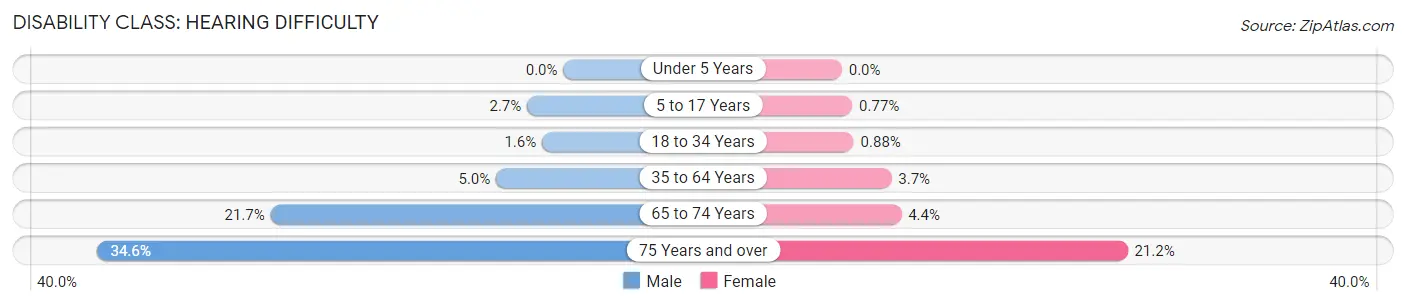
| Age Bracket | Male | Female |
| Under 5 Years | 0 (0.0%) | 0 (0.0%) |
| 5 to 17 Years | 108 (2.7%) | 30 (0.8%) |
| 18 to 34 Years | 89 (1.6%) | 47 (0.9%) |
| 35 to 64 Years | 543 (5.0%) | 409 (3.7%) |
| 65 to 74 Years | 665 (21.7%) | 150 (4.4%) |
| 75 Years and over | 637 (34.6%) | 522 (21.2%) |
Disability Class: Vision Difficulty
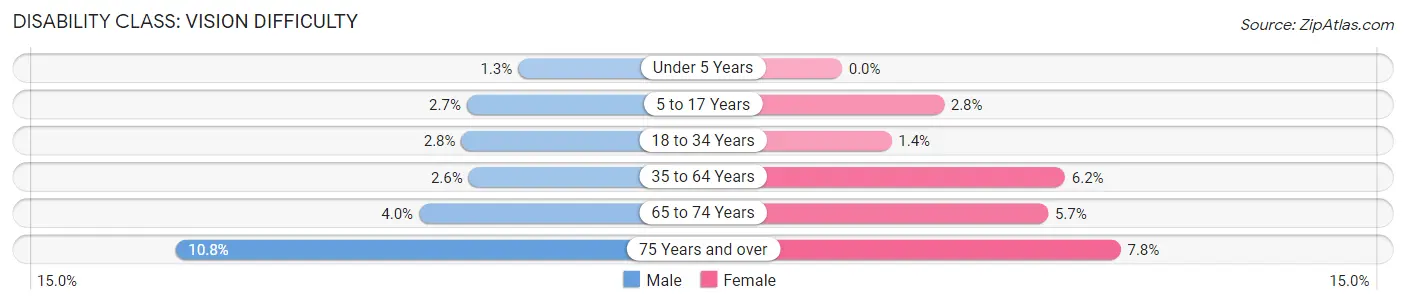
| Age Bracket | Male | Female |
| Under 5 Years | 15 (1.3%) | 0 (0.0%) |
| 5 to 17 Years | 108 (2.7%) | 111 (2.8%) |
| 18 to 34 Years | 160 (2.8%) | 74 (1.4%) |
| 35 to 64 Years | 287 (2.6%) | 690 (6.2%) |
| 65 to 74 Years | 123 (4.0%) | 195 (5.7%) |
| 75 Years and over | 199 (10.8%) | 191 (7.8%) |
Disability Class: Cognitive Difficulty
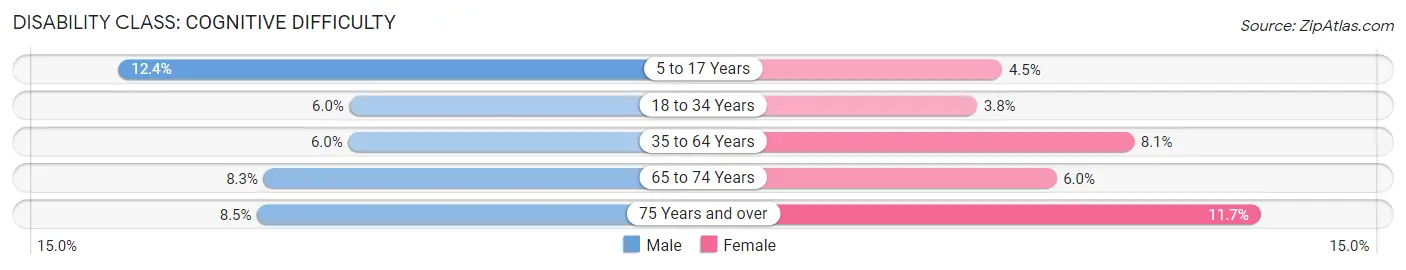
| Age Bracket | Male | Female |
| 5 to 17 Years | 498 (12.4%) | 174 (4.5%) |
| 18 to 34 Years | 335 (5.9%) | 201 (3.8%) |
| 35 to 64 Years | 650 (6.0%) | 903 (8.1%) |
| 65 to 74 Years | 255 (8.3%) | 203 (6.0%) |
| 75 Years and over | 157 (8.5%) | 287 (11.7%) |
Disability Class: Ambulatory Difficulty
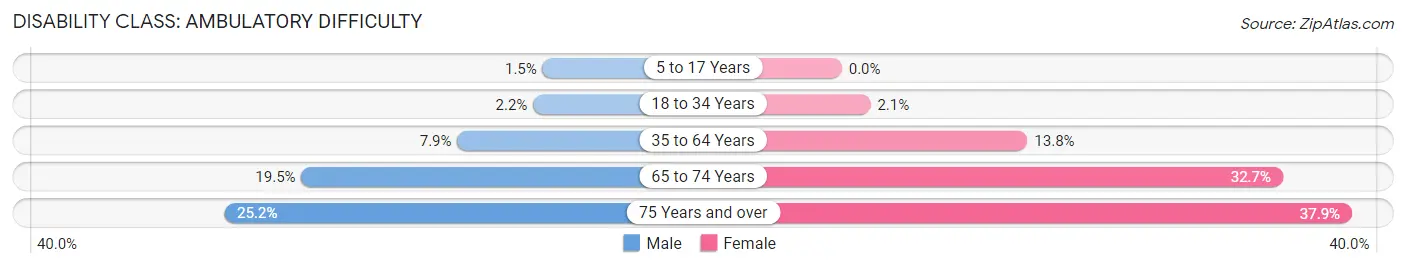
| Age Bracket | Male | Female |
| 5 to 17 Years | 62 (1.5%) | 0 (0.0%) |
| 18 to 34 Years | 126 (2.2%) | 114 (2.1%) |
| 35 to 64 Years | 856 (7.9%) | 1,530 (13.8%) |
| 65 to 74 Years | 595 (19.5%) | 1,113 (32.7%) |
| 75 Years and over | 464 (25.2%) | 932 (37.9%) |
Disability Class: Self-Care Difficulty
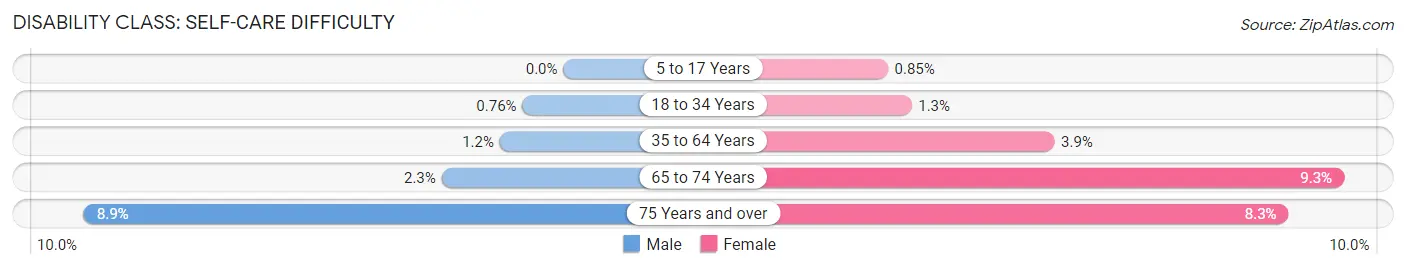
| Age Bracket | Male | Female |
| 5 to 17 Years | 0 (0.0%) | 33 (0.9%) |
| 18 to 34 Years | 43 (0.8%) | 69 (1.3%) |
| 35 to 64 Years | 128 (1.2%) | 438 (3.9%) |
| 65 to 74 Years | 69 (2.3%) | 317 (9.3%) |
| 75 Years and over | 164 (8.9%) | 204 (8.3%) |
Technology Access in Jefferson County
Computing Device Access in Jefferson County
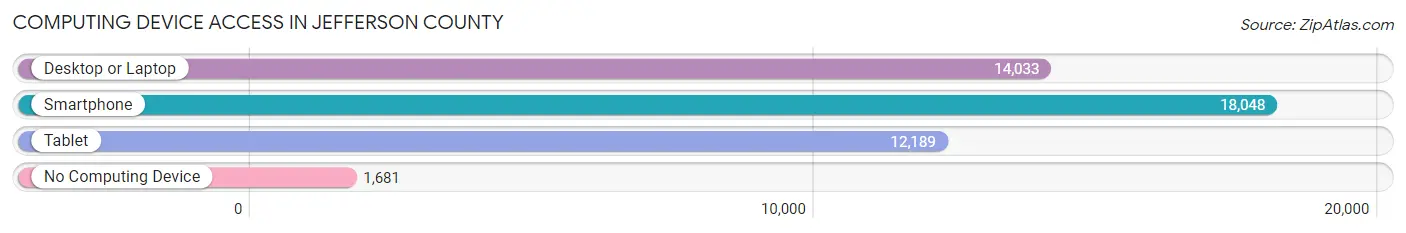
| Device Type | # Households | % Households |
| Desktop or Laptop | 14,033 | 67.4% |
| Smartphone | 18,048 | 86.7% |
| Tablet | 12,189 | 58.6% |
| No Computing Device | 1,681 | 8.1% |
| Total | 20,813 | 100.0% |
Internet Access in Jefferson County
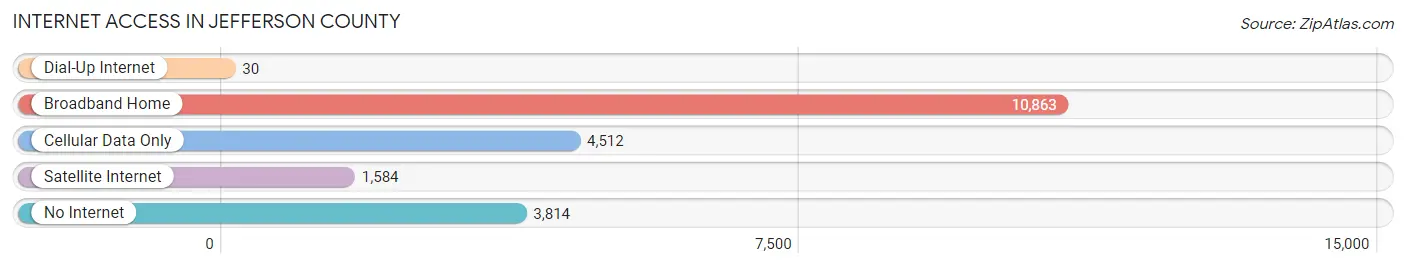
| Internet Type | # Households | % Households |
| Dial-Up Internet | 30 | 0.1% |
| Broadband Home | 10,863 | 52.2% |
| Cellular Data Only | 4,512 | 21.7% |
| Satellite Internet | 1,584 | 7.6% |
| No Internet | 3,814 | 18.3% |
| Total | 20,813 | 100.0% |
Jefferson County Summary
Jefferson County, Tennessee is located in the eastern part of the state and is bordered by the states of Kentucky and Virginia. It is part of the Knoxville Metropolitan Statistical Area and is the second most populous county in the state. The county seat is Dandridge, and the largest city is Jefferson City.
History
Jefferson County was established in 1792 and named after Thomas Jefferson, the third President of the United States. The county was formed from parts of Greene and Hawkins counties. The county was initially divided into two districts, the French Broad District and the Nolichucky District. The county was later divided into five districts, the French Broad, Nolichucky, White Pine, Dandridge, and New Market.
The county was home to several Native American tribes, including the Cherokee, Chickasaw, and Shawnee. The first European settlers arrived in the area in the late 1700s. The county was an important part of the early development of the state, as it was the site of several battles during the Civil War.
Geography
Jefferson County is located in the eastern part of the state and is bordered by the states of Kentucky and Virginia. It is part of the Knoxville Metropolitan Statistical Area and is the second most populous county in the state. The county covers an area of 545 square miles and has a population of over 57,000 people. The county is divided into five districts, the French Broad, Nolichucky, White Pine, Dandridge, and New Market.
The county is located in the Appalachian Mountains and is home to several mountain ranges, including the Great Smoky Mountains, the Unicoi Mountains, and the Clinch Mountains. The county is also home to several rivers, including the French Broad, Nolichucky, and Holston Rivers.
Economy
Jefferson County has a diverse economy that is driven by agriculture, manufacturing, and tourism. Agriculture is the largest sector of the economy, with the county producing a variety of crops, including corn, soybeans, wheat, and hay. The county is also home to several manufacturing companies, including a paper mill, a furniture factory, and a plastics plant.
Tourism is also an important part of the economy, with the county being home to several popular attractions, including the Great Smoky Mountains National Park, the Dollywood theme park, and the historic town of Dandridge.
Demographics
As of the 2010 census, the population of Jefferson County was 57,185. The population is predominantly white, with the largest racial group being non-Hispanic whites, who make up 87.3% of the population. The second largest racial group is African Americans, who make up 8.2% of the population. Other racial groups include Hispanics (2.2%), Asians (1.2%), and Native Americans (0.4%).
The median household income in the county is $45,845, and the median family income is $54,845. The poverty rate in the county is 17.3%, and the unemployment rate is 4.7%. The largest industries in the county are manufacturing, retail trade, and health care and social assistance.
Common Questions
What is Per Capita Income in Jefferson County?
Per Capita income in Jefferson County is $31,947.
What is the Median Family Income in Jefferson County?
Median Family Income in Jefferson County is $74,977.
What is the Median Household income in Jefferson County?
Median Household Income in Jefferson County is $60,393.
What is Income or Wage Gap in Jefferson County?
Income or Wage Gap in Jefferson County is 30.0%.
Women in Jefferson County earn 70.0 cents for every dollar earned by a man.
What is Family Income Deficit in Jefferson County?
Family Income Deficit in Jefferson County is $8,952.
Families that are below poverty line in Jefferson County earn $8,952 less on average than the poverty threshold level.
What is Inequality or Gini Index in Jefferson County?
Inequality or Gini Index in Jefferson County is 0.44.
What is the Total Population of Jefferson County?
Total Population of Jefferson County is 55,017.
What is the Total Male Population of Jefferson County?
Total Male Population of Jefferson County is 27,186.
What is the Total Female Population of Jefferson County?
Total Female Population of Jefferson County is 27,831.
What is the Ratio of Males per 100 Females in Jefferson County?
There are 97.68 Males per 100 Females in Jefferson County.
What is the Ratio of Females per 100 Males in Jefferson County?
There are 102.37 Females per 100 Males in Jefferson County.
What is the Median Population Age in Jefferson County?
Median Population Age in Jefferson County is 44.4 Years.
What is the Average Family Size in Jefferson County
Average Family Size in Jefferson County is 3.0 People.
What is the Average Household Size in Jefferson County
Average Household Size in Jefferson County is 2.6 People.
How Large is the Labor Force in Jefferson County?
There are 26,738 People in the Labor Forcein in Jefferson County.
What is the Percentage of People in the Labor Force in Jefferson County?
58.1% of People are in the Labor Force in Jefferson County.
What is the Unemployment Rate in Jefferson County?
Unemployment Rate in Jefferson County is 5.4%.