Hamblen County, TN Map & Demographics
Hamblen County Overview
$27,845
PER CAPITA INCOME
$68,553
AVG FAMILY INCOME
$49,656
AVG HOUSEHOLD INCOME
33.0%
WAGE / INCOME GAP [ % ]
67.0¢/ $1
WAGE / INCOME GAP [ $ ]
$13,120
FAMILY INCOME DEFICIT
0.46
INEQUALITY / GINI INDEX
64,531
TOTAL POPULATION
31,933
MALE POPULATION
32,598
FEMALE POPULATION
97.96
MALES / 100 FEMALES
102.08
FEMALES / 100 MALES
41.2
MEDIAN AGE
3.1
AVG FAMILY SIZE
2.5
AVG HOUSEHOLD SIZE
29,001
LABOR FORCE [ PEOPLE ]
56.6%
PERCENT IN LABOR FORCE
6.6%
UNEMPLOYMENT RATE
Income in Hamblen County
Income Overview in Hamblen County
Per Capita Income in Hamblen County is $27,845, while median incomes of families and households are $68,553 and $49,656 respectively.
| Characteristic | Number | Measure |
| Per Capita Income | 64,531 | $27,845 |
| Median Family Income | 16,600 | $68,553 |
| Mean Family Income | 16,600 | $83,628 |
| Median Household Income | 25,209 | $49,656 |
| Mean Household Income | 25,209 | $68,152 |
| Income Deficit | 16,600 | $13,120 |
| Wage / Income Gap (%) | 64,531 | 33.04% |
| Wage / Income Gap ($) | 64,531 | 66.96¢ per $1 |
| Gini / Inequality Index | 64,531 | 0.46 |
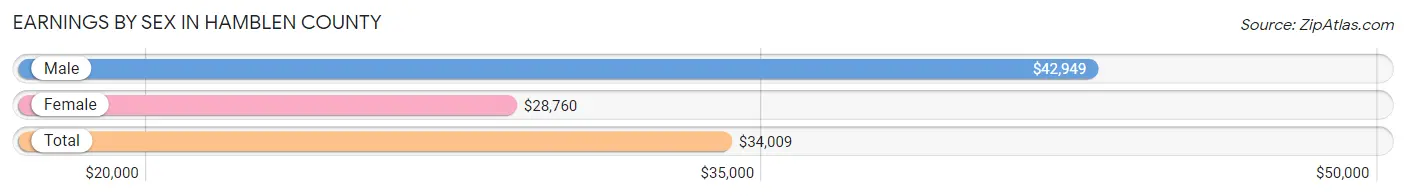
Earnings by Sex in Hamblen County
Average Earnings in Hamblen County are $34,009, $42,949 for men and $28,760 for women, a difference of 33.0%.
| Sex | Number | Average Earnings |
| Male | 15,275 (52.5%) | $42,949 |
| Female | 13,821 (47.5%) | $28,760 |
| Total | 29,096 (100.0%) | $34,009 |
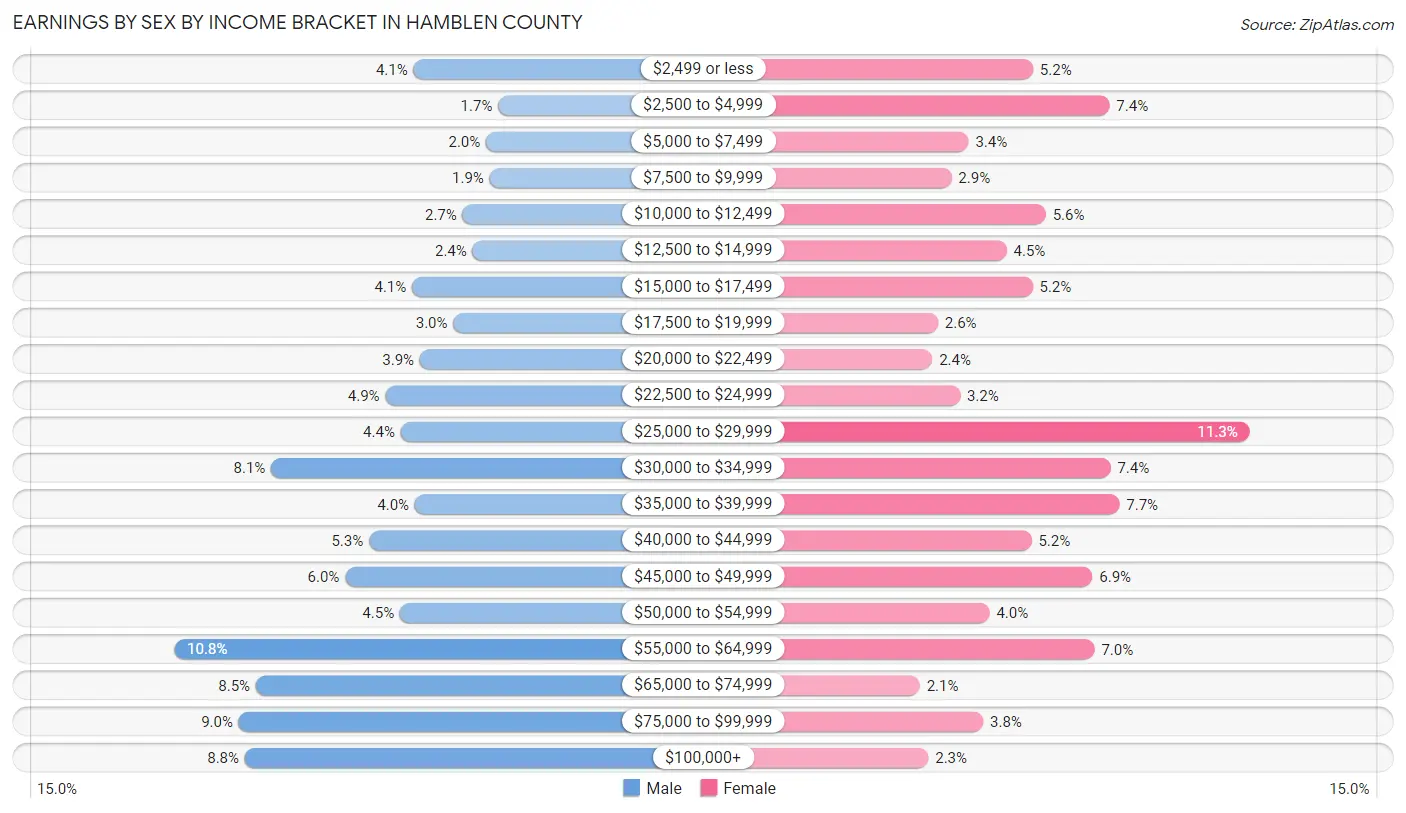
Earnings by Sex by Income Bracket in Hamblen County
The most common earnings brackets in Hamblen County are $55,000 to $64,999 for men (1,650 | 10.8%) and $25,000 to $29,999 for women (1,564 | 11.3%).
| Income | Male | Female |
| $2,499 or less | 621 (4.1%) | 723 (5.2%) |
| $2,500 to $4,999 | 258 (1.7%) | 1,020 (7.4%) |
| $5,000 to $7,499 | 310 (2.0%) | 472 (3.4%) |
| $7,500 to $9,999 | 295 (1.9%) | 406 (2.9%) |
| $10,000 to $12,499 | 411 (2.7%) | 772 (5.6%) |
| $12,500 to $14,999 | 368 (2.4%) | 620 (4.5%) |
| $15,000 to $17,499 | 628 (4.1%) | 721 (5.2%) |
| $17,500 to $19,999 | 450 (2.9%) | 354 (2.6%) |
| $20,000 to $22,499 | 594 (3.9%) | 332 (2.4%) |
| $22,500 to $24,999 | 742 (4.9%) | 439 (3.2%) |
| $25,000 to $29,999 | 677 (4.4%) | 1,564 (11.3%) |
| $30,000 to $34,999 | 1,232 (8.1%) | 1,024 (7.4%) |
| $35,000 to $39,999 | 616 (4.0%) | 1,058 (7.7%) |
| $40,000 to $44,999 | 812 (5.3%) | 717 (5.2%) |
| $45,000 to $49,999 | 915 (6.0%) | 953 (6.9%) |
| $50,000 to $54,999 | 680 (4.4%) | 554 (4.0%) |
| $55,000 to $64,999 | 1,650 (10.8%) | 962 (7.0%) |
| $65,000 to $74,999 | 1,299 (8.5%) | 284 (2.1%) |
| $75,000 to $99,999 | 1,372 (9.0%) | 529 (3.8%) |
| $100,000+ | 1,345 (8.8%) | 317 (2.3%) |
| Total | 15,275 (100.0%) | 13,821 (100.0%) |
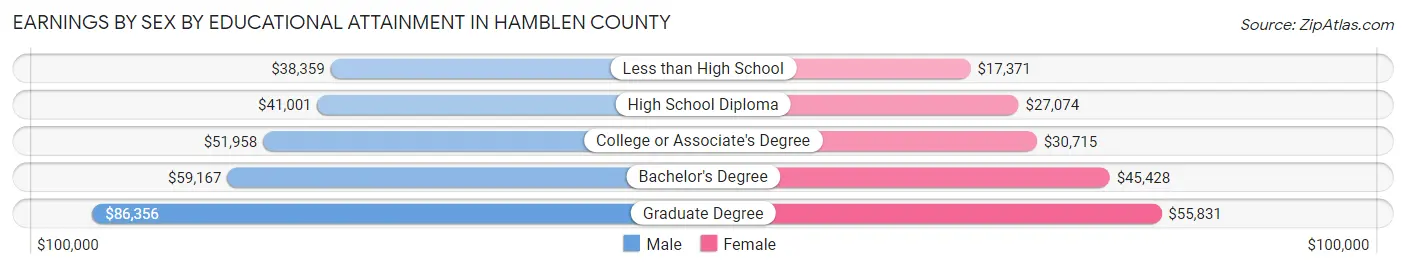
Earnings by Sex by Educational Attainment in Hamblen County
Average earnings in Hamblen County are $46,938 for men and $31,575 for women, a difference of 32.7%. Men with an educational attainment of graduate degree enjoy the highest average annual earnings of $86,356, while those with less than high school education earn the least with $38,359. Women with an educational attainment of graduate degree earn the most with the average annual earnings of $55,831, while those with less than high school education have the smallest earnings of $17,371.
| Educational Attainment | Male Income | Female Income |
| Less than High School | $38,359 | $17,371 |
| High School Diploma | $41,001 | $27,074 |
| College or Associate's Degree | $51,958 | $30,715 |
| Bachelor's Degree | $59,167 | $45,428 |
| Graduate Degree | $86,356 | $55,831 |
| Total | $46,938 | $31,575 |
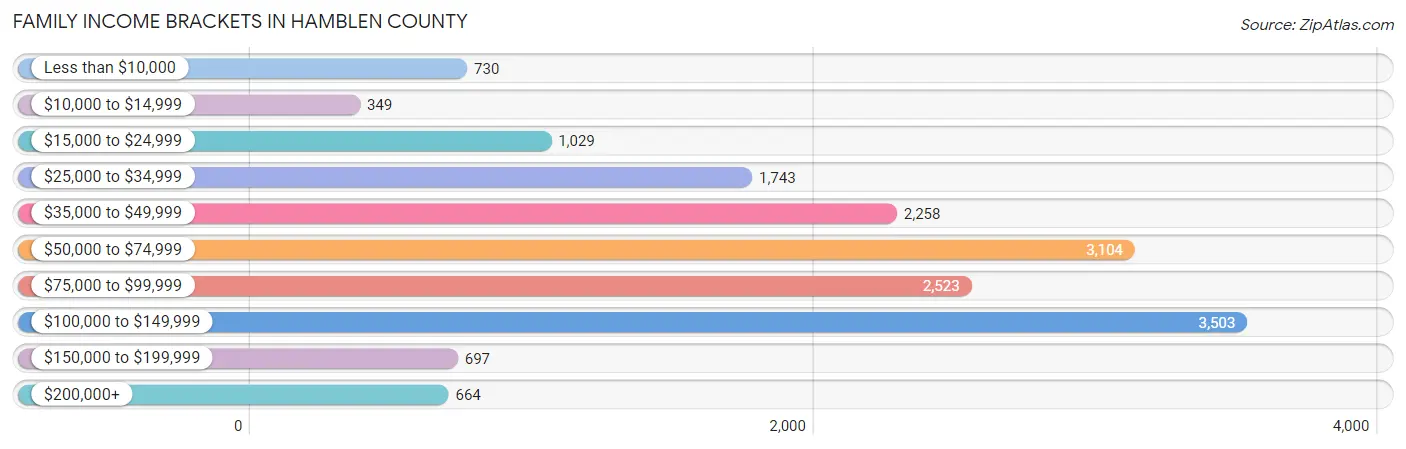
Family Income in Hamblen County
Family Income Brackets in Hamblen County
According to the Hamblen County family income data, there are 3,503 families falling into the $100,000 to $149,999 income range, which is the most common income bracket and makes up 21.1% of all families. Conversely, the $10,000 to $14,999 income bracket is the least frequent group with only 349 families (2.1%) belonging to this category.
| Income Bracket | # Families | % Families |
| Less than $10,000 | 730 | 4.4% |
| $10,000 to $14,999 | 349 | 2.1% |
| $15,000 to $24,999 | 1,029 | 6.2% |
| $25,000 to $34,999 | 1,743 | 10.5% |
| $35,000 to $49,999 | 2,258 | 13.6% |
| $50,000 to $74,999 | 3,104 | 18.7% |
| $75,000 to $99,999 | 2,523 | 15.2% |
| $100,000 to $149,999 | 3,503 | 21.1% |
| $150,000 to $199,999 | 697 | 4.2% |
| $200,000+ | 664 | 4.0% |
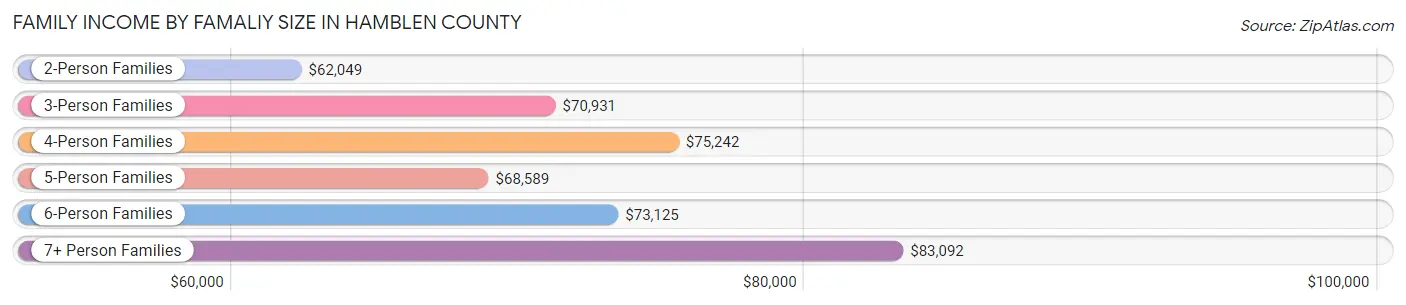
Family Income by Famaliy Size in Hamblen County
7+ person families (395 | 2.4%) account for the highest median family income in Hamblen County with $83,092 per family, while 2-person families (8,090 | 48.7%) have the highest median income of $31,024 per family member.
| Income Bracket | # Families | Median Income |
| 2-Person Families | 8,090 (48.7%) | $62,049 |
| 3-Person Families | 3,911 (23.6%) | $70,931 |
| 4-Person Families | 2,802 (16.9%) | $75,242 |
| 5-Person Families | 1,257 (7.6%) | $68,589 |
| 6-Person Families | 145 (0.9%) | $73,125 |
| 7+ Person Families | 395 (2.4%) | $83,092 |
| Total | 16,600 (100.0%) | $68,553 |
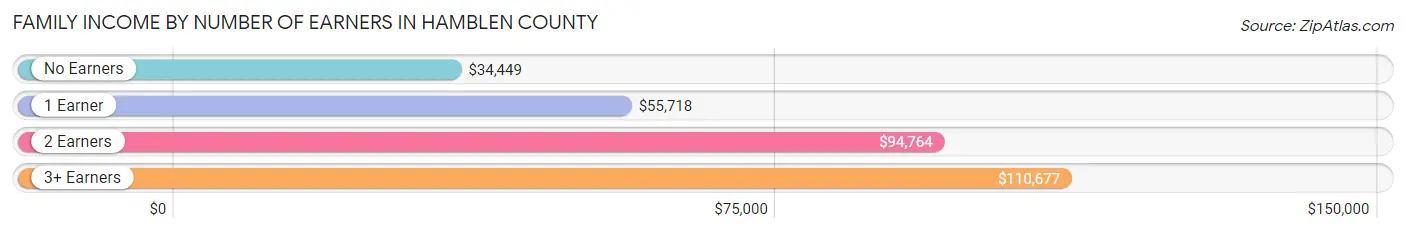
Family Income by Number of Earners in Hamblen County
The median family income in Hamblen County is $68,553, with families comprising 3+ earners (1,475) having the highest median family income of $110,677, while families with no earners (3,744) have the lowest median family income of $34,449, accounting for 8.9% and 22.6% of families, respectively.
| Number of Earners | # Families | Median Income |
| No Earners | 3,744 (22.6%) | $34,449 |
| 1 Earner | 5,858 (35.3%) | $55,718 |
| 2 Earners | 5,523 (33.3%) | $94,764 |
| 3+ Earners | 1,475 (8.9%) | $110,677 |
| Total | 16,600 (100.0%) | $68,553 |
Household Income in Hamblen County
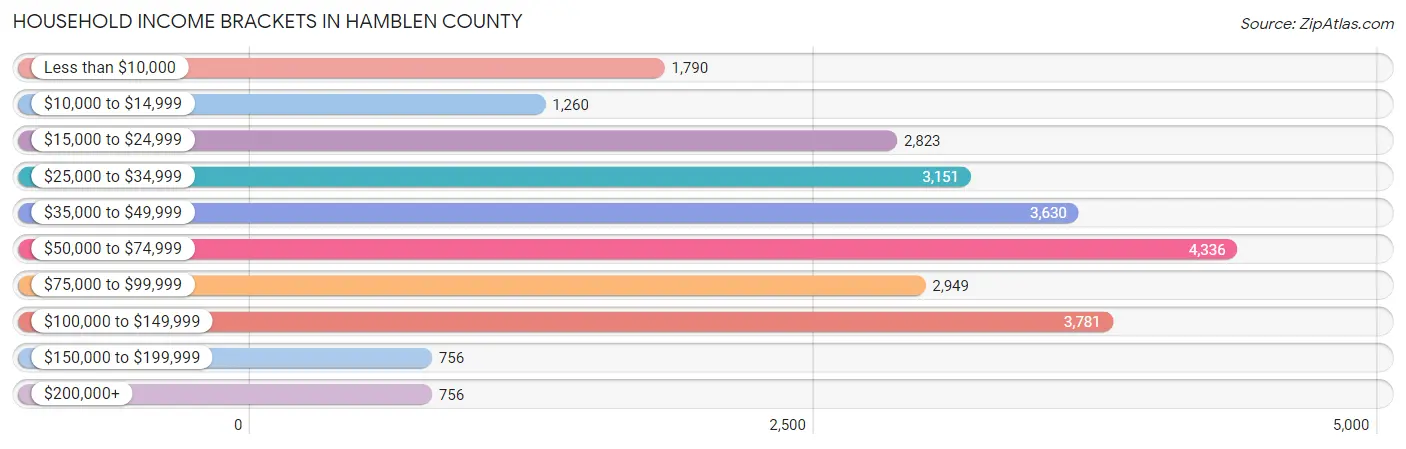
Household Income Brackets in Hamblen County
With 4,336 households falling in the category, the $50,000 to $74,999 income range is the most frequent in Hamblen County, accounting for 17.2% of all households. In contrast, only 756 households (3.0%) fall into the $150,000 to $199,999 income bracket, making it the least populous group.
| Income Bracket | # Households | % Households |
| Less than $10,000 | 1,790 | 7.1% |
| $10,000 to $14,999 | 1,260 | 5.0% |
| $15,000 to $24,999 | 2,823 | 11.2% |
| $25,000 to $34,999 | 3,151 | 12.5% |
| $35,000 to $49,999 | 3,630 | 14.4% |
| $50,000 to $74,999 | 4,336 | 17.2% |
| $75,000 to $99,999 | 2,949 | 11.7% |
| $100,000 to $149,999 | 3,781 | 15.0% |
| $150,000 to $199,999 | 756 | 3.0% |
| $200,000+ | 756 | 3.0% |
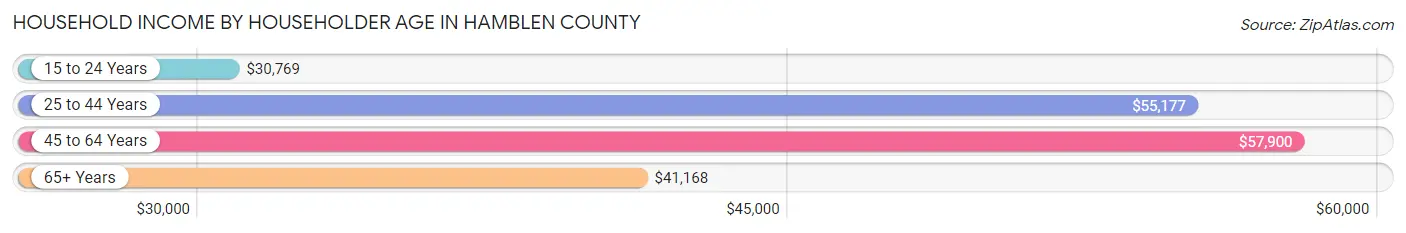
Household Income by Householder Age in Hamblen County
The median household income in Hamblen County is $49,656, with the highest median household income of $57,900 found in the 45 to 64 years age bracket for the primary householder. A total of 9,683 households (38.4%) fall into this category. Meanwhile, the 15 to 24 years age bracket for the primary householder has the lowest median household income of $30,769, with 654 households (2.6%) in this group.
| Income Bracket | # Households | Median Income |
| 15 to 24 Years | 654 (2.6%) | $30,769 |
| 25 to 44 Years | 7,342 (29.1%) | $55,177 |
| 45 to 64 Years | 9,683 (38.4%) | $57,900 |
| 65+ Years | 7,530 (29.9%) | $41,168 |
| Total | 25,209 (100.0%) | $49,656 |
Poverty in Hamblen County
Income Below Poverty by Sex and Age in Hamblen County
With 15.9% poverty level for males and 18.3% for females among the residents of Hamblen County, under 5 year old males and 5 year old females are the most vulnerable to poverty, with 756 males (37.6%) and 174 females (37.1%) in their respective age groups living below the poverty level.
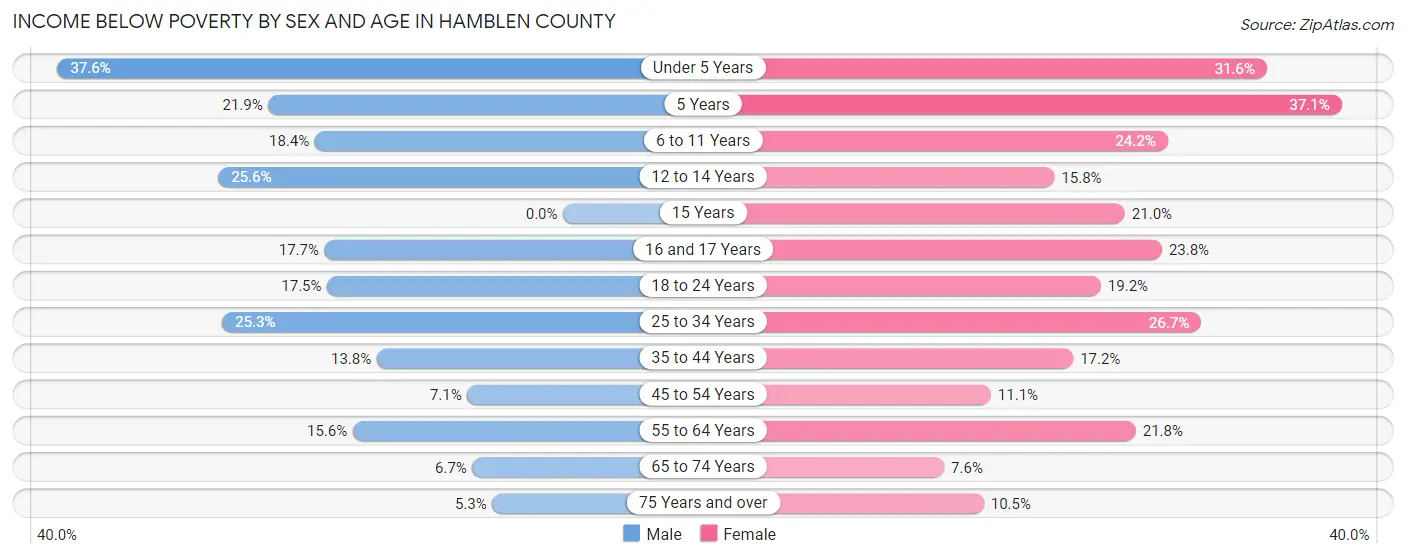
| Age Bracket | Male | Female |
| Under 5 Years | 756 (37.6%) | 571 (31.6%) |
| 5 Years | 74 (21.9%) | 174 (37.1%) |
| 6 to 11 Years | 534 (18.4%) | 515 (24.2%) |
| 12 to 14 Years | 249 (25.6%) | 208 (15.8%) |
| 15 Years | 0 (0.0%) | 120 (21.0%) |
| 16 and 17 Years | 150 (17.7%) | 194 (23.8%) |
| 18 to 24 Years | 453 (17.5%) | 509 (19.2%) |
| 25 to 34 Years | 974 (25.3%) | 966 (26.7%) |
| 35 to 44 Years | 499 (13.8%) | 669 (17.2%) |
| 45 to 54 Years | 324 (7.1%) | 465 (11.1%) |
| 55 to 64 Years | 655 (15.6%) | 932 (21.8%) |
| 65 to 74 Years | 219 (6.7%) | 272 (7.6%) |
| 75 Years and over | 96 (5.2%) | 296 (10.5%) |
| Total | 4,983 (15.9%) | 5,891 (18.3%) |
Income Above Poverty by Sex and Age in Hamblen County
According to the poverty statistics in Hamblen County, males aged 15 years and females aged 65 to 74 years are the age groups that are most secure financially, with 100.0% of males and 92.4% of females in these age groups living above the poverty line.
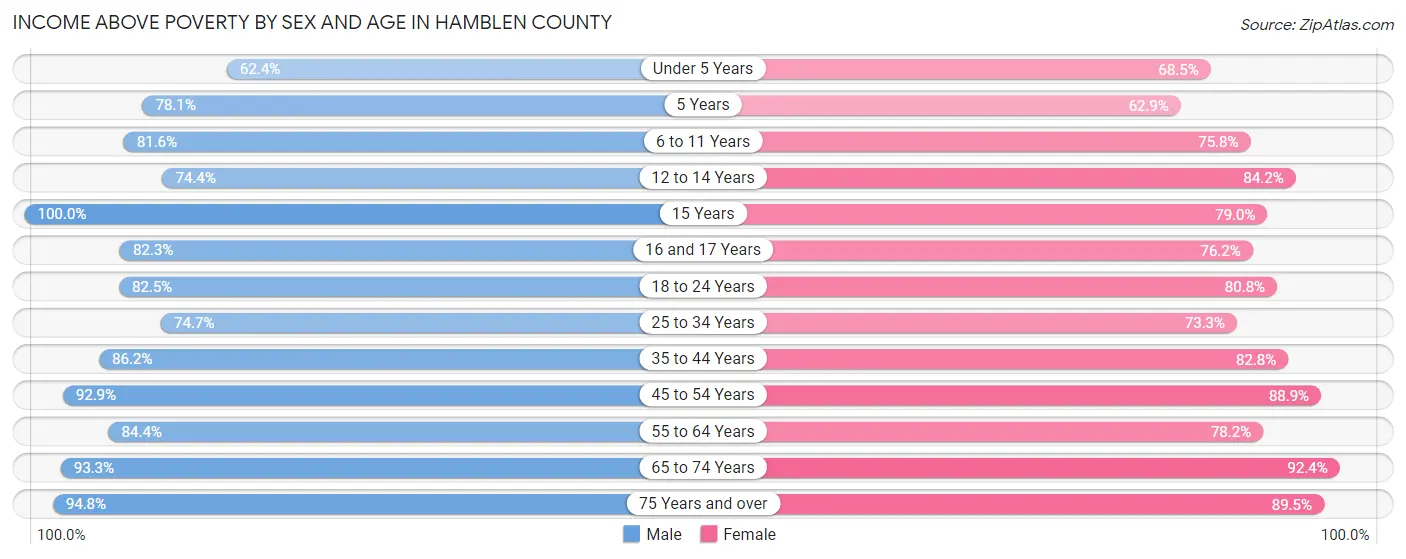
| Age Bracket | Male | Female |
| Under 5 Years | 1,257 (62.4%) | 1,239 (68.4%) |
| 5 Years | 264 (78.1%) | 295 (62.9%) |
| 6 to 11 Years | 2,364 (81.6%) | 1,614 (75.8%) |
| 12 to 14 Years | 723 (74.4%) | 1,109 (84.2%) |
| 15 Years | 375 (100.0%) | 451 (79.0%) |
| 16 and 17 Years | 697 (82.3%) | 622 (76.2%) |
| 18 to 24 Years | 2,132 (82.5%) | 2,136 (80.8%) |
| 25 to 34 Years | 2,872 (74.7%) | 2,655 (73.3%) |
| 35 to 44 Years | 3,110 (86.2%) | 3,224 (82.8%) |
| 45 to 54 Years | 4,233 (92.9%) | 3,735 (88.9%) |
| 55 to 64 Years | 3,542 (84.4%) | 3,337 (78.2%) |
| 65 to 74 Years | 3,035 (93.3%) | 3,305 (92.4%) |
| 75 Years and over | 1,733 (94.8%) | 2,513 (89.5%) |
| Total | 26,337 (84.1%) | 26,235 (81.7%) |
Income Below Poverty Among Married-Couple Families in Hamblen County
The poverty statistics for married-couple families in Hamblen County show that 6.5% or 784 of the total 11,998 families live below the poverty line. Families with 3 or 4 children have the highest poverty rate of 15.8%, comprising of 144 families. On the other hand, families with no children have the lowest poverty rate of 4.4%, which includes 324 families.
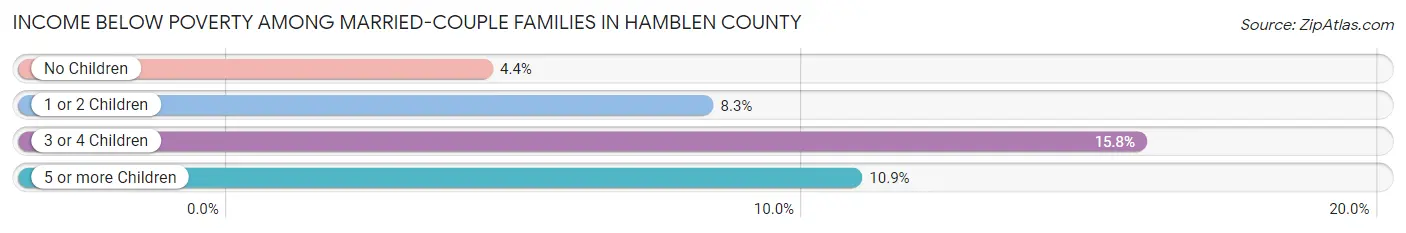
| Children | Above Poverty | Below Poverty |
| No Children | 6,977 (95.6%) | 324 (4.4%) |
| 1 or 2 Children | 3,389 (91.7%) | 306 (8.3%) |
| 3 or 4 Children | 766 (84.2%) | 144 (15.8%) |
| 5 or more Children | 82 (89.1%) | 10 (10.9%) |
| Total | 11,214 (93.5%) | 784 (6.5%) |
Income Below Poverty Among Single-Parent Households in Hamblen County
According to the poverty data in Hamblen County, 10.0% or 136 single-father households and 30.0% or 971 single-mother households are living below the poverty line. Among single-father households, those with 3 or 4 children have the highest poverty rate, with 58 households (51.8%) experiencing poverty. Likewise, among single-mother households, those with 5 or more children have the highest poverty rate, with 26 households (100.0%) falling below the poverty line.
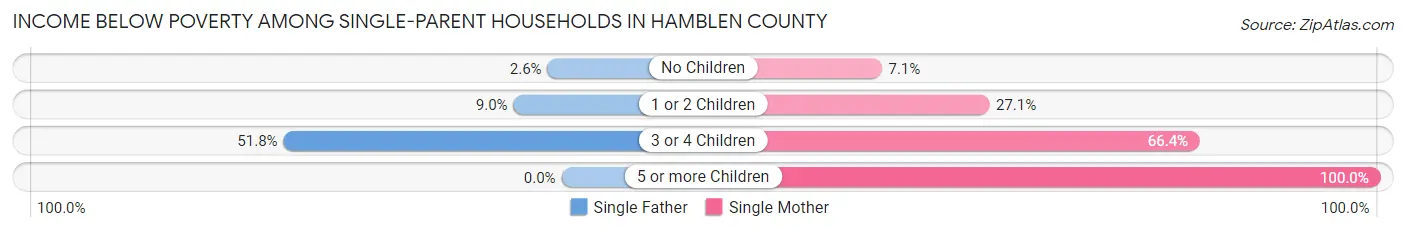
| Children | Single Father | Single Mother |
| No Children | 14 (2.6%) | 75 (7.0%) |
| 1 or 2 Children | 64 (8.9%) | 383 (27.1%) |
| 3 or 4 Children | 58 (51.8%) | 487 (66.3%) |
| 5 or more Children | 0 (0.0%) | 26 (100.0%) |
| Total | 136 (10.0%) | 971 (30.0%) |
Income Below Poverty Among Married-Couple vs Single-Parent Households in Hamblen County
The poverty data for Hamblen County shows that 784 of the married-couple family households (6.5%) and 1,107 of the single-parent households (24.0%) are living below the poverty level. Within the married-couple family households, those with 3 or 4 children have the highest poverty rate, with 144 households (15.8%) falling below the poverty line. Among the single-parent households, those with 5 or more children have the highest poverty rate, with 26 household (100.0%) living below poverty.
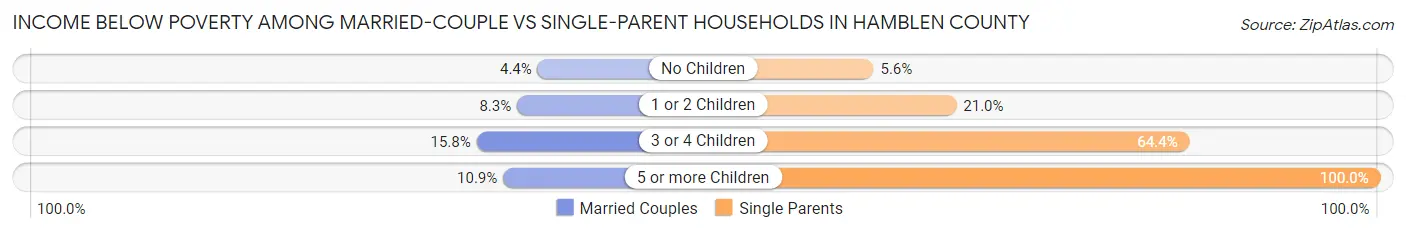
| Children | Married-Couple Families | Single-Parent Households |
| No Children | 324 (4.4%) | 89 (5.6%) |
| 1 or 2 Children | 306 (8.3%) | 447 (21.0%) |
| 3 or 4 Children | 144 (15.8%) | 545 (64.4%) |
| 5 or more Children | 10 (10.9%) | 26 (100.0%) |
| Total | 784 (6.5%) | 1,107 (24.0%) |
Race in Hamblen County
The most populous races in Hamblen County are White / Caucasian (55,250 | 85.6%), Hispanic or Latino (7,928 | 12.3%), and Two or more Races (4,411 | 6.8%).
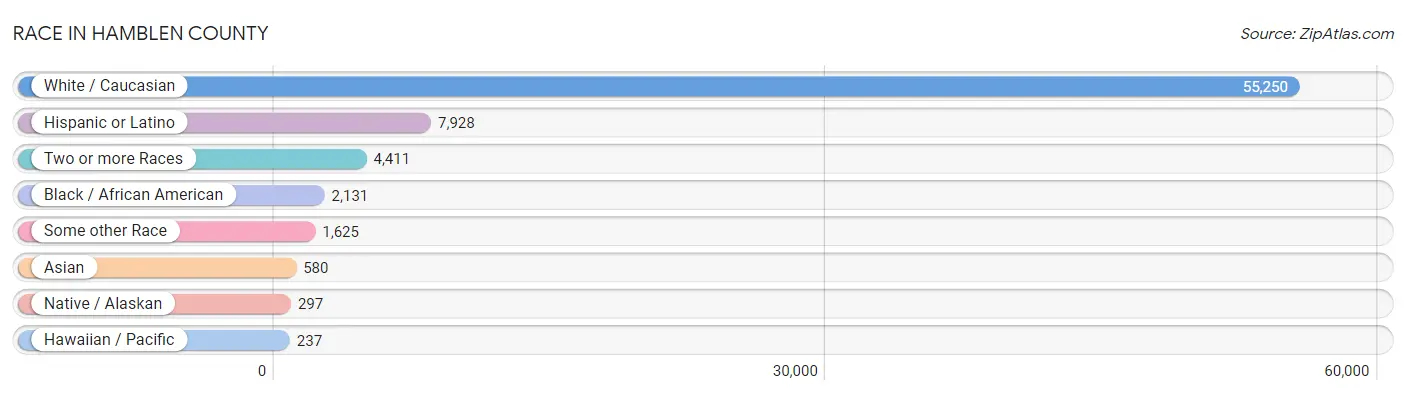
| Race | # Population | % Population |
| Asian | 580 | 0.9% |
| Black / African American | 2,131 | 3.3% |
| Hawaiian / Pacific | 237 | 0.4% |
| Hispanic or Latino | 7,928 | 12.3% |
| Native / Alaskan | 297 | 0.5% |
| White / Caucasian | 55,250 | 85.6% |
| Two or more Races | 4,411 | 6.8% |
| Some other Race | 1,625 | 2.5% |
| Total | 64,531 | 100.0% |
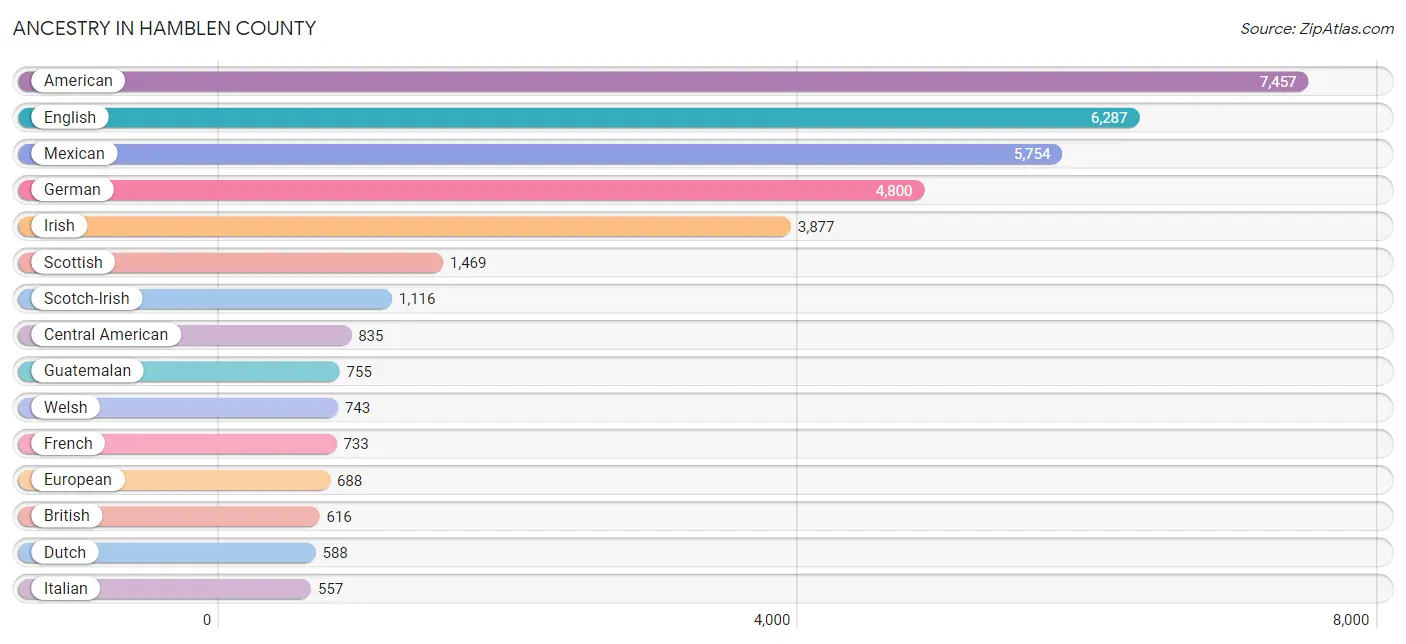
Ancestry in Hamblen County
The most populous ancestries reported in Hamblen County are American (7,457 | 11.6%), English (6,287 | 9.7%), Mexican (5,754 | 8.9%), German (4,800 | 7.4%), and Irish (3,877 | 6.0%), together accounting for 43.7% of all Hamblen County residents.
| Ancestry | # Population | % Population |
| African | 208 | 0.3% |
| American | 7,457 | 11.6% |
| Arab | 71 | 0.1% |
| Austrian | 218 | 0.3% |
| Belgian | 14 | 0.0% |
| Bhutanese | 111 | 0.2% |
| Blackfeet | 66 | 0.1% |
| Brazilian | 24 | 0.0% |
| British | 616 | 0.9% |
| Burmese | 73 | 0.1% |
| Canadian | 89 | 0.1% |
| Central American | 835 | 1.3% |
| Central American Indian | 177 | 0.3% |
| Cherokee | 353 | 0.5% |
| Choctaw | 10 | 0.0% |
| Colombian | 50 | 0.1% |
| Cuban | 170 | 0.3% |
| Czech | 20 | 0.0% |
| Danish | 66 | 0.1% |
| Delaware | 7 | 0.0% |
| Dutch | 588 | 0.9% |
| Eastern European | 81 | 0.1% |
| English | 6,287 | 9.7% |
| European | 688 | 1.1% |
| Finnish | 16 | 0.0% |
| French | 733 | 1.1% |
| French Canadian | 69 | 0.1% |
| German | 4,800 | 7.4% |
| Guatemalan | 755 | 1.2% |
| Honduran | 69 | 0.1% |
| Hungarian | 26 | 0.0% |
| Indian (Asian) | 50 | 0.1% |
| Irish | 3,877 | 6.0% |
| Iroquois | 29 | 0.0% |
| Italian | 557 | 0.9% |
| Jamaican | 270 | 0.4% |
| Korean | 80 | 0.1% |
| Lebanese | 71 | 0.1% |
| Lithuanian | 42 | 0.1% |
| Marshallese | 34 | 0.1% |
| Mexican | 5,754 | 8.9% |
| Native Hawaiian | 30 | 0.1% |
| Nigerian | 20 | 0.0% |
| Northern European | 52 | 0.1% |
| Norwegian | 105 | 0.2% |
| Paiute | 6 | 0.0% |
| Pennsylvania German | 5 | 0.0% |
| Polish | 542 | 0.8% |
| Portuguese | 82 | 0.1% |
| Puerto Rican | 353 | 0.5% |
| Russian | 68 | 0.1% |
| Salvadoran | 11 | 0.0% |
| Scandinavian | 84 | 0.1% |
| Scotch-Irish | 1,116 | 1.7% |
| Scottish | 1,469 | 2.3% |
| South American | 74 | 0.1% |
| Spaniard | 25 | 0.0% |
| Spanish | 126 | 0.2% |
| Sri Lankan | 305 | 0.5% |
| Subsaharan African | 248 | 0.4% |
| Swedish | 187 | 0.3% |
| Swiss | 150 | 0.2% |
| Thai | 69 | 0.1% |
| Ukrainian | 9 | 0.0% |
| Venezuelan | 24 | 0.0% |
| Welsh | 743 | 1.1% | View All 66 Rows |
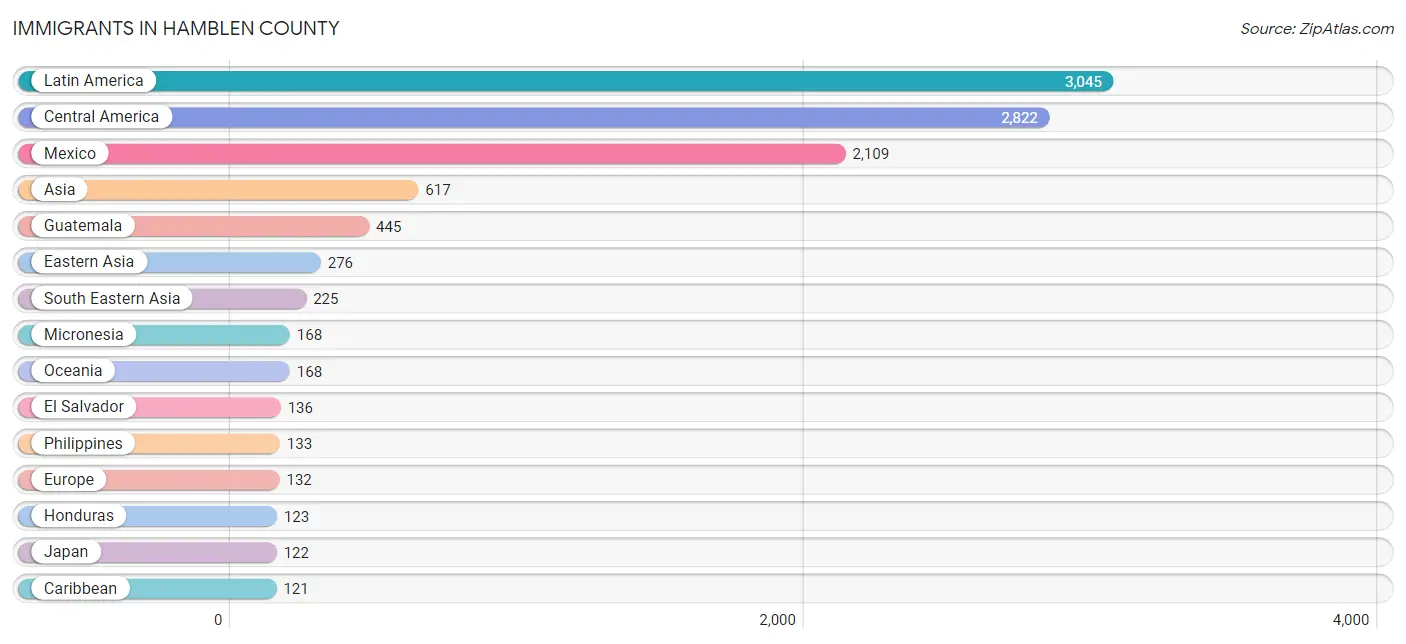
Immigrants in Hamblen County
The most numerous immigrant groups reported in Hamblen County came from Latin America (3,045 | 4.7%), Central America (2,822 | 4.4%), Mexico (2,109 | 3.3%), Asia (617 | 1.0%), and Guatemala (445 | 0.7%), together accounting for 14.0% of all Hamblen County residents.
| Immigration Origin | # Population | % Population |
| Asia | 617 | 1.0% |
| Austria | 12 | 0.0% |
| Brazil | 28 | 0.0% |
| Caribbean | 121 | 0.2% |
| Central America | 2,822 | 4.4% |
| China | 40 | 0.1% |
| Colombia | 50 | 0.1% |
| Cuba | 33 | 0.1% |
| Eastern Asia | 276 | 0.4% |
| Eastern Europe | 13 | 0.0% |
| El Salvador | 136 | 0.2% |
| England | 1 | 0.0% |
| Europe | 132 | 0.2% |
| Germany | 39 | 0.1% |
| Guatemala | 445 | 0.7% |
| Honduras | 123 | 0.2% |
| India | 69 | 0.1% |
| Iran | 15 | 0.0% |
| Italy | 22 | 0.0% |
| Jamaica | 88 | 0.1% |
| Japan | 122 | 0.2% |
| Korea | 114 | 0.2% |
| Latin America | 3,045 | 4.7% |
| Mexico | 2,109 | 3.3% |
| Micronesia | 168 | 0.3% |
| Nicaragua | 9 | 0.0% |
| Northern Europe | 46 | 0.1% |
| Oceania | 168 | 0.3% |
| Philippines | 133 | 0.2% |
| Russia | 13 | 0.0% |
| South America | 102 | 0.2% |
| South Central Asia | 116 | 0.2% |
| South Eastern Asia | 225 | 0.4% |
| Southern Europe | 22 | 0.0% |
| Sri Lanka | 32 | 0.1% |
| Thailand | 16 | 0.0% |
| Venezuela | 24 | 0.0% |
| Vietnam | 76 | 0.1% |
| Western Europe | 51 | 0.1% | View All 39 Rows |
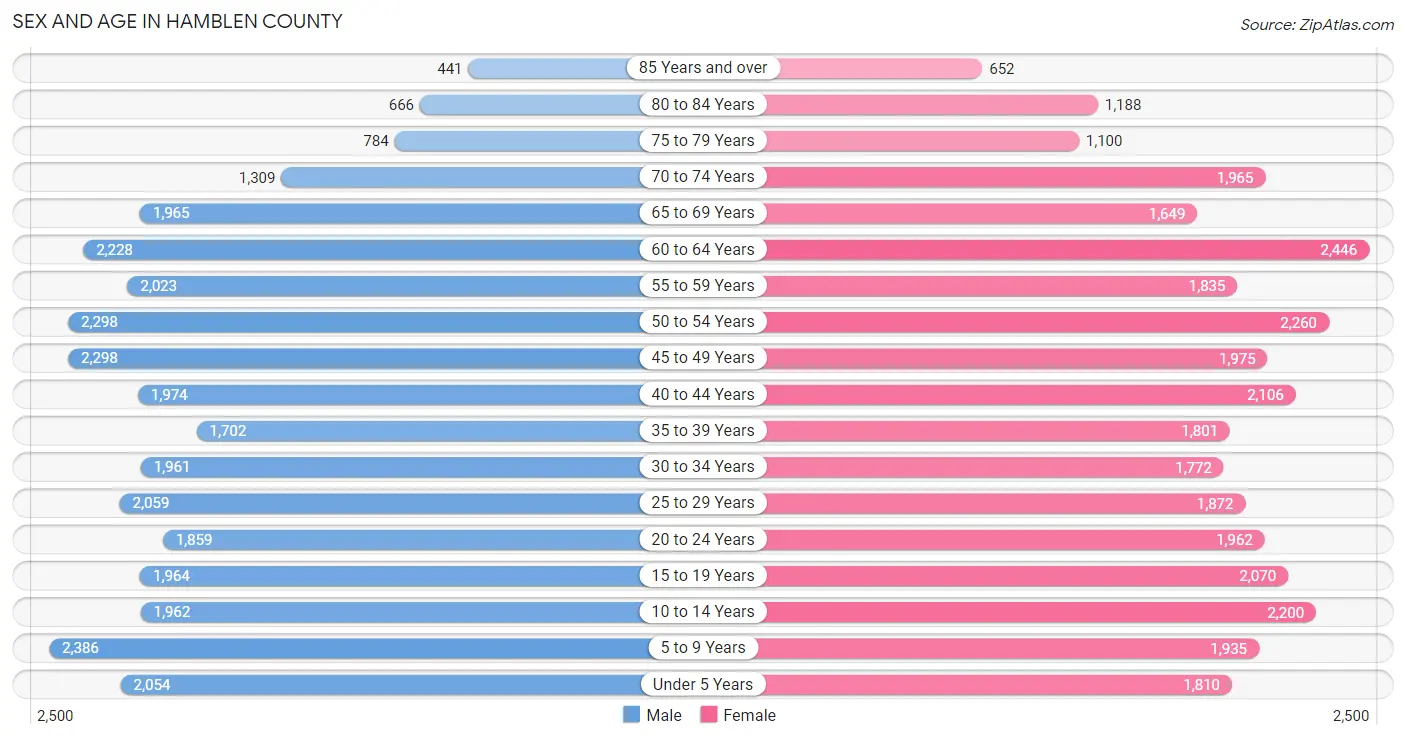
Sex and Age in Hamblen County
Sex and Age in Hamblen County
The most populous age groups in Hamblen County are 5 to 9 Years (2,386 | 7.5%) for men and 60 to 64 Years (2,446 | 7.5%) for women.
| Age Bracket | Male | Female |
| Under 5 Years | 2,054 (6.4%) | 1,810 (5.6%) |
| 5 to 9 Years | 2,386 (7.5%) | 1,935 (5.9%) |
| 10 to 14 Years | 1,962 (6.1%) | 2,200 (6.8%) |
| 15 to 19 Years | 1,964 (6.1%) | 2,070 (6.4%) |
| 20 to 24 Years | 1,859 (5.8%) | 1,962 (6.0%) |
| 25 to 29 Years | 2,059 (6.5%) | 1,872 (5.7%) |
| 30 to 34 Years | 1,961 (6.1%) | 1,772 (5.4%) |
| 35 to 39 Years | 1,702 (5.3%) | 1,801 (5.5%) |
| 40 to 44 Years | 1,974 (6.2%) | 2,106 (6.5%) |
| 45 to 49 Years | 2,298 (7.2%) | 1,975 (6.1%) |
| 50 to 54 Years | 2,298 (7.2%) | 2,260 (6.9%) |
| 55 to 59 Years | 2,023 (6.3%) | 1,835 (5.6%) |
| 60 to 64 Years | 2,228 (7.0%) | 2,446 (7.5%) |
| 65 to 69 Years | 1,965 (6.1%) | 1,649 (5.1%) |
| 70 to 74 Years | 1,309 (4.1%) | 1,965 (6.0%) |
| 75 to 79 Years | 784 (2.5%) | 1,100 (3.4%) |
| 80 to 84 Years | 666 (2.1%) | 1,188 (3.6%) |
| 85 Years and over | 441 (1.4%) | 652 (2.0%) |
| Total | 31,933 (100.0%) | 32,598 (100.0%) |
Families and Households in Hamblen County
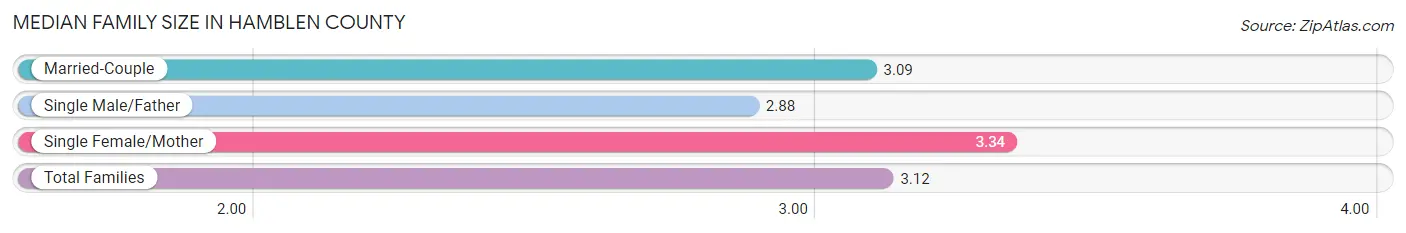
Median Family Size in Hamblen County
The median family size in Hamblen County is 3.12 persons per family, with single female/mother families (3,239 | 19.5%) accounting for the largest median family size of 3.34 persons per family. On the other hand, single male/father families (1,363 | 8.2%) represent the smallest median family size with 2.88 persons per family.
| Family Type | # Families | Family Size |
| Married-Couple | 11,998 (72.3%) | 3.09 |
| Single Male/Father | 1,363 (8.2%) | 2.88 |
| Single Female/Mother | 3,239 (19.5%) | 3.34 |
| Total Families | 16,600 (100.0%) | 3.12 |
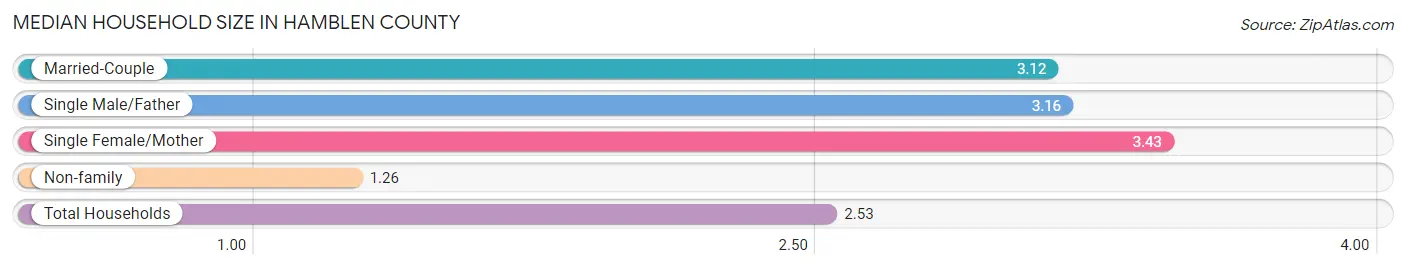
Median Household Size in Hamblen County
The median household size in Hamblen County is 2.53 persons per household, with single female/mother households (3,239 | 12.9%) accounting for the largest median household size of 3.43 persons per household. non-family households (8,609 | 34.2%) represent the smallest median household size with 1.26 persons per household.
| Household Type | # Households | Household Size |
| Married-Couple | 11,998 (47.6%) | 3.12 |
| Single Male/Father | 1,363 (5.4%) | 3.16 |
| Single Female/Mother | 3,239 (12.9%) | 3.43 |
| Non-family | 8,609 (34.2%) | 1.26 |
| Total Households | 25,209 (100.0%) | 2.53 |
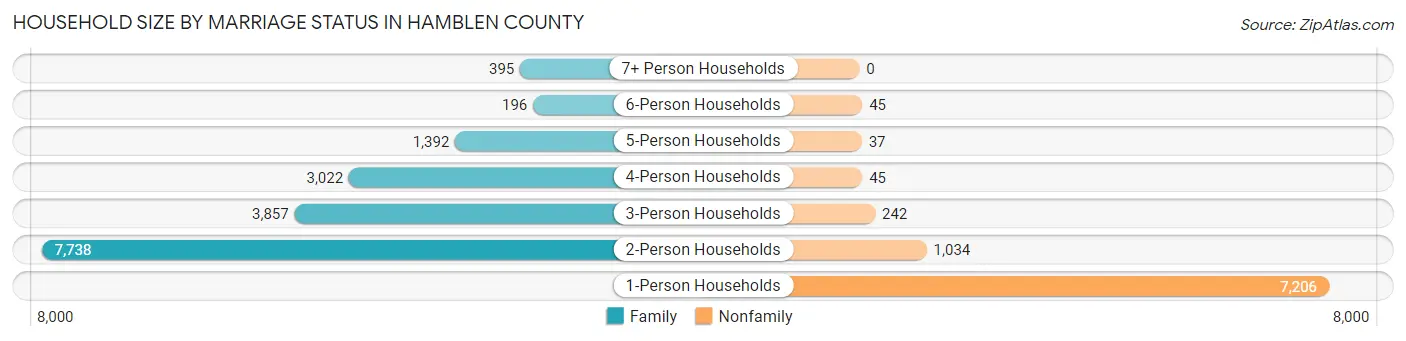
Household Size by Marriage Status in Hamblen County
Out of a total of 25,209 households in Hamblen County, 16,600 (65.8%) are family households, while 8,609 (34.2%) are nonfamily households. The most numerous type of family households are 2-person households, comprising 7,738, and the most common type of nonfamily households are 1-person households, comprising 7,206.
| Household Size | Family Households | Nonfamily Households |
| 1-Person Households | - | 7,206 (28.6%) |
| 2-Person Households | 7,738 (30.7%) | 1,034 (4.1%) |
| 3-Person Households | 3,857 (15.3%) | 242 (1.0%) |
| 4-Person Households | 3,022 (12.0%) | 45 (0.2%) |
| 5-Person Households | 1,392 (5.5%) | 37 (0.2%) |
| 6-Person Households | 196 (0.8%) | 45 (0.2%) |
| 7+ Person Households | 395 (1.6%) | 0 (0.0%) |
| Total | 16,600 (65.8%) | 8,609 (34.2%) |
Female Fertility in Hamblen County
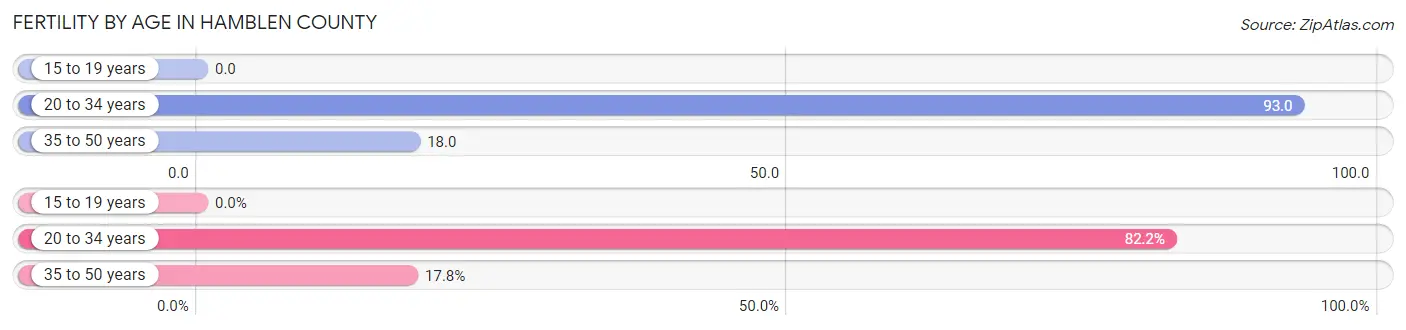
Fertility by Age in Hamblen County
Average fertility rate in Hamblen County is 45.0 births per 1,000 women. Women in the age bracket of 20 to 34 years have the highest fertility rate with 93.0 births per 1,000 women. Women in the age bracket of 20 to 34 years acount for 82.2% of all women with births.
| Age Bracket | Women with Births | Births / 1,000 Women |
| 15 to 19 years | 0 (0.0%) | 0.0 |
| 20 to 34 years | 521 (82.2%) | 93.0 |
| 35 to 50 years | 113 (17.8%) | 18.0 |
| Total | 634 (100.0%) | 45.0 |
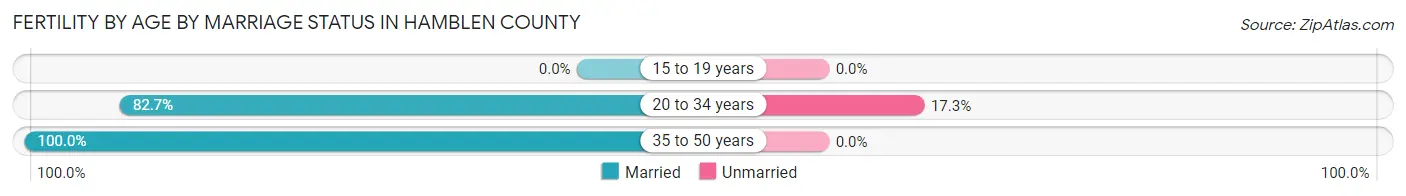
Fertility by Age by Marriage Status in Hamblen County
85.8% of women with births (634) in Hamblen County are married. The highest percentage of unmarried women with births falls into 20 to 34 years age bracket with 17.3% of them unmarried at the time of birth, while the lowest percentage of unmarried women with births belong to 35 to 50 years age bracket with 0.0% of them unmarried.
| Age Bracket | Married | Unmarried |
| 15 to 19 years | 0 (0.0%) | 0 (0.0%) |
| 20 to 34 years | 431 (82.7%) | 90 (17.3%) |
| 35 to 50 years | 113 (100.0%) | 0 (0.0%) |
| Total | 544 (85.8%) | 90 (14.2%) |
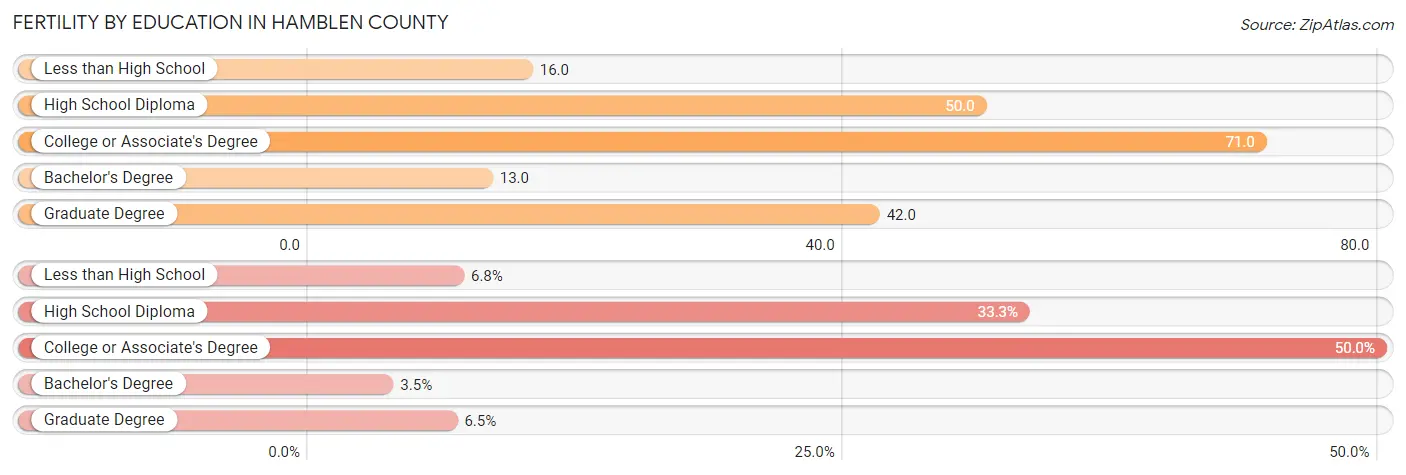
Fertility by Education in Hamblen County
Average fertility rate in Hamblen County is 45.0 births per 1,000 women. Women with the education attainment of college or associate's degree have the highest fertility rate of 71.0 births per 1,000 women, while women with the education attainment of bachelor's degree have the lowest fertility at 13.0 births per 1,000 women. Women with the education attainment of college or associate's degree represent 50.0% of all women with births.
| Educational Attainment | Women with Births | Births / 1,000 Women |
| Less than High School | 43 (6.8%) | 16.0 |
| High School Diploma | 211 (33.3%) | 50.0 |
| College or Associate's Degree | 317 (50.0%) | 71.0 |
| Bachelor's Degree | 22 (3.5%) | 13.0 |
| Graduate Degree | 41 (6.5%) | 42.0 |
| Total | 634 (100.0%) | 45.0 |
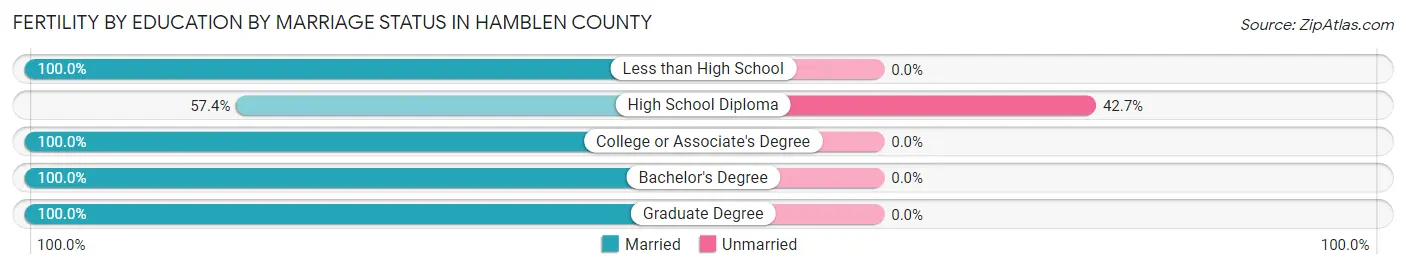
Fertility by Education by Marriage Status in Hamblen County
14.2% of women with births in Hamblen County are unmarried. Women with the educational attainment of less than high school are most likely to be married with 100.0% of them married at childbirth, while women with the educational attainment of high school diploma are least likely to be married with 42.6% of them unmarried at childbirth.
| Educational Attainment | Married | Unmarried |
| Less than High School | 43 (100.0%) | 0 (0.0%) |
| High School Diploma | 121 (57.4%) | 90 (42.6%) |
| College or Associate's Degree | 317 (100.0%) | 0 (0.0%) |
| Bachelor's Degree | 22 (100.0%) | 0 (0.0%) |
| Graduate Degree | 41 (100.0%) | 0 (0.0%) |
| Total | 544 (85.8%) | 90 (14.2%) |
Employment Characteristics in Hamblen County
Employment by Class of Employer in Hamblen County
Among the 26,689 employed individuals in Hamblen County, private company employees (20,111 | 75.3%), local government employees (2,010 | 7.5%), and self-employed (not incorporated) (1,827 | 6.9%) make up the most common classes of employment.
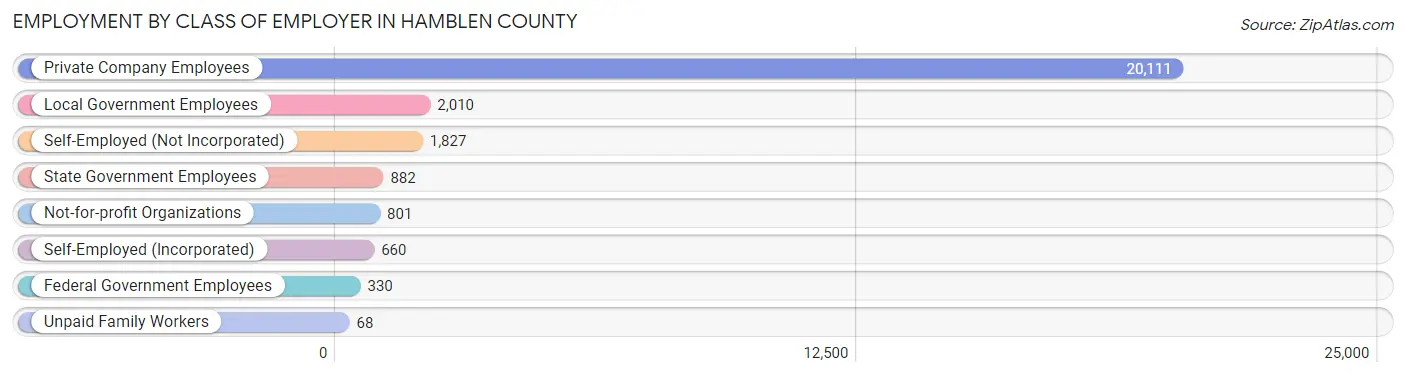
| Employer Class | # Employees | % Employees |
| Private Company Employees | 20,111 | 75.3% |
| Self-Employed (Incorporated) | 660 | 2.5% |
| Self-Employed (Not Incorporated) | 1,827 | 6.9% |
| Not-for-profit Organizations | 801 | 3.0% |
| Local Government Employees | 2,010 | 7.5% |
| State Government Employees | 882 | 3.3% |
| Federal Government Employees | 330 | 1.2% |
| Unpaid Family Workers | 68 | 0.3% |
| Total | 26,689 | 100.0% |
Employment Status by Age in Hamblen County
According to the labor force statistics for Hamblen County, out of the total population over 16 years of age (51,238), 56.6% or 29,001 individuals are in the labor force, with 6.6% or 1,914 of them unemployed. The age group with the highest labor force participation rate is 25 to 29 years, with 81.0% or 3,184 individuals in the labor force. Within the labor force, the 16 to 19 years age range has the highest percentage of unemployed individuals, with 19.5% or 305 of them being unemployed.
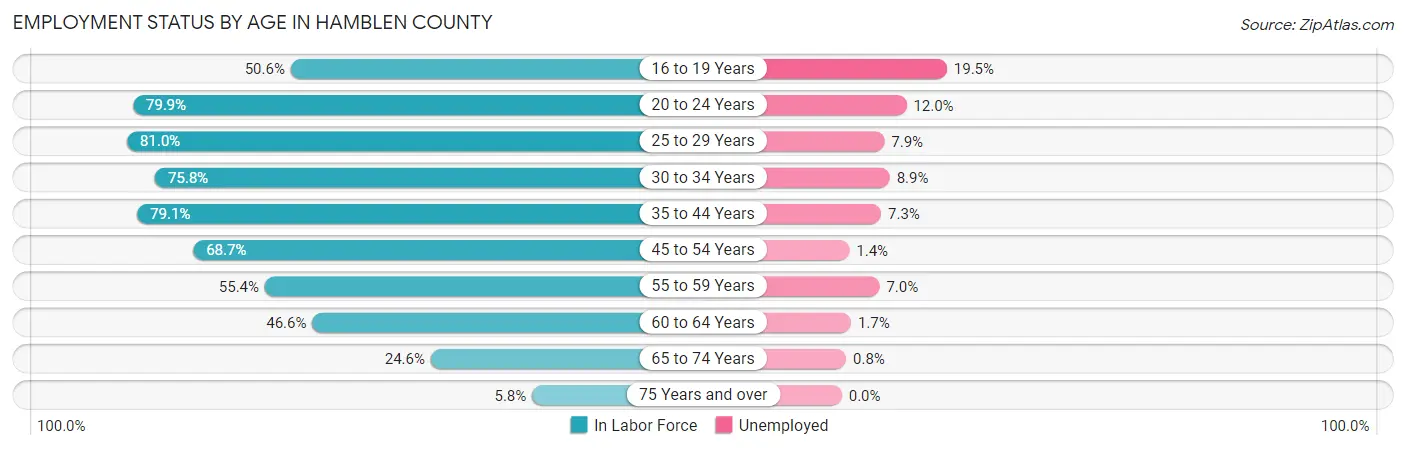
| Age Bracket | In Labor Force | Unemployed |
| 16 to 19 Years | 1,563 (50.6%) | 305 (19.5%) |
| 20 to 24 Years | 3,053 (79.9%) | 366 (12.0%) |
| 25 to 29 Years | 3,184 (81.0%) | 252 (7.9%) |
| 30 to 34 Years | 2,830 (75.8%) | 252 (8.9%) |
| 35 to 44 Years | 5,998 (79.1%) | 438 (7.3%) |
| 45 to 54 Years | 6,067 (68.7%) | 85 (1.4%) |
| 55 to 59 Years | 2,137 (55.4%) | 150 (7.0%) |
| 60 to 64 Years | 2,178 (46.6%) | 37 (1.7%) |
| 65 to 74 Years | 1,694 (24.6%) | 14 (0.8%) |
| 75 Years and over | 280 (5.8%) | 0 (0.0%) |
| Total | 29,001 (56.6%) | 1,914 (6.6%) |
Employment Status by Educational Attainment in Hamblen County
According to labor force statistics for Hamblen County, 68.7% of individuals (22,403) out of the total population between 25 and 64 years of age (32,610) are in the labor force, with 5.4% or 1,210 of them being unemployed. The group with the highest labor force participation rate are those with the educational attainment of bachelor's degree or higher, with 78.5% or 5,134 individuals in the labor force. Within the labor force, individuals with high school diploma education have the highest percentage of unemployment, with 10.1% or 886 of them being unemployed.
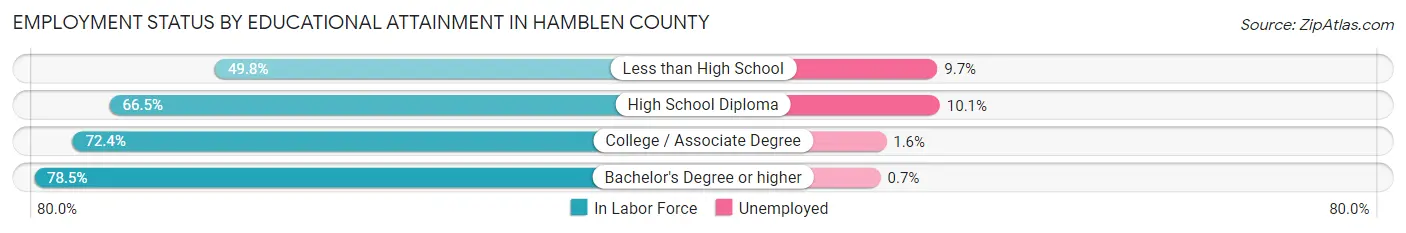
| Educational Attainment | In Labor Force | Unemployed |
| Less than High School | 1,845 (49.8%) | 359 (9.7%) |
| High School Diploma | 8,771 (66.5%) | 1,332 (10.1%) |
| College / Associate Degree | 6,643 (72.4%) | 147 (1.6%) |
| Bachelor's Degree or higher | 5,134 (78.5%) | 46 (0.7%) |
| Total | 22,403 (68.7%) | 1,761 (5.4%) |
Employment Occupations by Sex in Hamblen County
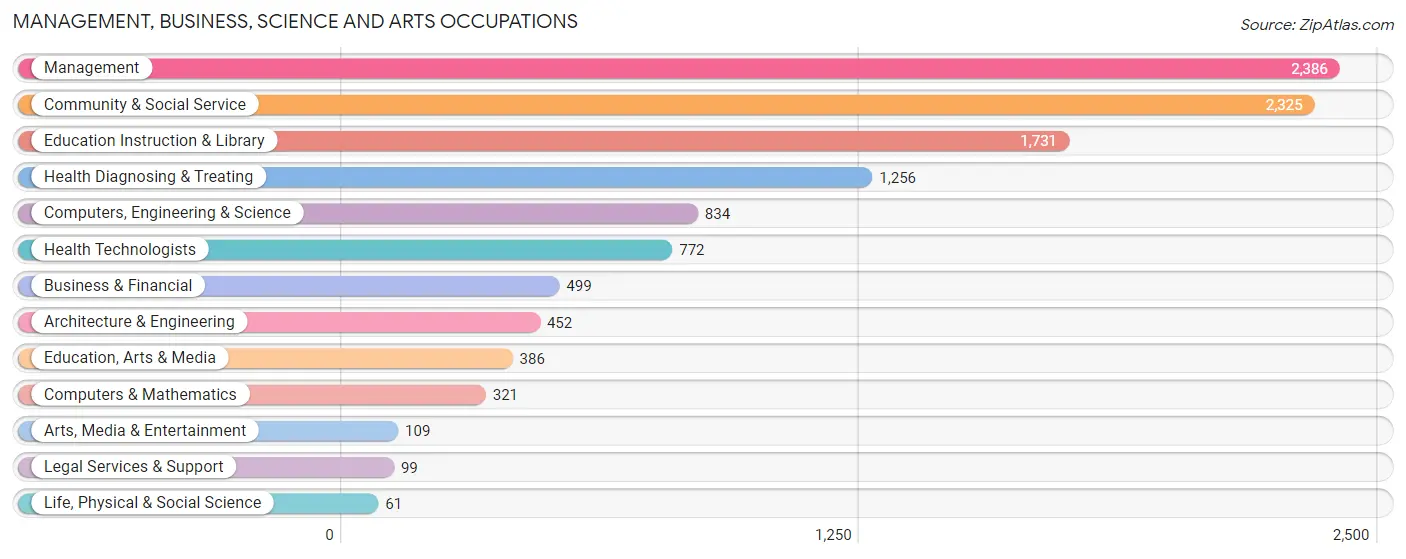
Management, Business, Science and Arts Occupations
The most common Management, Business, Science and Arts occupations in Hamblen County are Management (2,386 | 8.8%), Community & Social Service (2,325 | 8.6%), Education Instruction & Library (1,731 | 6.4%), Health Diagnosing & Treating (1,256 | 4.6%), and Computers, Engineering & Science (834 | 3.1%).
Management, Business, Science and Arts Occupations by Sex
Within the Management, Business, Science and Arts occupations in Hamblen County, the most male-oriented occupations are Architecture & Engineering (79.2%), Computers & Mathematics (79.1%), and Computers, Engineering & Science (78.1%), while the most female-oriented occupations are Education Instruction & Library (72.4%), Health Diagnosing & Treating (70.4%), and Community & Social Service (67.9%).
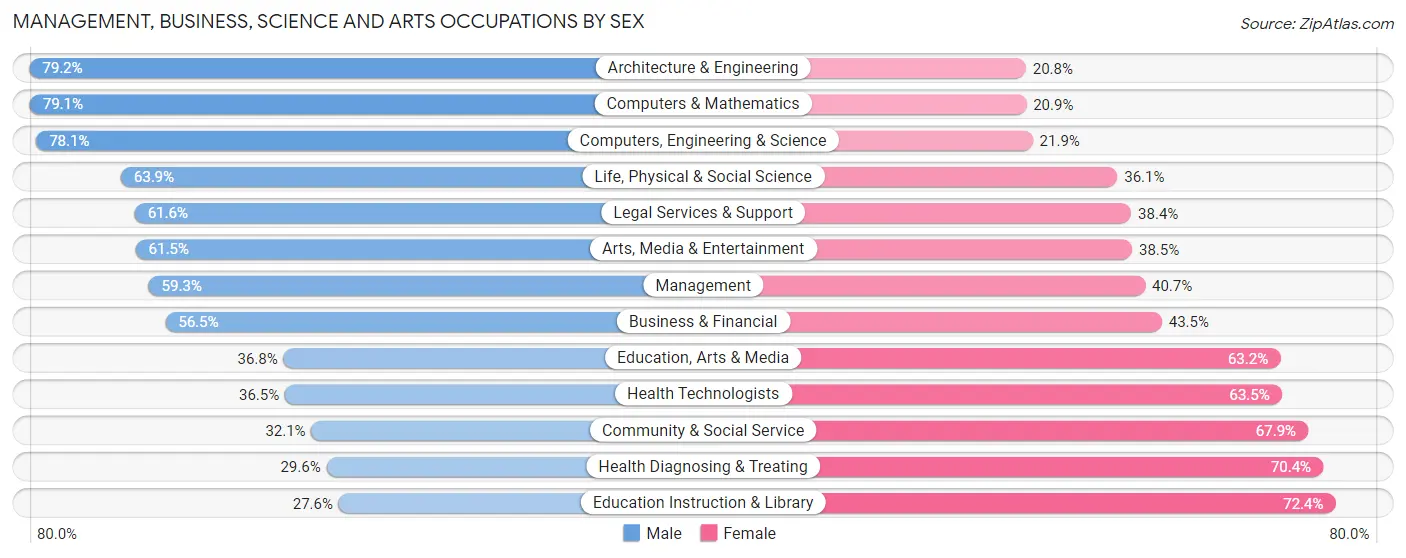
| Occupation | Male | Female |
| Management | 1,415 (59.3%) | 971 (40.7%) |
| Business & Financial | 282 (56.5%) | 217 (43.5%) |
| Computers, Engineering & Science | 651 (78.1%) | 183 (21.9%) |
| Computers & Mathematics | 254 (79.1%) | 67 (20.9%) |
| Architecture & Engineering | 358 (79.2%) | 94 (20.8%) |
| Life, Physical & Social Science | 39 (63.9%) | 22 (36.1%) |
| Community & Social Service | 747 (32.1%) | 1,578 (67.9%) |
| Education, Arts & Media | 142 (36.8%) | 244 (63.2%) |
| Legal Services & Support | 61 (61.6%) | 38 (38.4%) |
| Education Instruction & Library | 477 (27.6%) | 1,254 (72.4%) |
| Arts, Media & Entertainment | 67 (61.5%) | 42 (38.5%) |
| Health Diagnosing & Treating | 372 (29.6%) | 884 (70.4%) |
| Health Technologists | 282 (36.5%) | 490 (63.5%) |
| Total (Category) | 3,467 (47.5%) | 3,833 (52.5%) |
| Total (Overall) | 14,218 (52.6%) | 12,820 (47.4%) |
Services Occupations
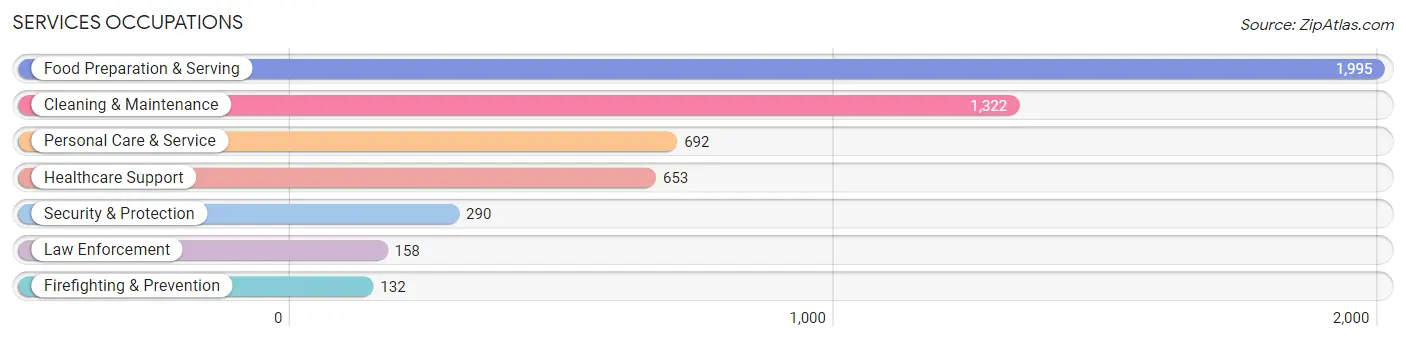
The most common Services occupations in Hamblen County are Food Preparation & Serving (1,995 | 7.4%), Cleaning & Maintenance (1,322 | 4.9%), Personal Care & Service (692 | 2.6%), Healthcare Support (653 | 2.4%), and Security & Protection (290 | 1.1%).
Services Occupations by Sex
Within the Services occupations in Hamblen County, the most male-oriented occupations are Firefighting & Prevention (81.1%), Security & Protection (79.7%), and Law Enforcement (78.5%), while the most female-oriented occupations are Personal Care & Service (91.0%), Healthcare Support (88.2%), and Food Preparation & Serving (52.3%).
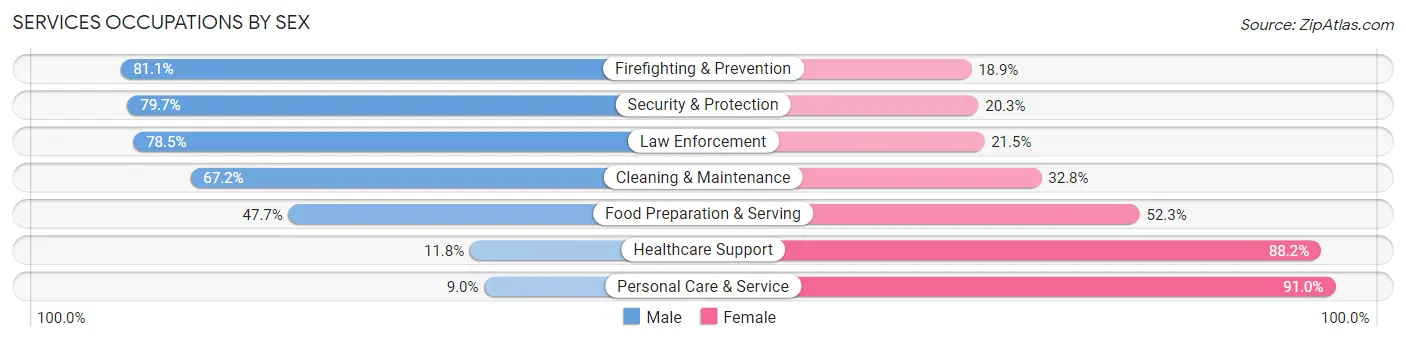
| Occupation | Male | Female |
| Healthcare Support | 77 (11.8%) | 576 (88.2%) |
| Security & Protection | 231 (79.7%) | 59 (20.3%) |
| Firefighting & Prevention | 107 (81.1%) | 25 (18.9%) |
| Law Enforcement | 124 (78.5%) | 34 (21.5%) |
| Food Preparation & Serving | 952 (47.7%) | 1,043 (52.3%) |
| Cleaning & Maintenance | 888 (67.2%) | 434 (32.8%) |
| Personal Care & Service | 62 (9.0%) | 630 (91.0%) |
| Total (Category) | 2,210 (44.6%) | 2,742 (55.4%) |
| Total (Overall) | 14,218 (52.6%) | 12,820 (47.4%) |
Sales and Office Occupations
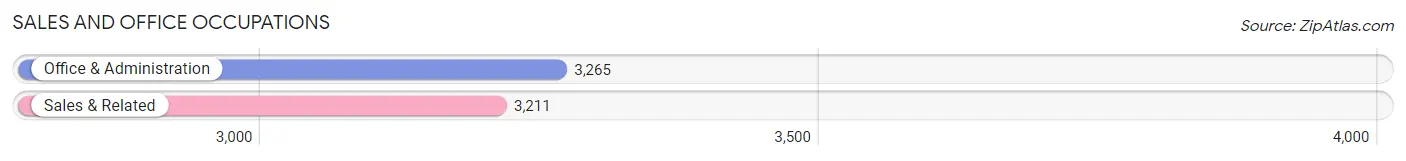
The most common Sales and Office occupations in Hamblen County are Office & Administration (3,265 | 12.1%), and Sales & Related (3,211 | 11.9%).
Sales and Office Occupations by Sex
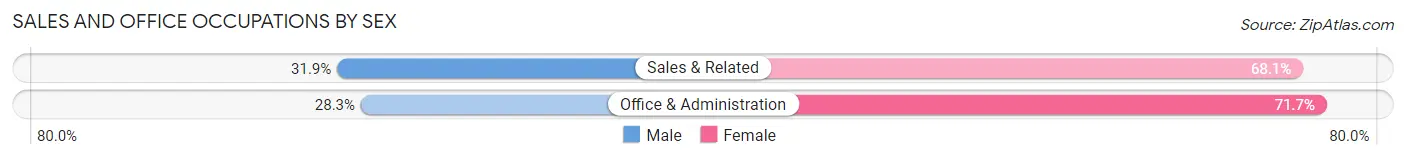
| Occupation | Male | Female |
| Sales & Related | 1,025 (31.9%) | 2,186 (68.1%) |
| Office & Administration | 923 (28.3%) | 2,342 (71.7%) |
| Total (Category) | 1,948 (30.1%) | 4,528 (69.9%) |
| Total (Overall) | 14,218 (52.6%) | 12,820 (47.4%) |
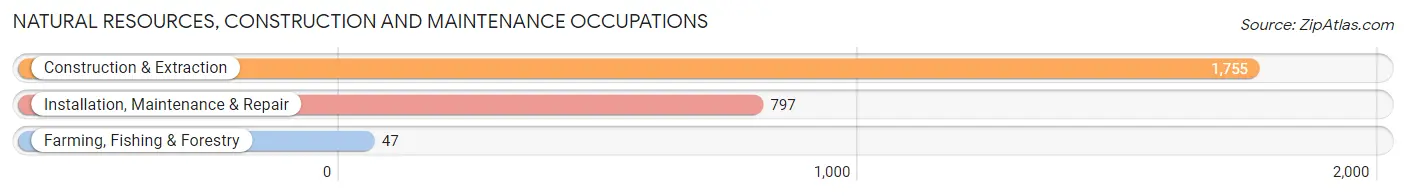
Natural Resources, Construction and Maintenance Occupations
The most common Natural Resources, Construction and Maintenance occupations in Hamblen County are Construction & Extraction (1,755 | 6.5%), Installation, Maintenance & Repair (797 | 2.9%), and Farming, Fishing & Forestry (47 | 0.2%).
Natural Resources, Construction and Maintenance Occupations by Sex
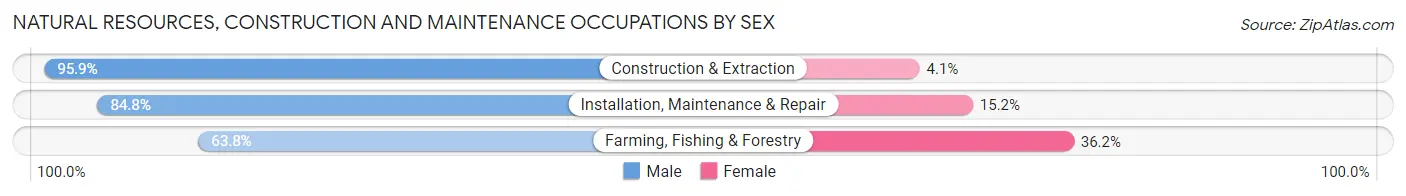
| Occupation | Male | Female |
| Farming, Fishing & Forestry | 30 (63.8%) | 17 (36.2%) |
| Construction & Extraction | 1,683 (95.9%) | 72 (4.1%) |
| Installation, Maintenance & Repair | 676 (84.8%) | 121 (15.2%) |
| Total (Category) | 2,389 (91.9%) | 210 (8.1%) |
| Total (Overall) | 14,218 (52.6%) | 12,820 (47.4%) |
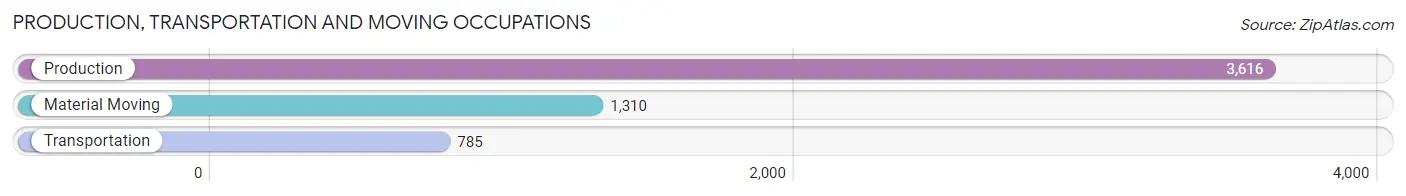
Production, Transportation and Moving Occupations
The most common Production, Transportation and Moving occupations in Hamblen County are Production (3,616 | 13.4%), Material Moving (1,310 | 4.9%), and Transportation (785 | 2.9%).
Production, Transportation and Moving Occupations by Sex
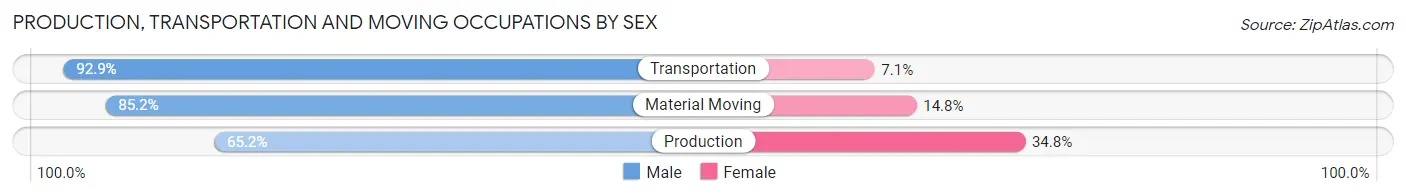
| Occupation | Male | Female |
| Production | 2,359 (65.2%) | 1,257 (34.8%) |
| Transportation | 729 (92.9%) | 56 (7.1%) |
| Material Moving | 1,116 (85.2%) | 194 (14.8%) |
| Total (Category) | 4,204 (73.6%) | 1,507 (26.4%) |
| Total (Overall) | 14,218 (52.6%) | 12,820 (47.4%) |
Employment Industries by Sex in Hamblen County
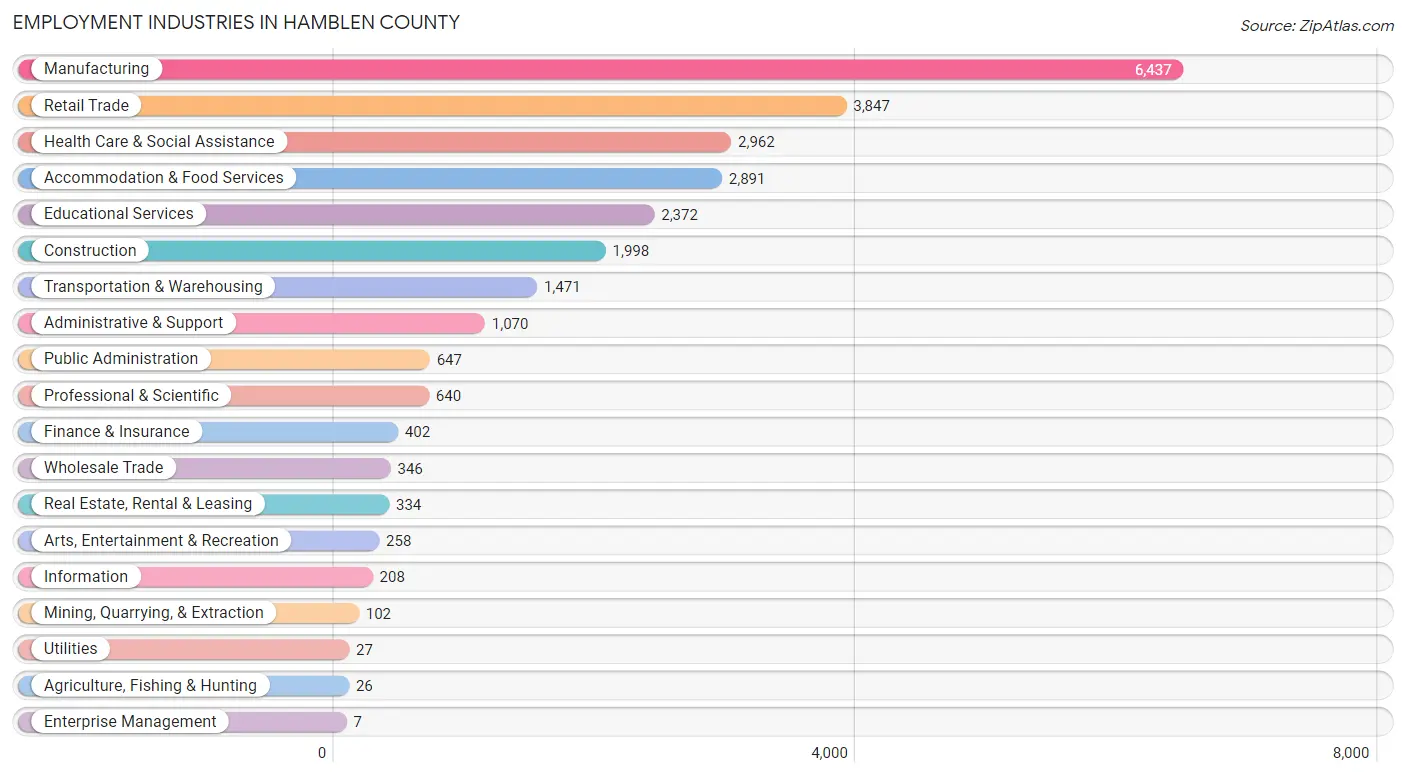
Employment Industries in Hamblen County
The major employment industries in Hamblen County include Manufacturing (6,437 | 23.8%), Retail Trade (3,847 | 14.2%), Health Care & Social Assistance (2,962 | 11.0%), Accommodation & Food Services (2,891 | 10.7%), and Educational Services (2,372 | 8.8%).
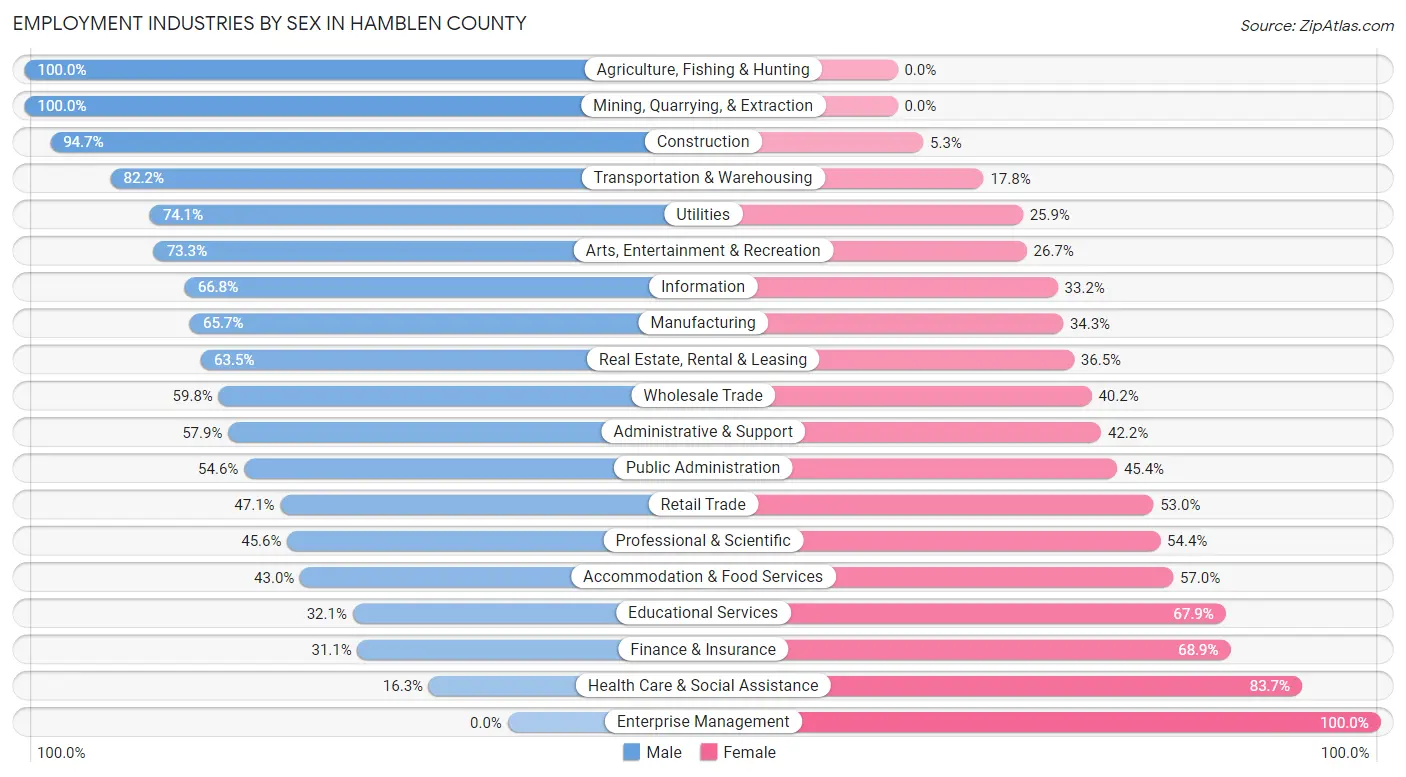
Employment Industries by Sex in Hamblen County
The Hamblen County industries that see more men than women are Agriculture, Fishing & Hunting (100.0%), Mining, Quarrying, & Extraction (100.0%), and Construction (94.7%), whereas the industries that tend to have a higher number of women are Enterprise Management (100.0%), Health Care & Social Assistance (83.7%), and Finance & Insurance (68.9%).
| Industry | Male | Female |
| Agriculture, Fishing & Hunting | 26 (100.0%) | 0 (0.0%) |
| Mining, Quarrying, & Extraction | 102 (100.0%) | 0 (0.0%) |
| Construction | 1,892 (94.7%) | 106 (5.3%) |
| Manufacturing | 4,232 (65.7%) | 2,205 (34.3%) |
| Wholesale Trade | 207 (59.8%) | 139 (40.2%) |
| Retail Trade | 1,810 (47.0%) | 2,037 (52.9%) |
| Transportation & Warehousing | 1,209 (82.2%) | 262 (17.8%) |
| Utilities | 20 (74.1%) | 7 (25.9%) |
| Information | 139 (66.8%) | 69 (33.2%) |
| Finance & Insurance | 125 (31.1%) | 277 (68.9%) |
| Real Estate, Rental & Leasing | 212 (63.5%) | 122 (36.5%) |
| Professional & Scientific | 292 (45.6%) | 348 (54.4%) |
| Enterprise Management | 0 (0.0%) | 7 (100.0%) |
| Administrative & Support | 619 (57.9%) | 451 (42.1%) |
| Educational Services | 761 (32.1%) | 1,611 (67.9%) |
| Health Care & Social Assistance | 483 (16.3%) | 2,479 (83.7%) |
| Arts, Entertainment & Recreation | 189 (73.3%) | 69 (26.7%) |
| Accommodation & Food Services | 1,242 (43.0%) | 1,649 (57.0%) |
| Public Administration | 353 (54.6%) | 294 (45.4%) |
| Total | 14,218 (52.6%) | 12,820 (47.4%) |
Education in Hamblen County
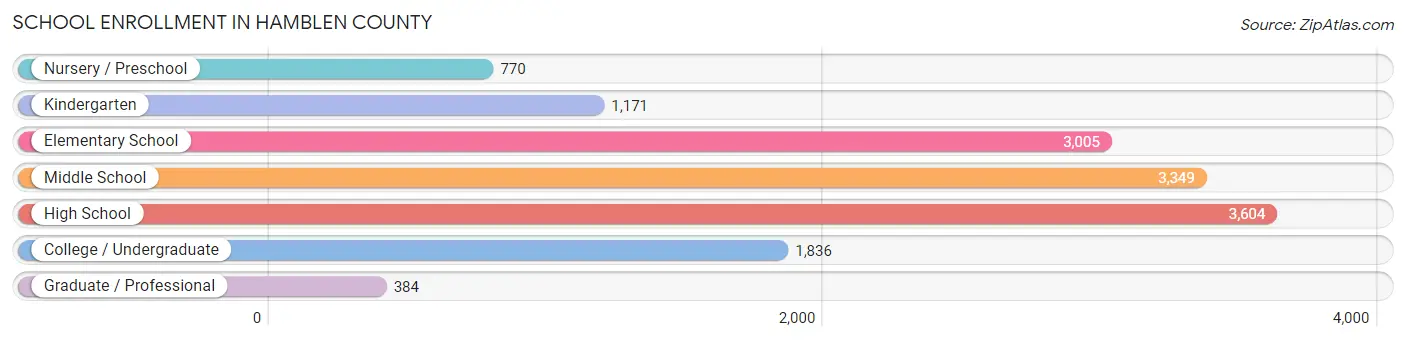
School Enrollment in Hamblen County
The most common levels of schooling among the 14,119 students in Hamblen County are high school (3,604 | 25.5%), middle school (3,349 | 23.7%), and elementary school (3,005 | 21.3%).
| School Level | # Students | % Students |
| Nursery / Preschool | 770 | 5.4% |
| Kindergarten | 1,171 | 8.3% |
| Elementary School | 3,005 | 21.3% |
| Middle School | 3,349 | 23.7% |
| High School | 3,604 | 25.5% |
| College / Undergraduate | 1,836 | 13.0% |
| Graduate / Professional | 384 | 2.7% |
| Total | 14,119 | 100.0% |
School Enrollment by Age by Funding Source in Hamblen County
Out of a total of 14,119 students who are enrolled in schools in Hamblen County, 1,412 (10.0%) attend a private institution, while the remaining 12,707 (90.0%) are enrolled in public schools. The age group of 35 years and over has the highest likelihood of being enrolled in private schools, with 146 (48.3% in the age bracket) enrolled. Conversely, the age group of 10 to 14 year olds has the lowest likelihood of being enrolled in a private school, with 3,799 (92.8% in the age bracket) attending a public institution.
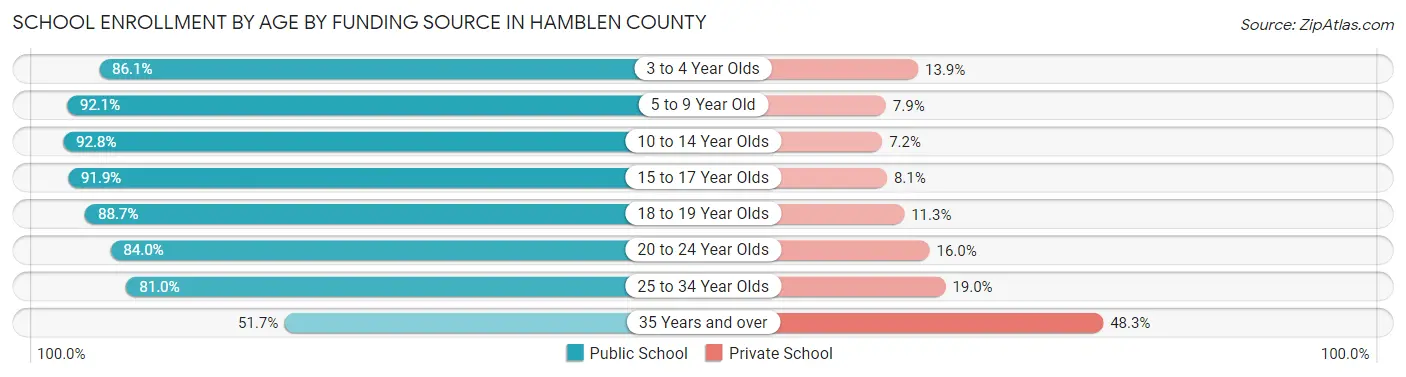
| Age Bracket | Public School | Private School |
| 3 to 4 Year Olds | 478 (86.1%) | 77 (13.9%) |
| 5 to 9 Year Old | 3,795 (92.1%) | 324 (7.9%) |
| 10 to 14 Year Olds | 3,799 (92.8%) | 294 (7.2%) |
| 15 to 17 Year Olds | 2,380 (91.9%) | 209 (8.1%) |
| 18 to 19 Year Olds | 960 (88.7%) | 122 (11.3%) |
| 20 to 24 Year Olds | 494 (84.0%) | 94 (16.0%) |
| 25 to 34 Year Olds | 641 (81.0%) | 150 (19.0%) |
| 35 Years and over | 156 (51.7%) | 146 (48.3%) |
| Total | 12,707 (90.0%) | 1,412 (10.0%) |
Educational Attainment by Field of Study in Hamblen County
Business (1,966 | 22.2%), education (1,574 | 17.8%), science & technology (1,176 | 13.3%), bio, nature & agricultural (619 | 7.0%), and engineering (597 | 6.7%) are the most common fields of study among 8,857 individuals in Hamblen County who have obtained a bachelor's degree or higher.
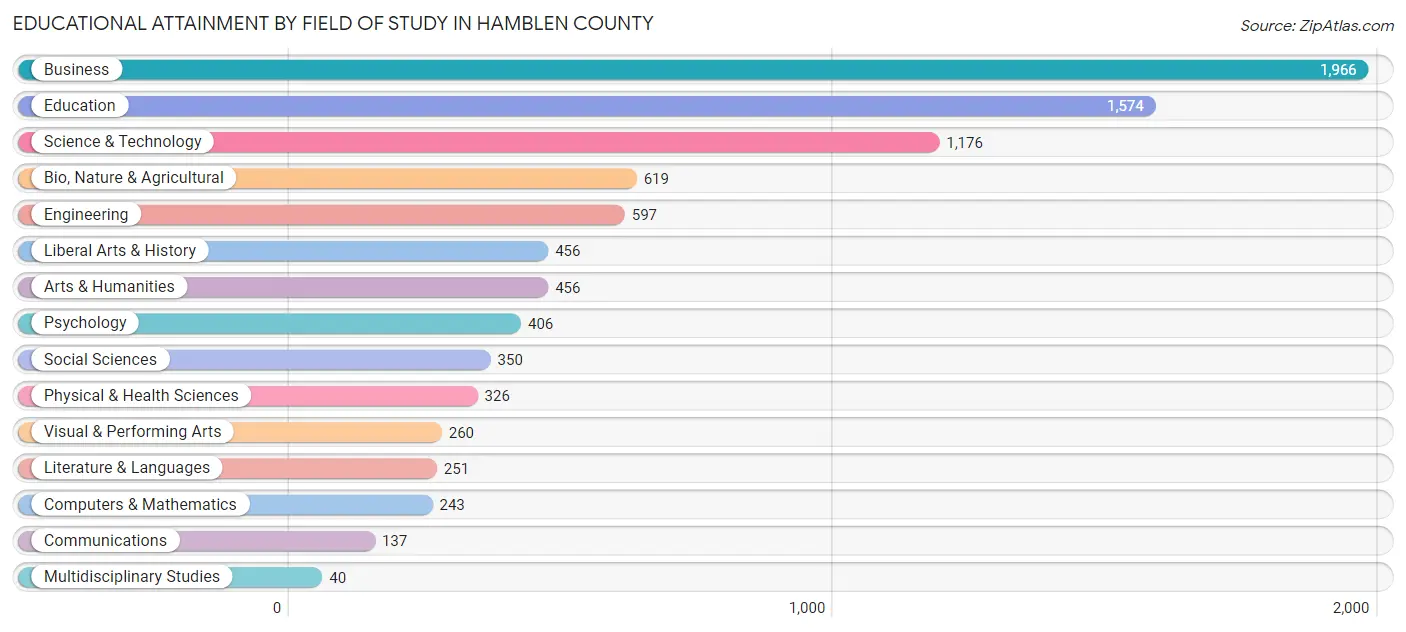
| Field of Study | # Graduates | % Graduates |
| Computers & Mathematics | 243 | 2.7% |
| Bio, Nature & Agricultural | 619 | 7.0% |
| Physical & Health Sciences | 326 | 3.7% |
| Psychology | 406 | 4.6% |
| Social Sciences | 350 | 4.0% |
| Engineering | 597 | 6.7% |
| Multidisciplinary Studies | 40 | 0.4% |
| Science & Technology | 1,176 | 13.3% |
| Business | 1,966 | 22.2% |
| Education | 1,574 | 17.8% |
| Literature & Languages | 251 | 2.8% |
| Liberal Arts & History | 456 | 5.1% |
| Visual & Performing Arts | 260 | 2.9% |
| Communications | 137 | 1.5% |
| Arts & Humanities | 456 | 5.1% |
| Total | 8,857 | 100.0% |
Transportation & Commute in Hamblen County
Vehicle Availability by Sex in Hamblen County
The most prevalent vehicle ownership categories in Hamblen County are males with 2 vehicles (5,382, accounting for 38.0%) and females with 2 vehicles (4,656, making up 43.0%).
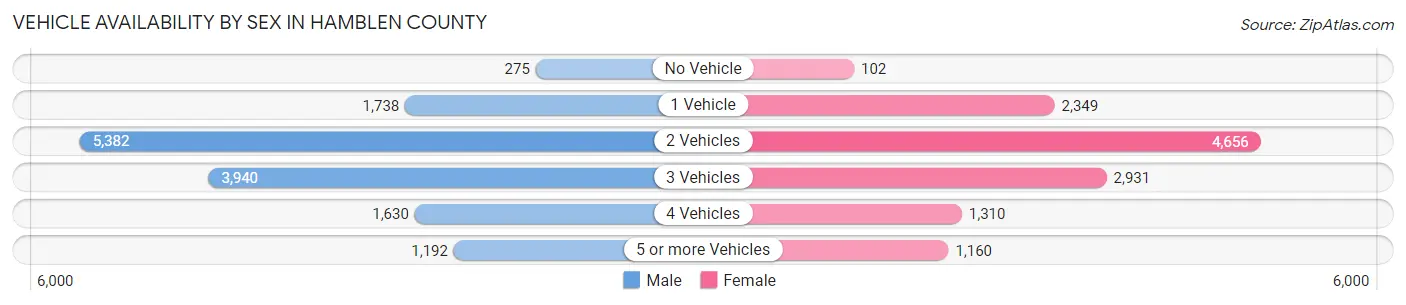
| Vehicles Available | Male | Female |
| No Vehicle | 275 (1.9%) | 102 (0.8%) |
| 1 Vehicle | 1,738 (12.3%) | 2,349 (18.8%) |
| 2 Vehicles | 5,382 (38.0%) | 4,656 (37.2%) |
| 3 Vehicles | 3,940 (27.8%) | 2,931 (23.4%) |
| 4 Vehicles | 1,630 (11.5%) | 1,310 (10.5%) |
| 5 or more Vehicles | 1,192 (8.4%) | 1,160 (9.3%) |
| Total | 14,157 (100.0%) | 12,508 (100.0%) |
Commute Time in Hamblen County
The most frequently occuring commute durations in Hamblen County are 10 to 14 minutes (5,064 commuters, 19.8%), 15 to 19 minutes (4,935 commuters, 19.3%), and 5 to 9 minutes (4,450 commuters, 17.4%).
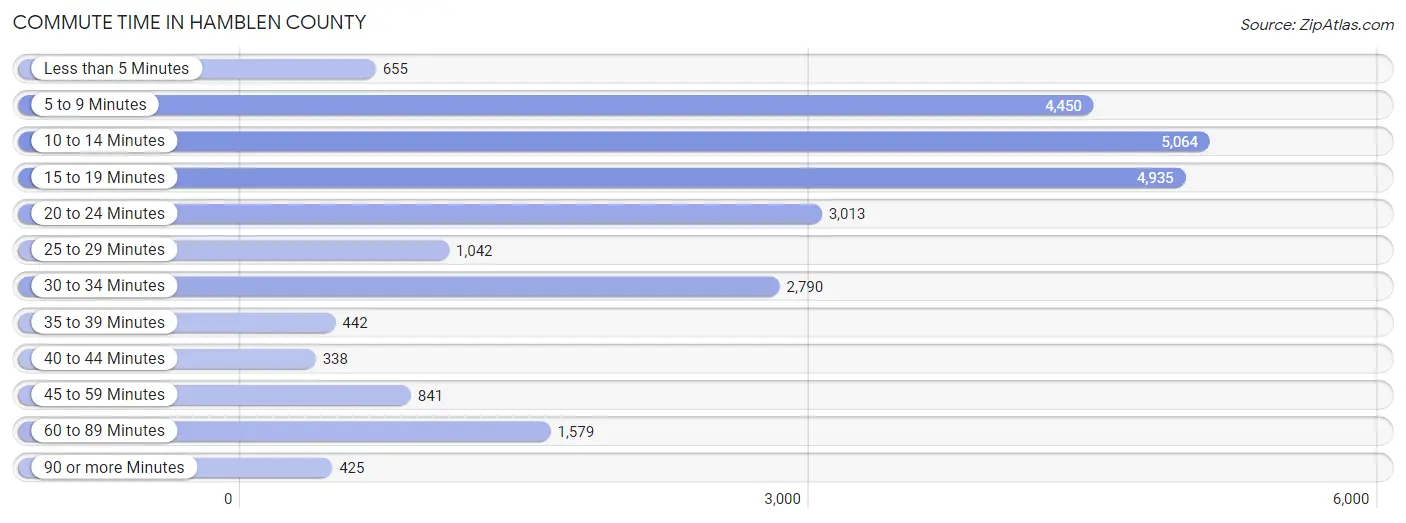
| Commute Time | # Commuters | % Commuters |
| Less than 5 Minutes | 655 | 2.6% |
| 5 to 9 Minutes | 4,450 | 17.4% |
| 10 to 14 Minutes | 5,064 | 19.8% |
| 15 to 19 Minutes | 4,935 | 19.3% |
| 20 to 24 Minutes | 3,013 | 11.8% |
| 25 to 29 Minutes | 1,042 | 4.1% |
| 30 to 34 Minutes | 2,790 | 10.9% |
| 35 to 39 Minutes | 442 | 1.7% |
| 40 to 44 Minutes | 338 | 1.3% |
| 45 to 59 Minutes | 841 | 3.3% |
| 60 to 89 Minutes | 1,579 | 6.2% |
| 90 or more Minutes | 425 | 1.7% |
Commute Time by Sex in Hamblen County
The most common commute times in Hamblen County are 5 to 9 minutes (2,682 commuters, 19.5%) for males and 15 to 19 minutes (2,625 commuters, 22.2%) for females.
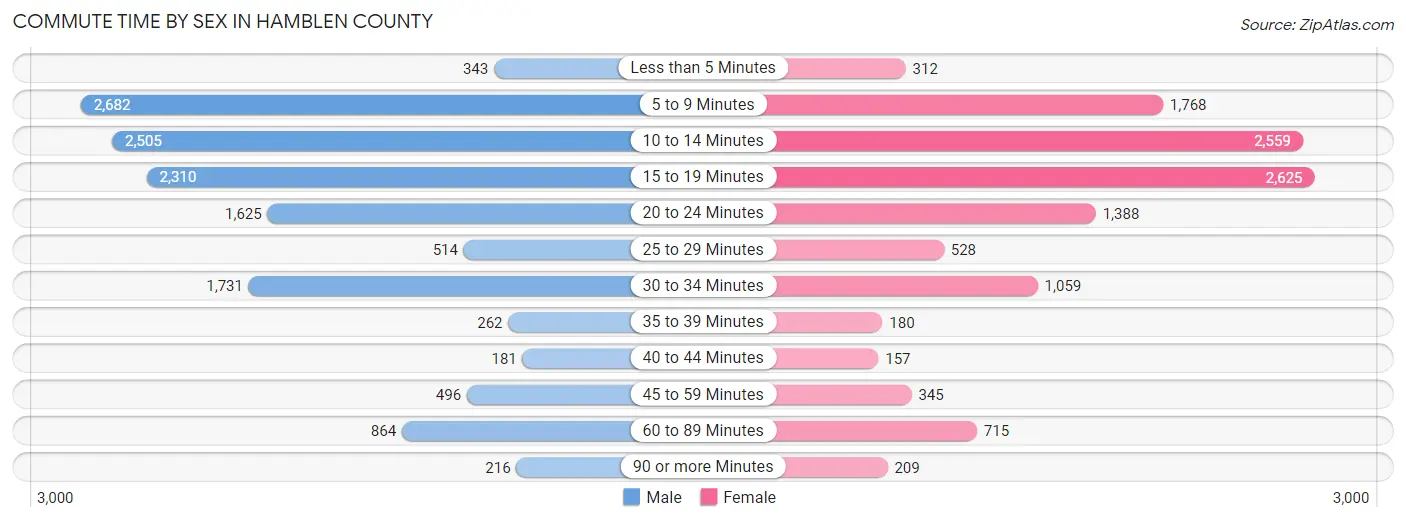
| Commute Time | Male | Female |
| Less than 5 Minutes | 343 (2.5%) | 312 (2.6%) |
| 5 to 9 Minutes | 2,682 (19.5%) | 1,768 (14.9%) |
| 10 to 14 Minutes | 2,505 (18.2%) | 2,559 (21.6%) |
| 15 to 19 Minutes | 2,310 (16.8%) | 2,625 (22.2%) |
| 20 to 24 Minutes | 1,625 (11.8%) | 1,388 (11.7%) |
| 25 to 29 Minutes | 514 (3.7%) | 528 (4.5%) |
| 30 to 34 Minutes | 1,731 (12.6%) | 1,059 (8.9%) |
| 35 to 39 Minutes | 262 (1.9%) | 180 (1.5%) |
| 40 to 44 Minutes | 181 (1.3%) | 157 (1.3%) |
| 45 to 59 Minutes | 496 (3.6%) | 345 (2.9%) |
| 60 to 89 Minutes | 864 (6.3%) | 715 (6.0%) |
| 90 or more Minutes | 216 (1.6%) | 209 (1.8%) |
Time of Departure to Work by Sex in Hamblen County
The most frequent times of departure to work in Hamblen County are 7:00 AM to 7:29 AM (1,877, 13.7%) for males and 7:00 AM to 7:29 AM (1,906, 16.1%) for females.
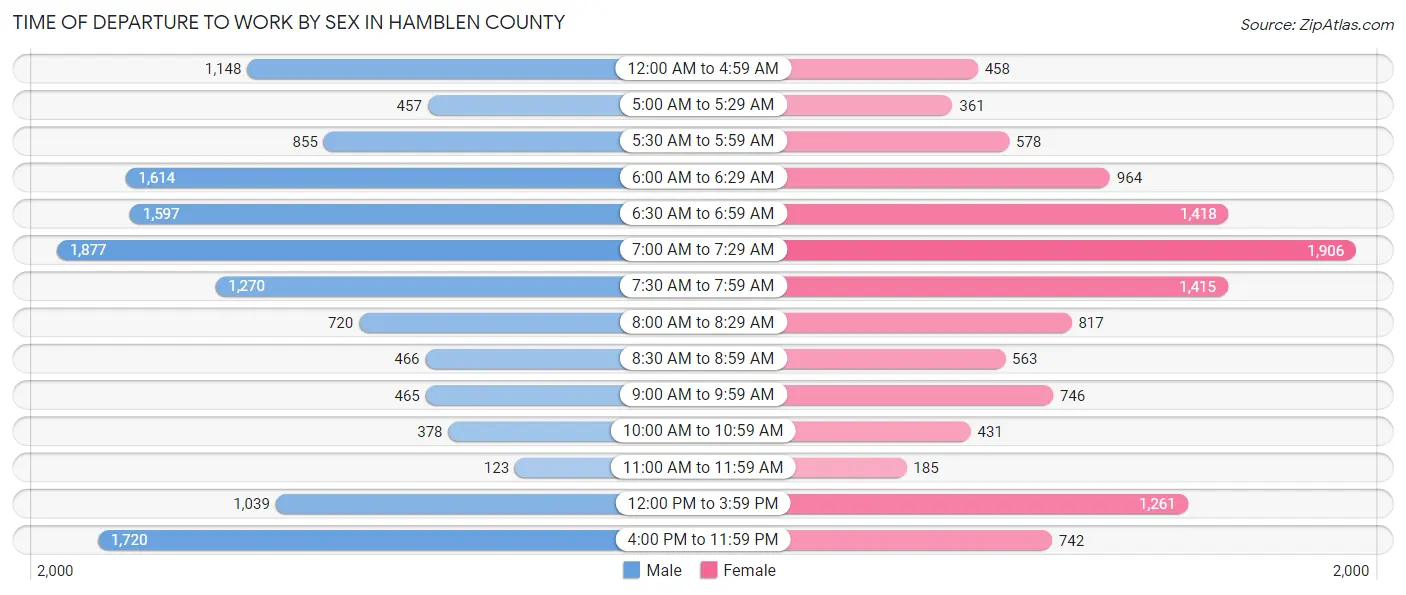
| Time of Departure | Male | Female |
| 12:00 AM to 4:59 AM | 1,148 (8.4%) | 458 (3.9%) |
| 5:00 AM to 5:29 AM | 457 (3.3%) | 361 (3.0%) |
| 5:30 AM to 5:59 AM | 855 (6.2%) | 578 (4.9%) |
| 6:00 AM to 6:29 AM | 1,614 (11.8%) | 964 (8.1%) |
| 6:30 AM to 6:59 AM | 1,597 (11.6%) | 1,418 (12.0%) |
| 7:00 AM to 7:29 AM | 1,877 (13.7%) | 1,906 (16.1%) |
| 7:30 AM to 7:59 AM | 1,270 (9.2%) | 1,415 (11.9%) |
| 8:00 AM to 8:29 AM | 720 (5.2%) | 817 (6.9%) |
| 8:30 AM to 8:59 AM | 466 (3.4%) | 563 (4.8%) |
| 9:00 AM to 9:59 AM | 465 (3.4%) | 746 (6.3%) |
| 10:00 AM to 10:59 AM | 378 (2.8%) | 431 (3.6%) |
| 11:00 AM to 11:59 AM | 123 (0.9%) | 185 (1.6%) |
| 12:00 PM to 3:59 PM | 1,039 (7.6%) | 1,261 (10.6%) |
| 4:00 PM to 11:59 PM | 1,720 (12.5%) | 742 (6.3%) |
| Total | 13,729 (100.0%) | 11,845 (100.0%) |
Housing Occupancy in Hamblen County
Occupancy by Ownership in Hamblen County
Of the total 25,209 dwellings in Hamblen County, owner-occupied units account for 16,946 (67.2%), while renter-occupied units make up 8,263 (32.8%).
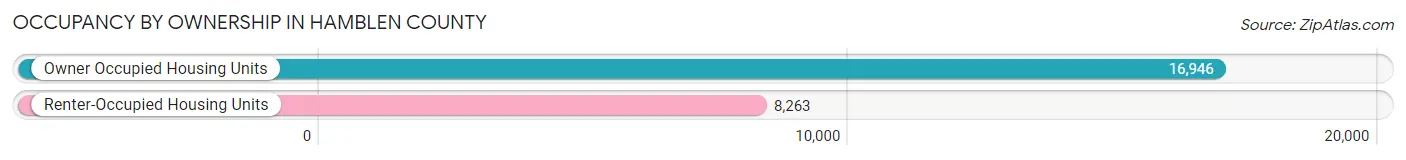
| Occupancy | # Housing Units | % Housing Units |
| Owner Occupied Housing Units | 16,946 | 67.2% |
| Renter-Occupied Housing Units | 8,263 | 32.8% |
| Total Occupied Housing Units | 25,209 | 100.0% |
Occupancy by Household Size in Hamblen County
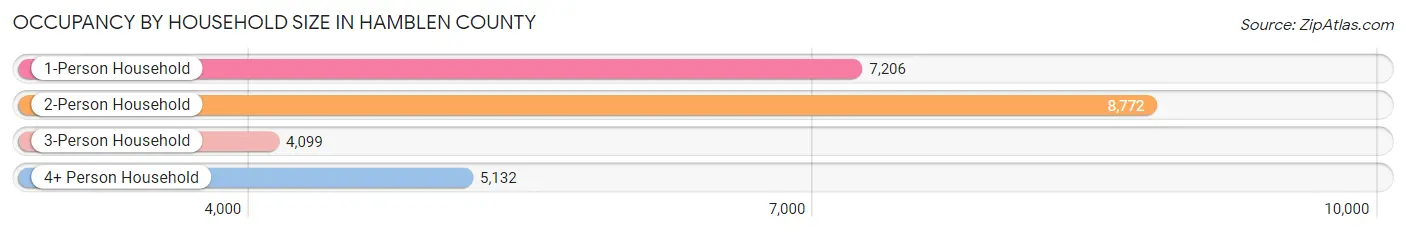
| Household Size | # Housing Units | % Housing Units |
| 1-Person Household | 7,206 | 28.6% |
| 2-Person Household | 8,772 | 34.8% |
| 3-Person Household | 4,099 | 16.3% |
| 4+ Person Household | 5,132 | 20.4% |
| Total Housing Units | 25,209 | 100.0% |
Occupancy by Ownership by Household Size in Hamblen County
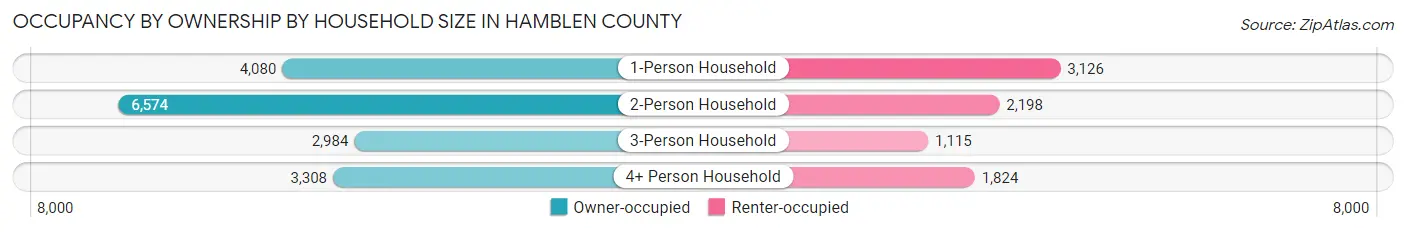
| Household Size | Owner-occupied | Renter-occupied |
| 1-Person Household | 4,080 (56.6%) | 3,126 (43.4%) |
| 2-Person Household | 6,574 (74.9%) | 2,198 (25.1%) |
| 3-Person Household | 2,984 (72.8%) | 1,115 (27.2%) |
| 4+ Person Household | 3,308 (64.5%) | 1,824 (35.5%) |
| Total Housing Units | 16,946 (67.2%) | 8,263 (32.8%) |
Occupancy by Educational Attainment in Hamblen County
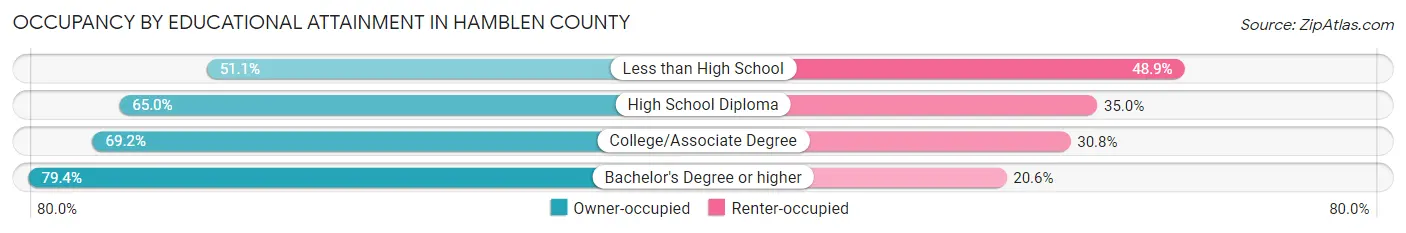
| Household Size | Owner-occupied | Renter-occupied |
| Less than High School | 1,664 (51.1%) | 1,592 (48.9%) |
| High School Diploma | 6,165 (65.0%) | 3,326 (35.0%) |
| College/Associate Degree | 5,268 (69.2%) | 2,344 (30.8%) |
| Bachelor's Degree or higher | 3,849 (79.4%) | 1,001 (20.6%) |
Occupancy by Age of Householder in Hamblen County
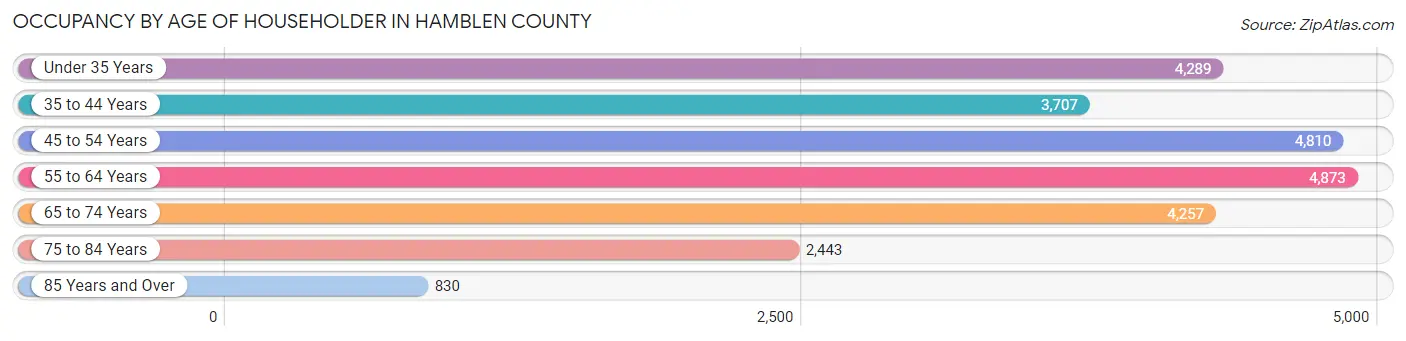
| Age Bracket | # Households | % Households |
| Under 35 Years | 4,289 | 17.0% |
| 35 to 44 Years | 3,707 | 14.7% |
| 45 to 54 Years | 4,810 | 19.1% |
| 55 to 64 Years | 4,873 | 19.3% |
| 65 to 74 Years | 4,257 | 16.9% |
| 75 to 84 Years | 2,443 | 9.7% |
| 85 Years and Over | 830 | 3.3% |
| Total | 25,209 | 100.0% |
Housing Finances in Hamblen County
Median Income by Occupancy in Hamblen County
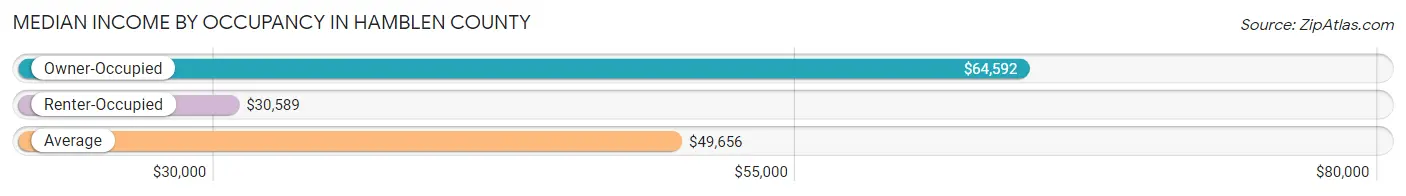
| Occupancy Type | # Households | Median Income |
| Owner-Occupied | 16,946 (67.2%) | $64,592 |
| Renter-Occupied | 8,263 (32.8%) | $30,589 |
| Average | 25,209 (100.0%) | $49,656 |
Occupancy by Householder Income Bracket in Hamblen County
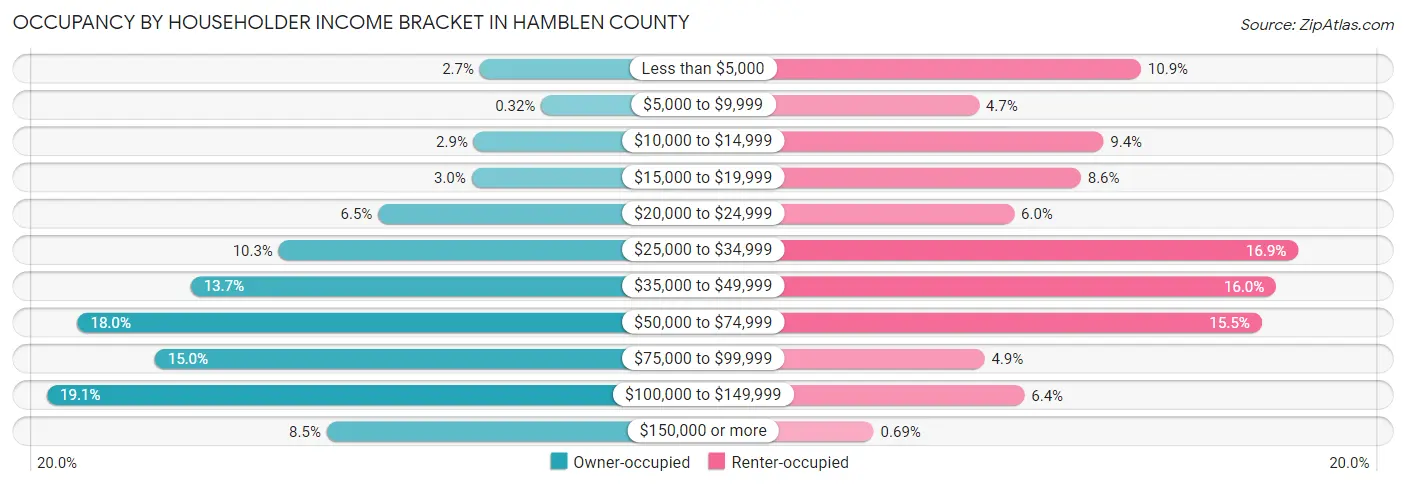
| Income Bracket | Owner-occupied | Renter-occupied |
| Less than $5,000 | 450 (2.7%) | 898 (10.9%) |
| $5,000 to $9,999 | 55 (0.3%) | 388 (4.7%) |
| $10,000 to $14,999 | 489 (2.9%) | 780 (9.4%) |
| $15,000 to $19,999 | 503 (3.0%) | 709 (8.6%) |
| $20,000 to $24,999 | 1,106 (6.5%) | 499 (6.0%) |
| $25,000 to $34,999 | 1,749 (10.3%) | 1,393 (16.9%) |
| $35,000 to $49,999 | 2,316 (13.7%) | 1,324 (16.0%) |
| $50,000 to $74,999 | 3,047 (18.0%) | 1,278 (15.5%) |
| $75,000 to $99,999 | 2,548 (15.0%) | 406 (4.9%) |
| $100,000 to $149,999 | 3,244 (19.1%) | 531 (6.4%) |
| $150,000 or more | 1,439 (8.5%) | 57 (0.7%) |
| Total | 16,946 (100.0%) | 8,263 (100.0%) |
Monthly Housing Cost Tiers in Hamblen County
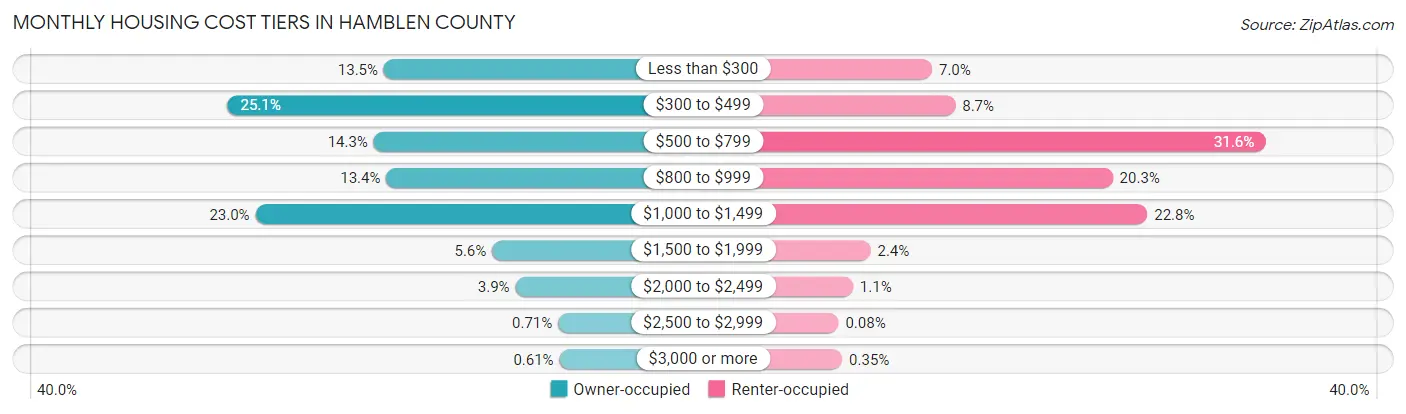
| Monthly Cost | Owner-occupied | Renter-occupied |
| Less than $300 | 2,295 (13.5%) | 576 (7.0%) |
| $300 to $499 | 4,245 (25.1%) | 717 (8.7%) |
| $500 to $799 | 2,422 (14.3%) | 2,609 (31.6%) |
| $800 to $999 | 2,264 (13.4%) | 1,675 (20.3%) |
| $1,000 to $1,499 | 3,898 (23.0%) | 1,886 (22.8%) |
| $1,500 to $1,999 | 944 (5.6%) | 202 (2.4%) |
| $2,000 to $2,499 | 653 (3.8%) | 94 (1.1%) |
| $2,500 to $2,999 | 121 (0.7%) | 7 (0.1%) |
| $3,000 or more | 104 (0.6%) | 29 (0.4%) |
| Total | 16,946 (100.0%) | 8,263 (100.0%) |
Physical Housing Characteristics in Hamblen County
Housing Structures in Hamblen County
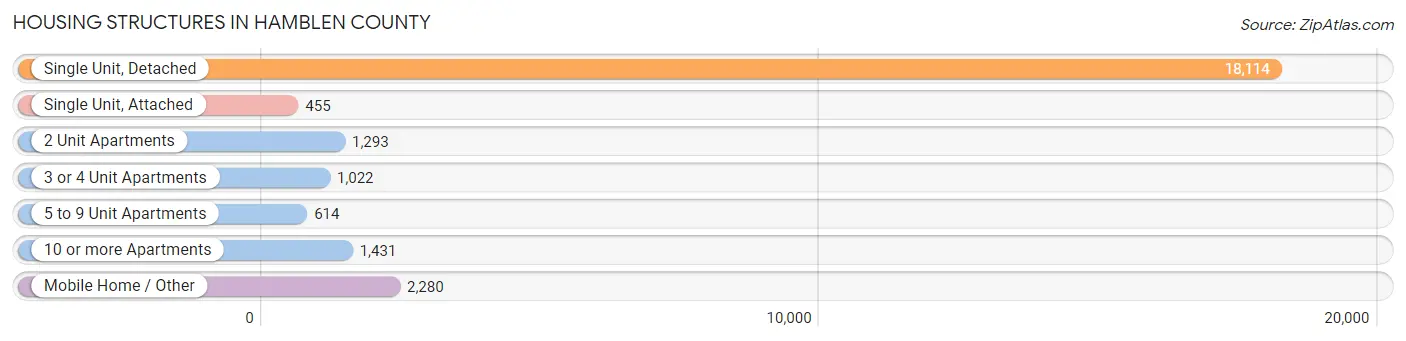
| Structure Type | # Housing Units | % Housing Units |
| Single Unit, Detached | 18,114 | 71.9% |
| Single Unit, Attached | 455 | 1.8% |
| 2 Unit Apartments | 1,293 | 5.1% |
| 3 or 4 Unit Apartments | 1,022 | 4.1% |
| 5 to 9 Unit Apartments | 614 | 2.4% |
| 10 or more Apartments | 1,431 | 5.7% |
| Mobile Home / Other | 2,280 | 9.0% |
| Total | 25,209 | 100.0% |
Housing Structures by Occupancy in Hamblen County
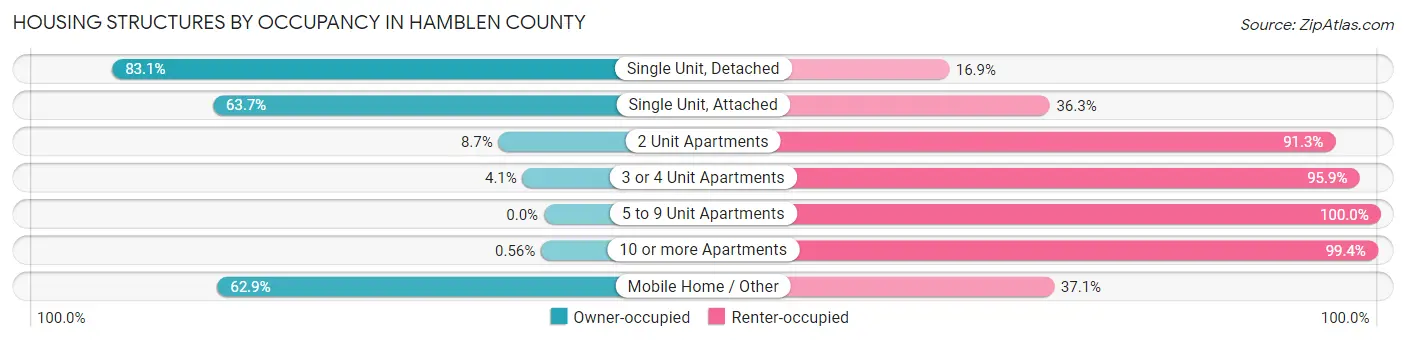
| Structure Type | Owner-occupied | Renter-occupied |
| Single Unit, Detached | 15,059 (83.1%) | 3,055 (16.9%) |
| Single Unit, Attached | 290 (63.7%) | 165 (36.3%) |
| 2 Unit Apartments | 113 (8.7%) | 1,180 (91.3%) |
| 3 or 4 Unit Apartments | 42 (4.1%) | 980 (95.9%) |
| 5 to 9 Unit Apartments | 0 (0.0%) | 614 (100.0%) |
| 10 or more Apartments | 8 (0.6%) | 1,423 (99.4%) |
| Mobile Home / Other | 1,434 (62.9%) | 846 (37.1%) |
| Total | 16,946 (67.2%) | 8,263 (32.8%) |
Housing Structures by Number of Rooms in Hamblen County
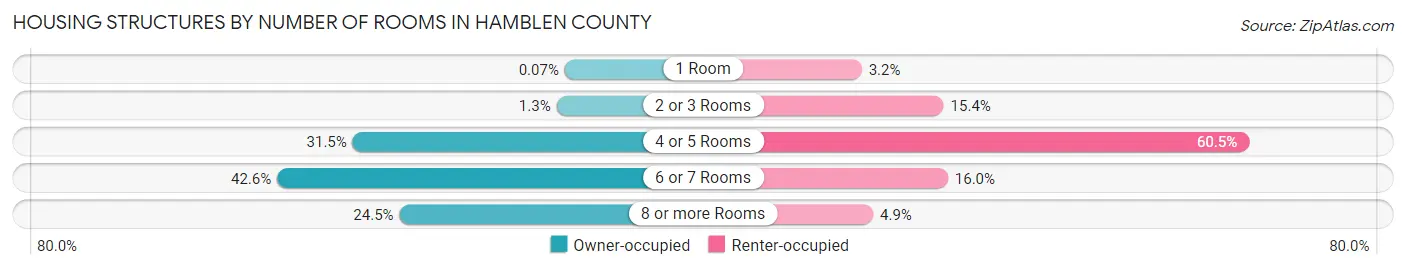
| Number of Rooms | Owner-occupied | Renter-occupied |
| 1 Room | 12 (0.1%) | 267 (3.2%) |
| 2 or 3 Rooms | 218 (1.3%) | 1,268 (15.3%) |
| 4 or 5 Rooms | 5,332 (31.5%) | 5,002 (60.5%) |
| 6 or 7 Rooms | 7,225 (42.6%) | 1,320 (16.0%) |
| 8 or more Rooms | 4,159 (24.5%) | 406 (4.9%) |
| Total | 16,946 (100.0%) | 8,263 (100.0%) |
Housing Structure by Heating Type in Hamblen County
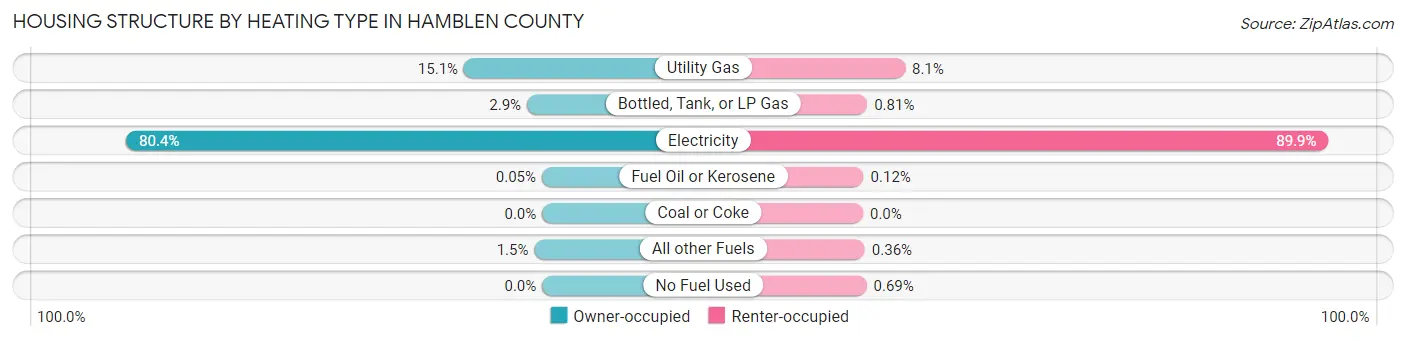
| Heating Type | Owner-occupied | Renter-occupied |
| Utility Gas | 2,561 (15.1%) | 670 (8.1%) |
| Bottled, Tank, or LP Gas | 499 (2.9%) | 67 (0.8%) |
| Electricity | 13,622 (80.4%) | 7,429 (89.9%) |
| Fuel Oil or Kerosene | 9 (0.1%) | 10 (0.1%) |
| Coal or Coke | 0 (0.0%) | 0 (0.0%) |
| All other Fuels | 255 (1.5%) | 30 (0.4%) |
| No Fuel Used | 0 (0.0%) | 57 (0.7%) |
| Total | 16,946 (100.0%) | 8,263 (100.0%) |
Household Vehicle Usage in Hamblen County
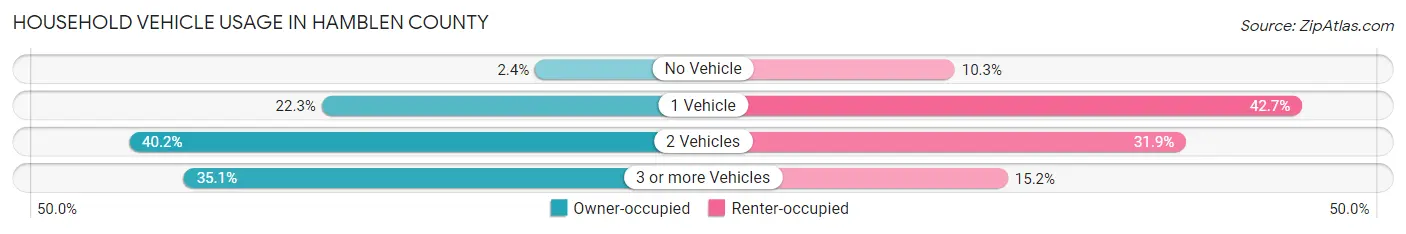
| Vehicles per Household | Owner-occupied | Renter-occupied |
| No Vehicle | 398 (2.4%) | 848 (10.3%) |
| 1 Vehicle | 3,774 (22.3%) | 3,526 (42.7%) |
| 2 Vehicles | 6,819 (40.2%) | 2,632 (31.9%) |
| 3 or more Vehicles | 5,955 (35.1%) | 1,257 (15.2%) |
| Total | 16,946 (100.0%) | 8,263 (100.0%) |
Real Estate & Mortgages in Hamblen County
Real Estate and Mortgage Overview in Hamblen County
| Characteristic | Without Mortgage | With Mortgage |
| Housing Units | 8,128 | 8,818 |
| Median Property Value | $153,900 | $173,800 |
| Median Household Income | $48,594 | $864 |
| Monthly Housing Costs | $375 | $91 |
| Real Estate Taxes | $765 | $275 |
Property Value by Mortgage Status in Hamblen County
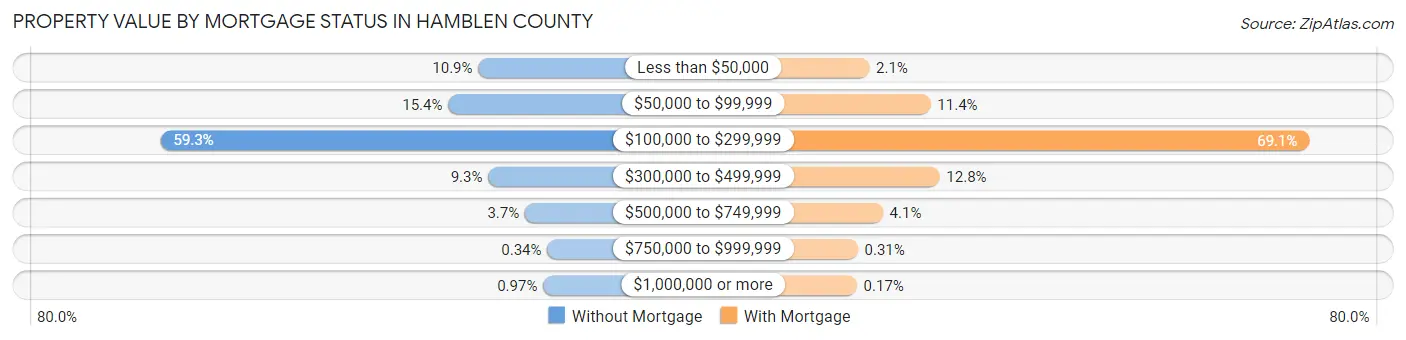
| Property Value | Without Mortgage | With Mortgage |
| Less than $50,000 | 883 (10.9%) | 182 (2.1%) |
| $50,000 to $99,999 | 1,255 (15.4%) | 1,006 (11.4%) |
| $100,000 to $299,999 | 4,820 (59.3%) | 6,097 (69.1%) |
| $300,000 to $499,999 | 759 (9.3%) | 1,127 (12.8%) |
| $500,000 to $749,999 | 304 (3.7%) | 364 (4.1%) |
| $750,000 to $999,999 | 28 (0.3%) | 27 (0.3%) |
| $1,000,000 or more | 79 (1.0%) | 15 (0.2%) |
| Total | 8,128 (100.0%) | 8,818 (100.0%) |
Household Income by Mortgage Status in Hamblen County
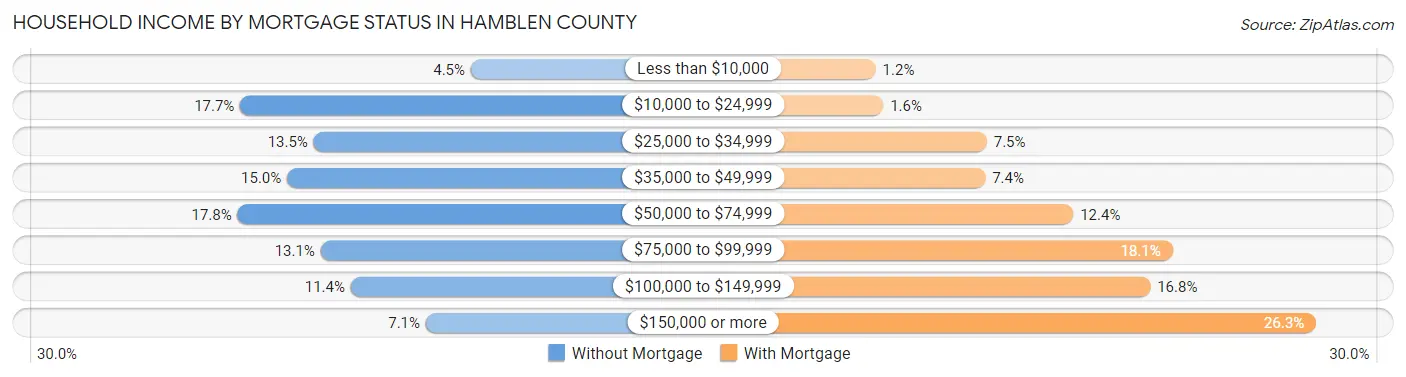
| Household Income | Without Mortgage | With Mortgage |
| Less than $10,000 | 366 (4.5%) | 101 (1.1%) |
| $10,000 to $24,999 | 1,437 (17.7%) | 139 (1.6%) |
| $25,000 to $34,999 | 1,096 (13.5%) | 661 (7.5%) |
| $35,000 to $49,999 | 1,219 (15.0%) | 653 (7.4%) |
| $50,000 to $74,999 | 1,449 (17.8%) | 1,097 (12.4%) |
| $75,000 to $99,999 | 1,063 (13.1%) | 1,598 (18.1%) |
| $100,000 to $149,999 | 923 (11.4%) | 1,485 (16.8%) |
| $150,000 or more | 575 (7.1%) | 2,321 (26.3%) |
| Total | 8,128 (100.0%) | 8,818 (100.0%) |
Property Value to Household Income Ratio in Hamblen County
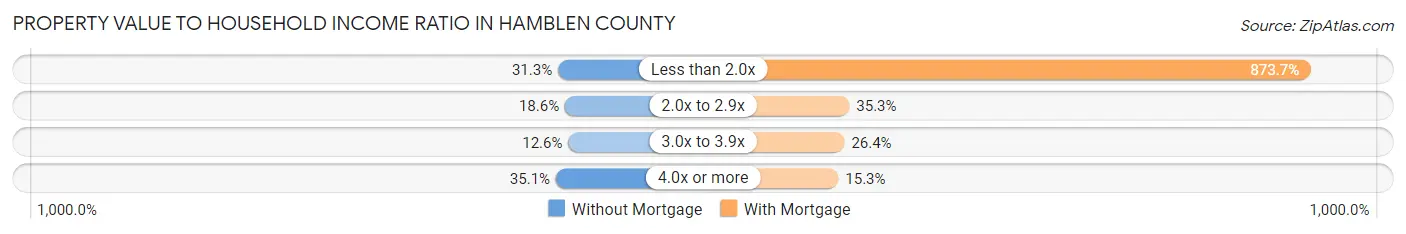
| Value-to-Income Ratio | Without Mortgage | With Mortgage |
| Less than 2.0x | 2,547 (31.3%) | 77,045 (873.7%) |
| 2.0x to 2.9x | 1,513 (18.6%) | 3,115 (35.3%) |
| 3.0x to 3.9x | 1,024 (12.6%) | 2,330 (26.4%) |
| 4.0x or more | 2,853 (35.1%) | 1,353 (15.3%) |
| Total | 8,128 (100.0%) | 8,818 (100.0%) |
Real Estate Taxes by Mortgage Status in Hamblen County
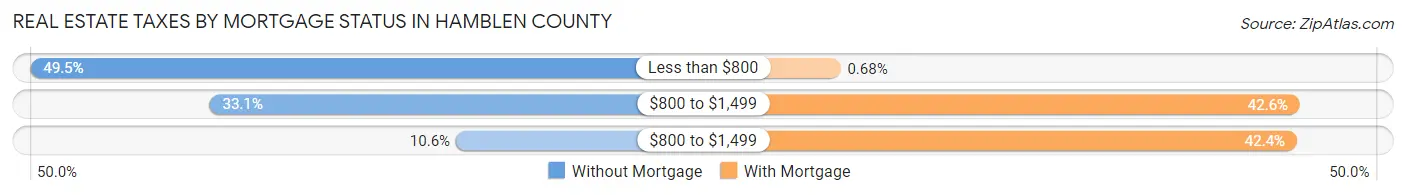
| Property Taxes | Without Mortgage | With Mortgage |
| Less than $800 | 4,021 (49.5%) | 60 (0.7%) |
| $800 to $1,499 | 2,691 (33.1%) | 3,759 (42.6%) |
| $800 to $1,499 | 862 (10.6%) | 3,735 (42.4%) |
| Total | 8,128 (100.0%) | 8,818 (100.0%) |
Health & Disability in Hamblen County
Health Insurance Coverage by Age in Hamblen County
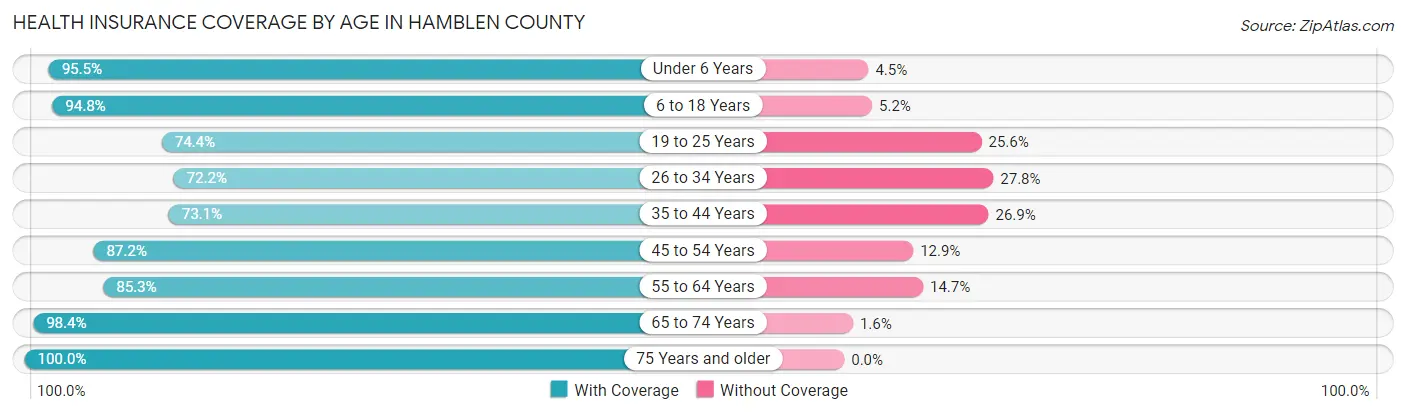
| Age Bracket | With Coverage | Without Coverage |
| Under 6 Years | 4,528 (95.5%) | 214 (4.5%) |
| 6 to 18 Years | 10,327 (94.8%) | 565 (5.2%) |
| 19 to 25 Years | 3,914 (74.4%) | 1,346 (25.6%) |
| 26 to 34 Years | 4,880 (72.2%) | 1,879 (27.8%) |
| 35 to 44 Years | 5,460 (73.1%) | 2,009 (26.9%) |
| 45 to 54 Years | 7,618 (87.2%) | 1,123 (12.9%) |
| 55 to 64 Years | 7,223 (85.3%) | 1,243 (14.7%) |
| 65 to 74 Years | 6,720 (98.4%) | 111 (1.6%) |
| 75 Years and older | 4,638 (100.0%) | 0 (0.0%) |
| Total | 55,308 (86.7%) | 8,490 (13.3%) |
Health Insurance Coverage by Citizenship Status in Hamblen County
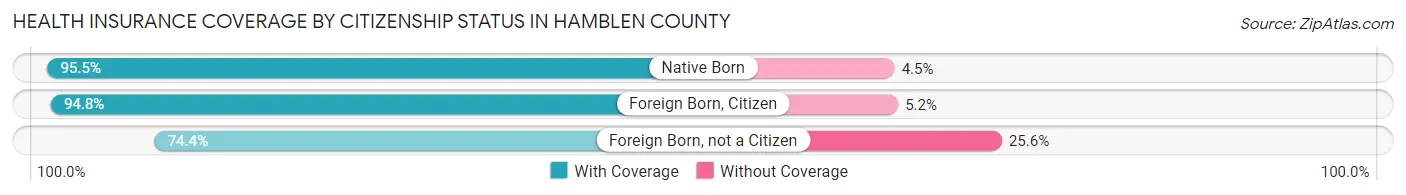
| Citizenship Status | With Coverage | Without Coverage |
| Native Born | 4,528 (95.5%) | 214 (4.5%) |
| Foreign Born, Citizen | 10,327 (94.8%) | 565 (5.2%) |
| Foreign Born, not a Citizen | 3,914 (74.4%) | 1,346 (25.6%) |
Health Insurance Coverage by Household Income in Hamblen County
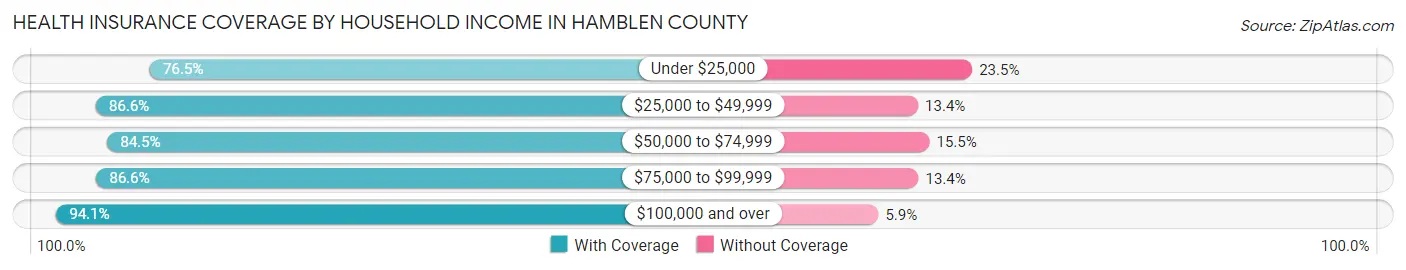
| Household Income | With Coverage | Without Coverage |
| Under $25,000 | 7,794 (76.5%) | 2,394 (23.5%) |
| $25,000 to $49,999 | 13,571 (86.6%) | 2,094 (13.4%) |
| $50,000 to $74,999 | 9,515 (84.5%) | 1,746 (15.5%) |
| $75,000 to $99,999 | 7,692 (86.6%) | 1,194 (13.4%) |
| $100,000 and over | 16,617 (94.1%) | 1,050 (5.9%) |
Public vs Private Health Insurance Coverage by Age in Hamblen County
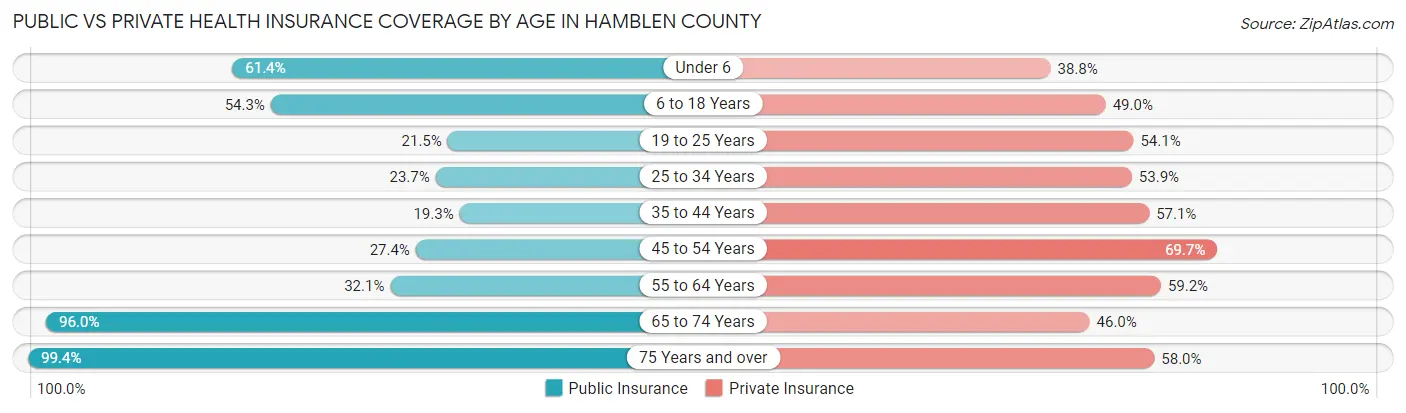
| Age Bracket | Public Insurance | Private Insurance |
| Under 6 | 2,913 (61.4%) | 1,838 (38.8%) |
| 6 to 18 Years | 5,917 (54.3%) | 5,336 (49.0%) |
| 19 to 25 Years | 1,130 (21.5%) | 2,848 (54.1%) |
| 25 to 34 Years | 1,603 (23.7%) | 3,640 (53.8%) |
| 35 to 44 Years | 1,440 (19.3%) | 4,262 (57.1%) |
| 45 to 54 Years | 2,396 (27.4%) | 6,091 (69.7%) |
| 55 to 64 Years | 2,720 (32.1%) | 5,015 (59.2%) |
| 65 to 74 Years | 6,558 (96.0%) | 3,142 (46.0%) |
| 75 Years and over | 4,608 (99.4%) | 2,691 (58.0%) |
| Total | 29,285 (45.9%) | 34,863 (54.6%) |
Disability Status by Sex by Age in Hamblen County
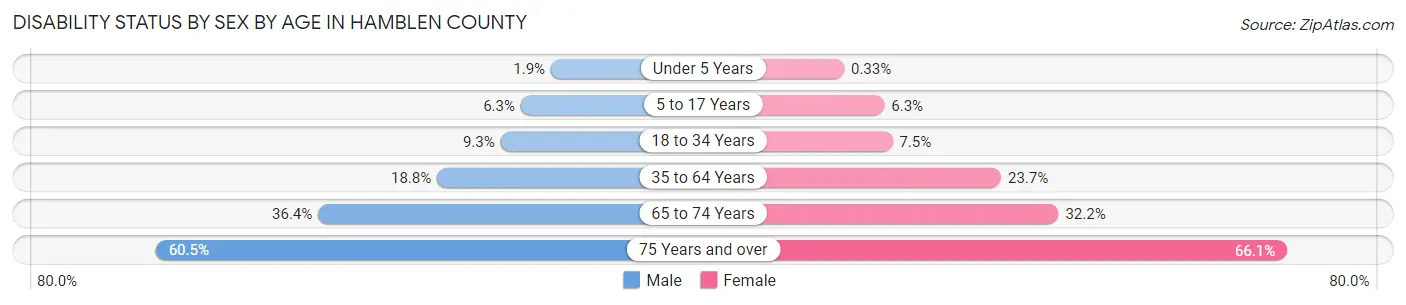
| Age Bracket | Male | Female |
| Under 5 Years | 38 (1.8%) | 6 (0.3%) |
| 5 to 17 Years | 352 (6.3%) | 349 (6.3%) |
| 18 to 34 Years | 600 (9.3%) | 471 (7.5%) |
| 35 to 64 Years | 2,309 (18.8%) | 2,925 (23.7%) |
| 65 to 74 Years | 1,185 (36.4%) | 1,151 (32.2%) |
| 75 Years and over | 1,107 (60.5%) | 1,857 (66.1%) |
Disability Class by Sex by Age in Hamblen County
Disability Class: Hearing Difficulty
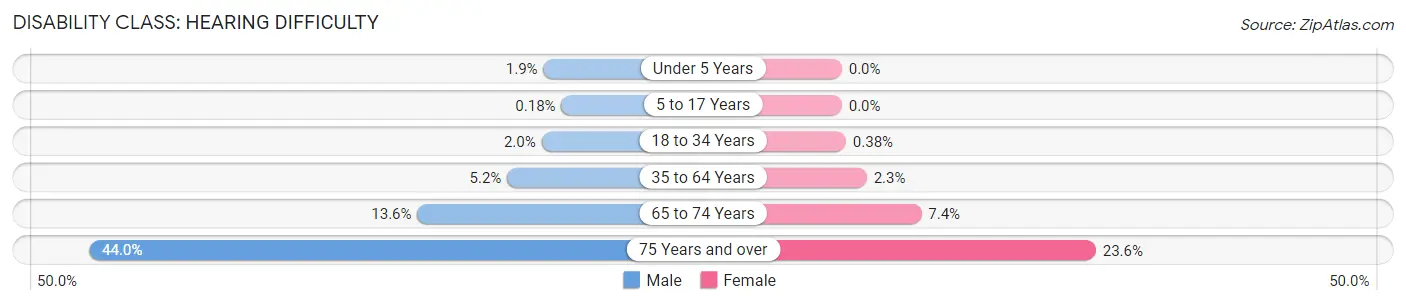
| Age Bracket | Male | Female |
| Under 5 Years | 38 (1.8%) | 0 (0.0%) |
| 5 to 17 Years | 10 (0.2%) | 0 (0.0%) |
| 18 to 34 Years | 130 (2.0%) | 24 (0.4%) |
| 35 to 64 Years | 641 (5.2%) | 286 (2.3%) |
| 65 to 74 Years | 441 (13.6%) | 264 (7.4%) |
| 75 Years and over | 805 (44.0%) | 662 (23.6%) |
Disability Class: Vision Difficulty
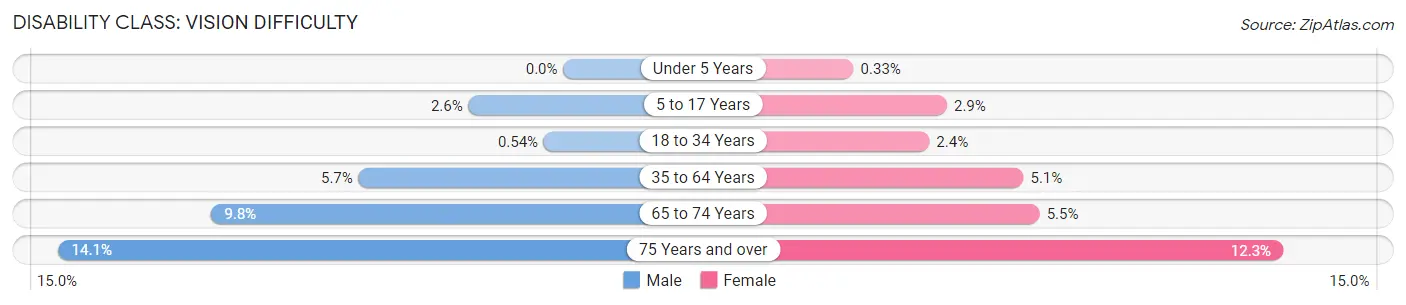
| Age Bracket | Male | Female |
| Under 5 Years | 0 (0.0%) | 6 (0.3%) |
| 5 to 17 Years | 147 (2.6%) | 162 (2.9%) |
| 18 to 34 Years | 35 (0.5%) | 153 (2.4%) |
| 35 to 64 Years | 702 (5.7%) | 625 (5.1%) |
| 65 to 74 Years | 319 (9.8%) | 197 (5.5%) |
| 75 Years and over | 257 (14.1%) | 345 (12.3%) |
Disability Class: Cognitive Difficulty
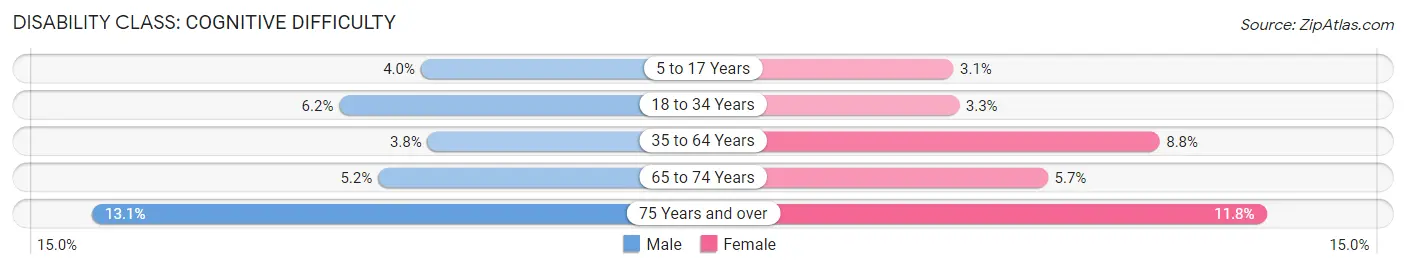
| Age Bracket | Male | Female |
| 5 to 17 Years | 221 (4.0%) | 171 (3.1%) |
| 18 to 34 Years | 401 (6.2%) | 204 (3.3%) |
| 35 to 64 Years | 465 (3.8%) | 1,093 (8.8%) |
| 65 to 74 Years | 168 (5.2%) | 205 (5.7%) |
| 75 Years and over | 240 (13.1%) | 332 (11.8%) |
Disability Class: Ambulatory Difficulty
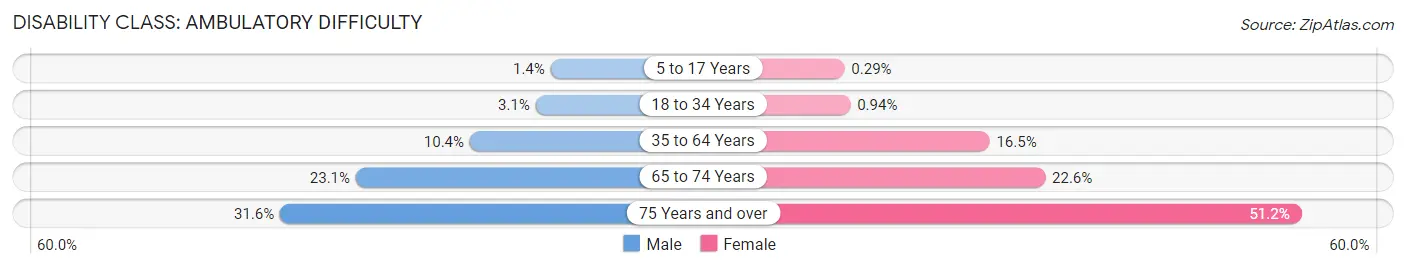
| Age Bracket | Male | Female |
| 5 to 17 Years | 79 (1.4%) | 16 (0.3%) |
| 18 to 34 Years | 198 (3.1%) | 59 (0.9%) |
| 35 to 64 Years | 1,282 (10.4%) | 2,034 (16.5%) |
| 65 to 74 Years | 752 (23.1%) | 810 (22.6%) |
| 75 Years and over | 577 (31.6%) | 1,438 (51.2%) |
Disability Class: Self-Care Difficulty
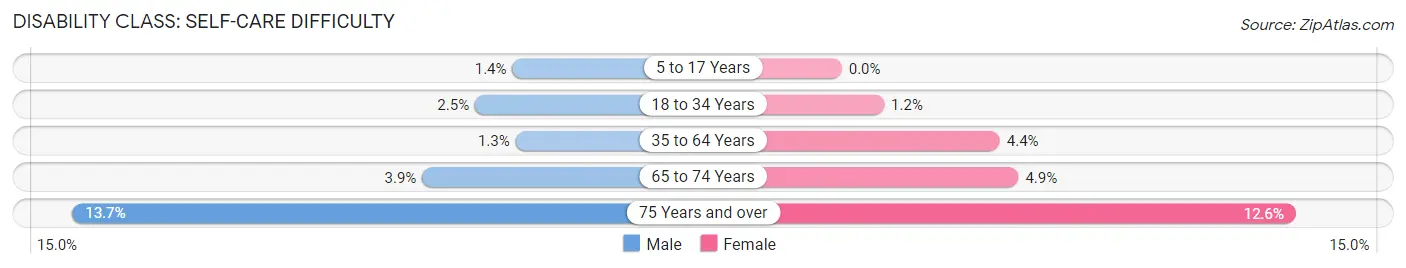
| Age Bracket | Male | Female |
| 5 to 17 Years | 79 (1.4%) | 0 (0.0%) |
| 18 to 34 Years | 158 (2.5%) | 74 (1.2%) |
| 35 to 64 Years | 164 (1.3%) | 544 (4.4%) |
| 65 to 74 Years | 128 (3.9%) | 176 (4.9%) |
| 75 Years and over | 250 (13.7%) | 355 (12.6%) |
Technology Access in Hamblen County
Computing Device Access in Hamblen County
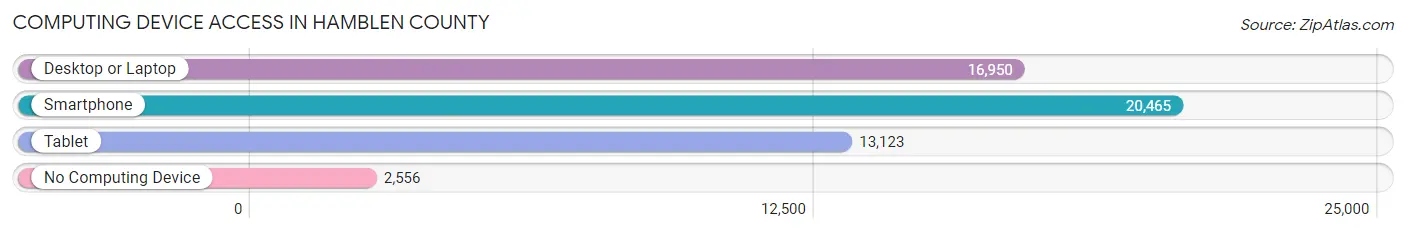
| Device Type | # Households | % Households |
| Desktop or Laptop | 16,950 | 67.2% |
| Smartphone | 20,465 | 81.2% |
| Tablet | 13,123 | 52.1% |
| No Computing Device | 2,556 | 10.1% |
| Total | 25,209 | 100.0% |
Internet Access in Hamblen County
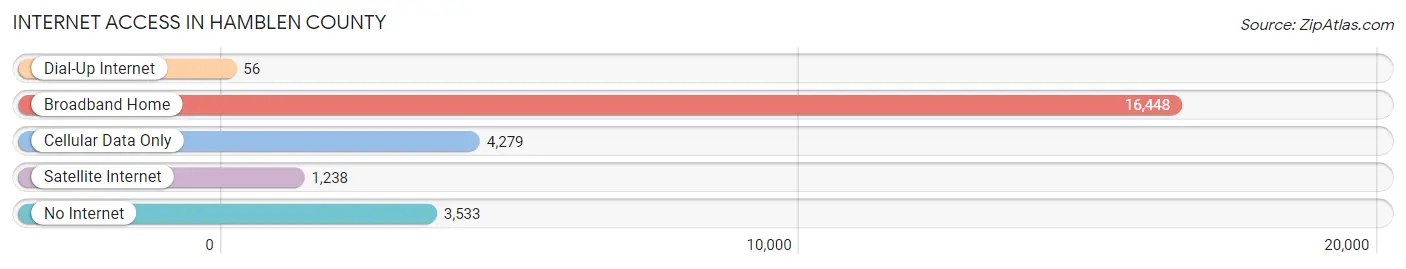
| Internet Type | # Households | % Households |
| Dial-Up Internet | 56 | 0.2% |
| Broadband Home | 16,448 | 65.2% |
| Cellular Data Only | 4,279 | 17.0% |
| Satellite Internet | 1,238 | 4.9% |
| No Internet | 3,533 | 14.0% |
| Total | 25,209 | 100.0% |
Hamblen County Summary
Hamblen County is located in the northeastern corner of Tennessee, and is part of the Morristown Metropolitan Statistical Area. It is bordered by Grainger, Jefferson, Cocke, Greene, and Hawkins counties. The county seat is Morristown, and the county was named after Hezekiah Hamblen, a Revolutionary War veteran.
History
The area that is now Hamblen County was originally part of the Cherokee Nation. The first European settlers arrived in the area in the late 1700s, and the county was officially established in 1870. The county was named after Hezekiah Hamblen, a Revolutionary War veteran who had settled in the area in 1785.
The county was largely agricultural in the 19th century, with tobacco, corn, and wheat being the main crops. The county also had several small industries, including a cotton mill, a grist mill, and a sawmill.
In the early 20th century, the county began to industrialize, with the establishment of several factories, including a cotton mill, a furniture factory, and a canning factory. The county also had several coal mines, which provided jobs for many of the county’s residents.
Geography
Hamblen County is located in the northeastern corner of Tennessee, and is part of the Morristown Metropolitan Statistical Area. It is bordered by Grainger, Jefferson, Cocke, Greene, and Hawkins counties. The county has a total area of 437 square miles, of which 434 square miles is land and 3 square miles is water.
The county is mostly hilly, with the highest point being the summit of White Oak Mountain, which has an elevation of 2,072 feet. The county is drained by the Holston River, which flows through the county from north to south.
Economy
The economy of Hamblen County is largely based on manufacturing and agriculture. The county’s largest employers are the Eastman Chemical Company, the Morristown-Hamblen Healthcare System, and the Morristown-Hamblen School System.
Agriculture is also an important part of the county’s economy, with tobacco, corn, and wheat being the main crops. The county also has several small industries, including a furniture factory, a canning factory, and a cotton mill.
Demographics
As of the 2010 census, the population of Hamblen County was 62,544. The population is largely white (90.2%), with small percentages of African Americans (6.2%), Hispanics (2.2%), and Asians (0.7%). The median household income is $41,945, and the median home value is $128,400.
The county is served by the Morristown-Hamblen School System, which consists of 15 elementary schools, five middle schools, and three high schools. The county is also home to Walters State Community College, which offers associate’s degrees and certificate programs.
Conclusion
Hamblen County is a rural county located in the northeastern corner of Tennessee. It has a population of 62,544, and is largely white. The county’s economy is based on manufacturing and agriculture, and it is served by the Morristown-Hamblen School System and Walters State Community College. The county has a rich history, and is a great place to live and work.
Common Questions
What is Per Capita Income in Hamblen County?
Per Capita income in Hamblen County is $27,845.
What is the Median Family Income in Hamblen County?
Median Family Income in Hamblen County is $68,553.
What is the Median Household income in Hamblen County?
Median Household Income in Hamblen County is $49,656.
What is Income or Wage Gap in Hamblen County?
Income or Wage Gap in Hamblen County is 33.0%.
Women in Hamblen County earn 67.0 cents for every dollar earned by a man.
What is Family Income Deficit in Hamblen County?
Family Income Deficit in Hamblen County is $13,120.
Families that are below poverty line in Hamblen County earn $13,120 less on average than the poverty threshold level.
What is Inequality or Gini Index in Hamblen County?
Inequality or Gini Index in Hamblen County is 0.46.
What is the Total Population of Hamblen County?
Total Population of Hamblen County is 64,531.
What is the Total Male Population of Hamblen County?
Total Male Population of Hamblen County is 31,933.
What is the Total Female Population of Hamblen County?
Total Female Population of Hamblen County is 32,598.
What is the Ratio of Males per 100 Females in Hamblen County?
There are 97.96 Males per 100 Females in Hamblen County.
What is the Ratio of Females per 100 Males in Hamblen County?
There are 102.08 Females per 100 Males in Hamblen County.
What is the Median Population Age in Hamblen County?
Median Population Age in Hamblen County is 41.2 Years.
What is the Average Family Size in Hamblen County
Average Family Size in Hamblen County is 3.1 People.
What is the Average Household Size in Hamblen County
Average Household Size in Hamblen County is 2.5 People.
How Large is the Labor Force in Hamblen County?
There are 29,001 People in the Labor Forcein in Hamblen County.
What is the Percentage of People in the Labor Force in Hamblen County?
56.6% of People are in the Labor Force in Hamblen County.
What is the Unemployment Rate in Hamblen County?
Unemployment Rate in Hamblen County is 6.6%.