Fentress County, TN Map & Demographics
Fentress County Map
Fentress County Overview
$24,595
PER CAPITA INCOME
$54,716
AVG FAMILY INCOME
$47,884
AVG HOUSEHOLD INCOME
11.3%
WAGE / INCOME GAP [ % ]
88.7¢/ $1
WAGE / INCOME GAP [ $ ]
0.42
INEQUALITY / GINI INDEX
18,642
TOTAL POPULATION
9,371
MALE POPULATION
9,271
FEMALE POPULATION
101.08
MALES / 100 FEMALES
98.93
FEMALES / 100 MALES
46.3
MEDIAN AGE
3.1
AVG FAMILY SIZE
2.4
AVG HOUSEHOLD SIZE
7,624
LABOR FORCE [ PEOPLE ]
49.5%
PERCENT IN LABOR FORCE
5.3%
UNEMPLOYMENT RATE
Fentress County Area Codes
Income in Fentress County
Income Overview in Fentress County
Per Capita Income in Fentress County is $24,595, while median incomes of families and households are $54,716 and $47,884 respectively.
| Characteristic | Number | Measure |
| Per Capita Income | 18,642 | $24,595 |
| Median Family Income | 4,693 | $54,716 |
| Mean Family Income | 4,693 | $68,009 |
| Median Household Income | 7,607 | $47,884 |
| Mean Household Income | 7,607 | $56,432 |
| Income Deficit | 4,693 | $0 |
| Wage / Income Gap (%) | 18,642 | 11.27% |
| Wage / Income Gap ($) | 18,642 | 88.73¢ per $1 |
| Gini / Inequality Index | 18,642 | 0.42 |
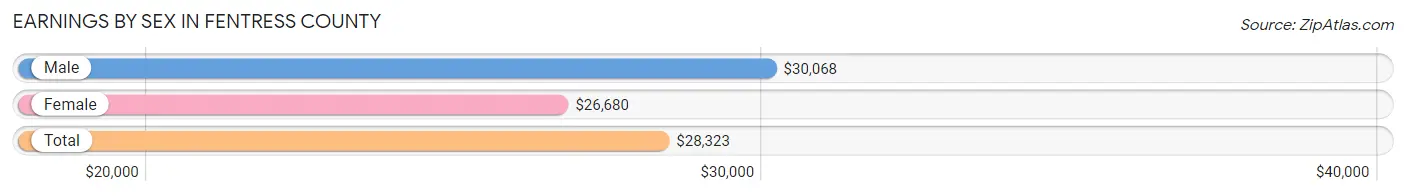
Earnings by Sex in Fentress County
Average Earnings in Fentress County are $28,323, $30,068 for men and $26,680 for women, a difference of 11.3%.
| Sex | Number | Average Earnings |
| Male | 4,273 (54.0%) | $30,068 |
| Female | 3,635 (46.0%) | $26,680 |
| Total | 7,908 (100.0%) | $28,323 |
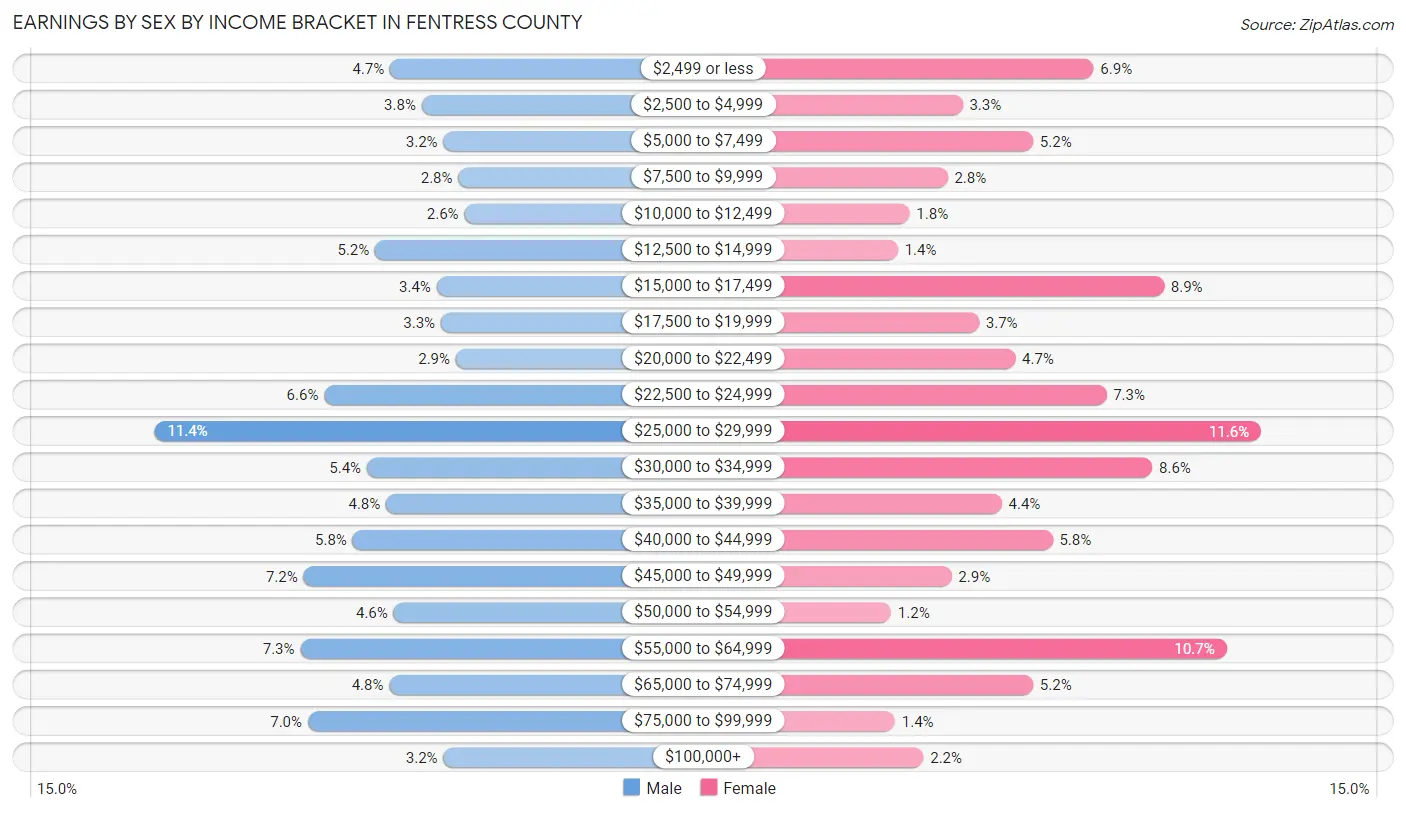
Earnings by Sex by Income Bracket in Fentress County
The most common earnings brackets in Fentress County are $25,000 to $29,999 for men (485 | 11.4%) and $25,000 to $29,999 for women (423 | 11.6%).
| Income | Male | Female |
| $2,499 or less | 202 (4.7%) | 252 (6.9%) |
| $2,500 to $4,999 | 164 (3.8%) | 118 (3.3%) |
| $5,000 to $7,499 | 138 (3.2%) | 190 (5.2%) |
| $7,500 to $9,999 | 120 (2.8%) | 103 (2.8%) |
| $10,000 to $12,499 | 113 (2.6%) | 64 (1.8%) |
| $12,500 to $14,999 | 220 (5.1%) | 52 (1.4%) |
| $15,000 to $17,499 | 146 (3.4%) | 324 (8.9%) |
| $17,500 to $19,999 | 141 (3.3%) | 135 (3.7%) |
| $20,000 to $22,499 | 123 (2.9%) | 172 (4.7%) |
| $22,500 to $24,999 | 281 (6.6%) | 265 (7.3%) |
| $25,000 to $29,999 | 485 (11.4%) | 423 (11.6%) |
| $30,000 to $34,999 | 230 (5.4%) | 312 (8.6%) |
| $35,000 to $39,999 | 207 (4.8%) | 158 (4.3%) |
| $40,000 to $44,999 | 247 (5.8%) | 210 (5.8%) |
| $45,000 to $49,999 | 306 (7.2%) | 107 (2.9%) |
| $50,000 to $54,999 | 198 (4.6%) | 45 (1.2%) |
| $55,000 to $64,999 | 310 (7.2%) | 388 (10.7%) |
| $65,000 to $74,999 | 203 (4.8%) | 190 (5.2%) |
| $75,000 to $99,999 | 301 (7.0%) | 49 (1.3%) |
| $100,000+ | 138 (3.2%) | 78 (2.1%) |
| Total | 4,273 (100.0%) | 3,635 (100.0%) |
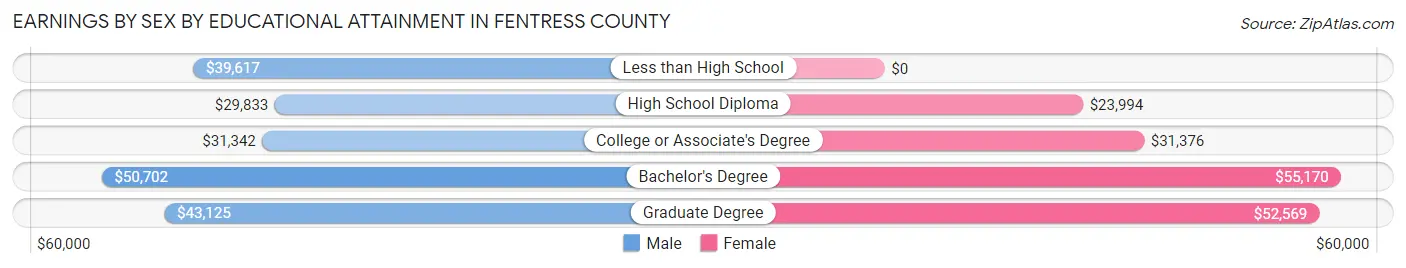
Earnings by Sex by Educational Attainment in Fentress County
Average earnings in Fentress County are $36,225 for men and $28,082 for women, a difference of 22.5%. Men with an educational attainment of bachelor's degree enjoy the highest average annual earnings of $50,702, while those with high school diploma education earn the least with $29,833. Women with an educational attainment of bachelor's degree earn the most with the average annual earnings of $55,170, while those with high school diploma education have the smallest earnings of $23,994.
| Educational Attainment | Male Income | Female Income |
| Less than High School | $39,617 | $0 |
| High School Diploma | $29,833 | $23,994 |
| College or Associate's Degree | $31,342 | $31,376 |
| Bachelor's Degree | $50,702 | $55,170 |
| Graduate Degree | $43,125 | $52,569 |
| Total | $36,225 | $28,082 |
Family Income in Fentress County
Family Income Brackets in Fentress County
According to the Fentress County family income data, there are 1,234 families falling into the $50,000 to $74,999 income range, which is the most common income bracket and makes up 26.3% of all families. Conversely, the $200,000+ income bracket is the least frequent group with only 103 families (2.2%) belonging to this category.
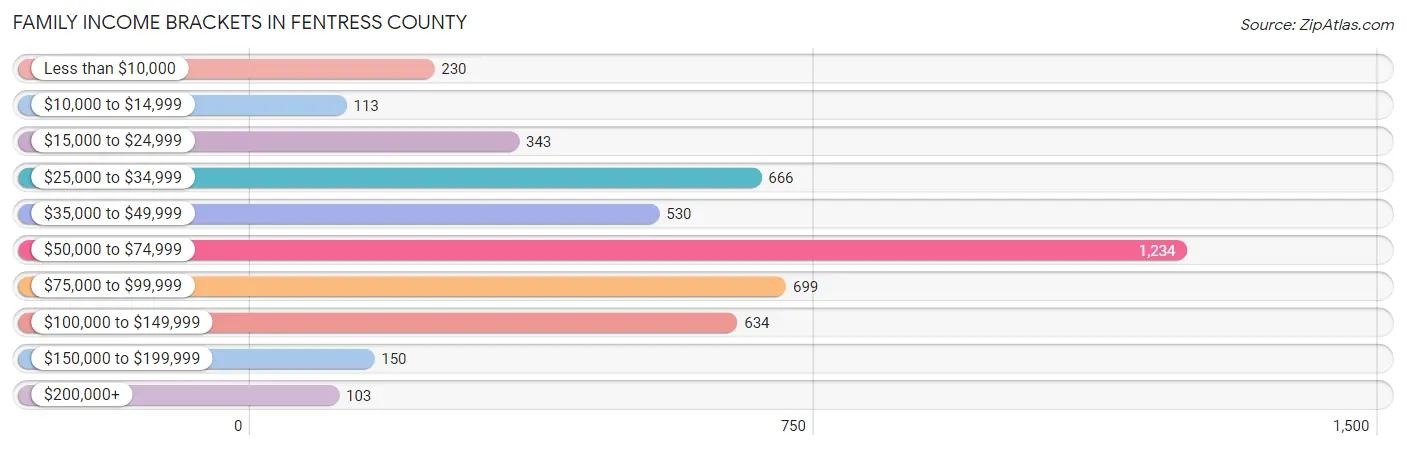
| Income Bracket | # Families | % Families |
| Less than $10,000 | 230 | 4.9% |
| $10,000 to $14,999 | 113 | 2.4% |
| $15,000 to $24,999 | 343 | 7.3% |
| $25,000 to $34,999 | 666 | 14.2% |
| $35,000 to $49,999 | 530 | 11.3% |
| $50,000 to $74,999 | 1,234 | 26.3% |
| $75,000 to $99,999 | 699 | 14.9% |
| $100,000 to $149,999 | 634 | 13.5% |
| $150,000 to $199,999 | 150 | 3.2% |
| $200,000+ | 103 | 2.2% |
Family Income by Famaliy Size in Fentress County
7+ person families (80 | 1.7%) account for the highest median family income in Fentress County with $113,676 per family, while 2-person families (2,467 | 52.6%) have the highest median income of $26,437 per family member.
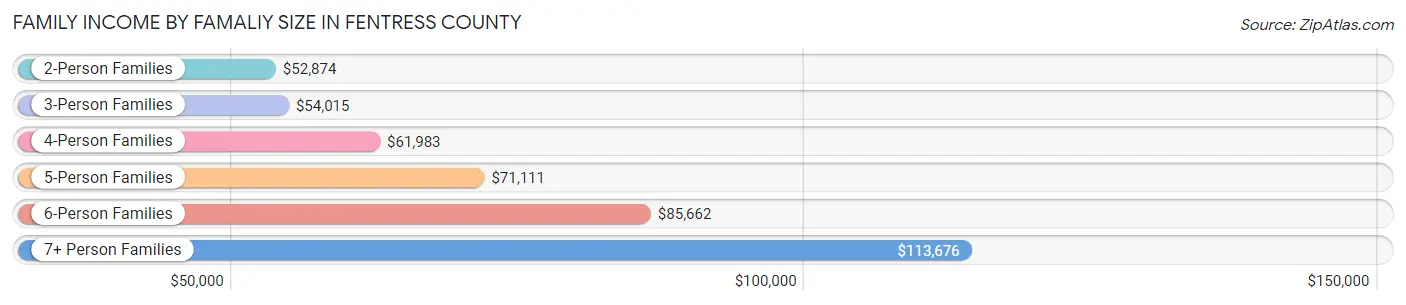
| Income Bracket | # Families | Median Income |
| 2-Person Families | 2,467 (52.6%) | $52,874 |
| 3-Person Families | 872 (18.6%) | $54,015 |
| 4-Person Families | 588 (12.5%) | $61,983 |
| 5-Person Families | 542 (11.6%) | $71,111 |
| 6-Person Families | 144 (3.1%) | $85,662 |
| 7+ Person Families | 80 (1.7%) | $113,676 |
| Total | 4,693 (100.0%) | $54,716 |
Family Income by Number of Earners in Fentress County
The median family income in Fentress County is $54,716, with families comprising 3+ earners (363) having the highest median family income of $96,188, while families with no earners (1,339) have the lowest median family income of $36,165, accounting for 7.7% and 28.5% of families, respectively.
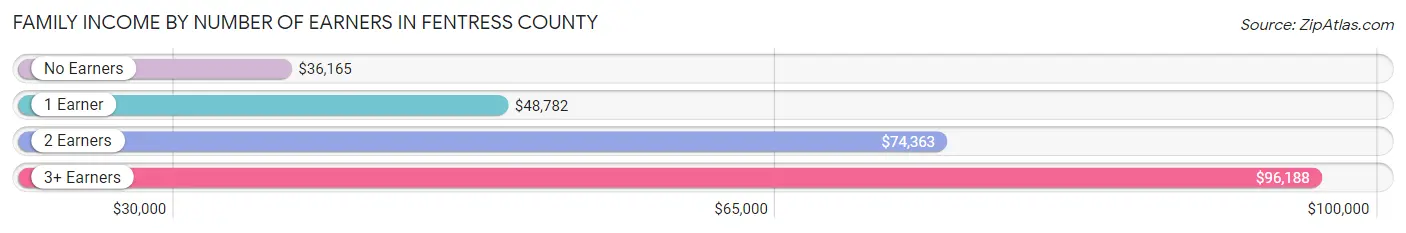
| Number of Earners | # Families | Median Income |
| No Earners | 1,339 (28.5%) | $36,165 |
| 1 Earner | 1,438 (30.6%) | $48,782 |
| 2 Earners | 1,553 (33.1%) | $74,363 |
| 3+ Earners | 363 (7.7%) | $96,188 |
| Total | 4,693 (100.0%) | $54,716 |
Household Income in Fentress County
Household Income Brackets in Fentress County
With 1,491 households falling in the category, the $50,000 to $74,999 income range is the most frequent in Fentress County, accounting for 19.6% of all households. In contrast, only 106 households (1.4%) fall into the $200,000+ income bracket, making it the least populous group.
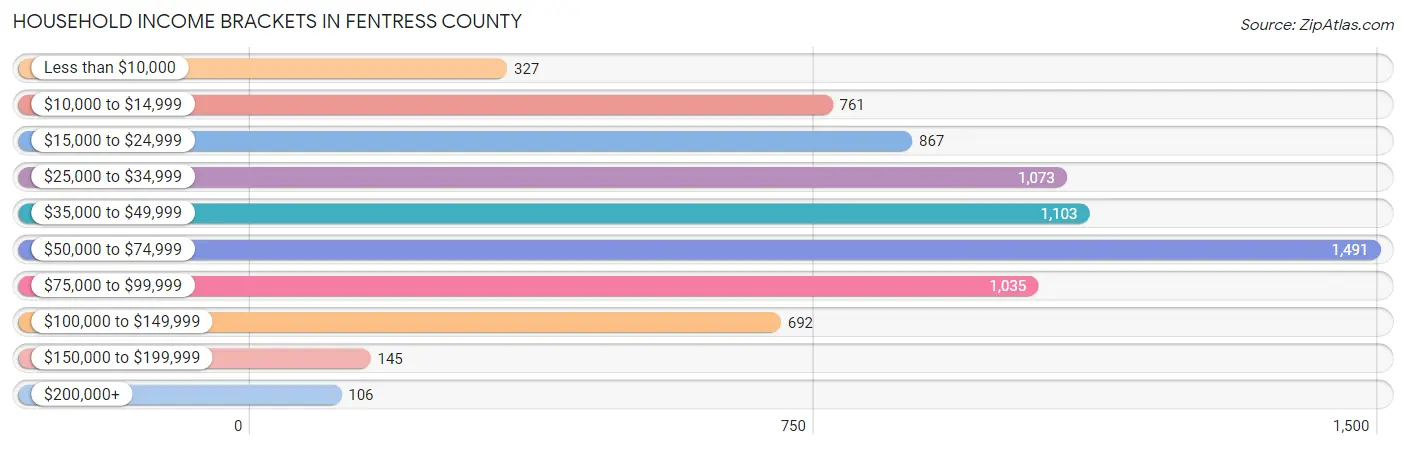
| Income Bracket | # Households | % Households |
| Less than $10,000 | 327 | 4.3% |
| $10,000 to $14,999 | 761 | 10.0% |
| $15,000 to $24,999 | 867 | 11.4% |
| $25,000 to $34,999 | 1,073 | 14.1% |
| $35,000 to $49,999 | 1,103 | 14.5% |
| $50,000 to $74,999 | 1,491 | 19.6% |
| $75,000 to $99,999 | 1,035 | 13.6% |
| $100,000 to $149,999 | 692 | 9.1% |
| $150,000 to $199,999 | 145 | 1.9% |
| $200,000+ | 106 | 1.4% |
Household Income by Householder Age in Fentress County
The median household income in Fentress County is $47,884, with the highest median household income of $58,210 found in the 25 to 44 years age bracket for the primary householder. A total of 1,720 households (22.6%) fall into this category. Meanwhile, the 15 to 24 years age bracket for the primary householder has the lowest median household income of $0, with 289 households (3.8%) in this group.
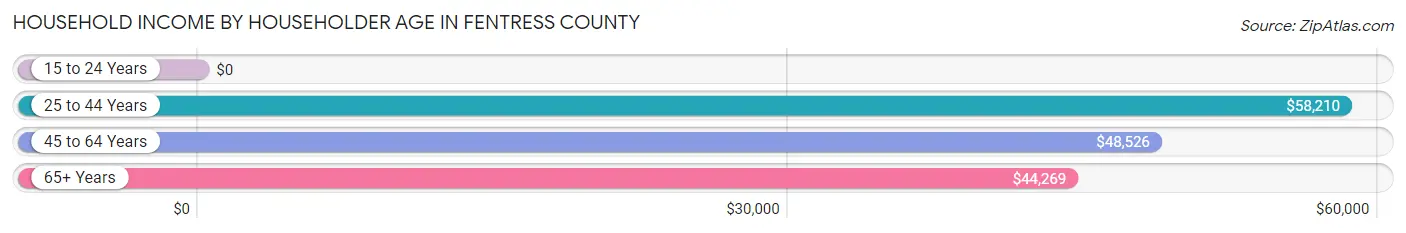
| Income Bracket | # Households | Median Income |
| 15 to 24 Years | 289 (3.8%) | $0 |
| 25 to 44 Years | 1,720 (22.6%) | $58,210 |
| 45 to 64 Years | 2,930 (38.5%) | $48,526 |
| 65+ Years | 2,668 (35.1%) | $44,269 |
| Total | 7,607 (100.0%) | $47,884 |
Poverty in Fentress County
Income Below Poverty by Sex and Age in Fentress County
With 20.0% poverty level for males and 20.4% for females among the residents of Fentress County, 6 to 11 year old males and 18 to 24 year old females are the most vulnerable to poverty, with 228 males (38.4%) and 253 females (38.3%) in their respective age groups living below the poverty level.
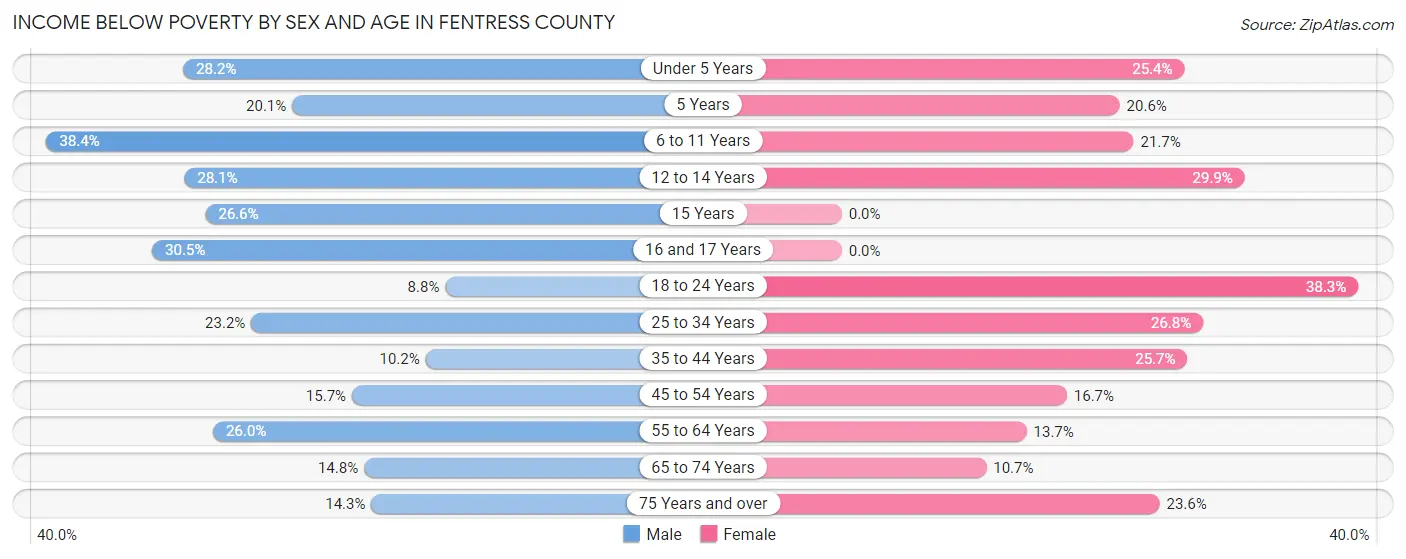
| Age Bracket | Male | Female |
| Under 5 Years | 142 (28.2%) | 132 (25.4%) |
| 5 Years | 28 (20.1%) | 13 (20.6%) |
| 6 to 11 Years | 228 (38.4%) | 125 (21.7%) |
| 12 to 14 Years | 74 (28.1%) | 70 (29.9%) |
| 15 Years | 21 (26.6%) | 0 (0.0%) |
| 16 and 17 Years | 109 (30.5%) | 0 (0.0%) |
| 18 to 24 Years | 62 (8.8%) | 253 (38.3%) |
| 25 to 34 Years | 226 (23.2%) | 247 (26.8%) |
| 35 to 44 Years | 102 (10.2%) | 248 (25.7%) |
| 45 to 54 Years | 200 (15.7%) | 203 (16.7%) |
| 55 to 64 Years | 359 (26.0%) | 198 (13.7%) |
| 65 to 74 Years | 184 (14.8%) | 142 (10.7%) |
| 75 Years and over | 92 (14.3%) | 214 (23.6%) |
| Total | 1,827 (20.0%) | 1,845 (20.4%) |
Income Above Poverty by Sex and Age in Fentress County
According to the poverty statistics in Fentress County, males aged 18 to 24 years and females aged 15 years are the age groups that are most secure financially, with 91.2% of males and 100.0% of females in these age groups living above the poverty line.
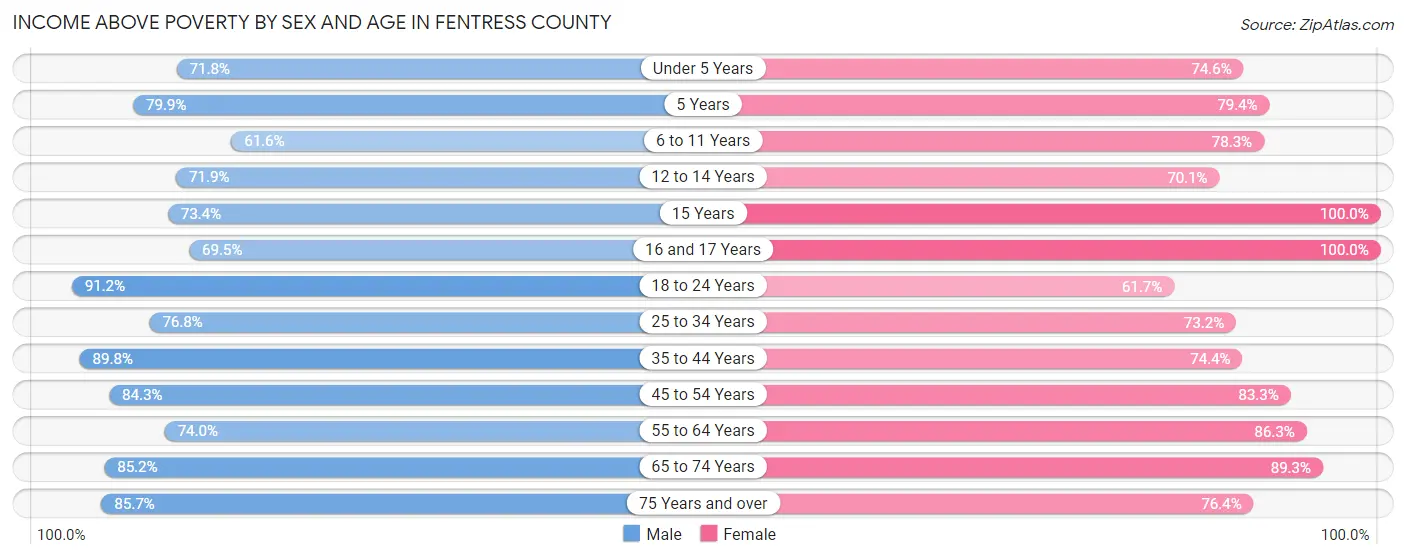
| Age Bracket | Male | Female |
| Under 5 Years | 361 (71.8%) | 387 (74.6%) |
| 5 Years | 111 (79.9%) | 50 (79.4%) |
| 6 to 11 Years | 366 (61.6%) | 452 (78.3%) |
| 12 to 14 Years | 189 (71.9%) | 164 (70.1%) |
| 15 Years | 58 (73.4%) | 3 (100.0%) |
| 16 and 17 Years | 248 (69.5%) | 219 (100.0%) |
| 18 to 24 Years | 645 (91.2%) | 407 (61.7%) |
| 25 to 34 Years | 749 (76.8%) | 674 (73.2%) |
| 35 to 44 Years | 895 (89.8%) | 719 (74.4%) |
| 45 to 54 Years | 1,074 (84.3%) | 1,012 (83.3%) |
| 55 to 64 Years | 1,021 (74.0%) | 1,245 (86.3%) |
| 65 to 74 Years | 1,059 (85.2%) | 1,182 (89.3%) |
| 75 Years and over | 553 (85.7%) | 693 (76.4%) |
| Total | 7,329 (80.0%) | 7,207 (79.6%) |
Income Below Poverty Among Married-Couple Families in Fentress County
The poverty statistics for married-couple families in Fentress County show that 11.6% or 403 of the total 3,464 families live below the poverty line. Families with 1 or 2 children have the highest poverty rate of 18.8%, comprising of 167 families. On the other hand, families with 5 or more children have the lowest poverty rate of 0.0%, which includes 0 families.
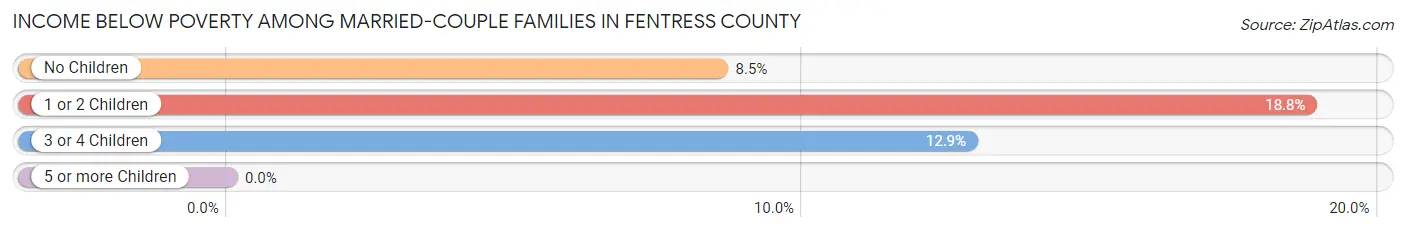
| Children | Above Poverty | Below Poverty |
| No Children | 1,938 (91.5%) | 181 (8.5%) |
| 1 or 2 Children | 722 (81.2%) | 167 (18.8%) |
| 3 or 4 Children | 372 (87.1%) | 55 (12.9%) |
| 5 or more Children | 29 (100.0%) | 0 (0.0%) |
| Total | 3,061 (88.4%) | 403 (11.6%) |
Income Below Poverty Among Single-Parent Households in Fentress County
According to the poverty data in Fentress County, 12.8% or 61 single-father households and 35.4% or 266 single-mother households are living below the poverty line. Among single-father households, those with 3 or 4 children have the highest poverty rate, with 48 households (81.4%) experiencing poverty. Likewise, among single-mother households, those with 1 or 2 children have the highest poverty rate, with 208 households (66.9%) falling below the poverty line.
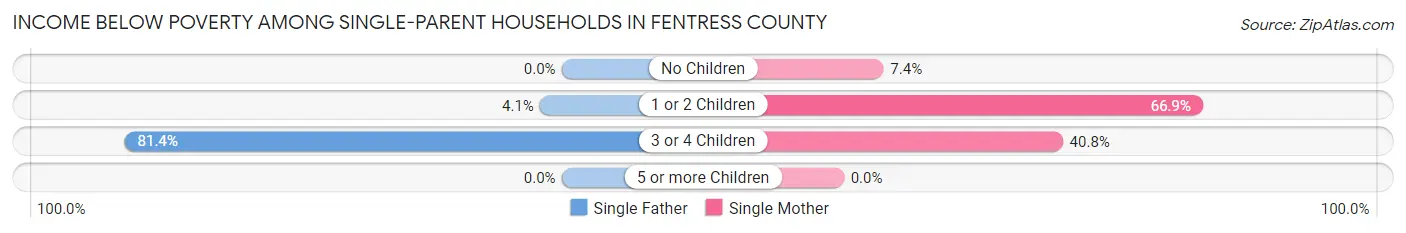
| Children | Single Father | Single Mother |
| No Children | 0 (0.0%) | 27 (7.4%) |
| 1 or 2 Children | 13 (4.1%) | 208 (66.9%) |
| 3 or 4 Children | 48 (81.4%) | 31 (40.8%) |
| 5 or more Children | 0 (0.0%) | 0 (0.0%) |
| Total | 61 (12.8%) | 266 (35.4%) |
Income Below Poverty Among Married-Couple vs Single-Parent Households in Fentress County
The poverty data for Fentress County shows that 403 of the married-couple family households (11.6%) and 327 of the single-parent households (26.6%) are living below the poverty level. Within the married-couple family households, those with 1 or 2 children have the highest poverty rate, with 167 households (18.8%) falling below the poverty line. Among the single-parent households, those with 3 or 4 children have the highest poverty rate, with 79 household (58.5%) living below poverty.
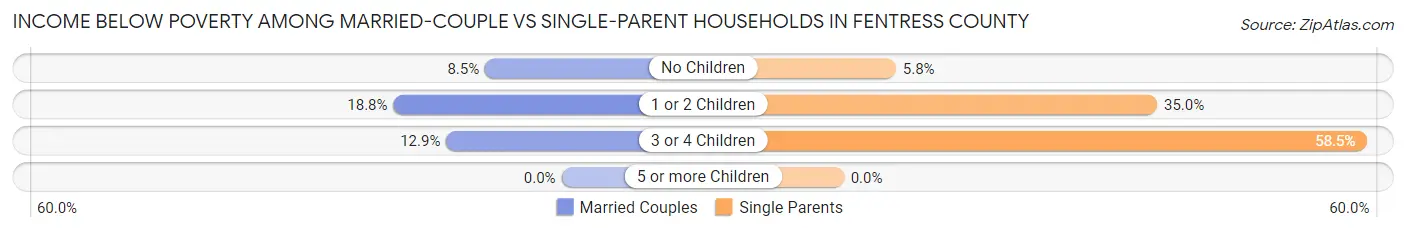
| Children | Married-Couple Families | Single-Parent Households |
| No Children | 181 (8.5%) | 27 (5.8%) |
| 1 or 2 Children | 167 (18.8%) | 221 (35.0%) |
| 3 or 4 Children | 55 (12.9%) | 79 (58.5%) |
| 5 or more Children | 0 (0.0%) | 0 (0.0%) |
| Total | 403 (11.6%) | 327 (26.6%) |
Race in Fentress County
The most populous races in Fentress County are White / Caucasian (17,874 | 95.9%), Two or more Races (526 | 2.8%), and Hispanic or Latino (344 | 1.8%).
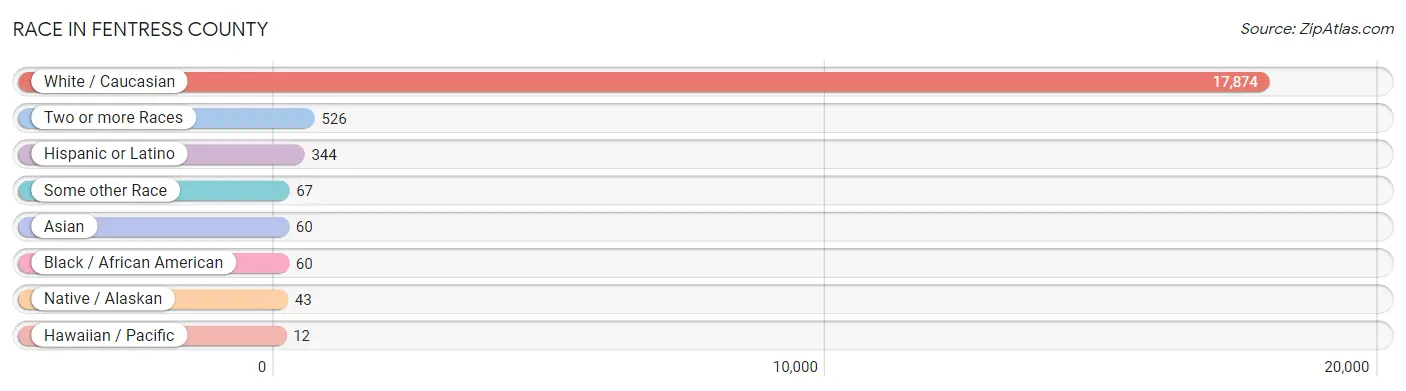
| Race | # Population | % Population |
| Asian | 60 | 0.3% |
| Black / African American | 60 | 0.3% |
| Hawaiian / Pacific | 12 | 0.1% |
| Hispanic or Latino | 344 | 1.8% |
| Native / Alaskan | 43 | 0.2% |
| White / Caucasian | 17,874 | 95.9% |
| Two or more Races | 526 | 2.8% |
| Some other Race | 67 | 0.4% |
| Total | 18,642 | 100.0% |
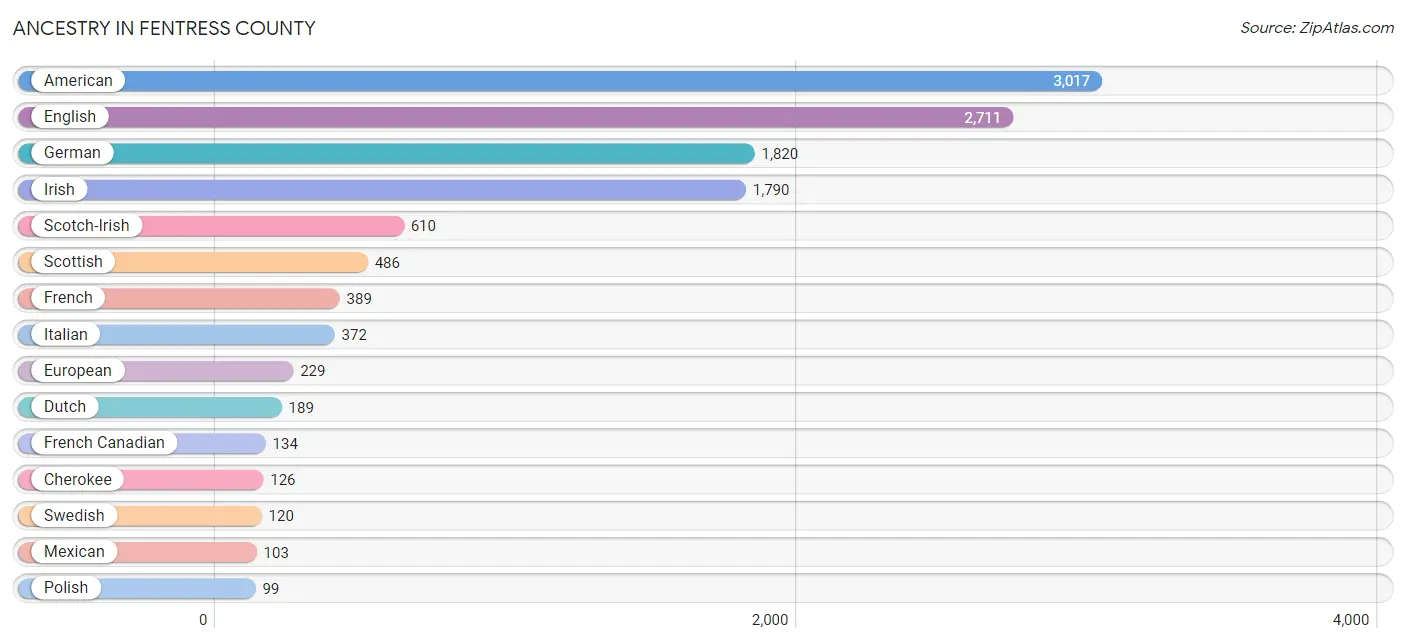
Ancestry in Fentress County
The most populous ancestries reported in Fentress County are American (3,017 | 16.2%), English (2,711 | 14.5%), German (1,820 | 9.8%), Irish (1,790 | 9.6%), and Scotch-Irish (610 | 3.3%), together accounting for 53.3% of all Fentress County residents.
| Ancestry | # Population | % Population |
| American | 3,017 | 16.2% |
| British | 3 | 0.0% |
| Burmese | 21 | 0.1% |
| Canadian | 31 | 0.2% |
| Central American | 54 | 0.3% |
| Cherokee | 126 | 0.7% |
| Choctaw | 3 | 0.0% |
| Cuban | 37 | 0.2% |
| Czechoslovakian | 37 | 0.2% |
| Danish | 6 | 0.0% |
| Dutch | 189 | 1.0% |
| English | 2,711 | 14.5% |
| European | 229 | 1.2% |
| Finnish | 12 | 0.1% |
| French | 389 | 2.1% |
| French Canadian | 134 | 0.7% |
| German | 1,820 | 9.8% |
| Guamanian / Chamorro | 4 | 0.0% |
| Guatemalan | 36 | 0.2% |
| Honduran | 18 | 0.1% |
| Hungarian | 13 | 0.1% |
| Indian (Asian) | 29 | 0.2% |
| Irish | 1,790 | 9.6% |
| Italian | 372 | 2.0% |
| Mexican | 103 | 0.5% |
| Native Hawaiian | 12 | 0.1% |
| Norwegian | 61 | 0.3% |
| Polish | 99 | 0.5% |
| Puerto Rican | 72 | 0.4% |
| Scandinavian | 23 | 0.1% |
| Scotch-Irish | 610 | 3.3% |
| Scottish | 486 | 2.6% |
| Sioux | 16 | 0.1% |
| Slavic | 17 | 0.1% |
| Spanish | 78 | 0.4% |
| Sri Lankan | 7 | 0.0% |
| Swedish | 120 | 0.6% |
| Swiss | 64 | 0.3% |
| Thai | 3 | 0.0% |
| Ukrainian | 2 | 0.0% |
| Welsh | 12 | 0.1% |
| Yugoslavian | 40 | 0.2% | View All 42 Rows |
Immigrants in Fentress County
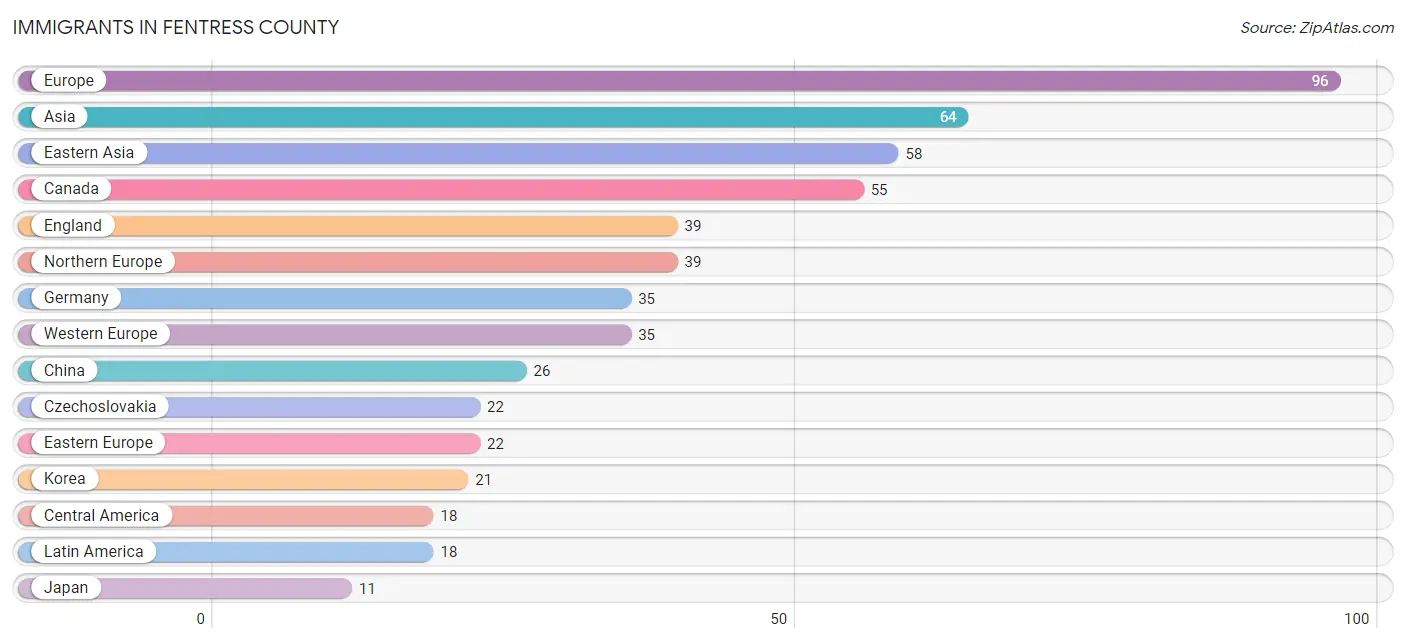
The most numerous immigrant groups reported in Fentress County came from Europe (96 | 0.5%), Asia (64 | 0.3%), Eastern Asia (58 | 0.3%), Canada (55 | 0.3%), and England (39 | 0.2%), together accounting for 1.7% of all Fentress County residents.
| Immigration Origin | # Population | % Population |
| Asia | 64 | 0.3% |
| Bangladesh | 3 | 0.0% |
| Canada | 55 | 0.3% |
| Central America | 18 | 0.1% |
| China | 26 | 0.1% |
| Czechoslovakia | 22 | 0.1% |
| Eastern Asia | 58 | 0.3% |
| Eastern Europe | 22 | 0.1% |
| England | 39 | 0.2% |
| Europe | 96 | 0.5% |
| Germany | 35 | 0.2% |
| Honduras | 8 | 0.0% |
| Japan | 11 | 0.1% |
| Korea | 21 | 0.1% |
| Latin America | 18 | 0.1% |
| Mexico | 10 | 0.1% |
| Northern Europe | 39 | 0.2% |
| Pakistan | 3 | 0.0% |
| South Central Asia | 6 | 0.0% |
| Western Europe | 35 | 0.2% | View All 20 Rows |
Sex and Age in Fentress County
Sex and Age in Fentress County
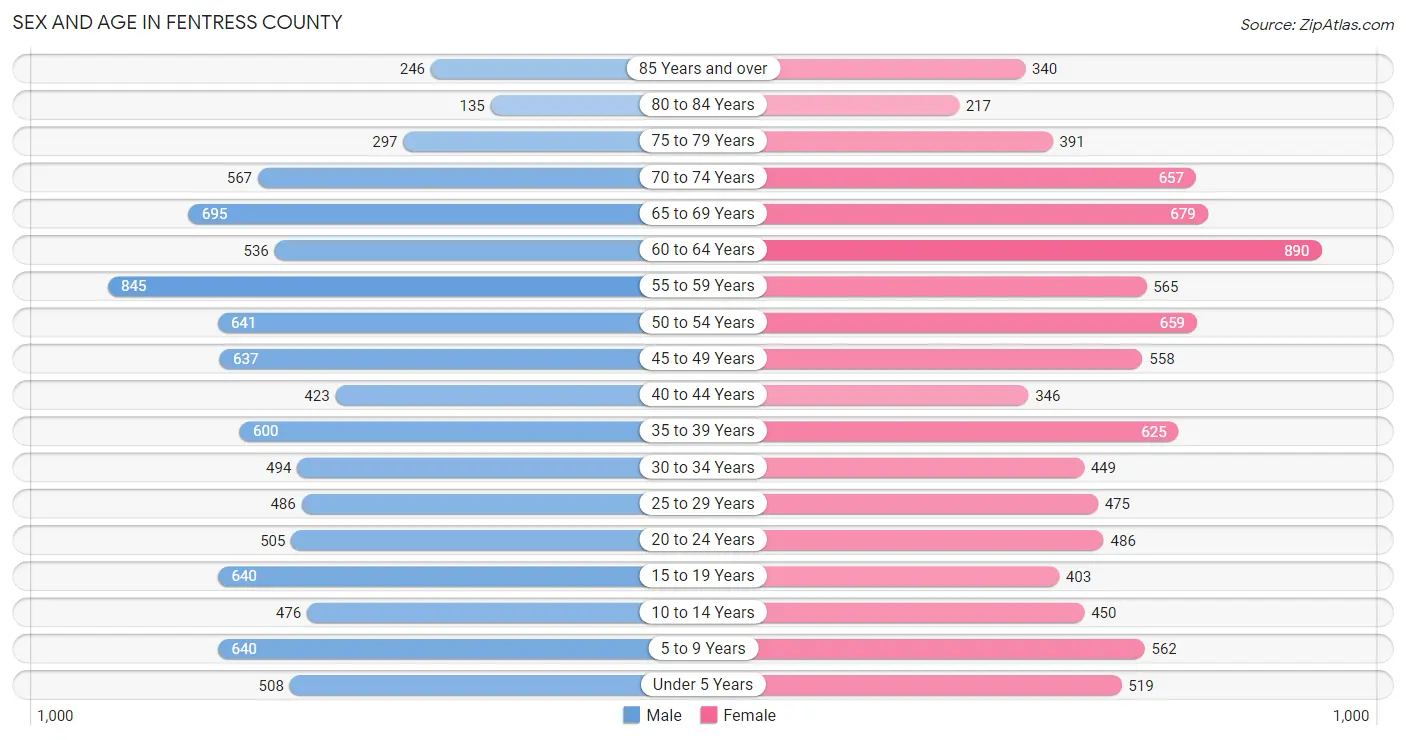
The most populous age groups in Fentress County are 55 to 59 Years (845 | 9.0%) for men and 60 to 64 Years (890 | 9.6%) for women.
| Age Bracket | Male | Female |
| Under 5 Years | 508 (5.4%) | 519 (5.6%) |
| 5 to 9 Years | 640 (6.8%) | 562 (6.1%) |
| 10 to 14 Years | 476 (5.1%) | 450 (4.9%) |
| 15 to 19 Years | 640 (6.8%) | 403 (4.3%) |
| 20 to 24 Years | 505 (5.4%) | 486 (5.2%) |
| 25 to 29 Years | 486 (5.2%) | 475 (5.1%) |
| 30 to 34 Years | 494 (5.3%) | 449 (4.8%) |
| 35 to 39 Years | 600 (6.4%) | 625 (6.7%) |
| 40 to 44 Years | 423 (4.5%) | 346 (3.7%) |
| 45 to 49 Years | 637 (6.8%) | 558 (6.0%) |
| 50 to 54 Years | 641 (6.8%) | 659 (7.1%) |
| 55 to 59 Years | 845 (9.0%) | 565 (6.1%) |
| 60 to 64 Years | 536 (5.7%) | 890 (9.6%) |
| 65 to 69 Years | 695 (7.4%) | 679 (7.3%) |
| 70 to 74 Years | 567 (6.0%) | 657 (7.1%) |
| 75 to 79 Years | 297 (3.2%) | 391 (4.2%) |
| 80 to 84 Years | 135 (1.4%) | 217 (2.3%) |
| 85 Years and over | 246 (2.6%) | 340 (3.7%) |
| Total | 9,371 (100.0%) | 9,271 (100.0%) |
Families and Households in Fentress County
Median Family Size in Fentress County
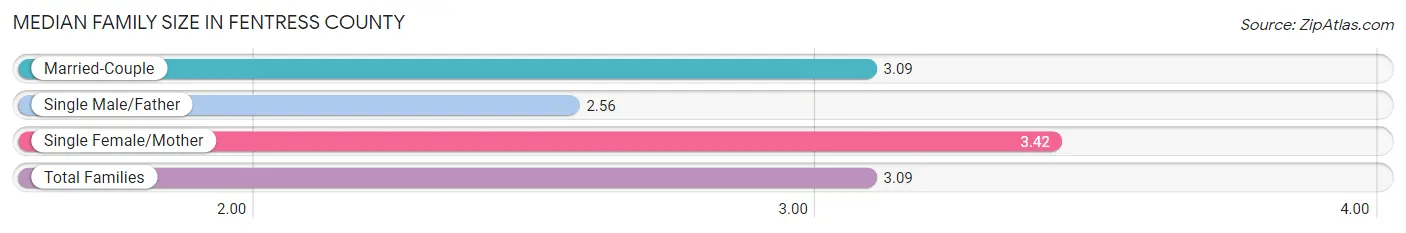
The median family size in Fentress County is 3.09 persons per family, with single female/mother families (752 | 16.0%) accounting for the largest median family size of 3.42 persons per family. On the other hand, single male/father families (477 | 10.2%) represent the smallest median family size with 2.56 persons per family.
| Family Type | # Families | Family Size |
| Married-Couple | 3,464 (73.8%) | 3.09 |
| Single Male/Father | 477 (10.2%) | 2.56 |
| Single Female/Mother | 752 (16.0%) | 3.42 |
| Total Families | 4,693 (100.0%) | 3.09 |
Median Household Size in Fentress County
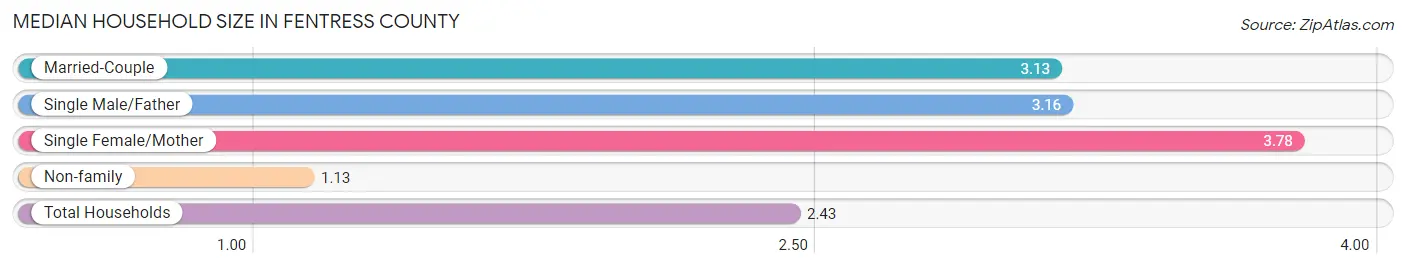
The median household size in Fentress County is 2.43 persons per household, with single female/mother households (752 | 9.9%) accounting for the largest median household size of 3.78 persons per household. non-family households (2,914 | 38.3%) represent the smallest median household size with 1.13 persons per household.
| Household Type | # Households | Household Size |
| Married-Couple | 3,464 (45.5%) | 3.13 |
| Single Male/Father | 477 (6.3%) | 3.16 |
| Single Female/Mother | 752 (9.9%) | 3.78 |
| Non-family | 2,914 (38.3%) | 1.13 |
| Total Households | 7,607 (100.0%) | 2.43 |
Household Size by Marriage Status in Fentress County
Out of a total of 7,607 households in Fentress County, 4,693 (61.7%) are family households, while 2,914 (38.3%) are nonfamily households. The most numerous type of family households are 2-person households, comprising 2,282, and the most common type of nonfamily households are 1-person households, comprising 2,609.
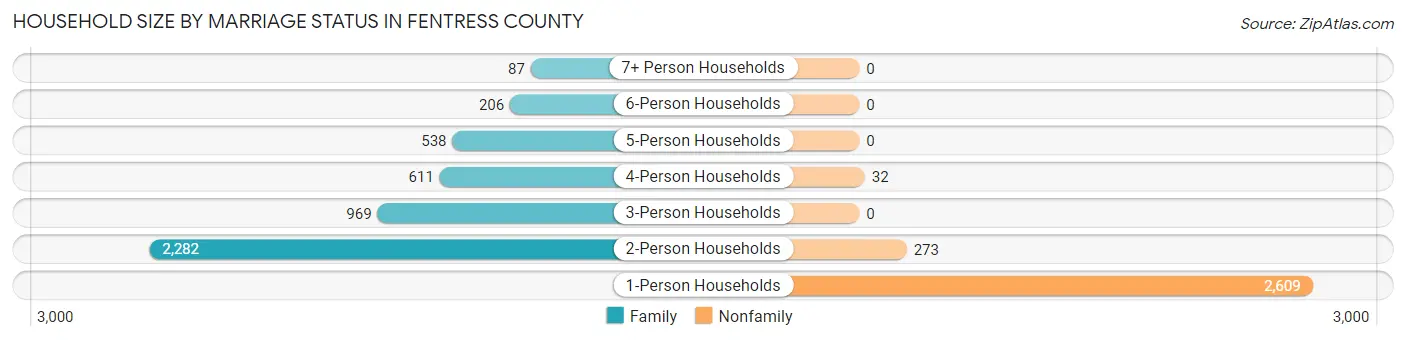
| Household Size | Family Households | Nonfamily Households |
| 1-Person Households | - | 2,609 (34.3%) |
| 2-Person Households | 2,282 (30.0%) | 273 (3.6%) |
| 3-Person Households | 969 (12.7%) | 0 (0.0%) |
| 4-Person Households | 611 (8.0%) | 32 (0.4%) |
| 5-Person Households | 538 (7.1%) | 0 (0.0%) |
| 6-Person Households | 206 (2.7%) | 0 (0.0%) |
| 7+ Person Households | 87 (1.1%) | 0 (0.0%) |
| Total | 4,693 (61.7%) | 2,914 (38.3%) |
Female Fertility in Fentress County
Fertility by Age in Fentress County
Average fertility rate in Fentress County is 50.0 births per 1,000 women. Women in the age bracket of 20 to 34 years have the highest fertility rate with 99.0 births per 1,000 women. Women in the age bracket of 20 to 34 years acount for 81.3% of all women with births.
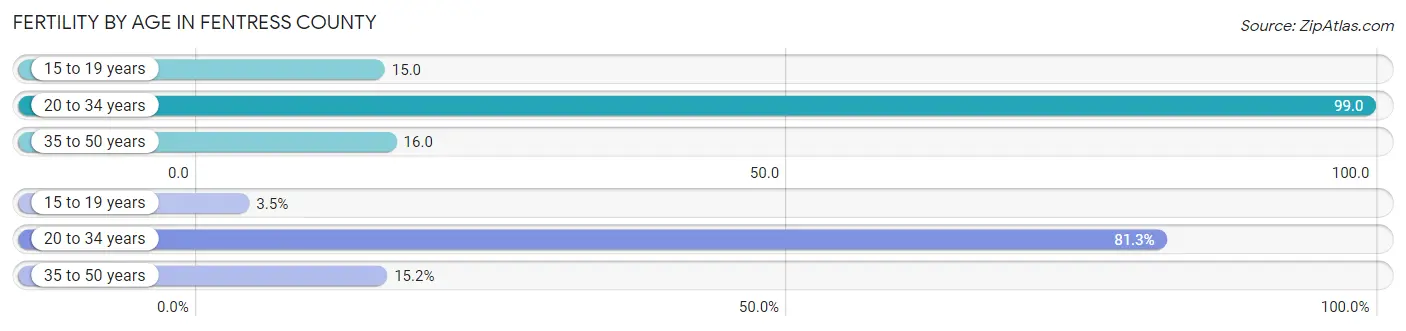
| Age Bracket | Women with Births | Births / 1,000 Women |
| 15 to 19 years | 6 (3.5%) | 15.0 |
| 20 to 34 years | 139 (81.3%) | 99.0 |
| 35 to 50 years | 26 (15.2%) | 16.0 |
| Total | 171 (100.0%) | 50.0 |
Fertility by Age by Marriage Status in Fentress County
94.2% of women with births (171) in Fentress County are married. The highest percentage of unmarried women with births falls into 15 to 19 years age bracket with 33.3% of them unmarried at the time of birth, while the lowest percentage of unmarried women with births belong to 35 to 50 years age bracket with 0.0% of them unmarried.
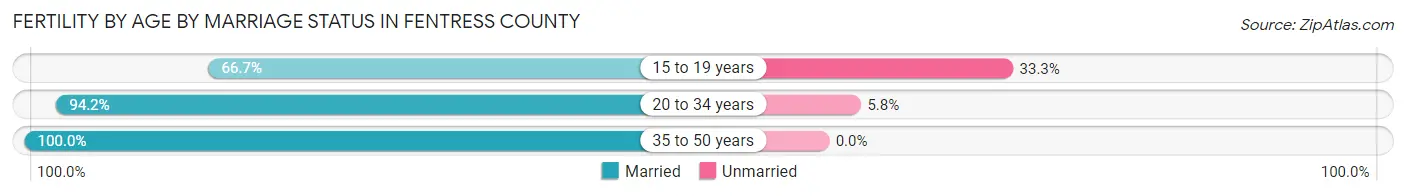
| Age Bracket | Married | Unmarried |
| 15 to 19 years | 4 (66.7%) | 2 (33.3%) |
| 20 to 34 years | 131 (94.2%) | 8 (5.8%) |
| 35 to 50 years | 26 (100.0%) | 0 (0.0%) |
| Total | 161 (94.2%) | 10 (5.9%) |
Fertility by Education in Fentress County
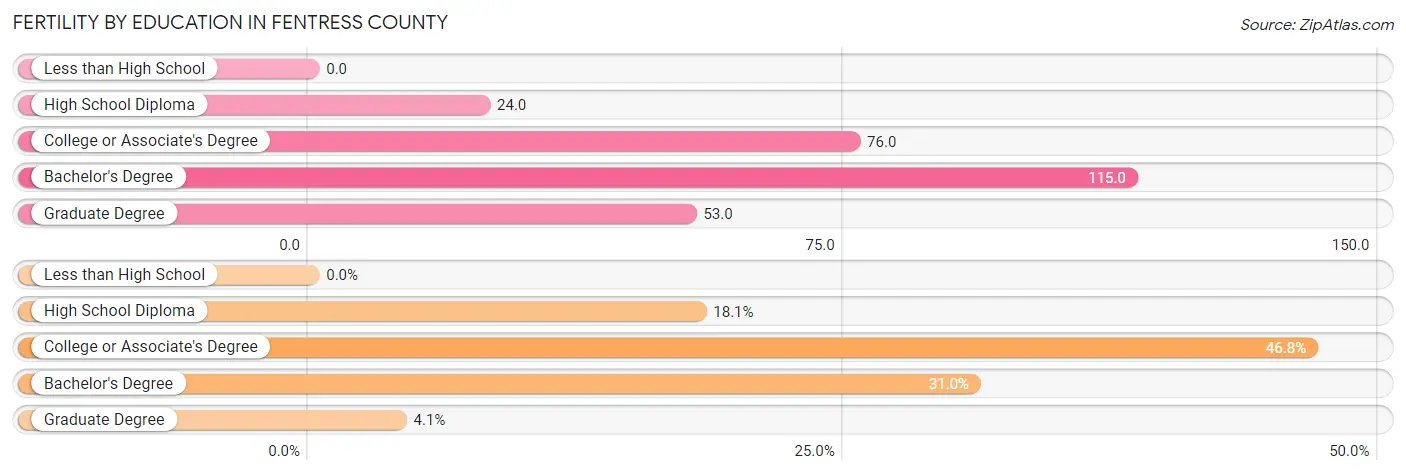
| Educational Attainment | Women with Births | Births / 1,000 Women |
| Less than High School | 0 (0.0%) | 0.0 |
| High School Diploma | 31 (18.1%) | 24.0 |
| College or Associate's Degree | 80 (46.8%) | 76.0 |
| Bachelor's Degree | 53 (31.0%) | 115.0 |
| Graduate Degree | 7 (4.1%) | 53.0 |
| Total | 171 (100.0%) | 50.0 |
Fertility by Education by Marriage Status in Fentress County
5.9% of women with births in Fentress County are unmarried. Women with the educational attainment of college or associate's degree are most likely to be married with 100.0% of them married at childbirth, while women with the educational attainment of high school diploma are least likely to be married with 32.3% of them unmarried at childbirth.
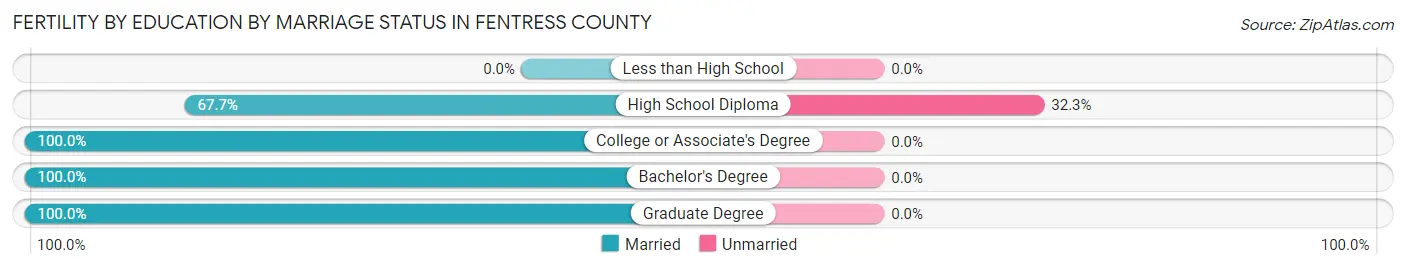
| Educational Attainment | Married | Unmarried |
| Less than High School | 0 (0.0%) | 0 (0.0%) |
| High School Diploma | 21 (67.7%) | 10 (32.3%) |
| College or Associate's Degree | 80 (100.0%) | 0 (0.0%) |
| Bachelor's Degree | 53 (100.0%) | 0 (0.0%) |
| Graduate Degree | 7 (100.0%) | 0 (0.0%) |
| Total | 161 (94.2%) | 10 (5.9%) |
Employment Characteristics in Fentress County
Employment by Class of Employer in Fentress County
Among the 7,127 employed individuals in Fentress County, private company employees (4,716 | 66.2%), self-employed (not incorporated) (834 | 11.7%), and local government employees (661 | 9.3%) make up the most common classes of employment.
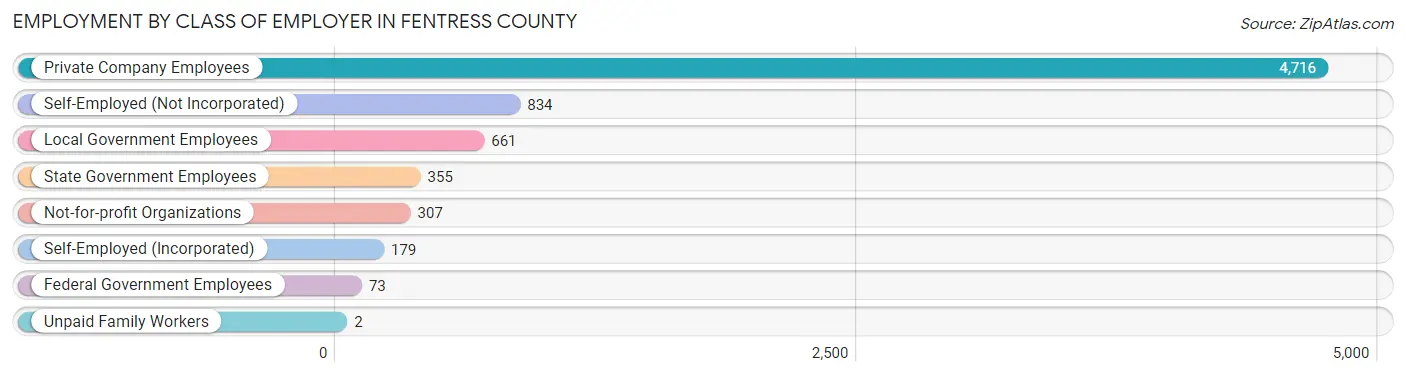
| Employer Class | # Employees | % Employees |
| Private Company Employees | 4,716 | 66.2% |
| Self-Employed (Incorporated) | 179 | 2.5% |
| Self-Employed (Not Incorporated) | 834 | 11.7% |
| Not-for-profit Organizations | 307 | 4.3% |
| Local Government Employees | 661 | 9.3% |
| State Government Employees | 355 | 5.0% |
| Federal Government Employees | 73 | 1.0% |
| Unpaid Family Workers | 2 | 0.0% |
| Total | 7,127 | 100.0% |
Employment Status by Age in Fentress County
According to the labor force statistics for Fentress County, out of the total population over 16 years of age (15,403), 49.5% or 7,624 individuals are in the labor force, with 5.3% or 404 of them unemployed. The age group with the highest labor force participation rate is 30 to 34 years, with 82.1% or 774 individuals in the labor force. Within the labor force, the 16 to 19 years age range has the highest percentage of unemployed individuals, with 37.9% or 237 of them being unemployed.
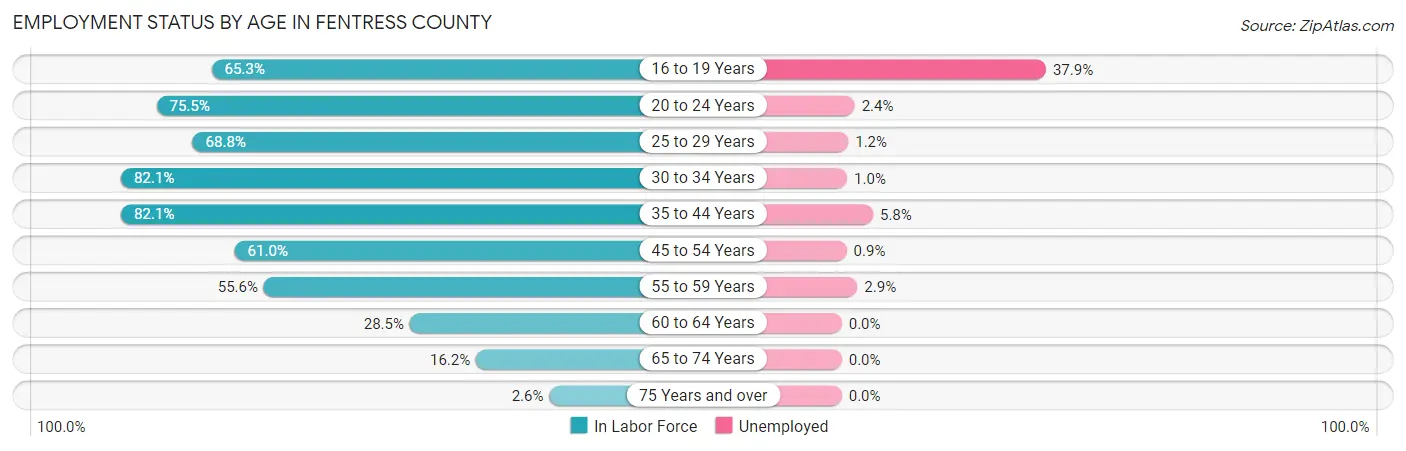
| Age Bracket | In Labor Force | Unemployed |
| 16 to 19 Years | 626 (65.3%) | 237 (37.9%) |
| 20 to 24 Years | 748 (75.5%) | 18 (2.4%) |
| 25 to 29 Years | 661 (68.8%) | 8 (1.2%) |
| 30 to 34 Years | 774 (82.1%) | 8 (1.0%) |
| 35 to 44 Years | 1,637 (82.1%) | 95 (5.8%) |
| 45 to 54 Years | 1,522 (61.0%) | 14 (0.9%) |
| 55 to 59 Years | 784 (55.6%) | 23 (2.9%) |
| 60 to 64 Years | 406 (28.5%) | 0 (0.0%) |
| 65 to 74 Years | 421 (16.2%) | 0 (0.0%) |
| 75 Years and over | 42 (2.6%) | 0 (0.0%) |
| Total | 7,624 (49.5%) | 404 (5.3%) |
Employment Status by Educational Attainment in Fentress County
According to labor force statistics for Fentress County, 62.7% of individuals (5,787) out of the total population between 25 and 64 years of age (9,229) are in the labor force, with 2.5% or 145 of them being unemployed. The group with the highest labor force participation rate are those with the educational attainment of bachelor's degree or higher, with 80.4% or 1,175 individuals in the labor force. Within the labor force, individuals with less than high school education have the highest percentage of unemployment, with 17.2% or 89 of them being unemployed.
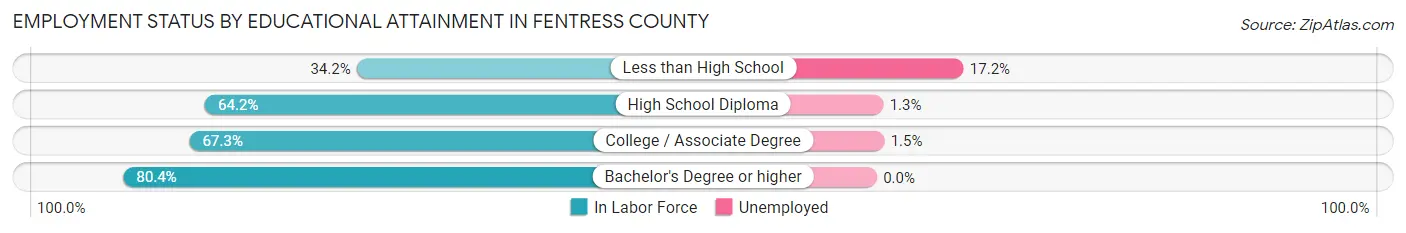
| Educational Attainment | In Labor Force | Unemployed |
| Less than High School | 516 (34.2%) | 260 (17.2%) |
| High School Diploma | 2,404 (64.2%) | 49 (1.3%) |
| College / Associate Degree | 1,691 (67.3%) | 38 (1.5%) |
| Bachelor's Degree or higher | 1,175 (80.4%) | 0 (0.0%) |
| Total | 5,787 (62.7%) | 231 (2.5%) |
Employment Occupations by Sex in Fentress County
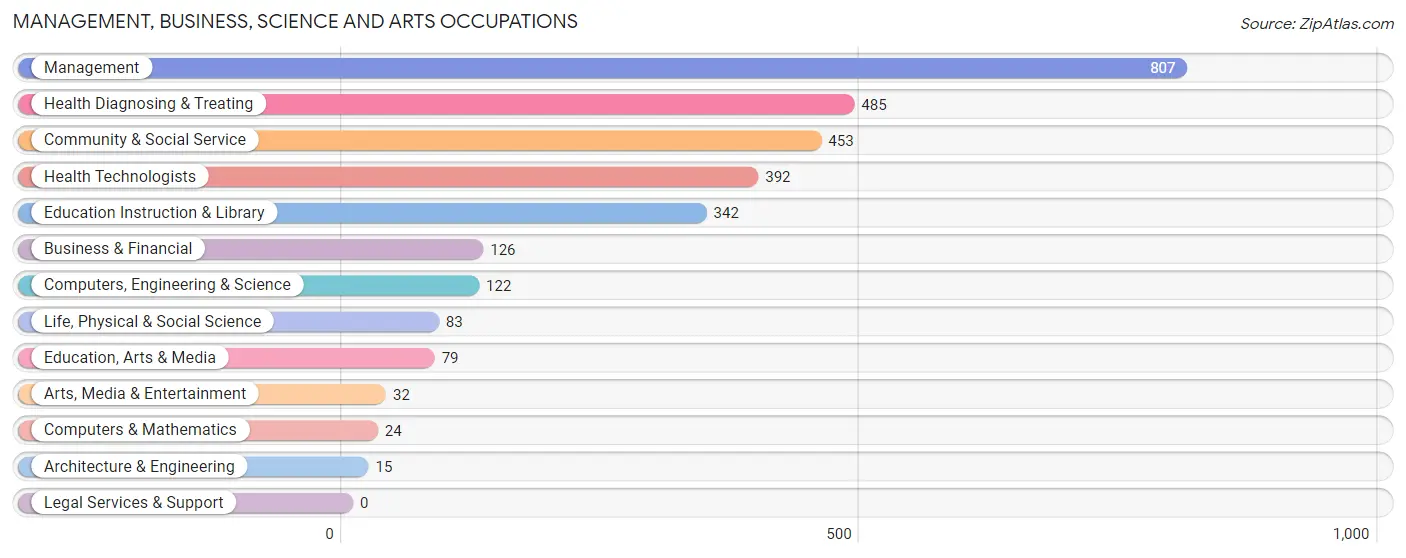
Management, Business, Science and Arts Occupations
The most common Management, Business, Science and Arts occupations in Fentress County are Management (807 | 11.2%), Health Diagnosing & Treating (485 | 6.7%), Community & Social Service (453 | 6.3%), Health Technologists (392 | 5.4%), and Education Instruction & Library (342 | 4.7%).
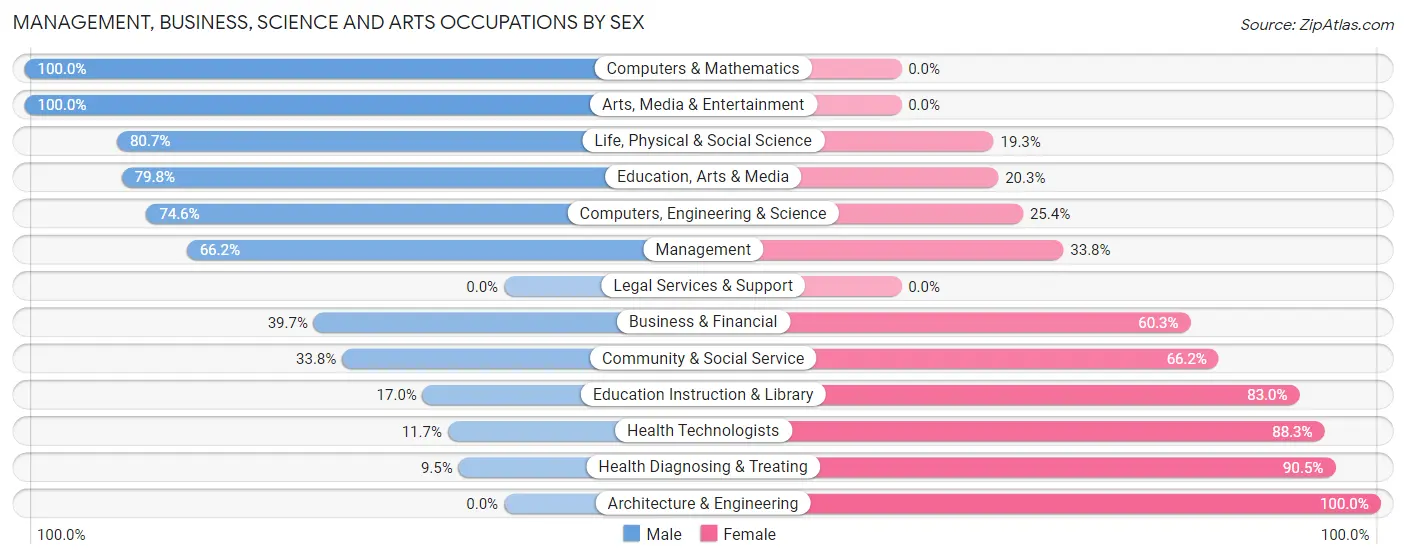
Management, Business, Science and Arts Occupations by Sex
Within the Management, Business, Science and Arts occupations in Fentress County, the most male-oriented occupations are Computers & Mathematics (100.0%), Arts, Media & Entertainment (100.0%), and Life, Physical & Social Science (80.7%), while the most female-oriented occupations are Architecture & Engineering (100.0%), Health Diagnosing & Treating (90.5%), and Health Technologists (88.3%).
| Occupation | Male | Female |
| Management | 534 (66.2%) | 273 (33.8%) |
| Business & Financial | 50 (39.7%) | 76 (60.3%) |
| Computers, Engineering & Science | 91 (74.6%) | 31 (25.4%) |
| Computers & Mathematics | 24 (100.0%) | 0 (0.0%) |
| Architecture & Engineering | 0 (0.0%) | 15 (100.0%) |
| Life, Physical & Social Science | 67 (80.7%) | 16 (19.3%) |
| Community & Social Service | 153 (33.8%) | 300 (66.2%) |
| Education, Arts & Media | 63 (79.7%) | 16 (20.3%) |
| Legal Services & Support | 0 (0.0%) | 0 (0.0%) |
| Education Instruction & Library | 58 (17.0%) | 284 (83.0%) |
| Arts, Media & Entertainment | 32 (100.0%) | 0 (0.0%) |
| Health Diagnosing & Treating | 46 (9.5%) | 439 (90.5%) |
| Health Technologists | 46 (11.7%) | 346 (88.3%) |
| Total (Category) | 874 (43.9%) | 1,119 (56.1%) |
| Total (Overall) | 3,945 (54.6%) | 3,278 (45.4%) |
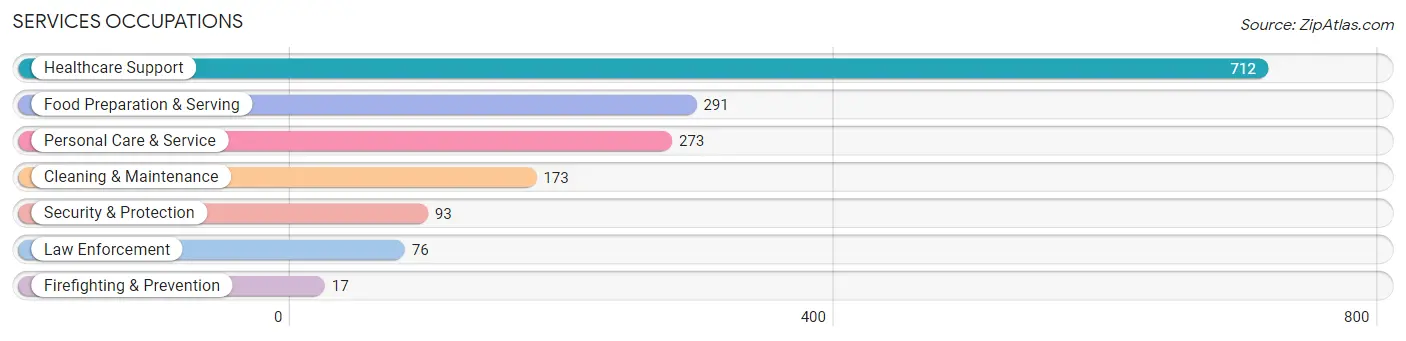
Services Occupations
The most common Services occupations in Fentress County are Healthcare Support (712 | 9.9%), Food Preparation & Serving (291 | 4.0%), Personal Care & Service (273 | 3.8%), Cleaning & Maintenance (173 | 2.4%), and Security & Protection (93 | 1.3%).
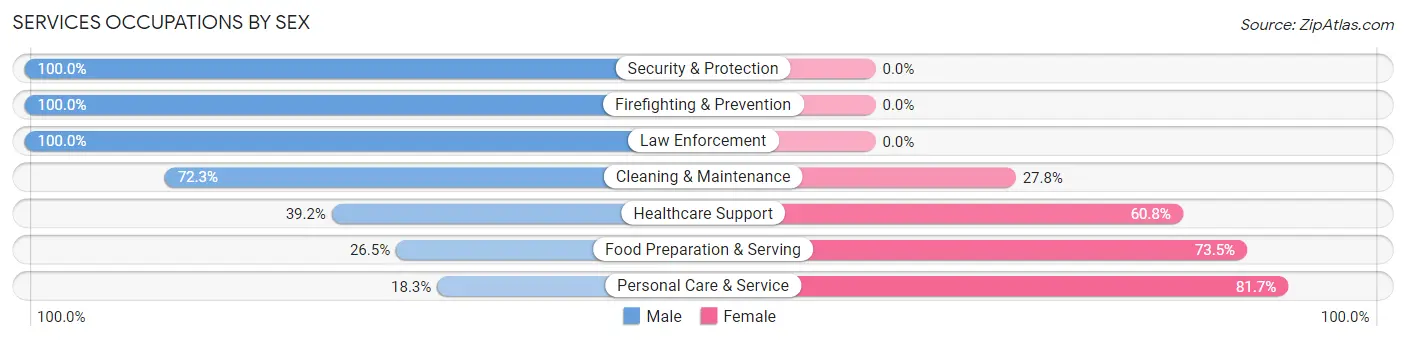
Services Occupations by Sex
Within the Services occupations in Fentress County, the most male-oriented occupations are Security & Protection (100.0%), Firefighting & Prevention (100.0%), and Law Enforcement (100.0%), while the most female-oriented occupations are Personal Care & Service (81.7%), Food Preparation & Serving (73.5%), and Healthcare Support (60.8%).
| Occupation | Male | Female |
| Healthcare Support | 279 (39.2%) | 433 (60.8%) |
| Security & Protection | 93 (100.0%) | 0 (0.0%) |
| Firefighting & Prevention | 17 (100.0%) | 0 (0.0%) |
| Law Enforcement | 76 (100.0%) | 0 (0.0%) |
| Food Preparation & Serving | 77 (26.5%) | 214 (73.5%) |
| Cleaning & Maintenance | 125 (72.3%) | 48 (27.8%) |
| Personal Care & Service | 50 (18.3%) | 223 (81.7%) |
| Total (Category) | 624 (40.5%) | 918 (59.5%) |
| Total (Overall) | 3,945 (54.6%) | 3,278 (45.4%) |
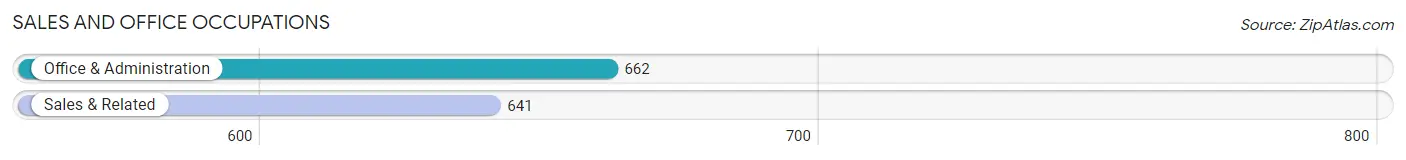
Sales and Office Occupations
The most common Sales and Office occupations in Fentress County are Office & Administration (662 | 9.2%), and Sales & Related (641 | 8.9%).
Sales and Office Occupations by Sex
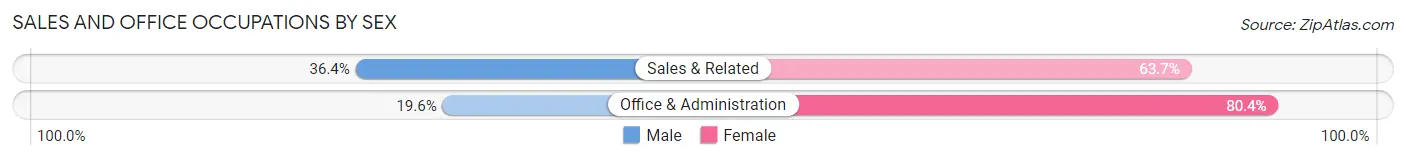
| Occupation | Male | Female |
| Sales & Related | 233 (36.3%) | 408 (63.6%) |
| Office & Administration | 130 (19.6%) | 532 (80.4%) |
| Total (Category) | 363 (27.9%) | 940 (72.1%) |
| Total (Overall) | 3,945 (54.6%) | 3,278 (45.4%) |
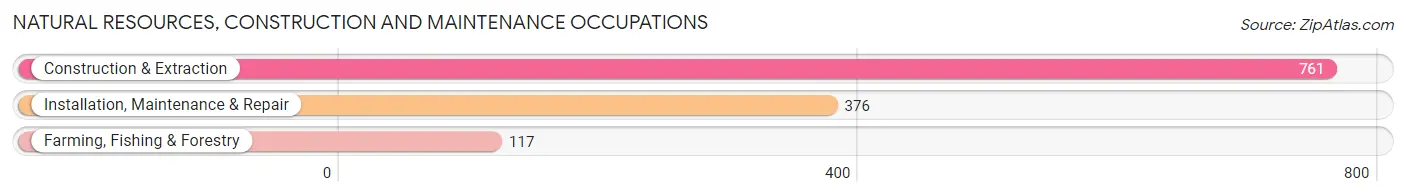
Natural Resources, Construction and Maintenance Occupations
The most common Natural Resources, Construction and Maintenance occupations in Fentress County are Construction & Extraction (761 | 10.5%), Installation, Maintenance & Repair (376 | 5.2%), and Farming, Fishing & Forestry (117 | 1.6%).
Natural Resources, Construction and Maintenance Occupations by Sex
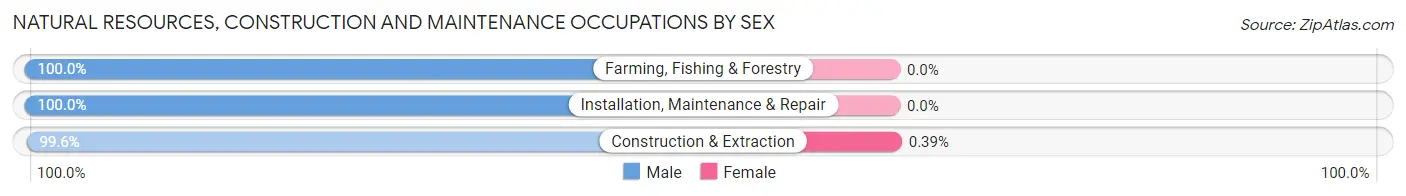
| Occupation | Male | Female |
| Farming, Fishing & Forestry | 117 (100.0%) | 0 (0.0%) |
| Construction & Extraction | 758 (99.6%) | 3 (0.4%) |
| Installation, Maintenance & Repair | 376 (100.0%) | 0 (0.0%) |
| Total (Category) | 1,251 (99.8%) | 3 (0.2%) |
| Total (Overall) | 3,945 (54.6%) | 3,278 (45.4%) |
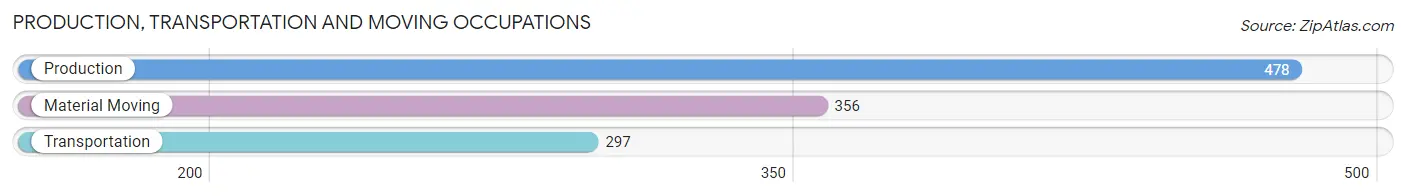
Production, Transportation and Moving Occupations
The most common Production, Transportation and Moving occupations in Fentress County are Production (478 | 6.6%), Material Moving (356 | 4.9%), and Transportation (297 | 4.1%).
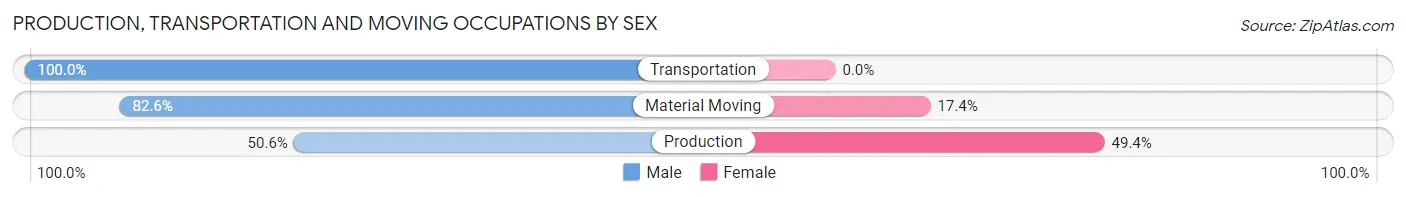
Production, Transportation and Moving Occupations by Sex
| Occupation | Male | Female |
| Production | 242 (50.6%) | 236 (49.4%) |
| Transportation | 297 (100.0%) | 0 (0.0%) |
| Material Moving | 294 (82.6%) | 62 (17.4%) |
| Total (Category) | 833 (73.7%) | 298 (26.4%) |
| Total (Overall) | 3,945 (54.6%) | 3,278 (45.4%) |
Employment Industries by Sex in Fentress County
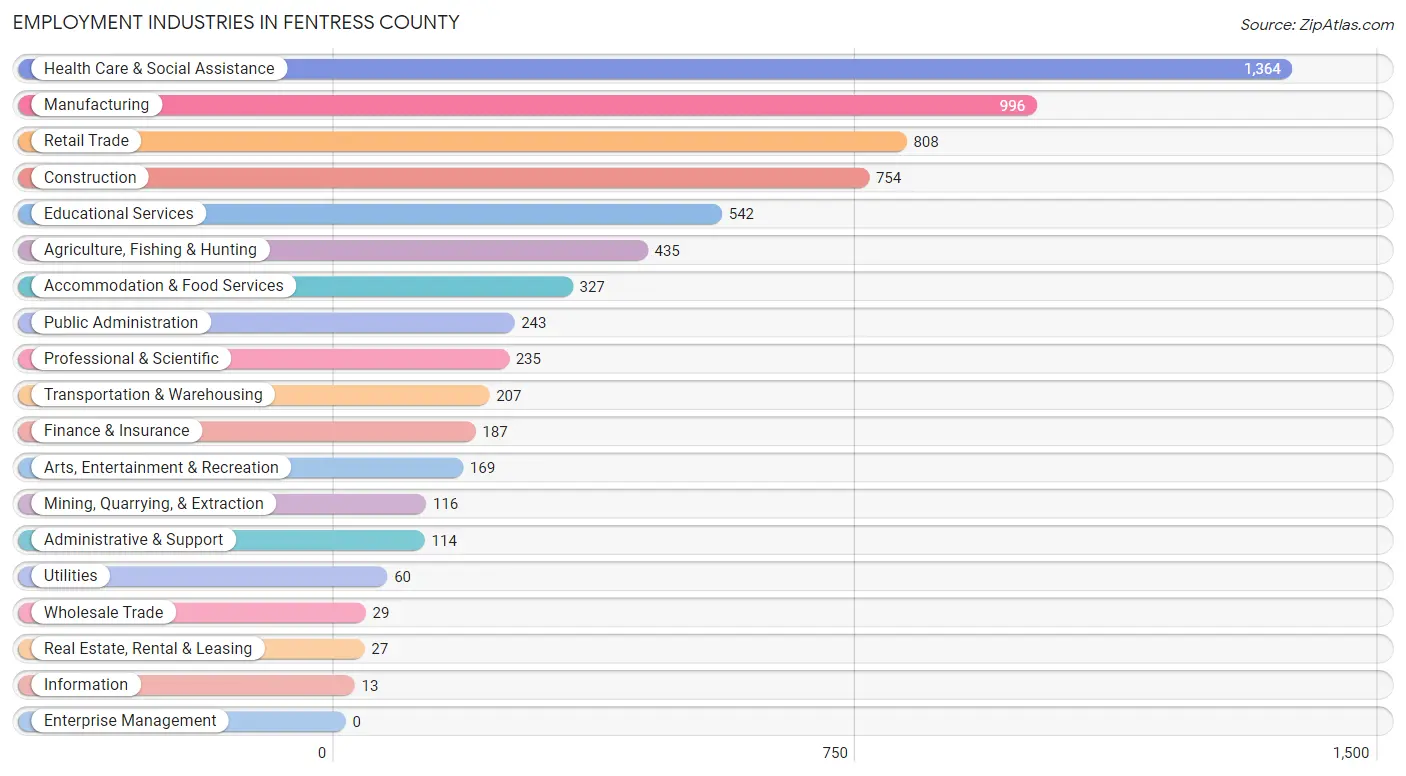
Employment Industries in Fentress County
The major employment industries in Fentress County include Health Care & Social Assistance (1,364 | 18.9%), Manufacturing (996 | 13.8%), Retail Trade (808 | 11.2%), Construction (754 | 10.4%), and Educational Services (542 | 7.5%).
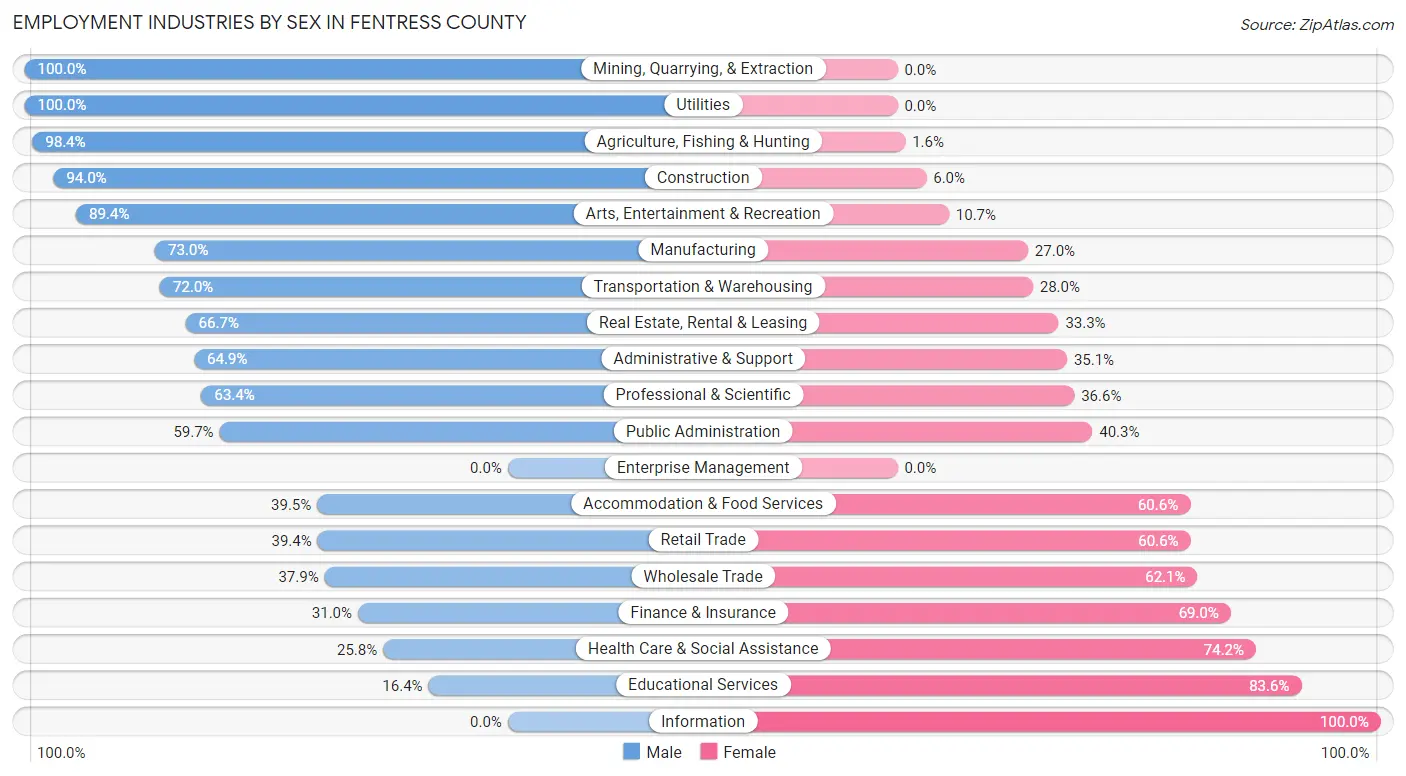
Employment Industries by Sex in Fentress County
The Fentress County industries that see more men than women are Mining, Quarrying, & Extraction (100.0%), Utilities (100.0%), and Agriculture, Fishing & Hunting (98.4%), whereas the industries that tend to have a higher number of women are Information (100.0%), Educational Services (83.6%), and Health Care & Social Assistance (74.2%).
| Industry | Male | Female |
| Agriculture, Fishing & Hunting | 428 (98.4%) | 7 (1.6%) |
| Mining, Quarrying, & Extraction | 116 (100.0%) | 0 (0.0%) |
| Construction | 709 (94.0%) | 45 (6.0%) |
| Manufacturing | 727 (73.0%) | 269 (27.0%) |
| Wholesale Trade | 11 (37.9%) | 18 (62.1%) |
| Retail Trade | 318 (39.4%) | 490 (60.6%) |
| Transportation & Warehousing | 149 (72.0%) | 58 (28.0%) |
| Utilities | 60 (100.0%) | 0 (0.0%) |
| Information | 0 (0.0%) | 13 (100.0%) |
| Finance & Insurance | 58 (31.0%) | 129 (69.0%) |
| Real Estate, Rental & Leasing | 18 (66.7%) | 9 (33.3%) |
| Professional & Scientific | 149 (63.4%) | 86 (36.6%) |
| Enterprise Management | 0 (0.0%) | 0 (0.0%) |
| Administrative & Support | 74 (64.9%) | 40 (35.1%) |
| Educational Services | 89 (16.4%) | 453 (83.6%) |
| Health Care & Social Assistance | 352 (25.8%) | 1,012 (74.2%) |
| Arts, Entertainment & Recreation | 151 (89.3%) | 18 (10.6%) |
| Accommodation & Food Services | 129 (39.5%) | 198 (60.6%) |
| Public Administration | 145 (59.7%) | 98 (40.3%) |
| Total | 3,945 (54.6%) | 3,278 (45.4%) |
Education in Fentress County
School Enrollment in Fentress County
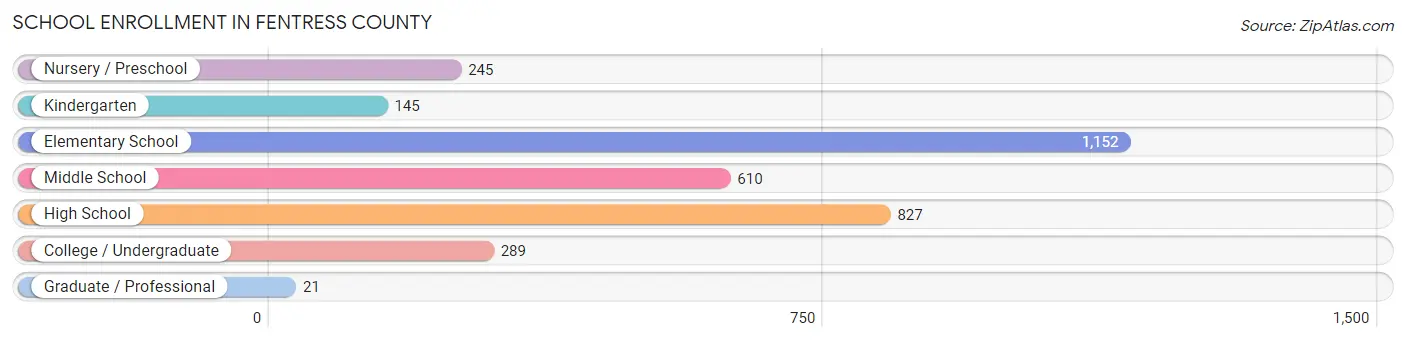
The most common levels of schooling among the 3,289 students in Fentress County are elementary school (1,152 | 35.0%), high school (827 | 25.1%), and middle school (610 | 18.5%).
| School Level | # Students | % Students |
| Nursery / Preschool | 245 | 7.4% |
| Kindergarten | 145 | 4.4% |
| Elementary School | 1,152 | 35.0% |
| Middle School | 610 | 18.5% |
| High School | 827 | 25.1% |
| College / Undergraduate | 289 | 8.8% |
| Graduate / Professional | 21 | 0.6% |
| Total | 3,289 | 100.0% |
School Enrollment by Age by Funding Source in Fentress County
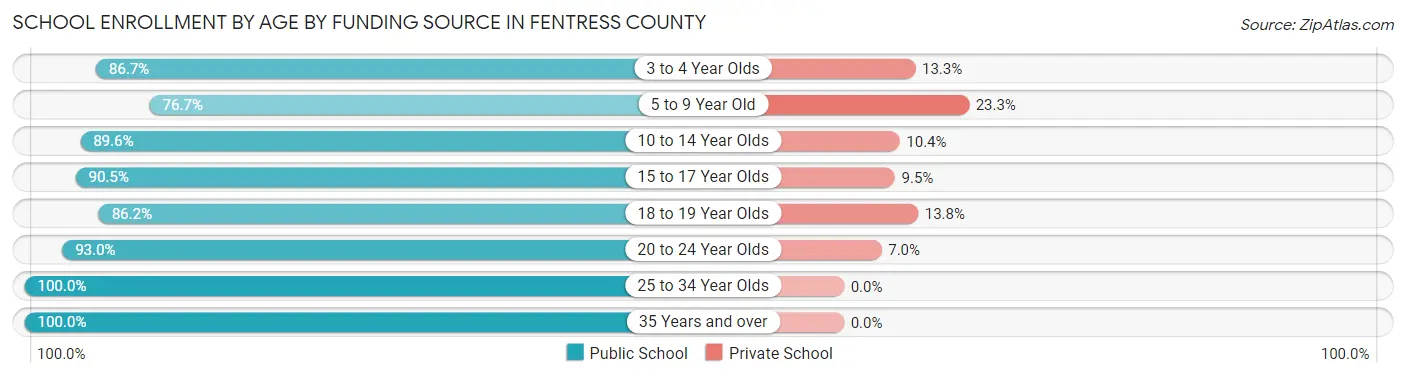
Out of a total of 3,289 students who are enrolled in schools in Fentress County, 490 (14.9%) attend a private institution, while the remaining 2,799 (85.1%) are enrolled in public schools. The age group of 5 to 9 year old has the highest likelihood of being enrolled in private schools, with 272 (23.3% in the age bracket) enrolled. Conversely, the age group of 25 to 34 year olds has the lowest likelihood of being enrolled in a private school, with 6 (100.0% in the age bracket) attending a public institution.
| Age Bracket | Public School | Private School |
| 3 to 4 Year Olds | 124 (86.7%) | 19 (13.3%) |
| 5 to 9 Year Old | 896 (76.7%) | 272 (23.3%) |
| 10 to 14 Year Olds | 830 (89.6%) | 96 (10.4%) |
| 15 to 17 Year Olds | 553 (90.5%) | 58 (9.5%) |
| 18 to 19 Year Olds | 206 (86.2%) | 33 (13.8%) |
| 20 to 24 Year Olds | 146 (93.0%) | 11 (7.0%) |
| 25 to 34 Year Olds | 6 (100.0%) | 0 (0.0%) |
| 35 Years and over | 39 (100.0%) | 0 (0.0%) |
| Total | 2,799 (85.1%) | 490 (14.9%) |
Educational Attainment by Field of Study in Fentress County
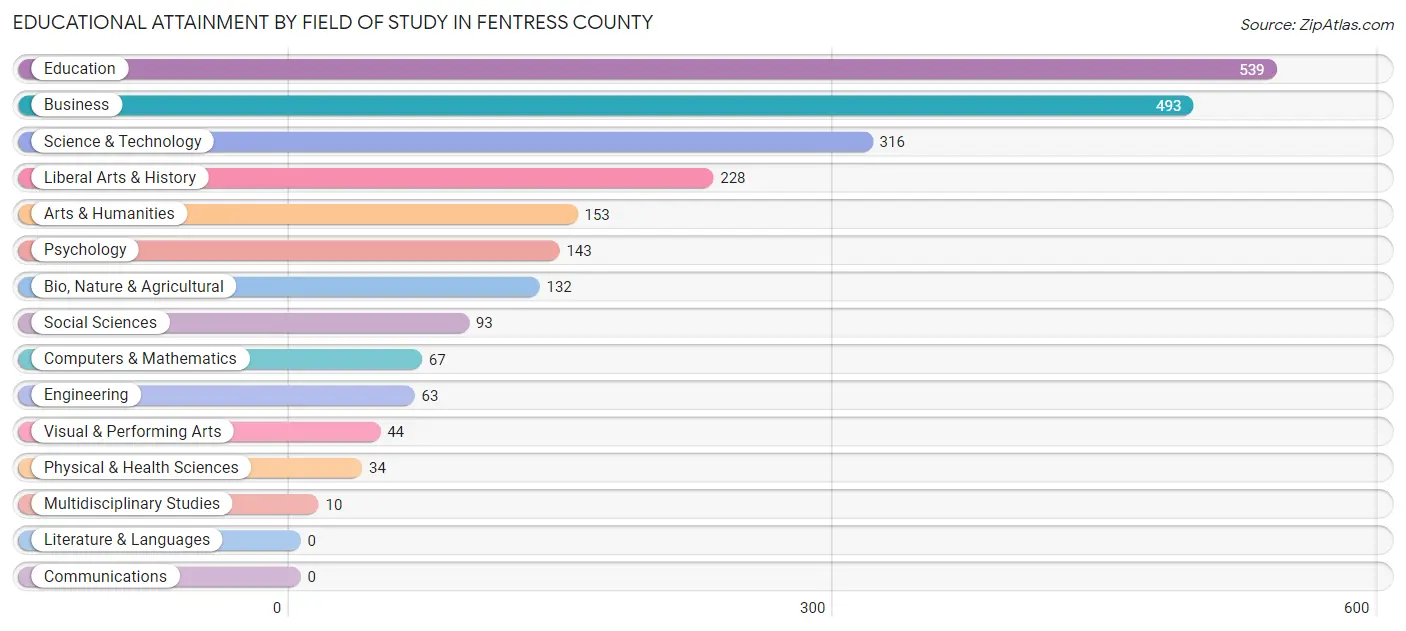
Education (539 | 23.3%), business (493 | 21.3%), science & technology (316 | 13.7%), liberal arts & history (228 | 9.9%), and arts & humanities (153 | 6.6%) are the most common fields of study among 2,315 individuals in Fentress County who have obtained a bachelor's degree or higher.
| Field of Study | # Graduates | % Graduates |
| Computers & Mathematics | 67 | 2.9% |
| Bio, Nature & Agricultural | 132 | 5.7% |
| Physical & Health Sciences | 34 | 1.5% |
| Psychology | 143 | 6.2% |
| Social Sciences | 93 | 4.0% |
| Engineering | 63 | 2.7% |
| Multidisciplinary Studies | 10 | 0.4% |
| Science & Technology | 316 | 13.7% |
| Business | 493 | 21.3% |
| Education | 539 | 23.3% |
| Literature & Languages | 0 | 0.0% |
| Liberal Arts & History | 228 | 9.9% |
| Visual & Performing Arts | 44 | 1.9% |
| Communications | 0 | 0.0% |
| Arts & Humanities | 153 | 6.6% |
| Total | 2,315 | 100.0% |
Transportation & Commute in Fentress County
Vehicle Availability by Sex in Fentress County
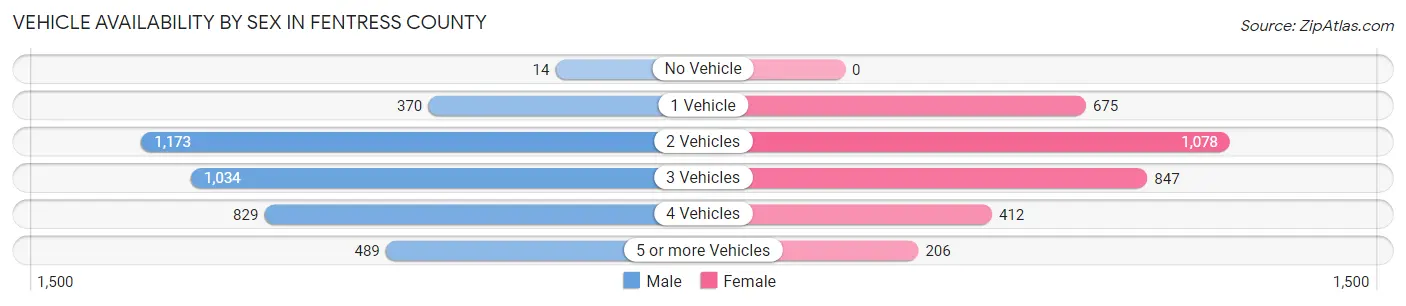
The most prevalent vehicle ownership categories in Fentress County are males with 2 vehicles (1,173, accounting for 30.0%) and females with 2 vehicles (1,078, making up 36.4%).
| Vehicles Available | Male | Female |
| No Vehicle | 14 (0.4%) | 0 (0.0%) |
| 1 Vehicle | 370 (9.5%) | 675 (21.0%) |
| 2 Vehicles | 1,173 (30.0%) | 1,078 (33.5%) |
| 3 Vehicles | 1,034 (26.5%) | 847 (26.3%) |
| 4 Vehicles | 829 (21.2%) | 412 (12.8%) |
| 5 or more Vehicles | 489 (12.5%) | 206 (6.4%) |
| Total | 3,909 (100.0%) | 3,218 (100.0%) |
Commute Time in Fentress County
The most frequently occuring commute durations in Fentress County are 10 to 14 minutes (1,405 commuters, 20.6%), 15 to 19 minutes (913 commuters, 13.4%), and 5 to 9 minutes (875 commuters, 12.8%).
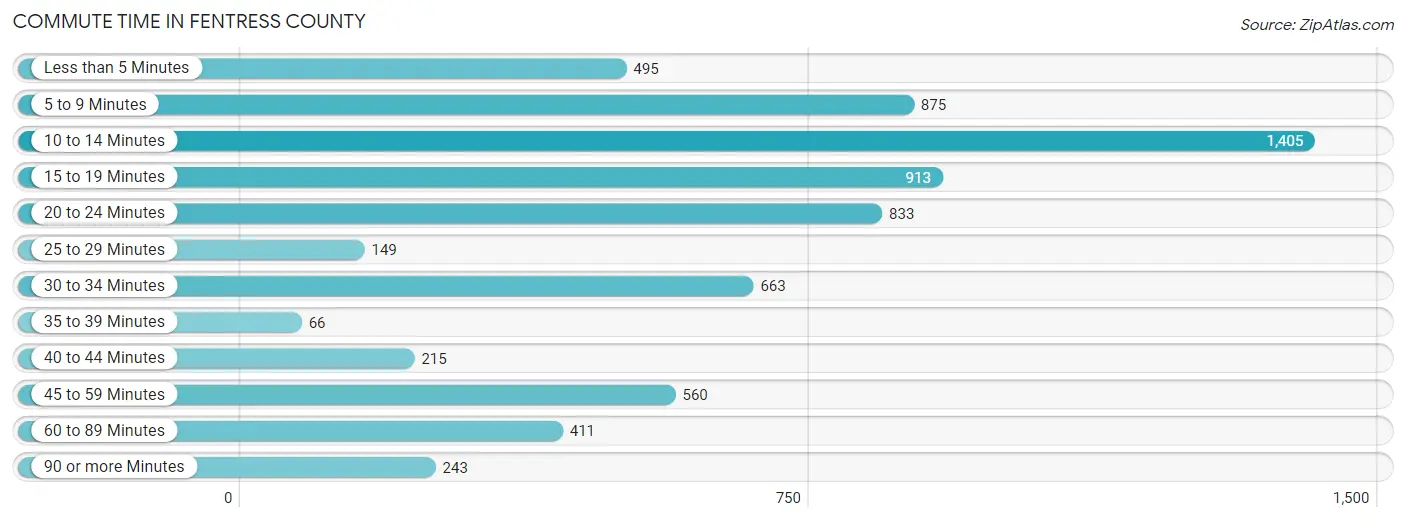
| Commute Time | # Commuters | % Commuters |
| Less than 5 Minutes | 495 | 7.2% |
| 5 to 9 Minutes | 875 | 12.8% |
| 10 to 14 Minutes | 1,405 | 20.6% |
| 15 to 19 Minutes | 913 | 13.4% |
| 20 to 24 Minutes | 833 | 12.2% |
| 25 to 29 Minutes | 149 | 2.2% |
| 30 to 34 Minutes | 663 | 9.7% |
| 35 to 39 Minutes | 66 | 1.0% |
| 40 to 44 Minutes | 215 | 3.2% |
| 45 to 59 Minutes | 560 | 8.2% |
| 60 to 89 Minutes | 411 | 6.0% |
| 90 or more Minutes | 243 | 3.6% |
Commute Time by Sex in Fentress County
The most common commute times in Fentress County are 10 to 14 minutes (838 commuters, 22.1%) for males and 10 to 14 minutes (567 commuters, 18.7%) for females.
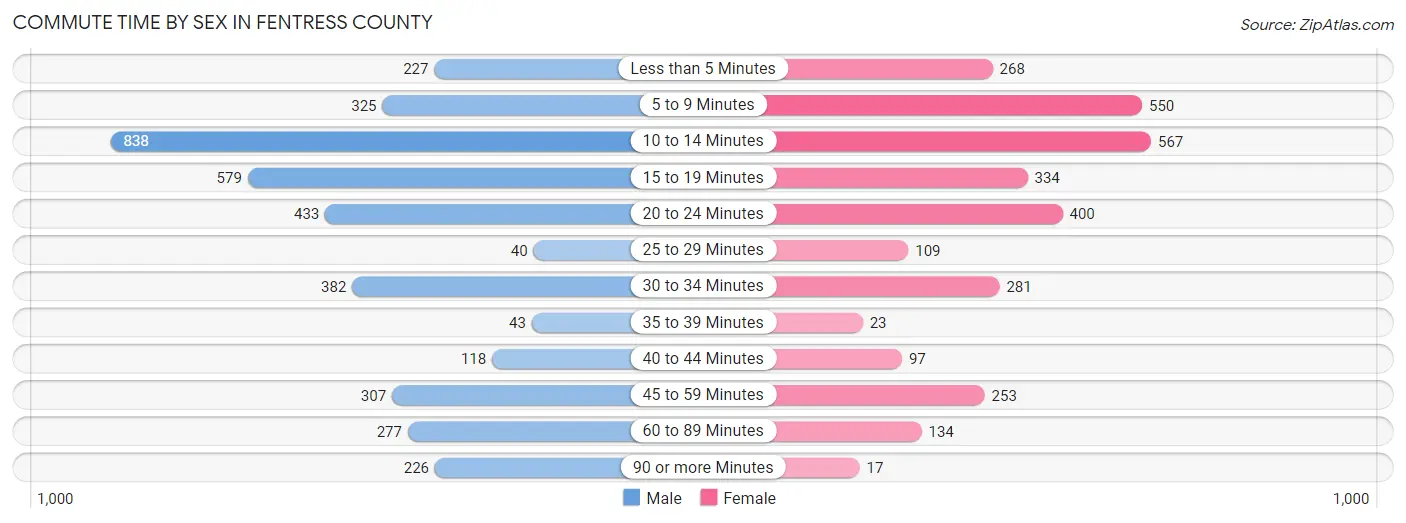
| Commute Time | Male | Female |
| Less than 5 Minutes | 227 (6.0%) | 268 (8.8%) |
| 5 to 9 Minutes | 325 (8.6%) | 550 (18.1%) |
| 10 to 14 Minutes | 838 (22.1%) | 567 (18.7%) |
| 15 to 19 Minutes | 579 (15.3%) | 334 (11.0%) |
| 20 to 24 Minutes | 433 (11.4%) | 400 (13.2%) |
| 25 to 29 Minutes | 40 (1.1%) | 109 (3.6%) |
| 30 to 34 Minutes | 382 (10.1%) | 281 (9.3%) |
| 35 to 39 Minutes | 43 (1.1%) | 23 (0.8%) |
| 40 to 44 Minutes | 118 (3.1%) | 97 (3.2%) |
| 45 to 59 Minutes | 307 (8.1%) | 253 (8.3%) |
| 60 to 89 Minutes | 277 (7.3%) | 134 (4.4%) |
| 90 or more Minutes | 226 (6.0%) | 17 (0.6%) |
Time of Departure to Work by Sex in Fentress County
The most frequent times of departure to work in Fentress County are 6:00 AM to 6:29 AM (504, 13.3%) for males and 7:30 AM to 7:59 AM (637, 21.0%) for females.
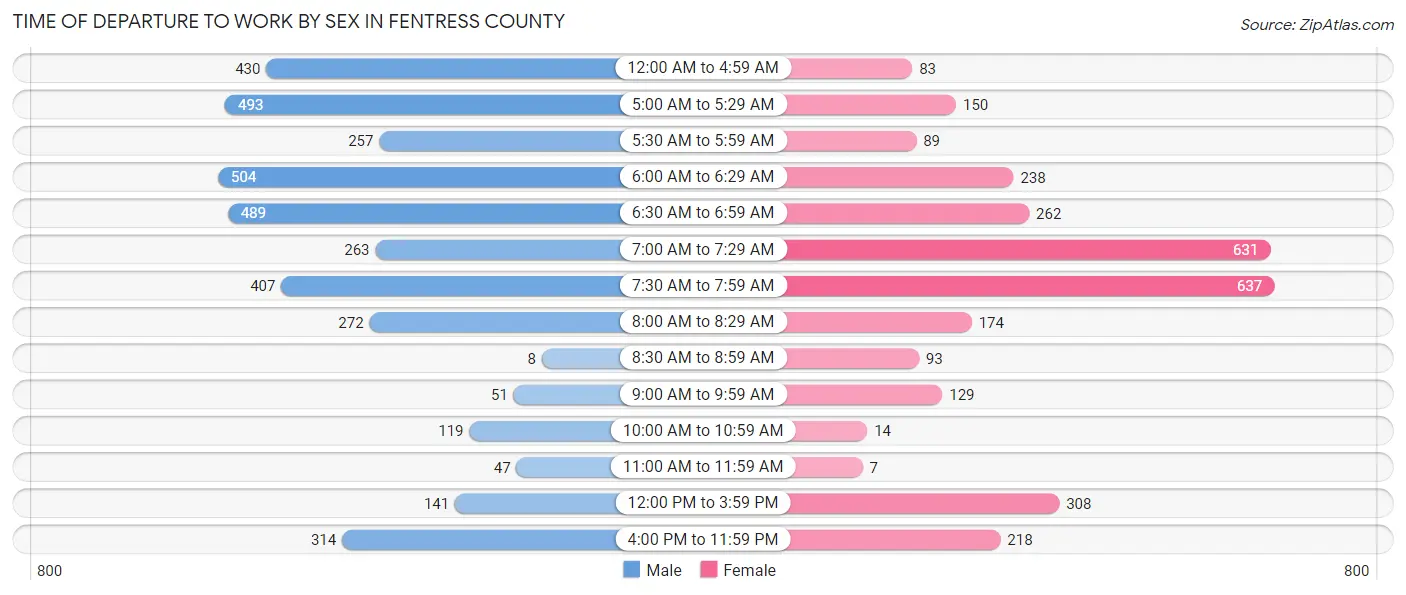
| Time of Departure | Male | Female |
| 12:00 AM to 4:59 AM | 430 (11.3%) | 83 (2.7%) |
| 5:00 AM to 5:29 AM | 493 (13.0%) | 150 (5.0%) |
| 5:30 AM to 5:59 AM | 257 (6.8%) | 89 (2.9%) |
| 6:00 AM to 6:29 AM | 504 (13.3%) | 238 (7.9%) |
| 6:30 AM to 6:59 AM | 489 (12.9%) | 262 (8.6%) |
| 7:00 AM to 7:29 AM | 263 (6.9%) | 631 (20.8%) |
| 7:30 AM to 7:59 AM | 407 (10.7%) | 637 (21.0%) |
| 8:00 AM to 8:29 AM | 272 (7.2%) | 174 (5.7%) |
| 8:30 AM to 8:59 AM | 8 (0.2%) | 93 (3.1%) |
| 9:00 AM to 9:59 AM | 51 (1.3%) | 129 (4.3%) |
| 10:00 AM to 10:59 AM | 119 (3.1%) | 14 (0.5%) |
| 11:00 AM to 11:59 AM | 47 (1.2%) | 7 (0.2%) |
| 12:00 PM to 3:59 PM | 141 (3.7%) | 308 (10.2%) |
| 4:00 PM to 11:59 PM | 314 (8.3%) | 218 (7.2%) |
| Total | 3,795 (100.0%) | 3,033 (100.0%) |
Housing Occupancy in Fentress County
Occupancy by Ownership in Fentress County
Of the total 7,607 dwellings in Fentress County, owner-occupied units account for 5,885 (77.4%), while renter-occupied units make up 1,722 (22.6%).
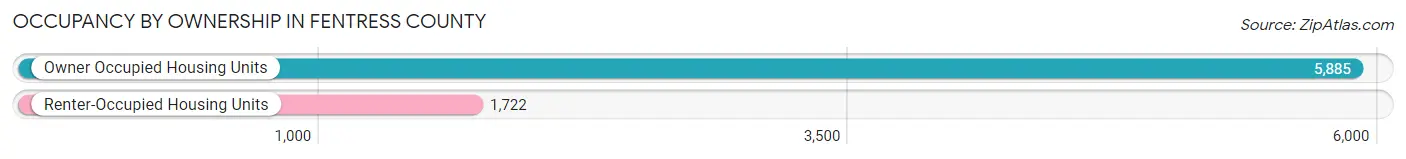
| Occupancy | # Housing Units | % Housing Units |
| Owner Occupied Housing Units | 5,885 | 77.4% |
| Renter-Occupied Housing Units | 1,722 | 22.6% |
| Total Occupied Housing Units | 7,607 | 100.0% |
Occupancy by Household Size in Fentress County
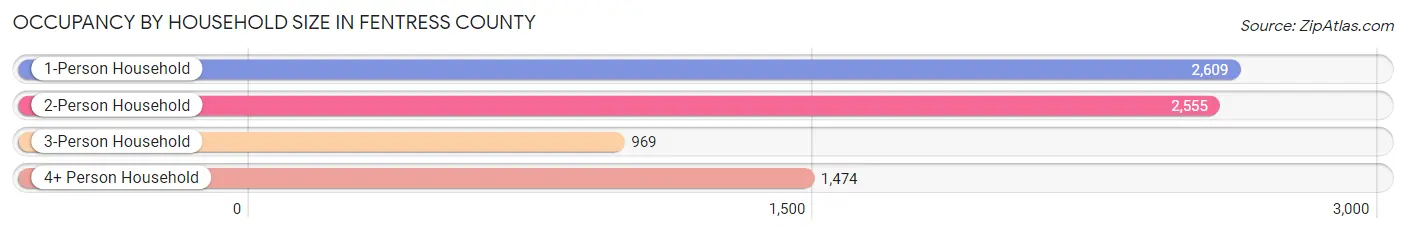
| Household Size | # Housing Units | % Housing Units |
| 1-Person Household | 2,609 | 34.3% |
| 2-Person Household | 2,555 | 33.6% |
| 3-Person Household | 969 | 12.7% |
| 4+ Person Household | 1,474 | 19.4% |
| Total Housing Units | 7,607 | 100.0% |
Occupancy by Ownership by Household Size in Fentress County
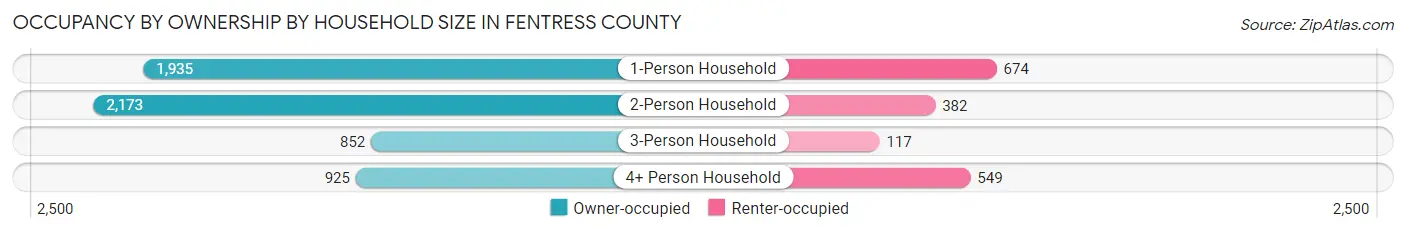
| Household Size | Owner-occupied | Renter-occupied |
| 1-Person Household | 1,935 (74.2%) | 674 (25.8%) |
| 2-Person Household | 2,173 (85.1%) | 382 (14.9%) |
| 3-Person Household | 852 (87.9%) | 117 (12.1%) |
| 4+ Person Household | 925 (62.7%) | 549 (37.2%) |
| Total Housing Units | 5,885 (77.4%) | 1,722 (22.6%) |
Occupancy by Educational Attainment in Fentress County
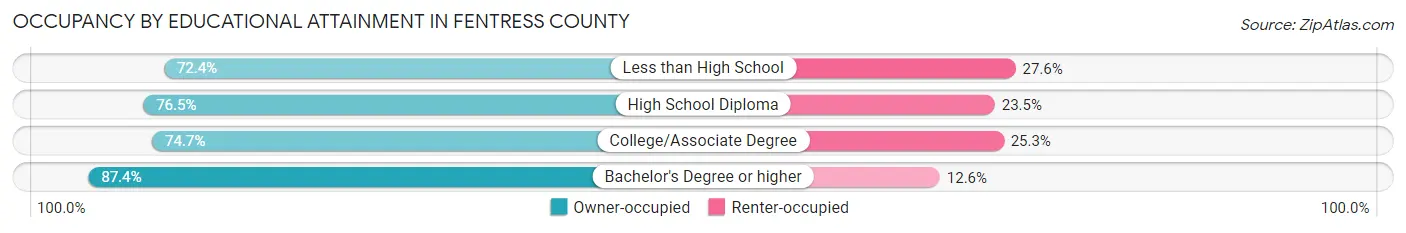
| Household Size | Owner-occupied | Renter-occupied |
| Less than High School | 964 (72.4%) | 368 (27.6%) |
| High School Diploma | 2,127 (76.5%) | 654 (23.5%) |
| College/Associate Degree | 1,528 (74.7%) | 517 (25.3%) |
| Bachelor's Degree or higher | 1,266 (87.4%) | 183 (12.6%) |
Occupancy by Age of Householder in Fentress County
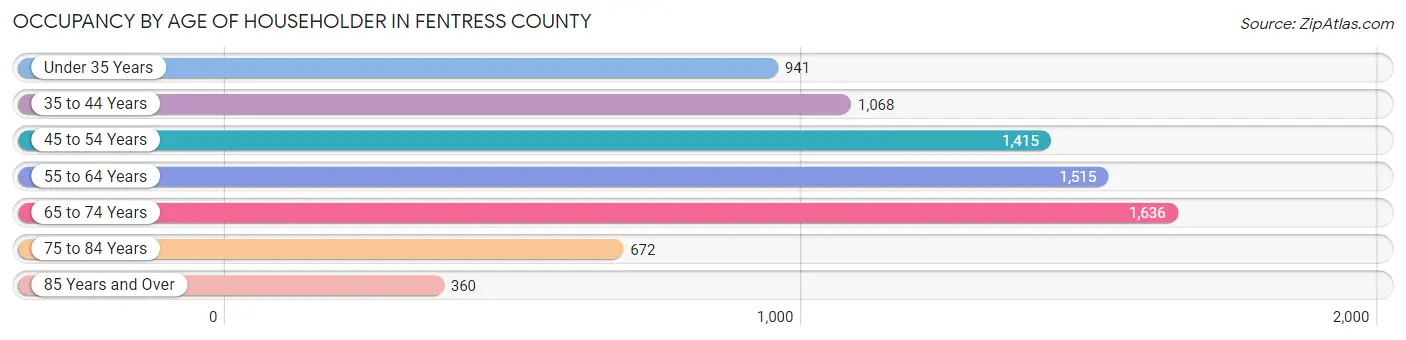
| Age Bracket | # Households | % Households |
| Under 35 Years | 941 | 12.4% |
| 35 to 44 Years | 1,068 | 14.0% |
| 45 to 54 Years | 1,415 | 18.6% |
| 55 to 64 Years | 1,515 | 19.9% |
| 65 to 74 Years | 1,636 | 21.5% |
| 75 to 84 Years | 672 | 8.8% |
| 85 Years and Over | 360 | 4.7% |
| Total | 7,607 | 100.0% |
Housing Finances in Fentress County
Median Income by Occupancy in Fentress County
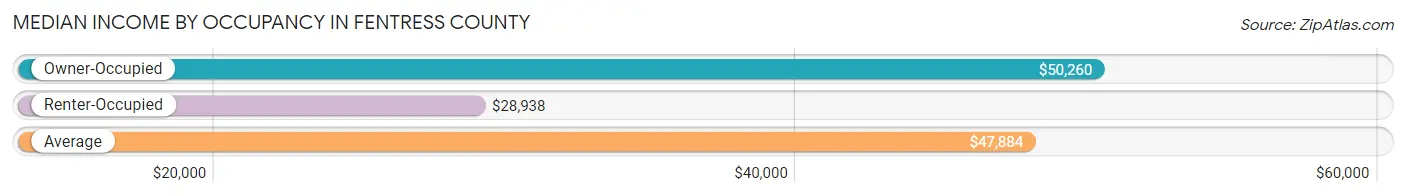
| Occupancy Type | # Households | Median Income |
| Owner-Occupied | 5,885 (77.4%) | $50,260 |
| Renter-Occupied | 1,722 (22.6%) | $28,938 |
| Average | 7,607 (100.0%) | $47,884 |
Occupancy by Householder Income Bracket in Fentress County
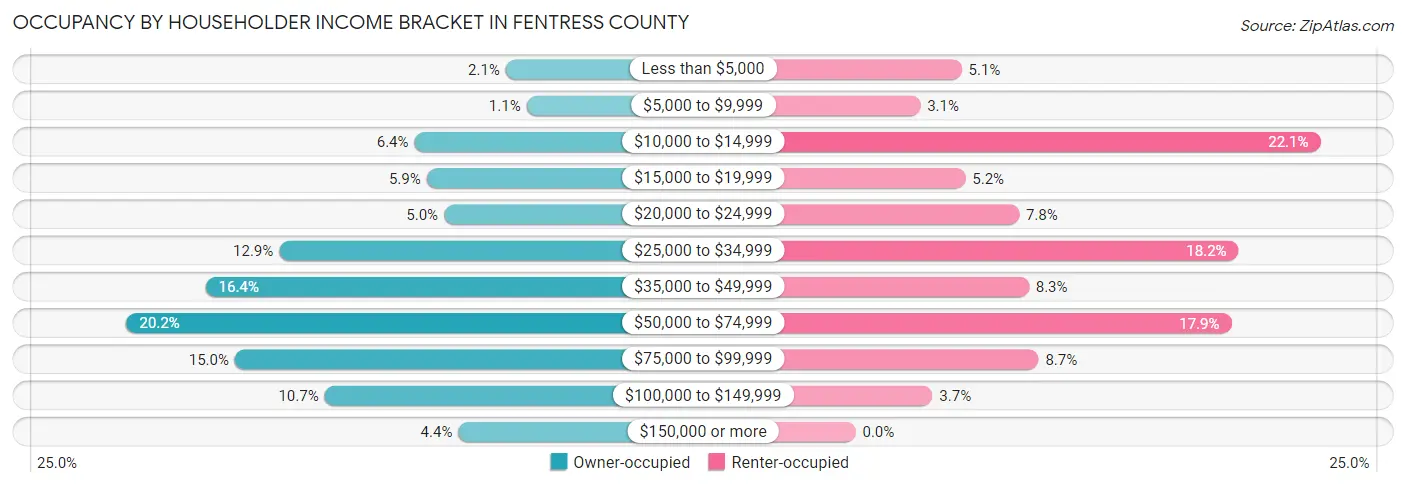
| Income Bracket | Owner-occupied | Renter-occupied |
| Less than $5,000 | 123 (2.1%) | 87 (5.1%) |
| $5,000 to $9,999 | 65 (1.1%) | 53 (3.1%) |
| $10,000 to $14,999 | 379 (6.4%) | 381 (22.1%) |
| $15,000 to $19,999 | 345 (5.9%) | 90 (5.2%) |
| $20,000 to $24,999 | 296 (5.0%) | 134 (7.8%) |
| $25,000 to $34,999 | 758 (12.9%) | 314 (18.2%) |
| $35,000 to $49,999 | 964 (16.4%) | 142 (8.3%) |
| $50,000 to $74,999 | 1,186 (20.2%) | 308 (17.9%) |
| $75,000 to $99,999 | 882 (15.0%) | 150 (8.7%) |
| $100,000 to $149,999 | 631 (10.7%) | 63 (3.7%) |
| $150,000 or more | 256 (4.3%) | 0 (0.0%) |
| Total | 5,885 (100.0%) | 1,722 (100.0%) |
Monthly Housing Cost Tiers in Fentress County
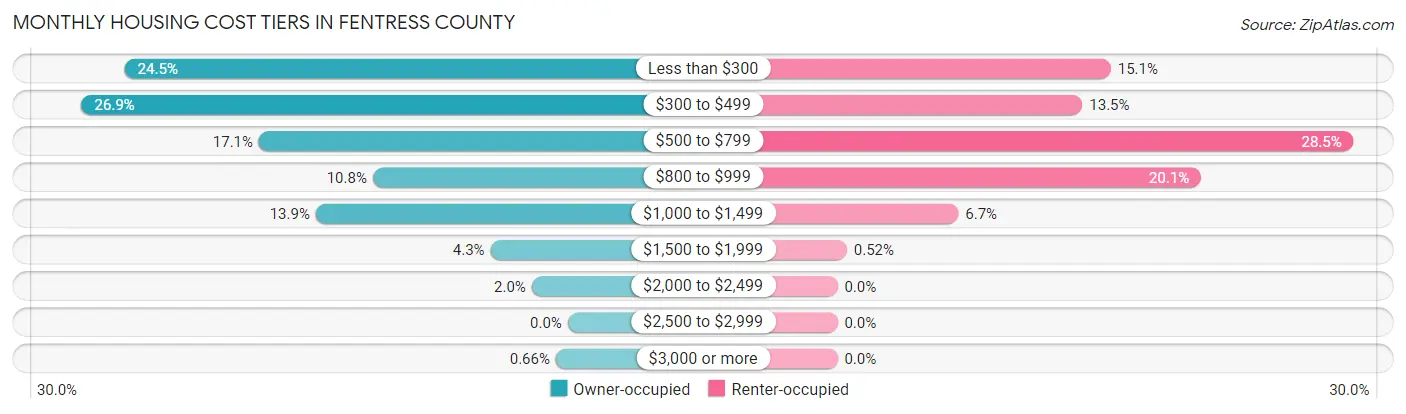
| Monthly Cost | Owner-occupied | Renter-occupied |
| Less than $300 | 1,440 (24.5%) | 260 (15.1%) |
| $300 to $499 | 1,581 (26.9%) | 233 (13.5%) |
| $500 to $799 | 1,004 (17.1%) | 491 (28.5%) |
| $800 to $999 | 634 (10.8%) | 346 (20.1%) |
| $1,000 to $1,499 | 819 (13.9%) | 115 (6.7%) |
| $1,500 to $1,999 | 251 (4.3%) | 9 (0.5%) |
| $2,000 to $2,499 | 117 (2.0%) | 0 (0.0%) |
| $2,500 to $2,999 | 0 (0.0%) | 0 (0.0%) |
| $3,000 or more | 39 (0.7%) | 0 (0.0%) |
| Total | 5,885 (100.0%) | 1,722 (100.0%) |
Physical Housing Characteristics in Fentress County
Housing Structures in Fentress County
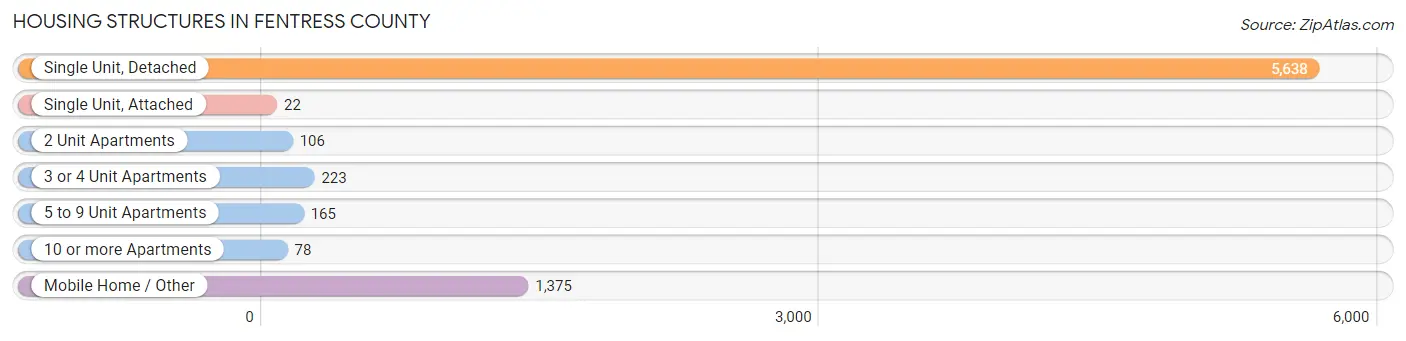
| Structure Type | # Housing Units | % Housing Units |
| Single Unit, Detached | 5,638 | 74.1% |
| Single Unit, Attached | 22 | 0.3% |
| 2 Unit Apartments | 106 | 1.4% |
| 3 or 4 Unit Apartments | 223 | 2.9% |
| 5 to 9 Unit Apartments | 165 | 2.2% |
| 10 or more Apartments | 78 | 1.0% |
| Mobile Home / Other | 1,375 | 18.1% |
| Total | 7,607 | 100.0% |
Housing Structures by Occupancy in Fentress County
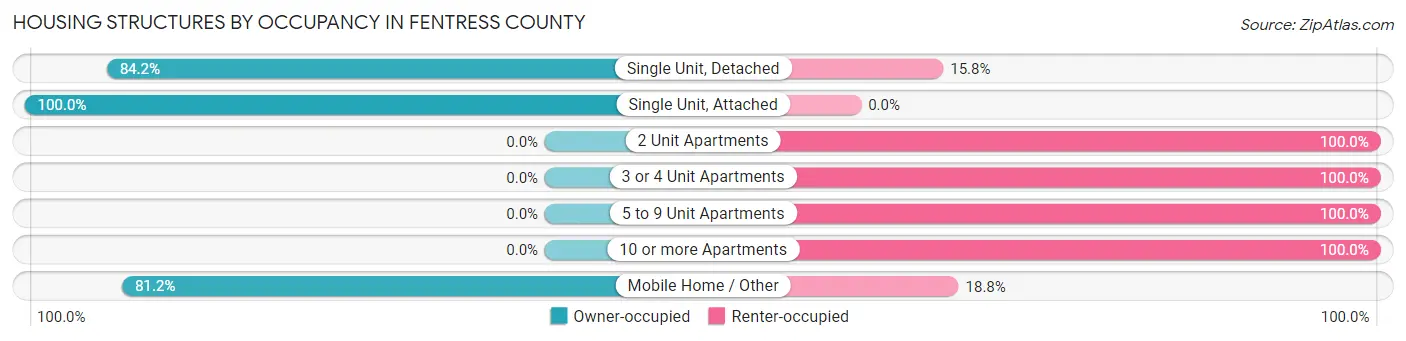
| Structure Type | Owner-occupied | Renter-occupied |
| Single Unit, Detached | 4,746 (84.2%) | 892 (15.8%) |
| Single Unit, Attached | 22 (100.0%) | 0 (0.0%) |
| 2 Unit Apartments | 0 (0.0%) | 106 (100.0%) |
| 3 or 4 Unit Apartments | 0 (0.0%) | 223 (100.0%) |
| 5 to 9 Unit Apartments | 0 (0.0%) | 165 (100.0%) |
| 10 or more Apartments | 0 (0.0%) | 78 (100.0%) |
| Mobile Home / Other | 1,117 (81.2%) | 258 (18.8%) |
| Total | 5,885 (77.4%) | 1,722 (22.6%) |
Housing Structures by Number of Rooms in Fentress County
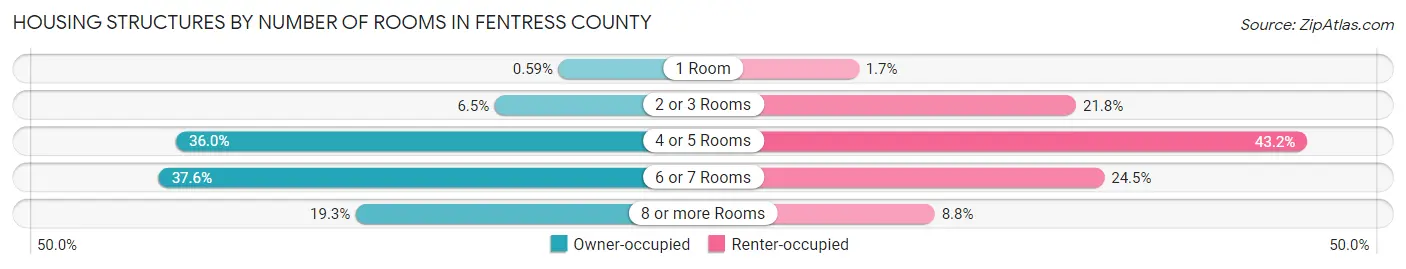
| Number of Rooms | Owner-occupied | Renter-occupied |
| 1 Room | 35 (0.6%) | 30 (1.7%) |
| 2 or 3 Rooms | 382 (6.5%) | 376 (21.8%) |
| 4 or 5 Rooms | 2,118 (36.0%) | 744 (43.2%) |
| 6 or 7 Rooms | 2,212 (37.6%) | 421 (24.4%) |
| 8 or more Rooms | 1,138 (19.3%) | 151 (8.8%) |
| Total | 5,885 (100.0%) | 1,722 (100.0%) |
Housing Structure by Heating Type in Fentress County
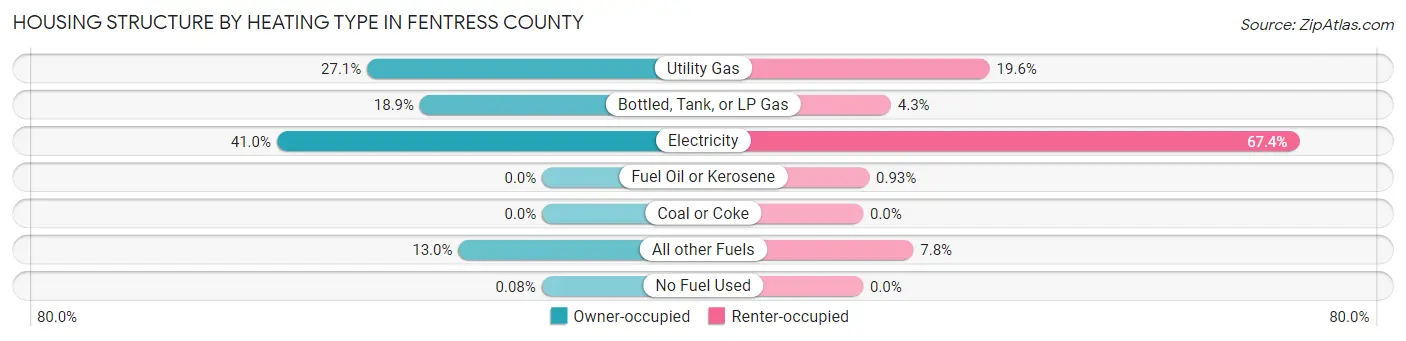
| Heating Type | Owner-occupied | Renter-occupied |
| Utility Gas | 1,592 (27.1%) | 337 (19.6%) |
| Bottled, Tank, or LP Gas | 1,112 (18.9%) | 74 (4.3%) |
| Electricity | 2,414 (41.0%) | 1,161 (67.4%) |
| Fuel Oil or Kerosene | 0 (0.0%) | 16 (0.9%) |
| Coal or Coke | 0 (0.0%) | 0 (0.0%) |
| All other Fuels | 762 (13.0%) | 134 (7.8%) |
| No Fuel Used | 5 (0.1%) | 0 (0.0%) |
| Total | 5,885 (100.0%) | 1,722 (100.0%) |
Household Vehicle Usage in Fentress County
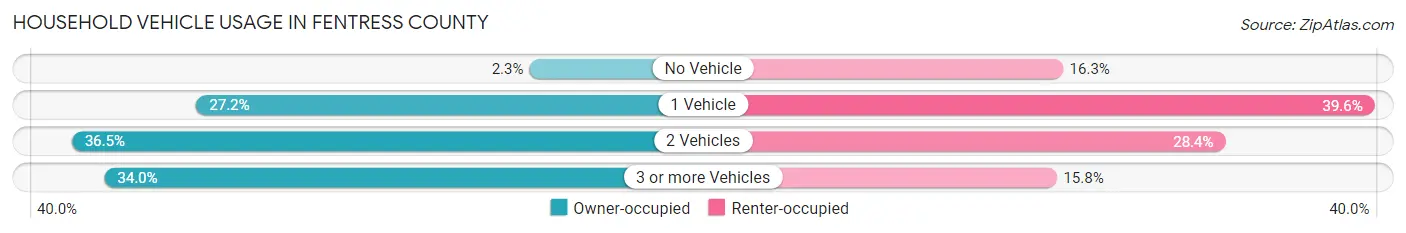
| Vehicles per Household | Owner-occupied | Renter-occupied |
| No Vehicle | 136 (2.3%) | 280 (16.3%) |
| 1 Vehicle | 1,599 (27.2%) | 681 (39.6%) |
| 2 Vehicles | 2,147 (36.5%) | 489 (28.4%) |
| 3 or more Vehicles | 2,003 (34.0%) | 272 (15.8%) |
| Total | 5,885 (100.0%) | 1,722 (100.0%) |
Real Estate & Mortgages in Fentress County
Real Estate and Mortgage Overview in Fentress County
| Characteristic | Without Mortgage | With Mortgage |
| Housing Units | 3,240 | 2,645 |
| Median Property Value | $131,800 | $140,400 |
| Median Household Income | $46,602 | $160 |
| Monthly Housing Costs | $322 | $38 |
| Real Estate Taxes | $473 | $50 |
Property Value by Mortgage Status in Fentress County
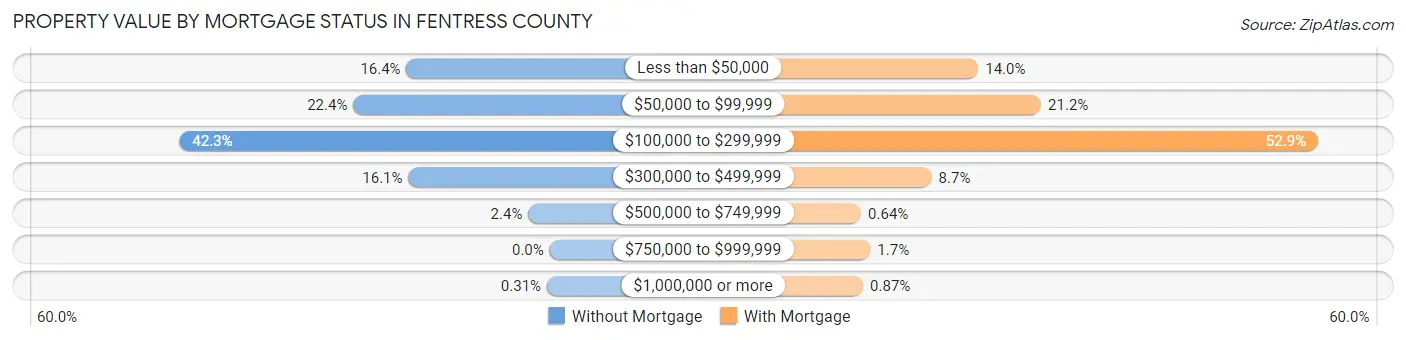
| Property Value | Without Mortgage | With Mortgage |
| Less than $50,000 | 530 (16.4%) | 371 (14.0%) |
| $50,000 to $99,999 | 727 (22.4%) | 561 (21.2%) |
| $100,000 to $299,999 | 1,371 (42.3%) | 1,398 (52.8%) |
| $300,000 to $499,999 | 523 (16.1%) | 230 (8.7%) |
| $500,000 to $749,999 | 79 (2.4%) | 17 (0.6%) |
| $750,000 to $999,999 | 0 (0.0%) | 45 (1.7%) |
| $1,000,000 or more | 10 (0.3%) | 23 (0.9%) |
| Total | 3,240 (100.0%) | 2,645 (100.0%) |
Household Income by Mortgage Status in Fentress County
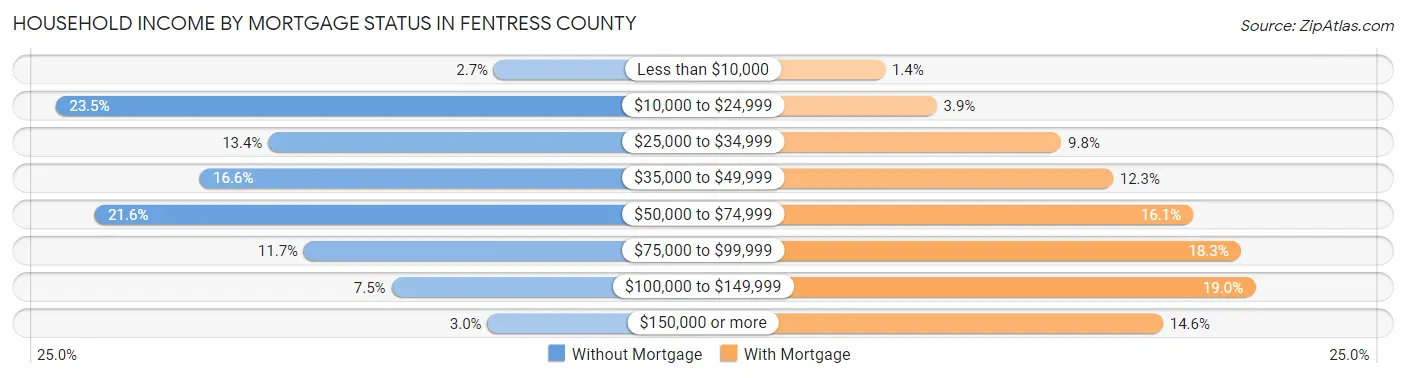
| Household Income | Without Mortgage | With Mortgage |
| Less than $10,000 | 86 (2.6%) | 37 (1.4%) |
| $10,000 to $24,999 | 761 (23.5%) | 102 (3.9%) |
| $25,000 to $34,999 | 434 (13.4%) | 259 (9.8%) |
| $35,000 to $49,999 | 539 (16.6%) | 324 (12.2%) |
| $50,000 to $74,999 | 701 (21.6%) | 425 (16.1%) |
| $75,000 to $99,999 | 379 (11.7%) | 485 (18.3%) |
| $100,000 to $149,999 | 244 (7.5%) | 503 (19.0%) |
| $150,000 or more | 96 (3.0%) | 387 (14.6%) |
| Total | 3,240 (100.0%) | 2,645 (100.0%) |
Property Value to Household Income Ratio in Fentress County
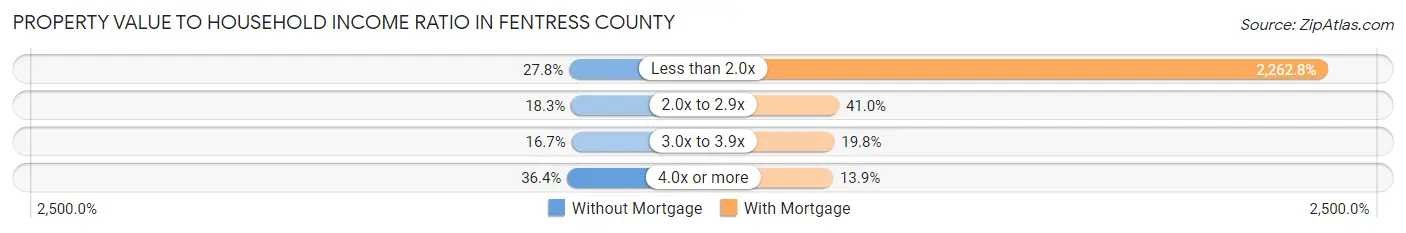
| Value-to-Income Ratio | Without Mortgage | With Mortgage |
| Less than 2.0x | 901 (27.8%) | 59,851 (2,262.8%) |
| 2.0x to 2.9x | 594 (18.3%) | 1,083 (40.9%) |
| 3.0x to 3.9x | 540 (16.7%) | 523 (19.8%) |
| 4.0x or more | 1,180 (36.4%) | 368 (13.9%) |
| Total | 3,240 (100.0%) | 2,645 (100.0%) |
Real Estate Taxes by Mortgage Status in Fentress County
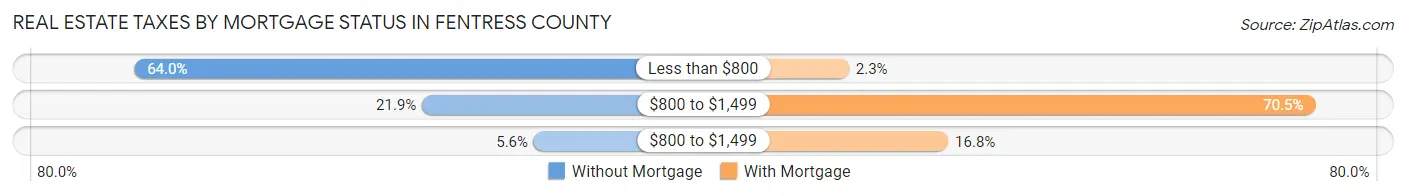
| Property Taxes | Without Mortgage | With Mortgage |
| Less than $800 | 2,073 (64.0%) | 61 (2.3%) |
| $800 to $1,499 | 710 (21.9%) | 1,864 (70.5%) |
| $800 to $1,499 | 181 (5.6%) | 445 (16.8%) |
| Total | 3,240 (100.0%) | 2,645 (100.0%) |
Health & Disability in Fentress County
Health Insurance Coverage by Age in Fentress County
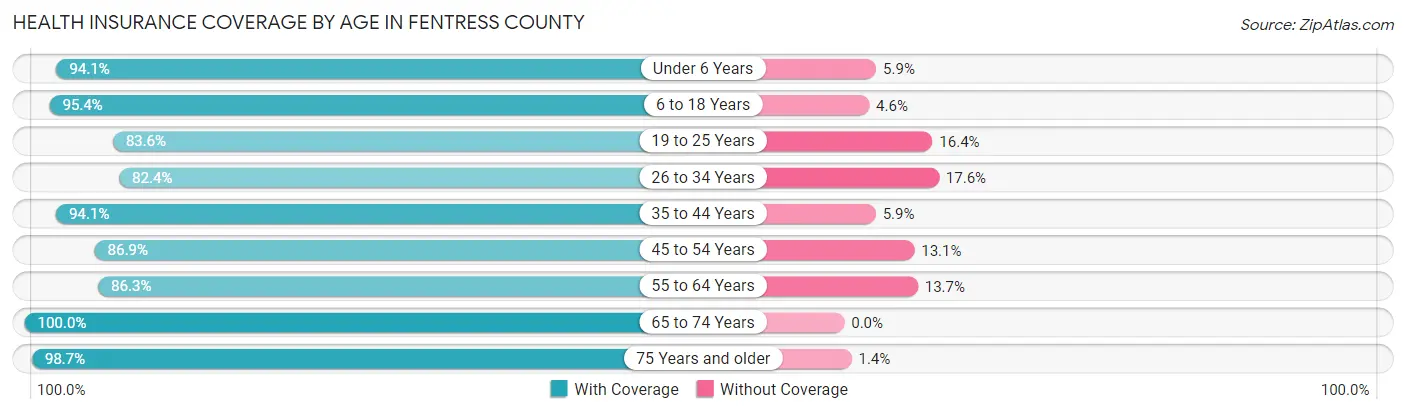
| Age Bracket | With Coverage | Without Coverage |
| Under 6 Years | 1,156 (94.1%) | 73 (5.9%) |
| 6 to 18 Years | 2,628 (95.4%) | 128 (4.6%) |
| 19 to 25 Years | 1,200 (83.6%) | 236 (16.4%) |
| 26 to 34 Years | 1,363 (82.4%) | 292 (17.6%) |
| 35 to 44 Years | 1,849 (94.1%) | 115 (5.9%) |
| 45 to 54 Years | 2,164 (86.9%) | 325 (13.1%) |
| 55 to 64 Years | 2,436 (86.3%) | 387 (13.7%) |
| 65 to 74 Years | 2,567 (100.0%) | 0 (0.0%) |
| 75 Years and older | 1,531 (98.7%) | 21 (1.3%) |
| Total | 16,894 (91.5%) | 1,577 (8.5%) |
Health Insurance Coverage by Citizenship Status in Fentress County
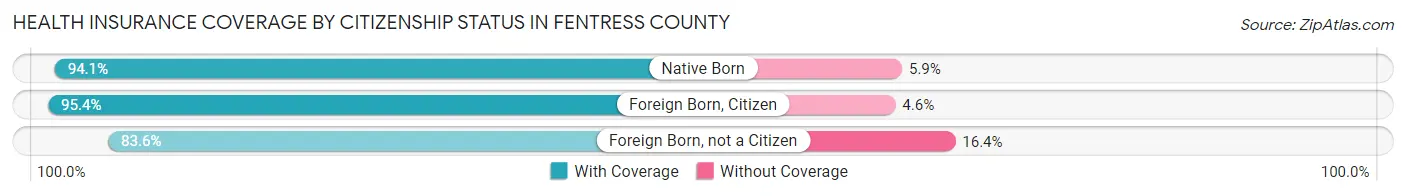
| Citizenship Status | With Coverage | Without Coverage |
| Native Born | 1,156 (94.1%) | 73 (5.9%) |
| Foreign Born, Citizen | 2,628 (95.4%) | 128 (4.6%) |
| Foreign Born, not a Citizen | 1,200 (83.6%) | 236 (16.4%) |
Health Insurance Coverage by Household Income in Fentress County
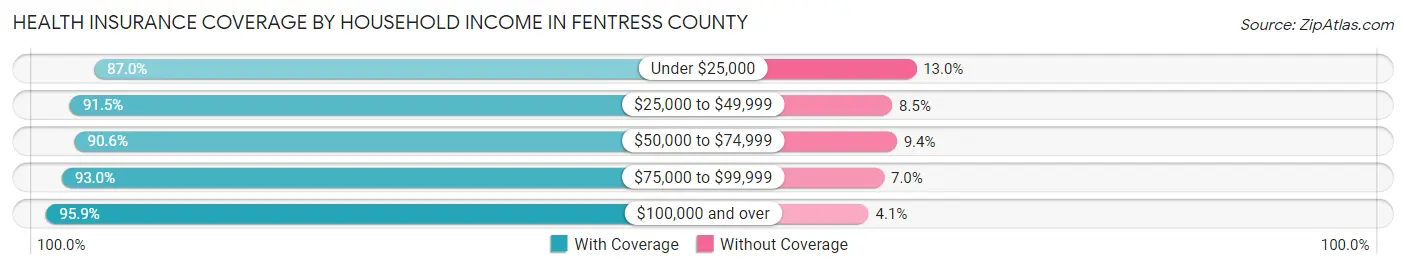
| Household Income | With Coverage | Without Coverage |
| Under $25,000 | 3,186 (87.0%) | 476 (13.0%) |
| $25,000 to $49,999 | 4,373 (91.5%) | 406 (8.5%) |
| $50,000 to $74,999 | 3,506 (90.6%) | 362 (9.4%) |
| $75,000 to $99,999 | 2,597 (93.0%) | 195 (7.0%) |
| $100,000 and over | 3,232 (95.9%) | 138 (4.1%) |
Public vs Private Health Insurance Coverage by Age in Fentress County
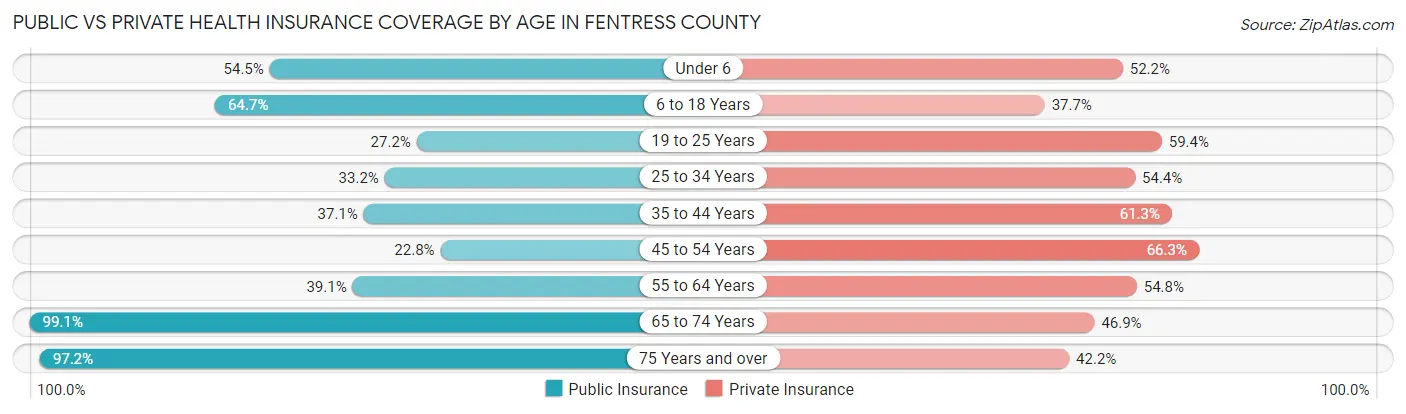
| Age Bracket | Public Insurance | Private Insurance |
| Under 6 | 670 (54.5%) | 641 (52.2%) |
| 6 to 18 Years | 1,782 (64.7%) | 1,038 (37.7%) |
| 19 to 25 Years | 391 (27.2%) | 853 (59.4%) |
| 25 to 34 Years | 549 (33.2%) | 901 (54.4%) |
| 35 to 44 Years | 728 (37.1%) | 1,203 (61.3%) |
| 45 to 54 Years | 568 (22.8%) | 1,649 (66.2%) |
| 55 to 64 Years | 1,105 (39.1%) | 1,546 (54.8%) |
| 65 to 74 Years | 2,543 (99.1%) | 1,204 (46.9%) |
| 75 Years and over | 1,508 (97.2%) | 655 (42.2%) |
| Total | 9,844 (53.3%) | 9,690 (52.5%) |
Disability Status by Sex by Age in Fentress County
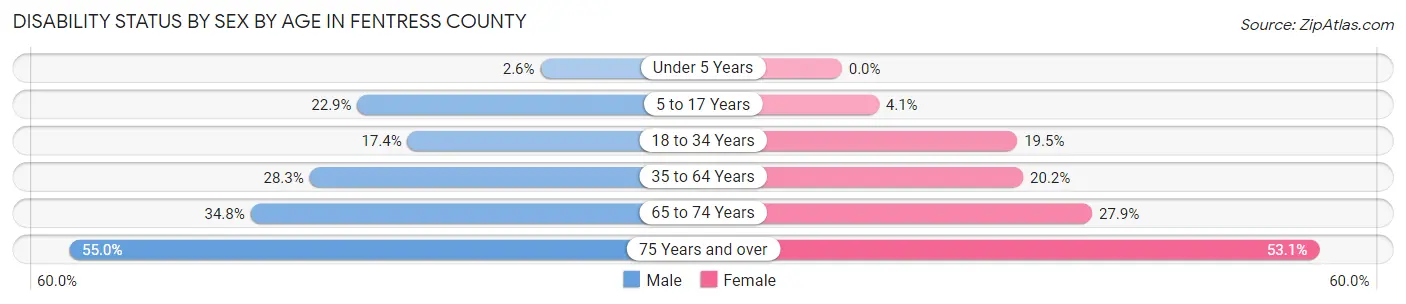
| Age Bracket | Male | Female |
| Under 5 Years | 13 (2.6%) | 0 (0.0%) |
| 5 to 17 Years | 356 (22.9%) | 51 (4.1%) |
| 18 to 34 Years | 292 (17.4%) | 309 (19.5%) |
| 35 to 64 Years | 1,032 (28.3%) | 732 (20.2%) |
| 65 to 74 Years | 433 (34.8%) | 369 (27.9%) |
| 75 Years and over | 355 (55.0%) | 482 (53.1%) |
Disability Class by Sex by Age in Fentress County
Disability Class: Hearing Difficulty
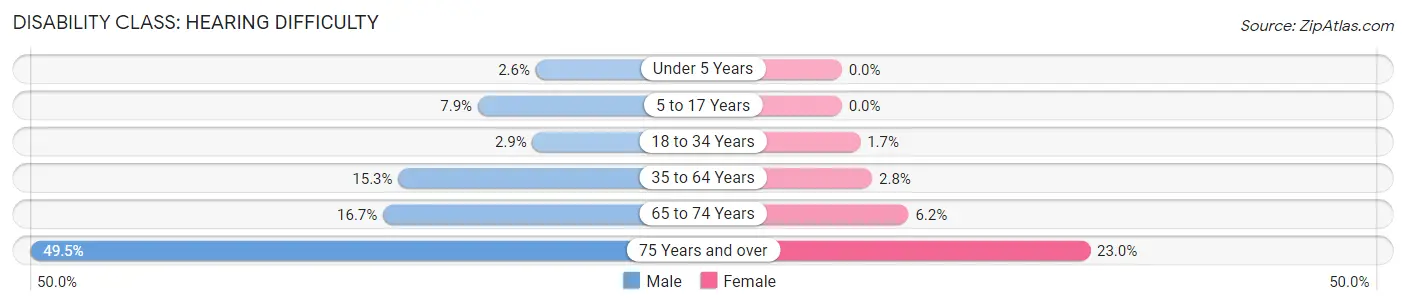
| Age Bracket | Male | Female |
| Under 5 Years | 13 (2.6%) | 0 (0.0%) |
| 5 to 17 Years | 123 (7.9%) | 0 (0.0%) |
| 18 to 34 Years | 48 (2.9%) | 27 (1.7%) |
| 35 to 64 Years | 559 (15.3%) | 102 (2.8%) |
| 65 to 74 Years | 208 (16.7%) | 82 (6.2%) |
| 75 Years and over | 319 (49.5%) | 209 (23.0%) |
Disability Class: Vision Difficulty
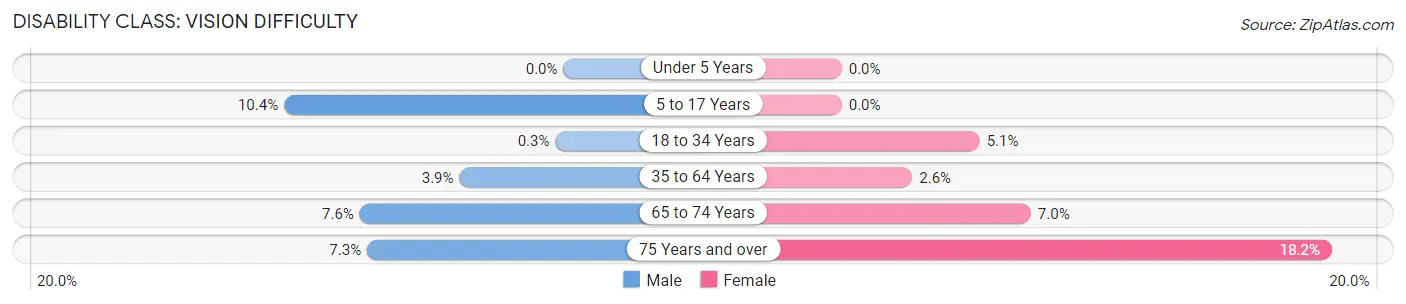
| Age Bracket | Male | Female |
| Under 5 Years | 0 (0.0%) | 0 (0.0%) |
| 5 to 17 Years | 161 (10.4%) | 0 (0.0%) |
| 18 to 34 Years | 5 (0.3%) | 81 (5.1%) |
| 35 to 64 Years | 141 (3.9%) | 95 (2.6%) |
| 65 to 74 Years | 94 (7.6%) | 93 (7.0%) |
| 75 Years and over | 47 (7.3%) | 165 (18.2%) |
Disability Class: Cognitive Difficulty
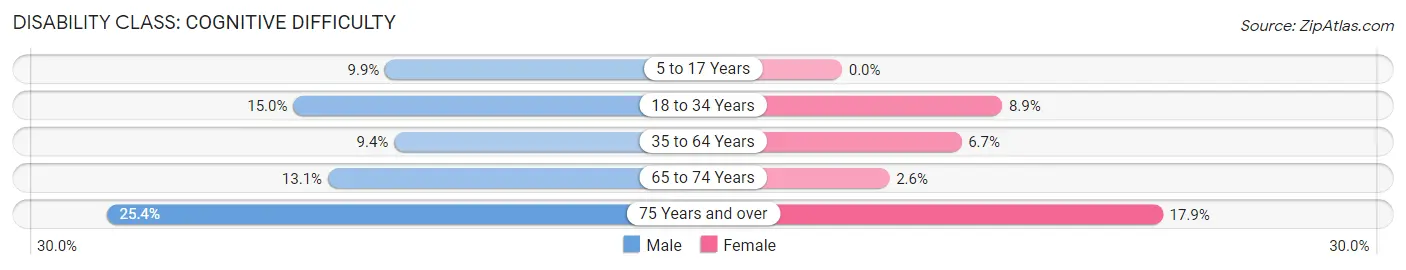
| Age Bracket | Male | Female |
| 5 to 17 Years | 154 (9.9%) | 0 (0.0%) |
| 18 to 34 Years | 253 (15.0%) | 141 (8.9%) |
| 35 to 64 Years | 344 (9.4%) | 241 (6.7%) |
| 65 to 74 Years | 163 (13.1%) | 35 (2.6%) |
| 75 Years and over | 164 (25.4%) | 162 (17.9%) |
Disability Class: Ambulatory Difficulty
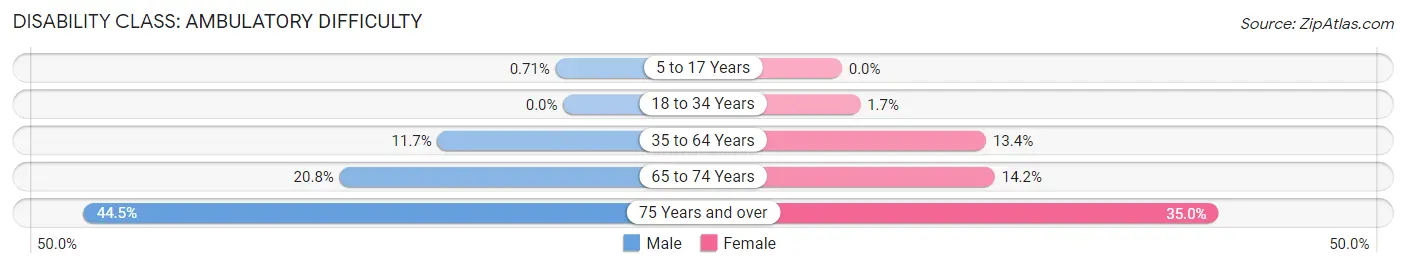
| Age Bracket | Male | Female |
| 5 to 17 Years | 11 (0.7%) | 0 (0.0%) |
| 18 to 34 Years | 0 (0.0%) | 27 (1.7%) |
| 35 to 64 Years | 426 (11.7%) | 485 (13.4%) |
| 65 to 74 Years | 258 (20.8%) | 188 (14.2%) |
| 75 Years and over | 287 (44.5%) | 317 (34.9%) |
Disability Class: Self-Care Difficulty
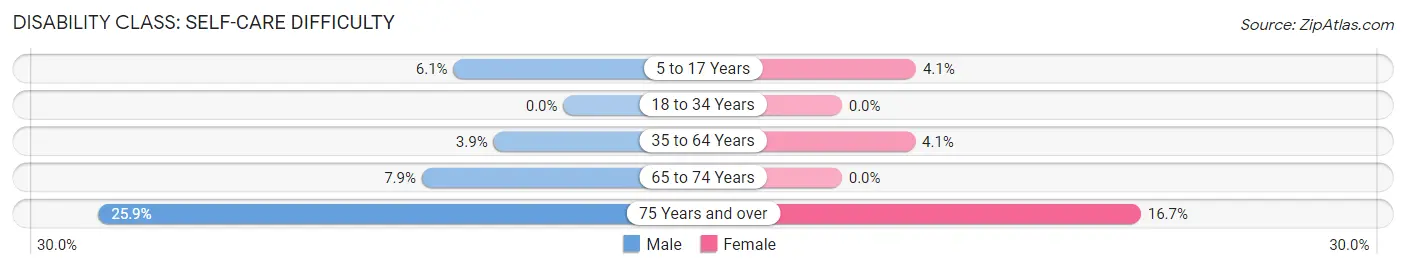
| Age Bracket | Male | Female |
| 5 to 17 Years | 95 (6.1%) | 51 (4.1%) |
| 18 to 34 Years | 0 (0.0%) | 0 (0.0%) |
| 35 to 64 Years | 142 (3.9%) | 148 (4.1%) |
| 65 to 74 Years | 98 (7.9%) | 0 (0.0%) |
| 75 Years and over | 167 (25.9%) | 151 (16.7%) |
Technology Access in Fentress County
Computing Device Access in Fentress County
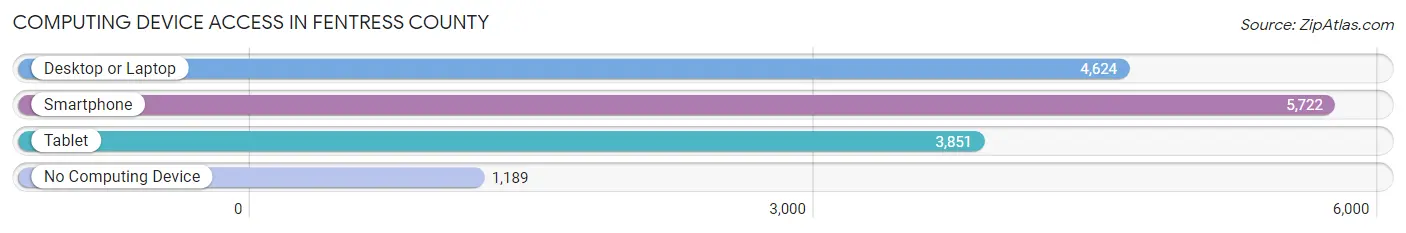
| Device Type | # Households | % Households |
| Desktop or Laptop | 4,624 | 60.8% |
| Smartphone | 5,722 | 75.2% |
| Tablet | 3,851 | 50.6% |
| No Computing Device | 1,189 | 15.6% |
| Total | 7,607 | 100.0% |
Internet Access in Fentress County
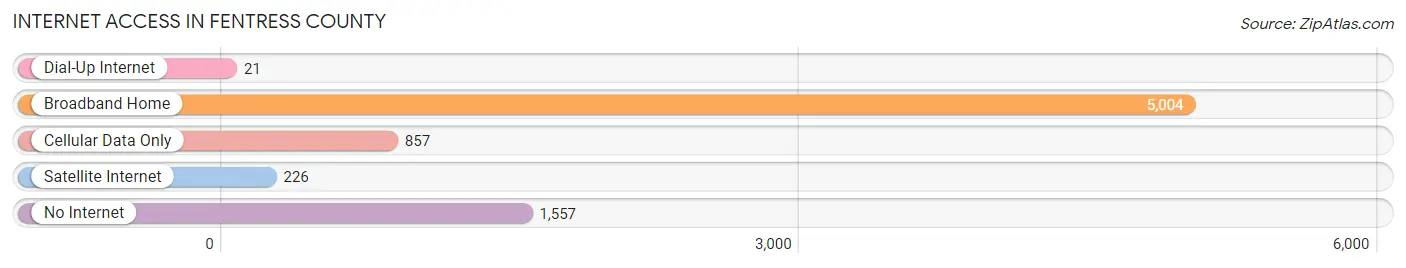
| Internet Type | # Households | % Households |
| Dial-Up Internet | 21 | 0.3% |
| Broadband Home | 5,004 | 65.8% |
| Cellular Data Only | 857 | 11.3% |
| Satellite Internet | 226 | 3.0% |
| No Internet | 1,557 | 20.5% |
| Total | 7,607 | 100.0% |
Fentress County Summary
Fentress County is located in the Upper Cumberland region of Tennessee, and is bordered by Pickett County to the north, Overton County to the east, Cumberland County to the south, and Scott County to the west. The county seat is Jamestown, and the county has a total area of 437 square miles, of which 435 square miles is land and 2 square miles is water. As of the 2010 census, the population of Fentress County was 17,959.
History
Fentress County was formed in 1823 from parts of Morgan, Overton, and White Counties. It was named for James Fentress, a Revolutionary War soldier and early settler of the area. The county was largely rural and agricultural until the late 19th century, when the railroad arrived and the timber industry began to boom. The county seat of Jamestown was established in 1823, and the county courthouse was built in 1825.
Geography
Fentress County is located in the Upper Cumberland region of Tennessee, and is bordered by Pickett County to the north, Overton County to the east, Cumberland County to the south, and Scott County to the west. The county has a total area of 437 square miles, of which 435 square miles is land and 2 square miles is water. The terrain is mostly hilly and forested, with the highest point being Big South Mountain at 1,890 feet. The county is drained by the Obey River and its tributaries.
Economy
Fentress County’s economy is largely based on agriculture and timber. The county is home to several large farms, and the timber industry is a major employer. The county also has a growing tourism industry, with several state parks and recreational areas.
Demographics
As of the 2010 census, the population of Fentress County was 17,959. The racial makeup of the county was 95.3% White, 2.2% African American, 0.3% Native American, 0.2% Asian, 0.1% Pacific Islander, 0.7% from other races, and 1.2% from two or more races. Hispanic or Latino of any race were 1.7% of the population.
The median income for a household in the county was $30,945, and the median income for a family was $37,945. The per capita income for the county was $16,845. About 17.2% of families and 21.2% of the population were below the poverty line, including 28.2% of those under age 18 and 17.2% of those age 65 or over.
Common Questions
What is Per Capita Income in Fentress County?
Per Capita income in Fentress County is $24,595.
What is the Median Family Income in Fentress County?
Median Family Income in Fentress County is $54,716.
What is the Median Household income in Fentress County?
Median Household Income in Fentress County is $47,884.
What is Income or Wage Gap in Fentress County?
Income or Wage Gap in Fentress County is 11.3%.
Women in Fentress County earn 88.7 cents for every dollar earned by a man.
What is Inequality or Gini Index in Fentress County?
Inequality or Gini Index in Fentress County is 0.42.
What is the Total Population of Fentress County?
Total Population of Fentress County is 18,642.
What is the Total Male Population of Fentress County?
Total Male Population of Fentress County is 9,371.
What is the Total Female Population of Fentress County?
Total Female Population of Fentress County is 9,271.
What is the Ratio of Males per 100 Females in Fentress County?
There are 101.08 Males per 100 Females in Fentress County.
What is the Ratio of Females per 100 Males in Fentress County?
There are 98.93 Females per 100 Males in Fentress County.
What is the Median Population Age in Fentress County?
Median Population Age in Fentress County is 46.3 Years.
What is the Average Family Size in Fentress County
Average Family Size in Fentress County is 3.1 People.
What is the Average Household Size in Fentress County
Average Household Size in Fentress County is 2.4 People.
How Large is the Labor Force in Fentress County?
There are 7,624 People in the Labor Forcein in Fentress County.
What is the Percentage of People in the Labor Force in Fentress County?
49.5% of People are in the Labor Force in Fentress County.
What is the Unemployment Rate in Fentress County?
Unemployment Rate in Fentress County is 5.3%.