Claiborne County, TN Map & Demographics
Claiborne County Map
Claiborne County Overview
$25,408
PER CAPITA INCOME
$62,962
AVG FAMILY INCOME
$42,406
AVG HOUSEHOLD INCOME
27.9%
WAGE / INCOME GAP [ % ]
72.1¢/ $1
WAGE / INCOME GAP [ $ ]
$10,356
FAMILY INCOME DEFICIT
0.46
INEQUALITY / GINI INDEX
32,092
TOTAL POPULATION
15,900
MALE POPULATION
16,192
FEMALE POPULATION
98.20
MALES / 100 FEMALES
101.84
FEMALES / 100 MALES
42.0
MEDIAN AGE
2.9
AVG FAMILY SIZE
2.3
AVG HOUSEHOLD SIZE
13,781
LABOR FORCE [ PEOPLE ]
51.7%
PERCENT IN LABOR FORCE
6.1%
UNEMPLOYMENT RATE
Claiborne County Area Codes
Income in Claiborne County
Income Overview in Claiborne County
Per Capita Income in Claiborne County is $25,408, while median incomes of families and households are $62,962 and $42,406 respectively.
| Characteristic | Number | Measure |
| Per Capita Income | 32,092 | $25,408 |
| Median Family Income | 8,266 | $62,962 |
| Mean Family Income | 8,266 | $75,462 |
| Median Household Income | 13,479 | $42,406 |
| Mean Household Income | 13,479 | $59,276 |
| Income Deficit | 8,266 | $10,356 |
| Wage / Income Gap (%) | 32,092 | 27.92% |
| Wage / Income Gap ($) | 32,092 | 72.08¢ per $1 |
| Gini / Inequality Index | 32,092 | 0.46 |
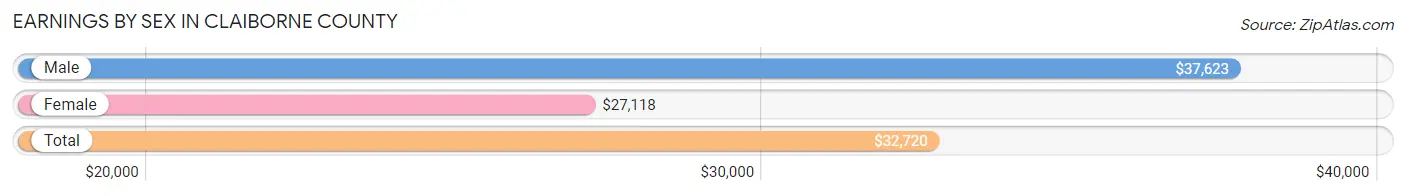
Earnings by Sex in Claiborne County
Average Earnings in Claiborne County are $32,720, $37,623 for men and $27,118 for women, a difference of 27.9%.
| Sex | Number | Average Earnings |
| Male | 7,619 (52.2%) | $37,623 |
| Female | 6,977 (47.8%) | $27,118 |
| Total | 14,596 (100.0%) | $32,720 |
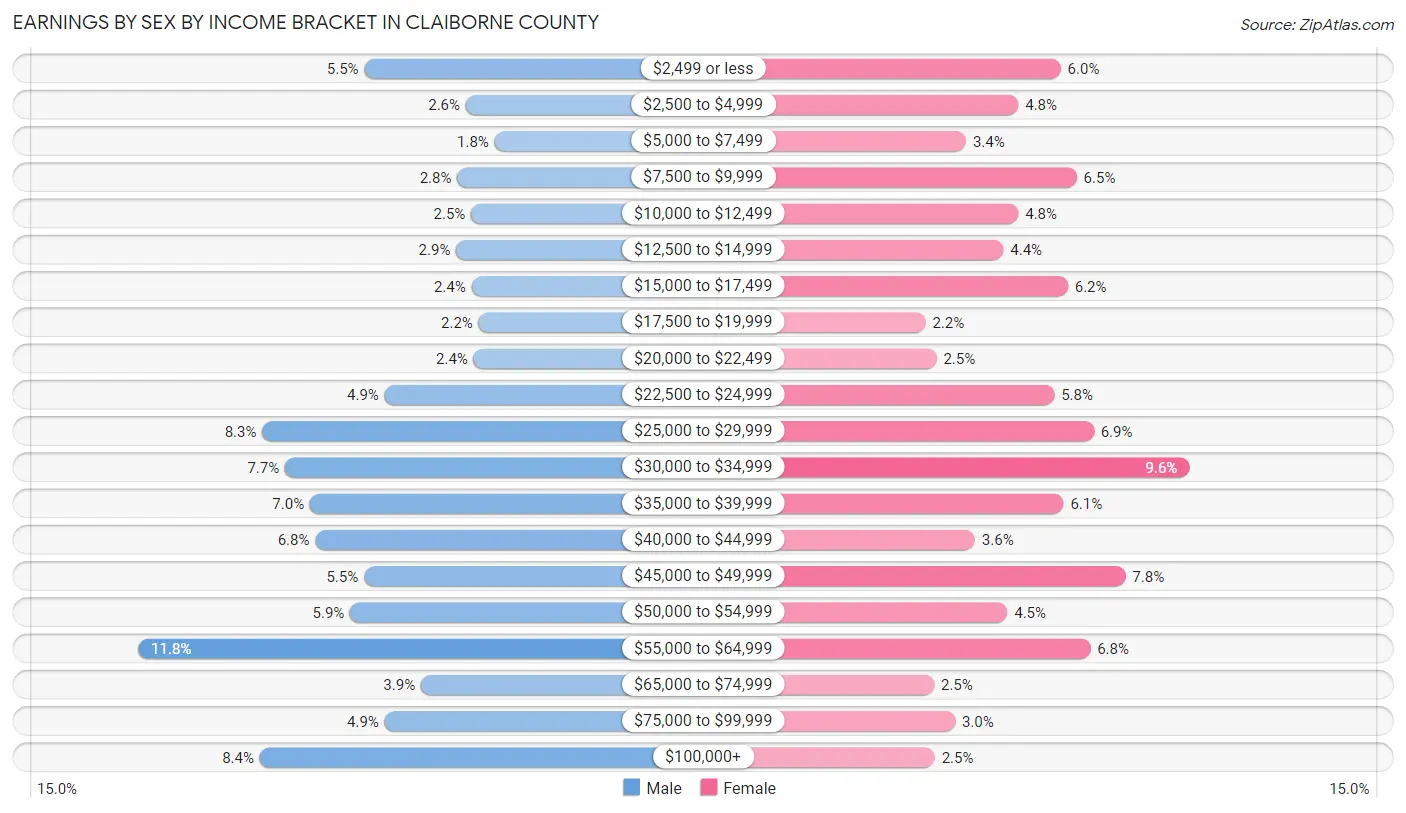
Earnings by Sex by Income Bracket in Claiborne County
The most common earnings brackets in Claiborne County are $55,000 to $64,999 for men (900 | 11.8%) and $30,000 to $34,999 for women (671 | 9.6%).
| Income | Male | Female |
| $2,499 or less | 415 (5.4%) | 419 (6.0%) |
| $2,500 to $4,999 | 198 (2.6%) | 336 (4.8%) |
| $5,000 to $7,499 | 136 (1.8%) | 234 (3.4%) |
| $7,500 to $9,999 | 216 (2.8%) | 451 (6.5%) |
| $10,000 to $12,499 | 187 (2.5%) | 336 (4.8%) |
| $12,500 to $14,999 | 219 (2.9%) | 307 (4.4%) |
| $15,000 to $17,499 | 186 (2.4%) | 433 (6.2%) |
| $17,500 to $19,999 | 171 (2.2%) | 154 (2.2%) |
| $20,000 to $22,499 | 181 (2.4%) | 176 (2.5%) |
| $22,500 to $24,999 | 372 (4.9%) | 407 (5.8%) |
| $25,000 to $29,999 | 634 (8.3%) | 484 (6.9%) |
| $30,000 to $34,999 | 585 (7.7%) | 671 (9.6%) |
| $35,000 to $39,999 | 532 (7.0%) | 425 (6.1%) |
| $40,000 to $44,999 | 520 (6.8%) | 251 (3.6%) |
| $45,000 to $49,999 | 416 (5.5%) | 546 (7.8%) |
| $50,000 to $54,999 | 446 (5.9%) | 315 (4.5%) |
| $55,000 to $64,999 | 900 (11.8%) | 477 (6.8%) |
| $65,000 to $74,999 | 294 (3.9%) | 171 (2.5%) |
| $75,000 to $99,999 | 372 (4.9%) | 212 (3.0%) |
| $100,000+ | 639 (8.4%) | 172 (2.5%) |
| Total | 7,619 (100.0%) | 6,977 (100.0%) |
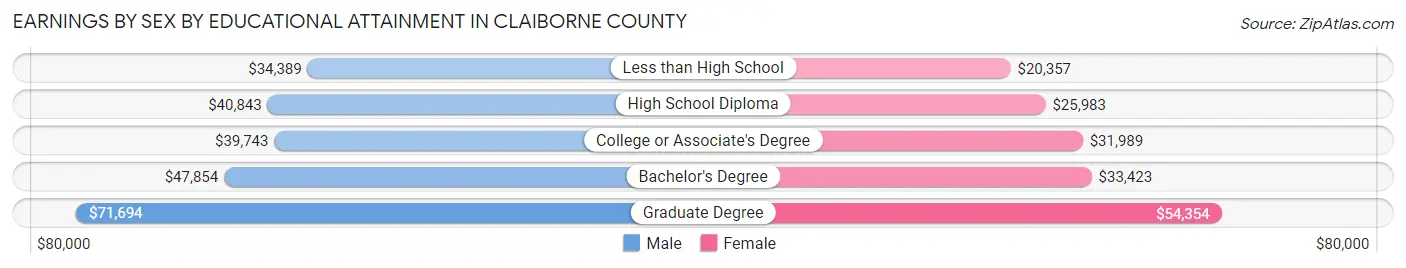
Earnings by Sex by Educational Attainment in Claiborne County
Average earnings in Claiborne County are $42,075 for men and $32,727 for women, a difference of 22.2%. Men with an educational attainment of graduate degree enjoy the highest average annual earnings of $71,694, while those with less than high school education earn the least with $34,389. Women with an educational attainment of graduate degree earn the most with the average annual earnings of $54,354, while those with less than high school education have the smallest earnings of $20,357.
| Educational Attainment | Male Income | Female Income |
| Less than High School | $34,389 | $20,357 |
| High School Diploma | $40,843 | $25,983 |
| College or Associate's Degree | $39,743 | $31,989 |
| Bachelor's Degree | $47,854 | $33,423 |
| Graduate Degree | $71,694 | $54,354 |
| Total | $42,075 | $32,727 |
Family Income in Claiborne County
Family Income Brackets in Claiborne County
According to the Claiborne County family income data, there are 1,934 families falling into the $50,000 to $74,999 income range, which is the most common income bracket and makes up 23.4% of all families. Conversely, the $10,000 to $14,999 income bracket is the least frequent group with only 198 families (2.4%) belonging to this category.
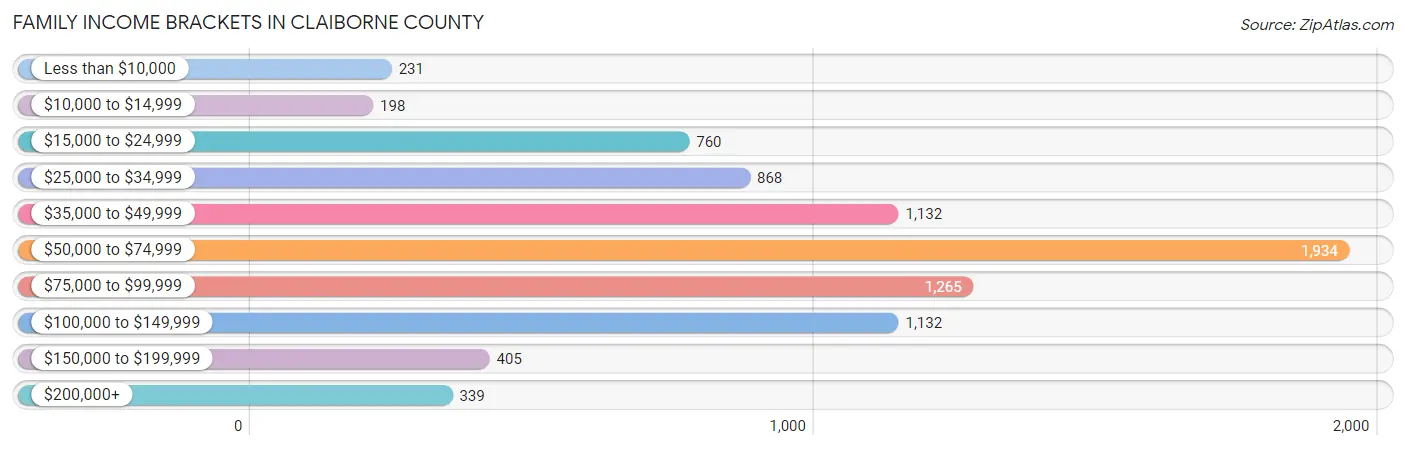
| Income Bracket | # Families | % Families |
| Less than $10,000 | 231 | 2.8% |
| $10,000 to $14,999 | 198 | 2.4% |
| $15,000 to $24,999 | 760 | 9.2% |
| $25,000 to $34,999 | 868 | 10.5% |
| $35,000 to $49,999 | 1,132 | 13.7% |
| $50,000 to $74,999 | 1,934 | 23.4% |
| $75,000 to $99,999 | 1,265 | 15.3% |
| $100,000 to $149,999 | 1,132 | 13.7% |
| $150,000 to $199,999 | 405 | 4.9% |
| $200,000+ | 339 | 4.1% |
Family Income by Famaliy Size in Claiborne County
4-person families (1,606 | 19.4%) account for the highest median family income in Claiborne County with $85,365 per family, while 3-person families (1,294 | 15.7%) have the highest median income of $24,414 per family member.
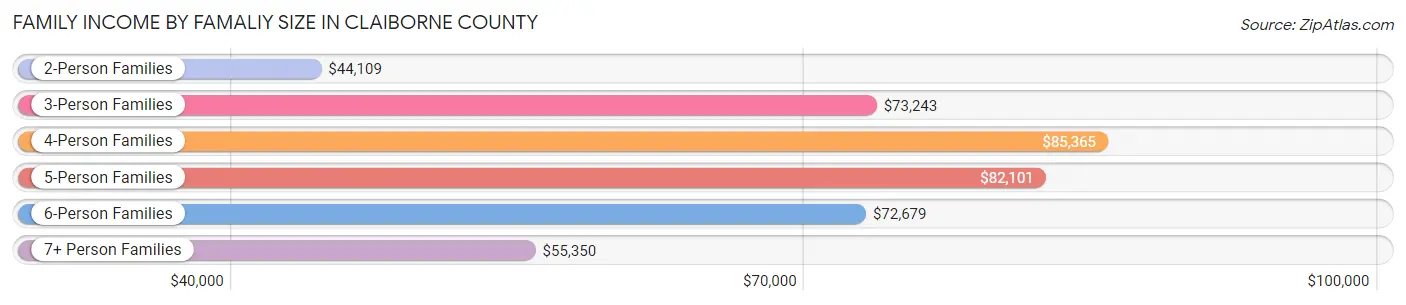
| Income Bracket | # Families | Median Income |
| 2-Person Families | 4,119 (49.8%) | $44,109 |
| 3-Person Families | 1,294 (15.7%) | $73,243 |
| 4-Person Families | 1,606 (19.4%) | $85,365 |
| 5-Person Families | 701 (8.5%) | $82,101 |
| 6-Person Families | 393 (4.8%) | $72,679 |
| 7+ Person Families | 153 (1.8%) | $55,350 |
| Total | 8,266 (100.0%) | $62,962 |
Family Income by Number of Earners in Claiborne County
The median family income in Claiborne County is $62,962, with families comprising 3+ earners (913) having the highest median family income of $120,897, while families with no earners (2,024) have the lowest median family income of $33,023, accounting for 11.1% and 24.5% of families, respectively.

| Number of Earners | # Families | Median Income |
| No Earners | 2,024 (24.5%) | $33,023 |
| 1 Earner | 2,579 (31.2%) | $50,016 |
| 2 Earners | 2,750 (33.3%) | $82,787 |
| 3+ Earners | 913 (11.1%) | $120,897 |
| Total | 8,266 (100.0%) | $62,962 |
Household Income in Claiborne County
Household Income Brackets in Claiborne County
With 2,359 households falling in the category, the $50,000 to $74,999 income range is the most frequent in Claiborne County, accounting for 17.5% of all households. In contrast, only 404 households (3.0%) fall into the $200,000+ income bracket, making it the least populous group.
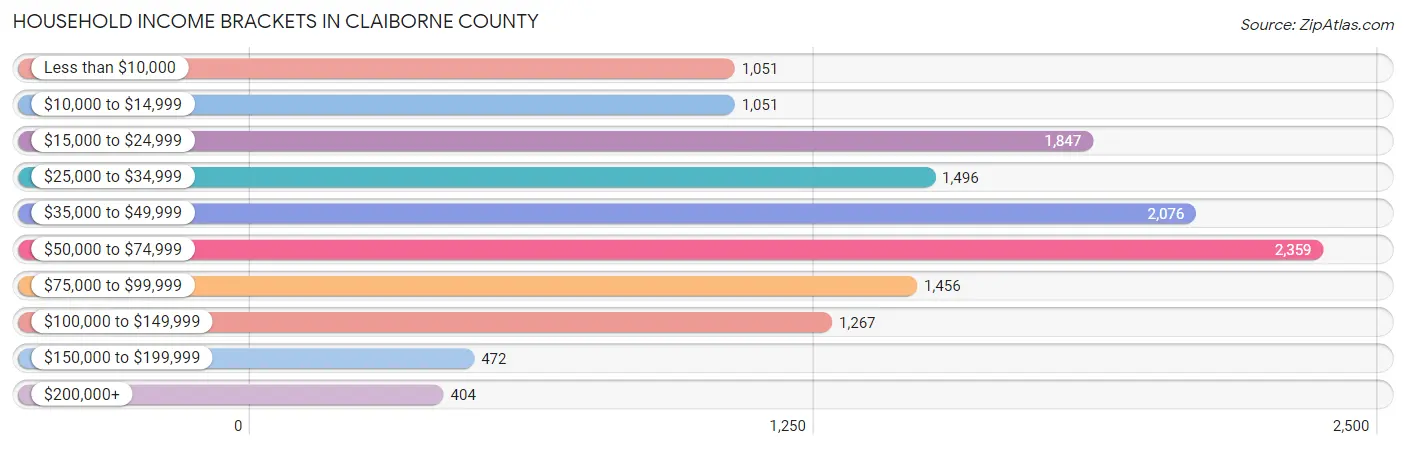
| Income Bracket | # Households | % Households |
| Less than $10,000 | 1,051 | 7.8% |
| $10,000 to $14,999 | 1,051 | 7.8% |
| $15,000 to $24,999 | 1,847 | 13.7% |
| $25,000 to $34,999 | 1,496 | 11.1% |
| $35,000 to $49,999 | 2,076 | 15.4% |
| $50,000 to $74,999 | 2,359 | 17.5% |
| $75,000 to $99,999 | 1,456 | 10.8% |
| $100,000 to $149,999 | 1,267 | 9.4% |
| $150,000 to $199,999 | 472 | 3.5% |
| $200,000+ | 404 | 3.0% |
Household Income by Householder Age in Claiborne County
The median household income in Claiborne County is $42,406, with the highest median household income of $57,643 found in the 25 to 44 years age bracket for the primary householder. A total of 3,748 households (27.8%) fall into this category. Meanwhile, the 15 to 24 years age bracket for the primary householder has the lowest median household income of $21,486, with 522 households (3.9%) in this group.
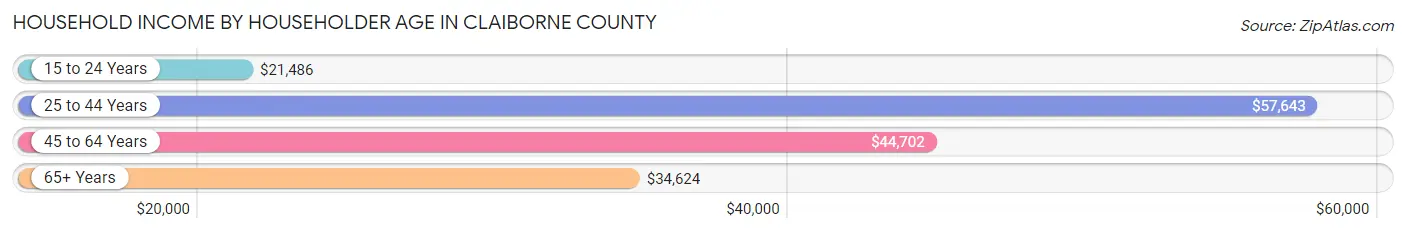
| Income Bracket | # Households | Median Income |
| 15 to 24 Years | 522 (3.9%) | $21,486 |
| 25 to 44 Years | 3,748 (27.8%) | $57,643 |
| 45 to 64 Years | 5,081 (37.7%) | $44,702 |
| 65+ Years | 4,128 (30.6%) | $34,624 |
| Total | 13,479 (100.0%) | $42,406 |
Poverty in Claiborne County
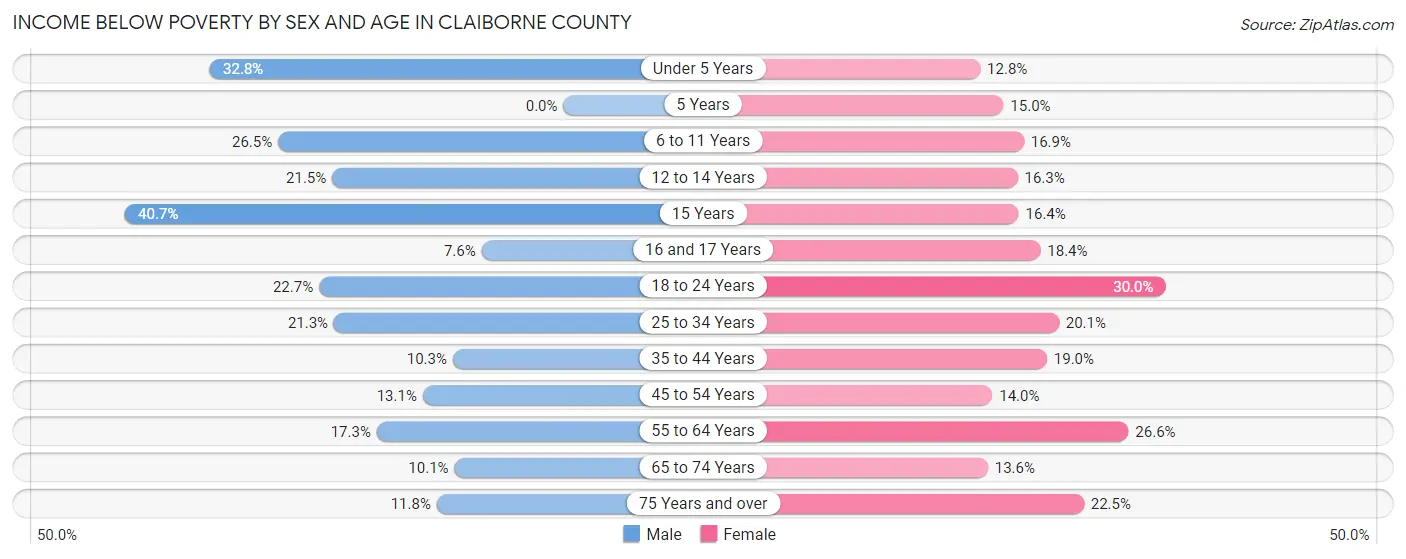
Income Below Poverty by Sex and Age in Claiborne County
With 17.3% poverty level for males and 19.4% for females among the residents of Claiborne County, 15 year old males and 18 to 24 year old females are the most vulnerable to poverty, with 85 males (40.7%) and 287 females (30.0%) in their respective age groups living below the poverty level.
| Age Bracket | Male | Female |
| Under 5 Years | 329 (32.8%) | 84 (12.8%) |
| 5 Years | 0 (0.0%) | 12 (15.0%) |
| 6 to 11 Years | 233 (26.5%) | 153 (16.9%) |
| 12 to 14 Years | 129 (21.5%) | 84 (16.3%) |
| 15 Years | 85 (40.7%) | 43 (16.4%) |
| 16 and 17 Years | 28 (7.6%) | 47 (18.4%) |
| 18 to 24 Years | 293 (22.7%) | 287 (30.0%) |
| 25 to 34 Years | 436 (21.3%) | 427 (20.1%) |
| 35 to 44 Years | 185 (10.3%) | 326 (19.0%) |
| 45 to 54 Years | 274 (13.1%) | 296 (14.0%) |
| 55 to 64 Years | 378 (17.3%) | 629 (26.6%) |
| 65 to 74 Years | 180 (10.1%) | 270 (13.6%) |
| 75 Years and over | 113 (11.7%) | 300 (22.5%) |
| Total | 2,663 (17.3%) | 2,958 (19.4%) |
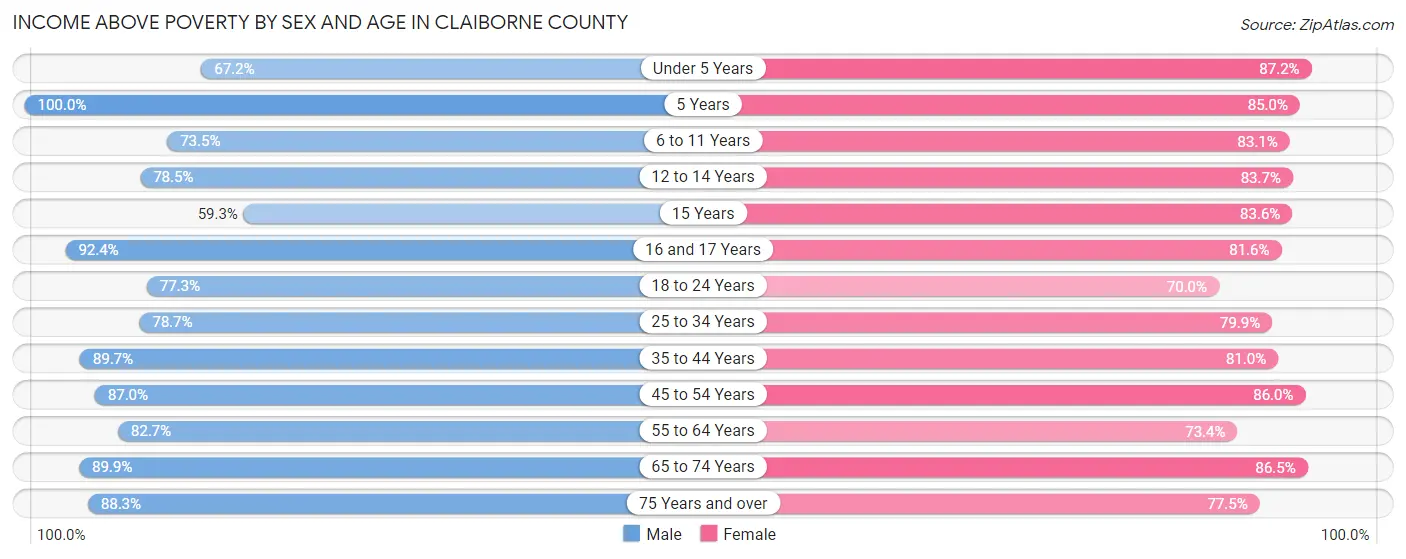
Income Above Poverty by Sex and Age in Claiborne County
According to the poverty statistics in Claiborne County, males aged 5 years and females aged under 5 years are the age groups that are most secure financially, with 100.0% of males and 87.2% of females in these age groups living above the poverty line.
| Age Bracket | Male | Female |
| Under 5 Years | 674 (67.2%) | 570 (87.2%) |
| 5 Years | 154 (100.0%) | 68 (85.0%) |
| 6 to 11 Years | 647 (73.5%) | 753 (83.1%) |
| 12 to 14 Years | 472 (78.5%) | 431 (83.7%) |
| 15 Years | 124 (59.3%) | 219 (83.6%) |
| 16 and 17 Years | 341 (92.4%) | 208 (81.6%) |
| 18 to 24 Years | 999 (77.3%) | 669 (70.0%) |
| 25 to 34 Years | 1,612 (78.7%) | 1,693 (79.9%) |
| 35 to 44 Years | 1,618 (89.7%) | 1,387 (81.0%) |
| 45 to 54 Years | 1,826 (87.0%) | 1,823 (86.0%) |
| 55 to 64 Years | 1,804 (82.7%) | 1,736 (73.4%) |
| 65 to 74 Years | 1,600 (89.9%) | 1,723 (86.5%) |
| 75 Years and over | 849 (88.2%) | 1,036 (77.5%) |
| Total | 12,720 (82.7%) | 12,316 (80.6%) |
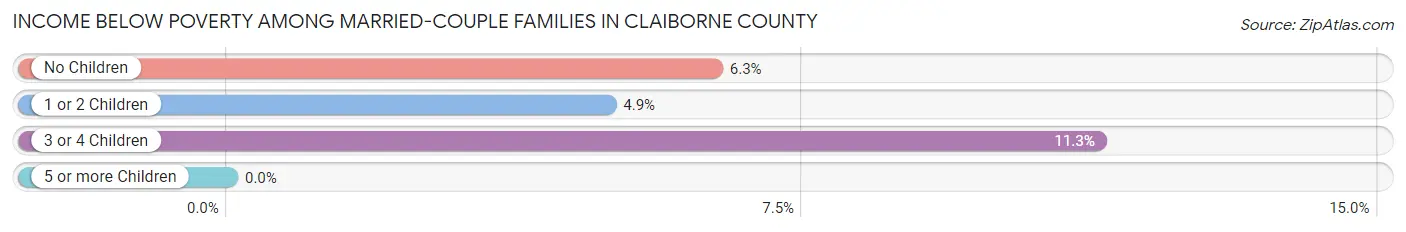
Income Below Poverty Among Married-Couple Families in Claiborne County
The poverty statistics for married-couple families in Claiborne County show that 6.3% or 399 of the total 6,355 families live below the poverty line. Families with 3 or 4 children have the highest poverty rate of 11.3%, comprising of 65 families. On the other hand, families with 5 or more children have the lowest poverty rate of 0.0%, which includes 0 families.
| Children | Above Poverty | Below Poverty |
| No Children | 3,328 (93.7%) | 225 (6.3%) |
| 1 or 2 Children | 2,098 (95.1%) | 109 (4.9%) |
| 3 or 4 Children | 508 (88.7%) | 65 (11.3%) |
| 5 or more Children | 22 (100.0%) | 0 (0.0%) |
| Total | 5,956 (93.7%) | 399 (6.3%) |
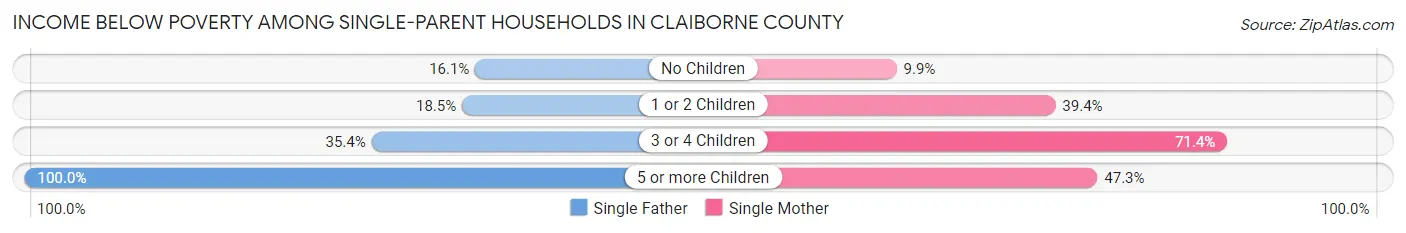
Income Below Poverty Among Single-Parent Households in Claiborne County
According to the poverty data in Claiborne County, 20.4% or 124 single-father households and 30.6% or 399 single-mother households are living below the poverty line. Among single-father households, those with 5 or more children have the highest poverty rate, with 4 households (100.0%) experiencing poverty. Likewise, among single-mother households, those with 3 or 4 children have the highest poverty rate, with 55 households (71.4%) falling below the poverty line.
| Children | Single Father | Single Mother |
| No Children | 36 (16.1%) | 49 (9.9%) |
| 1 or 2 Children | 55 (18.5%) | 252 (39.4%) |
| 3 or 4 Children | 29 (35.4%) | 55 (71.4%) |
| 5 or more Children | 4 (100.0%) | 43 (47.2%) |
| Total | 124 (20.4%) | 399 (30.6%) |
Income Below Poverty Among Married-Couple vs Single-Parent Households in Claiborne County
The poverty data for Claiborne County shows that 399 of the married-couple family households (6.3%) and 523 of the single-parent households (27.4%) are living below the poverty level. Within the married-couple family households, those with 3 or 4 children have the highest poverty rate, with 65 households (11.3%) falling below the poverty line. Among the single-parent households, those with 3 or 4 children have the highest poverty rate, with 84 household (52.8%) living below poverty.
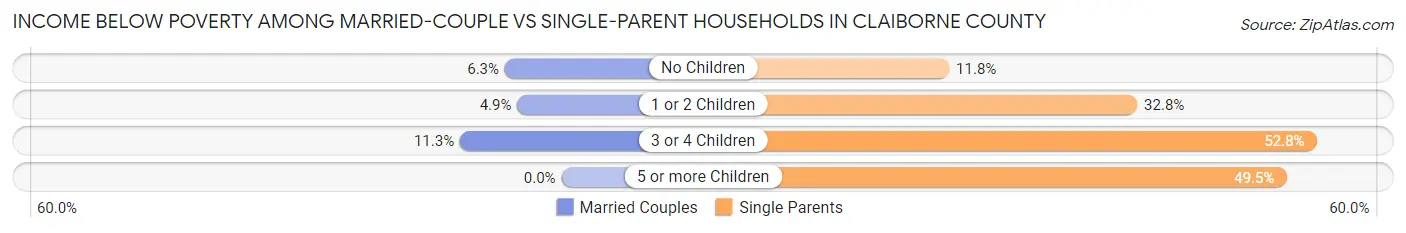
| Children | Married-Couple Families | Single-Parent Households |
| No Children | 225 (6.3%) | 85 (11.8%) |
| 1 or 2 Children | 109 (4.9%) | 307 (32.8%) |
| 3 or 4 Children | 65 (11.3%) | 84 (52.8%) |
| 5 or more Children | 0 (0.0%) | 47 (49.5%) |
| Total | 399 (6.3%) | 523 (27.4%) |
Race in Claiborne County
The most populous races in Claiborne County are White / Caucasian (30,497 | 95.0%), Two or more Races (970 | 3.0%), and Hispanic or Latino (482 | 1.5%).
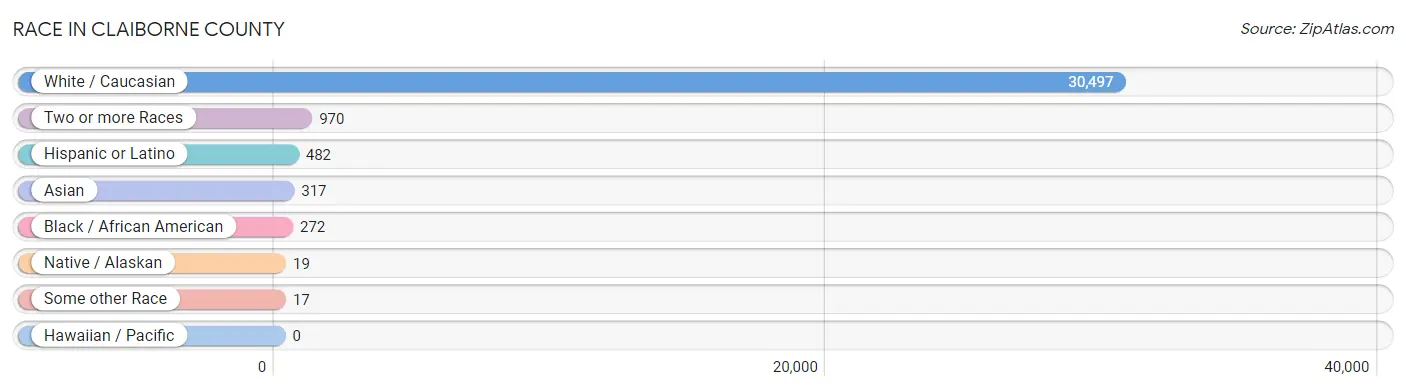
| Race | # Population | % Population |
| Asian | 317 | 1.0% |
| Black / African American | 272 | 0.9% |
| Hawaiian / Pacific | 0 | 0.0% |
| Hispanic or Latino | 482 | 1.5% |
| Native / Alaskan | 19 | 0.1% |
| White / Caucasian | 30,497 | 95.0% |
| Two or more Races | 970 | 3.0% |
| Some other Race | 17 | 0.1% |
| Total | 32,092 | 100.0% |
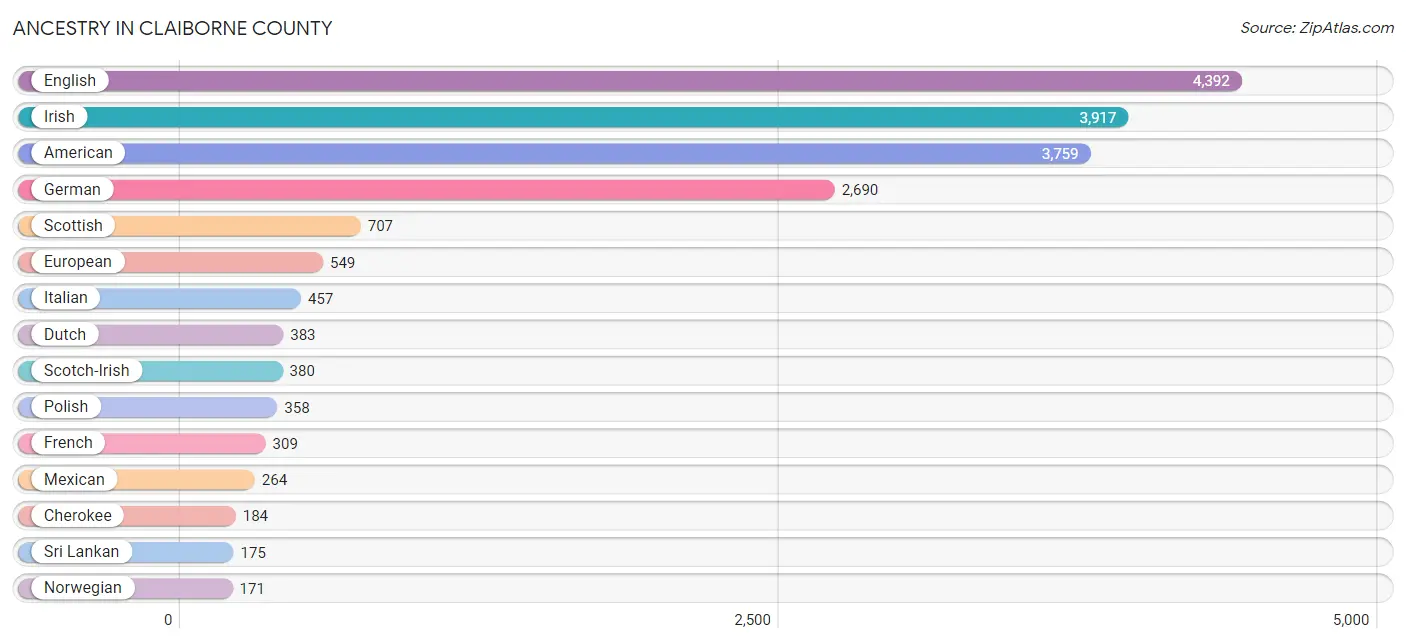
Ancestry in Claiborne County
The most populous ancestries reported in Claiborne County are English (4,392 | 13.7%), Irish (3,917 | 12.2%), American (3,759 | 11.7%), German (2,690 | 8.4%), and Scottish (707 | 2.2%), together accounting for 48.2% of all Claiborne County residents.
| Ancestry | # Population | % Population |
| African | 55 | 0.2% |
| American | 3,759 | 11.7% |
| Apache | 36 | 0.1% |
| Arab | 4 | 0.0% |
| Armenian | 4 | 0.0% |
| Austrian | 10 | 0.0% |
| Belgian | 36 | 0.1% |
| Bhutanese | 65 | 0.2% |
| Blackfeet | 8 | 0.0% |
| British | 123 | 0.4% |
| Burmese | 97 | 0.3% |
| Canadian | 52 | 0.2% |
| Cherokee | 184 | 0.6% |
| Chilean | 9 | 0.0% |
| Chippewa | 1 | 0.0% |
| Choctaw | 8 | 0.0% |
| Colombian | 3 | 0.0% |
| Croatian | 9 | 0.0% |
| Crow | 4 | 0.0% |
| Cuban | 14 | 0.0% |
| Czechoslovakian | 9 | 0.0% |
| Danish | 13 | 0.0% |
| Dutch | 383 | 1.2% |
| Dutch West Indian | 8 | 0.0% |
| Eastern European | 12 | 0.0% |
| English | 4,392 | 13.7% |
| European | 549 | 1.7% |
| Finnish | 19 | 0.1% |
| French | 309 | 1.0% |
| French American Indian | 47 | 0.2% |
| French Canadian | 155 | 0.5% |
| German | 2,690 | 8.4% |
| Greek | 24 | 0.1% |
| Guamanian / Chamorro | 14 | 0.0% |
| Guyanese | 1 | 0.0% |
| Indian (Asian) | 91 | 0.3% |
| Irish | 3,917 | 12.2% |
| Israeli | 26 | 0.1% |
| Italian | 457 | 1.4% |
| Korean | 38 | 0.1% |
| Lithuanian | 12 | 0.0% |
| Macedonian | 6 | 0.0% |
| Mexican | 264 | 0.8% |
| Mexican American Indian | 6 | 0.0% |
| Northern European | 55 | 0.2% |
| Norwegian | 171 | 0.5% |
| Palestinian | 4 | 0.0% |
| Polish | 358 | 1.1% |
| Portuguese | 8 | 0.0% |
| Puerto Rican | 58 | 0.2% |
| Russian | 37 | 0.1% |
| Scandinavian | 62 | 0.2% |
| Scotch-Irish | 380 | 1.2% |
| Scottish | 707 | 2.2% |
| Slavic | 13 | 0.0% |
| Slovak | 38 | 0.1% |
| South American | 12 | 0.0% |
| Spaniard | 127 | 0.4% |
| Spanish | 7 | 0.0% |
| Sri Lankan | 175 | 0.5% |
| Subsaharan African | 55 | 0.2% |
| Swedish | 76 | 0.2% |
| Swiss | 47 | 0.2% |
| Thai | 7 | 0.0% |
| Turkish | 6 | 0.0% |
| Ukrainian | 48 | 0.2% |
| Welsh | 104 | 0.3% | View All 67 Rows |
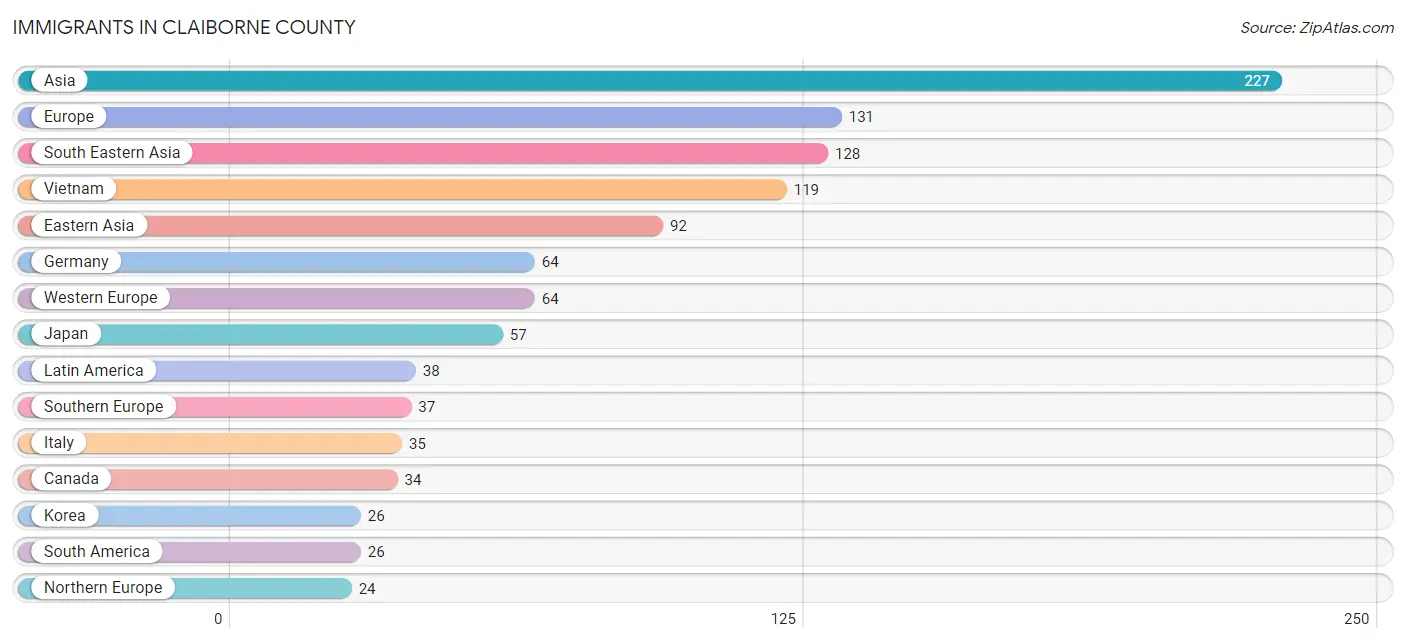
Immigrants in Claiborne County
The most numerous immigrant groups reported in Claiborne County came from Asia (227 | 0.7%), Europe (131 | 0.4%), South Eastern Asia (128 | 0.4%), Vietnam (119 | 0.4%), and Eastern Asia (92 | 0.3%), together accounting for 2.2% of all Claiborne County residents.
| Immigration Origin | # Population | % Population |
| Africa | 9 | 0.0% |
| Asia | 227 | 0.7% |
| Brazil | 14 | 0.0% |
| Canada | 34 | 0.1% |
| Central America | 12 | 0.0% |
| Chile | 9 | 0.0% |
| China | 9 | 0.0% |
| Colombia | 3 | 0.0% |
| Eastern Africa | 1 | 0.0% |
| Eastern Asia | 92 | 0.3% |
| Eastern Europe | 6 | 0.0% |
| Europe | 131 | 0.4% |
| Germany | 64 | 0.2% |
| Italy | 35 | 0.1% |
| Japan | 57 | 0.2% |
| Korea | 26 | 0.1% |
| Latin America | 38 | 0.1% |
| Mexico | 12 | 0.0% |
| Northern Europe | 24 | 0.1% |
| Philippines | 9 | 0.0% |
| Russia | 6 | 0.0% |
| South Africa | 8 | 0.0% |
| South America | 26 | 0.1% |
| South Eastern Asia | 128 | 0.4% |
| Southern Europe | 37 | 0.1% |
| Spain | 2 | 0.0% |
| Sweden | 7 | 0.0% |
| Turkey | 7 | 0.0% |
| Vietnam | 119 | 0.4% |
| Western Asia | 7 | 0.0% |
| Western Europe | 64 | 0.2% | View All 31 Rows |
Sex and Age in Claiborne County
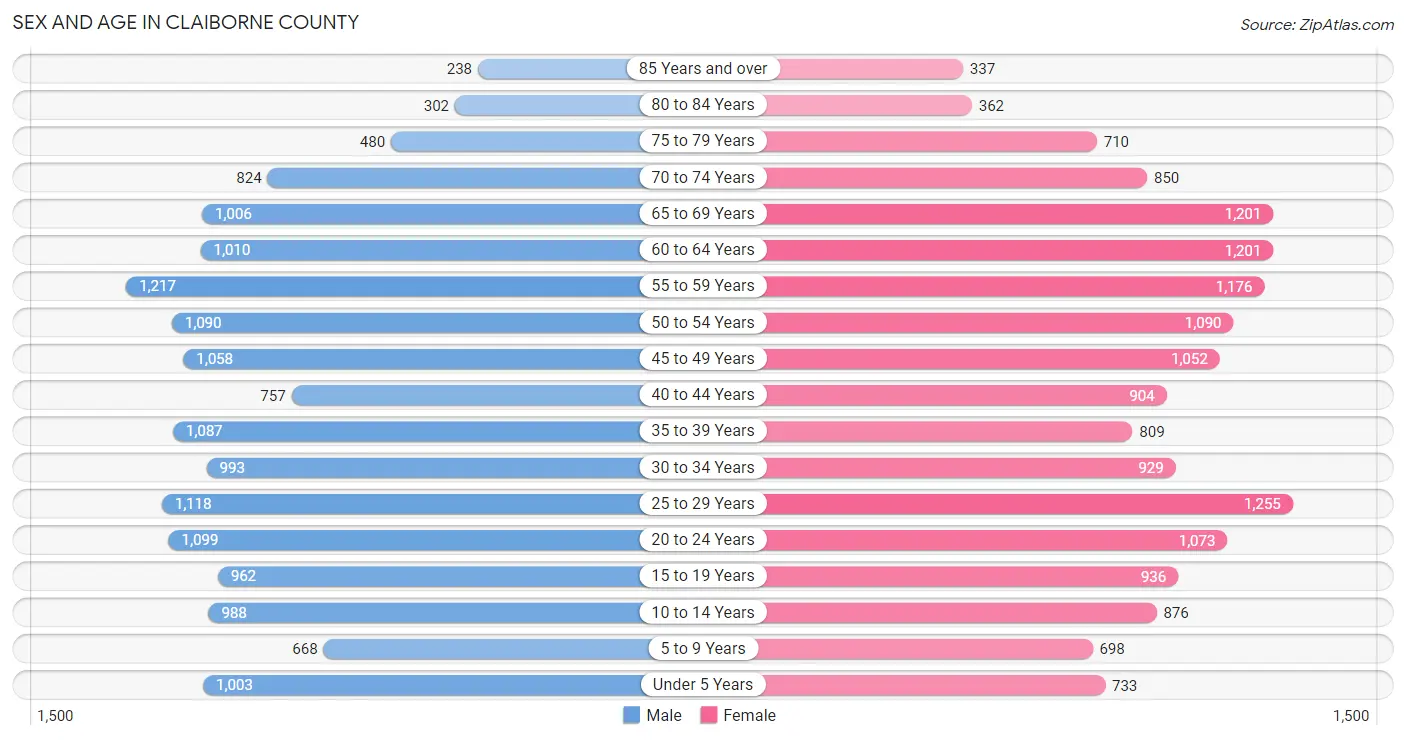
Sex and Age in Claiborne County
The most populous age groups in Claiborne County are 55 to 59 Years (1,217 | 7.6%) for men and 25 to 29 Years (1,255 | 7.7%) for women.
| Age Bracket | Male | Female |
| Under 5 Years | 1,003 (6.3%) | 733 (4.5%) |
| 5 to 9 Years | 668 (4.2%) | 698 (4.3%) |
| 10 to 14 Years | 988 (6.2%) | 876 (5.4%) |
| 15 to 19 Years | 962 (6.0%) | 936 (5.8%) |
| 20 to 24 Years | 1,099 (6.9%) | 1,073 (6.6%) |
| 25 to 29 Years | 1,118 (7.0%) | 1,255 (7.7%) |
| 30 to 34 Years | 993 (6.2%) | 929 (5.7%) |
| 35 to 39 Years | 1,087 (6.8%) | 809 (5.0%) |
| 40 to 44 Years | 757 (4.8%) | 904 (5.6%) |
| 45 to 49 Years | 1,058 (6.7%) | 1,052 (6.5%) |
| 50 to 54 Years | 1,090 (6.9%) | 1,090 (6.7%) |
| 55 to 59 Years | 1,217 (7.6%) | 1,176 (7.3%) |
| 60 to 64 Years | 1,010 (6.4%) | 1,201 (7.4%) |
| 65 to 69 Years | 1,006 (6.3%) | 1,201 (7.4%) |
| 70 to 74 Years | 824 (5.2%) | 850 (5.2%) |
| 75 to 79 Years | 480 (3.0%) | 710 (4.4%) |
| 80 to 84 Years | 302 (1.9%) | 362 (2.2%) |
| 85 Years and over | 238 (1.5%) | 337 (2.1%) |
| Total | 15,900 (100.0%) | 16,192 (100.0%) |
Families and Households in Claiborne County
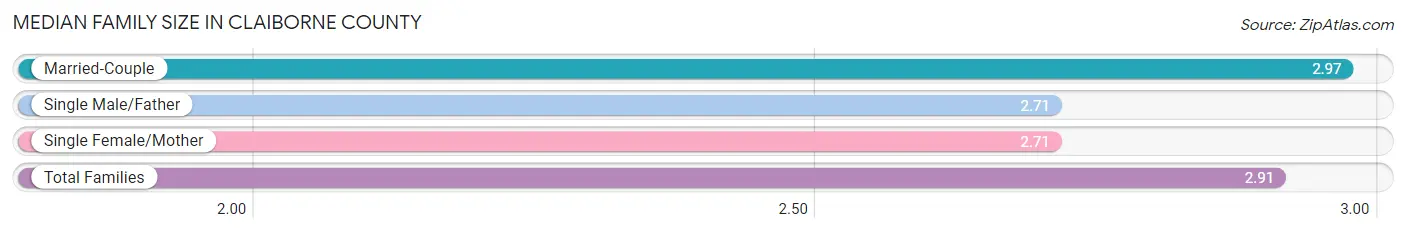
Median Family Size in Claiborne County
The median family size in Claiborne County is 2.91 persons per family, with married-couple families (6,355 | 76.9%) accounting for the largest median family size of 2.97 persons per family. On the other hand, single male/father families (607 | 7.3%) represent the smallest median family size with 2.71 persons per family.
| Family Type | # Families | Family Size |
| Married-Couple | 6,355 (76.9%) | 2.97 |
| Single Male/Father | 607 (7.3%) | 2.71 |
| Single Female/Mother | 1,304 (15.8%) | 2.71 |
| Total Families | 8,266 (100.0%) | 2.91 |
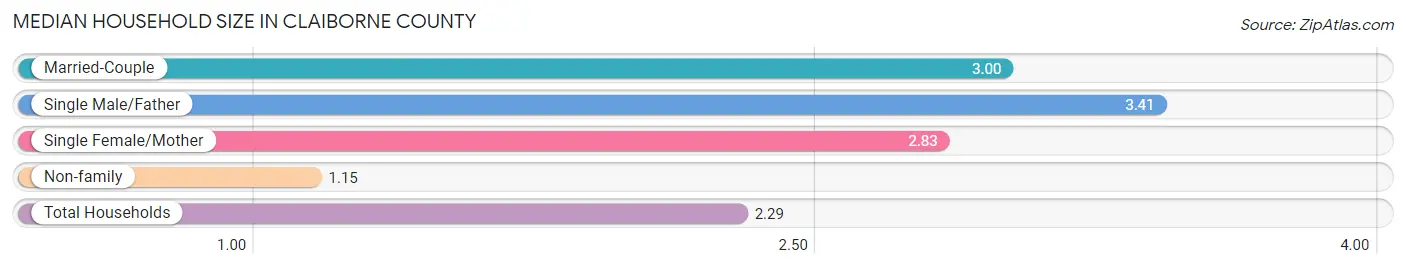
Median Household Size in Claiborne County
The median household size in Claiborne County is 2.29 persons per household, with single male/father households (607 | 4.5%) accounting for the largest median household size of 3.41 persons per household. non-family households (5,213 | 38.7%) represent the smallest median household size with 1.15 persons per household.
| Household Type | # Households | Household Size |
| Married-Couple | 6,355 (47.1%) | 3.00 |
| Single Male/Father | 607 (4.5%) | 3.41 |
| Single Female/Mother | 1,304 (9.7%) | 2.83 |
| Non-family | 5,213 (38.7%) | 1.15 |
| Total Households | 13,479 (100.0%) | 2.29 |
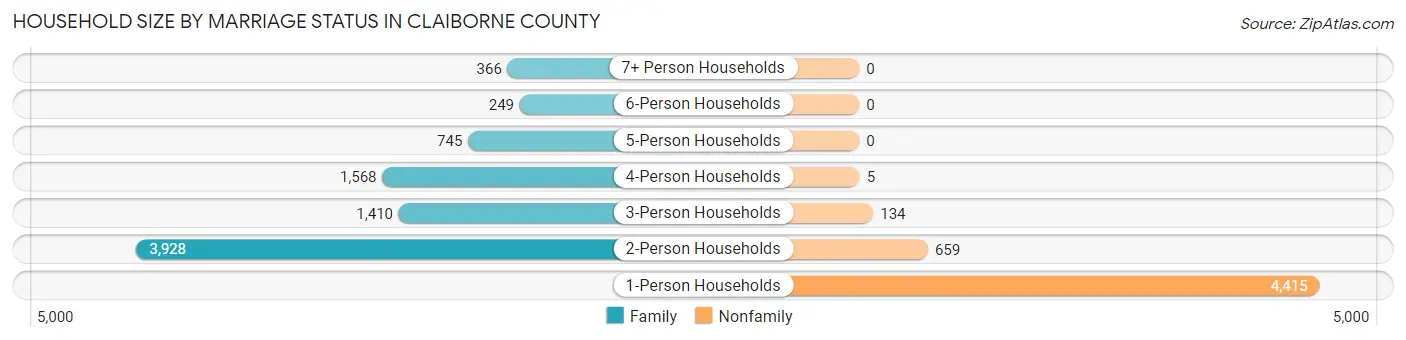
Household Size by Marriage Status in Claiborne County
Out of a total of 13,479 households in Claiborne County, 8,266 (61.3%) are family households, while 5,213 (38.7%) are nonfamily households. The most numerous type of family households are 2-person households, comprising 3,928, and the most common type of nonfamily households are 1-person households, comprising 4,415.
| Household Size | Family Households | Nonfamily Households |
| 1-Person Households | - | 4,415 (32.8%) |
| 2-Person Households | 3,928 (29.1%) | 659 (4.9%) |
| 3-Person Households | 1,410 (10.5%) | 134 (1.0%) |
| 4-Person Households | 1,568 (11.6%) | 5 (0.0%) |
| 5-Person Households | 745 (5.5%) | 0 (0.0%) |
| 6-Person Households | 249 (1.8%) | 0 (0.0%) |
| 7+ Person Households | 366 (2.7%) | 0 (0.0%) |
| Total | 8,266 (61.3%) | 5,213 (38.7%) |
Female Fertility in Claiborne County
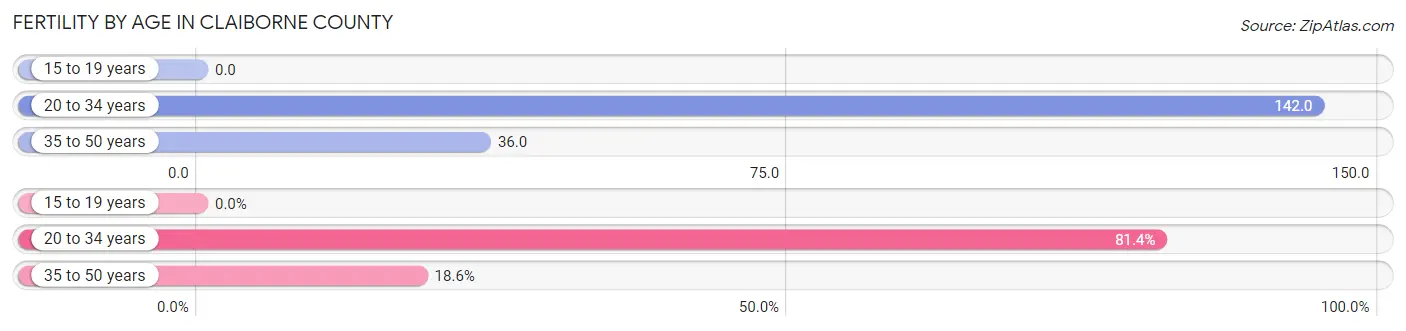
Fertility by Age in Claiborne County
Average fertility rate in Claiborne County is 79.0 births per 1,000 women. Women in the age bracket of 20 to 34 years have the highest fertility rate with 142.0 births per 1,000 women. Women in the age bracket of 20 to 34 years acount for 81.4% of all women with births.
| Age Bracket | Women with Births | Births / 1,000 Women |
| 15 to 19 years | 0 (0.0%) | 0.0 |
| 20 to 34 years | 463 (81.4%) | 142.0 |
| 35 to 50 years | 106 (18.6%) | 36.0 |
| Total | 569 (100.0%) | 79.0 |
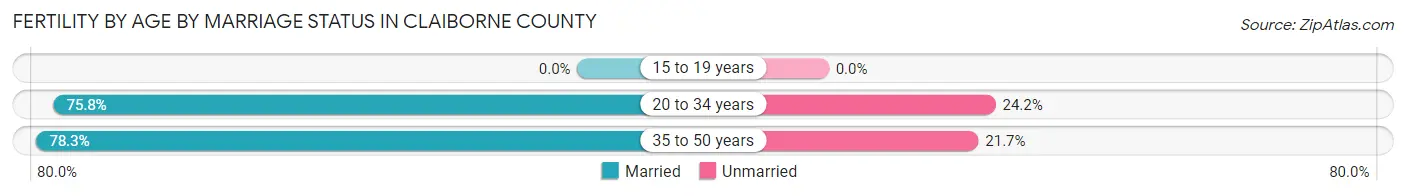
Fertility by Age by Marriage Status in Claiborne County
76.3% of women with births (569) in Claiborne County are married. The highest percentage of unmarried women with births falls into 20 to 34 years age bracket with 24.2% of them unmarried at the time of birth, while the lowest percentage of unmarried women with births belong to 35 to 50 years age bracket with 21.7% of them unmarried.
| Age Bracket | Married | Unmarried |
| 15 to 19 years | 0 (0.0%) | 0 (0.0%) |
| 20 to 34 years | 351 (75.8%) | 112 (24.2%) |
| 35 to 50 years | 83 (78.3%) | 23 (21.7%) |
| Total | 434 (76.3%) | 135 (23.7%) |
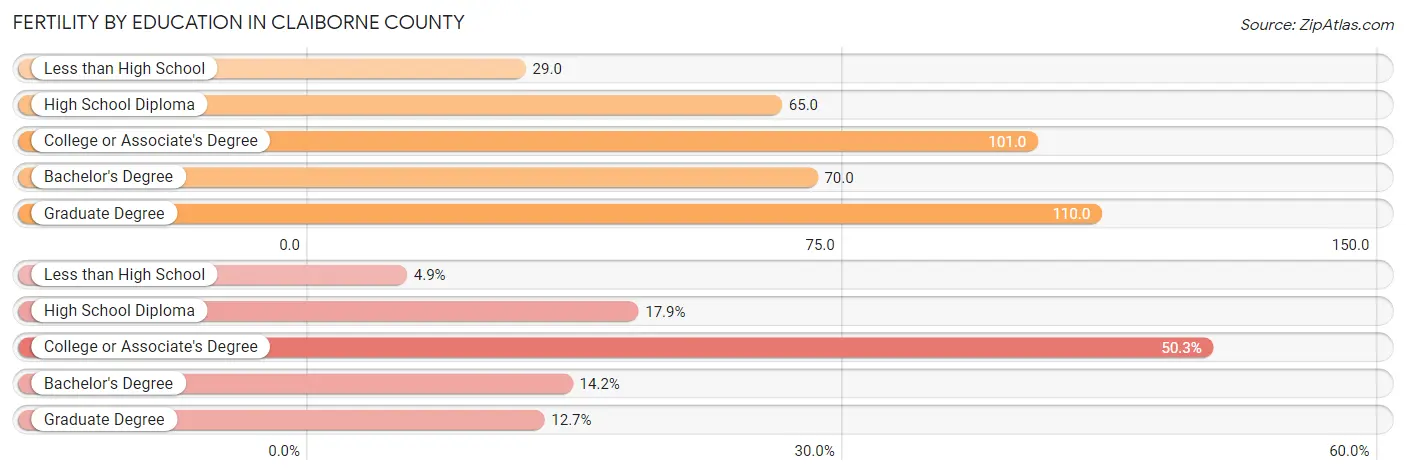
Fertility by Education in Claiborne County
Average fertility rate in Claiborne County is 79.0 births per 1,000 women. Women with the education attainment of graduate degree have the highest fertility rate of 110.0 births per 1,000 women, while women with the education attainment of less than high school have the lowest fertility at 29.0 births per 1,000 women. Women with the education attainment of college or associate's degree represent 50.3% of all women with births.
| Educational Attainment | Women with Births | Births / 1,000 Women |
| Less than High School | 28 (4.9%) | 29.0 |
| High School Diploma | 102 (17.9%) | 65.0 |
| College or Associate's Degree | 286 (50.3%) | 101.0 |
| Bachelor's Degree | 81 (14.2%) | 70.0 |
| Graduate Degree | 72 (12.7%) | 110.0 |
| Total | 569 (100.0%) | 79.0 |
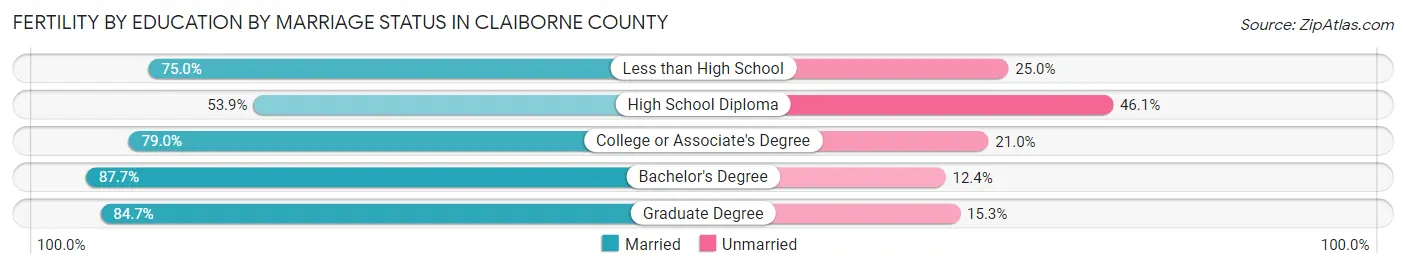
Fertility by Education by Marriage Status in Claiborne County
23.7% of women with births in Claiborne County are unmarried. Women with the educational attainment of bachelor's degree are most likely to be married with 87.6% of them married at childbirth, while women with the educational attainment of high school diploma are least likely to be married with 46.1% of them unmarried at childbirth.
| Educational Attainment | Married | Unmarried |
| Less than High School | 21 (75.0%) | 7 (25.0%) |
| High School Diploma | 55 (53.9%) | 47 (46.1%) |
| College or Associate's Degree | 226 (79.0%) | 60 (21.0%) |
| Bachelor's Degree | 71 (87.6%) | 10 (12.3%) |
| Graduate Degree | 61 (84.7%) | 11 (15.3%) |
| Total | 434 (76.3%) | 135 (23.7%) |
Employment Characteristics in Claiborne County
Employment by Class of Employer in Claiborne County
Among the 12,619 employed individuals in Claiborne County, private company employees (8,733 | 69.2%), local government employees (1,109 | 8.8%), and not-for-profit organizations (850 | 6.7%) make up the most common classes of employment.
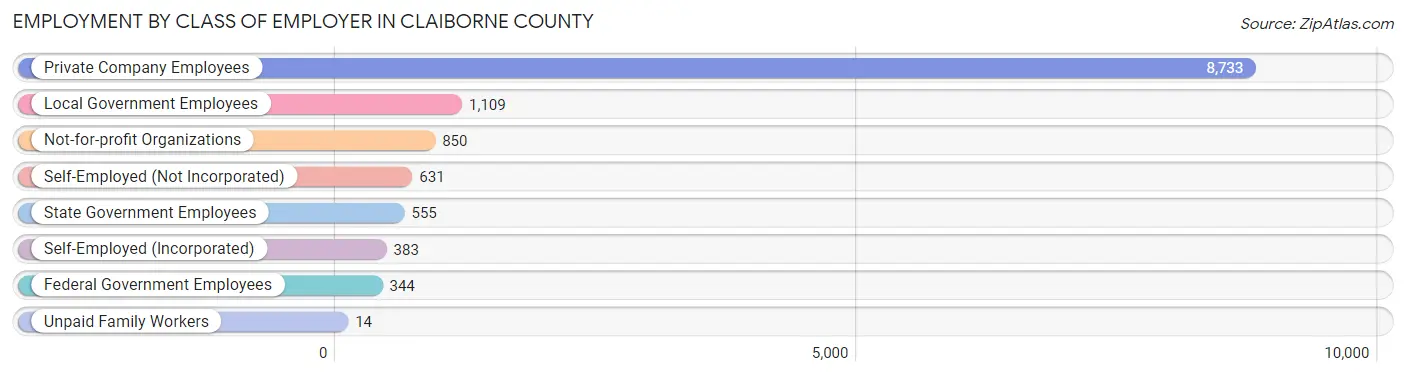
| Employer Class | # Employees | % Employees |
| Private Company Employees | 8,733 | 69.2% |
| Self-Employed (Incorporated) | 383 | 3.0% |
| Self-Employed (Not Incorporated) | 631 | 5.0% |
| Not-for-profit Organizations | 850 | 6.7% |
| Local Government Employees | 1,109 | 8.8% |
| State Government Employees | 555 | 4.4% |
| Federal Government Employees | 344 | 2.7% |
| Unpaid Family Workers | 14 | 0.1% |
| Total | 12,619 | 100.0% |
Employment Status by Age in Claiborne County
According to the labor force statistics for Claiborne County, out of the total population over 16 years of age (26,655), 51.7% or 13,781 individuals are in the labor force, with 6.1% or 841 of them unemployed. The age group with the highest labor force participation rate is 35 to 44 years, with 77.1% or 2,742 individuals in the labor force. Within the labor force, the 16 to 19 years age range has the highest percentage of unemployed individuals, with 13.0% or 73 of them being unemployed.
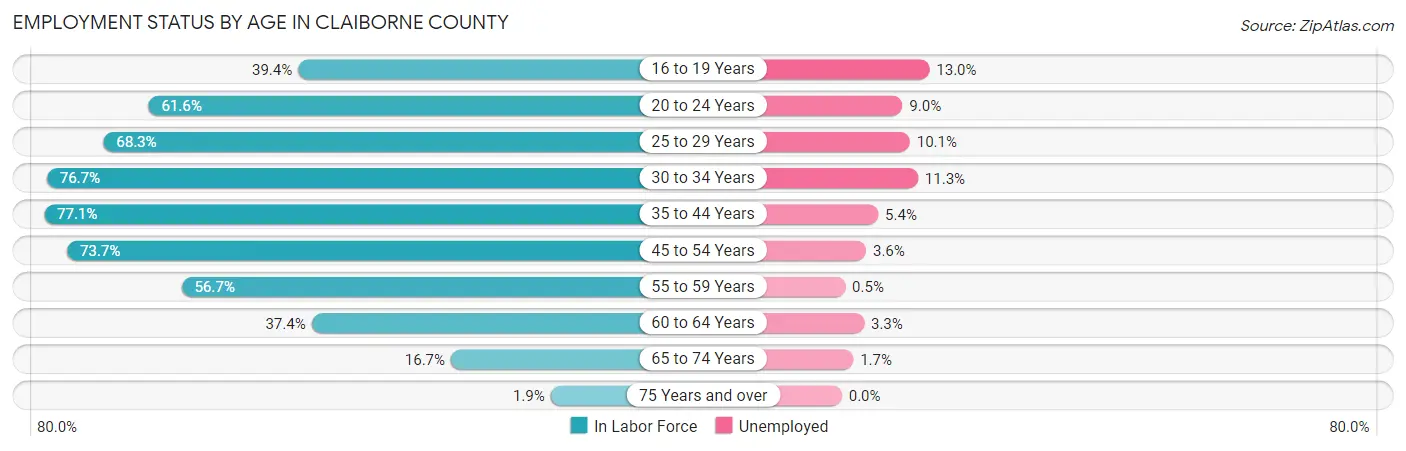
| Age Bracket | In Labor Force | Unemployed |
| 16 to 19 Years | 562 (39.4%) | 73 (13.0%) |
| 20 to 24 Years | 1,338 (61.6%) | 120 (9.0%) |
| 25 to 29 Years | 1,621 (68.3%) | 164 (10.1%) |
| 30 to 34 Years | 1,474 (76.7%) | 167 (11.3%) |
| 35 to 44 Years | 2,742 (77.1%) | 148 (5.4%) |
| 45 to 54 Years | 3,162 (73.7%) | 114 (3.6%) |
| 55 to 59 Years | 1,357 (56.7%) | 7 (0.5%) |
| 60 to 64 Years | 827 (37.4%) | 27 (3.3%) |
| 65 to 74 Years | 648 (16.7%) | 11 (1.7%) |
| 75 Years and over | 46 (1.9%) | 0 (0.0%) |
| Total | 13,781 (51.7%) | 841 (6.1%) |
Employment Status by Educational Attainment in Claiborne County
According to labor force statistics for Claiborne County, 66.8% of individuals (11,186) out of the total population between 25 and 64 years of age (16,746) are in the labor force, with 5.6% or 626 of them being unemployed. The group with the highest labor force participation rate are those with the educational attainment of college / associate degree, with 75.2% or 3,495 individuals in the labor force. Within the labor force, individuals with college / associate degree education have the highest percentage of unemployment, with 8.7% or 304 of them being unemployed.
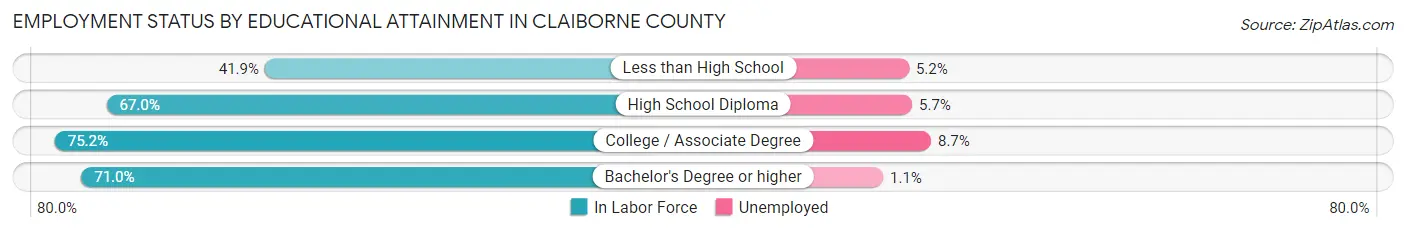
| Educational Attainment | In Labor Force | Unemployed |
| Less than High School | 926 (41.9%) | 115 (5.2%) |
| High School Diploma | 4,364 (67.0%) | 371 (5.7%) |
| College / Associate Degree | 3,495 (75.2%) | 404 (8.7%) |
| Bachelor's Degree or higher | 2,395 (71.0%) | 37 (1.1%) |
| Total | 11,186 (66.8%) | 938 (5.6%) |
Employment Occupations by Sex in Claiborne County
Management, Business, Science and Arts Occupations
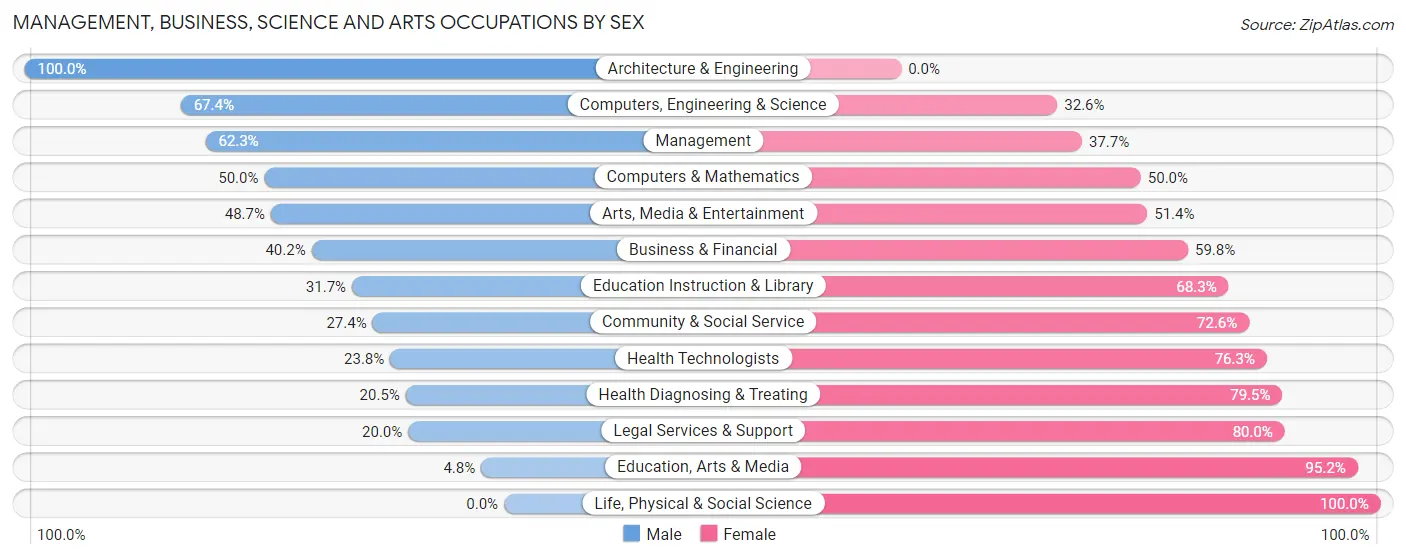
The most common Management, Business, Science and Arts occupations in Claiborne County are Community & Social Service (1,130 | 8.7%), Management (1,092 | 8.4%), Health Diagnosing & Treating (1,024 | 7.9%), Education Instruction & Library (807 | 6.2%), and Health Technologists (741 | 5.7%).
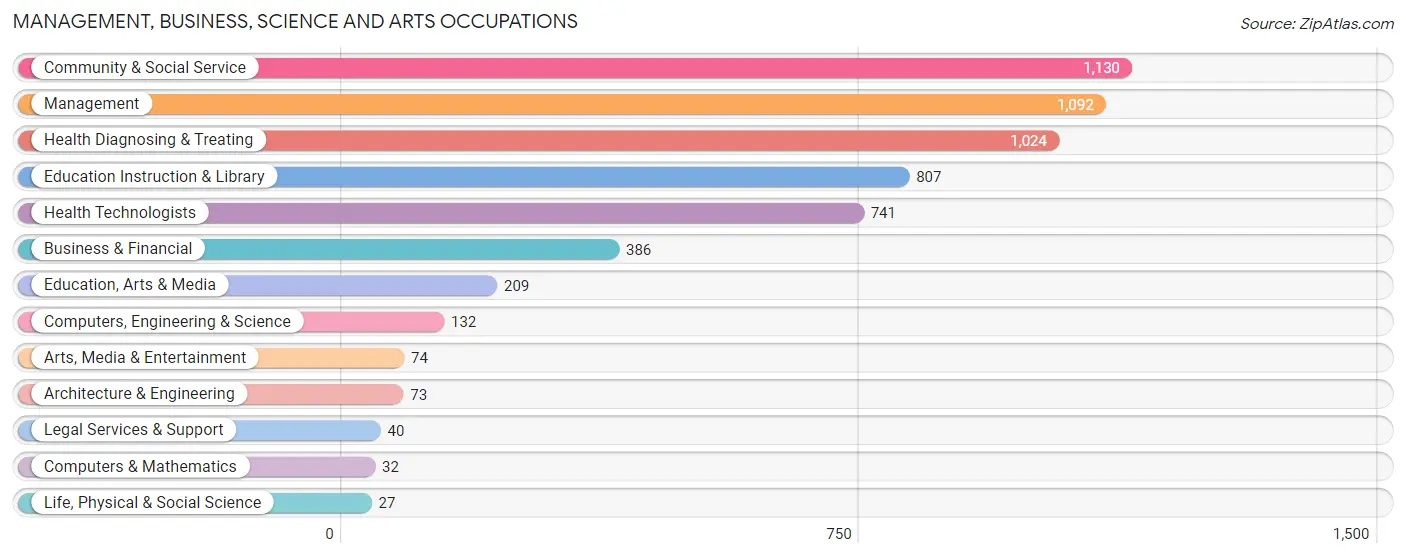
Management, Business, Science and Arts Occupations by Sex
Within the Management, Business, Science and Arts occupations in Claiborne County, the most male-oriented occupations are Architecture & Engineering (100.0%), Computers, Engineering & Science (67.4%), and Management (62.3%), while the most female-oriented occupations are Life, Physical & Social Science (100.0%), Education, Arts & Media (95.2%), and Legal Services & Support (80.0%).
| Occupation | Male | Female |
| Management | 680 (62.3%) | 412 (37.7%) |
| Business & Financial | 155 (40.2%) | 231 (59.8%) |
| Computers, Engineering & Science | 89 (67.4%) | 43 (32.6%) |
| Computers & Mathematics | 16 (50.0%) | 16 (50.0%) |
| Architecture & Engineering | 73 (100.0%) | 0 (0.0%) |
| Life, Physical & Social Science | 0 (0.0%) | 27 (100.0%) |
| Community & Social Service | 310 (27.4%) | 820 (72.6%) |
| Education, Arts & Media | 10 (4.8%) | 199 (95.2%) |
| Legal Services & Support | 8 (20.0%) | 32 (80.0%) |
| Education Instruction & Library | 256 (31.7%) | 551 (68.3%) |
| Arts, Media & Entertainment | 36 (48.6%) | 38 (51.3%) |
| Health Diagnosing & Treating | 210 (20.5%) | 814 (79.5%) |
| Health Technologists | 176 (23.7%) | 565 (76.2%) |
| Total (Category) | 1,444 (38.4%) | 2,320 (61.6%) |
| Total (Overall) | 6,984 (54.0%) | 5,947 (46.0%) |
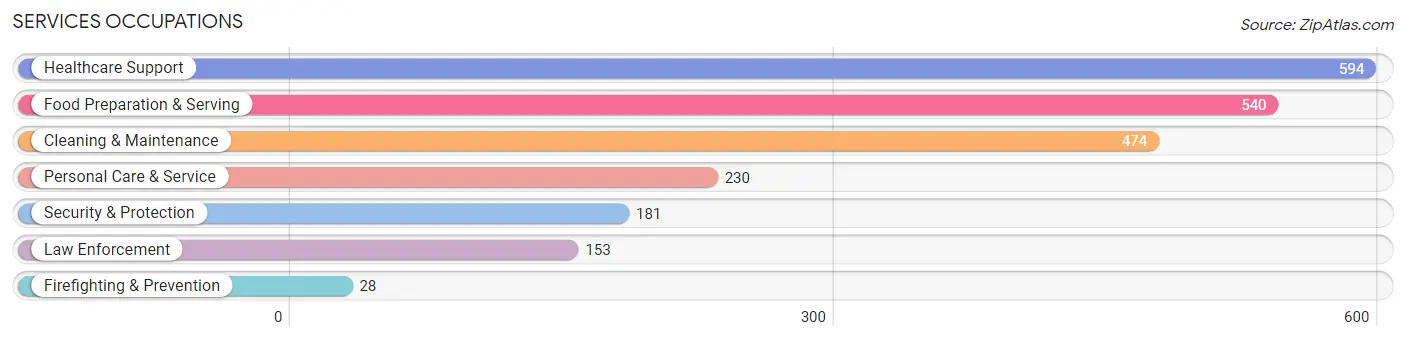
Services Occupations
The most common Services occupations in Claiborne County are Healthcare Support (594 | 4.6%), Food Preparation & Serving (540 | 4.2%), Cleaning & Maintenance (474 | 3.7%), Personal Care & Service (230 | 1.8%), and Security & Protection (181 | 1.4%).
Services Occupations by Sex
Within the Services occupations in Claiborne County, the most male-oriented occupations are Firefighting & Prevention (100.0%), Security & Protection (92.8%), and Law Enforcement (91.5%), while the most female-oriented occupations are Healthcare Support (89.4%), Food Preparation & Serving (74.1%), and Personal Care & Service (73.5%).
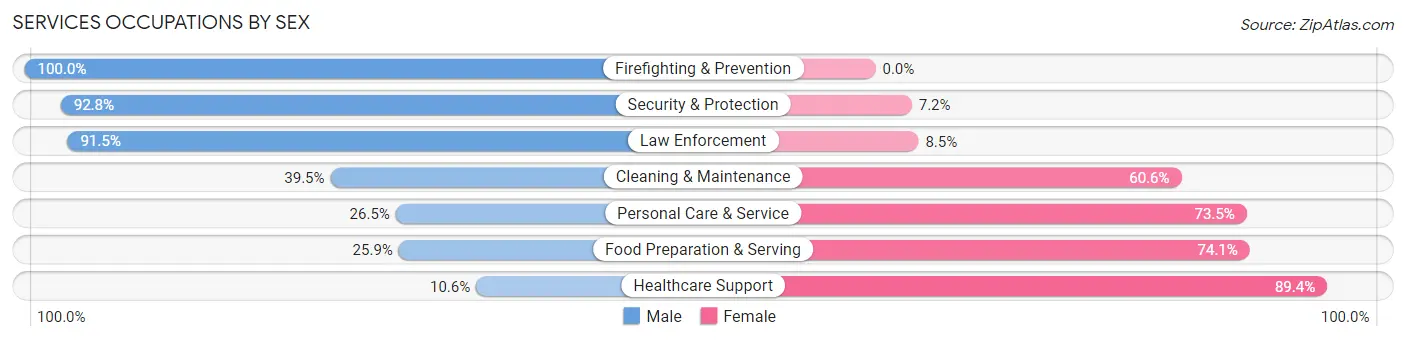
| Occupation | Male | Female |
| Healthcare Support | 63 (10.6%) | 531 (89.4%) |
| Security & Protection | 168 (92.8%) | 13 (7.2%) |
| Firefighting & Prevention | 28 (100.0%) | 0 (0.0%) |
| Law Enforcement | 140 (91.5%) | 13 (8.5%) |
| Food Preparation & Serving | 140 (25.9%) | 400 (74.1%) |
| Cleaning & Maintenance | 187 (39.5%) | 287 (60.6%) |
| Personal Care & Service | 61 (26.5%) | 169 (73.5%) |
| Total (Category) | 619 (30.7%) | 1,400 (69.3%) |
| Total (Overall) | 6,984 (54.0%) | 5,947 (46.0%) |
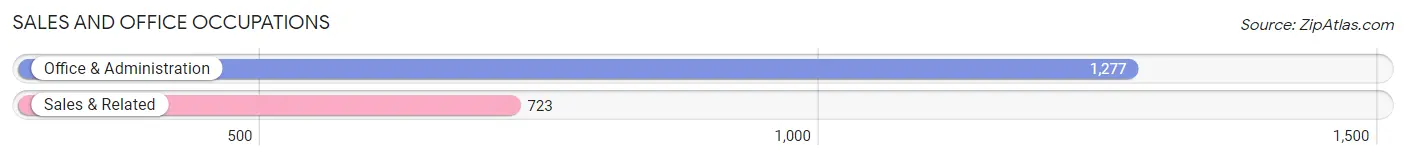
Sales and Office Occupations
The most common Sales and Office occupations in Claiborne County are Office & Administration (1,277 | 9.9%), and Sales & Related (723 | 5.6%).
Sales and Office Occupations by Sex
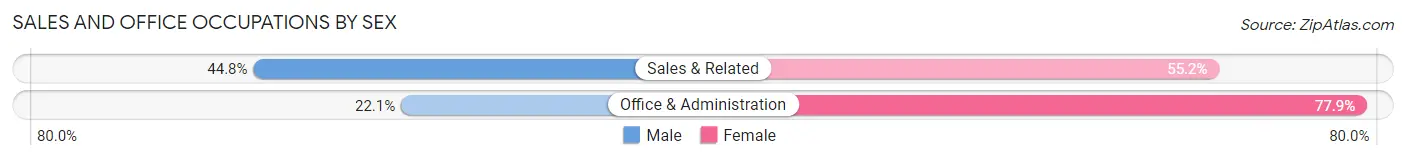
| Occupation | Male | Female |
| Sales & Related | 324 (44.8%) | 399 (55.2%) |
| Office & Administration | 282 (22.1%) | 995 (77.9%) |
| Total (Category) | 606 (30.3%) | 1,394 (69.7%) |
| Total (Overall) | 6,984 (54.0%) | 5,947 (46.0%) |
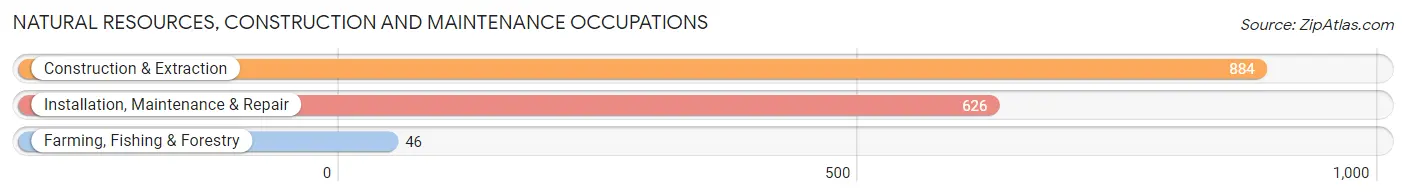
Natural Resources, Construction and Maintenance Occupations
The most common Natural Resources, Construction and Maintenance occupations in Claiborne County are Construction & Extraction (884 | 6.8%), Installation, Maintenance & Repair (626 | 4.8%), and Farming, Fishing & Forestry (46 | 0.4%).
Natural Resources, Construction and Maintenance Occupations by Sex
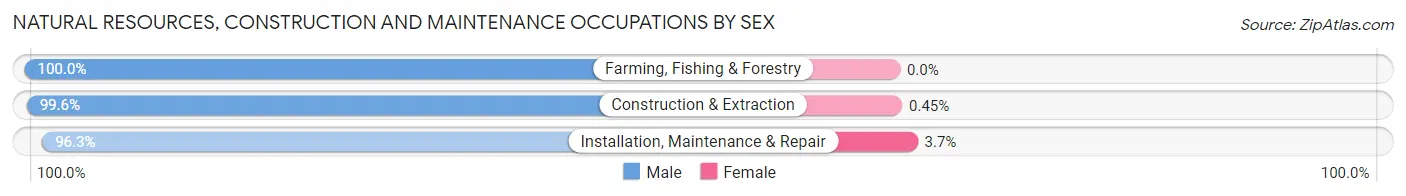
| Occupation | Male | Female |
| Farming, Fishing & Forestry | 46 (100.0%) | 0 (0.0%) |
| Construction & Extraction | 880 (99.6%) | 4 (0.4%) |
| Installation, Maintenance & Repair | 603 (96.3%) | 23 (3.7%) |
| Total (Category) | 1,529 (98.3%) | 27 (1.7%) |
| Total (Overall) | 6,984 (54.0%) | 5,947 (46.0%) |
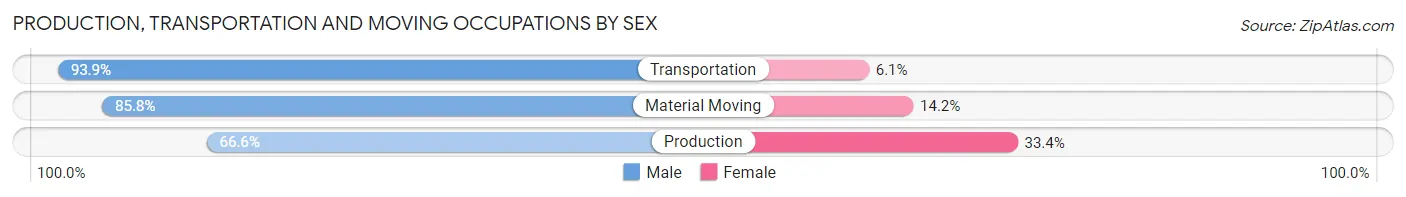
Production, Transportation and Moving Occupations
The most common Production, Transportation and Moving occupations in Claiborne County are Production (1,913 | 14.8%), Transportation (885 | 6.8%), and Material Moving (794 | 6.1%).
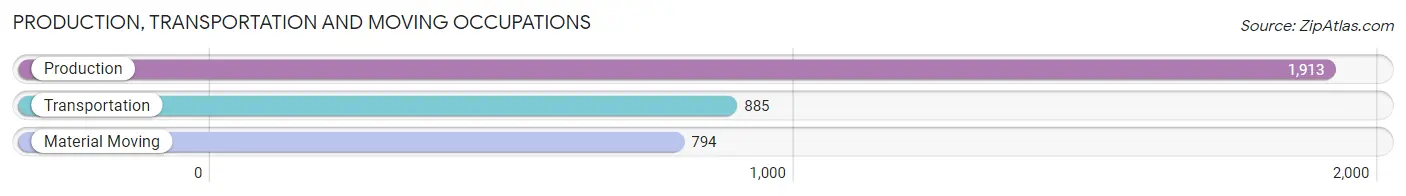
Production, Transportation and Moving Occupations by Sex
| Occupation | Male | Female |
| Production | 1,274 (66.6%) | 639 (33.4%) |
| Transportation | 831 (93.9%) | 54 (6.1%) |
| Material Moving | 681 (85.8%) | 113 (14.2%) |
| Total (Category) | 2,786 (77.6%) | 806 (22.4%) |
| Total (Overall) | 6,984 (54.0%) | 5,947 (46.0%) |
Employment Industries by Sex in Claiborne County
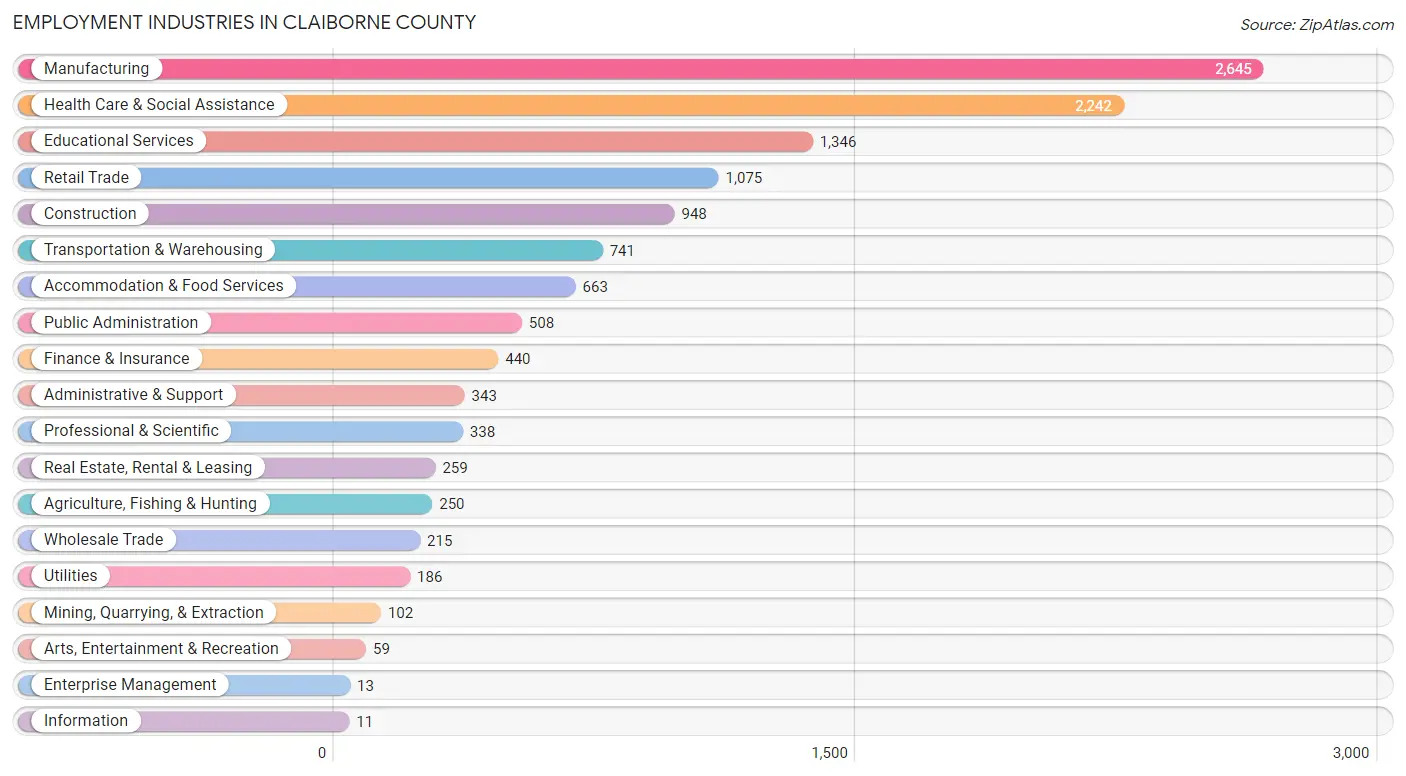
Employment Industries in Claiborne County
The major employment industries in Claiborne County include Manufacturing (2,645 | 20.4%), Health Care & Social Assistance (2,242 | 17.3%), Educational Services (1,346 | 10.4%), Retail Trade (1,075 | 8.3%), and Construction (948 | 7.3%).
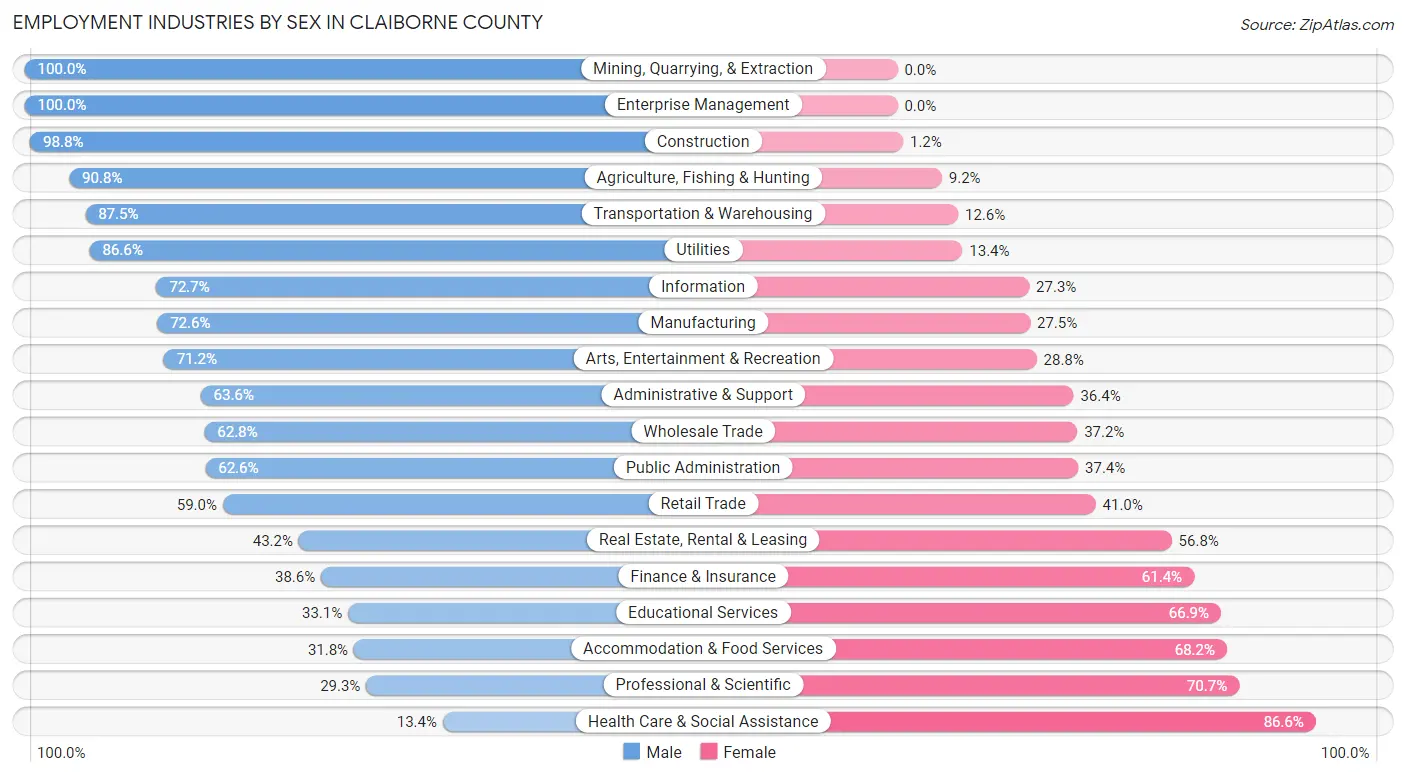
Employment Industries by Sex in Claiborne County
The Claiborne County industries that see more men than women are Mining, Quarrying, & Extraction (100.0%), Enterprise Management (100.0%), and Construction (98.8%), whereas the industries that tend to have a higher number of women are Health Care & Social Assistance (86.6%), Professional & Scientific (70.7%), and Accommodation & Food Services (68.2%).
| Industry | Male | Female |
| Agriculture, Fishing & Hunting | 227 (90.8%) | 23 (9.2%) |
| Mining, Quarrying, & Extraction | 102 (100.0%) | 0 (0.0%) |
| Construction | 937 (98.8%) | 11 (1.2%) |
| Manufacturing | 1,919 (72.6%) | 726 (27.5%) |
| Wholesale Trade | 135 (62.8%) | 80 (37.2%) |
| Retail Trade | 634 (59.0%) | 441 (41.0%) |
| Transportation & Warehousing | 648 (87.5%) | 93 (12.6%) |
| Utilities | 161 (86.6%) | 25 (13.4%) |
| Information | 8 (72.7%) | 3 (27.3%) |
| Finance & Insurance | 170 (38.6%) | 270 (61.4%) |
| Real Estate, Rental & Leasing | 112 (43.2%) | 147 (56.8%) |
| Professional & Scientific | 99 (29.3%) | 239 (70.7%) |
| Enterprise Management | 13 (100.0%) | 0 (0.0%) |
| Administrative & Support | 218 (63.6%) | 125 (36.4%) |
| Educational Services | 445 (33.1%) | 901 (66.9%) |
| Health Care & Social Assistance | 301 (13.4%) | 1,941 (86.6%) |
| Arts, Entertainment & Recreation | 42 (71.2%) | 17 (28.8%) |
| Accommodation & Food Services | 211 (31.8%) | 452 (68.2%) |
| Public Administration | 318 (62.6%) | 190 (37.4%) |
| Total | 6,984 (54.0%) | 5,947 (46.0%) |
Education in Claiborne County
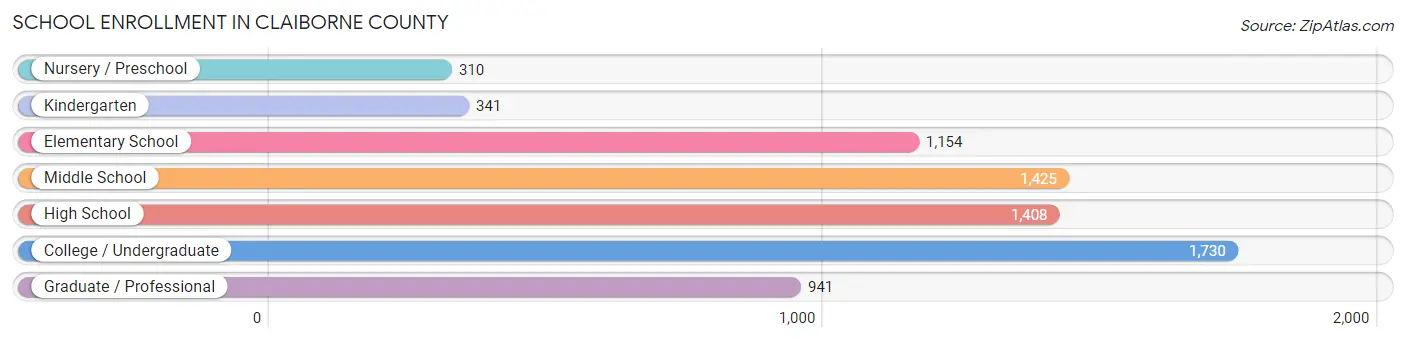
School Enrollment in Claiborne County
The most common levels of schooling among the 7,309 students in Claiborne County are college / undergraduate (1,730 | 23.7%), middle school (1,425 | 19.5%), and high school (1,408 | 19.3%).
| School Level | # Students | % Students |
| Nursery / Preschool | 310 | 4.2% |
| Kindergarten | 341 | 4.7% |
| Elementary School | 1,154 | 15.8% |
| Middle School | 1,425 | 19.5% |
| High School | 1,408 | 19.3% |
| College / Undergraduate | 1,730 | 23.7% |
| Graduate / Professional | 941 | 12.9% |
| Total | 7,309 | 100.0% |
School Enrollment by Age by Funding Source in Claiborne County
Out of a total of 7,309 students who are enrolled in schools in Claiborne County, 2,047 (28.0%) attend a private institution, while the remaining 5,262 (72.0%) are enrolled in public schools. The age group of 20 to 24 year olds has the highest likelihood of being enrolled in private schools, with 764 (70.4% in the age bracket) enrolled. Conversely, the age group of 15 to 17 year olds has the lowest likelihood of being enrolled in a private school, with 985 (92.9% in the age bracket) attending a public institution.
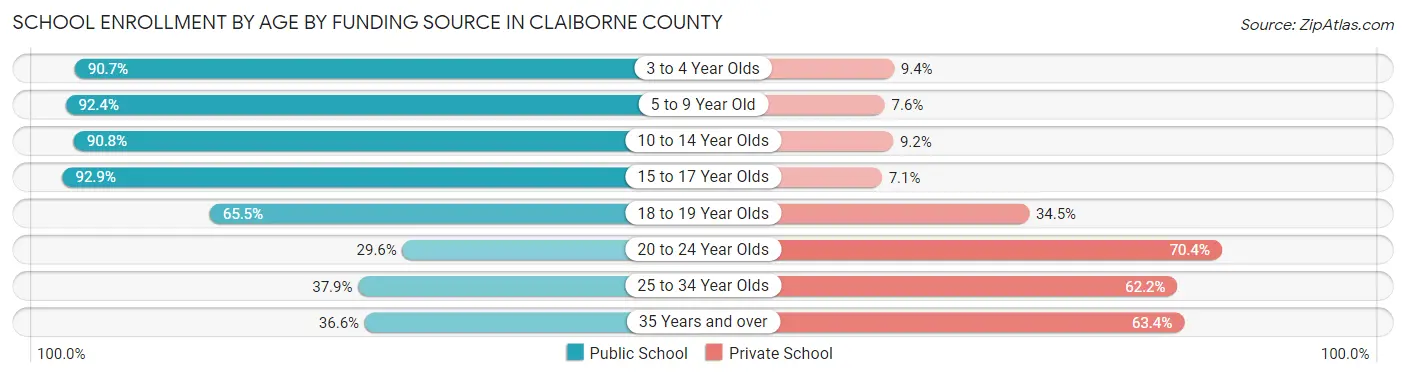
| Age Bracket | Public School | Private School |
| 3 to 4 Year Olds | 281 (90.6%) | 29 (9.3%) |
| 5 to 9 Year Old | 1,200 (92.4%) | 99 (7.6%) |
| 10 to 14 Year Olds | 1,632 (90.8%) | 165 (9.2%) |
| 15 to 17 Year Olds | 985 (92.9%) | 75 (7.1%) |
| 18 to 19 Year Olds | 427 (65.5%) | 225 (34.5%) |
| 20 to 24 Year Olds | 321 (29.6%) | 764 (70.4%) |
| 25 to 34 Year Olds | 307 (37.9%) | 504 (62.2%) |
| 35 Years and over | 108 (36.6%) | 187 (63.4%) |
| Total | 5,262 (72.0%) | 2,047 (28.0%) |
Educational Attainment by Field of Study in Claiborne County
Education (1,115 | 23.9%), science & technology (808 | 17.3%), business (806 | 17.3%), bio, nature & agricultural (521 | 11.2%), and arts & humanities (310 | 6.7%) are the most common fields of study among 4,661 individuals in Claiborne County who have obtained a bachelor's degree or higher.
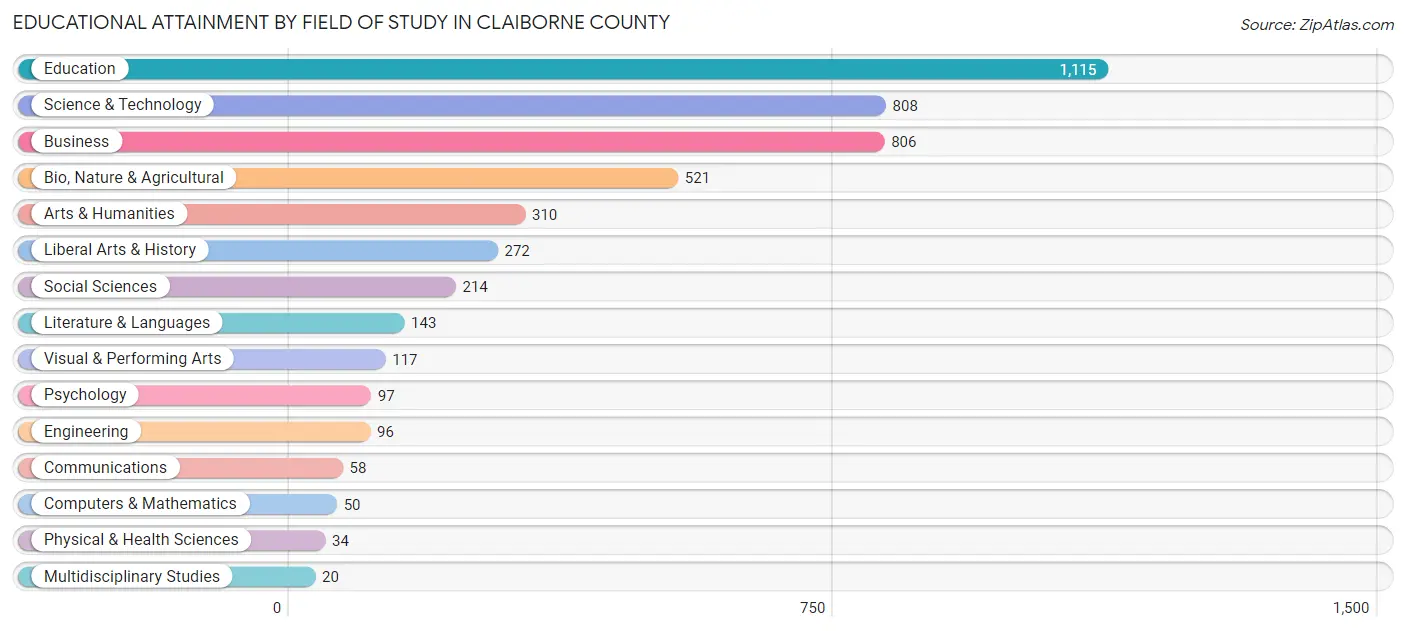
| Field of Study | # Graduates | % Graduates |
| Computers & Mathematics | 50 | 1.1% |
| Bio, Nature & Agricultural | 521 | 11.2% |
| Physical & Health Sciences | 34 | 0.7% |
| Psychology | 97 | 2.1% |
| Social Sciences | 214 | 4.6% |
| Engineering | 96 | 2.1% |
| Multidisciplinary Studies | 20 | 0.4% |
| Science & Technology | 808 | 17.3% |
| Business | 806 | 17.3% |
| Education | 1,115 | 23.9% |
| Literature & Languages | 143 | 3.1% |
| Liberal Arts & History | 272 | 5.8% |
| Visual & Performing Arts | 117 | 2.5% |
| Communications | 58 | 1.2% |
| Arts & Humanities | 310 | 6.7% |
| Total | 4,661 | 100.0% |
Transportation & Commute in Claiborne County
Vehicle Availability by Sex in Claiborne County
The most prevalent vehicle ownership categories in Claiborne County are males with 2 vehicles (2,396, accounting for 35.0%) and females with 2 vehicles (1,693, making up 43.1%).
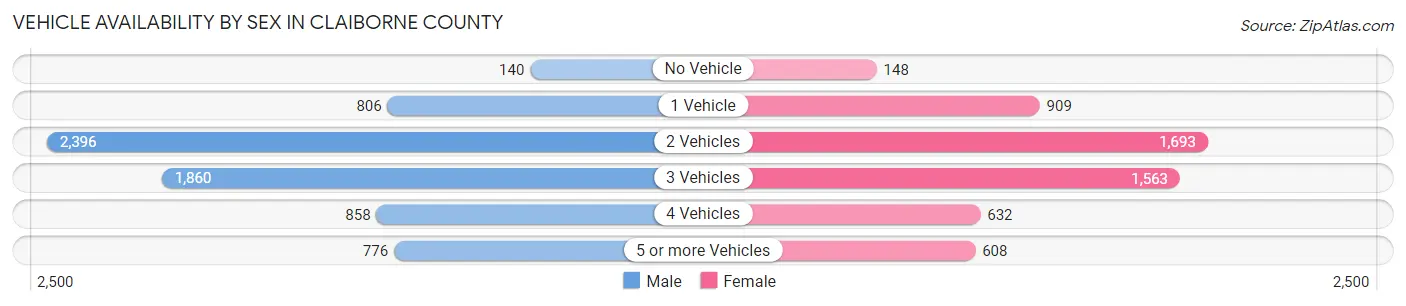
| Vehicles Available | Male | Female |
| No Vehicle | 140 (2.1%) | 148 (2.7%) |
| 1 Vehicle | 806 (11.8%) | 909 (16.4%) |
| 2 Vehicles | 2,396 (35.0%) | 1,693 (30.5%) |
| 3 Vehicles | 1,860 (27.2%) | 1,563 (28.1%) |
| 4 Vehicles | 858 (12.6%) | 632 (11.4%) |
| 5 or more Vehicles | 776 (11.4%) | 608 (11.0%) |
| Total | 6,836 (100.0%) | 5,553 (100.0%) |
Commute Time in Claiborne County
The most frequently occuring commute durations in Claiborne County are 15 to 19 minutes (2,083 commuters, 17.3%), 20 to 24 minutes (1,701 commuters, 14.1%), and 10 to 14 minutes (1,602 commuters, 13.3%).
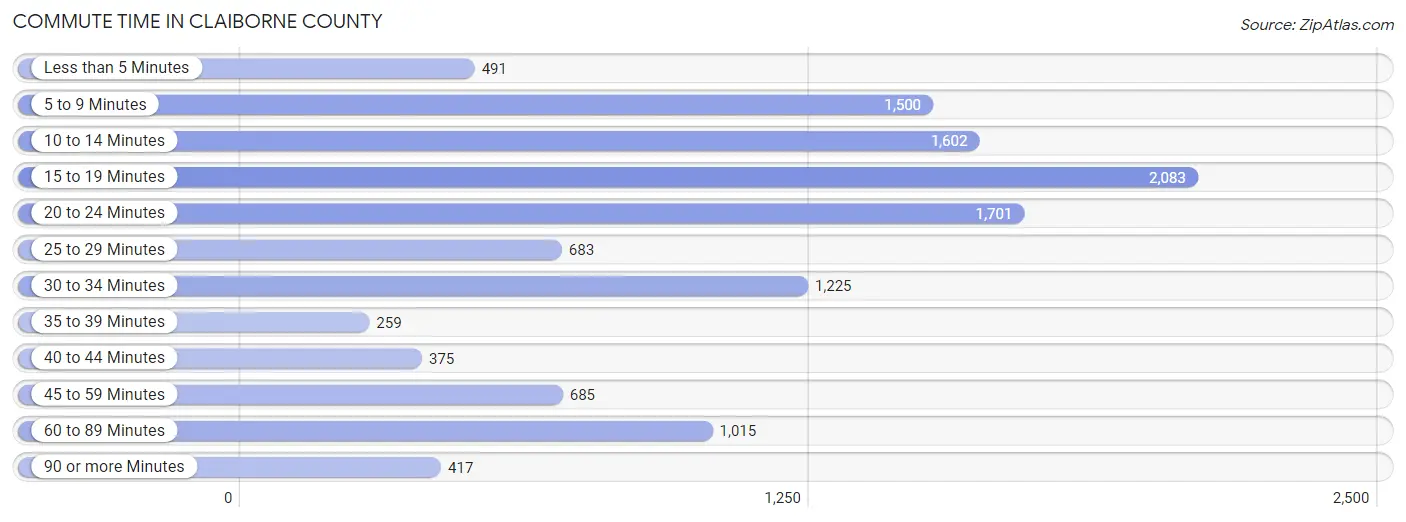
| Commute Time | # Commuters | % Commuters |
| Less than 5 Minutes | 491 | 4.1% |
| 5 to 9 Minutes | 1,500 | 12.5% |
| 10 to 14 Minutes | 1,602 | 13.3% |
| 15 to 19 Minutes | 2,083 | 17.3% |
| 20 to 24 Minutes | 1,701 | 14.1% |
| 25 to 29 Minutes | 683 | 5.7% |
| 30 to 34 Minutes | 1,225 | 10.2% |
| 35 to 39 Minutes | 259 | 2.1% |
| 40 to 44 Minutes | 375 | 3.1% |
| 45 to 59 Minutes | 685 | 5.7% |
| 60 to 89 Minutes | 1,015 | 8.4% |
| 90 or more Minutes | 417 | 3.5% |
Commute Time by Sex in Claiborne County
The most common commute times in Claiborne County are 15 to 19 minutes (1,255 commuters, 19.4%) for males and 20 to 24 minutes (1,091 commuters, 19.6%) for females.
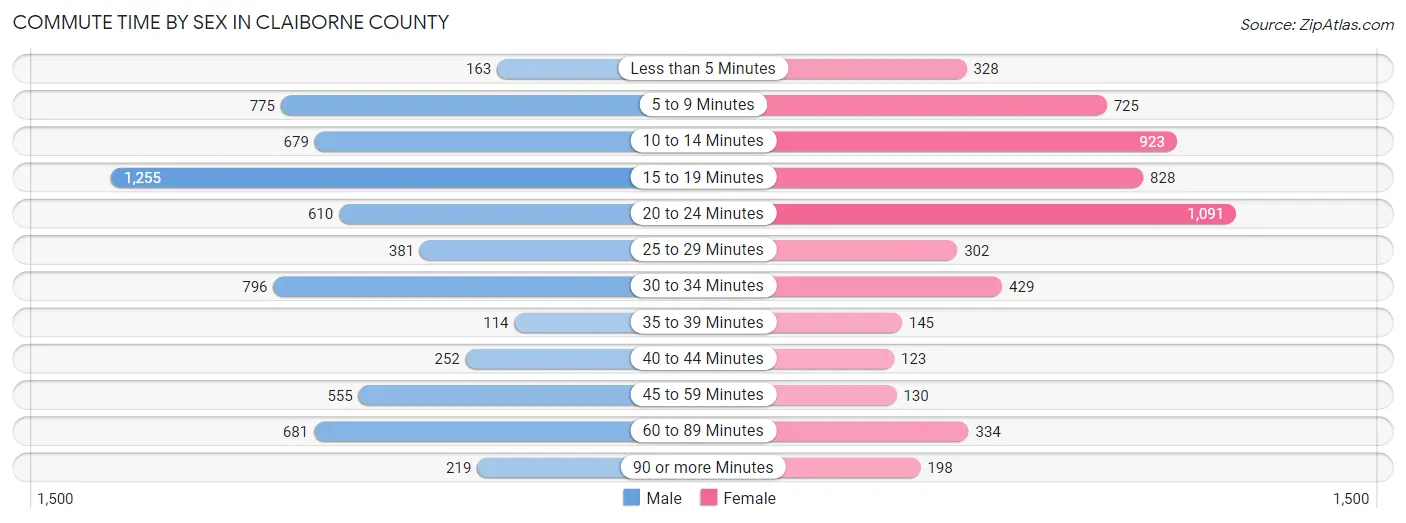
| Commute Time | Male | Female |
| Less than 5 Minutes | 163 (2.5%) | 328 (5.9%) |
| 5 to 9 Minutes | 775 (12.0%) | 725 (13.1%) |
| 10 to 14 Minutes | 679 (10.5%) | 923 (16.6%) |
| 15 to 19 Minutes | 1,255 (19.4%) | 828 (14.9%) |
| 20 to 24 Minutes | 610 (9.4%) | 1,091 (19.6%) |
| 25 to 29 Minutes | 381 (5.9%) | 302 (5.4%) |
| 30 to 34 Minutes | 796 (12.3%) | 429 (7.7%) |
| 35 to 39 Minutes | 114 (1.8%) | 145 (2.6%) |
| 40 to 44 Minutes | 252 (3.9%) | 123 (2.2%) |
| 45 to 59 Minutes | 555 (8.6%) | 130 (2.3%) |
| 60 to 89 Minutes | 681 (10.5%) | 334 (6.0%) |
| 90 or more Minutes | 219 (3.4%) | 198 (3.6%) |
Time of Departure to Work by Sex in Claiborne County
The most frequent times of departure to work in Claiborne County are 7:00 AM to 7:29 AM (909, 14.0%) for males and 7:00 AM to 7:29 AM (1,023, 18.4%) for females.
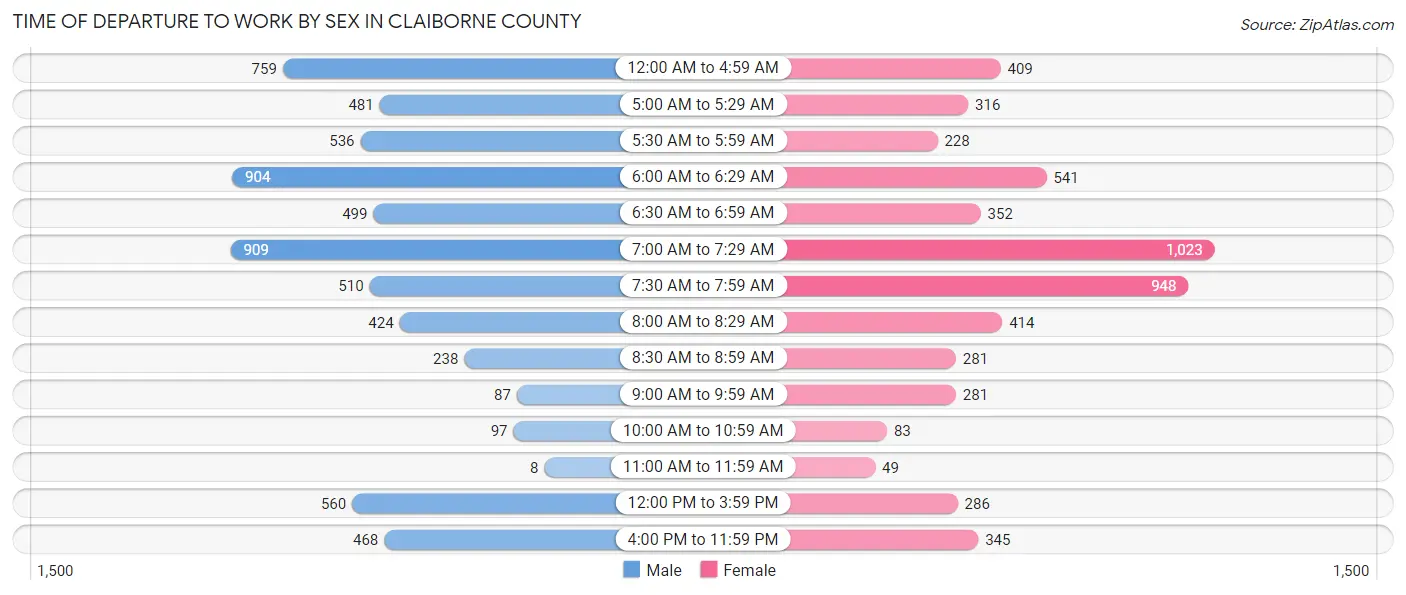
| Time of Departure | Male | Female |
| 12:00 AM to 4:59 AM | 759 (11.7%) | 409 (7.4%) |
| 5:00 AM to 5:29 AM | 481 (7.4%) | 316 (5.7%) |
| 5:30 AM to 5:59 AM | 536 (8.3%) | 228 (4.1%) |
| 6:00 AM to 6:29 AM | 904 (14.0%) | 541 (9.7%) |
| 6:30 AM to 6:59 AM | 499 (7.7%) | 352 (6.3%) |
| 7:00 AM to 7:29 AM | 909 (14.0%) | 1,023 (18.4%) |
| 7:30 AM to 7:59 AM | 510 (7.9%) | 948 (17.1%) |
| 8:00 AM to 8:29 AM | 424 (6.5%) | 414 (7.4%) |
| 8:30 AM to 8:59 AM | 238 (3.7%) | 281 (5.1%) |
| 9:00 AM to 9:59 AM | 87 (1.3%) | 281 (5.1%) |
| 10:00 AM to 10:59 AM | 97 (1.5%) | 83 (1.5%) |
| 11:00 AM to 11:59 AM | 8 (0.1%) | 49 (0.9%) |
| 12:00 PM to 3:59 PM | 560 (8.6%) | 286 (5.1%) |
| 4:00 PM to 11:59 PM | 468 (7.2%) | 345 (6.2%) |
| Total | 6,480 (100.0%) | 5,556 (100.0%) |
Housing Occupancy in Claiborne County
Occupancy by Ownership in Claiborne County
Of the total 13,479 dwellings in Claiborne County, owner-occupied units account for 9,656 (71.6%), while renter-occupied units make up 3,823 (28.4%).
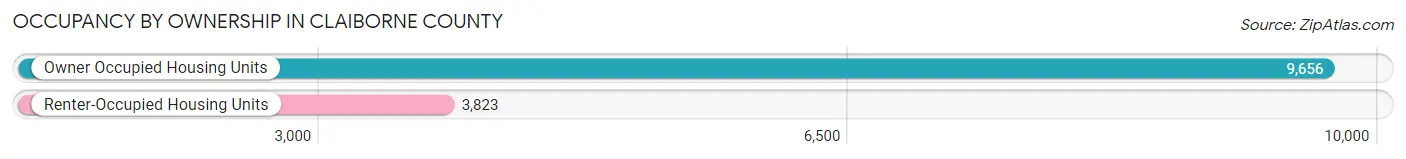
| Occupancy | # Housing Units | % Housing Units |
| Owner Occupied Housing Units | 9,656 | 71.6% |
| Renter-Occupied Housing Units | 3,823 | 28.4% |
| Total Occupied Housing Units | 13,479 | 100.0% |
Occupancy by Household Size in Claiborne County
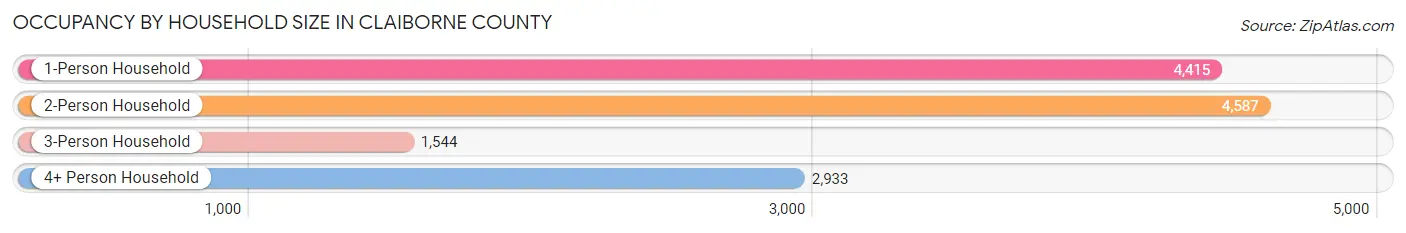
| Household Size | # Housing Units | % Housing Units |
| 1-Person Household | 4,415 | 32.8% |
| 2-Person Household | 4,587 | 34.0% |
| 3-Person Household | 1,544 | 11.5% |
| 4+ Person Household | 2,933 | 21.8% |
| Total Housing Units | 13,479 | 100.0% |
Occupancy by Ownership by Household Size in Claiborne County
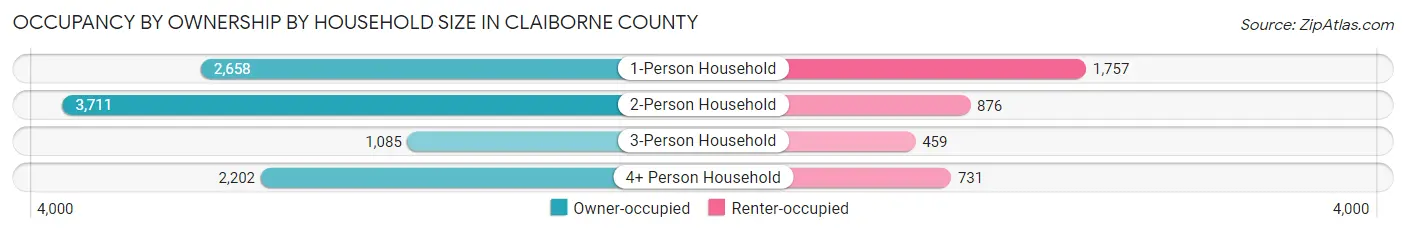
| Household Size | Owner-occupied | Renter-occupied |
| 1-Person Household | 2,658 (60.2%) | 1,757 (39.8%) |
| 2-Person Household | 3,711 (80.9%) | 876 (19.1%) |
| 3-Person Household | 1,085 (70.3%) | 459 (29.7%) |
| 4+ Person Household | 2,202 (75.1%) | 731 (24.9%) |
| Total Housing Units | 9,656 (71.6%) | 3,823 (28.4%) |
Occupancy by Educational Attainment in Claiborne County
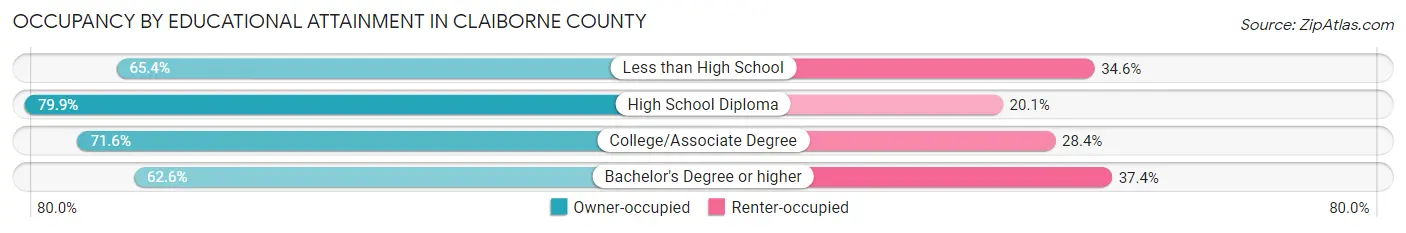
| Household Size | Owner-occupied | Renter-occupied |
| Less than High School | 1,591 (65.4%) | 841 (34.6%) |
| High School Diploma | 3,994 (79.9%) | 1,002 (20.1%) |
| College/Associate Degree | 2,240 (71.6%) | 888 (28.4%) |
| Bachelor's Degree or higher | 1,831 (62.6%) | 1,092 (37.4%) |
Occupancy by Age of Householder in Claiborne County
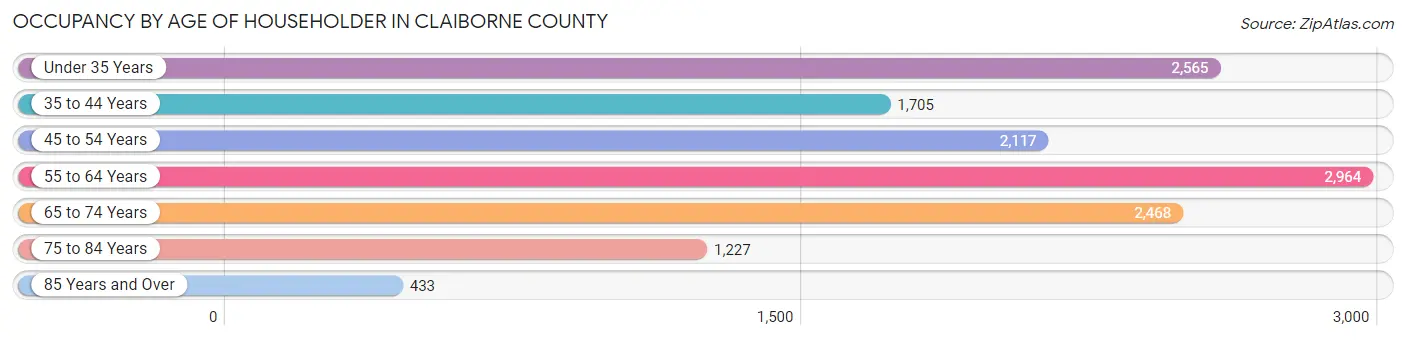
| Age Bracket | # Households | % Households |
| Under 35 Years | 2,565 | 19.0% |
| 35 to 44 Years | 1,705 | 12.7% |
| 45 to 54 Years | 2,117 | 15.7% |
| 55 to 64 Years | 2,964 | 22.0% |
| 65 to 74 Years | 2,468 | 18.3% |
| 75 to 84 Years | 1,227 | 9.1% |
| 85 Years and Over | 433 | 3.2% |
| Total | 13,479 | 100.0% |
Housing Finances in Claiborne County
Median Income by Occupancy in Claiborne County
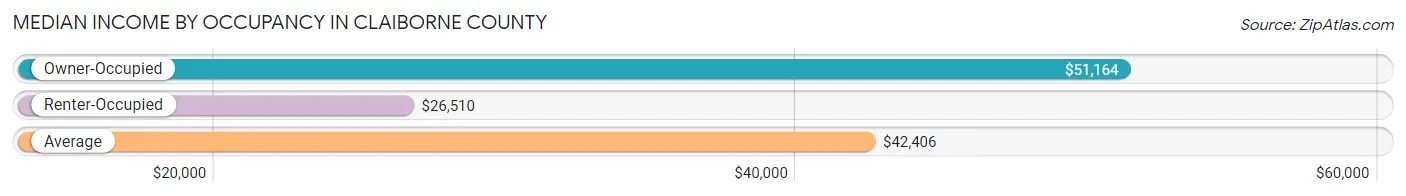
| Occupancy Type | # Households | Median Income |
| Owner-Occupied | 9,656 (71.6%) | $51,164 |
| Renter-Occupied | 3,823 (28.4%) | $26,510 |
| Average | 13,479 (100.0%) | $42,406 |
Occupancy by Householder Income Bracket in Claiborne County
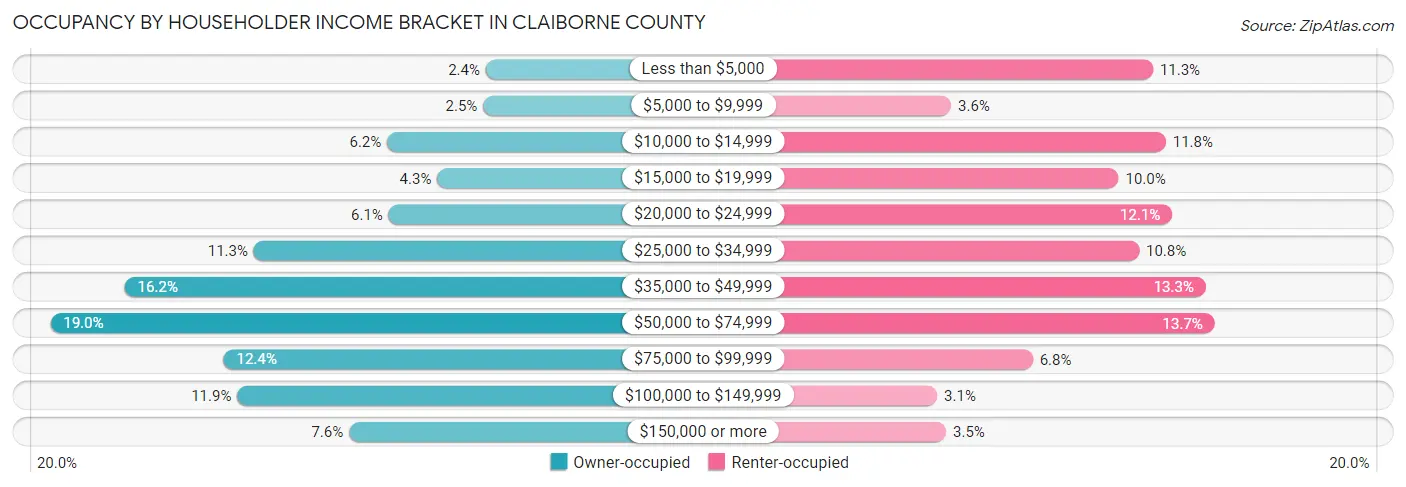
| Income Bracket | Owner-occupied | Renter-occupied |
| Less than $5,000 | 235 (2.4%) | 433 (11.3%) |
| $5,000 to $9,999 | 244 (2.5%) | 139 (3.6%) |
| $10,000 to $14,999 | 598 (6.2%) | 452 (11.8%) |
| $15,000 to $19,999 | 413 (4.3%) | 383 (10.0%) |
| $20,000 to $24,999 | 592 (6.1%) | 461 (12.1%) |
| $25,000 to $34,999 | 1,088 (11.3%) | 413 (10.8%) |
| $35,000 to $49,999 | 1,563 (16.2%) | 510 (13.3%) |
| $50,000 to $74,999 | 1,837 (19.0%) | 523 (13.7%) |
| $75,000 to $99,999 | 1,199 (12.4%) | 258 (6.8%) |
| $100,000 to $149,999 | 1,149 (11.9%) | 119 (3.1%) |
| $150,000 or more | 738 (7.6%) | 132 (3.5%) |
| Total | 9,656 (100.0%) | 3,823 (100.0%) |
Monthly Housing Cost Tiers in Claiborne County
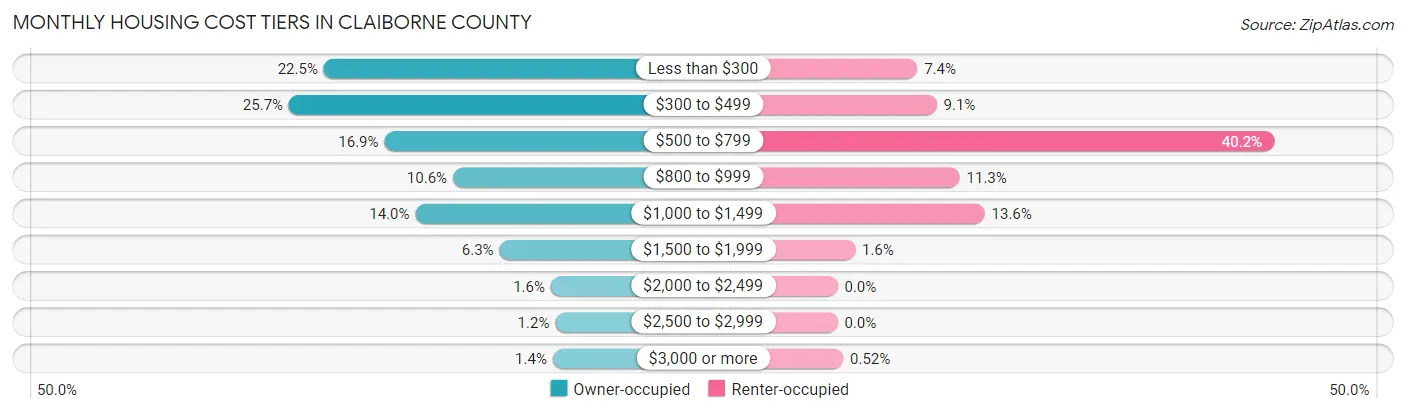
| Monthly Cost | Owner-occupied | Renter-occupied |
| Less than $300 | 2,169 (22.5%) | 281 (7.3%) |
| $300 to $499 | 2,479 (25.7%) | 349 (9.1%) |
| $500 to $799 | 1,630 (16.9%) | 1,536 (40.2%) |
| $800 to $999 | 1,021 (10.6%) | 430 (11.3%) |
| $1,000 to $1,499 | 1,355 (14.0%) | 518 (13.6%) |
| $1,500 to $1,999 | 607 (6.3%) | 62 (1.6%) |
| $2,000 to $2,499 | 151 (1.6%) | 0 (0.0%) |
| $2,500 to $2,999 | 111 (1.1%) | 0 (0.0%) |
| $3,000 or more | 133 (1.4%) | 20 (0.5%) |
| Total | 9,656 (100.0%) | 3,823 (100.0%) |
Physical Housing Characteristics in Claiborne County
Housing Structures in Claiborne County
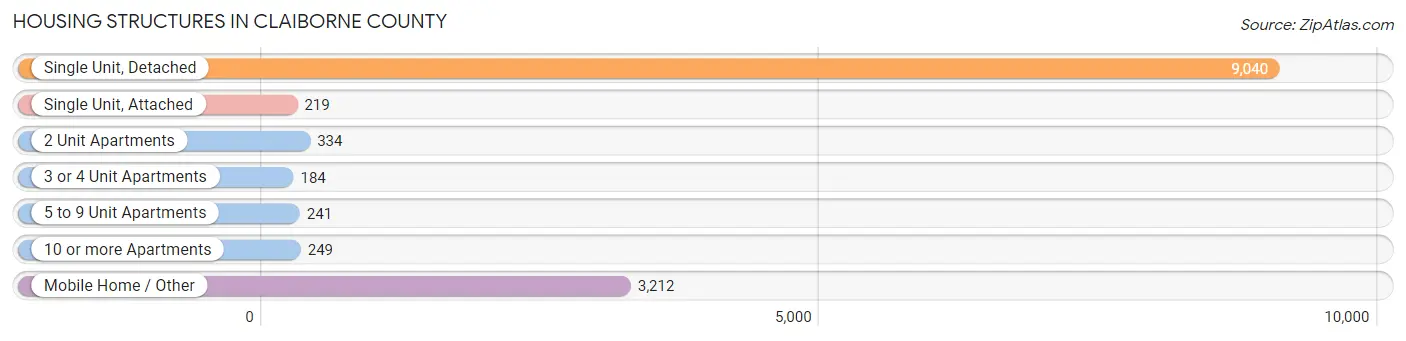
| Structure Type | # Housing Units | % Housing Units |
| Single Unit, Detached | 9,040 | 67.1% |
| Single Unit, Attached | 219 | 1.6% |
| 2 Unit Apartments | 334 | 2.5% |
| 3 or 4 Unit Apartments | 184 | 1.4% |
| 5 to 9 Unit Apartments | 241 | 1.8% |
| 10 or more Apartments | 249 | 1.8% |
| Mobile Home / Other | 3,212 | 23.8% |
| Total | 13,479 | 100.0% |
Housing Structures by Occupancy in Claiborne County
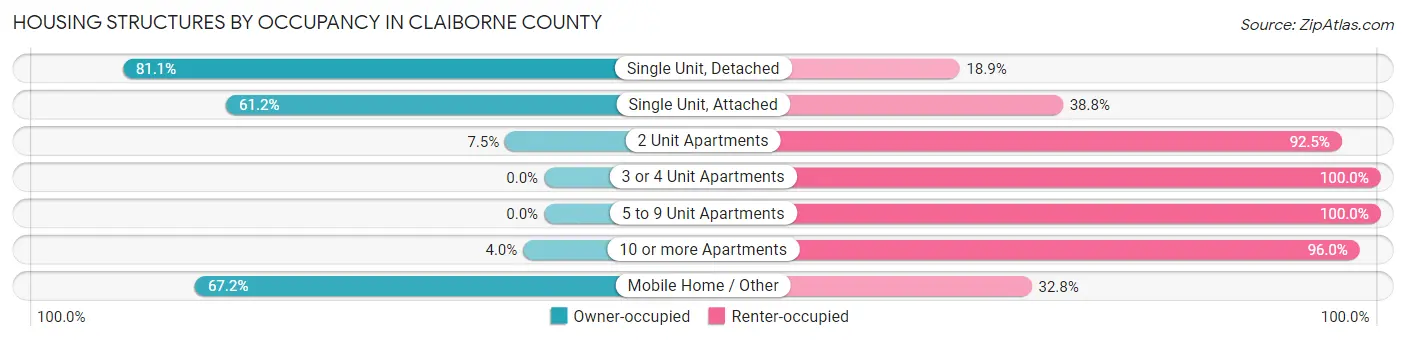
| Structure Type | Owner-occupied | Renter-occupied |
| Single Unit, Detached | 7,329 (81.1%) | 1,711 (18.9%) |
| Single Unit, Attached | 134 (61.2%) | 85 (38.8%) |
| 2 Unit Apartments | 25 (7.5%) | 309 (92.5%) |
| 3 or 4 Unit Apartments | 0 (0.0%) | 184 (100.0%) |
| 5 to 9 Unit Apartments | 0 (0.0%) | 241 (100.0%) |
| 10 or more Apartments | 10 (4.0%) | 239 (96.0%) |
| Mobile Home / Other | 2,158 (67.2%) | 1,054 (32.8%) |
| Total | 9,656 (71.6%) | 3,823 (28.4%) |
Housing Structures by Number of Rooms in Claiborne County
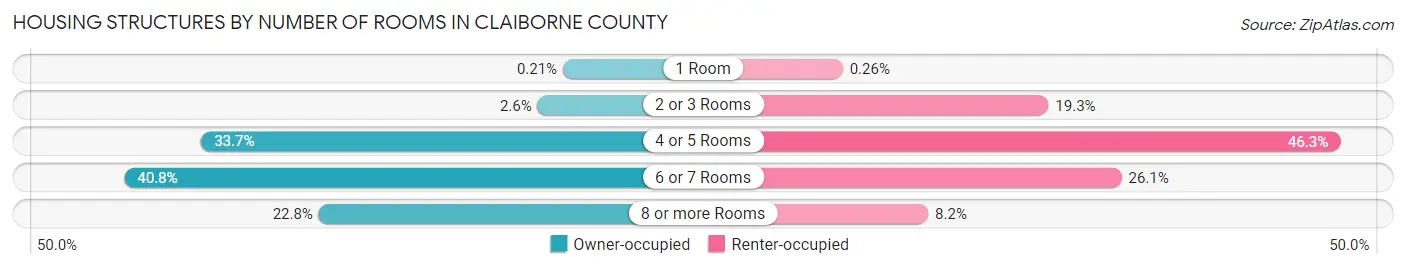
| Number of Rooms | Owner-occupied | Renter-occupied |
| 1 Room | 20 (0.2%) | 10 (0.3%) |
| 2 or 3 Rooms | 247 (2.6%) | 737 (19.3%) |
| 4 or 5 Rooms | 3,250 (33.7%) | 1,768 (46.3%) |
| 6 or 7 Rooms | 3,937 (40.8%) | 996 (26.1%) |
| 8 or more Rooms | 2,202 (22.8%) | 312 (8.2%) |
| Total | 9,656 (100.0%) | 3,823 (100.0%) |
Housing Structure by Heating Type in Claiborne County
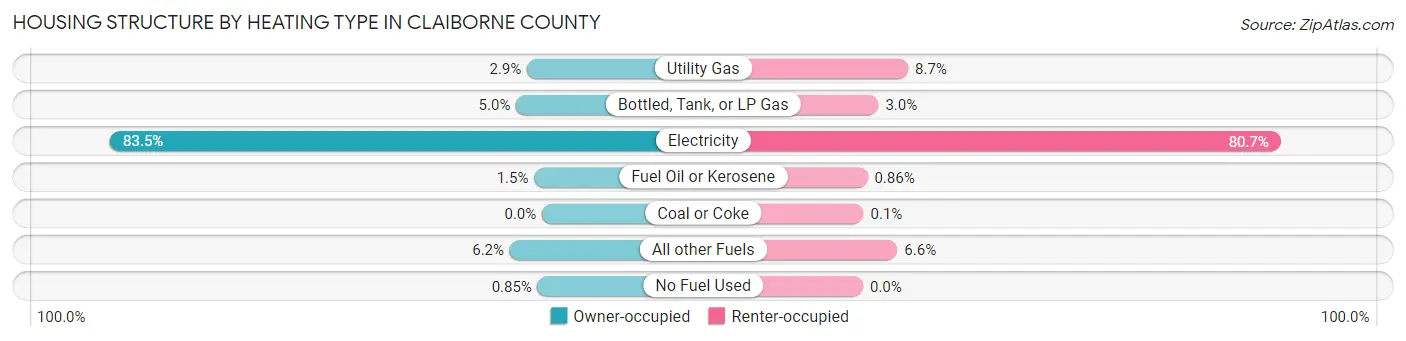
| Heating Type | Owner-occupied | Renter-occupied |
| Utility Gas | 280 (2.9%) | 333 (8.7%) |
| Bottled, Tank, or LP Gas | 483 (5.0%) | 114 (3.0%) |
| Electricity | 8,064 (83.5%) | 3,085 (80.7%) |
| Fuel Oil or Kerosene | 145 (1.5%) | 33 (0.9%) |
| Coal or Coke | 0 (0.0%) | 4 (0.1%) |
| All other Fuels | 602 (6.2%) | 254 (6.6%) |
| No Fuel Used | 82 (0.9%) | 0 (0.0%) |
| Total | 9,656 (100.0%) | 3,823 (100.0%) |
Household Vehicle Usage in Claiborne County
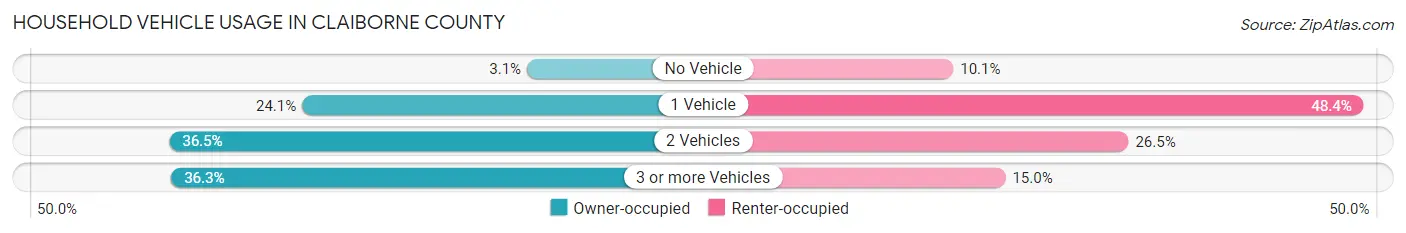
| Vehicles per Household | Owner-occupied | Renter-occupied |
| No Vehicle | 300 (3.1%) | 387 (10.1%) |
| 1 Vehicle | 2,327 (24.1%) | 1,851 (48.4%) |
| 2 Vehicles | 3,523 (36.5%) | 1,012 (26.5%) |
| 3 or more Vehicles | 3,506 (36.3%) | 573 (15.0%) |
| Total | 9,656 (100.0%) | 3,823 (100.0%) |
Real Estate & Mortgages in Claiborne County
Real Estate and Mortgage Overview in Claiborne County
| Characteristic | Without Mortgage | With Mortgage |
| Housing Units | 5,340 | 4,316 |
| Median Property Value | $112,800 | $155,900 |
| Median Household Income | $39,598 | $380 |
| Monthly Housing Costs | $331 | $127 |
| Real Estate Taxes | $572 | $142 |
Property Value by Mortgage Status in Claiborne County
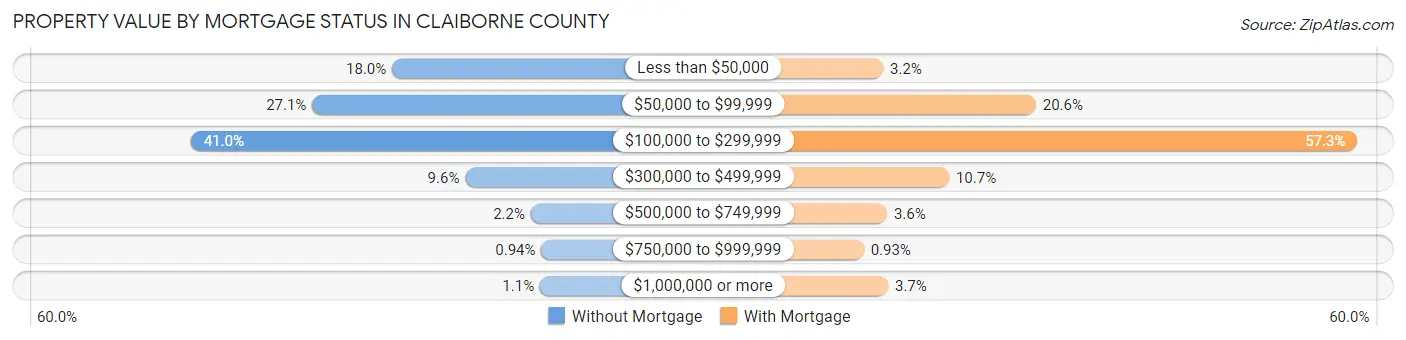
| Property Value | Without Mortgage | With Mortgage |
| Less than $50,000 | 962 (18.0%) | 136 (3.2%) |
| $50,000 to $99,999 | 1,449 (27.1%) | 889 (20.6%) |
| $100,000 to $299,999 | 2,190 (41.0%) | 2,475 (57.3%) |
| $300,000 to $499,999 | 515 (9.6%) | 461 (10.7%) |
| $500,000 to $749,999 | 115 (2.1%) | 155 (3.6%) |
| $750,000 to $999,999 | 50 (0.9%) | 40 (0.9%) |
| $1,000,000 or more | 59 (1.1%) | 160 (3.7%) |
| Total | 5,340 (100.0%) | 4,316 (100.0%) |
Household Income by Mortgage Status in Claiborne County
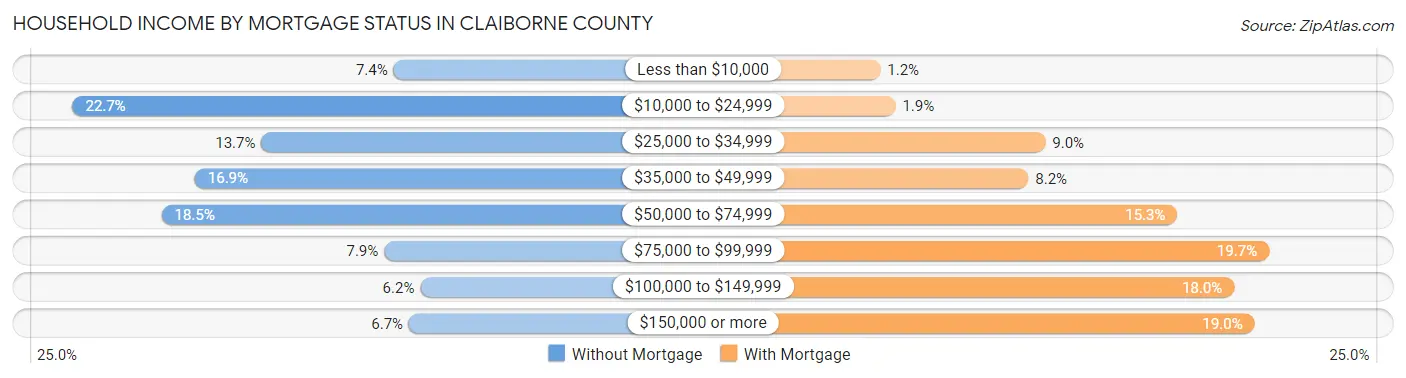
| Household Income | Without Mortgage | With Mortgage |
| Less than $10,000 | 397 (7.4%) | 51 (1.2%) |
| $10,000 to $24,999 | 1,213 (22.7%) | 82 (1.9%) |
| $25,000 to $34,999 | 733 (13.7%) | 390 (9.0%) |
| $35,000 to $49,999 | 902 (16.9%) | 355 (8.2%) |
| $50,000 to $74,999 | 987 (18.5%) | 661 (15.3%) |
| $75,000 to $99,999 | 421 (7.9%) | 850 (19.7%) |
| $100,000 to $149,999 | 329 (6.2%) | 778 (18.0%) |
| $150,000 or more | 358 (6.7%) | 820 (19.0%) |
| Total | 5,340 (100.0%) | 4,316 (100.0%) |
Property Value to Household Income Ratio in Claiborne County
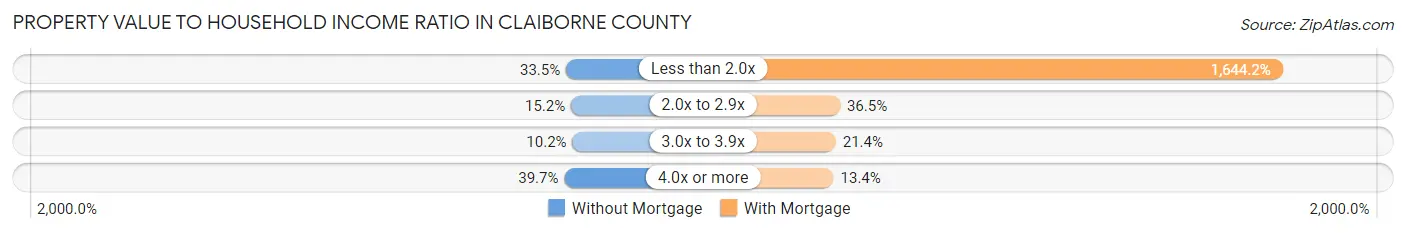
| Value-to-Income Ratio | Without Mortgage | With Mortgage |
| Less than 2.0x | 1,788 (33.5%) | 70,965 (1,644.2%) |
| 2.0x to 2.9x | 812 (15.2%) | 1,574 (36.5%) |
| 3.0x to 3.9x | 546 (10.2%) | 922 (21.4%) |
| 4.0x or more | 2,121 (39.7%) | 580 (13.4%) |
| Total | 5,340 (100.0%) | 4,316 (100.0%) |
Real Estate Taxes by Mortgage Status in Claiborne County
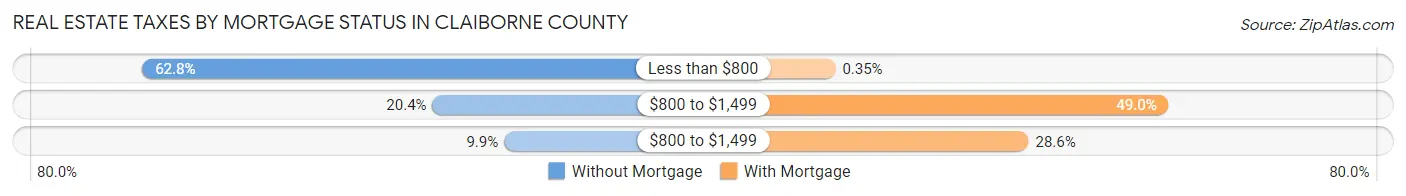
| Property Taxes | Without Mortgage | With Mortgage |
| Less than $800 | 3,354 (62.8%) | 15 (0.4%) |
| $800 to $1,499 | 1,090 (20.4%) | 2,116 (49.0%) |
| $800 to $1,499 | 531 (9.9%) | 1,233 (28.6%) |
| Total | 5,340 (100.0%) | 4,316 (100.0%) |
Health & Disability in Claiborne County
Health Insurance Coverage by Age in Claiborne County
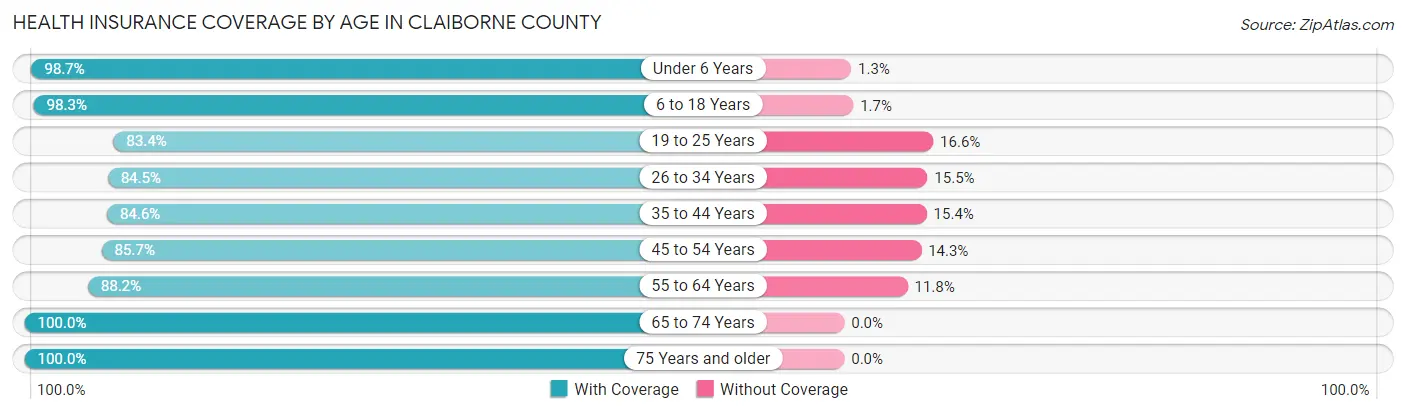
| Age Bracket | With Coverage | Without Coverage |
| Under 6 Years | 1,945 (98.7%) | 25 (1.3%) |
| 6 to 18 Years | 4,404 (98.3%) | 75 (1.7%) |
| 19 to 25 Years | 2,699 (83.4%) | 536 (16.6%) |
| 26 to 34 Years | 2,994 (84.5%) | 549 (15.5%) |
| 35 to 44 Years | 2,976 (84.6%) | 540 (15.4%) |
| 45 to 54 Years | 3,614 (85.7%) | 605 (14.3%) |
| 55 to 64 Years | 3,999 (88.2%) | 535 (11.8%) |
| 65 to 74 Years | 3,773 (100.0%) | 0 (0.0%) |
| 75 Years and older | 2,298 (100.0%) | 0 (0.0%) |
| Total | 28,702 (90.9%) | 2,865 (9.1%) |
Health Insurance Coverage by Citizenship Status in Claiborne County
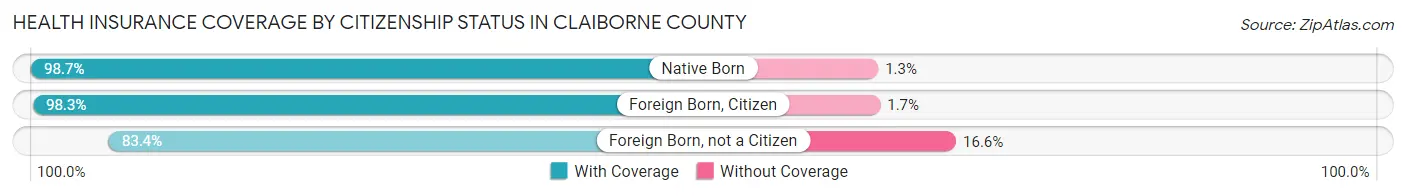
| Citizenship Status | With Coverage | Without Coverage |
| Native Born | 1,945 (98.7%) | 25 (1.3%) |
| Foreign Born, Citizen | 4,404 (98.3%) | 75 (1.7%) |
| Foreign Born, not a Citizen | 2,699 (83.4%) | 536 (16.6%) |
Health Insurance Coverage by Household Income in Claiborne County
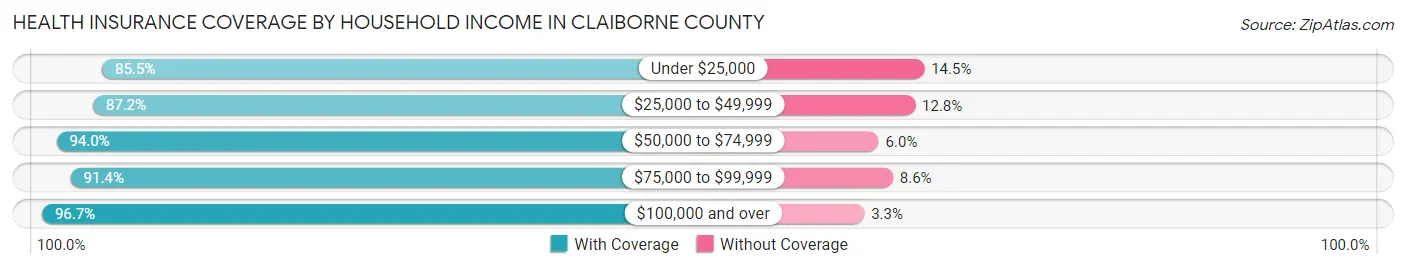
| Household Income | With Coverage | Without Coverage |
| Under $25,000 | 5,110 (85.5%) | 867 (14.5%) |
| $25,000 to $49,999 | 6,296 (87.2%) | 924 (12.8%) |
| $50,000 to $74,999 | 6,076 (94.0%) | 386 (6.0%) |
| $75,000 to $99,999 | 3,960 (91.4%) | 374 (8.6%) |
| $100,000 and over | 6,591 (96.7%) | 222 (3.3%) |
Public vs Private Health Insurance Coverage by Age in Claiborne County
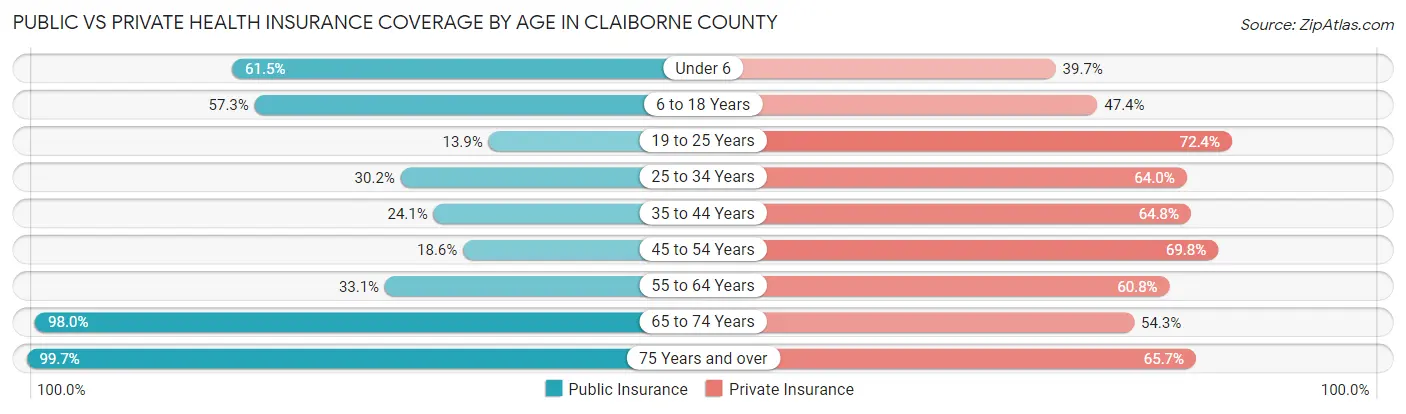
| Age Bracket | Public Insurance | Private Insurance |
| Under 6 | 1,211 (61.5%) | 782 (39.7%) |
| 6 to 18 Years | 2,567 (57.3%) | 2,125 (47.4%) |
| 19 to 25 Years | 449 (13.9%) | 2,342 (72.4%) |
| 25 to 34 Years | 1,070 (30.2%) | 2,267 (64.0%) |
| 35 to 44 Years | 847 (24.1%) | 2,278 (64.8%) |
| 45 to 54 Years | 785 (18.6%) | 2,946 (69.8%) |
| 55 to 64 Years | 1,501 (33.1%) | 2,757 (60.8%) |
| 65 to 74 Years | 3,699 (98.0%) | 2,047 (54.2%) |
| 75 Years and over | 2,290 (99.7%) | 1,510 (65.7%) |
| Total | 14,419 (45.7%) | 19,054 (60.4%) |
Disability Status by Sex by Age in Claiborne County
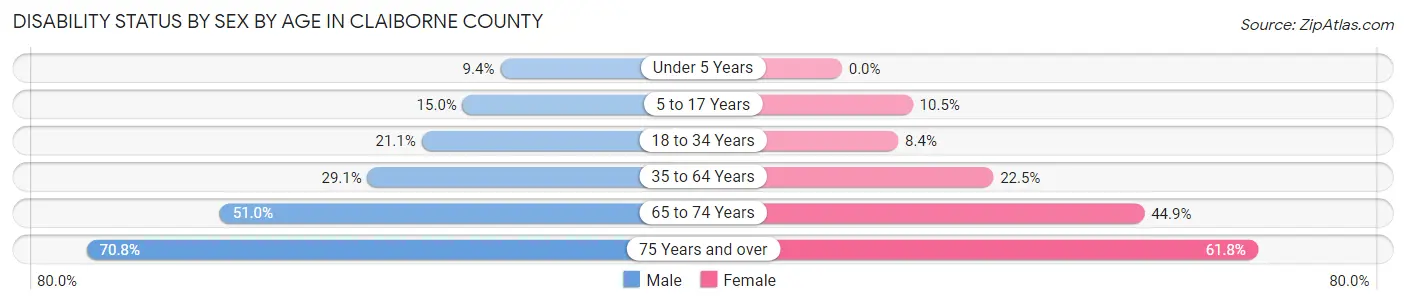
| Age Bracket | Male | Female |
| Under 5 Years | 94 (9.4%) | 0 (0.0%) |
| 5 to 17 Years | 334 (14.9%) | 220 (10.5%) |
| 18 to 34 Years | 742 (21.1%) | 305 (8.4%) |
| 35 to 64 Years | 1,766 (29.1%) | 1,393 (22.5%) |
| 65 to 74 Years | 908 (51.0%) | 895 (44.9%) |
| 75 Years and over | 681 (70.8%) | 825 (61.8%) |
Disability Class by Sex by Age in Claiborne County
Disability Class: Hearing Difficulty
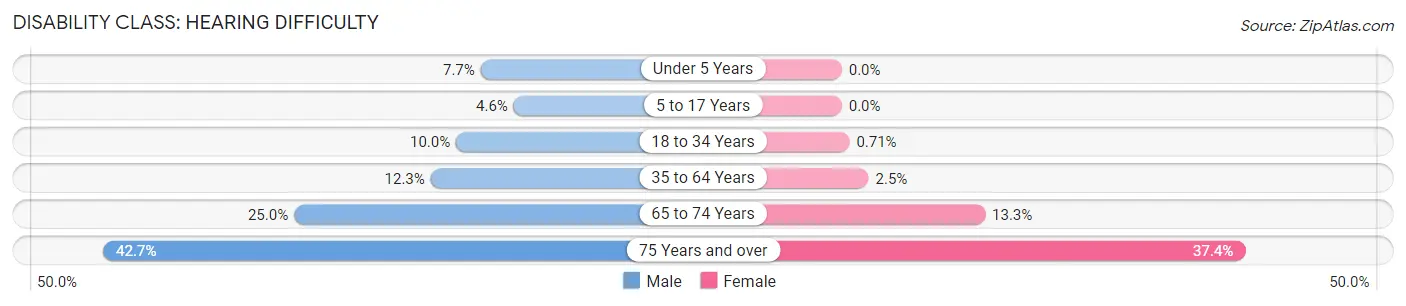
| Age Bracket | Male | Female |
| Under 5 Years | 77 (7.7%) | 0 (0.0%) |
| 5 to 17 Years | 103 (4.6%) | 0 (0.0%) |
| 18 to 34 Years | 351 (10.0%) | 26 (0.7%) |
| 35 to 64 Years | 748 (12.3%) | 154 (2.5%) |
| 65 to 74 Years | 445 (25.0%) | 265 (13.3%) |
| 75 Years and over | 411 (42.7%) | 500 (37.4%) |
Disability Class: Vision Difficulty
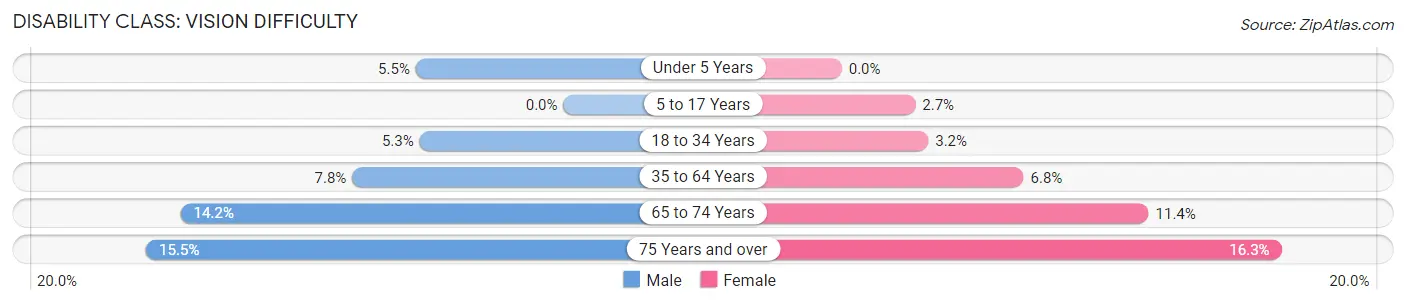
| Age Bracket | Male | Female |
| Under 5 Years | 55 (5.5%) | 0 (0.0%) |
| 5 to 17 Years | 0 (0.0%) | 57 (2.7%) |
| 18 to 34 Years | 188 (5.3%) | 117 (3.2%) |
| 35 to 64 Years | 476 (7.8%) | 418 (6.8%) |
| 65 to 74 Years | 253 (14.2%) | 227 (11.4%) |
| 75 Years and over | 149 (15.5%) | 218 (16.3%) |
Disability Class: Cognitive Difficulty
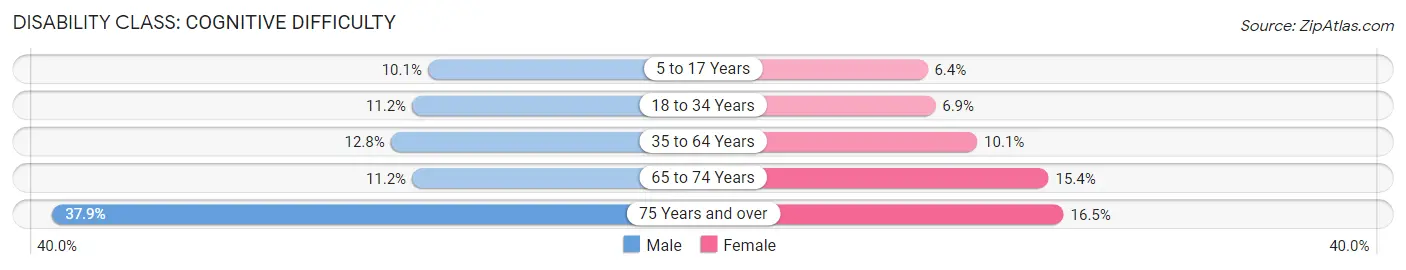
| Age Bracket | Male | Female |
| 5 to 17 Years | 225 (10.1%) | 133 (6.4%) |
| 18 to 34 Years | 396 (11.2%) | 253 (6.9%) |
| 35 to 64 Years | 779 (12.8%) | 623 (10.1%) |
| 65 to 74 Years | 200 (11.2%) | 306 (15.3%) |
| 75 Years and over | 365 (37.9%) | 220 (16.5%) |
Disability Class: Ambulatory Difficulty
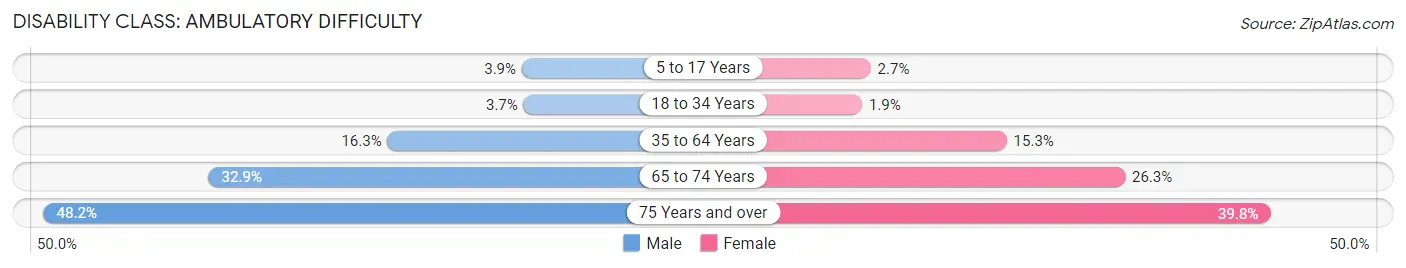
| Age Bracket | Male | Female |
| 5 to 17 Years | 86 (3.8%) | 56 (2.7%) |
| 18 to 34 Years | 130 (3.7%) | 68 (1.9%) |
| 35 to 64 Years | 991 (16.3%) | 948 (15.3%) |
| 65 to 74 Years | 586 (32.9%) | 524 (26.3%) |
| 75 Years and over | 464 (48.2%) | 531 (39.8%) |
Disability Class: Self-Care Difficulty
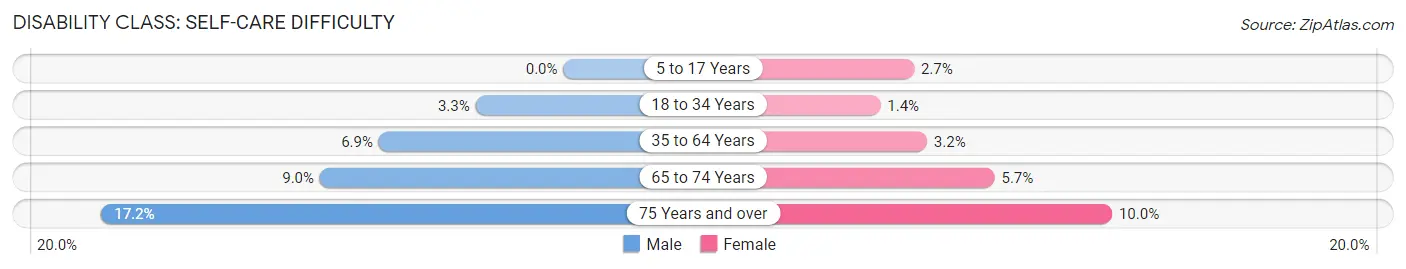
| Age Bracket | Male | Female |
| 5 to 17 Years | 0 (0.0%) | 56 (2.7%) |
| 18 to 34 Years | 115 (3.3%) | 52 (1.4%) |
| 35 to 64 Years | 416 (6.9%) | 196 (3.2%) |
| 65 to 74 Years | 161 (9.0%) | 113 (5.7%) |
| 75 Years and over | 165 (17.2%) | 134 (10.0%) |
Technology Access in Claiborne County
Computing Device Access in Claiborne County
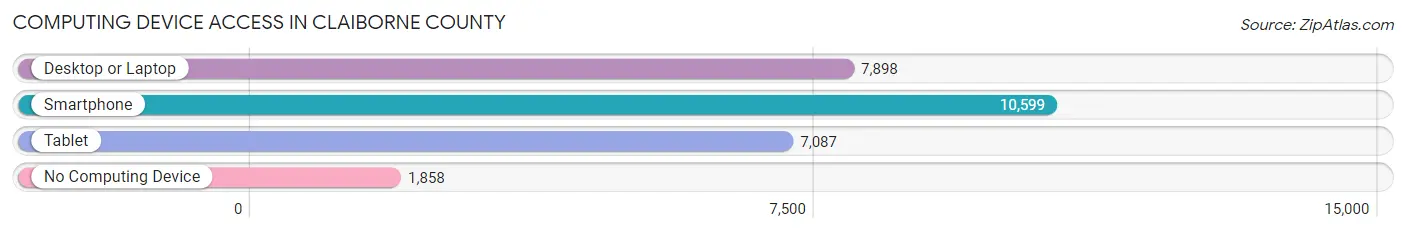
| Device Type | # Households | % Households |
| Desktop or Laptop | 7,898 | 58.6% |
| Smartphone | 10,599 | 78.6% |
| Tablet | 7,087 | 52.6% |
| No Computing Device | 1,858 | 13.8% |
| Total | 13,479 | 100.0% |
Internet Access in Claiborne County
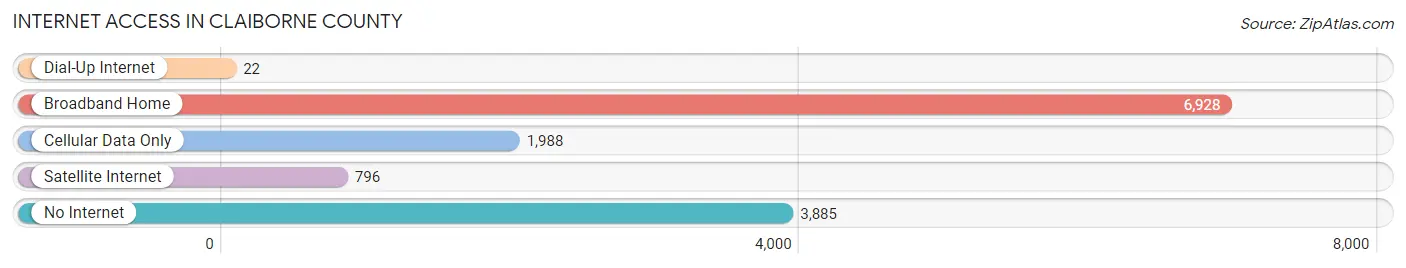
| Internet Type | # Households | % Households |
| Dial-Up Internet | 22 | 0.2% |
| Broadband Home | 6,928 | 51.4% |
| Cellular Data Only | 1,988 | 14.7% |
| Satellite Internet | 796 | 5.9% |
| No Internet | 3,885 | 28.8% |
| Total | 13,479 | 100.0% |
Claiborne County Summary
Claiborne County is located in the northeastern corner of Tennessee, and is bordered by Kentucky to the north and Virginia to the east. It is part of the Cumberland Plateau region of the state, and is home to the Cumberland Gap National Historical Park. The county was established in 1801 and named for Virginia statesman and Revolutionary War hero, William C.C. Claiborne. The county seat is Tazewell, and the population was estimated to be 32,213 in 2019.
Geography
Claiborne County is located in the Appalachian Mountains and is part of the Cumberland Plateau region. The county is mostly mountainous, with the highest point being Lone Mountain at 2,890 feet. The county is drained by the Clinch River, which flows through the county from north to south. The county is also home to several state parks, including Cumberland Gap National Historical Park, which is located in the northern part of the county.
Climate
Claiborne County has a humid subtropical climate, with hot, humid summers and mild winters. The average annual temperature is around 57°F, and the average annual precipitation is around 45 inches.
Demographics
As of the 2010 census, the population of Claiborne County was 32,213, with a population density of 44.3 people per square mile. The racial makeup of the county was 92.3% White, 4.7% African American, 0.3% Native American, 0.3% Asian, 0.1% Pacific Islander, 1.2% from other races, and 1.2% from two or more races. Hispanic or Latino of any race were 2.3% of the population.
The median income for a household in the county was $30,945, and the median income for a family was $37,945. The per capita income for the county was $16,845. About 17.2% of the population was below the poverty line.
Economy
The economy of Claiborne County is largely based on agriculture and tourism. The county is home to several large farms, and the main crops grown in the county are corn, soybeans, hay, and tobacco. The county is also home to several tourist attractions, including Cumberland Gap National Historical Park, which attracts thousands of visitors each year.
The county is also home to several manufacturing companies, including a paper mill, a furniture factory, and a plastics factory. The county is also home to several coal mines, which provide jobs for many of the county's residents.
Conclusion
Claiborne County is a rural county located in the northeastern corner of Tennessee. The county is home to several tourist attractions, including Cumberland Gap National Historical Park, and the economy is largely based on agriculture and tourism. The county is also home to several manufacturing companies, and coal mines, which provide jobs for many of the county's residents. The population of the county was estimated to be 32,213 in 2019.
Common Questions
What is Per Capita Income in Claiborne County?
Per Capita income in Claiborne County is $25,408.
What is the Median Family Income in Claiborne County?
Median Family Income in Claiborne County is $62,962.
What is the Median Household income in Claiborne County?
Median Household Income in Claiborne County is $42,406.
What is Income or Wage Gap in Claiborne County?
Income or Wage Gap in Claiborne County is 27.9%.
Women in Claiborne County earn 72.1 cents for every dollar earned by a man.
What is Family Income Deficit in Claiborne County?
Family Income Deficit in Claiborne County is $10,356.
Families that are below poverty line in Claiborne County earn $10,356 less on average than the poverty threshold level.
What is Inequality or Gini Index in Claiborne County?
Inequality or Gini Index in Claiborne County is 0.46.
What is the Total Population of Claiborne County?
Total Population of Claiborne County is 32,092.
What is the Total Male Population of Claiborne County?
Total Male Population of Claiborne County is 15,900.
What is the Total Female Population of Claiborne County?
Total Female Population of Claiborne County is 16,192.
What is the Ratio of Males per 100 Females in Claiborne County?
There are 98.20 Males per 100 Females in Claiborne County.
What is the Ratio of Females per 100 Males in Claiborne County?
There are 101.84 Females per 100 Males in Claiborne County.
What is the Median Population Age in Claiborne County?
Median Population Age in Claiborne County is 42.0 Years.
What is the Average Family Size in Claiborne County
Average Family Size in Claiborne County is 2.9 People.
What is the Average Household Size in Claiborne County
Average Household Size in Claiborne County is 2.3 People.
How Large is the Labor Force in Claiborne County?
There are 13,781 People in the Labor Forcein in Claiborne County.
What is the Percentage of People in the Labor Force in Claiborne County?
51.7% of People are in the Labor Force in Claiborne County.
What is the Unemployment Rate in Claiborne County?
Unemployment Rate in Claiborne County is 6.1%.