Campbell County, TN Map & Demographics
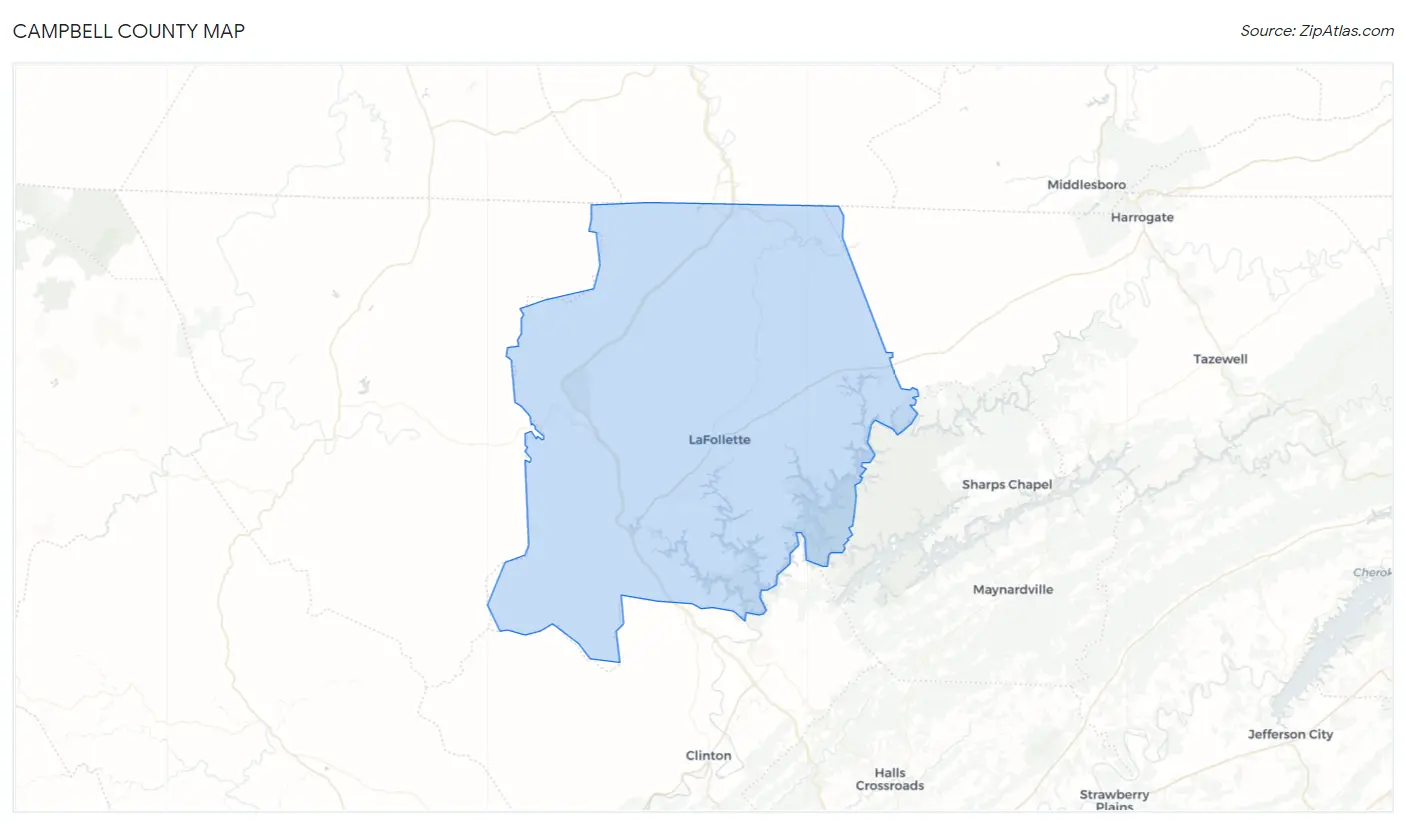
Campbell County Map
Campbell County Overview
$26,791
PER CAPITA INCOME
$61,629
AVG FAMILY INCOME
$48,258
AVG HOUSEHOLD INCOME
38.2%
WAGE / INCOME GAP [ % ]
61.8¢/ $1
WAGE / INCOME GAP [ $ ]
$9,846
FAMILY INCOME DEFICIT
0.44
INEQUALITY / GINI INDEX
39,397
TOTAL POPULATION
19,508
MALE POPULATION
19,889
FEMALE POPULATION
98.08
MALES / 100 FEMALES
101.95
FEMALES / 100 MALES
44.2
MEDIAN AGE
2.8
AVG FAMILY SIZE
2.4
AVG HOUSEHOLD SIZE
16,440
LABOR FORCE [ PEOPLE ]
51.2%
PERCENT IN LABOR FORCE
7.1%
UNEMPLOYMENT RATE
Campbell County Area Codes
Income in Campbell County
Income Overview in Campbell County
Per Capita Income in Campbell County is $26,791, while median incomes of families and households are $61,629 and $48,258 respectively.
| Characteristic | Number | Measure |
| Per Capita Income | 39,397 | $26,791 |
| Median Family Income | 10,871 | $61,629 |
| Mean Family Income | 10,871 | $74,373 |
| Median Household Income | 16,255 | $48,258 |
| Mean Household Income | 16,255 | $63,315 |
| Income Deficit | 10,871 | $9,846 |
| Wage / Income Gap (%) | 39,397 | 38.19% |
| Wage / Income Gap ($) | 39,397 | 61.81¢ per $1 |
| Gini / Inequality Index | 39,397 | 0.44 |
Earnings by Sex in Campbell County
Average Earnings in Campbell County are $34,264, $42,300 for men and $26,144 for women, a difference of 38.2%.
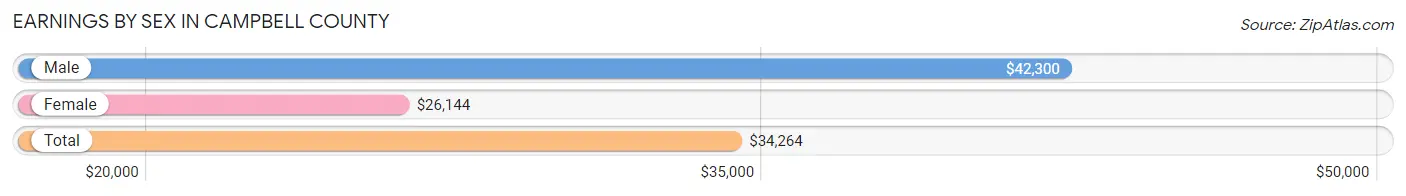
| Sex | Number | Average Earnings |
| Male | 8,982 (52.2%) | $42,300 |
| Female | 8,215 (47.8%) | $26,144 |
| Total | 17,197 (100.0%) | $34,264 |
Earnings by Sex by Income Bracket in Campbell County
The most common earnings brackets in Campbell County are $55,000 to $64,999 for men (865 | 9.6%) and $25,000 to $29,999 for women (911 | 11.1%).
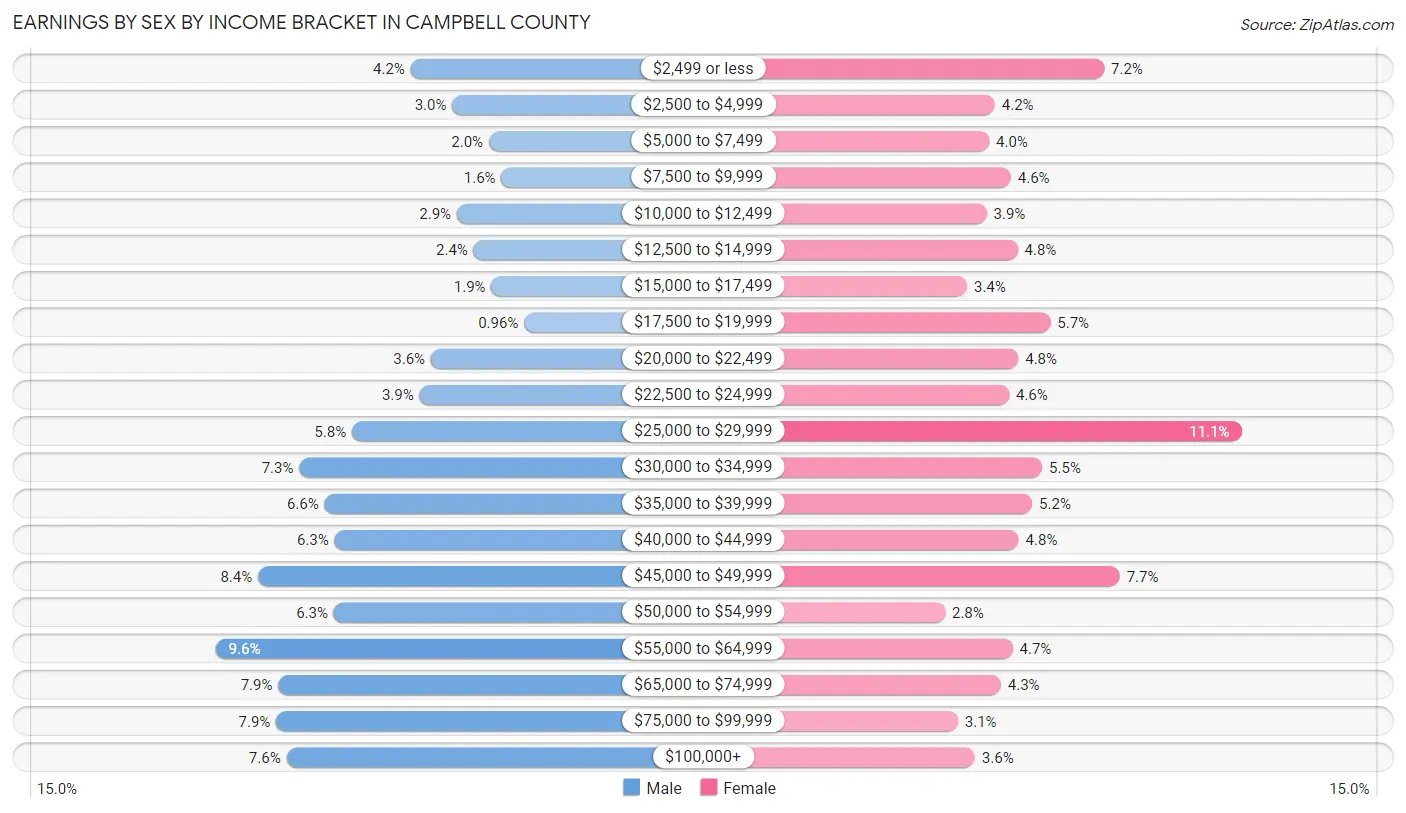
| Income | Male | Female |
| $2,499 or less | 373 (4.2%) | 594 (7.2%) |
| $2,500 to $4,999 | 268 (3.0%) | 342 (4.2%) |
| $5,000 to $7,499 | 175 (1.9%) | 329 (4.0%) |
| $7,500 to $9,999 | 144 (1.6%) | 379 (4.6%) |
| $10,000 to $12,499 | 256 (2.9%) | 323 (3.9%) |
| $12,500 to $14,999 | 214 (2.4%) | 394 (4.8%) |
| $15,000 to $17,499 | 169 (1.9%) | 278 (3.4%) |
| $17,500 to $19,999 | 86 (1.0%) | 470 (5.7%) |
| $20,000 to $22,499 | 322 (3.6%) | 396 (4.8%) |
| $22,500 to $24,999 | 350 (3.9%) | 375 (4.6%) |
| $25,000 to $29,999 | 521 (5.8%) | 911 (11.1%) |
| $30,000 to $34,999 | 654 (7.3%) | 451 (5.5%) |
| $35,000 to $39,999 | 590 (6.6%) | 428 (5.2%) |
| $40,000 to $44,999 | 565 (6.3%) | 397 (4.8%) |
| $45,000 to $49,999 | 758 (8.4%) | 630 (7.7%) |
| $50,000 to $54,999 | 567 (6.3%) | 227 (2.8%) |
| $55,000 to $64,999 | 865 (9.6%) | 383 (4.7%) |
| $65,000 to $74,999 | 707 (7.9%) | 356 (4.3%) |
| $75,000 to $99,999 | 712 (7.9%) | 256 (3.1%) |
| $100,000+ | 686 (7.6%) | 296 (3.6%) |
| Total | 8,982 (100.0%) | 8,215 (100.0%) |
Earnings by Sex by Educational Attainment in Campbell County
Average earnings in Campbell County are $46,043 for men and $27,866 for women, a difference of 39.5%. Men with an educational attainment of graduate degree enjoy the highest average annual earnings of $53,203, while those with less than high school education earn the least with $36,966. Women with an educational attainment of graduate degree earn the most with the average annual earnings of $64,290, while those with less than high school education have the smallest earnings of $15,391.
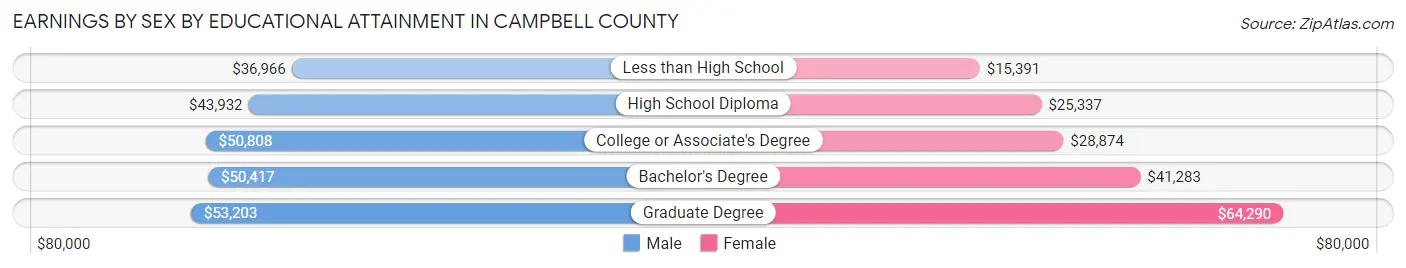
| Educational Attainment | Male Income | Female Income |
| Less than High School | $36,966 | $15,391 |
| High School Diploma | $43,932 | $25,337 |
| College or Associate's Degree | $50,808 | $28,874 |
| Bachelor's Degree | $50,417 | $41,283 |
| Graduate Degree | $53,203 | $64,290 |
| Total | $46,043 | $27,866 |
Family Income in Campbell County
Family Income Brackets in Campbell County
According to the Campbell County family income data, there are 2,065 families falling into the $50,000 to $74,999 income range, which is the most common income bracket and makes up 19.0% of all families. Conversely, the $200,000+ income bracket is the least frequent group with only 359 families (3.3%) belonging to this category.
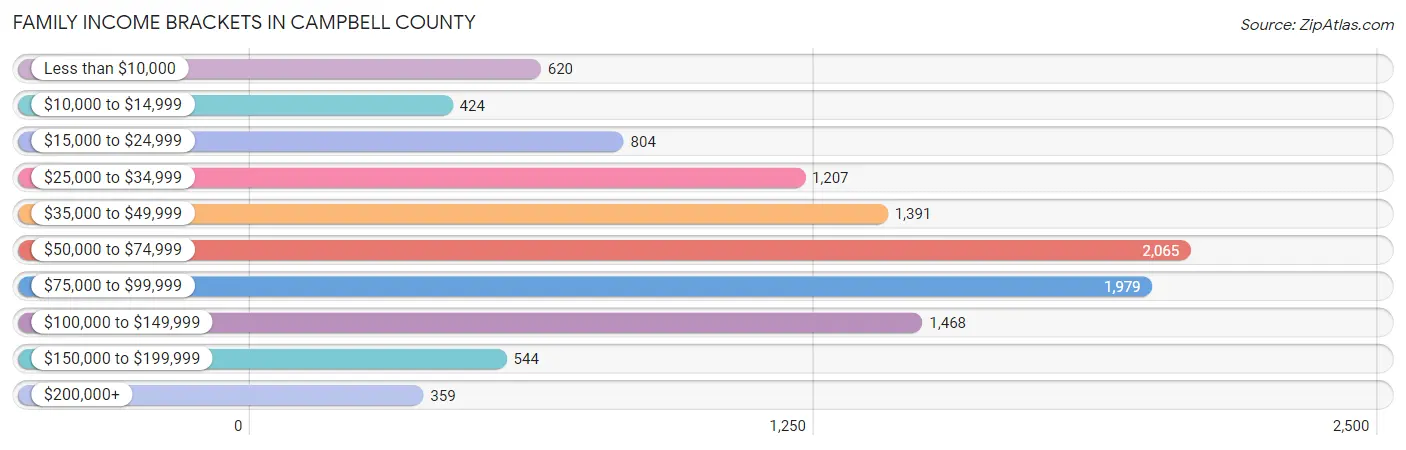
| Income Bracket | # Families | % Families |
| Less than $10,000 | 620 | 5.7% |
| $10,000 to $14,999 | 424 | 3.9% |
| $15,000 to $24,999 | 804 | 7.4% |
| $25,000 to $34,999 | 1,207 | 11.1% |
| $35,000 to $49,999 | 1,391 | 12.8% |
| $50,000 to $74,999 | 2,065 | 19.0% |
| $75,000 to $99,999 | 1,979 | 18.2% |
| $100,000 to $149,999 | 1,468 | 13.5% |
| $150,000 to $199,999 | 544 | 5.0% |
| $200,000+ | 359 | 3.3% |
Family Income by Famaliy Size in Campbell County
4-person families (1,690 | 15.5%) account for the highest median family income in Campbell County with $85,022 per family, while 2-person families (5,978 | 55.0%) have the highest median income of $25,644 per family member.
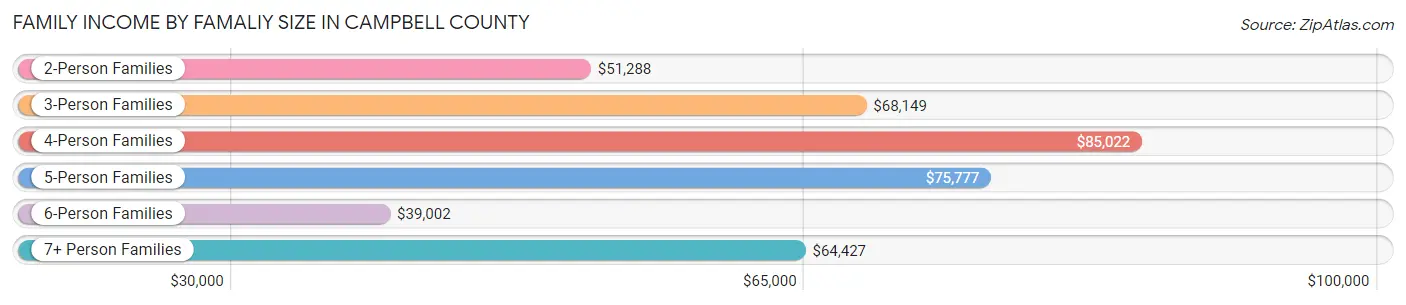
| Income Bracket | # Families | Median Income |
| 2-Person Families | 5,978 (55.0%) | $51,288 |
| 3-Person Families | 2,171 (20.0%) | $68,149 |
| 4-Person Families | 1,690 (15.5%) | $85,022 |
| 5-Person Families | 507 (4.7%) | $75,777 |
| 6-Person Families | 241 (2.2%) | $39,002 |
| 7+ Person Families | 284 (2.6%) | $64,427 |
| Total | 10,871 (100.0%) | $61,629 |
Family Income by Number of Earners in Campbell County
The median family income in Campbell County is $61,629, with families comprising 3+ earners (791) having the highest median family income of $101,809, while families with no earners (2,859) have the lowest median family income of $33,252, accounting for 7.3% and 26.3% of families, respectively.
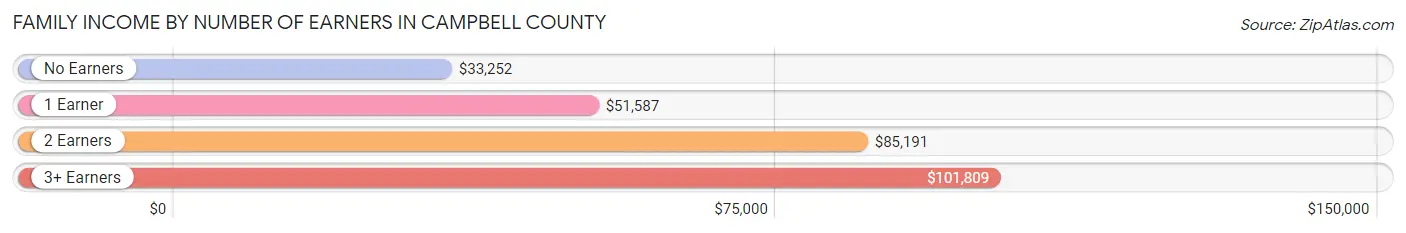
| Number of Earners | # Families | Median Income |
| No Earners | 2,859 (26.3%) | $33,252 |
| 1 Earner | 3,644 (33.5%) | $51,587 |
| 2 Earners | 3,577 (32.9%) | $85,191 |
| 3+ Earners | 791 (7.3%) | $101,809 |
| Total | 10,871 (100.0%) | $61,629 |
Household Income in Campbell County
Household Income Brackets in Campbell County
With 2,877 households falling in the category, the $50,000 to $74,999 income range is the most frequent in Campbell County, accounting for 17.7% of all households. In contrast, only 374 households (2.3%) fall into the $200,000+ income bracket, making it the least populous group.
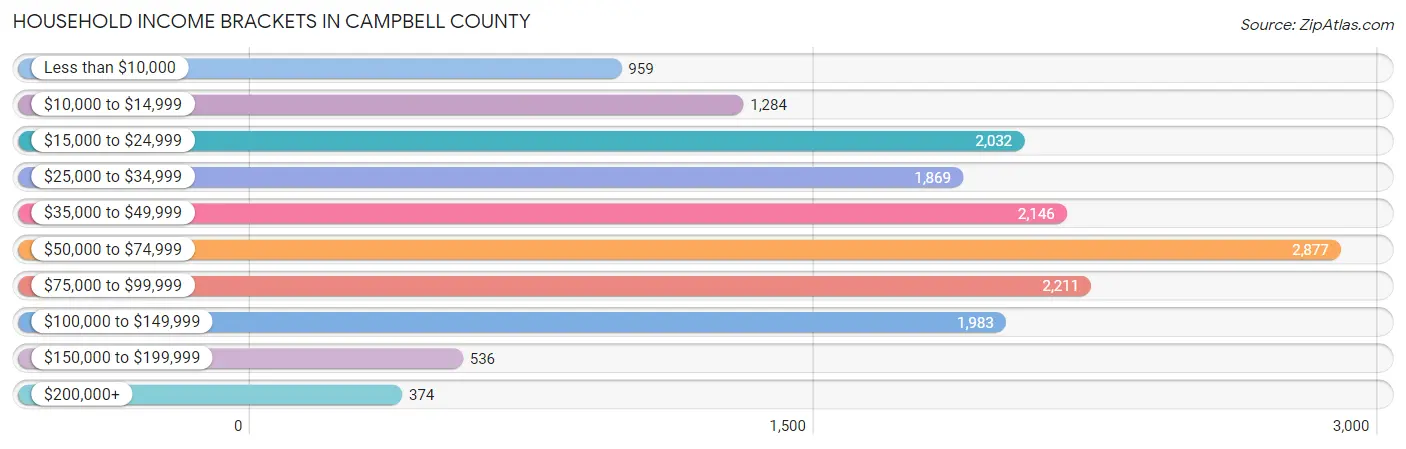
| Income Bracket | # Households | % Households |
| Less than $10,000 | 959 | 5.9% |
| $10,000 to $14,999 | 1,284 | 7.9% |
| $15,000 to $24,999 | 2,032 | 12.5% |
| $25,000 to $34,999 | 1,869 | 11.5% |
| $35,000 to $49,999 | 2,146 | 13.2% |
| $50,000 to $74,999 | 2,877 | 17.7% |
| $75,000 to $99,999 | 2,211 | 13.6% |
| $100,000 to $149,999 | 1,983 | 12.2% |
| $150,000 to $199,999 | 536 | 3.3% |
| $200,000+ | 374 | 2.3% |
Household Income by Householder Age in Campbell County
The median household income in Campbell County is $48,258, with the highest median household income of $61,989 found in the 25 to 44 years age bracket for the primary householder. A total of 4,200 households (25.8%) fall into this category. Meanwhile, the 65+ years age bracket for the primary householder has the lowest median household income of $34,242, with 5,200 households (32.0%) in this group.
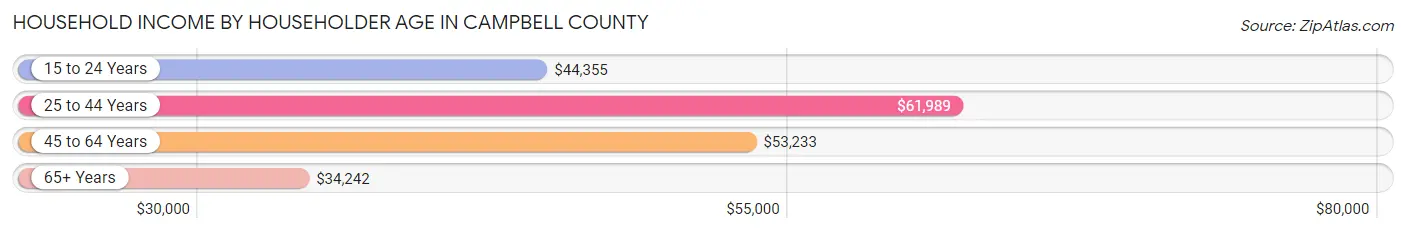
| Income Bracket | # Households | Median Income |
| 15 to 24 Years | 620 (3.8%) | $44,355 |
| 25 to 44 Years | 4,200 (25.8%) | $61,989 |
| 45 to 64 Years | 6,235 (38.4%) | $53,233 |
| 65+ Years | 5,200 (32.0%) | $34,242 |
| Total | 16,255 (100.0%) | $48,258 |
Poverty in Campbell County
Income Below Poverty by Sex and Age in Campbell County
With 18.0% poverty level for males and 20.8% for females among the residents of Campbell County, under 5 year old males and 25 to 34 year old females are the most vulnerable to poverty, with 448 males (42.4%) and 785 females (34.0%) in their respective age groups living below the poverty level.
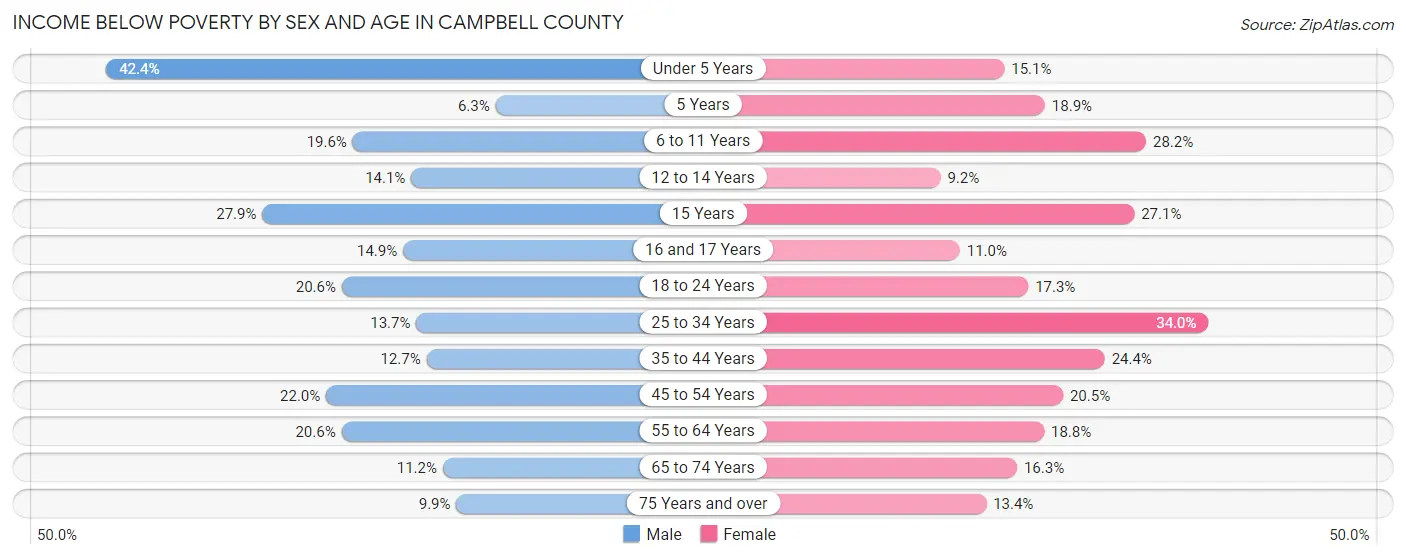
| Age Bracket | Male | Female |
| Under 5 Years | 448 (42.4%) | 155 (15.1%) |
| 5 Years | 9 (6.3%) | 23 (18.9%) |
| 6 to 11 Years | 286 (19.6%) | 429 (28.2%) |
| 12 to 14 Years | 87 (14.1%) | 38 (9.2%) |
| 15 Years | 95 (27.9%) | 76 (27.1%) |
| 16 and 17 Years | 57 (14.9%) | 46 (11.0%) |
| 18 to 24 Years | 303 (20.6%) | 243 (17.3%) |
| 25 to 34 Years | 317 (13.7%) | 785 (34.0%) |
| 35 to 44 Years | 278 (12.7%) | 528 (24.4%) |
| 45 to 54 Years | 614 (22.0%) | 559 (20.5%) |
| 55 to 64 Years | 551 (20.6%) | 531 (18.8%) |
| 65 to 74 Years | 238 (11.2%) | 396 (16.3%) |
| 75 Years and over | 144 (9.9%) | 237 (13.4%) |
| Total | 3,427 (18.0%) | 4,046 (20.8%) |
Income Above Poverty by Sex and Age in Campbell County
According to the poverty statistics in Campbell County, males aged 5 years and females aged 12 to 14 years are the age groups that are most secure financially, with 93.7% of males and 90.8% of females in these age groups living above the poverty line.
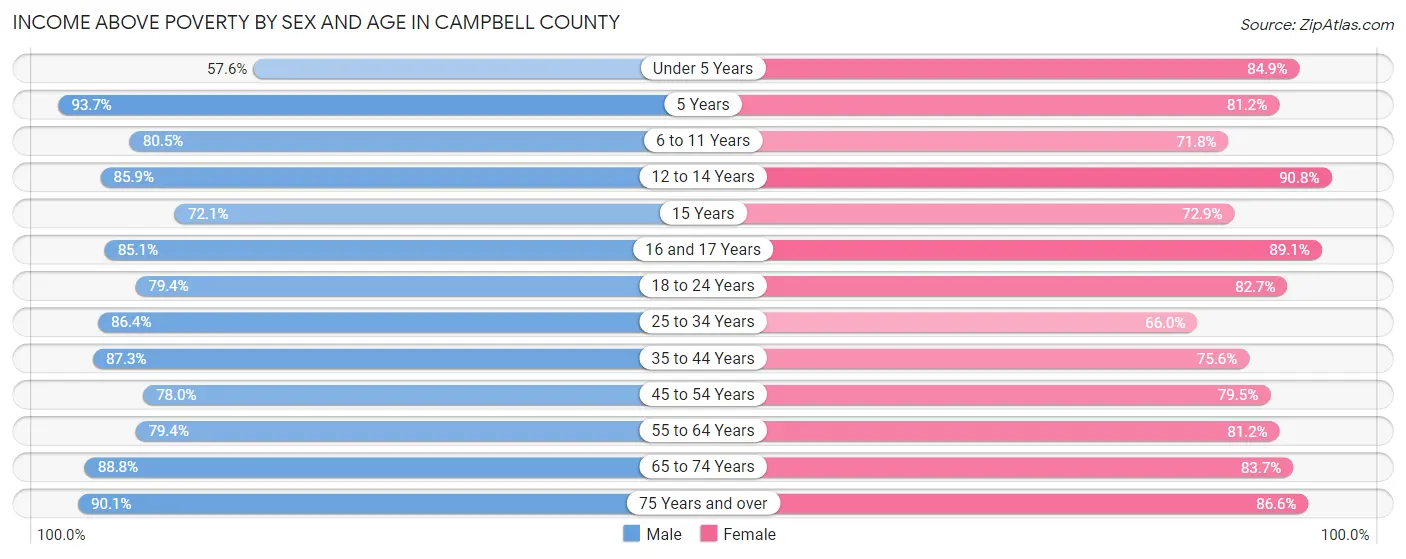
| Age Bracket | Male | Female |
| Under 5 Years | 608 (57.6%) | 873 (84.9%) |
| 5 Years | 134 (93.7%) | 99 (81.1%) |
| 6 to 11 Years | 1,177 (80.4%) | 1,090 (71.8%) |
| 12 to 14 Years | 529 (85.9%) | 377 (90.8%) |
| 15 Years | 245 (72.1%) | 204 (72.9%) |
| 16 and 17 Years | 326 (85.1%) | 374 (89.0%) |
| 18 to 24 Years | 1,171 (79.4%) | 1,162 (82.7%) |
| 25 to 34 Years | 2,006 (86.4%) | 1,523 (66.0%) |
| 35 to 44 Years | 1,911 (87.3%) | 1,636 (75.6%) |
| 45 to 54 Years | 2,175 (78.0%) | 2,164 (79.5%) |
| 55 to 64 Years | 2,125 (79.4%) | 2,298 (81.2%) |
| 65 to 74 Years | 1,888 (88.8%) | 2,039 (83.7%) |
| 75 Years and over | 1,306 (90.1%) | 1,531 (86.6%) |
| Total | 15,601 (82.0%) | 15,370 (79.2%) |
Income Below Poverty Among Married-Couple Families in Campbell County
The poverty statistics for married-couple families in Campbell County show that 9.8% or 736 of the total 7,528 families live below the poverty line. Families with 5 or more children have the highest poverty rate of 22.7%, comprising of 45 families. On the other hand, families with 1 or 2 children have the lowest poverty rate of 7.4%, which includes 152 families.
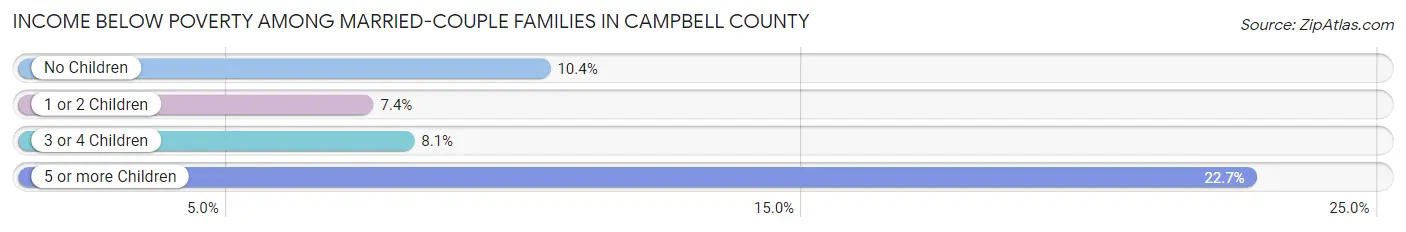
| Children | Above Poverty | Below Poverty |
| No Children | 4,316 (89.6%) | 503 (10.4%) |
| 1 or 2 Children | 1,913 (92.6%) | 152 (7.4%) |
| 3 or 4 Children | 410 (91.9%) | 36 (8.1%) |
| 5 or more Children | 153 (77.3%) | 45 (22.7%) |
| Total | 6,792 (90.2%) | 736 (9.8%) |
Income Below Poverty Among Single-Parent Households in Campbell County
According to the poverty data in Campbell County, 24.2% or 208 single-father households and 30.7% or 763 single-mother households are living below the poverty line. Among single-father households, those with 3 or 4 children have the highest poverty rate, with 26 households (45.6%) experiencing poverty. Likewise, among single-mother households, those with 3 or 4 children have the highest poverty rate, with 88 households (61.1%) falling below the poverty line.
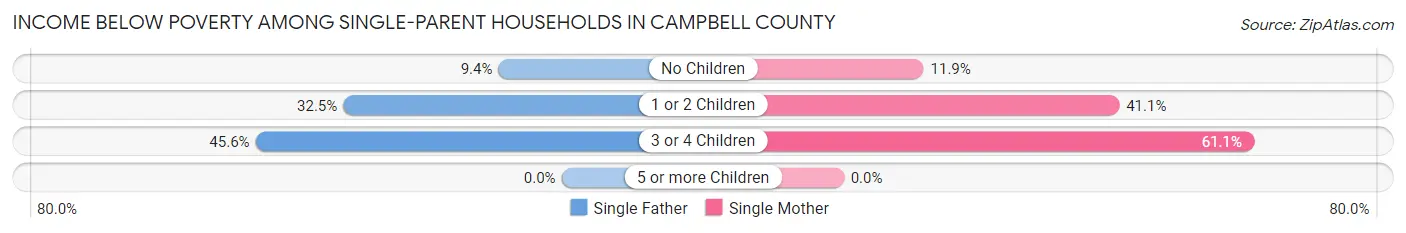
| Children | Single Father | Single Mother |
| No Children | 32 (9.4%) | 117 (11.9%) |
| 1 or 2 Children | 150 (32.5%) | 558 (41.1%) |
| 3 or 4 Children | 26 (45.6%) | 88 (61.1%) |
| 5 or more Children | 0 (0.0%) | 0 (0.0%) |
| Total | 208 (24.2%) | 763 (30.7%) |
Income Below Poverty Among Married-Couple vs Single-Parent Households in Campbell County
The poverty data for Campbell County shows that 736 of the married-couple family households (9.8%) and 971 of the single-parent households (29.0%) are living below the poverty level. Within the married-couple family households, those with 5 or more children have the highest poverty rate, with 45 households (22.7%) falling below the poverty line. Among the single-parent households, those with 3 or 4 children have the highest poverty rate, with 114 household (56.7%) living below poverty.
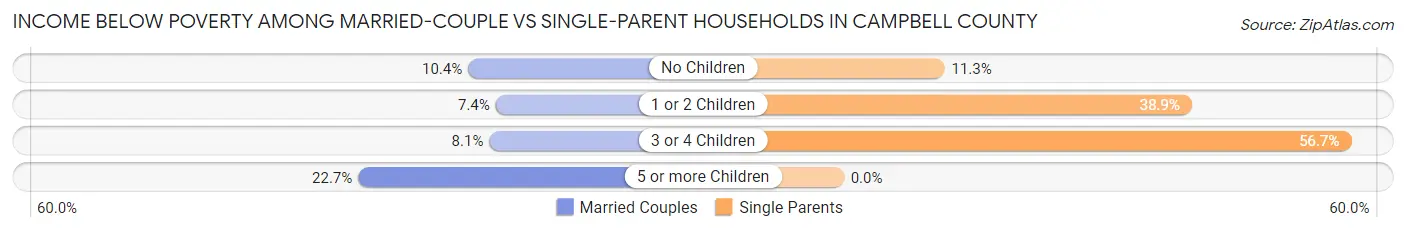
| Children | Married-Couple Families | Single-Parent Households |
| No Children | 503 (10.4%) | 149 (11.3%) |
| 1 or 2 Children | 152 (7.4%) | 708 (38.9%) |
| 3 or 4 Children | 36 (8.1%) | 114 (56.7%) |
| 5 or more Children | 45 (22.7%) | 0 (0.0%) |
| Total | 736 (9.8%) | 971 (29.0%) |
Race in Campbell County
The most populous races in Campbell County are White / Caucasian (37,935 | 96.3%), Two or more Races (930 | 2.4%), and Hispanic or Latino (661 | 1.7%).
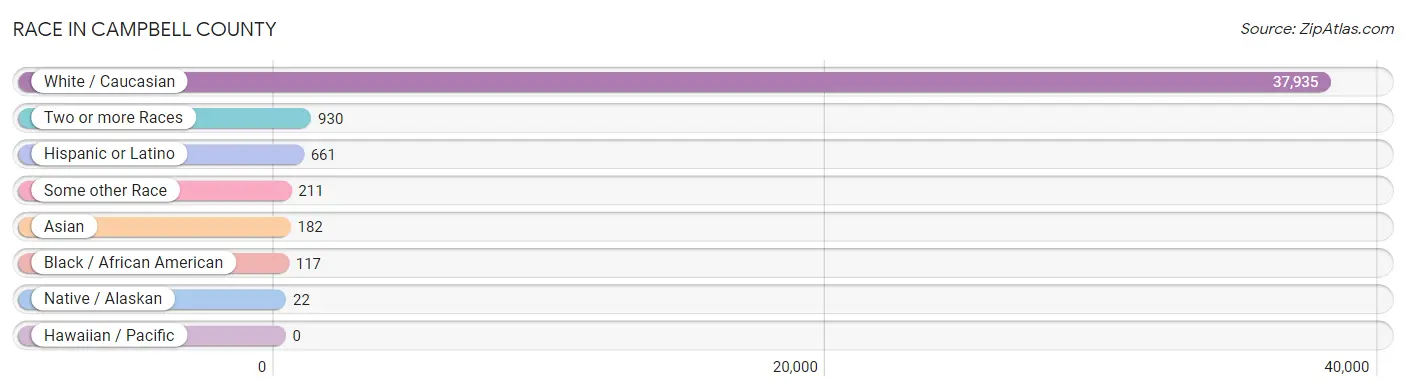
| Race | # Population | % Population |
| Asian | 182 | 0.5% |
| Black / African American | 117 | 0.3% |
| Hawaiian / Pacific | 0 | 0.0% |
| Hispanic or Latino | 661 | 1.7% |
| Native / Alaskan | 22 | 0.1% |
| White / Caucasian | 37,935 | 96.3% |
| Two or more Races | 930 | 2.4% |
| Some other Race | 211 | 0.5% |
| Total | 39,397 | 100.0% |
Ancestry in Campbell County
The most populous ancestries reported in Campbell County are German (3,927 | 10.0%), English (3,912 | 9.9%), Irish (3,490 | 8.9%), American (3,484 | 8.8%), and Scottish (1,345 | 3.4%), together accounting for 41.0% of all Campbell County residents.
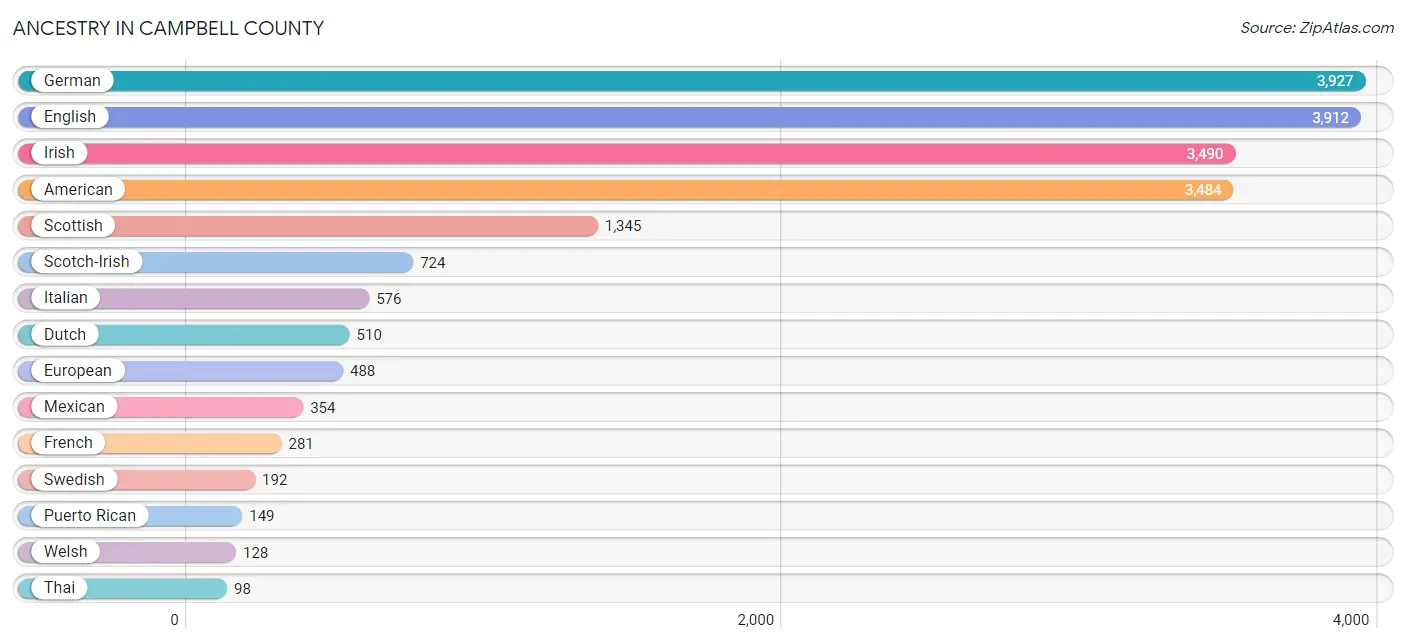
| Ancestry | # Population | % Population |
| Aleut | 6 | 0.0% |
| American | 3,484 | 8.8% |
| Arab | 23 | 0.1% |
| Argentinean | 6 | 0.0% |
| Armenian | 32 | 0.1% |
| Austrian | 29 | 0.1% |
| Brazilian | 26 | 0.1% |
| British | 90 | 0.2% |
| Burmese | 1 | 0.0% |
| Canadian | 25 | 0.1% |
| Central American | 27 | 0.1% |
| Central American Indian | 4 | 0.0% |
| Cherokee | 89 | 0.2% |
| Creek | 3 | 0.0% |
| Cuban | 12 | 0.0% |
| Czech | 4 | 0.0% |
| Czechoslovakian | 36 | 0.1% |
| Danish | 8 | 0.0% |
| Dutch | 510 | 1.3% |
| Dutch West Indian | 5 | 0.0% |
| Eastern European | 18 | 0.1% |
| Egyptian | 4 | 0.0% |
| English | 3,912 | 9.9% |
| European | 488 | 1.2% |
| Finnish | 8 | 0.0% |
| French | 281 | 0.7% |
| French Canadian | 49 | 0.1% |
| German | 3,927 | 10.0% |
| Greek | 11 | 0.0% |
| Guatemalan | 27 | 0.1% |
| Hungarian | 6 | 0.0% |
| Indian (Asian) | 72 | 0.2% |
| Inupiat | 5 | 0.0% |
| Iraqi | 4 | 0.0% |
| Irish | 3,490 | 8.9% |
| Iroquois | 5 | 0.0% |
| Italian | 576 | 1.5% |
| Korean | 4 | 0.0% |
| Lithuanian | 42 | 0.1% |
| Malaysian | 13 | 0.0% |
| Mexican | 354 | 0.9% |
| Mexican American Indian | 4 | 0.0% |
| Moroccan | 7 | 0.0% |
| Northern European | 14 | 0.0% |
| Norwegian | 58 | 0.2% |
| Polish | 45 | 0.1% |
| Portuguese | 30 | 0.1% |
| Puerto Rican | 149 | 0.4% |
| Puget Sound Salish | 3 | 0.0% |
| Romanian | 51 | 0.1% |
| Russian | 65 | 0.2% |
| Scandinavian | 40 | 0.1% |
| Scotch-Irish | 724 | 1.8% |
| Scottish | 1,345 | 3.4% |
| Slovak | 36 | 0.1% |
| South American | 11 | 0.0% |
| Spanish | 86 | 0.2% |
| Subsaharan African | 18 | 0.1% |
| Swedish | 192 | 0.5% |
| Swiss | 9 | 0.0% |
| Syrian | 8 | 0.0% |
| Thai | 98 | 0.3% |
| Venezuelan | 5 | 0.0% |
| Welsh | 128 | 0.3% | View All 64 Rows |
Immigrants in Campbell County
The most numerous immigrant groups reported in Campbell County came from Latin America (157 | 0.4%), Asia (129 | 0.3%), Central America (124 | 0.3%), Mexico (101 | 0.3%), and Europe (79 | 0.2%), together accounting for 1.5% of all Campbell County residents.
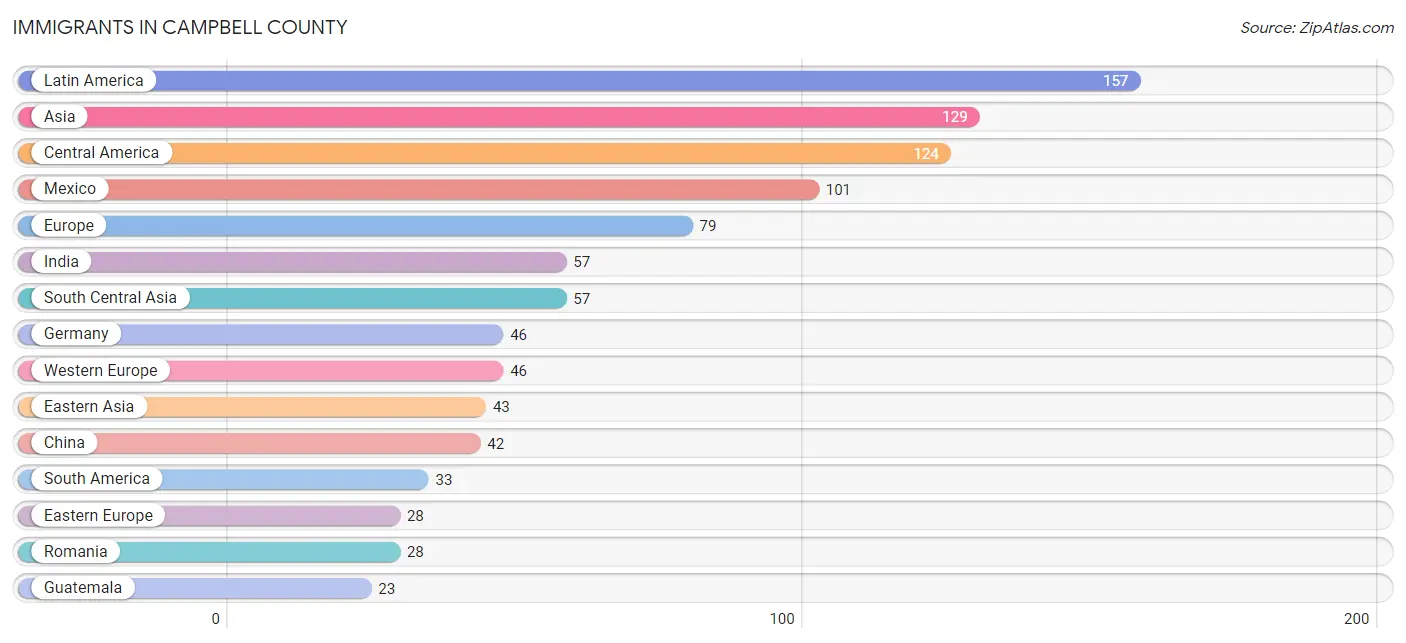
| Immigration Origin | # Population | % Population |
| Africa | 7 | 0.0% |
| Argentina | 6 | 0.0% |
| Asia | 129 | 0.3% |
| Brazil | 22 | 0.1% |
| Canada | 9 | 0.0% |
| Central America | 124 | 0.3% |
| China | 42 | 0.1% |
| Eastern Asia | 43 | 0.1% |
| Eastern Europe | 28 | 0.1% |
| Europe | 79 | 0.2% |
| Germany | 46 | 0.1% |
| Guatemala | 23 | 0.1% |
| India | 57 | 0.1% |
| Iraq | 4 | 0.0% |
| Korea | 1 | 0.0% |
| Laos | 13 | 0.0% |
| Latin America | 157 | 0.4% |
| Mexico | 101 | 0.3% |
| Morocco | 7 | 0.0% |
| Northern Africa | 7 | 0.0% |
| Northern Europe | 5 | 0.0% |
| Philippines | 4 | 0.0% |
| Romania | 28 | 0.1% |
| South America | 33 | 0.1% |
| South Central Asia | 57 | 0.1% |
| South Eastern Asia | 17 | 0.0% |
| Sweden | 5 | 0.0% |
| Syria | 8 | 0.0% |
| Venezuela | 5 | 0.0% |
| Western Asia | 12 | 0.0% |
| Western Europe | 46 | 0.1% | View All 31 Rows |
Sex and Age in Campbell County
Sex and Age in Campbell County
The most populous age groups in Campbell County are 50 to 54 Years (1,459 | 7.5%) for men and 55 to 59 Years (1,549 | 7.8%) for women.
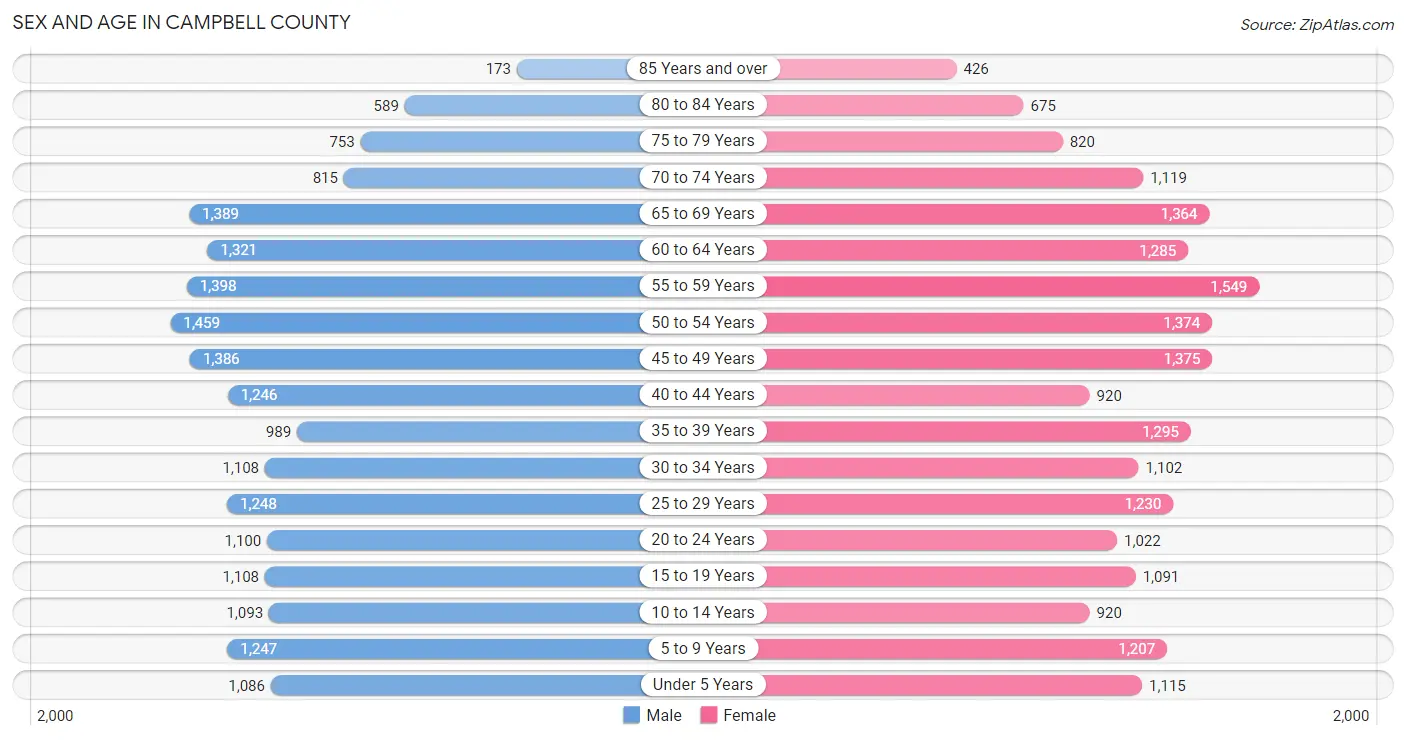
| Age Bracket | Male | Female |
| Under 5 Years | 1,086 (5.6%) | 1,115 (5.6%) |
| 5 to 9 Years | 1,247 (6.4%) | 1,207 (6.1%) |
| 10 to 14 Years | 1,093 (5.6%) | 920 (4.6%) |
| 15 to 19 Years | 1,108 (5.7%) | 1,091 (5.5%) |
| 20 to 24 Years | 1,100 (5.6%) | 1,022 (5.1%) |
| 25 to 29 Years | 1,248 (6.4%) | 1,230 (6.2%) |
| 30 to 34 Years | 1,108 (5.7%) | 1,102 (5.5%) |
| 35 to 39 Years | 989 (5.1%) | 1,295 (6.5%) |
| 40 to 44 Years | 1,246 (6.4%) | 920 (4.6%) |
| 45 to 49 Years | 1,386 (7.1%) | 1,375 (6.9%) |
| 50 to 54 Years | 1,459 (7.5%) | 1,374 (6.9%) |
| 55 to 59 Years | 1,398 (7.2%) | 1,549 (7.8%) |
| 60 to 64 Years | 1,321 (6.8%) | 1,285 (6.5%) |
| 65 to 69 Years | 1,389 (7.1%) | 1,364 (6.9%) |
| 70 to 74 Years | 815 (4.2%) | 1,119 (5.6%) |
| 75 to 79 Years | 753 (3.9%) | 820 (4.1%) |
| 80 to 84 Years | 589 (3.0%) | 675 (3.4%) |
| 85 Years and over | 173 (0.9%) | 426 (2.1%) |
| Total | 19,508 (100.0%) | 19,889 (100.0%) |
Families and Households in Campbell County
Median Family Size in Campbell County
The median family size in Campbell County is 2.84 persons per family, with married-couple families (7,528 | 69.3%) accounting for the largest median family size of 2.92 persons per family. On the other hand, single male/father families (858 | 7.9%) represent the smallest median family size with 2.29 persons per family.
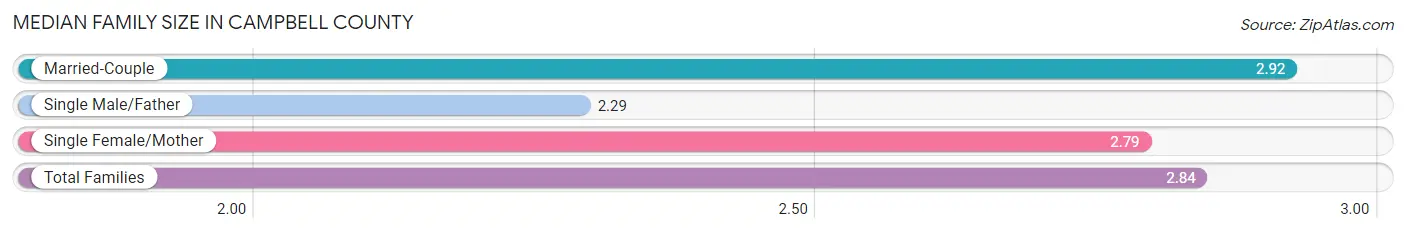
| Family Type | # Families | Family Size |
| Married-Couple | 7,528 (69.3%) | 2.92 |
| Single Male/Father | 858 (7.9%) | 2.29 |
| Single Female/Mother | 2,485 (22.9%) | 2.79 |
| Total Families | 10,871 (100.0%) | 2.84 |
Median Household Size in Campbell County
The median household size in Campbell County is 2.38 persons per household, with married-couple households (7,528 | 46.3%) accounting for the largest median household size of 2.94 persons per household. non-family households (5,384 | 33.1%) represent the smallest median household size with 1.28 persons per household.
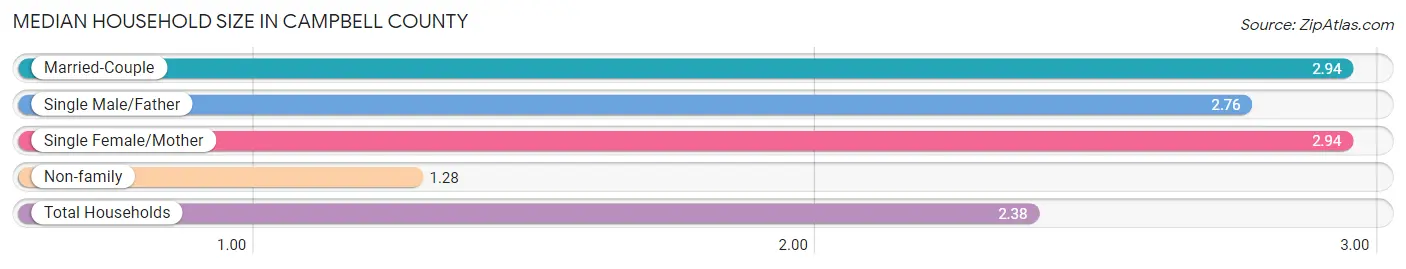
| Household Type | # Households | Household Size |
| Married-Couple | 7,528 (46.3%) | 2.94 |
| Single Male/Father | 858 (5.3%) | 2.76 |
| Single Female/Mother | 2,485 (15.3%) | 2.94 |
| Non-family | 5,384 (33.1%) | 1.28 |
| Total Households | 16,255 (100.0%) | 2.38 |
Household Size by Marriage Status in Campbell County
Out of a total of 16,255 households in Campbell County, 10,871 (66.9%) are family households, while 5,384 (33.1%) are nonfamily households. The most numerous type of family households are 2-person households, comprising 5,420, and the most common type of nonfamily households are 1-person households, comprising 4,344.
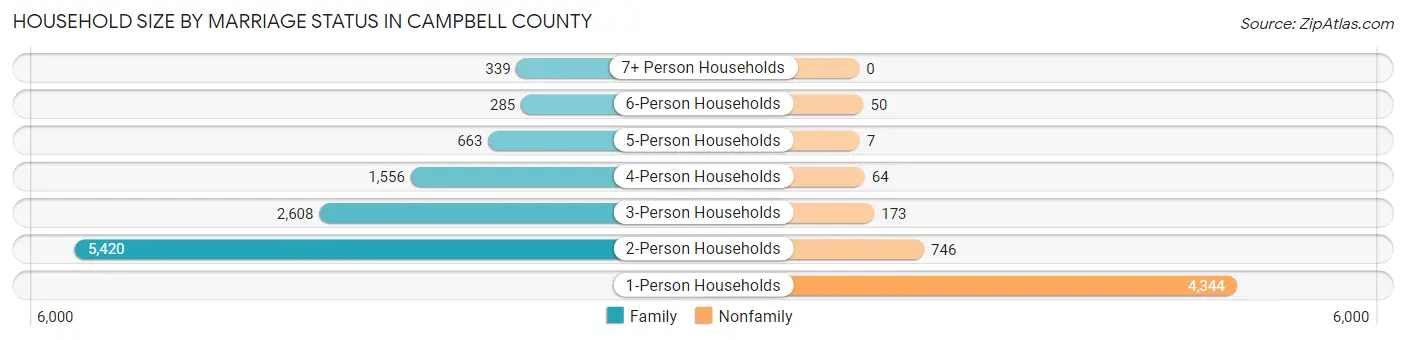
| Household Size | Family Households | Nonfamily Households |
| 1-Person Households | - | 4,344 (26.7%) |
| 2-Person Households | 5,420 (33.3%) | 746 (4.6%) |
| 3-Person Households | 2,608 (16.0%) | 173 (1.1%) |
| 4-Person Households | 1,556 (9.6%) | 64 (0.4%) |
| 5-Person Households | 663 (4.1%) | 7 (0.0%) |
| 6-Person Households | 285 (1.8%) | 50 (0.3%) |
| 7+ Person Households | 339 (2.1%) | 0 (0.0%) |
| Total | 10,871 (66.9%) | 5,384 (33.1%) |
Female Fertility in Campbell County
Fertility by Age in Campbell County
Average fertility rate in Campbell County is 81.0 births per 1,000 women. Women in the age bracket of 20 to 34 years have the highest fertility rate with 171.0 births per 1,000 women. Women in the age bracket of 20 to 34 years acount for 85.4% of all women with births.
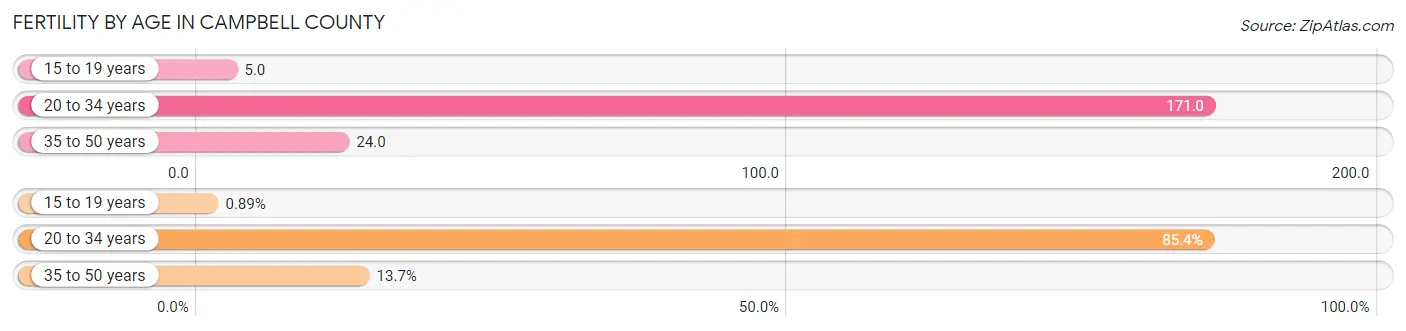
| Age Bracket | Women with Births | Births / 1,000 Women |
| 15 to 19 years | 6 (0.9%) | 5.0 |
| 20 to 34 years | 573 (85.4%) | 171.0 |
| 35 to 50 years | 92 (13.7%) | 24.0 |
| Total | 671 (100.0%) | 81.0 |
Fertility by Age by Marriage Status in Campbell County
59.5% of women with births (671) in Campbell County are married. The highest percentage of unmarried women with births falls into 15 to 19 years age bracket with 100.0% of them unmarried at the time of birth, while the lowest percentage of unmarried women with births belong to 35 to 50 years age bracket with 18.5% of them unmarried.
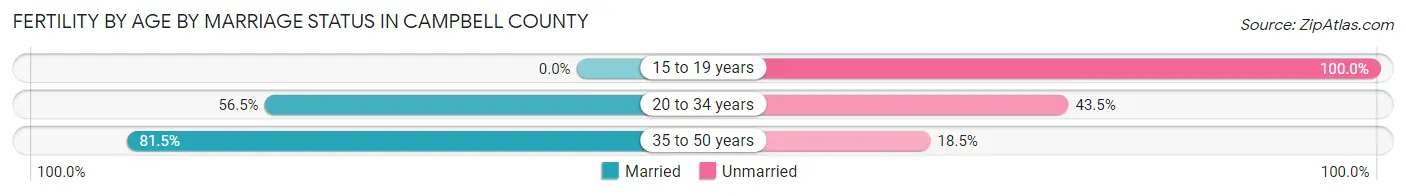
| Age Bracket | Married | Unmarried |
| 15 to 19 years | 0 (0.0%) | 6 (100.0%) |
| 20 to 34 years | 324 (56.5%) | 249 (43.5%) |
| 35 to 50 years | 75 (81.5%) | 17 (18.5%) |
| Total | 399 (59.5%) | 272 (40.5%) |
Fertility by Education in Campbell County
Average fertility rate in Campbell County is 81.0 births per 1,000 women. Women with the education attainment of college or associate's degree have the highest fertility rate of 115.0 births per 1,000 women, while women with the education attainment of graduate degree have the lowest fertility at 26.0 births per 1,000 women. Women with the education attainment of college or associate's degree represent 43.7% of all women with births.
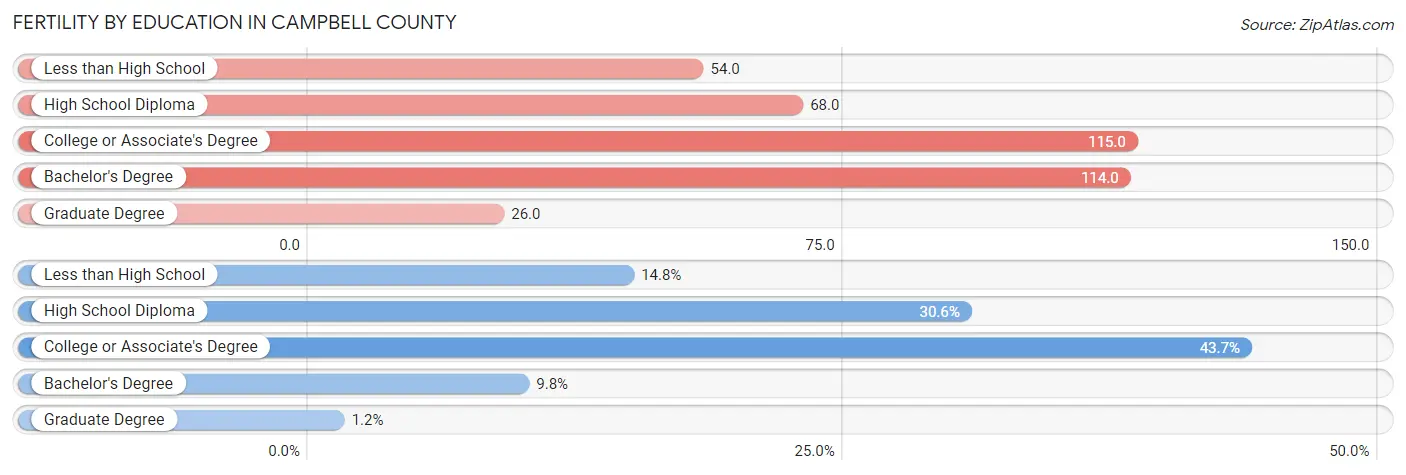
| Educational Attainment | Women with Births | Births / 1,000 Women |
| Less than High School | 99 (14.7%) | 54.0 |
| High School Diploma | 205 (30.5%) | 68.0 |
| College or Associate's Degree | 293 (43.7%) | 115.0 |
| Bachelor's Degree | 66 (9.8%) | 114.0 |
| Graduate Degree | 8 (1.2%) | 26.0 |
| Total | 671 (100.0%) | 81.0 |
Fertility by Education by Marriage Status in Campbell County
40.5% of women with births in Campbell County are unmarried. Women with the educational attainment of bachelor's degree are most likely to be married with 100.0% of them married at childbirth, while women with the educational attainment of high school diploma are least likely to be married with 70.7% of them unmarried at childbirth.
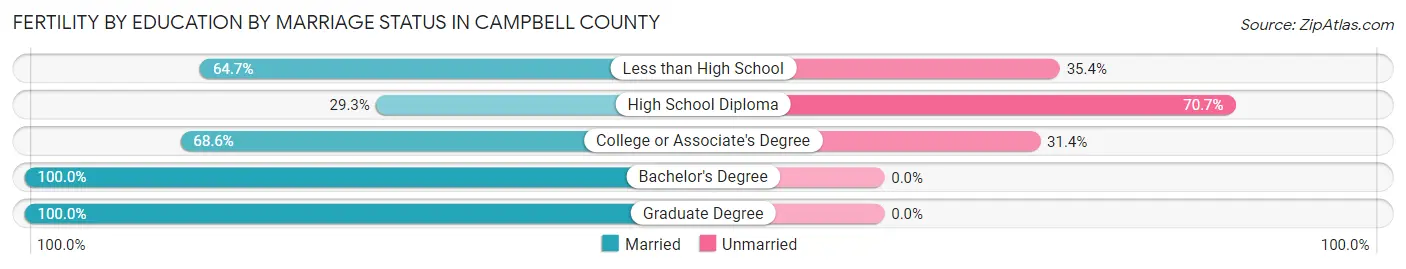
| Educational Attainment | Married | Unmarried |
| Less than High School | 64 (64.6%) | 35 (35.3%) |
| High School Diploma | 60 (29.3%) | 145 (70.7%) |
| College or Associate's Degree | 201 (68.6%) | 92 (31.4%) |
| Bachelor's Degree | 66 (100.0%) | 0 (0.0%) |
| Graduate Degree | 8 (100.0%) | 0 (0.0%) |
| Total | 399 (59.5%) | 272 (40.5%) |
Employment Characteristics in Campbell County
Employment by Class of Employer in Campbell County
Among the 14,927 employed individuals in Campbell County, private company employees (9,950 | 66.7%), local government employees (1,914 | 12.8%), and self-employed (not incorporated) (1,159 | 7.8%) make up the most common classes of employment.
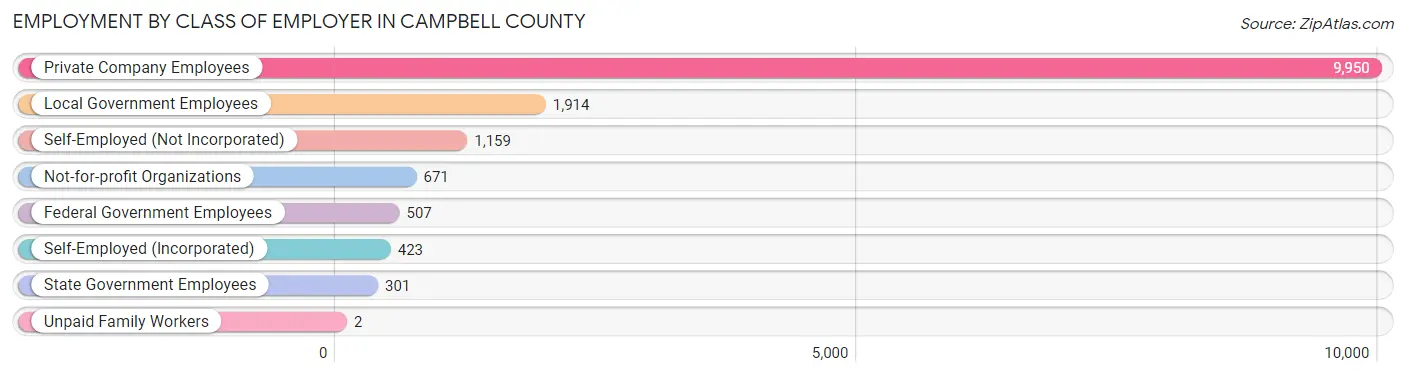
| Employer Class | # Employees | % Employees |
| Private Company Employees | 9,950 | 66.7% |
| Self-Employed (Incorporated) | 423 | 2.8% |
| Self-Employed (Not Incorporated) | 1,159 | 7.8% |
| Not-for-profit Organizations | 671 | 4.5% |
| Local Government Employees | 1,914 | 12.8% |
| State Government Employees | 301 | 2.0% |
| Federal Government Employees | 507 | 3.4% |
| Unpaid Family Workers | 2 | 0.0% |
| Total | 14,927 | 100.0% |
Employment Status by Age in Campbell County
According to the labor force statistics for Campbell County, out of the total population over 16 years of age (32,109), 51.2% or 16,440 individuals are in the labor force, with 7.1% or 1,167 of them unemployed. The age group with the highest labor force participation rate is 30 to 34 years, with 81.5% or 1,801 individuals in the labor force. Within the labor force, the 25 to 29 years age range has the highest percentage of unemployed individuals, with 10.6% or 204 of them being unemployed.
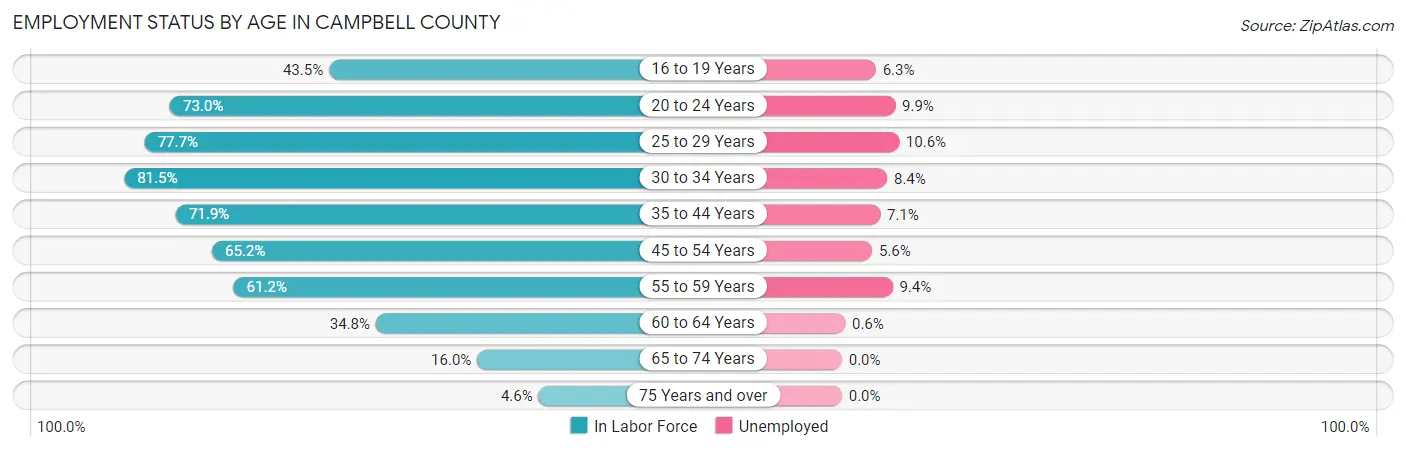
| Age Bracket | In Labor Force | Unemployed |
| 16 to 19 Years | 687 (43.5%) | 43 (6.3%) |
| 20 to 24 Years | 1,549 (73.0%) | 153 (9.9%) |
| 25 to 29 Years | 1,925 (77.7%) | 204 (10.6%) |
| 30 to 34 Years | 1,801 (81.5%) | 151 (8.4%) |
| 35 to 44 Years | 3,200 (71.9%) | 227 (7.1%) |
| 45 to 54 Years | 3,647 (65.2%) | 204 (5.6%) |
| 55 to 59 Years | 1,804 (61.2%) | 170 (9.4%) |
| 60 to 64 Years | 907 (34.8%) | 5 (0.6%) |
| 65 to 74 Years | 750 (16.0%) | 0 (0.0%) |
| 75 Years and over | 158 (4.6%) | 0 (0.0%) |
| Total | 16,440 (51.2%) | 1,167 (7.1%) |
Employment Status by Educational Attainment in Campbell County
According to labor force statistics for Campbell County, 65.5% of individuals (13,287) out of the total population between 25 and 64 years of age (20,285) are in the labor force, with 7.3% or 970 of them being unemployed. The group with the highest labor force participation rate are those with the educational attainment of college / associate degree, with 72.6% or 4,308 individuals in the labor force. Within the labor force, individuals with less than high school education have the highest percentage of unemployment, with 13.9% or 207 of them being unemployed.
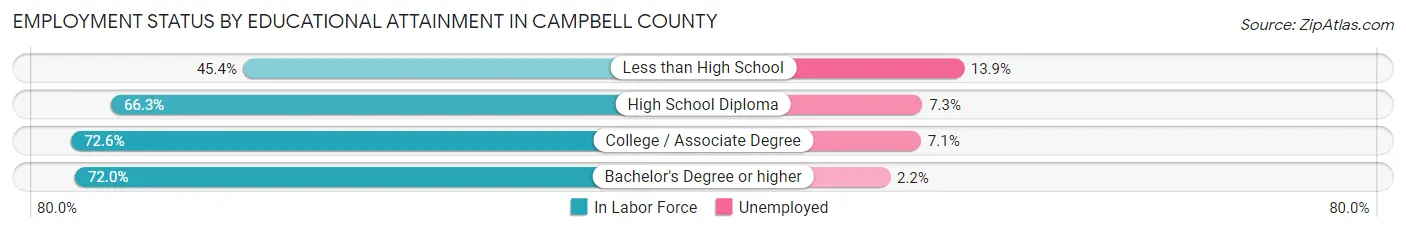
| Educational Attainment | In Labor Force | Unemployed |
| Less than High School | 1,491 (45.4%) | 457 (13.9%) |
| High School Diploma | 5,603 (66.3%) | 617 (7.3%) |
| College / Associate Degree | 4,308 (72.6%) | 421 (7.1%) |
| Bachelor's Degree or higher | 1,883 (72.0%) | 58 (2.2%) |
| Total | 13,287 (65.5%) | 1,481 (7.3%) |
Employment Occupations by Sex in Campbell County
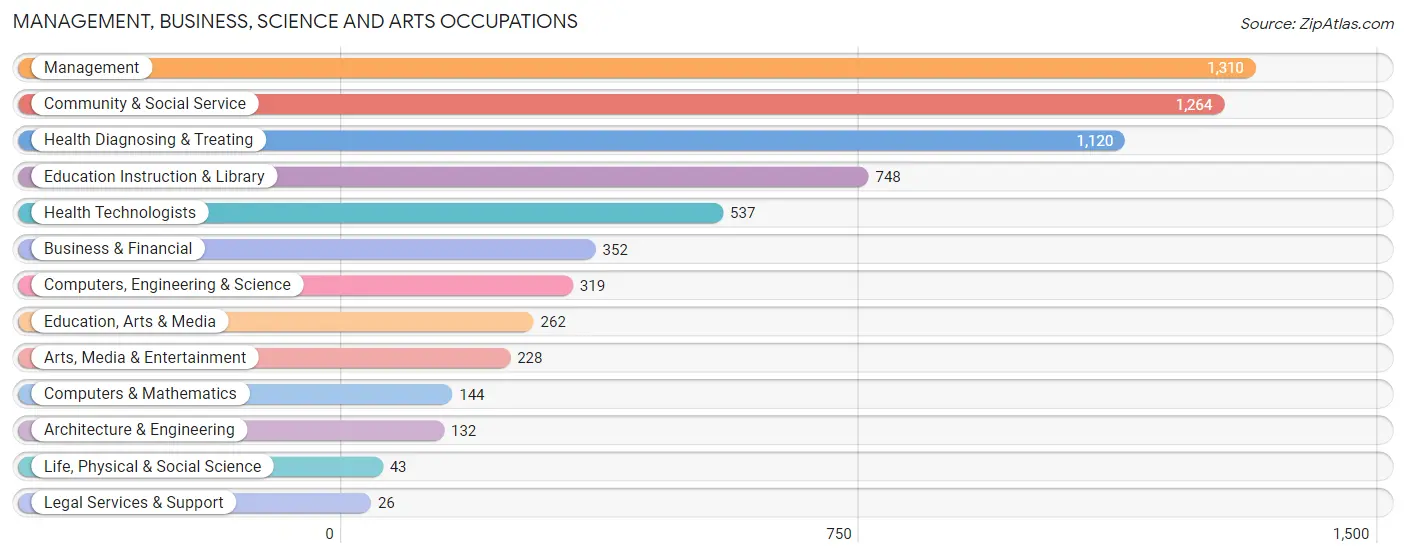
Management, Business, Science and Arts Occupations
The most common Management, Business, Science and Arts occupations in Campbell County are Management (1,310 | 8.6%), Community & Social Service (1,264 | 8.3%), Health Diagnosing & Treating (1,120 | 7.3%), Education Instruction & Library (748 | 4.9%), and Health Technologists (537 | 3.5%).
Management, Business, Science and Arts Occupations by Sex
Within the Management, Business, Science and Arts occupations in Campbell County, the most male-oriented occupations are Architecture & Engineering (93.9%), Computers & Mathematics (84.0%), and Computers, Engineering & Science (81.8%), while the most female-oriented occupations are Health Technologists (88.1%), Health Diagnosing & Treating (87.3%), and Education Instruction & Library (82.0%).
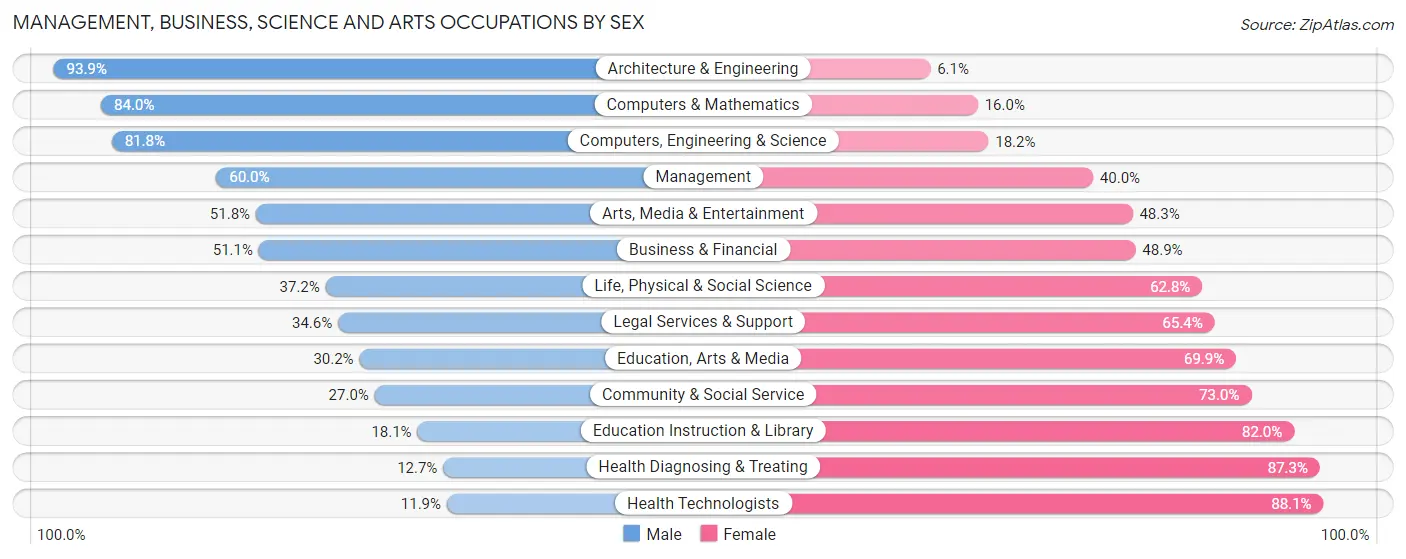
| Occupation | Male | Female |
| Management | 786 (60.0%) | 524 (40.0%) |
| Business & Financial | 180 (51.1%) | 172 (48.9%) |
| Computers, Engineering & Science | 261 (81.8%) | 58 (18.2%) |
| Computers & Mathematics | 121 (84.0%) | 23 (16.0%) |
| Architecture & Engineering | 124 (93.9%) | 8 (6.1%) |
| Life, Physical & Social Science | 16 (37.2%) | 27 (62.8%) |
| Community & Social Service | 341 (27.0%) | 923 (73.0%) |
| Education, Arts & Media | 79 (30.1%) | 183 (69.9%) |
| Legal Services & Support | 9 (34.6%) | 17 (65.4%) |
| Education Instruction & Library | 135 (18.0%) | 613 (82.0%) |
| Arts, Media & Entertainment | 118 (51.7%) | 110 (48.2%) |
| Health Diagnosing & Treating | 142 (12.7%) | 978 (87.3%) |
| Health Technologists | 64 (11.9%) | 473 (88.1%) |
| Total (Category) | 1,710 (39.2%) | 2,655 (60.8%) |
| Total (Overall) | 8,116 (53.1%) | 7,156 (46.9%) |
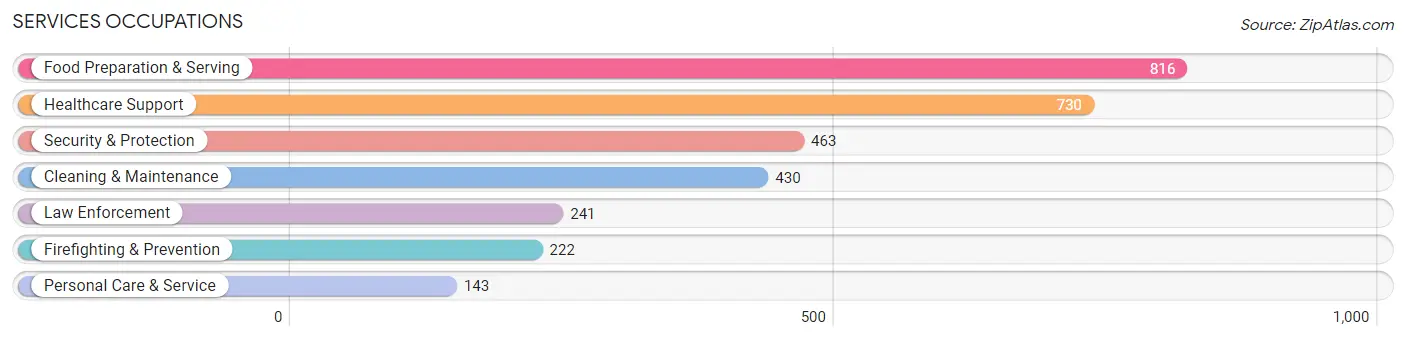
Services Occupations
The most common Services occupations in Campbell County are Food Preparation & Serving (816 | 5.3%), Healthcare Support (730 | 4.8%), Security & Protection (463 | 3.0%), Cleaning & Maintenance (430 | 2.8%), and Law Enforcement (241 | 1.6%).
Services Occupations by Sex
Within the Services occupations in Campbell County, the most male-oriented occupations are Law Enforcement (86.3%), Security & Protection (85.8%), and Firefighting & Prevention (85.1%), while the most female-oriented occupations are Personal Care & Service (100.0%), Healthcare Support (96.6%), and Food Preparation & Serving (81.4%).
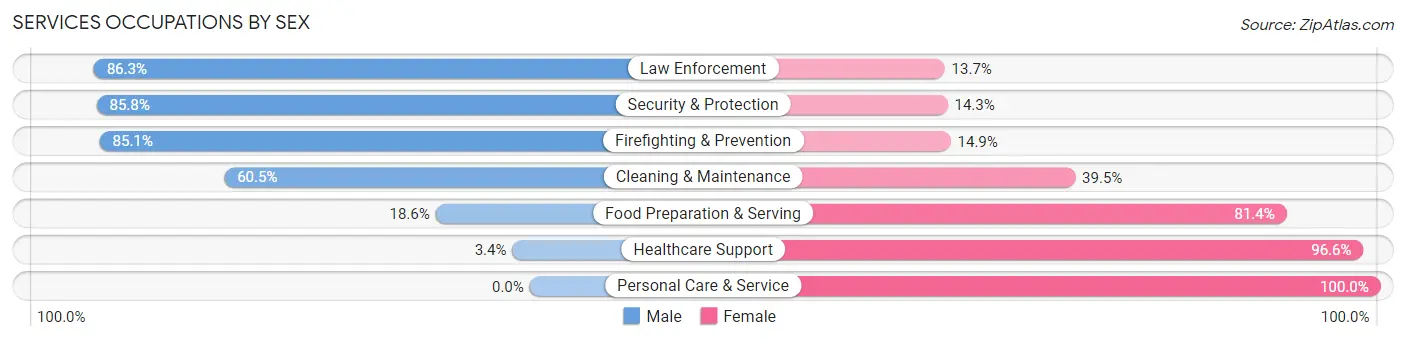
| Occupation | Male | Female |
| Healthcare Support | 25 (3.4%) | 705 (96.6%) |
| Security & Protection | 397 (85.8%) | 66 (14.2%) |
| Firefighting & Prevention | 189 (85.1%) | 33 (14.9%) |
| Law Enforcement | 208 (86.3%) | 33 (13.7%) |
| Food Preparation & Serving | 152 (18.6%) | 664 (81.4%) |
| Cleaning & Maintenance | 260 (60.5%) | 170 (39.5%) |
| Personal Care & Service | 0 (0.0%) | 143 (100.0%) |
| Total (Category) | 834 (32.3%) | 1,748 (67.7%) |
| Total (Overall) | 8,116 (53.1%) | 7,156 (46.9%) |
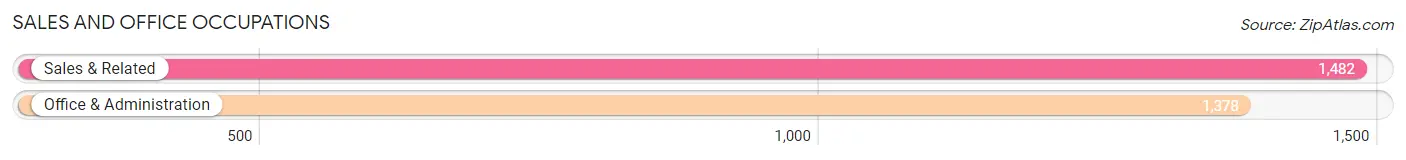
Sales and Office Occupations
The most common Sales and Office occupations in Campbell County are Sales & Related (1,482 | 9.7%), and Office & Administration (1,378 | 9.0%).
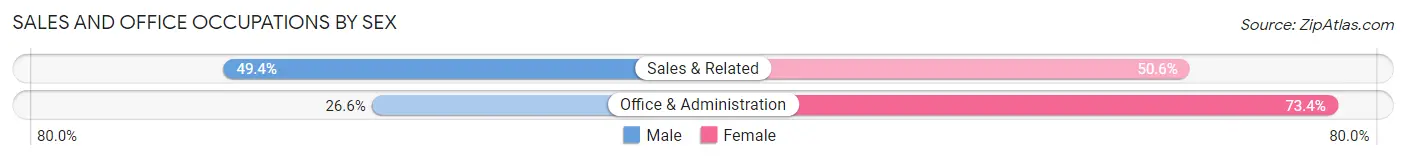
Sales and Office Occupations by Sex
| Occupation | Male | Female |
| Sales & Related | 732 (49.4%) | 750 (50.6%) |
| Office & Administration | 367 (26.6%) | 1,011 (73.4%) |
| Total (Category) | 1,099 (38.4%) | 1,761 (61.6%) |
| Total (Overall) | 8,116 (53.1%) | 7,156 (46.9%) |
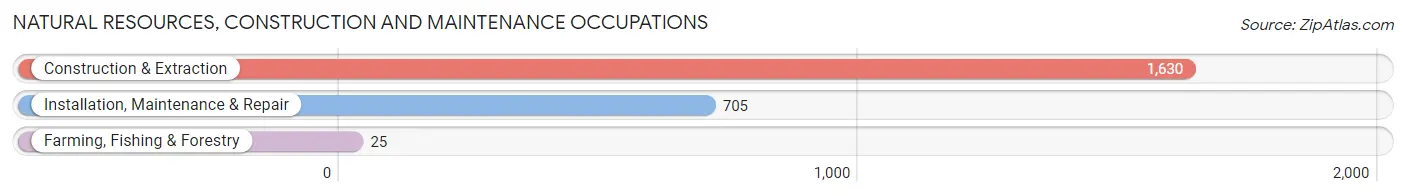
Natural Resources, Construction and Maintenance Occupations
The most common Natural Resources, Construction and Maintenance occupations in Campbell County are Construction & Extraction (1,630 | 10.7%), Installation, Maintenance & Repair (705 | 4.6%), and Farming, Fishing & Forestry (25 | 0.2%).
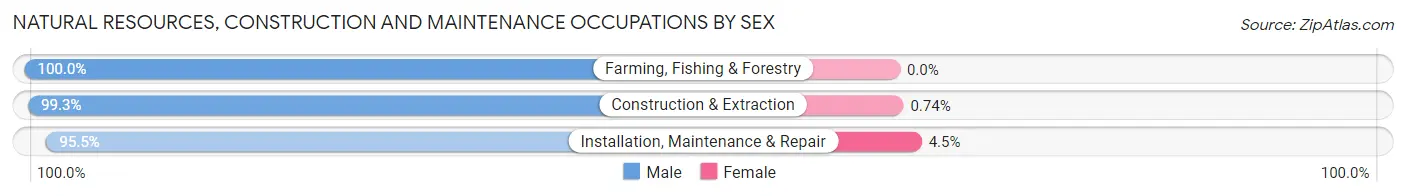
Natural Resources, Construction and Maintenance Occupations by Sex
| Occupation | Male | Female |
| Farming, Fishing & Forestry | 25 (100.0%) | 0 (0.0%) |
| Construction & Extraction | 1,618 (99.3%) | 12 (0.7%) |
| Installation, Maintenance & Repair | 673 (95.5%) | 32 (4.5%) |
| Total (Category) | 2,316 (98.1%) | 44 (1.9%) |
| Total (Overall) | 8,116 (53.1%) | 7,156 (46.9%) |
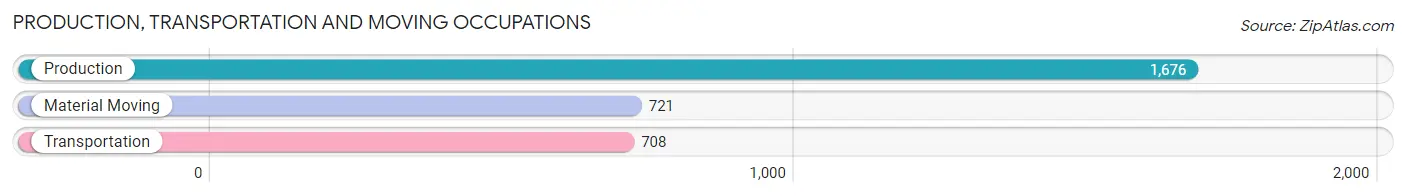
Production, Transportation and Moving Occupations
The most common Production, Transportation and Moving occupations in Campbell County are Production (1,676 | 11.0%), Material Moving (721 | 4.7%), and Transportation (708 | 4.6%).
Production, Transportation and Moving Occupations by Sex
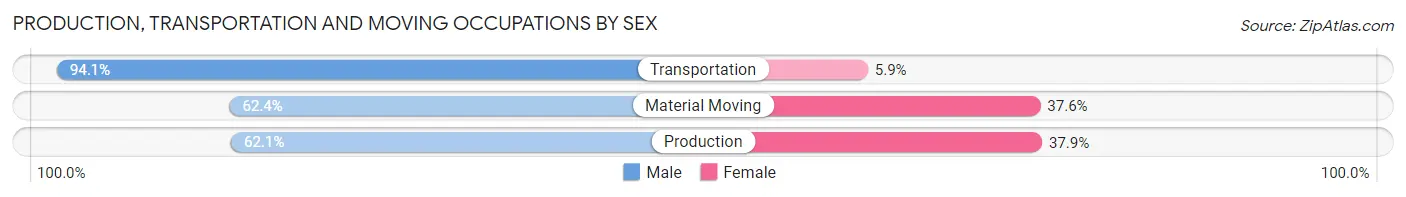
| Occupation | Male | Female |
| Production | 1,041 (62.1%) | 635 (37.9%) |
| Transportation | 666 (94.1%) | 42 (5.9%) |
| Material Moving | 450 (62.4%) | 271 (37.6%) |
| Total (Category) | 2,157 (69.5%) | 948 (30.5%) |
| Total (Overall) | 8,116 (53.1%) | 7,156 (46.9%) |
Employment Industries by Sex in Campbell County
Employment Industries in Campbell County
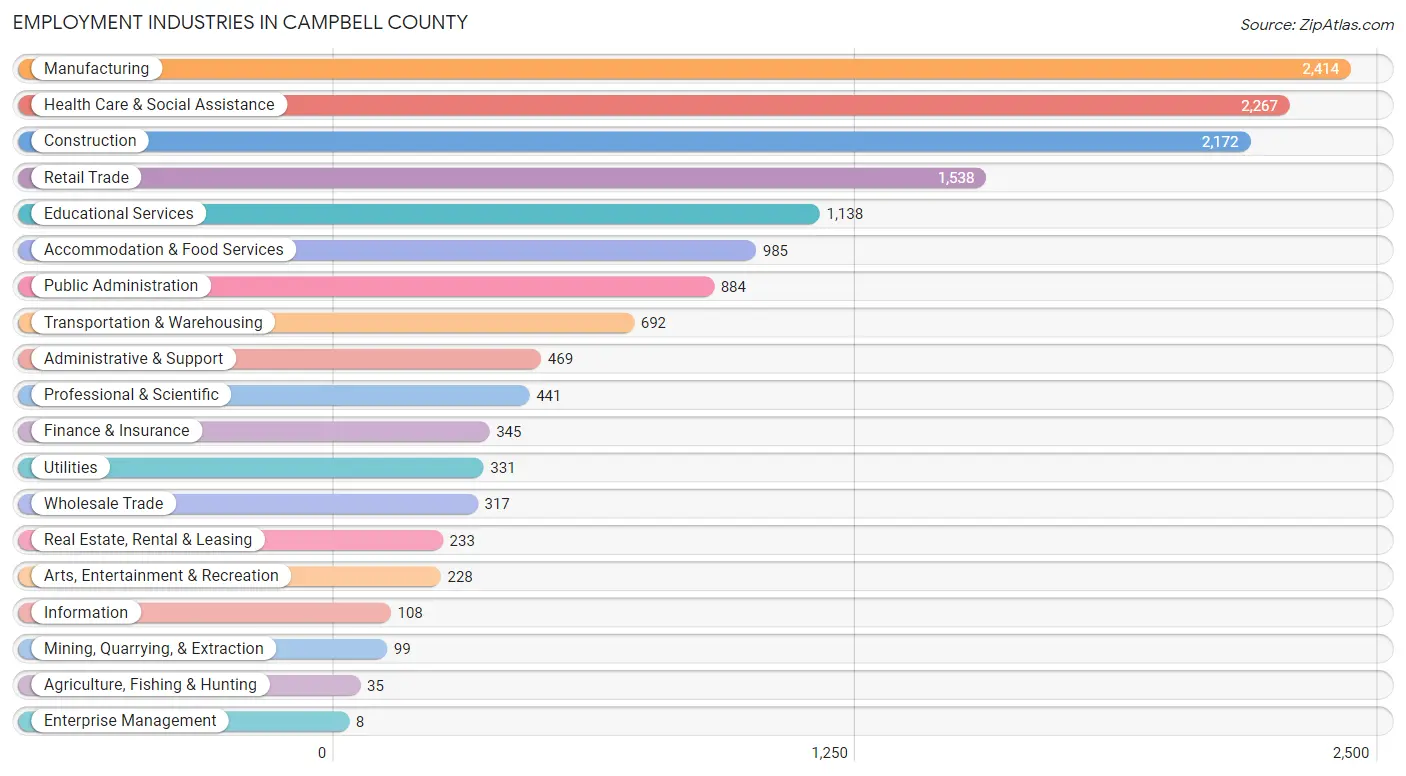
The major employment industries in Campbell County include Manufacturing (2,414 | 15.8%), Health Care & Social Assistance (2,267 | 14.8%), Construction (2,172 | 14.2%), Retail Trade (1,538 | 10.1%), and Educational Services (1,138 | 7.4%).
Employment Industries by Sex in Campbell County
The Campbell County industries that see more men than women are Agriculture, Fishing & Hunting (100.0%), Mining, Quarrying, & Extraction (100.0%), and Enterprise Management (100.0%), whereas the industries that tend to have a higher number of women are Educational Services (87.0%), Health Care & Social Assistance (84.0%), and Finance & Insurance (79.7%).
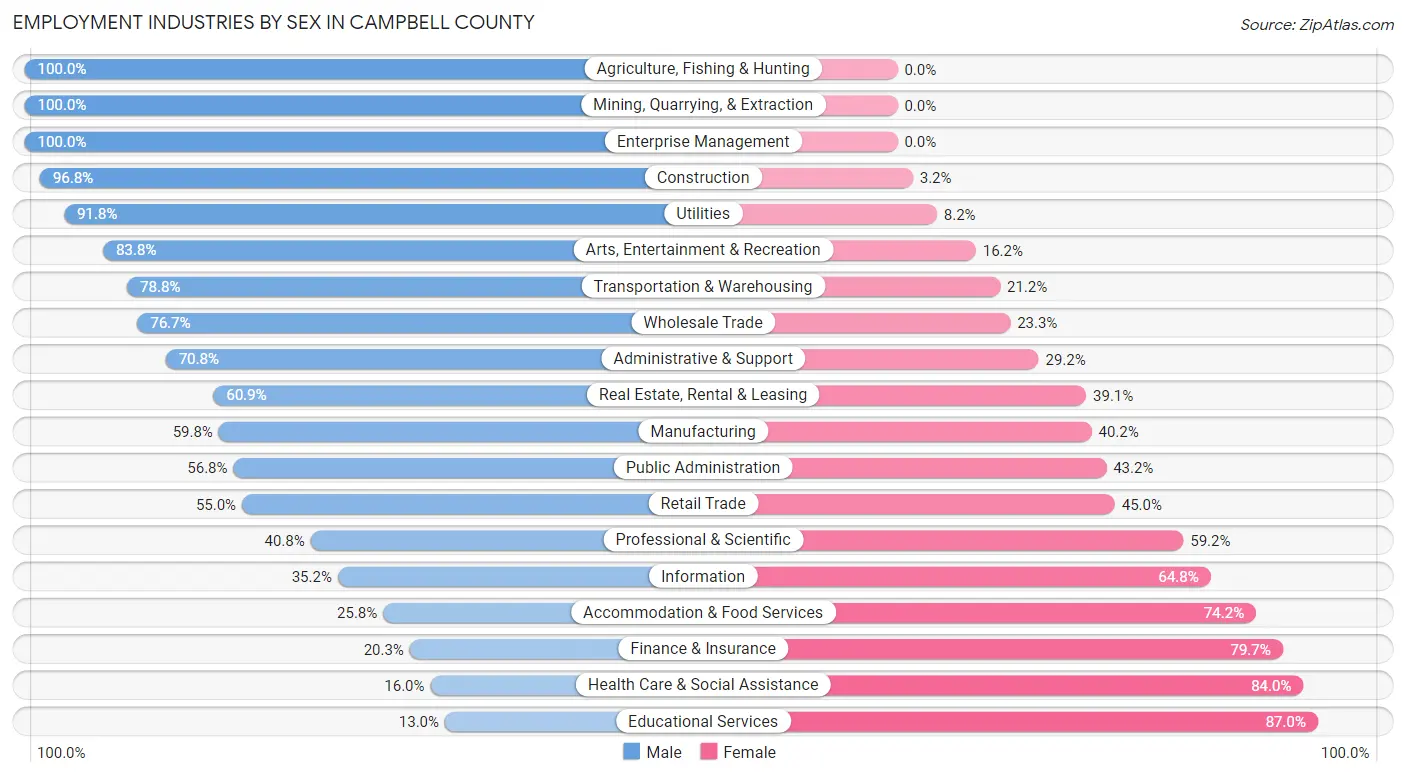
| Industry | Male | Female |
| Agriculture, Fishing & Hunting | 35 (100.0%) | 0 (0.0%) |
| Mining, Quarrying, & Extraction | 99 (100.0%) | 0 (0.0%) |
| Construction | 2,103 (96.8%) | 69 (3.2%) |
| Manufacturing | 1,444 (59.8%) | 970 (40.2%) |
| Wholesale Trade | 243 (76.7%) | 74 (23.3%) |
| Retail Trade | 846 (55.0%) | 692 (45.0%) |
| Transportation & Warehousing | 545 (78.8%) | 147 (21.2%) |
| Utilities | 304 (91.8%) | 27 (8.2%) |
| Information | 38 (35.2%) | 70 (64.8%) |
| Finance & Insurance | 70 (20.3%) | 275 (79.7%) |
| Real Estate, Rental & Leasing | 142 (60.9%) | 91 (39.1%) |
| Professional & Scientific | 180 (40.8%) | 261 (59.2%) |
| Enterprise Management | 8 (100.0%) | 0 (0.0%) |
| Administrative & Support | 332 (70.8%) | 137 (29.2%) |
| Educational Services | 148 (13.0%) | 990 (87.0%) |
| Health Care & Social Assistance | 363 (16.0%) | 1,904 (84.0%) |
| Arts, Entertainment & Recreation | 191 (83.8%) | 37 (16.2%) |
| Accommodation & Food Services | 254 (25.8%) | 731 (74.2%) |
| Public Administration | 502 (56.8%) | 382 (43.2%) |
| Total | 8,116 (53.1%) | 7,156 (46.9%) |
Education in Campbell County
School Enrollment in Campbell County
The most common levels of schooling among the 7,766 students in Campbell County are elementary school (1,997 | 25.7%), high school (1,938 | 24.9%), and middle school (1,643 | 21.2%).
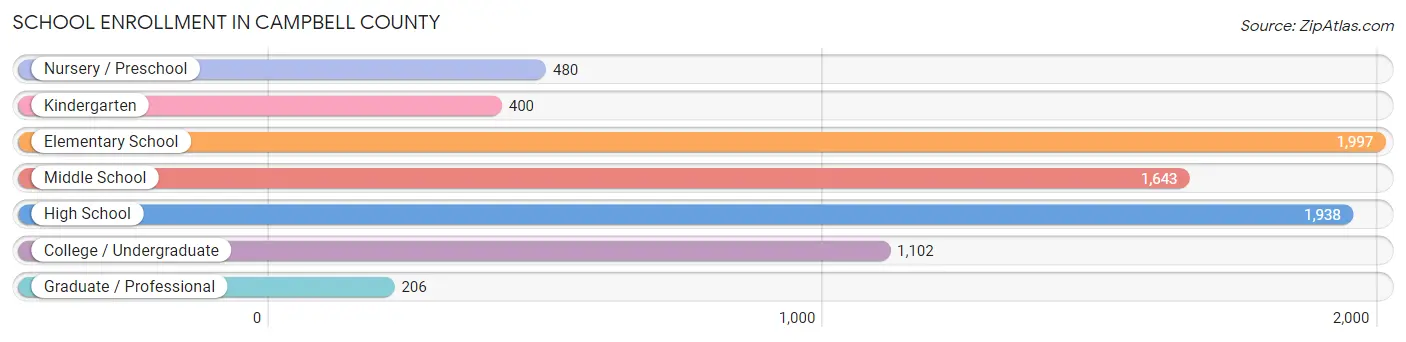
| School Level | # Students | % Students |
| Nursery / Preschool | 480 | 6.2% |
| Kindergarten | 400 | 5.1% |
| Elementary School | 1,997 | 25.7% |
| Middle School | 1,643 | 21.2% |
| High School | 1,938 | 24.9% |
| College / Undergraduate | 1,102 | 14.2% |
| Graduate / Professional | 206 | 2.6% |
| Total | 7,766 | 100.0% |
School Enrollment by Age by Funding Source in Campbell County
Out of a total of 7,766 students who are enrolled in schools in Campbell County, 1,180 (15.2%) attend a private institution, while the remaining 6,586 (84.8%) are enrolled in public schools. The age group of 20 to 24 year olds has the highest likelihood of being enrolled in private schools, with 145 (42.3% in the age bracket) enrolled. Conversely, the age group of 5 to 9 year old has the lowest likelihood of being enrolled in a private school, with 2,135 (91.7% in the age bracket) attending a public institution.
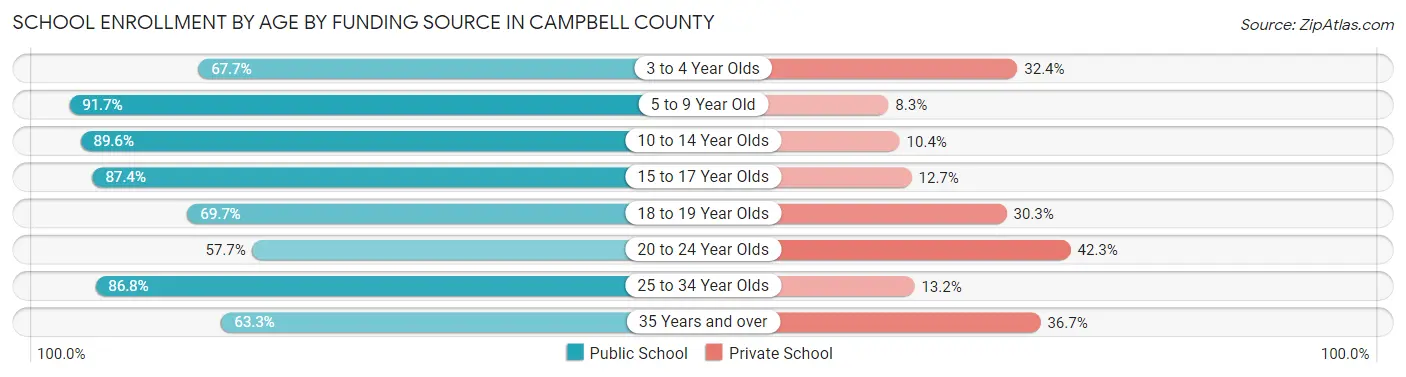
| Age Bracket | Public School | Private School |
| 3 to 4 Year Olds | 253 (67.6%) | 121 (32.4%) |
| 5 to 9 Year Old | 2,135 (91.7%) | 194 (8.3%) |
| 10 to 14 Year Olds | 1,803 (89.6%) | 210 (10.4%) |
| 15 to 17 Year Olds | 1,243 (87.4%) | 180 (12.7%) |
| 18 to 19 Year Olds | 340 (69.7%) | 148 (30.3%) |
| 20 to 24 Year Olds | 198 (57.7%) | 145 (42.3%) |
| 25 to 34 Year Olds | 395 (86.8%) | 60 (13.2%) |
| 35 Years and over | 216 (63.3%) | 125 (36.7%) |
| Total | 6,586 (84.8%) | 1,180 (15.2%) |
Educational Attainment by Field of Study in Campbell County
Business (815 | 20.0%), education (772 | 18.9%), science & technology (527 | 12.9%), social sciences (417 | 10.2%), and psychology (387 | 9.5%) are the most common fields of study among 4,080 individuals in Campbell County who have obtained a bachelor's degree or higher.
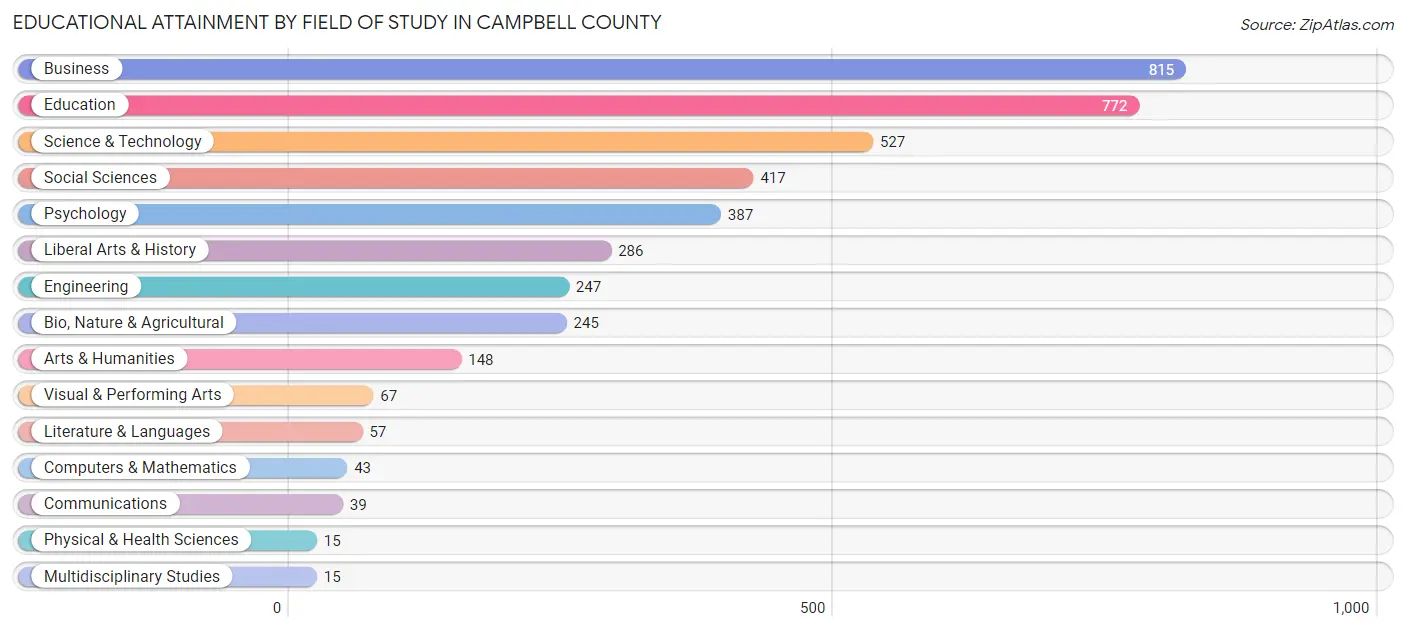
| Field of Study | # Graduates | % Graduates |
| Computers & Mathematics | 43 | 1.1% |
| Bio, Nature & Agricultural | 245 | 6.0% |
| Physical & Health Sciences | 15 | 0.4% |
| Psychology | 387 | 9.5% |
| Social Sciences | 417 | 10.2% |
| Engineering | 247 | 6.0% |
| Multidisciplinary Studies | 15 | 0.4% |
| Science & Technology | 527 | 12.9% |
| Business | 815 | 20.0% |
| Education | 772 | 18.9% |
| Literature & Languages | 57 | 1.4% |
| Liberal Arts & History | 286 | 7.0% |
| Visual & Performing Arts | 67 | 1.6% |
| Communications | 39 | 1.0% |
| Arts & Humanities | 148 | 3.6% |
| Total | 4,080 | 100.0% |
Transportation & Commute in Campbell County
Vehicle Availability by Sex in Campbell County
The most prevalent vehicle ownership categories in Campbell County are males with 2 vehicles (2,529, accounting for 31.6%) and females with 2 vehicles (2,090, making up 36.5%).
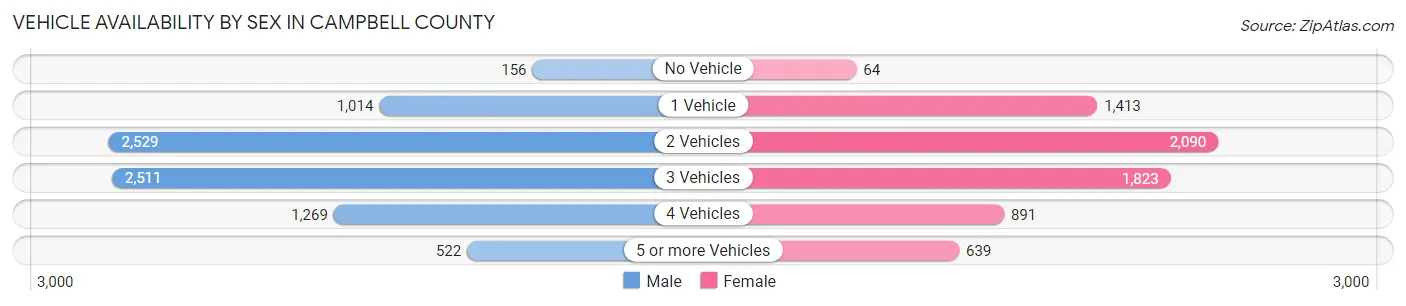
| Vehicles Available | Male | Female |
| No Vehicle | 156 (1.9%) | 64 (0.9%) |
| 1 Vehicle | 1,014 (12.7%) | 1,413 (20.4%) |
| 2 Vehicles | 2,529 (31.6%) | 2,090 (30.2%) |
| 3 Vehicles | 2,511 (31.4%) | 1,823 (26.3%) |
| 4 Vehicles | 1,269 (15.9%) | 891 (12.9%) |
| 5 or more Vehicles | 522 (6.5%) | 639 (9.2%) |
| Total | 8,001 (100.0%) | 6,920 (100.0%) |
Commute Time in Campbell County
The most frequently occuring commute durations in Campbell County are 15 to 19 minutes (2,087 commuters, 15.0%), 60 to 89 minutes (1,827 commuters, 13.1%), and 30 to 34 minutes (1,750 commuters, 12.5%).
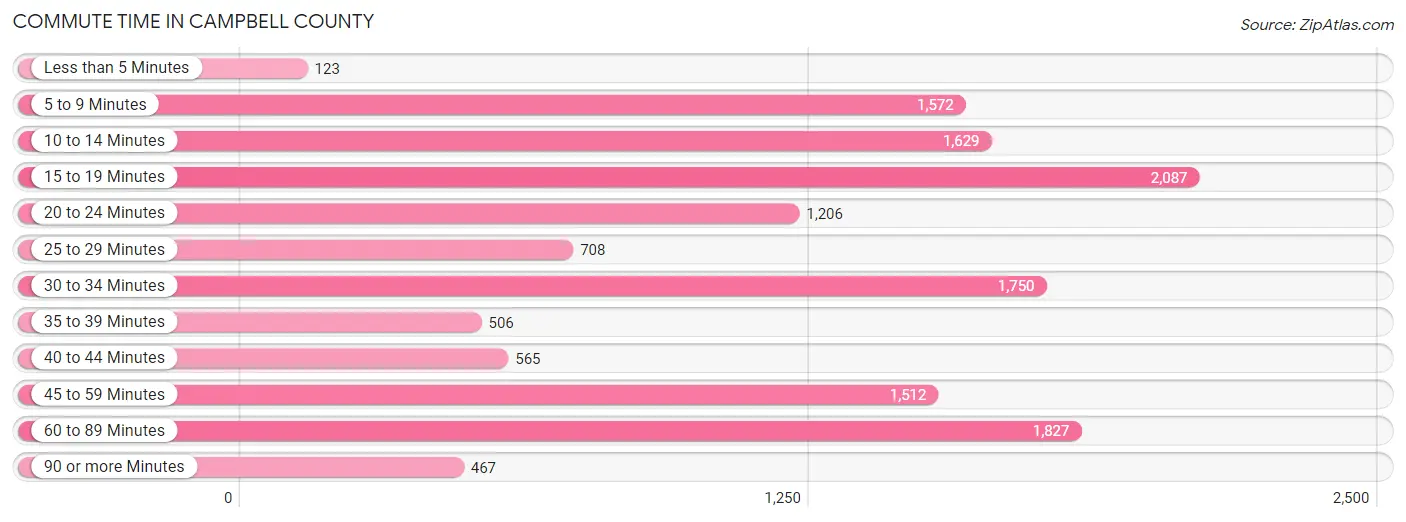
| Commute Time | # Commuters | % Commuters |
| Less than 5 Minutes | 123 | 0.9% |
| 5 to 9 Minutes | 1,572 | 11.3% |
| 10 to 14 Minutes | 1,629 | 11.7% |
| 15 to 19 Minutes | 2,087 | 15.0% |
| 20 to 24 Minutes | 1,206 | 8.6% |
| 25 to 29 Minutes | 708 | 5.1% |
| 30 to 34 Minutes | 1,750 | 12.5% |
| 35 to 39 Minutes | 506 | 3.6% |
| 40 to 44 Minutes | 565 | 4.1% |
| 45 to 59 Minutes | 1,512 | 10.8% |
| 60 to 89 Minutes | 1,827 | 13.1% |
| 90 or more Minutes | 467 | 3.4% |
Commute Time by Sex in Campbell County
The most common commute times in Campbell County are 60 to 89 minutes (1,366 commuters, 18.4%) for males and 15 to 19 minutes (1,320 commuters, 20.2%) for females.
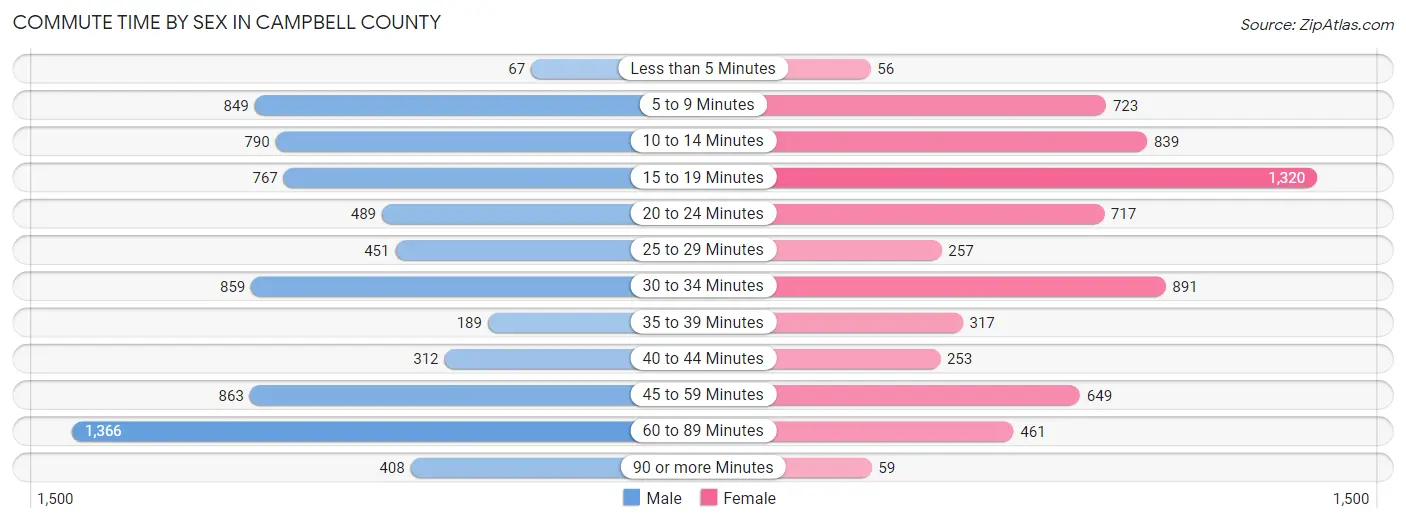
| Commute Time | Male | Female |
| Less than 5 Minutes | 67 (0.9%) | 56 (0.9%) |
| 5 to 9 Minutes | 849 (11.5%) | 723 (11.1%) |
| 10 to 14 Minutes | 790 (10.7%) | 839 (12.8%) |
| 15 to 19 Minutes | 767 (10.3%) | 1,320 (20.2%) |
| 20 to 24 Minutes | 489 (6.6%) | 717 (11.0%) |
| 25 to 29 Minutes | 451 (6.1%) | 257 (3.9%) |
| 30 to 34 Minutes | 859 (11.6%) | 891 (13.6%) |
| 35 to 39 Minutes | 189 (2.5%) | 317 (4.9%) |
| 40 to 44 Minutes | 312 (4.2%) | 253 (3.9%) |
| 45 to 59 Minutes | 863 (11.7%) | 649 (9.9%) |
| 60 to 89 Minutes | 1,366 (18.4%) | 461 (7.0%) |
| 90 or more Minutes | 408 (5.5%) | 59 (0.9%) |
Time of Departure to Work by Sex in Campbell County
The most frequent times of departure to work in Campbell County are 6:00 AM to 6:29 AM (873, 11.8%) for males and 7:00 AM to 7:29 AM (893, 13.7%) for females.
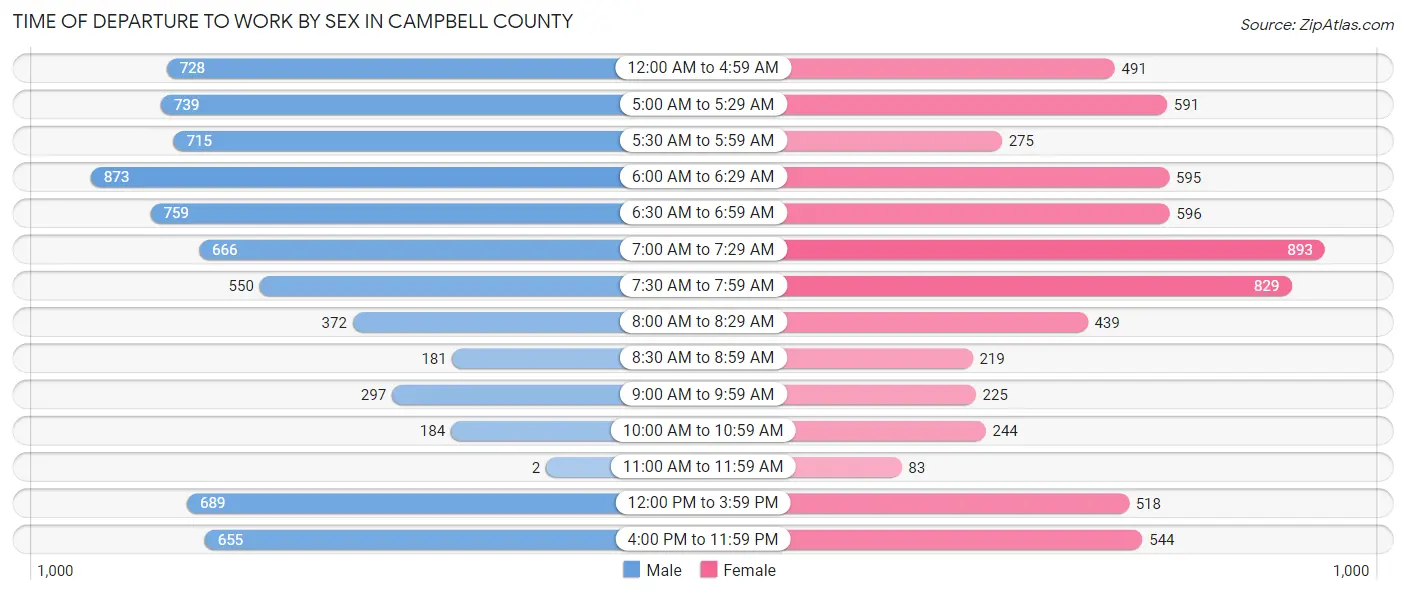
| Time of Departure | Male | Female |
| 12:00 AM to 4:59 AM | 728 (9.8%) | 491 (7.5%) |
| 5:00 AM to 5:29 AM | 739 (10.0%) | 591 (9.0%) |
| 5:30 AM to 5:59 AM | 715 (9.7%) | 275 (4.2%) |
| 6:00 AM to 6:29 AM | 873 (11.8%) | 595 (9.1%) |
| 6:30 AM to 6:59 AM | 759 (10.2%) | 596 (9.1%) |
| 7:00 AM to 7:29 AM | 666 (9.0%) | 893 (13.7%) |
| 7:30 AM to 7:59 AM | 550 (7.4%) | 829 (12.7%) |
| 8:00 AM to 8:29 AM | 372 (5.0%) | 439 (6.7%) |
| 8:30 AM to 8:59 AM | 181 (2.4%) | 219 (3.4%) |
| 9:00 AM to 9:59 AM | 297 (4.0%) | 225 (3.4%) |
| 10:00 AM to 10:59 AM | 184 (2.5%) | 244 (3.7%) |
| 11:00 AM to 11:59 AM | 2 (0.0%) | 83 (1.3%) |
| 12:00 PM to 3:59 PM | 689 (9.3%) | 518 (7.9%) |
| 4:00 PM to 11:59 PM | 655 (8.8%) | 544 (8.3%) |
| Total | 7,410 (100.0%) | 6,542 (100.0%) |
Housing Occupancy in Campbell County
Occupancy by Ownership in Campbell County
Of the total 16,255 dwellings in Campbell County, owner-occupied units account for 10,944 (67.3%), while renter-occupied units make up 5,311 (32.7%).
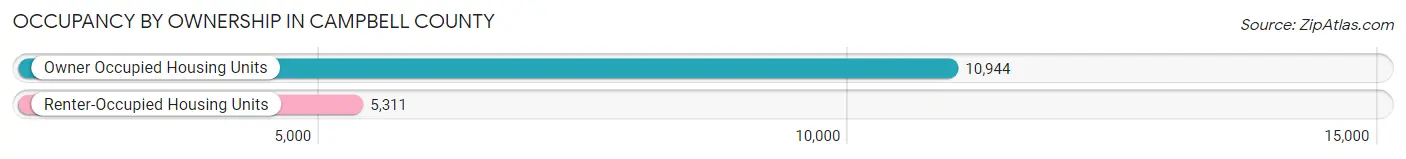
| Occupancy | # Housing Units | % Housing Units |
| Owner Occupied Housing Units | 10,944 | 67.3% |
| Renter-Occupied Housing Units | 5,311 | 32.7% |
| Total Occupied Housing Units | 16,255 | 100.0% |
Occupancy by Household Size in Campbell County
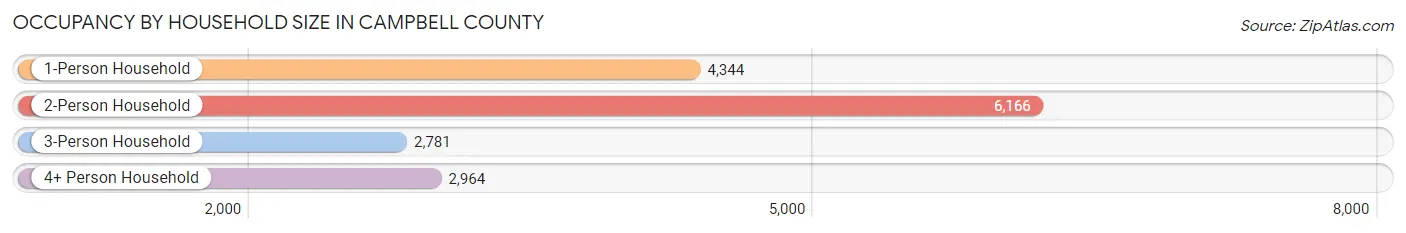
| Household Size | # Housing Units | % Housing Units |
| 1-Person Household | 4,344 | 26.7% |
| 2-Person Household | 6,166 | 37.9% |
| 3-Person Household | 2,781 | 17.1% |
| 4+ Person Household | 2,964 | 18.2% |
| Total Housing Units | 16,255 | 100.0% |
Occupancy by Ownership by Household Size in Campbell County
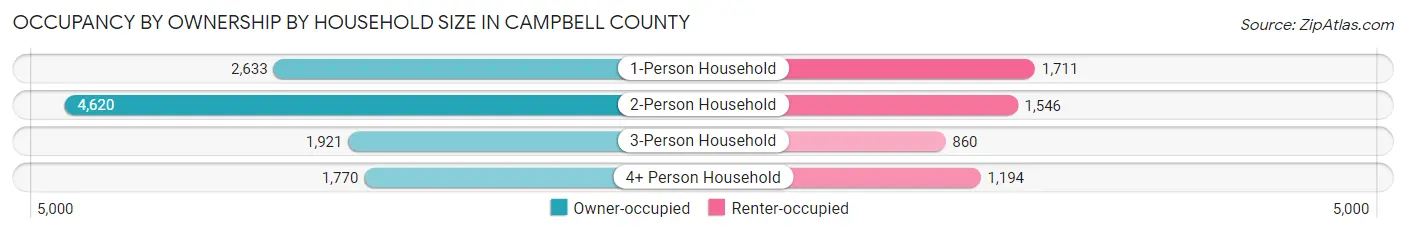
| Household Size | Owner-occupied | Renter-occupied |
| 1-Person Household | 2,633 (60.6%) | 1,711 (39.4%) |
| 2-Person Household | 4,620 (74.9%) | 1,546 (25.1%) |
| 3-Person Household | 1,921 (69.1%) | 860 (30.9%) |
| 4+ Person Household | 1,770 (59.7%) | 1,194 (40.3%) |
| Total Housing Units | 10,944 (67.3%) | 5,311 (32.7%) |
Occupancy by Educational Attainment in Campbell County
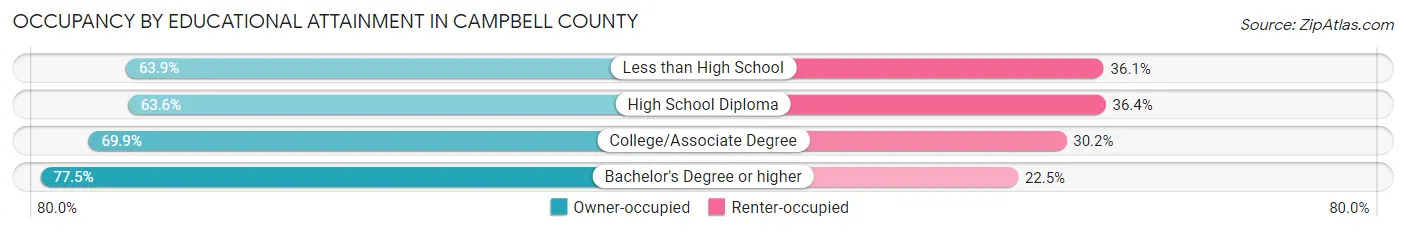
| Household Size | Owner-occupied | Renter-occupied |
| Less than High School | 1,717 (63.9%) | 969 (36.1%) |
| High School Diploma | 4,285 (63.6%) | 2,450 (36.4%) |
| College/Associate Degree | 3,236 (69.9%) | 1,397 (30.1%) |
| Bachelor's Degree or higher | 1,706 (77.5%) | 495 (22.5%) |
Occupancy by Age of Householder in Campbell County
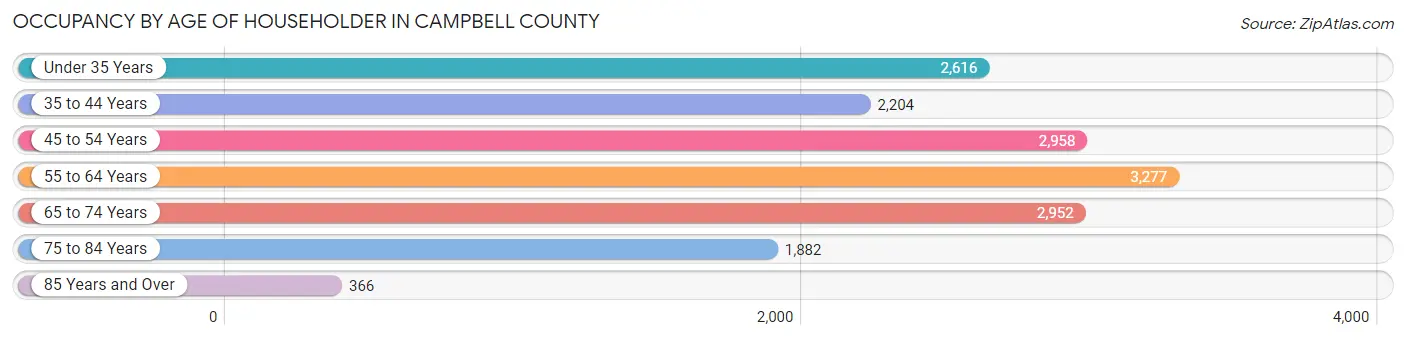
| Age Bracket | # Households | % Households |
| Under 35 Years | 2,616 | 16.1% |
| 35 to 44 Years | 2,204 | 13.6% |
| 45 to 54 Years | 2,958 | 18.2% |
| 55 to 64 Years | 3,277 | 20.2% |
| 65 to 74 Years | 2,952 | 18.2% |
| 75 to 84 Years | 1,882 | 11.6% |
| 85 Years and Over | 366 | 2.2% |
| Total | 16,255 | 100.0% |
Housing Finances in Campbell County
Median Income by Occupancy in Campbell County
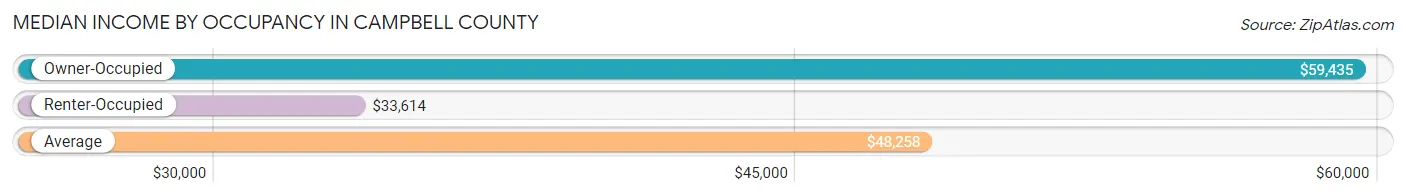
| Occupancy Type | # Households | Median Income |
| Owner-Occupied | 10,944 (67.3%) | $59,435 |
| Renter-Occupied | 5,311 (32.7%) | $33,614 |
| Average | 16,255 (100.0%) | $48,258 |
Occupancy by Householder Income Bracket in Campbell County
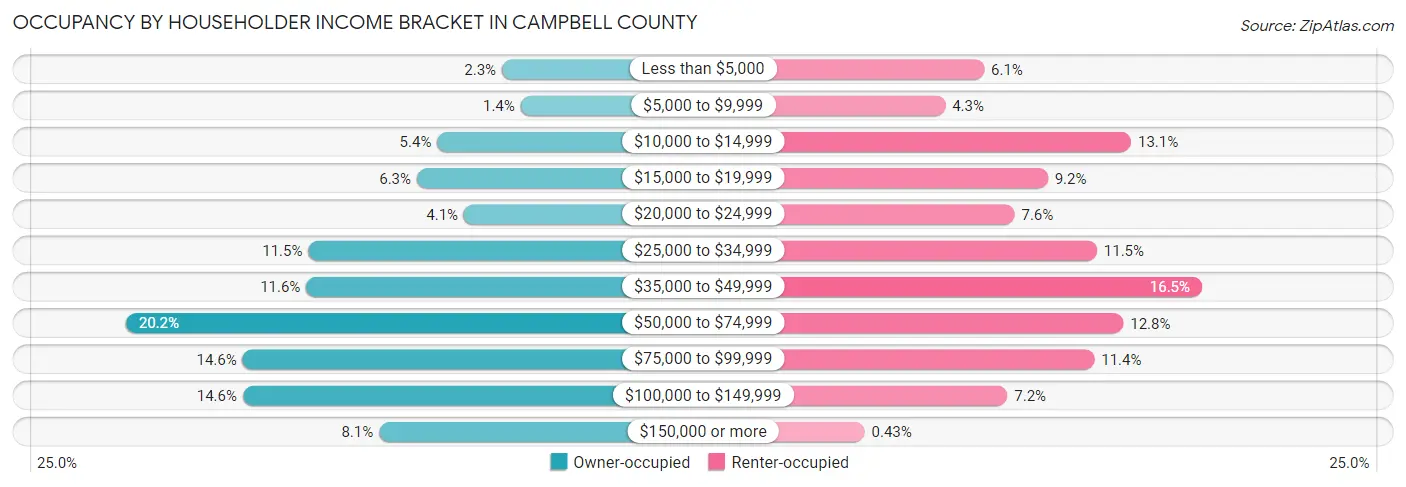
| Income Bracket | Owner-occupied | Renter-occupied |
| Less than $5,000 | 248 (2.3%) | 325 (6.1%) |
| $5,000 to $9,999 | 151 (1.4%) | 227 (4.3%) |
| $10,000 to $14,999 | 585 (5.3%) | 697 (13.1%) |
| $15,000 to $19,999 | 692 (6.3%) | 486 (9.1%) |
| $20,000 to $24,999 | 446 (4.1%) | 402 (7.6%) |
| $25,000 to $34,999 | 1,258 (11.5%) | 610 (11.5%) |
| $35,000 to $49,999 | 1,268 (11.6%) | 876 (16.5%) |
| $50,000 to $74,999 | 2,208 (20.2%) | 677 (12.8%) |
| $75,000 to $99,999 | 1,600 (14.6%) | 604 (11.4%) |
| $100,000 to $149,999 | 1,599 (14.6%) | 384 (7.2%) |
| $150,000 or more | 889 (8.1%) | 23 (0.4%) |
| Total | 10,944 (100.0%) | 5,311 (100.0%) |
Monthly Housing Cost Tiers in Campbell County
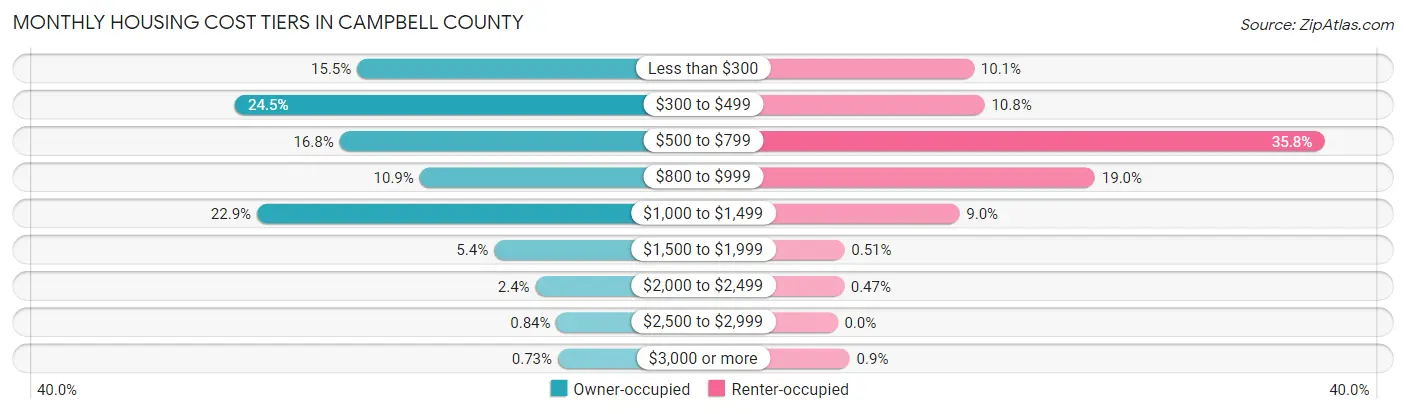
| Monthly Cost | Owner-occupied | Renter-occupied |
| Less than $300 | 1,697 (15.5%) | 534 (10.1%) |
| $300 to $499 | 2,681 (24.5%) | 575 (10.8%) |
| $500 to $799 | 1,840 (16.8%) | 1,903 (35.8%) |
| $800 to $999 | 1,194 (10.9%) | 1,007 (19.0%) |
| $1,000 to $1,499 | 2,505 (22.9%) | 477 (9.0%) |
| $1,500 to $1,999 | 594 (5.4%) | 27 (0.5%) |
| $2,000 to $2,499 | 261 (2.4%) | 25 (0.5%) |
| $2,500 to $2,999 | 92 (0.8%) | 0 (0.0%) |
| $3,000 or more | 80 (0.7%) | 48 (0.9%) |
| Total | 10,944 (100.0%) | 5,311 (100.0%) |
Physical Housing Characteristics in Campbell County
Housing Structures in Campbell County
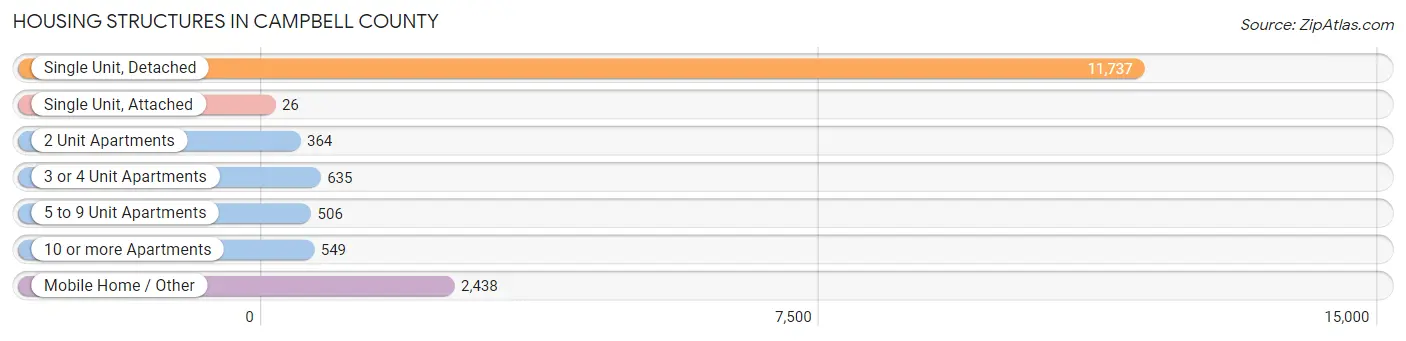
| Structure Type | # Housing Units | % Housing Units |
| Single Unit, Detached | 11,737 | 72.2% |
| Single Unit, Attached | 26 | 0.2% |
| 2 Unit Apartments | 364 | 2.2% |
| 3 or 4 Unit Apartments | 635 | 3.9% |
| 5 to 9 Unit Apartments | 506 | 3.1% |
| 10 or more Apartments | 549 | 3.4% |
| Mobile Home / Other | 2,438 | 15.0% |
| Total | 16,255 | 100.0% |
Housing Structures by Occupancy in Campbell County
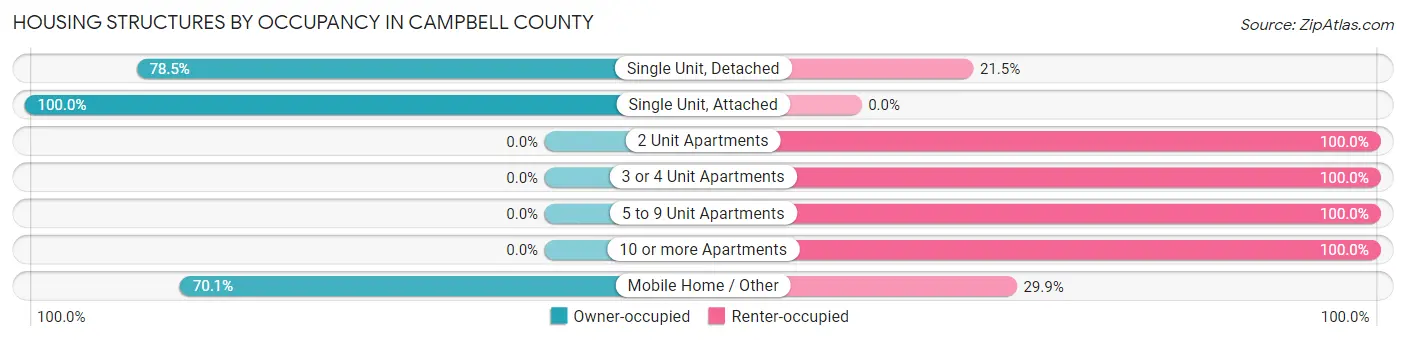
| Structure Type | Owner-occupied | Renter-occupied |
| Single Unit, Detached | 9,209 (78.5%) | 2,528 (21.5%) |
| Single Unit, Attached | 26 (100.0%) | 0 (0.0%) |
| 2 Unit Apartments | 0 (0.0%) | 364 (100.0%) |
| 3 or 4 Unit Apartments | 0 (0.0%) | 635 (100.0%) |
| 5 to 9 Unit Apartments | 0 (0.0%) | 506 (100.0%) |
| 10 or more Apartments | 0 (0.0%) | 549 (100.0%) |
| Mobile Home / Other | 1,709 (70.1%) | 729 (29.9%) |
| Total | 10,944 (67.3%) | 5,311 (32.7%) |
Housing Structures by Number of Rooms in Campbell County
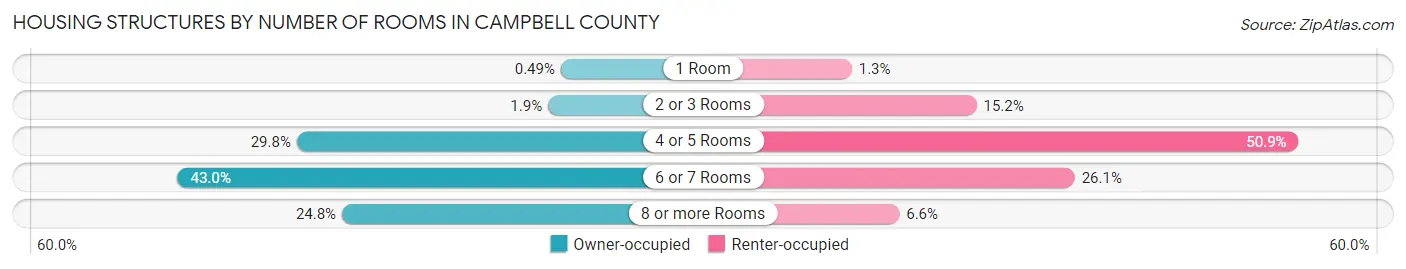
| Number of Rooms | Owner-occupied | Renter-occupied |
| 1 Room | 54 (0.5%) | 70 (1.3%) |
| 2 or 3 Rooms | 209 (1.9%) | 805 (15.2%) |
| 4 or 5 Rooms | 3,261 (29.8%) | 2,702 (50.9%) |
| 6 or 7 Rooms | 4,708 (43.0%) | 1,384 (26.1%) |
| 8 or more Rooms | 2,712 (24.8%) | 350 (6.6%) |
| Total | 10,944 (100.0%) | 5,311 (100.0%) |
Housing Structure by Heating Type in Campbell County
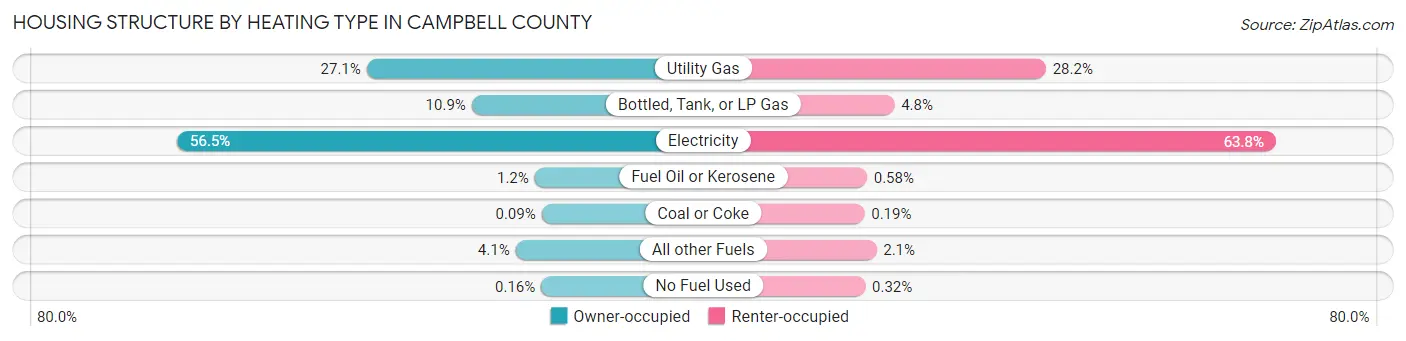
| Heating Type | Owner-occupied | Renter-occupied |
| Utility Gas | 2,969 (27.1%) | 1,500 (28.2%) |
| Bottled, Tank, or LP Gas | 1,192 (10.9%) | 256 (4.8%) |
| Electricity | 6,178 (56.5%) | 3,388 (63.8%) |
| Fuel Oil or Kerosene | 127 (1.2%) | 31 (0.6%) |
| Coal or Coke | 10 (0.1%) | 10 (0.2%) |
| All other Fuels | 450 (4.1%) | 109 (2.1%) |
| No Fuel Used | 18 (0.2%) | 17 (0.3%) |
| Total | 10,944 (100.0%) | 5,311 (100.0%) |
Household Vehicle Usage in Campbell County
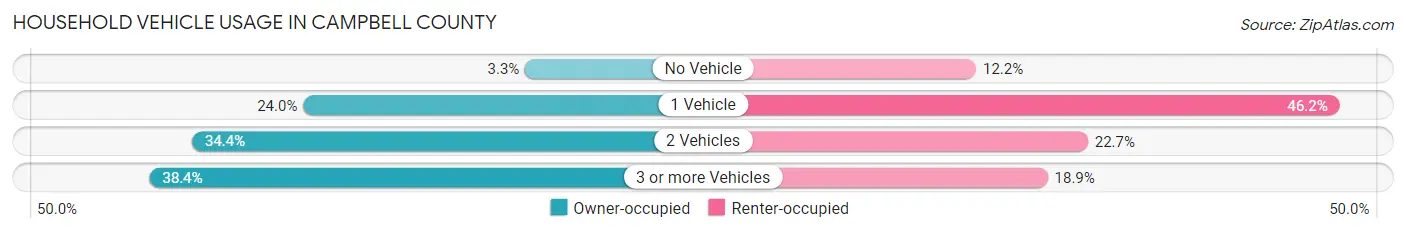
| Vehicles per Household | Owner-occupied | Renter-occupied |
| No Vehicle | 358 (3.3%) | 650 (12.2%) |
| 1 Vehicle | 2,625 (24.0%) | 2,452 (46.2%) |
| 2 Vehicles | 3,764 (34.4%) | 1,204 (22.7%) |
| 3 or more Vehicles | 4,197 (38.4%) | 1,005 (18.9%) |
| Total | 10,944 (100.0%) | 5,311 (100.0%) |
Real Estate & Mortgages in Campbell County
Real Estate and Mortgage Overview in Campbell County
| Characteristic | Without Mortgage | With Mortgage |
| Housing Units | 5,590 | 5,354 |
| Median Property Value | $113,500 | $164,100 |
| Median Household Income | $43,769 | $644 |
| Monthly Housing Costs | $379 | $80 |
| Real Estate Taxes | $518 | $124 |
Property Value by Mortgage Status in Campbell County
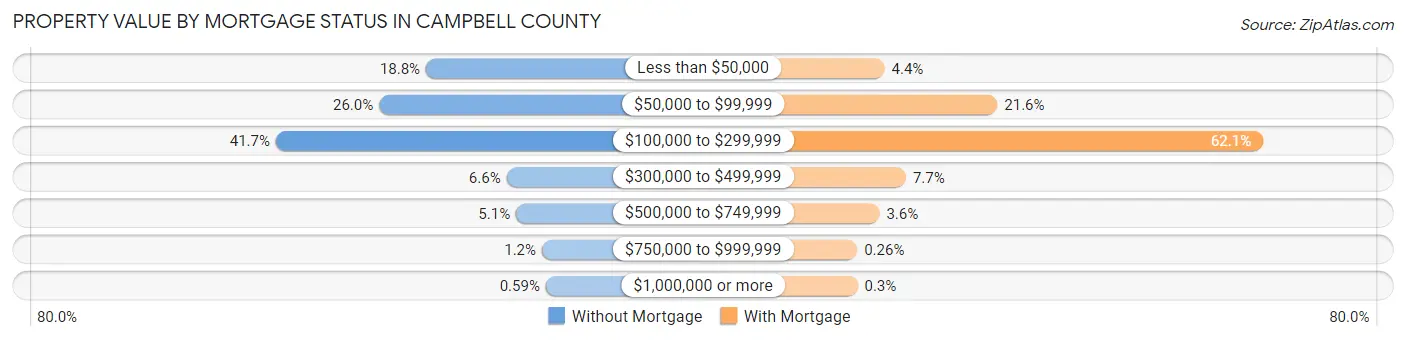
| Property Value | Without Mortgage | With Mortgage |
| Less than $50,000 | 1,053 (18.8%) | 237 (4.4%) |
| $50,000 to $99,999 | 1,453 (26.0%) | 1,157 (21.6%) |
| $100,000 to $299,999 | 2,332 (41.7%) | 3,324 (62.1%) |
| $300,000 to $499,999 | 367 (6.6%) | 411 (7.7%) |
| $500,000 to $749,999 | 286 (5.1%) | 195 (3.6%) |
| $750,000 to $999,999 | 66 (1.2%) | 14 (0.3%) |
| $1,000,000 or more | 33 (0.6%) | 16 (0.3%) |
| Total | 5,590 (100.0%) | 5,354 (100.0%) |
Household Income by Mortgage Status in Campbell County
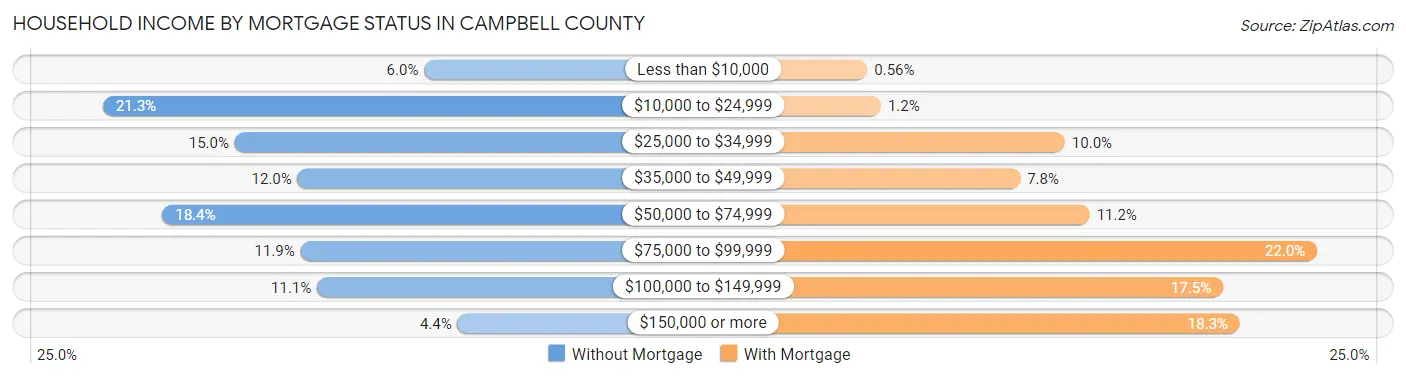
| Household Income | Without Mortgage | With Mortgage |
| Less than $10,000 | 334 (6.0%) | 30 (0.6%) |
| $10,000 to $24,999 | 1,189 (21.3%) | 65 (1.2%) |
| $25,000 to $34,999 | 838 (15.0%) | 534 (10.0%) |
| $35,000 to $49,999 | 671 (12.0%) | 420 (7.8%) |
| $50,000 to $74,999 | 1,031 (18.4%) | 597 (11.2%) |
| $75,000 to $99,999 | 663 (11.9%) | 1,177 (22.0%) |
| $100,000 to $149,999 | 619 (11.1%) | 937 (17.5%) |
| $150,000 or more | 245 (4.4%) | 980 (18.3%) |
| Total | 5,590 (100.0%) | 5,354 (100.0%) |
Property Value to Household Income Ratio in Campbell County
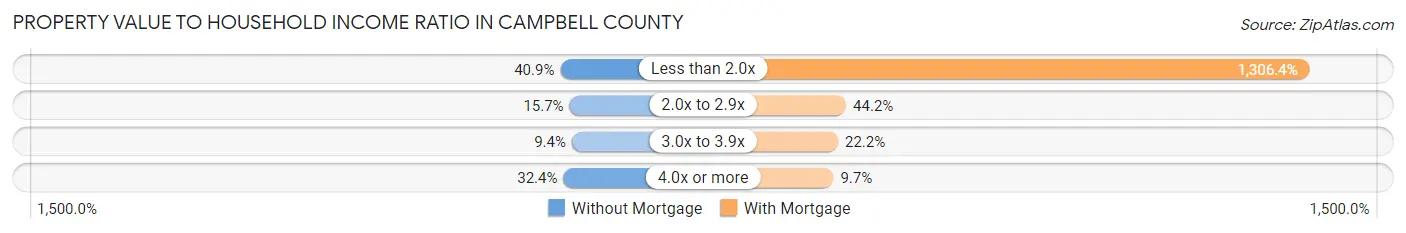
| Value-to-Income Ratio | Without Mortgage | With Mortgage |
| Less than 2.0x | 2,286 (40.9%) | 69,946 (1,306.4%) |
| 2.0x to 2.9x | 879 (15.7%) | 2,366 (44.2%) |
| 3.0x to 3.9x | 526 (9.4%) | 1,187 (22.2%) |
| 4.0x or more | 1,812 (32.4%) | 517 (9.7%) |
| Total | 5,590 (100.0%) | 5,354 (100.0%) |
Real Estate Taxes by Mortgage Status in Campbell County
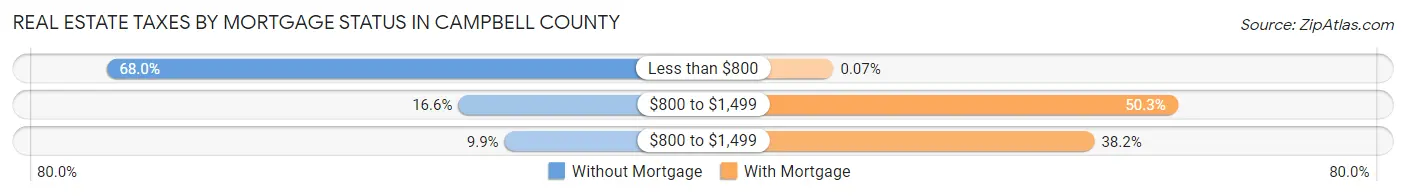
| Property Taxes | Without Mortgage | With Mortgage |
| Less than $800 | 3,803 (68.0%) | 4 (0.1%) |
| $800 to $1,499 | 930 (16.6%) | 2,694 (50.3%) |
| $800 to $1,499 | 553 (9.9%) | 2,045 (38.2%) |
| Total | 5,590 (100.0%) | 5,354 (100.0%) |
Health & Disability in Campbell County
Health Insurance Coverage by Age in Campbell County
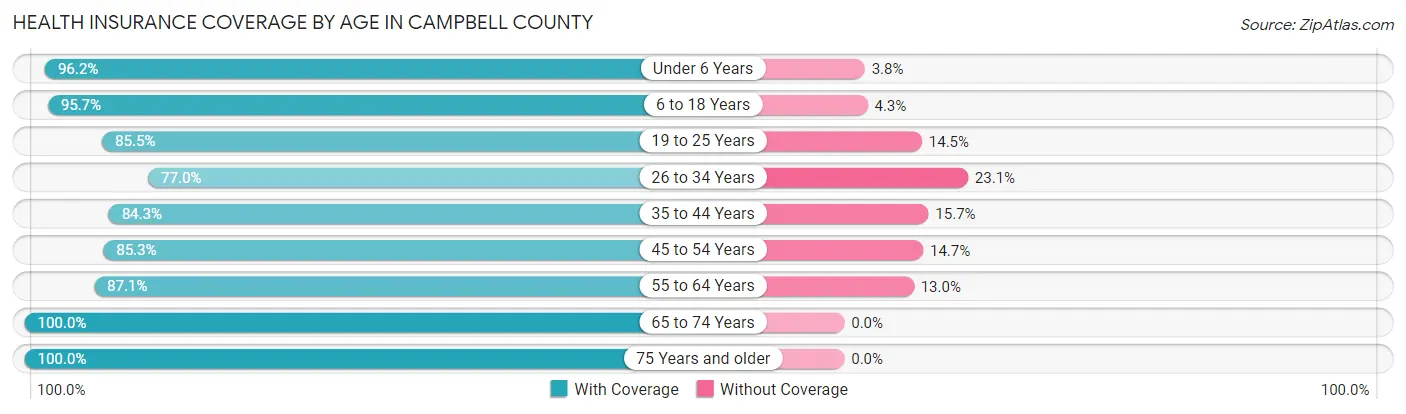
| Age Bracket | With Coverage | Without Coverage |
| Under 6 Years | 2,400 (96.2%) | 95 (3.8%) |
| 6 to 18 Years | 5,745 (95.7%) | 260 (4.3%) |
| 19 to 25 Years | 2,523 (85.5%) | 427 (14.5%) |
| 26 to 34 Years | 3,194 (76.9%) | 957 (23.1%) |
| 35 to 44 Years | 3,670 (84.3%) | 683 (15.7%) |
| 45 to 54 Years | 4,703 (85.3%) | 809 (14.7%) |
| 55 to 64 Years | 4,792 (87.1%) | 713 (13.0%) |
| 65 to 74 Years | 4,561 (100.0%) | 0 (0.0%) |
| 75 Years and older | 3,218 (100.0%) | 0 (0.0%) |
| Total | 34,806 (89.8%) | 3,944 (10.2%) |
Health Insurance Coverage by Citizenship Status in Campbell County
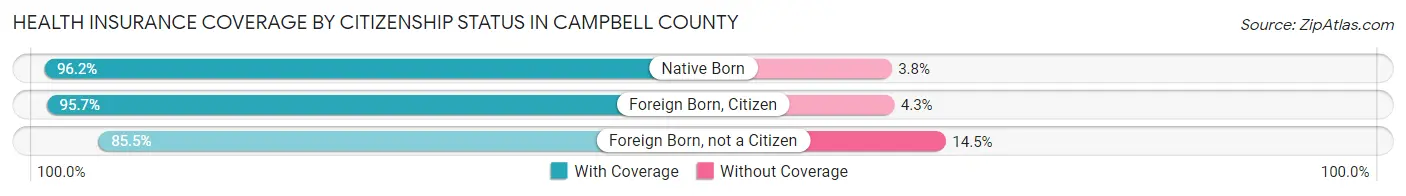
| Citizenship Status | With Coverage | Without Coverage |
| Native Born | 2,400 (96.2%) | 95 (3.8%) |
| Foreign Born, Citizen | 5,745 (95.7%) | 260 (4.3%) |
| Foreign Born, not a Citizen | 2,523 (85.5%) | 427 (14.5%) |
Health Insurance Coverage by Household Income in Campbell County
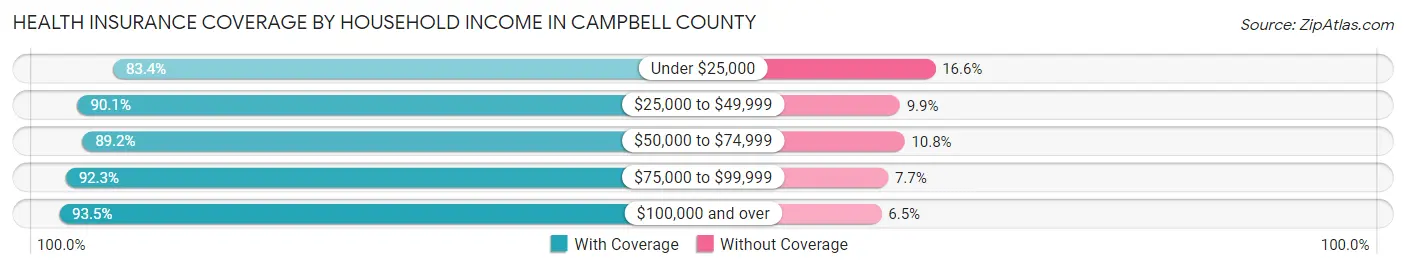
| Household Income | With Coverage | Without Coverage |
| Under $25,000 | 5,790 (83.4%) | 1,149 (16.6%) |
| $25,000 to $49,999 | 8,096 (90.1%) | 891 (9.9%) |
| $50,000 to $74,999 | 6,940 (89.2%) | 840 (10.8%) |
| $75,000 to $99,999 | 6,192 (92.3%) | 517 (7.7%) |
| $100,000 and over | 7,761 (93.5%) | 537 (6.5%) |
Public vs Private Health Insurance Coverage by Age in Campbell County
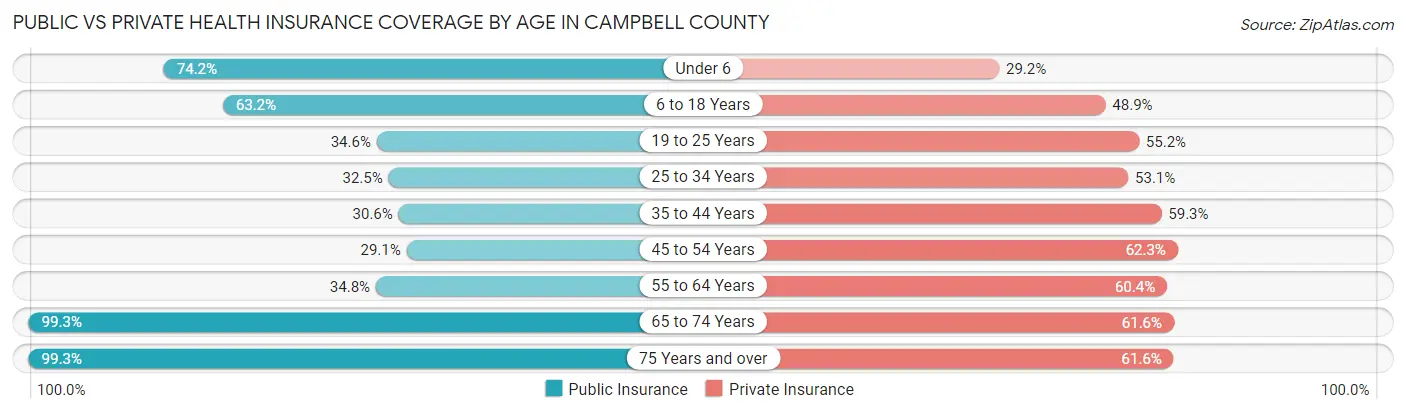
| Age Bracket | Public Insurance | Private Insurance |
| Under 6 | 1,850 (74.2%) | 728 (29.2%) |
| 6 to 18 Years | 3,796 (63.2%) | 2,938 (48.9%) |
| 19 to 25 Years | 1,022 (34.6%) | 1,627 (55.1%) |
| 25 to 34 Years | 1,347 (32.5%) | 2,206 (53.1%) |
| 35 to 44 Years | 1,331 (30.6%) | 2,582 (59.3%) |
| 45 to 54 Years | 1,604 (29.1%) | 3,436 (62.3%) |
| 55 to 64 Years | 1,915 (34.8%) | 3,324 (60.4%) |
| 65 to 74 Years | 4,527 (99.3%) | 2,811 (61.6%) |
| 75 Years and over | 3,194 (99.3%) | 1,982 (61.6%) |
| Total | 20,586 (53.1%) | 21,634 (55.8%) |
Disability Status by Sex by Age in Campbell County
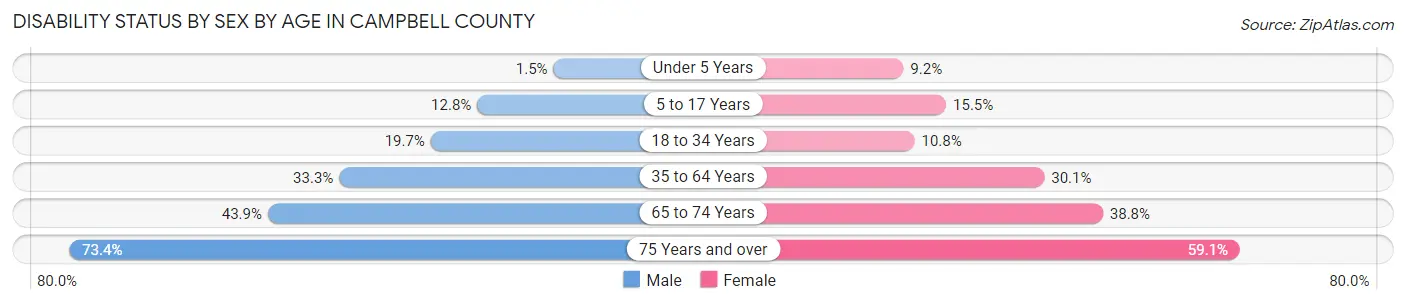
| Age Bracket | Male | Female |
| Under 5 Years | 16 (1.5%) | 102 (9.1%) |
| 5 to 17 Years | 392 (12.8%) | 438 (15.5%) |
| 18 to 34 Years | 748 (19.7%) | 401 (10.8%) |
| 35 to 64 Years | 2,548 (33.3%) | 2,320 (30.1%) |
| 65 to 74 Years | 933 (43.9%) | 944 (38.8%) |
| 75 Years and over | 1,064 (73.4%) | 1,045 (59.1%) |
Disability Class by Sex by Age in Campbell County
Disability Class: Hearing Difficulty
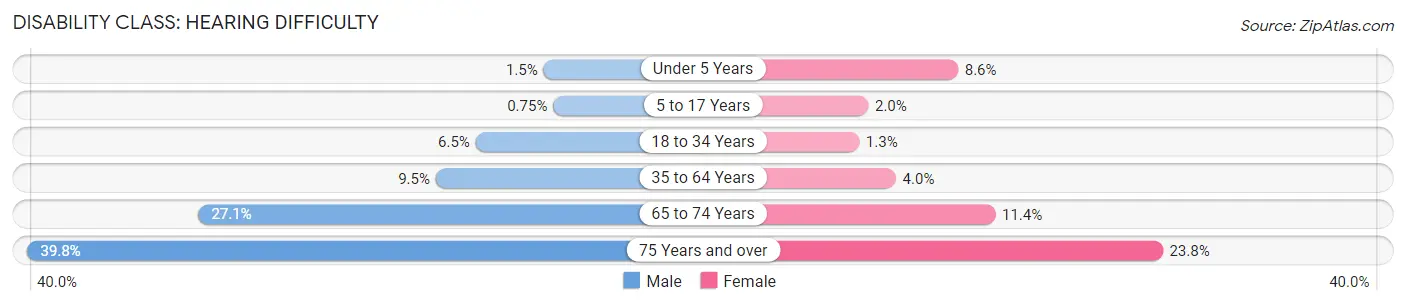
| Age Bracket | Male | Female |
| Under 5 Years | 16 (1.5%) | 96 (8.6%) |
| 5 to 17 Years | 23 (0.7%) | 55 (1.9%) |
| 18 to 34 Years | 247 (6.5%) | 47 (1.3%) |
| 35 to 64 Years | 725 (9.5%) | 309 (4.0%) |
| 65 to 74 Years | 576 (27.1%) | 277 (11.4%) |
| 75 Years and over | 577 (39.8%) | 421 (23.8%) |
Disability Class: Vision Difficulty
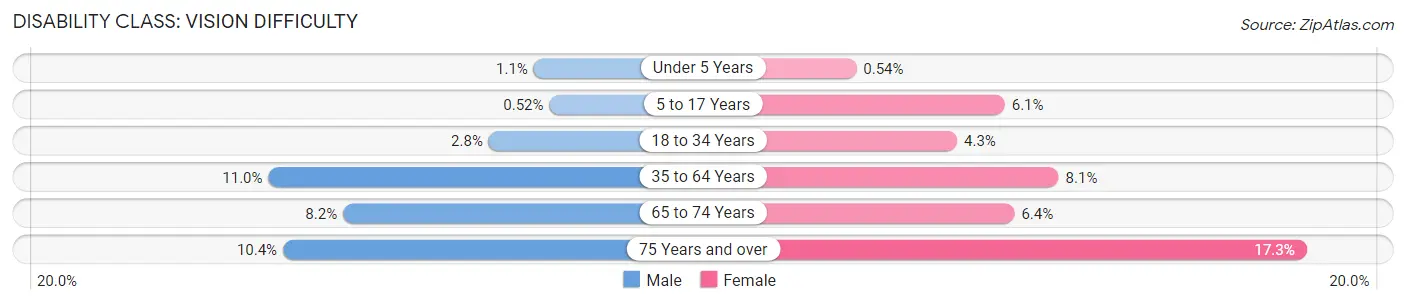
| Age Bracket | Male | Female |
| Under 5 Years | 12 (1.1%) | 6 (0.5%) |
| 5 to 17 Years | 16 (0.5%) | 171 (6.0%) |
| 18 to 34 Years | 105 (2.8%) | 159 (4.3%) |
| 35 to 64 Years | 838 (11.0%) | 621 (8.1%) |
| 65 to 74 Years | 174 (8.2%) | 156 (6.4%) |
| 75 Years and over | 151 (10.4%) | 305 (17.2%) |
Disability Class: Cognitive Difficulty
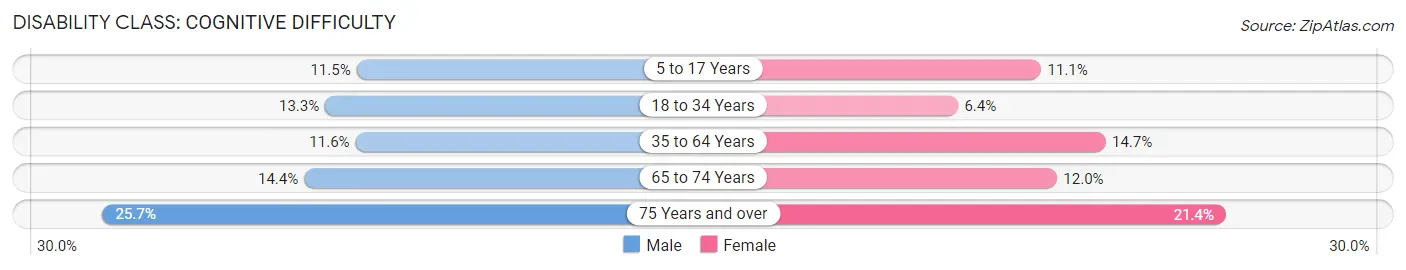
| Age Bracket | Male | Female |
| 5 to 17 Years | 353 (11.5%) | 313 (11.1%) |
| 18 to 34 Years | 504 (13.3%) | 239 (6.4%) |
| 35 to 64 Years | 886 (11.6%) | 1,131 (14.7%) |
| 65 to 74 Years | 307 (14.4%) | 291 (11.9%) |
| 75 Years and over | 372 (25.7%) | 378 (21.4%) |
Disability Class: Ambulatory Difficulty
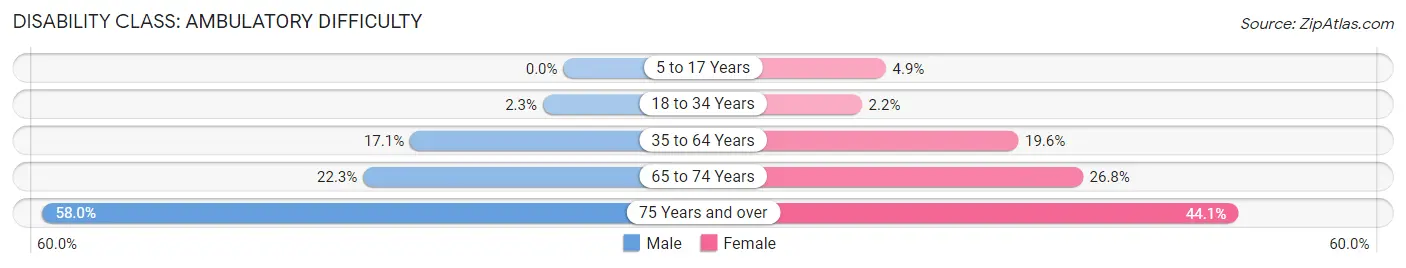
| Age Bracket | Male | Female |
| 5 to 17 Years | 0 (0.0%) | 138 (4.9%) |
| 18 to 34 Years | 87 (2.3%) | 82 (2.2%) |
| 35 to 64 Years | 1,307 (17.1%) | 1,515 (19.6%) |
| 65 to 74 Years | 474 (22.3%) | 653 (26.8%) |
| 75 Years and over | 841 (58.0%) | 780 (44.1%) |
Disability Class: Self-Care Difficulty
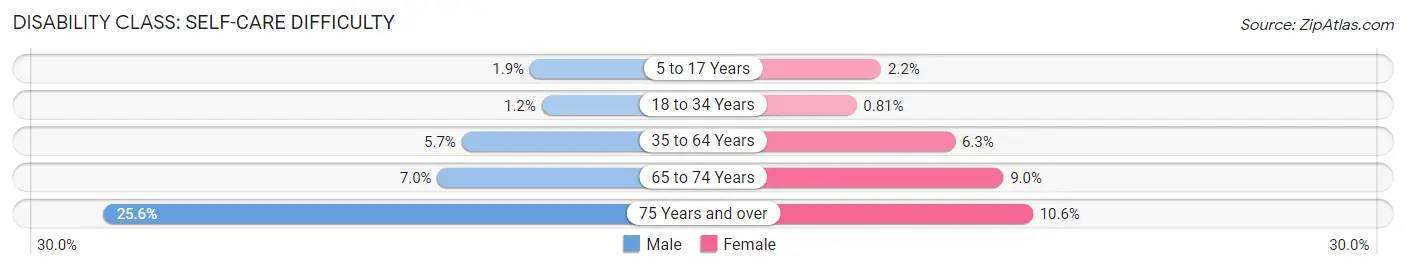
| Age Bracket | Male | Female |
| 5 to 17 Years | 57 (1.9%) | 62 (2.2%) |
| 18 to 34 Years | 46 (1.2%) | 30 (0.8%) |
| 35 to 64 Years | 433 (5.7%) | 486 (6.3%) |
| 65 to 74 Years | 149 (7.0%) | 219 (9.0%) |
| 75 Years and over | 371 (25.6%) | 188 (10.6%) |
Technology Access in Campbell County
Computing Device Access in Campbell County
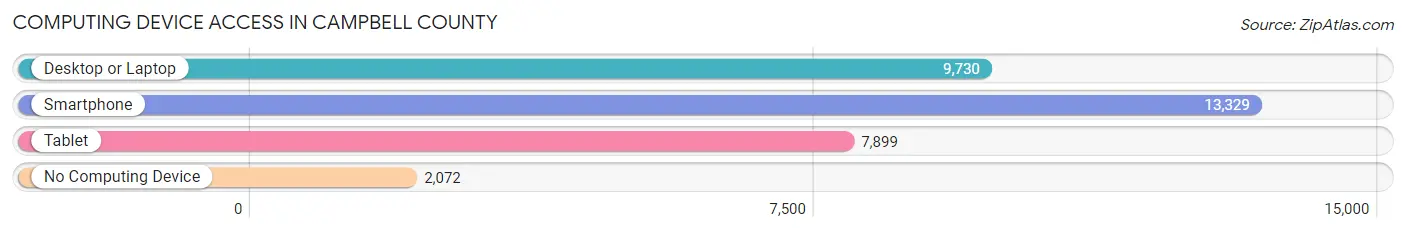
| Device Type | # Households | % Households |
| Desktop or Laptop | 9,730 | 59.9% |
| Smartphone | 13,329 | 82.0% |
| Tablet | 7,899 | 48.6% |
| No Computing Device | 2,072 | 12.8% |
| Total | 16,255 | 100.0% |
Internet Access in Campbell County
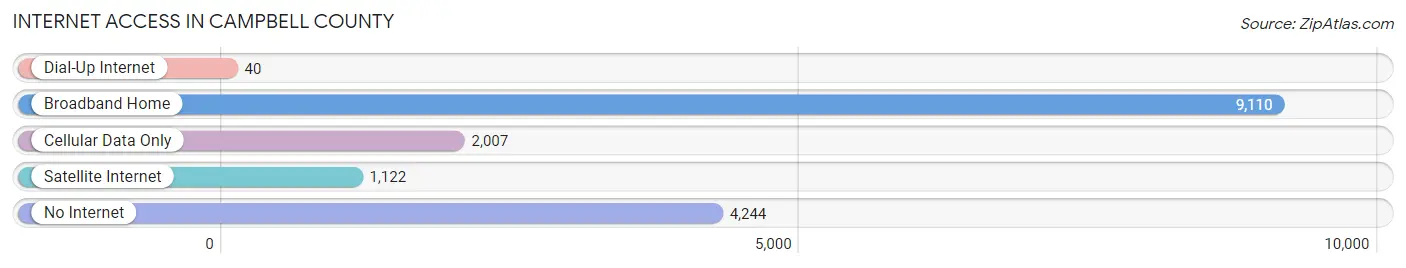
| Internet Type | # Households | % Households |
| Dial-Up Internet | 40 | 0.3% |
| Broadband Home | 9,110 | 56.0% |
| Cellular Data Only | 2,007 | 12.3% |
| Satellite Internet | 1,122 | 6.9% |
| No Internet | 4,244 | 26.1% |
| Total | 16,255 | 100.0% |
Campbell County Summary
Campbell County is located in the northeastern corner of Tennessee, and is bordered by Kentucky to the north and Virginia to the east. It is part of the Appalachian region of the United States, and is known for its rolling hills and lush forests. The county was established in 1806 and named after Colonel Arthur Campbell, a Revolutionary War hero. The county seat is Jacksboro, and the largest city is La Follette.
Geography
Campbell County covers an area of 517 square miles, making it the fourth largest county in Tennessee. The terrain is mostly hilly, with the Cumberland Mountains to the east and the Clinch Mountains to the west. The county is drained by the Clinch River, which flows through the county from north to south. The county is home to several state parks, including Cove Lake State Park, Norris Dam State Park, and Big Ridge State Park.
Demographics
As of the 2010 census, Campbell County had a population of 40,716. The racial makeup of the county was 94.3% White, 2.7% African American, 0.4% Native American, 0.7% Asian, 0.1% Pacific Islander, 0.7% from other races, and 1.2% from two or more races. Hispanic or Latino of any race were 2.2% of the population.
The median income for a household in the county was $37,845, and the median income for a family was $45,945. The per capita income for the county was $19,845. About 14.2% of families and 17.7% of the population were below the poverty line, including 24.2% of those under age 18 and 14.2% of those age 65 or over.
Economy
Campbell County has a diverse economy, with a mix of manufacturing, agriculture, and tourism. The county is home to several large manufacturing companies, including LaFollette Furniture, LaFollette Paper Products, and LaFollette Textiles. Agriculture is also an important part of the economy, with the county producing corn, soybeans, hay, and tobacco. Tourism is also a major industry, with the county being home to several state parks and recreational areas.
The county is also home to several colleges and universities, including the University of Tennessee at Knoxville, Tennessee Technological University, and Walters State Community College.
Conclusion
Campbell County is a rural county located in the northeastern corner of Tennessee. It is known for its rolling hills and lush forests, and is home to several state parks and recreational areas. The county has a diverse economy, with a mix of manufacturing, agriculture, and tourism. The population of the county is mostly white, with a small percentage of African Americans, Native Americans, and other races. The median income for a household in the county is slightly below the state average, and the poverty rate is slightly higher than the state average.
Common Questions
What is Per Capita Income in Campbell County?
Per Capita income in Campbell County is $26,791.
What is the Median Family Income in Campbell County?
Median Family Income in Campbell County is $61,629.
What is the Median Household income in Campbell County?
Median Household Income in Campbell County is $48,258.
What is Income or Wage Gap in Campbell County?
Income or Wage Gap in Campbell County is 38.2%.
Women in Campbell County earn 61.8 cents for every dollar earned by a man.
What is Family Income Deficit in Campbell County?
Family Income Deficit in Campbell County is $9,846.
Families that are below poverty line in Campbell County earn $9,846 less on average than the poverty threshold level.
What is Inequality or Gini Index in Campbell County?
Inequality or Gini Index in Campbell County is 0.44.
What is the Total Population of Campbell County?
Total Population of Campbell County is 39,397.
What is the Total Male Population of Campbell County?
Total Male Population of Campbell County is 19,508.
What is the Total Female Population of Campbell County?
Total Female Population of Campbell County is 19,889.
What is the Ratio of Males per 100 Females in Campbell County?
There are 98.08 Males per 100 Females in Campbell County.
What is the Ratio of Females per 100 Males in Campbell County?
There are 101.95 Females per 100 Males in Campbell County.
What is the Median Population Age in Campbell County?
Median Population Age in Campbell County is 44.2 Years.
What is the Average Family Size in Campbell County
Average Family Size in Campbell County is 2.8 People.
What is the Average Household Size in Campbell County
Average Household Size in Campbell County is 2.4 People.
How Large is the Labor Force in Campbell County?
There are 16,440 People in the Labor Forcein in Campbell County.
What is the Percentage of People in the Labor Force in Campbell County?
51.2% of People are in the Labor Force in Campbell County.
What is the Unemployment Rate in Campbell County?
Unemployment Rate in Campbell County is 7.1%.