Zip Codes with the Highest Percentage of Families with Income Below $10,000 in New Hampshire
RELATED REPORTS & OPTIONS
Family Income | $0-10k
New Hampshire
Compare Zip Codes
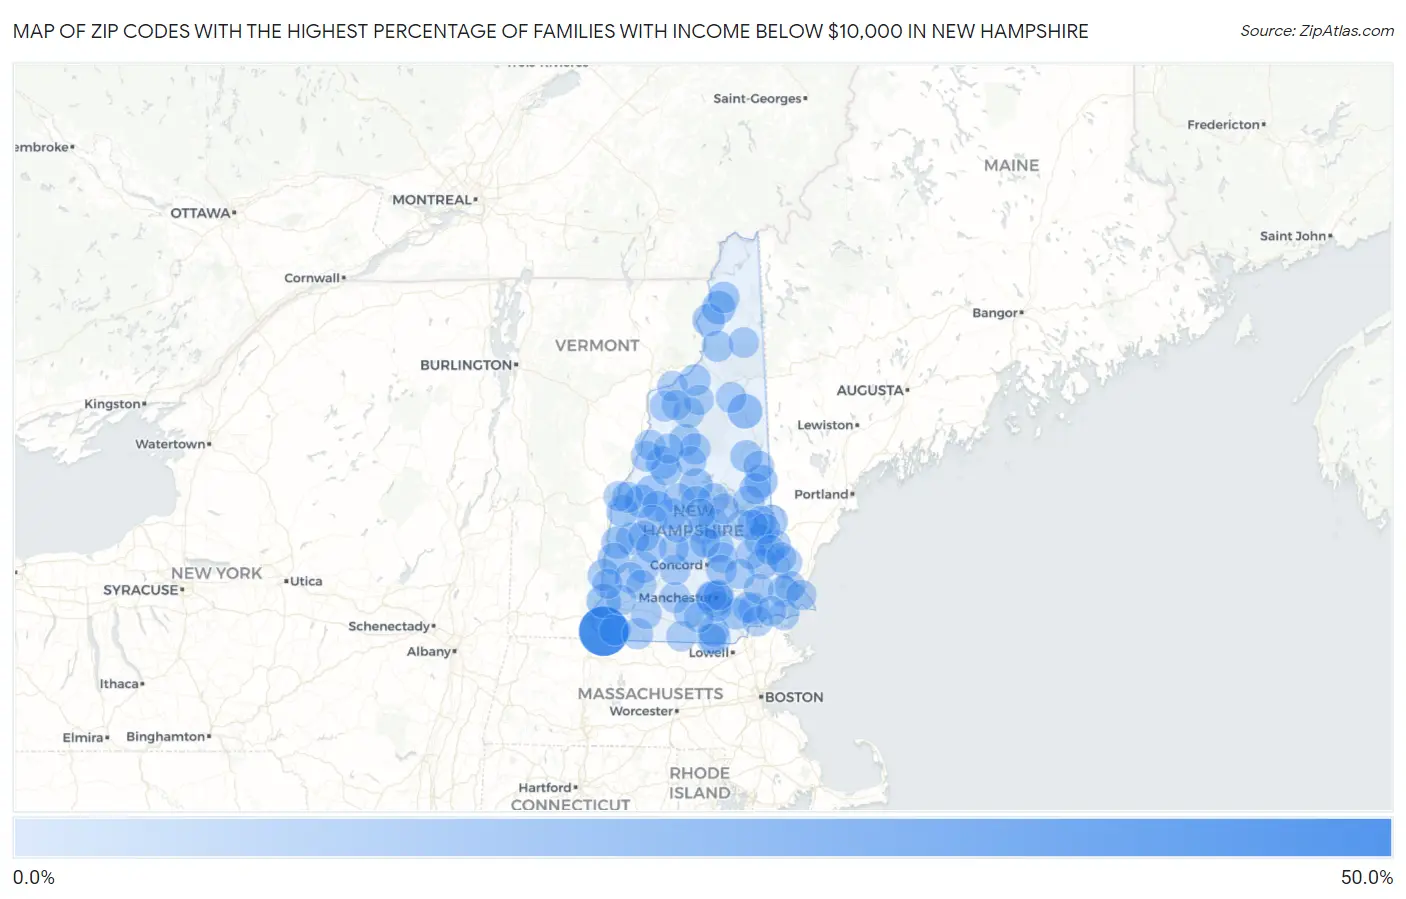
Map of Zip Codes with the Highest Percentage of Families with Income Below $10,000 in New Hampshire
0.0%
50.0%
Zip Codes with the Highest Percentage of Families with Income Below $10,000 in New Hampshire
| Zip Code | Families with Income < $10k | vs State | vs National | |
| 1. | 03441 | 46.0% | 1.6%(+44.4)#1 | 3.1%(+42.9)#76 |
| 2. | 03101 | 13.9% | 1.6%(+12.3)#2 | 3.1%(+10.8)#986 |
| 3. | 03846 | 11.4% | 1.6%(+9.80)#3 | 3.1%(+8.30)#1,490 |
| 4. | 03467 | 10.3% | 1.6%(+8.70)#4 | 3.1%(+7.20)#1,808 |
| 5. | 03597 | 8.5% | 1.6%(+6.90)#5 | 3.1%(+5.40)#2,686 |
| 6. | 03217 | 8.0% | 1.6%(+6.40)#6 | 3.1%(+4.90)#2,988 |
| 7. | 03748 | 7.9% | 1.6%(+6.30)#7 | 3.1%(+4.80)#3,045 |
| 8. | 03852 | 7.7% | 1.6%(+6.10)#8 | 3.1%(+4.60)#3,179 |
| 9. | 03282 | 7.4% | 1.6%(+5.80)#9 | 3.1%(+4.30)#3,373 |
| 10. | 03882 | 7.3% | 1.6%(+5.70)#10 | 3.1%(+4.20)#3,443 |
| 11. | 03590 | 6.7% | 1.6%(+5.10)#11 | 3.1%(+3.60)#3,954 |
| 12. | 03773 | 6.6% | 1.6%(+5.00)#12 | 3.1%(+3.50)#4,022 |
| 13. | 03743 | 6.2% | 1.6%(+4.60)#13 | 3.1%(+3.10)#4,453 |
| 14. | 03875 | 5.6% | 1.6%(+4.00)#14 | 3.1%(+2.50)#5,253 |
| 15. | 03609 | 5.1% | 1.6%(+3.50)#15 | 3.1%(+2.00)#6,052 |
| 16. | 03307 | 5.0% | 1.6%(+3.40)#16 | 3.1%(+1.90)#6,154 |
| 17. | 03603 | 5.0% | 1.6%(+3.40)#17 | 3.1%(+1.90)#6,158 |
| 18. | 03262 | 5.0% | 1.6%(+3.40)#18 | 3.1%(+1.90)#6,208 |
| 19. | 03781 | 4.7% | 1.6%(+3.10)#19 | 3.1%(+1.60)#6,745 |
| 20. | 03741 | 4.6% | 1.6%(+3.00)#20 | 3.1%(+1.50)#6,904 |
| 21. | 03869 | 4.6% | 1.6%(+3.00)#21 | 3.1%(+1.50)#6,925 |
| 22. | 03868 | 4.4% | 1.6%(+2.80)#22 | 3.1%(+1.30)#7,285 |
| 23. | 03576 | 4.3% | 1.6%(+2.70)#23 | 3.1%(+1.20)#7,529 |
| 24. | 03470 | 4.2% | 1.6%(+2.60)#24 | 3.1%(+1.10)#7,754 |
| 25. | 03840 | 4.1% | 1.6%(+2.50)#25 | 3.1%(+1.000)#8,012 |
| 26. | 03276 | 4.0% | 1.6%(+2.40)#26 | 3.1%(+0.900)#8,233 |
| 27. | 03598 | 3.9% | 1.6%(+2.30)#27 | 3.1%(+0.800)#8,551 |
| 28. | 03038 | 3.8% | 1.6%(+2.20)#28 | 3.1%(+0.700)#8,662 |
| 29. | 03253 | 3.7% | 1.6%(+2.10)#29 | 3.1%(+0.600)#9,063 |
| 30. | 03894 | 3.7% | 1.6%(+2.10)#30 | 3.1%(+0.600)#9,066 |
| 31. | 03582 | 3.7% | 1.6%(+2.10)#31 | 3.1%(+0.600)#9,130 |
| 32. | 03060 | 3.6% | 1.6%(+2.00)#32 | 3.1%(+0.500)#9,242 |
| 33. | 03230 | 3.6% | 1.6%(+2.00)#33 | 3.1%(+0.500)#9,407 |
| 34. | 03222 | 3.5% | 1.6%(+1.90)#34 | 3.1%(+0.400)#9,631 |
| 35. | 03819 | 3.4% | 1.6%(+1.80)#35 | 3.1%(+0.300)#9,953 |
| 36. | 03285 | 3.4% | 1.6%(+1.80)#36 | 3.1%(+0.300)#9,992 |
| 37. | 03447 | 3.4% | 1.6%(+1.80)#37 | 3.1%(+0.300)#10,001 |
| 38. | 03064 | 3.3% | 1.6%(+1.70)#38 | 3.1%(+0.200)#10,199 |
| 39. | 03766 | 3.3% | 1.6%(+1.70)#39 | 3.1%(+0.200)#10,228 |
| 40. | 03864 | 3.1% | 1.6%(+1.50)#40 | 3.1%(=0.000)#10,997 |
| 41. | 03809 | 3.0% | 1.6%(+1.40)#41 | 3.1%(-0.100)#11,281 |
| 42. | 03782 | 3.0% | 1.6%(+1.40)#42 | 3.1%(-0.100)#11,291 |
| 43. | 03266 | 3.0% | 1.6%(+1.40)#43 | 3.1%(-0.100)#11,333 |
| 44. | 03580 | 3.0% | 1.6%(+1.40)#44 | 3.1%(-0.100)#11,355 |
| 45. | 03240 | 3.0% | 1.6%(+1.40)#45 | 3.1%(-0.100)#11,362 |
| 46. | 03835 | 2.9% | 1.6%(+1.30)#46 | 3.1%(-0.200)#11,599 |
| 47. | 03836 | 2.9% | 1.6%(+1.30)#47 | 3.1%(-0.200)#11,722 |
| 48. | 03887 | 2.8% | 1.6%(+1.20)#48 | 3.1%(-0.300)#12,087 |
| 49. | 03280 | 2.8% | 1.6%(+1.20)#49 | 3.1%(-0.300)#12,126 |
| 50. | 03456 | 2.8% | 1.6%(+1.20)#50 | 3.1%(-0.300)#12,140 |
| 51. | 03593 | 2.7% | 1.6%(+1.10)#51 | 3.1%(-0.400)#12,565 |
| 52. | 03825 | 2.6% | 1.6%(+1.00)#52 | 3.1%(-0.500)#12,799 |
| 53. | 03585 | 2.6% | 1.6%(+1.00)#53 | 3.1%(-0.500)#12,896 |
| 54. | 03801 | 2.5% | 1.6%(+0.900)#54 | 3.1%(-0.600)#13,134 |
| 55. | 03220 | 2.5% | 1.6%(+0.900)#55 | 3.1%(-0.600)#13,226 |
| 56. | 03043 | 2.5% | 1.6%(+0.900)#56 | 3.1%(-0.600)#13,337 |
| 57. | 03103 | 2.4% | 1.6%(+0.800)#57 | 3.1%(-0.700)#13,466 |
| 58. | 03884 | 2.4% | 1.6%(+0.800)#58 | 3.1%(-0.700)#13,688 |
| 59. | 03102 | 2.3% | 1.6%(+0.700)#59 | 3.1%(-0.800)#13,928 |
| 60. | 03873 | 2.3% | 1.6%(+0.700)#60 | 3.1%(-0.800)#14,100 |
| 61. | 03258 | 2.3% | 1.6%(+0.700)#61 | 3.1%(-0.800)#14,186 |
| 62. | 03255 | 2.3% | 1.6%(+0.700)#62 | 3.1%(-0.800)#14,210 |
| 63. | 03444 | 2.3% | 1.6%(+0.700)#63 | 3.1%(-0.800)#14,218 |
| 64. | 03104 | 2.2% | 1.6%(+0.600)#64 | 3.1%(-0.900)#14,363 |
| 65. | 03249 | 2.2% | 1.6%(+0.600)#65 | 3.1%(-0.900)#14,522 |
| 66. | 03851 | 2.2% | 1.6%(+0.600)#66 | 3.1%(-0.900)#14,570 |
| 67. | 03855 | 2.2% | 1.6%(+0.600)#67 | 3.1%(-0.900)#14,609 |
| 68. | 03777 | 2.2% | 1.6%(+0.600)#68 | 3.1%(-0.900)#14,677 |
| 69. | 03275 | 2.1% | 1.6%(+0.500)#69 | 3.1%(-1.000)#14,964 |
| 70. | 03242 | 2.1% | 1.6%(+0.500)#70 | 3.1%(-1.000)#15,022 |
| 71. | 03303 | 2.0% | 1.6%(+0.400)#71 | 3.1%(-1.10)#15,402 |
| 72. | 03561 | 2.0% | 1.6%(+0.400)#72 | 3.1%(-1.10)#15,496 |
| 73. | 03278 | 2.0% | 1.6%(+0.400)#73 | 3.1%(-1.10)#15,568 |
| 74. | 03256 | 2.0% | 1.6%(+0.400)#74 | 3.1%(-1.10)#15,577 |
| 75. | 03588 | 2.0% | 1.6%(+0.400)#75 | 3.1%(-1.10)#15,627 |
| 76. | 03464 | 2.0% | 1.6%(+0.400)#76 | 3.1%(-1.10)#15,653 |
| 77. | 03867 | 1.9% | 1.6%(+0.300)#77 | 3.1%(-1.20)#15,839 |
| 78. | 03431 | 1.8% | 1.6%(+0.200)#78 | 3.1%(-1.30)#16,313 |
| 79. | 03574 | 1.7% | 1.6%(+0.100)#79 | 3.1%(-1.40)#17,040 |
| 80. | 03779 | 1.7% | 1.6%(+0.100)#80 | 3.1%(-1.40)#17,122 |
| 81. | 03284 | 1.7% | 1.6%(+0.100)#81 | 3.1%(-1.40)#17,126 |
| 82. | 03062 | 1.6% | 1.6%(=0.000)#82 | 3.1%(-1.50)#17,265 |
| 83. | 03878 | 1.6% | 1.6%(=0.000)#83 | 3.1%(-1.50)#17,364 |
| 84. | 03874 | 1.6% | 1.6%(=0.000)#84 | 3.1%(-1.50)#17,401 |
| 85. | 03865 | 1.6% | 1.6%(=0.000)#85 | 3.1%(-1.50)#17,407 |
| 86. | 03870 | 1.6% | 1.6%(=0.000)#86 | 3.1%(-1.50)#17,440 |
| 87. | 03037 | 1.6% | 1.6%(=0.000)#87 | 3.1%(-1.50)#17,451 |
| 88. | 03784 | 1.6% | 1.6%(=0.000)#88 | 3.1%(-1.50)#17,461 |
| 89. | 03048 | 1.6% | 1.6%(=0.000)#89 | 3.1%(-1.50)#17,474 |
| 90. | 03608 | 1.6% | 1.6%(=0.000)#90 | 3.1%(-1.50)#17,489 |
| 91. | 03269 | 1.6% | 1.6%(=0.000)#91 | 3.1%(-1.50)#17,494 |
| 92. | 03057 | 1.6% | 1.6%(=0.000)#92 | 3.1%(-1.50)#17,508 |
| 93. | 03224 | 1.6% | 1.6%(=0.000)#93 | 3.1%(-1.50)#17,524 |
| 94. | 03216 | 1.6% | 1.6%(=0.000)#94 | 3.1%(-1.50)#17,530 |
| 95. | 03586 | 1.6% | 1.6%(=0.000)#95 | 3.1%(-1.50)#17,615 |
| 96. | 03031 | 1.5% | 1.6%(-0.100)#96 | 3.1%(-1.60)#17,869 |
| 97. | 03042 | 1.5% | 1.6%(-0.100)#97 | 3.1%(-1.60)#17,928 |
| 98. | 03223 | 1.5% | 1.6%(-0.100)#98 | 3.1%(-1.60)#18,001 |
| 99. | 03827 | 1.5% | 1.6%(-0.100)#99 | 3.1%(-1.60)#18,008 |
| 100. | 03279 | 1.5% | 1.6%(-0.100)#100 | 3.1%(-1.60)#18,114 |
Common Questions
What are the Top 10 Zip Codes with the Highest Percentage of Families with Income Below $10,000 in New Hampshire?
Top 10 Zip Codes with the Highest Percentage of Families with Income Below $10,000 in New Hampshire are:
What zip code has the Highest Percentage of Families with Income Below $10,000 in New Hampshire?
03441 has the Highest Percentage of Families with Income Below $10,000 in New Hampshire with 46.0%.
What is the Percentage of Families with Income Below $10,000 in the State of New Hampshire?
Percentage of Families with Income Below $10,000 in New Hampshire is 1.6%.
What is the Percentage of Families with Income Below $10,000 in the United States?
Percentage of Families with Income Below $10,000 in the United States is 3.1%.