Area Code 573 Map & Demographics
Area Code 573 Map
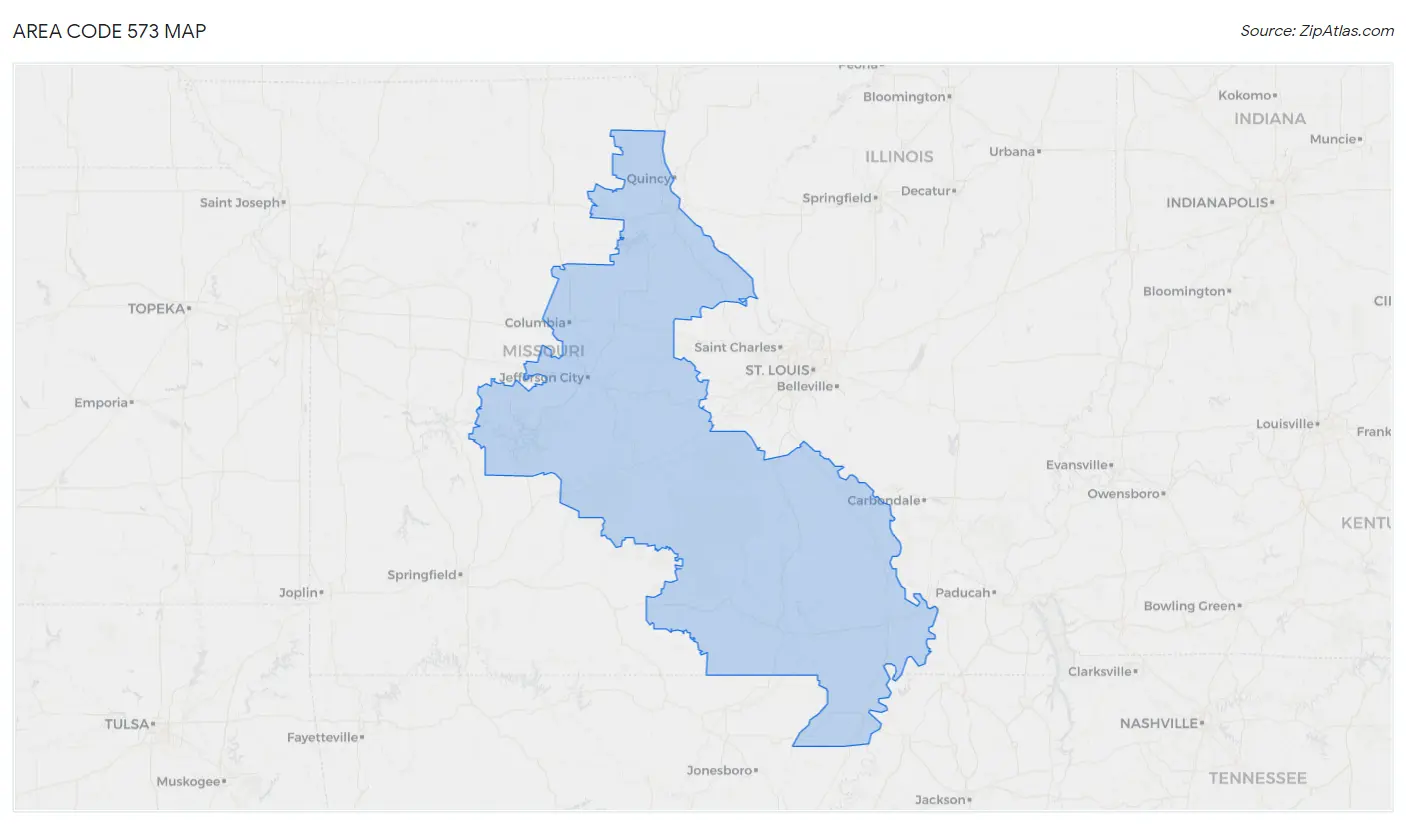
Area Code 573 Overview
$28,837
PER CAPITA INCOME
$72,050
AVG FAMILY INCOME
$57,043
AVG HOUSEHOLD INCOME
28.6%
WAGE / INCOME GAP [ % ]
71.4¢/ $1
WAGE / INCOME GAP [ $ ]
$9,713
FAMILY INCOME DEFICIT
118.70
INEQUALITY / GINI INDEX
1,221,784
TOTAL POPULATION
614,087
MALE POPULATION
607,697
FEMALE POPULATION
101.05
MALES / 100 FEMALES
98.96
FEMALES / 100 MALES
43.2
MEDIAN AGE
3.1
AVG FAMILY SIZE
2.6
AVG HOUSEHOLD SIZE
552,069
LABOR FORCE [ PEOPLE ]
56.0%
PERCENT IN LABOR FORCE
6.2%
UNEMPLOYMENT RATE
Income in Area Code 573
Income Overview in Area Code 573
Per Capita Income in Area Code 573 is $28,837, while median incomes of families and households are $72,050 and $57,043 respectively.
| Characteristic | Number | Measure |
| Per Capita Income | 1,221,784 | $28,837 |
| Median Family Income | 299,533 | $72,050 |
| Mean Family Income | 299,533 | $24,291,128 |
| Median Household Income | 468,171 | $57,043 |
| Mean Household Income | 468,171 | $20,782,360 |
| Income Deficit | 299,533 | $9,713 |
| Wage / Income Gap (%) | 1,221,784 | 28.58% |
| Wage / Income Gap ($) | 1,221,784 | 71.42¢ per $1 |
| Gini / Inequality Index | 1,221,784 | 118.70 |
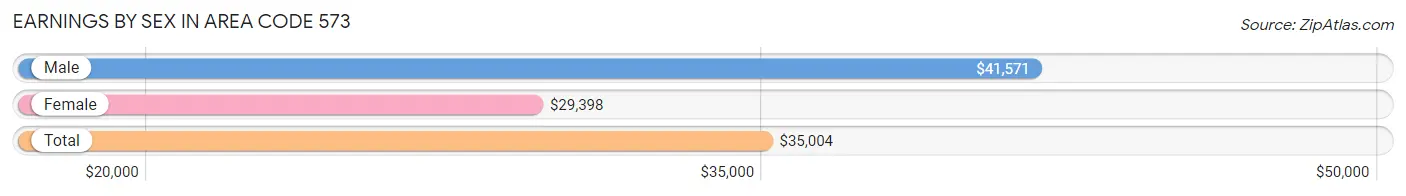
Earnings by Sex in Area Code 573
Average Earnings in Area Code 573 are $35,004, $41,571 for men and $29,398 for women, a difference of 29.3%.
| Sex | Number | Average Earnings |
| Male | 324,749 (52.5%) | $41,571 |
| Female | 293,805 (47.5%) | $29,398 |
| Total | 618,554 (100.0%) | $35,004 |
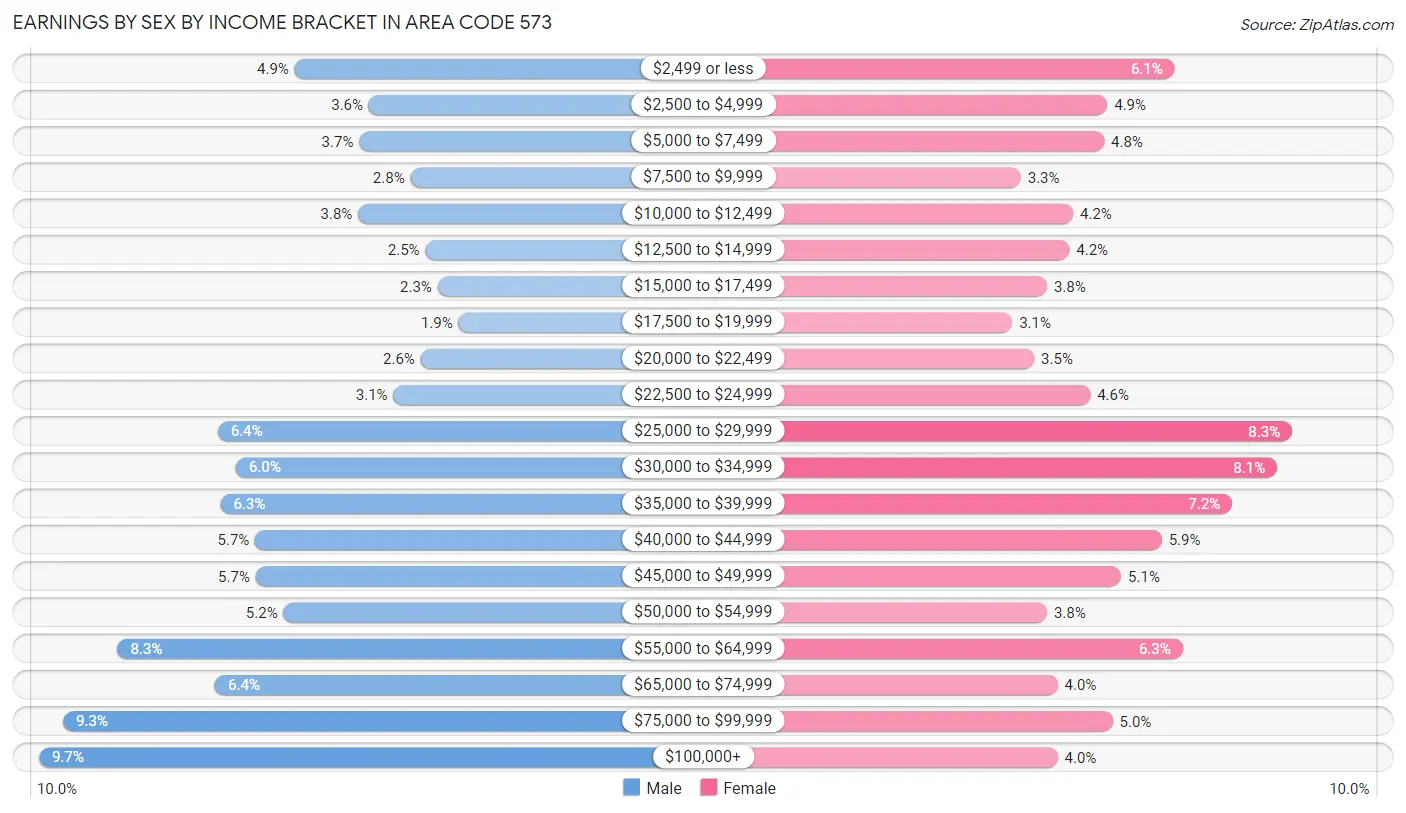
Earnings by Sex by Income Bracket in Area Code 573
The most common earnings brackets in Area Code 573 are $100,000+ for men (31,584 | 9.7%) and $25,000 to $29,999 for women (24,500 | 8.3%).
| Income | Male | Female |
| $2,499 or less | 16,051 (4.9%) | 18,038 (6.1%) |
| $2,500 to $4,999 | 11,526 (3.5%) | 14,347 (4.9%) |
| $5,000 to $7,499 | 12,125 (3.7%) | 14,169 (4.8%) |
| $7,500 to $9,999 | 8,991 (2.8%) | 9,564 (3.3%) |
| $10,000 to $12,499 | 12,180 (3.7%) | 12,469 (4.2%) |
| $12,500 to $14,999 | 8,093 (2.5%) | 12,254 (4.2%) |
| $15,000 to $17,499 | 7,352 (2.3%) | 11,018 (3.7%) |
| $17,500 to $19,999 | 6,078 (1.9%) | 9,112 (3.1%) |
| $20,000 to $22,499 | 8,388 (2.6%) | 10,307 (3.5%) |
| $22,500 to $24,999 | 10,046 (3.1%) | 13,392 (4.6%) |
| $25,000 to $29,999 | 20,721 (6.4%) | 24,500 (8.3%) |
| $30,000 to $34,999 | 19,615 (6.0%) | 23,690 (8.1%) |
| $35,000 to $39,999 | 20,570 (6.3%) | 21,223 (7.2%) |
| $40,000 to $44,999 | 18,455 (5.7%) | 17,327 (5.9%) |
| $45,000 to $49,999 | 18,398 (5.7%) | 15,102 (5.1%) |
| $50,000 to $54,999 | 16,730 (5.1%) | 11,010 (3.7%) |
| $55,000 to $64,999 | 26,826 (8.3%) | 18,467 (6.3%) |
| $65,000 to $74,999 | 20,880 (6.4%) | 11,606 (4.0%) |
| $75,000 to $99,999 | 30,140 (9.3%) | 14,617 (5.0%) |
| $100,000+ | 31,584 (9.7%) | 11,593 (4.0%) |
| Total | 324,749 (100.0%) | 293,805 (100.0%) |
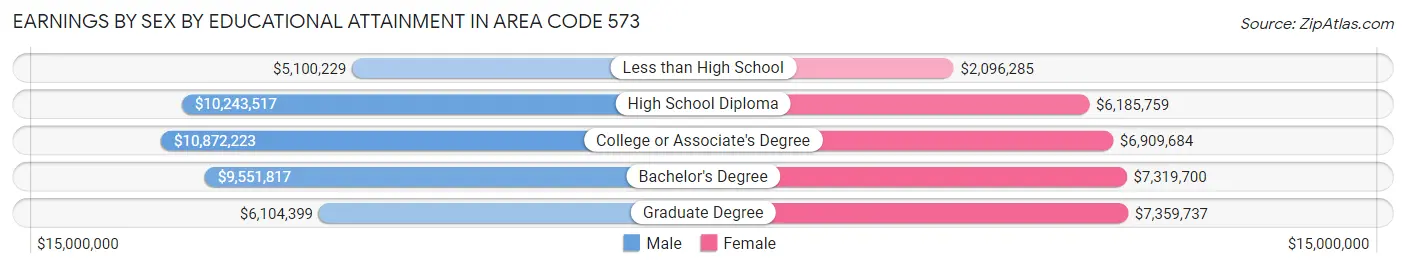
Earnings by Sex by Educational Attainment in Area Code 573
Average earnings in Area Code 573 are $11,736,727 for men and $8,452,016 for women, a difference of 28.0%. Men with an educational attainment of college or associate's degree enjoy the highest average annual earnings of $10,872,223, while those with less than high school education earn the least with $5,100,229. Women with an educational attainment of graduate degree earn the most with the average annual earnings of $7,359,737, while those with less than high school education have the smallest earnings of $2,096,285.
| Educational Attainment | Male Income | Female Income |
| Less than High School | $5,100,229 | $2,096,285 |
| High School Diploma | $10,243,517 | $6,185,759 |
| College or Associate's Degree | $10,872,223 | $6,909,684 |
| Bachelor's Degree | $9,551,817 | $7,319,700 |
| Graduate Degree | $6,104,399 | $7,359,737 |
| Total | $11,736,727 | $8,452,016 |
Family Income in Area Code 573
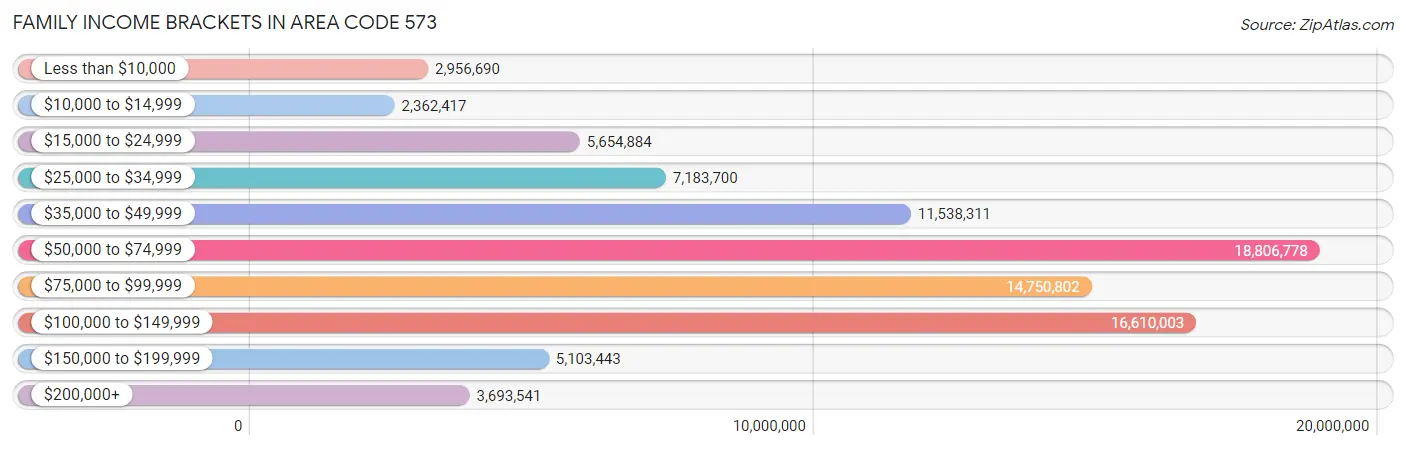
Family Income Brackets in Area Code 573
According to the Area Code 573 family income data, there are 18,806,778 families falling into the $50,000 to $74,999 income range, which is the most common income bracket and makes up 6,278.7% of all families. Conversely, the $10,000 to $14,999 income bracket is the least frequent group with only 2,362,417 families (788.7%) belonging to this category.
| Income Bracket | # Families | % Families |
| Less than $10,000 | 2,956,690 | 987.1% |
| $10,000 to $14,999 | 2,362,417 | 788.7% |
| $15,000 to $24,999 | 5,654,884 | 1,887.9% |
| $25,000 to $34,999 | 7,183,700 | 2,398.3% |
| $35,000 to $49,999 | 11,538,311 | 3,852.1% |
| $50,000 to $74,999 | 18,806,778 | 6,278.7% |
| $75,000 to $99,999 | 14,750,802 | 4,924.6% |
| $100,000 to $149,999 | 16,610,003 | 5,545.3% |
| $150,000 to $199,999 | 5,103,443 | 1,703.8% |
| $200,000+ | 3,693,541 | 1,233.1% |
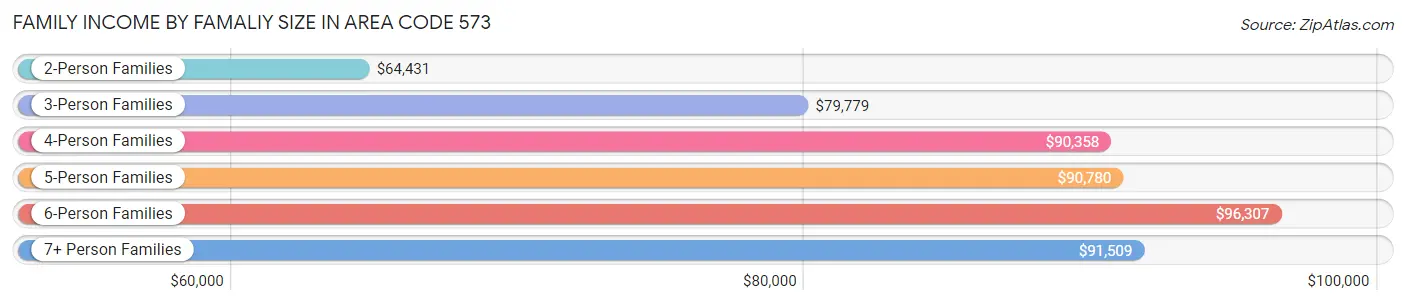
Family Income by Famaliy Size in Area Code 573
6-person families (7,203 | 2.4%) account for the highest median family income in Area Code 573 with $96,307 per family, while 2-person families (154,014 | 51.4%) have the highest median income of $32,216 per family member.
| Income Bracket | # Families | Median Income |
| 2-Person Families | 154,014 (51.4%) | $64,431 |
| 3-Person Families | 62,809 (21.0%) | $79,779 |
| 4-Person Families | 49,380 (16.5%) | $90,358 |
| 5-Person Families | 22,244 (7.4%) | $90,780 |
| 6-Person Families | 7,203 (2.4%) | $96,307 |
| 7+ Person Families | 3,883 (1.3%) | $91,509 |
| Total | 299,533 (100.0%) | $72,050 |
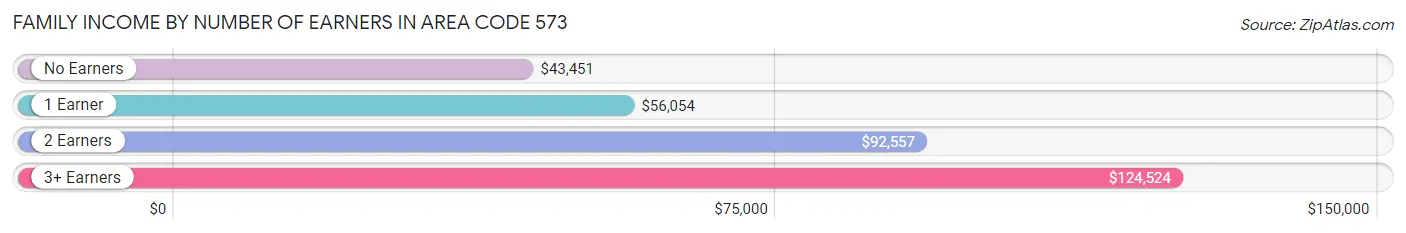
Family Income by Number of Earners in Area Code 573
The median family income in Area Code 573 is $72,050, with families comprising 3+ earners (29,226) having the highest median family income of $124,524, while families with no earners (53,844) have the lowest median family income of $43,451, accounting for 9.8% and 18.0% of families, respectively.
| Number of Earners | # Families | Median Income |
| No Earners | 53,844 (18.0%) | $43,451 |
| 1 Earner | 94,078 (31.4%) | $56,054 |
| 2 Earners | 122,385 (40.9%) | $92,557 |
| 3+ Earners | 29,226 (9.8%) | $124,524 |
| Total | 299,533 (100.0%) | $72,050 |
Household Income in Area Code 573
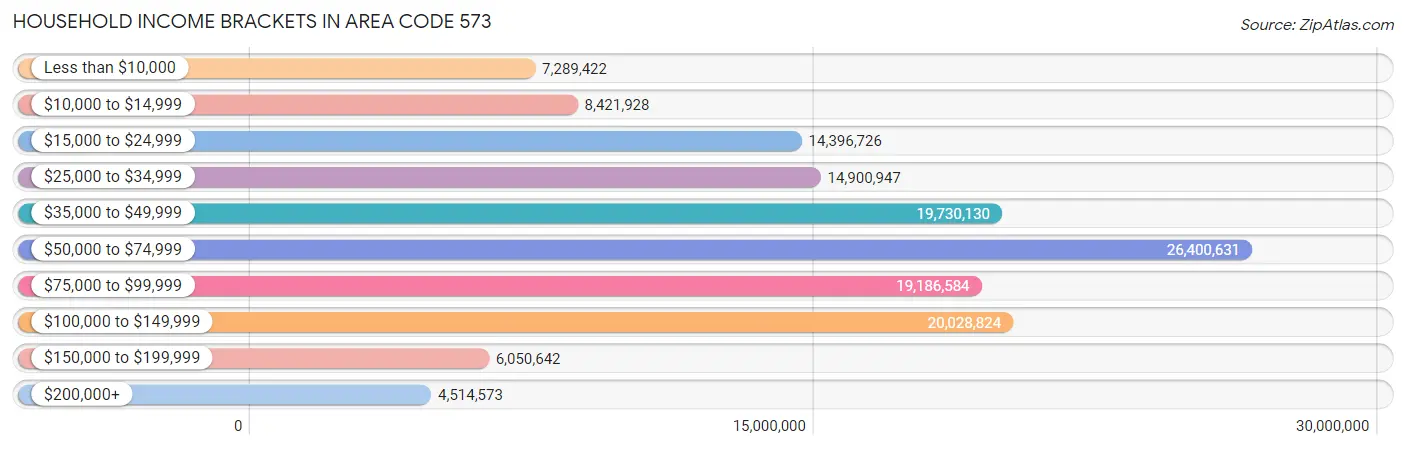
Household Income Brackets in Area Code 573
With 26,400,631 households falling in the category, the $50,000 to $74,999 income range is the most frequent in Area Code 573, accounting for 5,639.1% of all households. In contrast, only 4,514,573 households (964.3%) fall into the $200,000+ income bracket, making it the least populous group.
| Income Bracket | # Households | % Households |
| Less than $10,000 | 7,289,422 | 1,557.0% |
| $10,000 to $14,999 | 8,421,928 | 1,798.9% |
| $15,000 to $24,999 | 14,396,726 | 3,075.1% |
| $25,000 to $34,999 | 14,900,947 | 3,182.8% |
| $35,000 to $49,999 | 19,730,130 | 4,214.3% |
| $50,000 to $74,999 | 26,400,631 | 5,639.1% |
| $75,000 to $99,999 | 19,186,584 | 4,098.2% |
| $100,000 to $149,999 | 20,028,824 | 4,278.1% |
| $150,000 to $199,999 | 6,050,642 | 1,292.4% |
| $200,000+ | 4,514,573 | 964.3% |
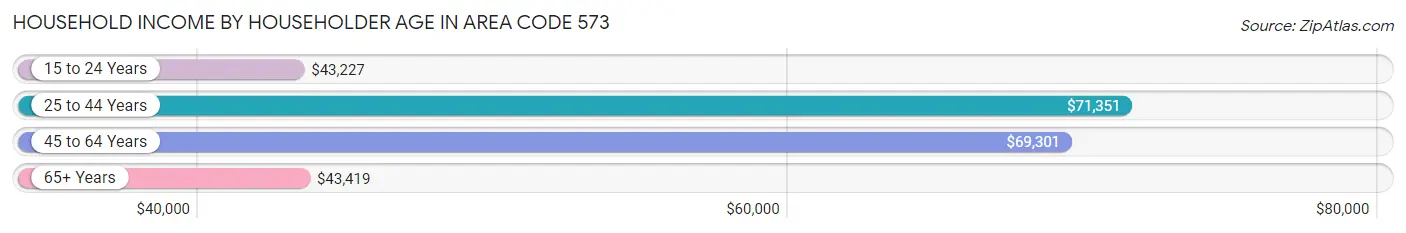
Household Income by Householder Age in Area Code 573
The median household income in Area Code 573 is $57,043, with the highest median household income of $71,351 found in the 25 to 44 years age bracket for the primary householder. A total of 141,742 households (30.3%) fall into this category. Meanwhile, the 15 to 24 years age bracket for the primary householder has the lowest median household income of $43,227, with 26,148 households (5.6%) in this group.
| Income Bracket | # Households | Median Income |
| 15 to 24 Years | 26,148 (5.6%) | $43,227 |
| 25 to 44 Years | 141,742 (30.3%) | $71,351 |
| 45 to 64 Years | 166,916 (35.6%) | $69,301 |
| 65+ Years | 133,365 (28.5%) | $43,419 |
| Total | 468,171 (100.0%) | $57,043 |
Poverty in Area Code 573
Income Below Poverty by Sex and Age in Area Code 573
With 14.5% poverty level for males and 17.0% for females among the residents of Area Code 573, 18 to 24 year old males and 18 to 24 year old females are the most vulnerable to poverty, with 15,256 males (26.6%) and 16,432 females (30.9%) in their respective age groups living below the poverty level.
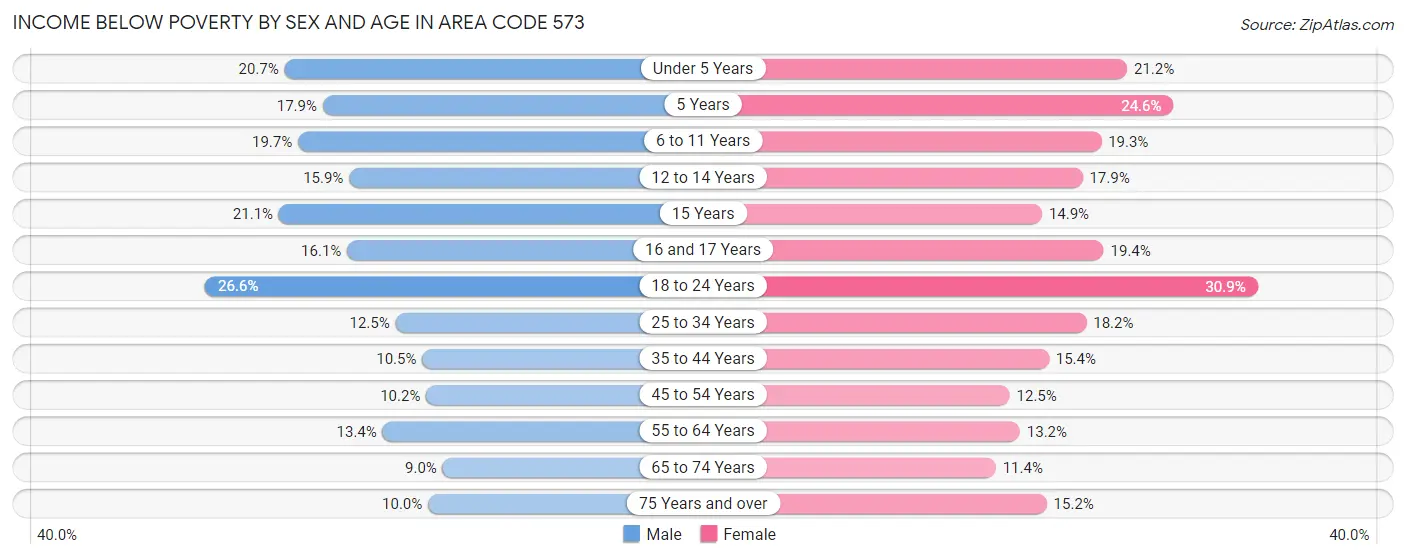
| Age Bracket | Male | Female |
| Under 5 Years | 7,162 (20.7%) | 7,004 (21.2%) |
| 5 Years | 1,243 (17.9%) | 1,776 (24.6%) |
| 6 to 11 Years | 8,933 (19.7%) | 8,226 (19.3%) |
| 12 to 14 Years | 3,661 (15.9%) | 3,825 (17.9%) |
| 15 Years | 1,709 (21.1%) | 1,048 (14.9%) |
| 16 and 17 Years | 2,538 (16.1%) | 2,989 (19.4%) |
| 18 to 24 Years | 15,256 (26.6%) | 16,432 (30.9%) |
| 25 to 34 Years | 9,155 (12.5%) | 13,437 (18.1%) |
| 35 to 44 Years | 7,343 (10.5%) | 10,832 (15.4%) |
| 45 to 54 Years | 6,977 (10.2%) | 8,598 (12.5%) |
| 55 to 64 Years | 10,363 (13.4%) | 10,747 (13.2%) |
| 65 to 74 Years | 5,248 (9.0%) | 7,324 (11.4%) |
| 75 Years and over | 3,494 (10.0%) | 7,228 (15.2%) |
| Total | 83,082 (14.5%) | 99,466 (17.0%) |
Income Above Poverty by Sex and Age in Area Code 573
According to the poverty statistics in Area Code 573, males aged 65 to 74 years and females aged 65 to 74 years are the age groups that are most secure financially, with 91.0% of males and 88.6% of females in these age groups living above the poverty line.
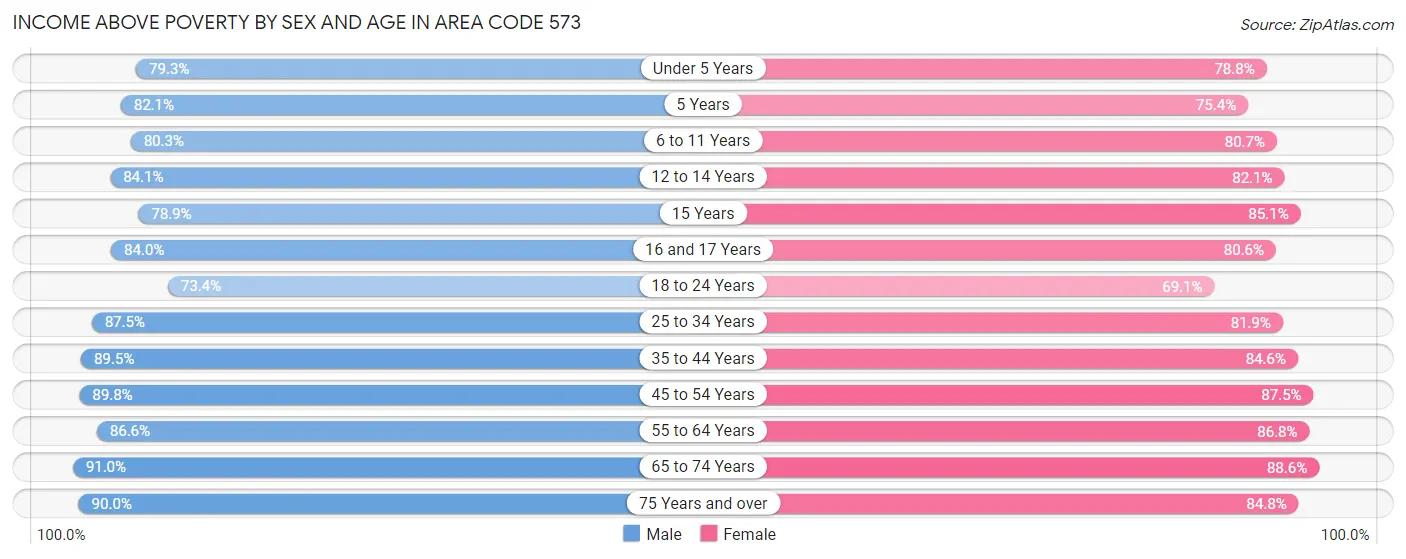
| Age Bracket | Male | Female |
| Under 5 Years | 27,433 (79.3%) | 26,061 (78.8%) |
| 5 Years | 5,718 (82.1%) | 5,442 (75.4%) |
| 6 to 11 Years | 36,409 (80.3%) | 34,484 (80.7%) |
| 12 to 14 Years | 19,365 (84.1%) | 17,582 (82.1%) |
| 15 Years | 6,383 (78.9%) | 6,003 (85.1%) |
| 16 and 17 Years | 13,271 (84.0%) | 12,389 (80.6%) |
| 18 to 24 Years | 42,098 (73.4%) | 36,822 (69.1%) |
| 25 to 34 Years | 64,307 (87.5%) | 60,616 (81.9%) |
| 35 to 44 Years | 62,791 (89.5%) | 59,637 (84.6%) |
| 45 to 54 Years | 61,584 (89.8%) | 60,387 (87.5%) |
| 55 to 64 Years | 66,831 (86.6%) | 70,532 (86.8%) |
| 65 to 74 Years | 53,332 (91.0%) | 56,731 (88.6%) |
| 75 Years and over | 31,295 (90.0%) | 40,279 (84.8%) |
| Total | 490,817 (85.5%) | 486,965 (83.0%) |
Income Below Poverty Among Married-Couple Families in Area Code 573
The poverty statistics for married-couple families in Area Code 573 show that 5.2% or 11,952 of the total 228,884 families live below the poverty line. Families with 5 or more children have the highest poverty rate of 24.4%, comprising of 431 families. On the other hand, families with no children have the lowest poverty rate of 4.3%, which includes 5,981 families.
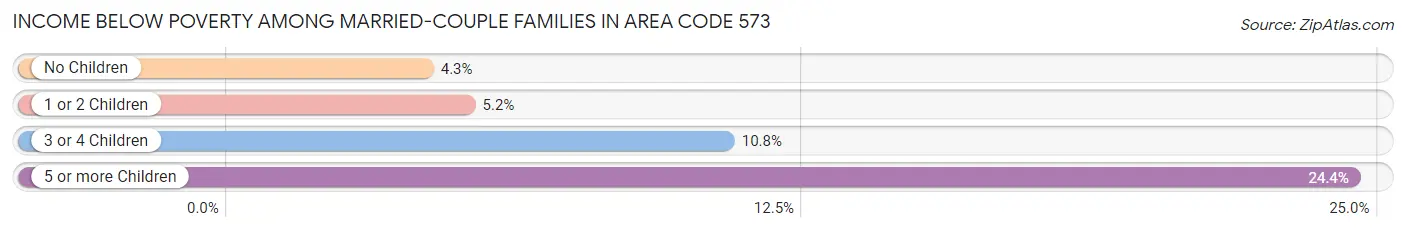
| Children | Above Poverty | Below Poverty |
| No Children | 134,493 (95.7%) | 5,981 (4.3%) |
| 1 or 2 Children | 64,383 (94.8%) | 3,513 (5.2%) |
| 3 or 4 Children | 16,723 (89.2%) | 2,027 (10.8%) |
| 5 or more Children | 1,333 (75.6%) | 431 (24.4%) |
| Total | 216,932 (94.8%) | 11,952 (5.2%) |
Income Below Poverty Among Single-Parent Households in Area Code 573
According to the poverty data in Area Code 573, 16.7% or 3,721 single-father households and 31.2% or 15,116 single-mother households are living below the poverty line. Among single-father households, those with 5 or more children have the highest poverty rate, with 94 households (47.2%) experiencing poverty. Likewise, among single-mother households, those with 5 or more children have the highest poverty rate, with 338 households (72.4%) falling below the poverty line.
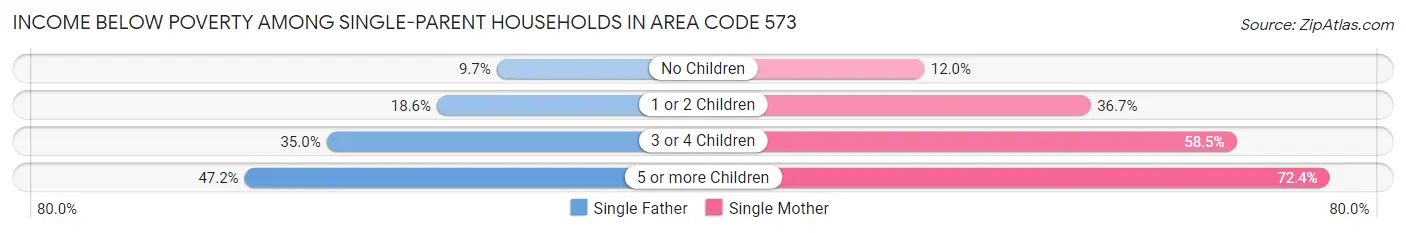
| Children | Single Father | Single Mother |
| No Children | 829 (9.7%) | 1,949 (11.9%) |
| 1 or 2 Children | 2,162 (18.6%) | 9,600 (36.7%) |
| 3 or 4 Children | 636 (35.0%) | 3,229 (58.5%) |
| 5 or more Children | 94 (47.2%) | 338 (72.4%) |
| Total | 3,721 (16.7%) | 15,116 (31.2%) |
Income Below Poverty Among Married-Couple vs Single-Parent Households in Area Code 573
The poverty data for Area Code 573 shows that 11,952 of the married-couple family households (5.2%) and 18,837 of the single-parent households (26.7%) are living below the poverty level. Within the married-couple family households, those with 5 or more children have the highest poverty rate, with 431 households (24.4%) falling below the poverty line. Among the single-parent households, those with 5 or more children have the highest poverty rate, with 432 household (64.9%) living below poverty.
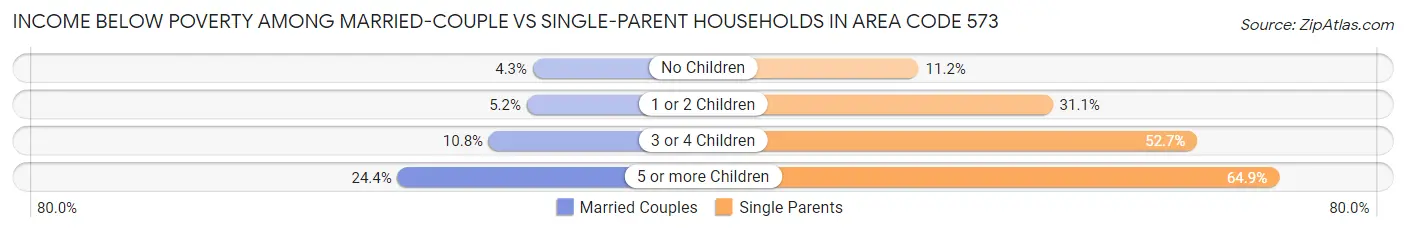
| Children | Married-Couple Families | Single-Parent Households |
| No Children | 5,981 (4.3%) | 2,778 (11.2%) |
| 1 or 2 Children | 3,513 (5.2%) | 11,762 (31.1%) |
| 3 or 4 Children | 2,027 (10.8%) | 3,865 (52.7%) |
| 5 or more Children | 431 (24.4%) | 432 (64.9%) |
| Total | 11,952 (5.2%) | 18,837 (26.7%) |
Race in Area Code 573
The most populous races in Area Code 573 are White / Caucasian (1,062,217 | 86.9%), Black / African American (70,452 | 5.8%), and Two or more Races (58,837 | 4.8%).
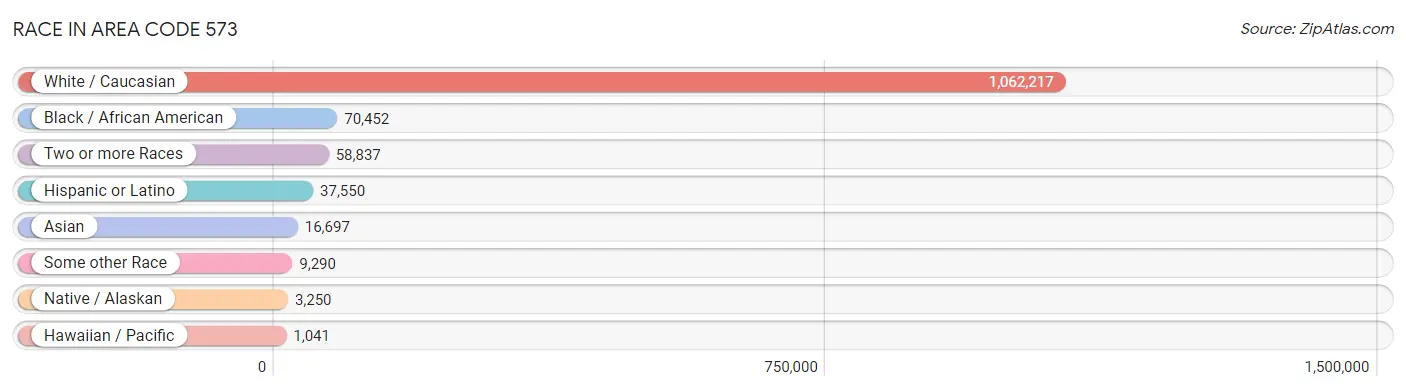
| Race | # Population | % Population |
| Asian | 16,697 | 1.4% |
| Black / African American | 70,452 | 5.8% |
| Hawaiian / Pacific | 1,041 | 0.1% |
| Hispanic or Latino | 37,550 | 3.1% |
| Native / Alaskan | 3,250 | 0.3% |
| White / Caucasian | 1,062,217 | 86.9% |
| Two or more Races | 58,837 | 4.8% |
| Some other Race | 9,290 | 0.8% |
| Total | 1,221,784 | 100.0% |
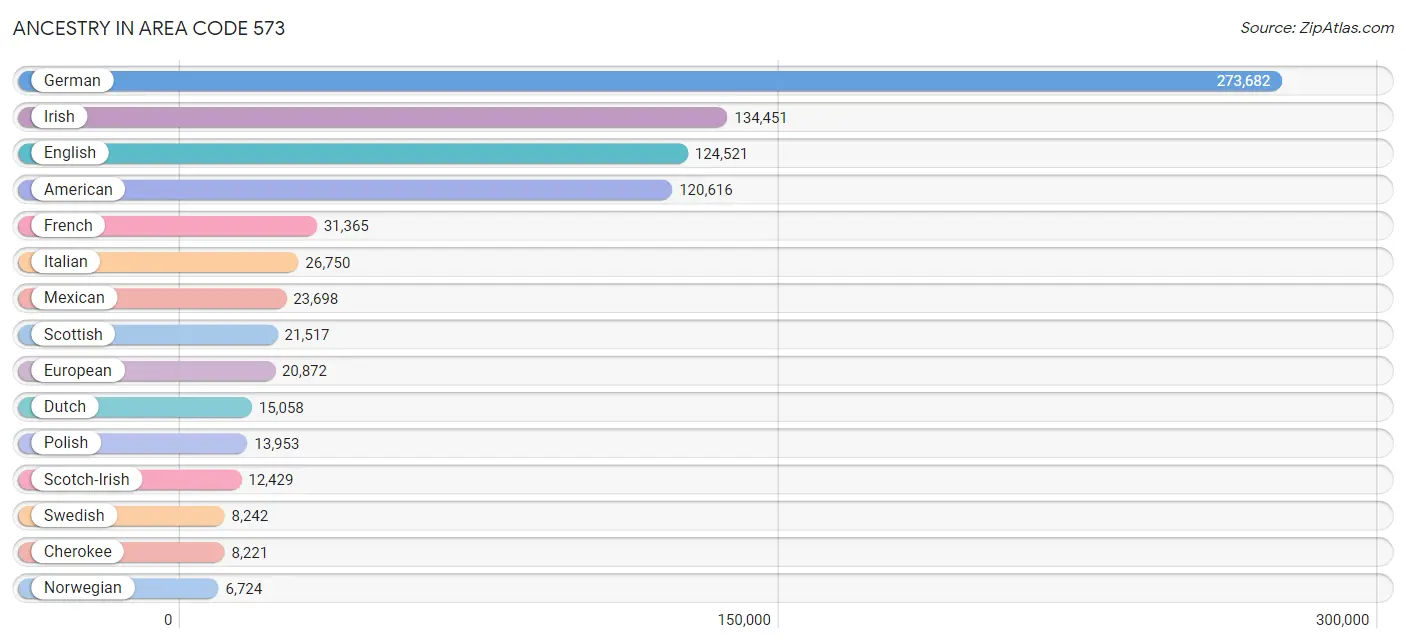
Ancestry in Area Code 573
The most populous ancestries reported in Area Code 573 are German (273,682 | 22.4%), Irish (134,451 | 11.0%), English (124,521 | 10.2%), American (120,616 | 9.9%), and French (31,365 | 2.6%), together accounting for 56.0% of all Area Code 573 residents.
| Ancestry | # Population | % Population |
| Afghan | 3 | 0.0% |
| African | 3,362 | 0.3% |
| Alaska Native | 14 | 0.0% |
| Alaskan Athabascan | 14 | 0.0% |
| Albanian | 176 | 0.0% |
| Aleut | 35 | 0.0% |
| Alsatian | 17 | 0.0% |
| American | 120,616 | 9.9% |
| Apache | 419 | 0.0% |
| Arab | 2,241 | 0.2% |
| Argentinean | 126 | 0.0% |
| Armenian | 287 | 0.0% |
| Assyrian / Chaldean / Syriac | 18 | 0.0% |
| Australian | 175 | 0.0% |
| Austrian | 1,427 | 0.1% |
| Bangladeshi | 1 | 0.0% |
| Barbadian | 11 | 0.0% |
| Basque | 30 | 0.0% |
| Belgian | 794 | 0.1% |
| Belizean | 5 | 0.0% |
| Bhutanese | 2,099 | 0.2% |
| Blackfeet | 1,220 | 0.1% |
| Bolivian | 101 | 0.0% |
| Brazilian | 227 | 0.0% |
| British | 5,478 | 0.4% |
| British West Indian | 50 | 0.0% |
| Bulgarian | 471 | 0.0% |
| Burmese | 3,525 | 0.3% |
| Cajun | 198 | 0.0% |
| Cambodian | 34 | 0.0% |
| Canadian | 679 | 0.1% |
| Celtic | 187 | 0.0% |
| Central American | 2,575 | 0.2% |
| Central American Indian | 269 | 0.0% |
| Cherokee | 8,221 | 0.7% |
| Cheyenne | 100 | 0.0% |
| Chickasaw | 118 | 0.0% |
| Chilean | 91 | 0.0% |
| Chinese | 30 | 0.0% |
| Chippewa | 154 | 0.0% |
| Choctaw | 1,010 | 0.1% |
| Colombian | 1,002 | 0.1% |
| Comanche | 127 | 0.0% |
| Costa Rican | 35 | 0.0% |
| Cree | 3 | 0.0% |
| Creek | 210 | 0.0% |
| Croatian | 688 | 0.1% |
| Crow | 49 | 0.0% |
| Cuban | 1,098 | 0.1% |
| Czech | 3,572 | 0.3% |
| Czechoslovakian | 917 | 0.1% |
| Danish | 2,475 | 0.2% |
| Delaware | 55 | 0.0% |
| Dominican | 374 | 0.0% |
| Dutch | 15,058 | 1.2% |
| Dutch West Indian | 120 | 0.0% |
| Eastern European | 1,915 | 0.2% |
| Ecuadorian | 355 | 0.0% |
| Egyptian | 204 | 0.0% |
| English | 124,521 | 10.2% |
| Estonian | 16 | 0.0% |
| Ethiopian | 129 | 0.0% |
| European | 20,872 | 1.7% |
| Filipino | 415 | 0.0% |
| Finnish | 865 | 0.1% |
| French | 31,365 | 2.6% |
| French American Indian | 200 | 0.0% |
| French Canadian | 2,483 | 0.2% |
| German | 273,682 | 22.4% |
| German Russian | 8 | 0.0% |
| Ghanaian | 496 | 0.0% |
| Greek | 1,697 | 0.1% |
| Guamanian / Chamorro | 170 | 0.0% |
| Guatemalan | 814 | 0.1% |
| Guyanese | 35 | 0.0% |
| Haitian | 524 | 0.0% |
| Hmong | 23 | 0.0% |
| Honduran | 568 | 0.1% |
| Hopi | 65 | 0.0% |
| Hungarian | 1,539 | 0.1% |
| Icelander | 36 | 0.0% |
| Indian (Asian) | 6,276 | 0.5% |
| Indonesian | 71 | 0.0% |
| Inupiat | 20 | 0.0% |
| Iranian | 489 | 0.0% |
| Iraqi | 519 | 0.0% |
| Irish | 134,451 | 11.0% |
| Iroquois | 192 | 0.0% |
| Israeli | 188 | 0.0% |
| Italian | 26,750 | 2.2% |
| Jamaican | 1,064 | 0.1% |
| Japanese | 922 | 0.1% |
| Jordanian | 57 | 0.0% |
| Kenyan | 72 | 0.0% |
| Kiowa | 81 | 0.0% |
| Korean | 3,867 | 0.3% |
| Laotian | 81 | 0.0% |
| Latvian | 103 | 0.0% |
| Lebanese | 528 | 0.0% |
| Lithuanian | 945 | 0.1% |
| Lumbee | 12 | 0.0% |
| Luxembourger | 44 | 0.0% |
| Macedonian | 14 | 0.0% |
| Malaysian | 35 | 0.0% |
| Maltese | 2 | 0.0% |
| Menominee | 21 | 0.0% |
| Mexican | 23,698 | 1.9% |
| Mexican American Indian | 158 | 0.0% |
| Mongolian | 3 | 0.0% |
| Moroccan | 52 | 0.0% |
| Native Hawaiian | 1,067 | 0.1% |
| Navajo | 149 | 0.0% |
| New Zealander | 87 | 0.0% |
| Nicaraguan | 473 | 0.0% |
| Nigerian | 521 | 0.0% |
| Northern European | 1,769 | 0.1% |
| Norwegian | 6,724 | 0.5% |
| Okinawan | 6 | 0.0% |
| Osage | 225 | 0.0% |
| Pakistani | 557 | 0.1% |
| Palestinian | 45 | 0.0% |
| Panamanian | 251 | 0.0% |
| Paraguayan | 84 | 0.0% |
| Pennsylvania German | 245 | 0.0% |
| Peruvian | 454 | 0.0% |
| Polish | 13,953 | 1.1% |
| Portuguese | 958 | 0.1% |
| Potawatomi | 117 | 0.0% |
| Pueblo | 23 | 0.0% |
| Puerto Rican | 3,885 | 0.3% |
| Romanian | 582 | 0.1% |
| Russian | 2,907 | 0.2% |
| Salvadoran | 434 | 0.0% |
| Samoan | 609 | 0.1% |
| Scandinavian | 3,136 | 0.3% |
| Scotch-Irish | 12,429 | 1.0% |
| Scottish | 21,517 | 1.8% |
| Seminole | 77 | 0.0% |
| Serbian | 159 | 0.0% |
| Shoshone | 12 | 0.0% |
| Sierra Leonean | 37 | 0.0% |
| Sioux | 646 | 0.1% |
| Slavic | 207 | 0.0% |
| Slovak | 333 | 0.0% |
| Slovene | 238 | 0.0% |
| Somali | 15 | 0.0% |
| South African | 142 | 0.0% |
| South American | 2,325 | 0.2% |
| South American Indian | 150 | 0.0% |
| Spaniard | 822 | 0.1% |
| Spanish | 624 | 0.1% |
| Spanish American | 35 | 0.0% |
| Sri Lankan | 1,839 | 0.2% |
| Subsaharan African | 5,472 | 0.4% |
| Sudanese | 299 | 0.0% |
| Swedish | 8,242 | 0.7% |
| Swiss | 3,501 | 0.3% |
| Syrian | 257 | 0.0% |
| Thai | 2,649 | 0.2% |
| Tlingit-Haida | 22 | 0.0% |
| Trinidadian and Tobagonian | 119 | 0.0% |
| Turkish | 217 | 0.0% |
| Ukrainian | 695 | 0.1% |
| Ute | 4 | 0.0% |
| Venezuelan | 105 | 0.0% |
| Vietnamese | 43 | 0.0% |
| Welsh | 6,252 | 0.5% |
| West Indian | 76 | 0.0% |
| Yugoslavian | 337 | 0.0% |
| Yup'ik | 31 | 0.0% |
| Zimbabwean | 48 | 0.0% | View All 171 Rows |
Immigrants in Area Code 573
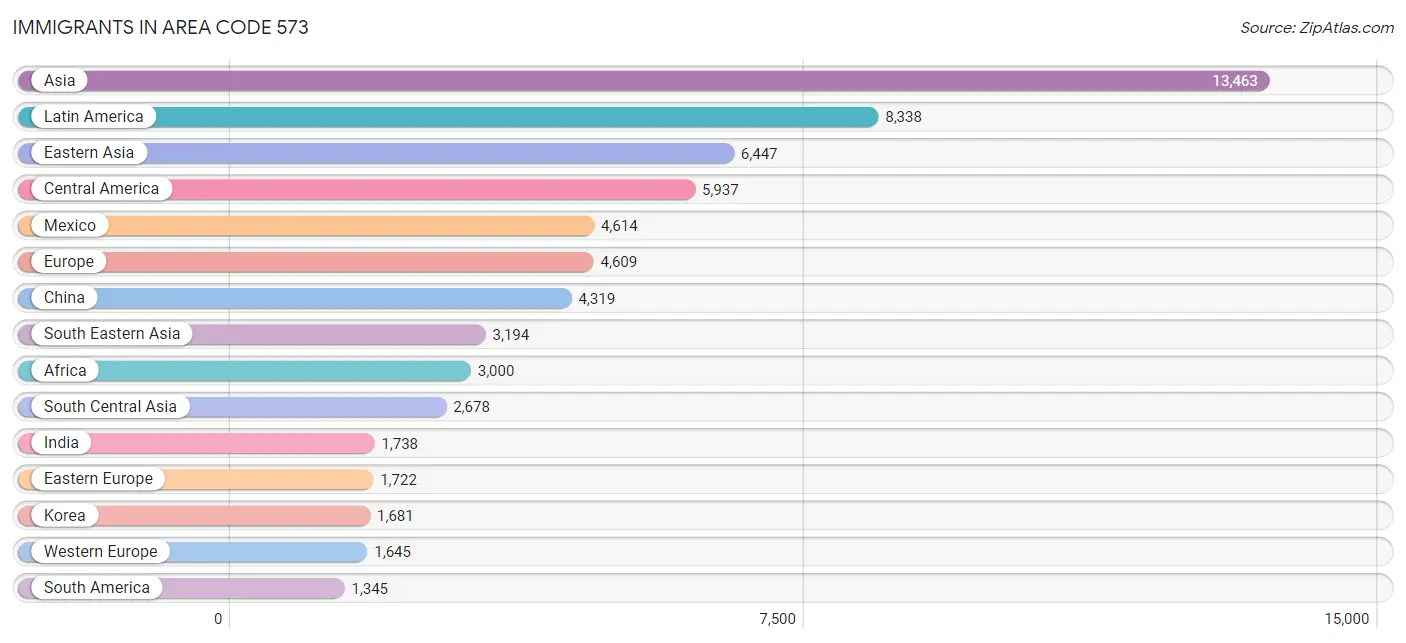
The most numerous immigrant groups reported in Area Code 573 came from Asia (13,463 | 1.1%), Latin America (8,338 | 0.7%), Eastern Asia (6,447 | 0.5%), Central America (5,937 | 0.5%), and Mexico (4,614 | 0.4%), together accounting for 3.2% of all Area Code 573 residents.
| Immigration Origin | # Population | % Population |
| Afghanistan | 3 | 0.0% |
| Africa | 3,000 | 0.3% |
| Argentina | 111 | 0.0% |
| Armenia | 15 | 0.0% |
| Asia | 13,463 | 1.1% |
| Australia | 32 | 0.0% |
| Austria | 47 | 0.0% |
| Bahamas | 73 | 0.0% |
| Bangladesh | 131 | 0.0% |
| Belarus | 5 | 0.0% |
| Belgium | 15 | 0.0% |
| Bolivia | 74 | 0.0% |
| Bosnia and Herzegovina | 38 | 0.0% |
| Brazil | 123 | 0.0% |
| Bulgaria | 408 | 0.0% |
| Cambodia | 301 | 0.0% |
| Cameroon | 16 | 0.0% |
| Canada | 433 | 0.0% |
| Caribbean | 1,056 | 0.1% |
| Central America | 5,937 | 0.5% |
| Chile | 37 | 0.0% |
| China | 4,319 | 0.4% |
| Colombia | 611 | 0.1% |
| Congo | 12 | 0.0% |
| Costa Rica | 19 | 0.0% |
| Croatia | 19 | 0.0% |
| Cuba | 67 | 0.0% |
| Czechoslovakia | 62 | 0.0% |
| Denmark | 9 | 0.0% |
| Dominica | 27 | 0.0% |
| Dominican Republic | 33 | 0.0% |
| Eastern Africa | 727 | 0.1% |
| Eastern Asia | 6,447 | 0.5% |
| Eastern Europe | 1,722 | 0.1% |
| Ecuador | 55 | 0.0% |
| Egypt | 276 | 0.0% |
| El Salvador | 185 | 0.0% |
| England | 322 | 0.0% |
| Eritrea | 205 | 0.0% |
| Ethiopia | 76 | 0.0% |
| Europe | 4,609 | 0.4% |
| France | 155 | 0.0% |
| Germany | 1,341 | 0.1% |
| Ghana | 485 | 0.0% |
| Greece | 77 | 0.0% |
| Guatemala | 501 | 0.0% |
| Haiti | 163 | 0.0% |
| Honduras | 312 | 0.0% |
| Hong Kong | 53 | 0.0% |
| Hungary | 16 | 0.0% |
| India | 1,738 | 0.1% |
| Indonesia | 67 | 0.0% |
| Iran | 132 | 0.0% |
| Iraq | 501 | 0.0% |
| Ireland | 30 | 0.0% |
| Israel | 22 | 0.0% |
| Italy | 151 | 0.0% |
| Jamaica | 516 | 0.0% |
| Japan | 428 | 0.0% |
| Jordan | 67 | 0.0% |
| Kazakhstan | 2 | 0.0% |
| Kenya | 326 | 0.0% |
| Korea | 1,681 | 0.1% |
| Kuwait | 33 | 0.0% |
| Laos | 22 | 0.0% |
| Latin America | 8,338 | 0.7% |
| Lebanon | 51 | 0.0% |
| Lithuania | 67 | 0.0% |
| Malaysia | 57 | 0.0% |
| Mexico | 4,614 | 0.4% |
| Micronesia | 141 | 0.0% |
| Middle Africa | 152 | 0.0% |
| Morocco | 22 | 0.0% |
| Nepal | 279 | 0.0% |
| Netherlands | 74 | 0.0% |
| Nicaragua | 138 | 0.0% |
| Nigeria | 292 | 0.0% |
| North Macedonia | 49 | 0.0% |
| Northern Africa | 648 | 0.1% |
| Northern Europe | 925 | 0.1% |
| Norway | 20 | 0.0% |
| Oceania | 406 | 0.0% |
| Pakistan | 312 | 0.0% |
| Panama | 168 | 0.0% |
| Peru | 211 | 0.0% |
| Philippines | 1,314 | 0.1% |
| Poland | 181 | 0.0% |
| Romania | 72 | 0.0% |
| Russia | 433 | 0.0% |
| Saudi Arabia | 203 | 0.0% |
| Scotland | 129 | 0.0% |
| Serbia | 53 | 0.0% |
| Sierra Leone | 71 | 0.0% |
| Singapore | 91 | 0.0% |
| Somalia | 5 | 0.0% |
| South Africa | 164 | 0.0% |
| South America | 1,345 | 0.1% |
| South Central Asia | 2,678 | 0.2% |
| South Eastern Asia | 3,194 | 0.3% |
| Southern Europe | 307 | 0.0% |
| Spain | 61 | 0.0% |
| Sri Lanka | 71 | 0.0% |
| Sudan | 75 | 0.0% |
| Sweden | 39 | 0.0% |
| Switzerland | 13 | 0.0% |
| Syria | 47 | 0.0% |
| Taiwan | 339 | 0.0% |
| Thailand | 282 | 0.0% |
| Trinidad and Tobago | 153 | 0.0% |
| Turkey | 144 | 0.0% |
| Uganda | 12 | 0.0% |
| Ukraine | 273 | 0.0% |
| Uzbekistan | 10 | 0.0% |
| Venezuela | 100 | 0.0% |
| Vietnam | 908 | 0.1% |
| Western Africa | 1,020 | 0.1% |
| Western Asia | 1,144 | 0.1% |
| Western Europe | 1,645 | 0.1% |
| Zaire | 52 | 0.0% |
| Zimbabwe | 76 | 0.0% | View All 120 Rows |
Sex and Age in Area Code 573
Sex and Age in Area Code 573
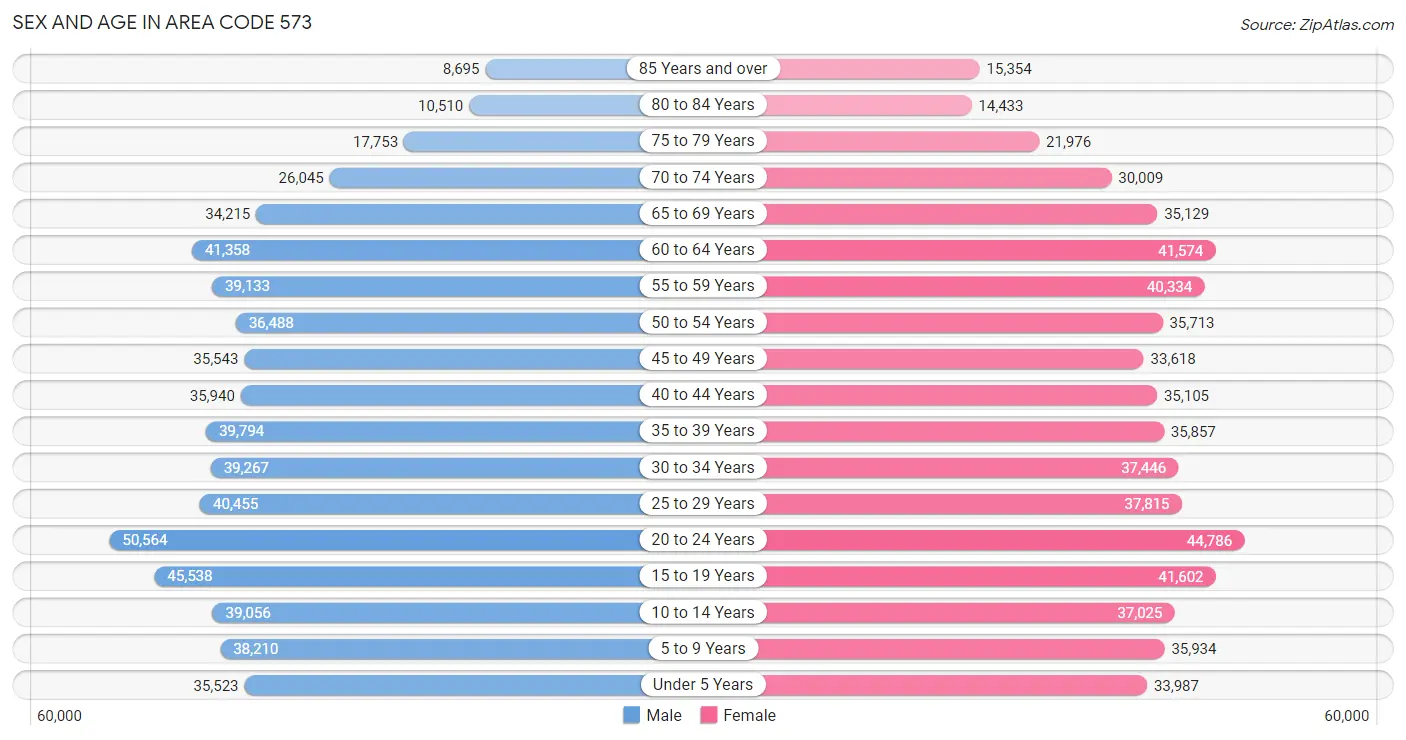
The most populous age groups in Area Code 573 are 20 to 24 Years (50,564 | 8.2%) for men and 20 to 24 Years (44,786 | 7.4%) for women.
| Age Bracket | Male | Female |
| Under 5 Years | 35,523 (5.8%) | 33,987 (5.6%) |
| 5 to 9 Years | 38,210 (6.2%) | 35,934 (5.9%) |
| 10 to 14 Years | 39,056 (6.4%) | 37,025 (6.1%) |
| 15 to 19 Years | 45,538 (7.4%) | 41,602 (6.9%) |
| 20 to 24 Years | 50,564 (8.2%) | 44,786 (7.4%) |
| 25 to 29 Years | 40,455 (6.6%) | 37,815 (6.2%) |
| 30 to 34 Years | 39,267 (6.4%) | 37,446 (6.2%) |
| 35 to 39 Years | 39,794 (6.5%) | 35,857 (5.9%) |
| 40 to 44 Years | 35,940 (5.9%) | 35,105 (5.8%) |
| 45 to 49 Years | 35,543 (5.8%) | 33,618 (5.5%) |
| 50 to 54 Years | 36,488 (5.9%) | 35,713 (5.9%) |
| 55 to 59 Years | 39,133 (6.4%) | 40,334 (6.6%) |
| 60 to 64 Years | 41,358 (6.7%) | 41,574 (6.8%) |
| 65 to 69 Years | 34,215 (5.6%) | 35,129 (5.8%) |
| 70 to 74 Years | 26,045 (4.2%) | 30,009 (4.9%) |
| 75 to 79 Years | 17,753 (2.9%) | 21,976 (3.6%) |
| 80 to 84 Years | 10,510 (1.7%) | 14,433 (2.4%) |
| 85 Years and over | 8,695 (1.4%) | 15,354 (2.5%) |
| Total | 614,087 (100.0%) | 607,697 (100.0%) |
Families and Households in Area Code 573
Median Family Size in Area Code 573
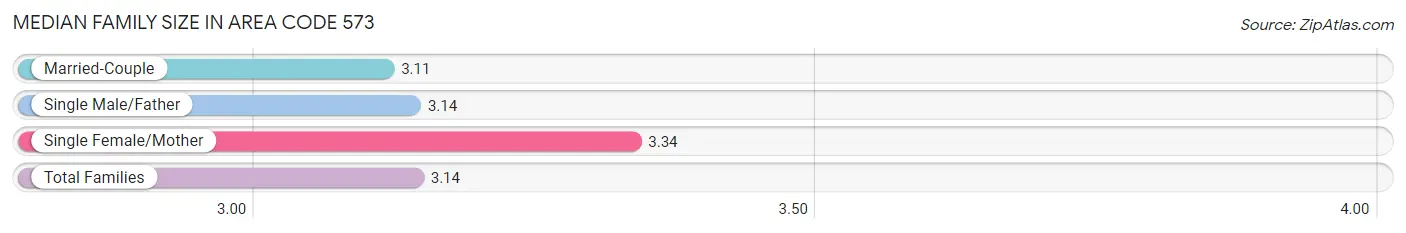
The median family size in Area Code 573 is 3.14 persons per family, with single female/mother families (48,420 | 16.2%) accounting for the largest median family size of 3.33519 persons per family. On the other hand, married-couple families (228,884 | 76.4%) represent the smallest median family size with 3.11 persons per family.
| Family Type | # Families | Family Size |
| Married-Couple | 228,884 (76.4%) | 3.11 |
| Single Male/Father | 22,229 (7.4%) | 3.14 |
| Single Female/Mother | 48,420 (16.2%) | 3.34 |
| Total Families | 299,533 (100.0%) | 3.14 |
Median Household Size in Area Code 573
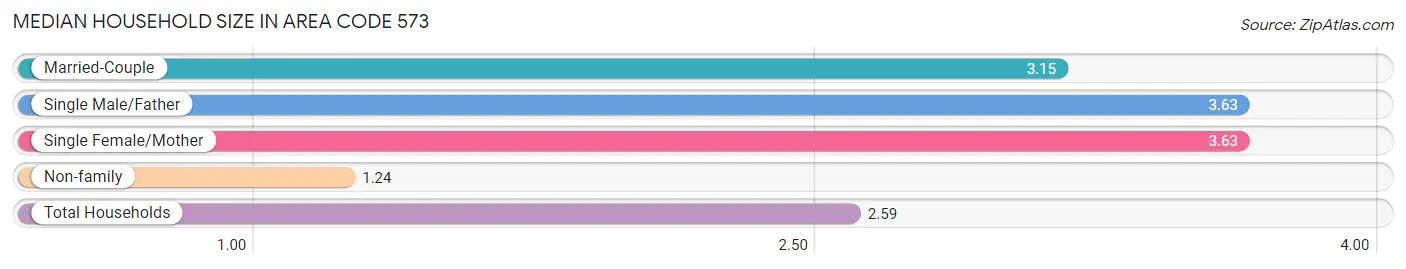
The median household size in Area Code 573 is 2.59 persons per household, with single female/mother households (48,420 | 10.3%) accounting for the largest median household size of 3.63334 persons per household. non-family households (168,638 | 36.0%) represent the smallest median household size with 1.24 persons per household.
| Household Type | # Households | Household Size |
| Married-Couple | 228,884 (48.9%) | 3.15 |
| Single Male/Father | 22,229 (4.8%) | 3.63 |
| Single Female/Mother | 48,420 (10.3%) | 3.63 |
| Non-family | 168,638 (36.0%) | 1.24 |
| Total Households | 468,171 (100.0%) | 2.59 |
Household Size by Marriage Status in Area Code 573
Out of a total of 468,171 households in Area Code 573, 299,533 (64.0%) are family households, while 168,638 (36.0%) are nonfamily households. The most numerous type of family households are 2-person households, comprising 144,791, and the most common type of nonfamily households are 1-person households, comprising 138,572.
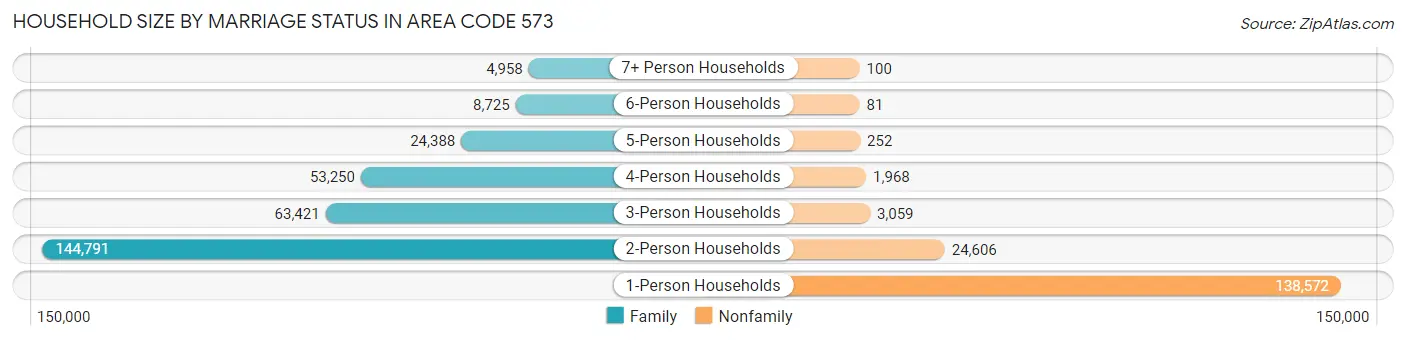
| Household Size | Family Households | Nonfamily Households |
| 1-Person Households | - | 138,572 (29.6%) |
| 2-Person Households | 144,791 (30.9%) | 24,606 (5.3%) |
| 3-Person Households | 63,421 (13.6%) | 3,059 (0.6%) |
| 4-Person Households | 53,250 (11.4%) | 1,968 (0.4%) |
| 5-Person Households | 24,388 (5.2%) | 252 (0.1%) |
| 6-Person Households | 8,725 (1.9%) | 81 (0.0%) |
| 7+ Person Households | 4,958 (1.1%) | 100 (0.0%) |
| Total | 299,533 (64.0%) | 168,638 (36.0%) |
Female Fertility in Area Code 573
Fertility by Age in Area Code 573
Average fertility rate in Area Code 573 is 74.4 births per 1,000 women. Women in the age bracket of 20 to 34 years have the highest fertility rate with 143.6 births per 1,000 women. Women in the age bracket of 20 to 34 years acount for 76.4% of all women with births.
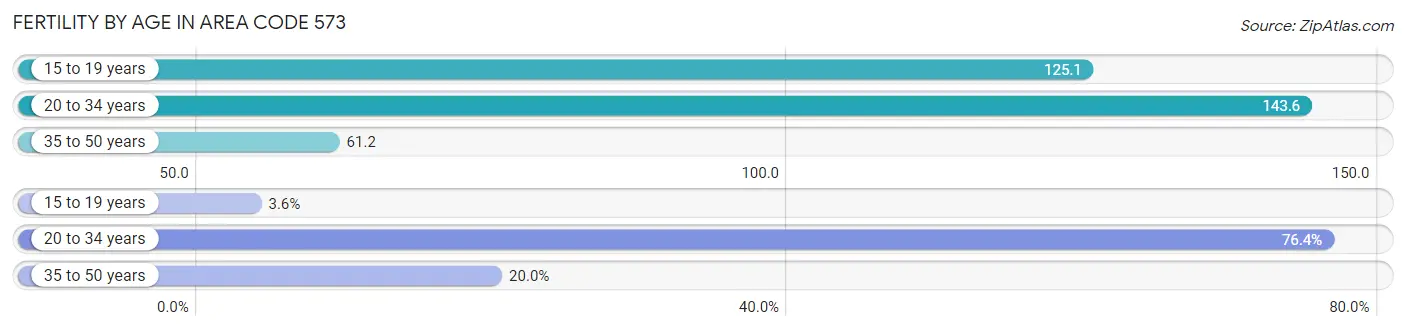
| Age Bracket | Women with Births | Births / 1,000 Women |
| 15 to 19 years | 566 (3.6%) | 125.1 |
| 20 to 34 years | 11,926 (76.4%) | 143.6 |
| 35 to 50 years | 3,115 (20.0%) | 61.2 |
| Total | 15,607 (100.0%) | 74.4 |
Fertility by Age by Marriage Status in Area Code 573
52.8% of women with births (15,607) in Area Code 573 are married. The highest percentage of unmarried women with births falls into 15 to 19 years age bracket with 100.0% of them unmarried at the time of birth, while the lowest percentage of unmarried women with births belong to 20 to 34 years age bracket with 51.5% of them unmarried.
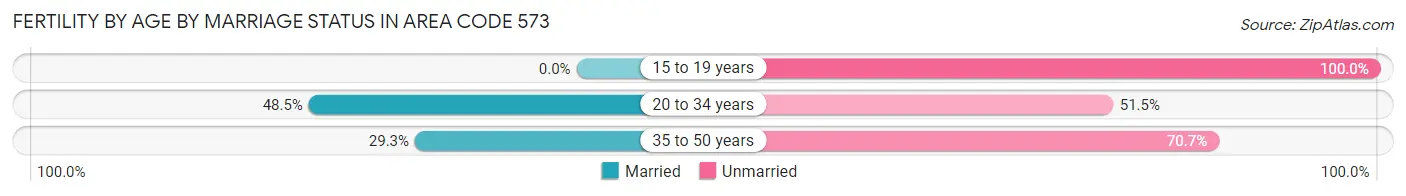
| Age Bracket | Married | Unmarried |
| 15 to 19 years | 0 (0.0%) | 566 (100.0%) |
| 20 to 34 years | 5,786 (48.5%) | 6,140 (51.5%) |
| 35 to 50 years | 912 (29.3%) | 2,203 (70.7%) |
| Total | 8,236 (52.8%) | 7,371 (47.2%) |
Fertility by Education in Area Code 573
Average fertility rate in Area Code 573 is 74.4 births per 1,000 women. Women with the education attainment of graduate degree have the highest fertility rate of 207.9 births per 1,000 women, while women with the education attainment of college or associate's degree have the lowest fertility at 103.9 births per 1,000 women. Women with the education attainment of college or associate's degree represent 34.7% of all women with births.
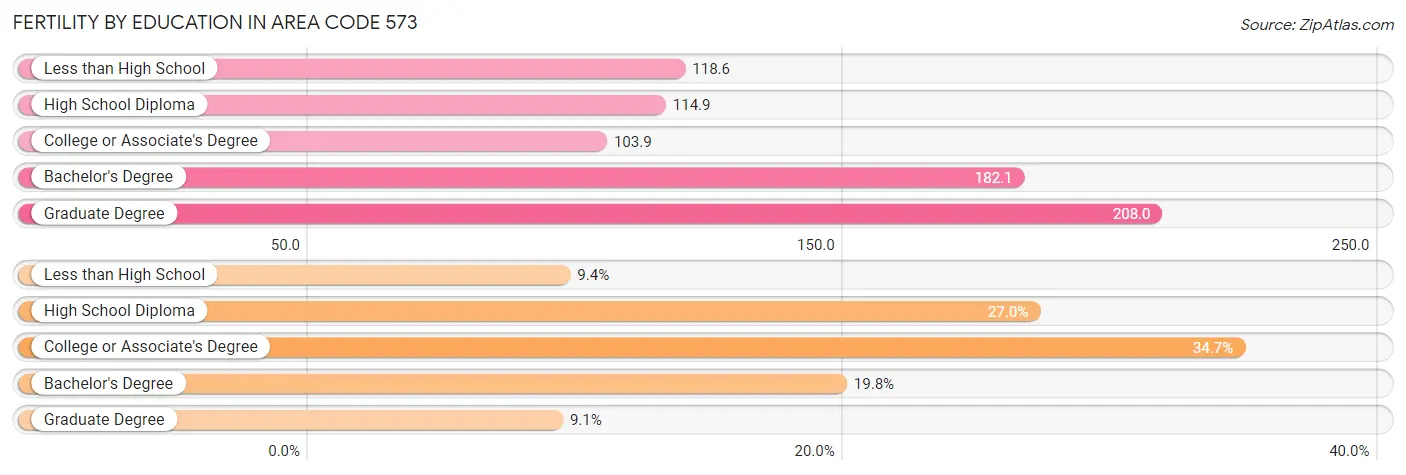
| Educational Attainment | Women with Births | Births / 1,000 Women |
| Less than High School | 1,468 (9.4%) | 118.6 |
| High School Diploma | 4,215 (27.0%) | 114.9 |
| College or Associate's Degree | 5,414 (34.7%) | 103.9 |
| Bachelor's Degree | 3,085 (19.8%) | 182.1 |
| Graduate Degree | 1,425 (9.1%) | 207.9 |
| Total | 15,607 (100.0%) | 74.4 |
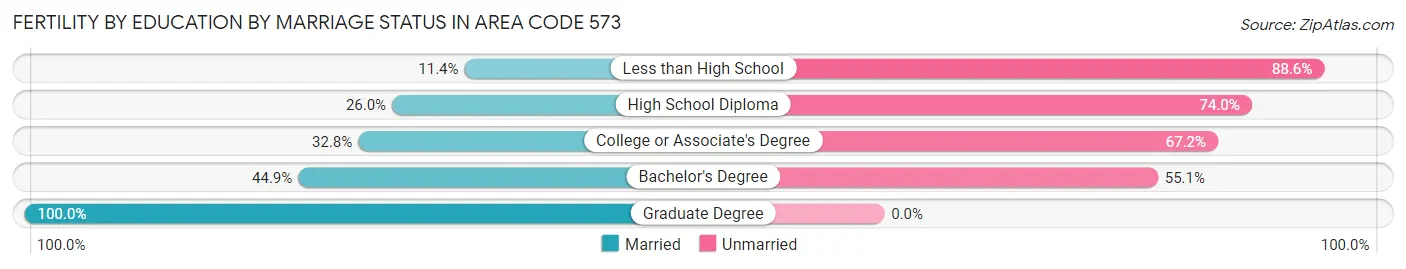
Fertility by Education by Marriage Status in Area Code 573
47.2% of women with births in Area Code 573 are unmarried. Women with the educational attainment of graduate degree are most likely to be married with 100.0% of them married at childbirth, while women with the educational attainment of less than high school are least likely to be married with 88.6% of them unmarried at childbirth.
| Educational Attainment | Married | Unmarried |
| Less than High School | 167 (11.4%) | 1,301 (88.6%) |
| High School Diploma | 1,095 (26.0%) | 3,120 (74.0%) |
| College or Associate's Degree | 1,775 (32.8%) | 3,639 (67.2%) |
| Bachelor's Degree | 1,385 (44.9%) | 1,700 (55.1%) |
| Graduate Degree | 1,425 (100.0%) | 0 (0.0%) |
| Total | 8,236 (52.8%) | 7,371 (47.2%) |
Employment Characteristics in Area Code 573
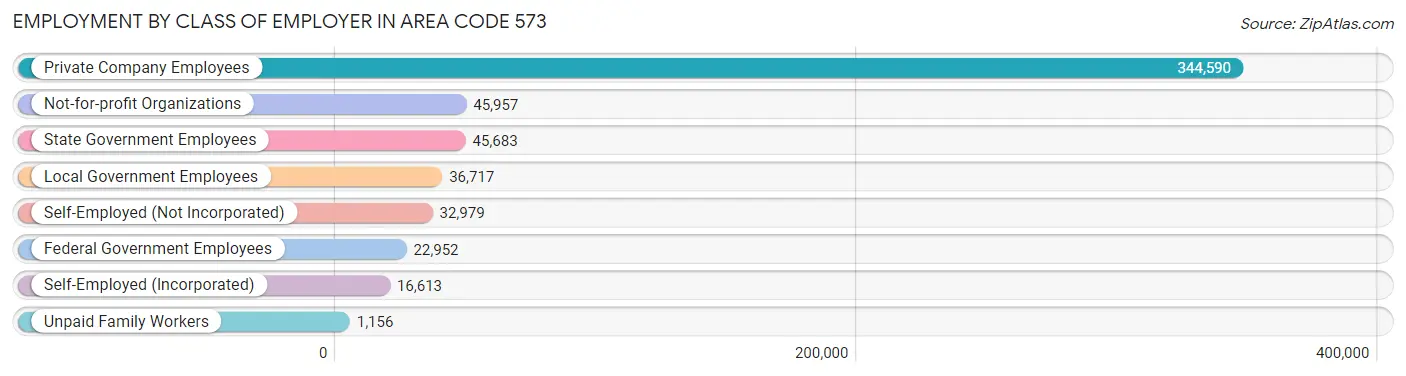
Employment by Class of Employer in Area Code 573
Among the 546,647 employed individuals in Area Code 573, private company employees (344,590 | 63.0%), not-for-profit organizations (45,957 | 8.4%), and state government employees (45,683 | 8.4%) make up the most common classes of employment.
| Employer Class | # Employees | % Employees |
| Private Company Employees | 344,590 | 63.0% |
| Self-Employed (Incorporated) | 16,613 | 3.0% |
| Self-Employed (Not Incorporated) | 32,979 | 6.0% |
| Not-for-profit Organizations | 45,957 | 8.4% |
| Local Government Employees | 36,717 | 6.7% |
| State Government Employees | 45,683 | 8.4% |
| Federal Government Employees | 22,952 | 4.2% |
| Unpaid Family Workers | 1,156 | 0.2% |
| Total | 546,647 | 100.0% |
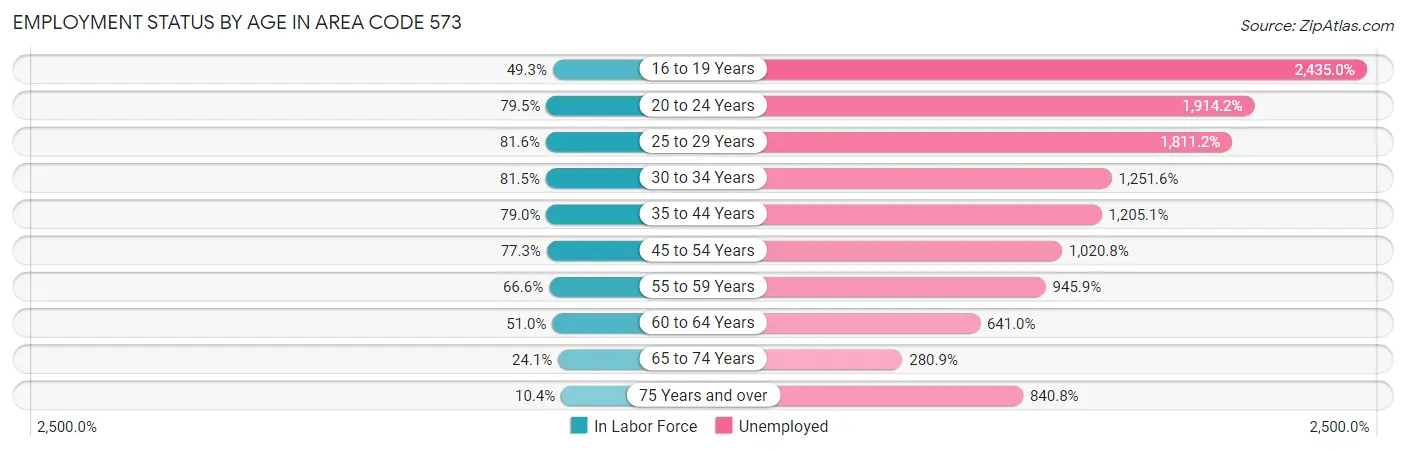
Employment Status by Age in Area Code 573
According to the labor force statistics for Area Code 573, out of the total population over 16 years of age (986,685), 55.9% or 552,050 individuals are in the labor force, with 6.2% or 34,503 of them unemployed. The age group with the highest labor force participation rate is 25 to 29 years, with 81.6% or 63,860 individuals in the labor force. Within the labor force, the 16 to 19 years age range has the highest percentage of unemployed individuals, with 2,435.0% or 861,284 of them being unemployed.
| Age Bracket | In Labor Force | Unemployed |
| 16 to 19 Years | 35,373 (49.3%) | 861,284 (2,435.0%) |
| 20 to 24 Years | 75,767 (79.5%) | 1,450,294 (1,914.2%) |
| 25 to 29 Years | 63,863 (81.6%) | 1,156,632 (1,811.2%) |
| 30 to 34 Years | 62,549 (81.5%) | 782,901 (1,251.6%) |
| 35 to 44 Years | 115,829 (79.0%) | 1,395,879 (1,205.1%) |
| 45 to 54 Years | 109,317 (77.3%) | 1,115,888 (1,020.8%) |
| 55 to 59 Years | 52,915 (66.6%) | 500,542 (945.9%) |
| 60 to 64 Years | 42,314 (51.0%) | 271,220 (641.0%) |
| 65 to 74 Years | 30,269 (24.1%) | 85,031 (280.9%) |
| 75 Years and over | 9,191 (10.4%) | 77,278 (840.8%) |
| Total | 552,069 (55.9%) | 34,481 (6.2%) |
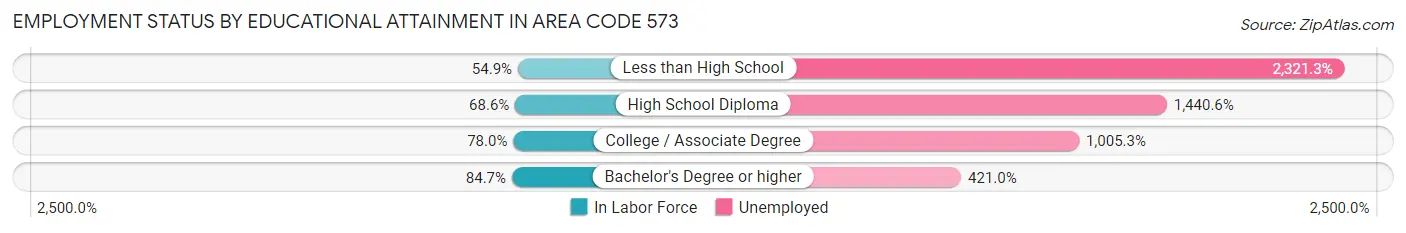
Employment Status by Educational Attainment in Area Code 573
According to labor force statistics for Area Code 573, 72.0% of individuals (436,159) out of the total population between 25 and 64 years of age (605,440) are in the labor force, with 1,353.7% or 5,904,284 of them being unemployed. The group with the highest labor force participation rate are those with the educational attainment of bachelor's degree or higher, with 84.7% or 132,509 individuals in the labor force. Within the labor force, individuals with less than high school education have the highest percentage of unemployment, with 2,321.3% or 764,915 of them being unemployed.
| Educational Attainment | In Labor Force | Unemployed |
| Less than High School | 32,950 (54.9%) | 1,393,291 (2,321.3%) |
| High School Diploma | 143,956 (68.6%) | 3,022,825 (1,440.6%) |
| College / Associate Degree | 139,650 (77.9%) | 1,801,095 (1,005.3%) |
| Bachelor's Degree or higher | 132,509 (84.7%) | 658,558 (421.0%) |
| Total | 436,172 (72.0%) | 8,195,841 (1,353.7%) |
Employment Occupations by Sex in Area Code 573
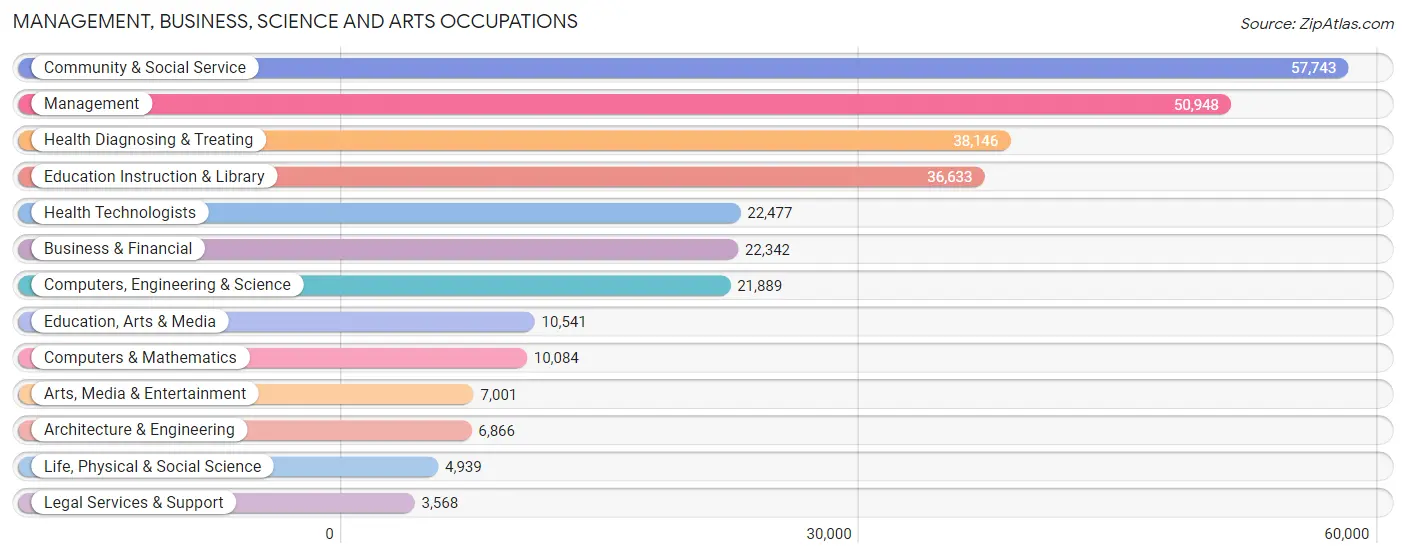
Management, Business, Science and Arts Occupations
The most common Management, Business, Science and Arts occupations in Area Code 573 are Community & Social Service (57,743 | 10.6%), Management (50,948 | 9.3%), Health Diagnosing & Treating (38,146 | 7.0%), Education Instruction & Library (36,633 | 6.7%), and Health Technologists (22,477 | 4.1%).
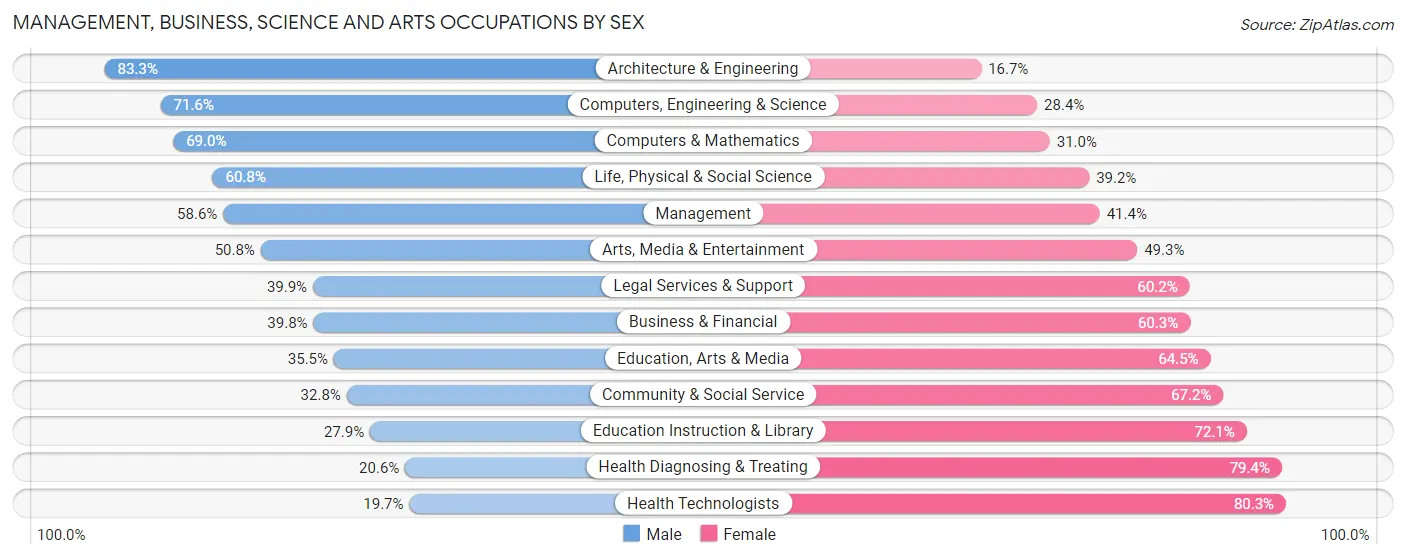
Management, Business, Science and Arts Occupations by Sex
Within the Management, Business, Science and Arts occupations in Area Code 573, the most male-oriented occupations are Architecture & Engineering (83.3%), Computers, Engineering & Science (71.6%), and Computers & Mathematics (69.0%), while the most female-oriented occupations are Health Technologists (80.3%), Health Diagnosing & Treating (79.4%), and Education Instruction & Library (72.1%).
| Occupation | Male | Female |
| Management | 29,844 (58.6%) | 21,104 (41.4%) |
| Business & Financial | 8,882 (39.8%) | 13,460 (60.3%) |
| Computers, Engineering & Science | 15,679 (71.6%) | 6,210 (28.4%) |
| Computers & Mathematics | 6,957 (69.0%) | 3,127 (31.0%) |
| Architecture & Engineering | 5,720 (83.3%) | 1,146 (16.7%) |
| Life, Physical & Social Science | 3,002 (60.8%) | 1,937 (39.2%) |
| Community & Social Service | 18,950 (32.8%) | 38,793 (67.2%) |
| Education, Arts & Media | 3,741 (35.5%) | 6,800 (64.5%) |
| Legal Services & Support | 1,422 (39.9%) | 2,146 (60.2%) |
| Education Instruction & Library | 10,234 (27.9%) | 26,399 (72.1%) |
| Arts, Media & Entertainment | 3,553 (50.7%) | 3,448 (49.2%) |
| Health Diagnosing & Treating | 7,866 (20.6%) | 30,280 (79.4%) |
| Health Technologists | 4,437 (19.7%) | 18,040 (80.3%) |
| Total (Category) | 81,221 (42.5%) | 109,847 (57.5%) |
| Total (Overall) | 283,843 (51.9%) | 262,516 (48.0%) |
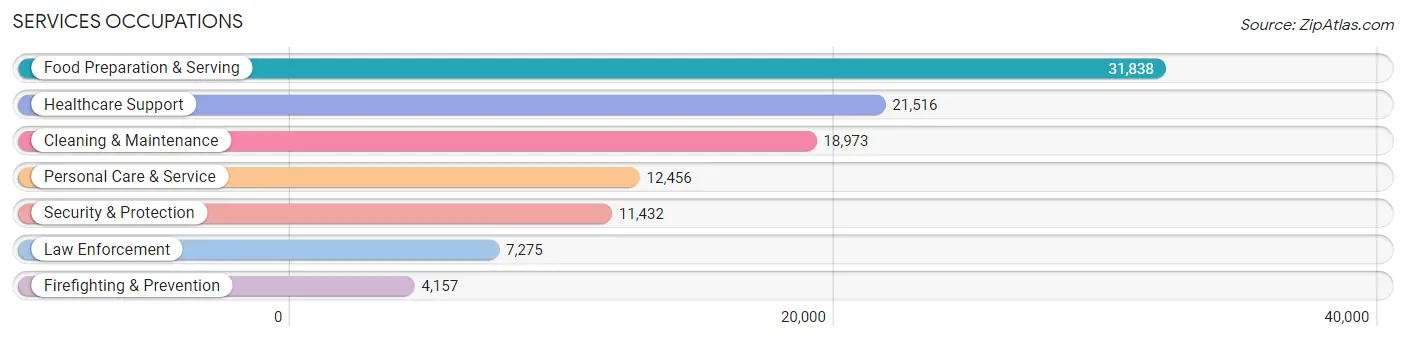
Services Occupations
The most common Services occupations in Area Code 573 are Food Preparation & Serving (31,838 | 5.8%), Healthcare Support (21,516 | 3.9%), Cleaning & Maintenance (18,973 | 3.5%), Personal Care & Service (12,456 | 2.3%), and Security & Protection (11,432 | 2.1%).
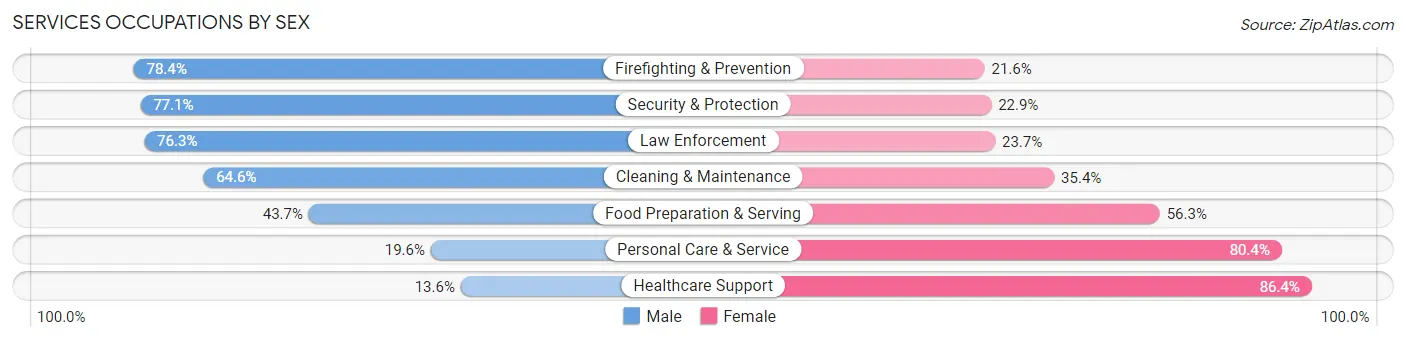
Services Occupations by Sex
Within the Services occupations in Area Code 573, the most male-oriented occupations are Firefighting & Prevention (78.4%), Security & Protection (77.1%), and Law Enforcement (76.3%), while the most female-oriented occupations are Healthcare Support (86.4%), Personal Care & Service (80.4%), and Food Preparation & Serving (56.3%).
| Occupation | Male | Female |
| Healthcare Support | 2,934 (13.6%) | 18,582 (86.4%) |
| Security & Protection | 8,814 (77.1%) | 2,618 (22.9%) |
| Firefighting & Prevention | 3,260 (78.4%) | 897 (21.6%) |
| Law Enforcement | 5,554 (76.3%) | 1,721 (23.7%) |
| Food Preparation & Serving | 13,923 (43.7%) | 17,915 (56.3%) |
| Cleaning & Maintenance | 12,262 (64.6%) | 6,711 (35.4%) |
| Personal Care & Service | 2,438 (19.6%) | 10,018 (80.4%) |
| Total (Category) | 40,371 (42.0%) | 55,844 (58.0%) |
| Total (Overall) | 283,843 (51.9%) | 262,516 (48.0%) |
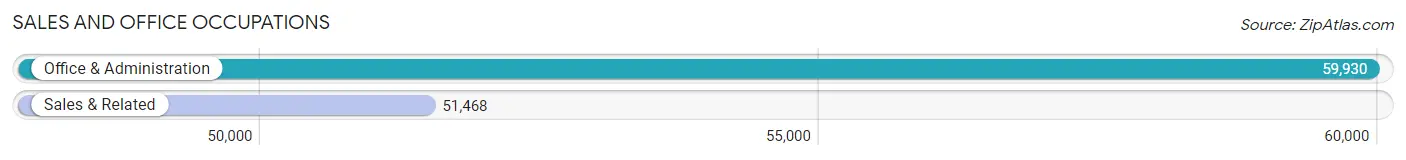
Sales and Office Occupations
The most common Sales and Office occupations in Area Code 573 are Office & Administration (59,930 | 11.0%), and Sales & Related (51,468 | 9.4%).
Sales and Office Occupations by Sex
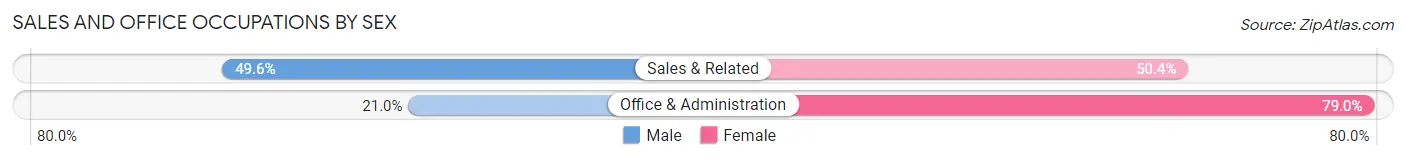
| Occupation | Male | Female |
| Sales & Related | 25,524 (49.6%) | 25,944 (50.4%) |
| Office & Administration | 12,563 (21.0%) | 47,367 (79.0%) |
| Total (Category) | 38,087 (34.2%) | 73,311 (65.8%) |
| Total (Overall) | 283,843 (51.9%) | 262,516 (48.0%) |
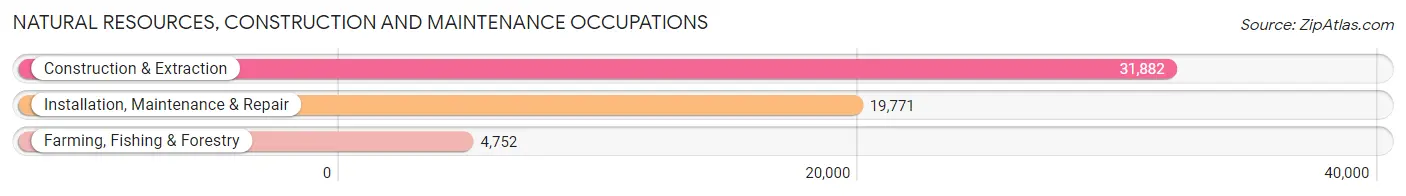
Natural Resources, Construction and Maintenance Occupations
The most common Natural Resources, Construction and Maintenance occupations in Area Code 573 are Construction & Extraction (31,882 | 5.8%), Installation, Maintenance & Repair (19,771 | 3.6%), and Farming, Fishing & Forestry (4,752 | 0.9%).
Natural Resources, Construction and Maintenance Occupations by Sex
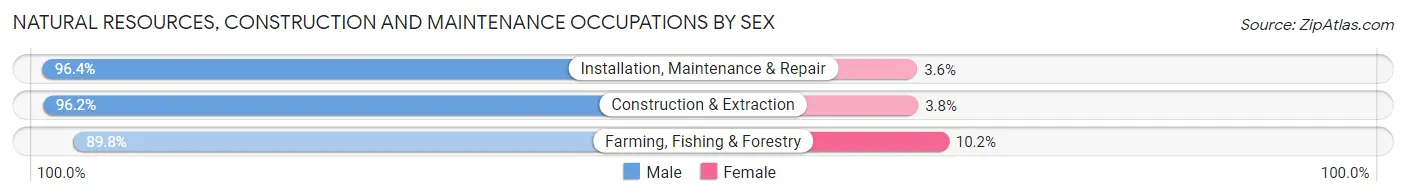
| Occupation | Male | Female |
| Farming, Fishing & Forestry | 4,269 (89.8%) | 483 (10.2%) |
| Construction & Extraction | 30,671 (96.2%) | 1,211 (3.8%) |
| Installation, Maintenance & Repair | 19,057 (96.4%) | 714 (3.6%) |
| Total (Category) | 53,997 (95.7%) | 2,408 (4.3%) |
| Total (Overall) | 283,843 (51.9%) | 262,516 (48.0%) |
Production, Transportation and Moving Occupations
The most common Production, Transportation and Moving occupations in Area Code 573 are Production (41,950 | 7.7%), Material Moving (26,112 | 4.8%), and Transportation (23,211 | 4.3%).
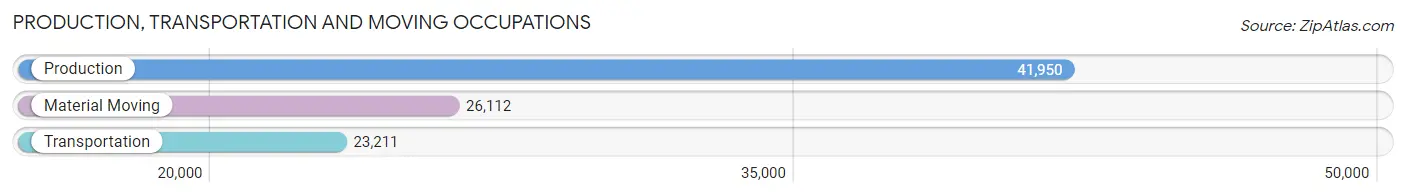
Production, Transportation and Moving Occupations by Sex
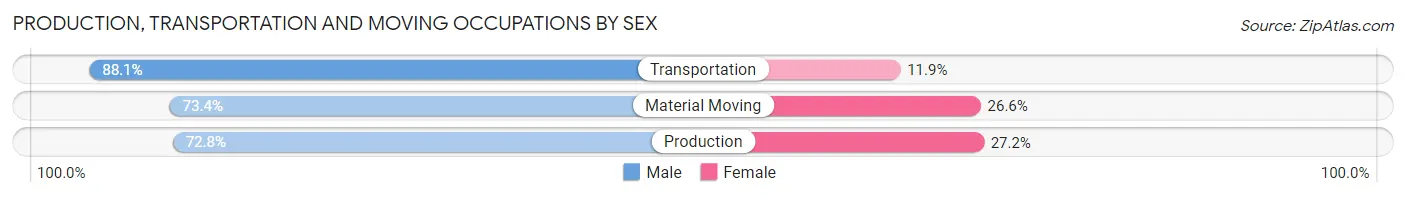
| Occupation | Male | Female |
| Production | 30,549 (72.8%) | 11,401 (27.2%) |
| Transportation | 20,457 (88.1%) | 2,754 (11.9%) |
| Material Moving | 19,161 (73.4%) | 6,951 (26.6%) |
| Total (Category) | 70,167 (76.9%) | 21,106 (23.1%) |
| Total (Overall) | 283,843 (51.9%) | 262,516 (48.0%) |
Employment Industries by Sex in Area Code 573
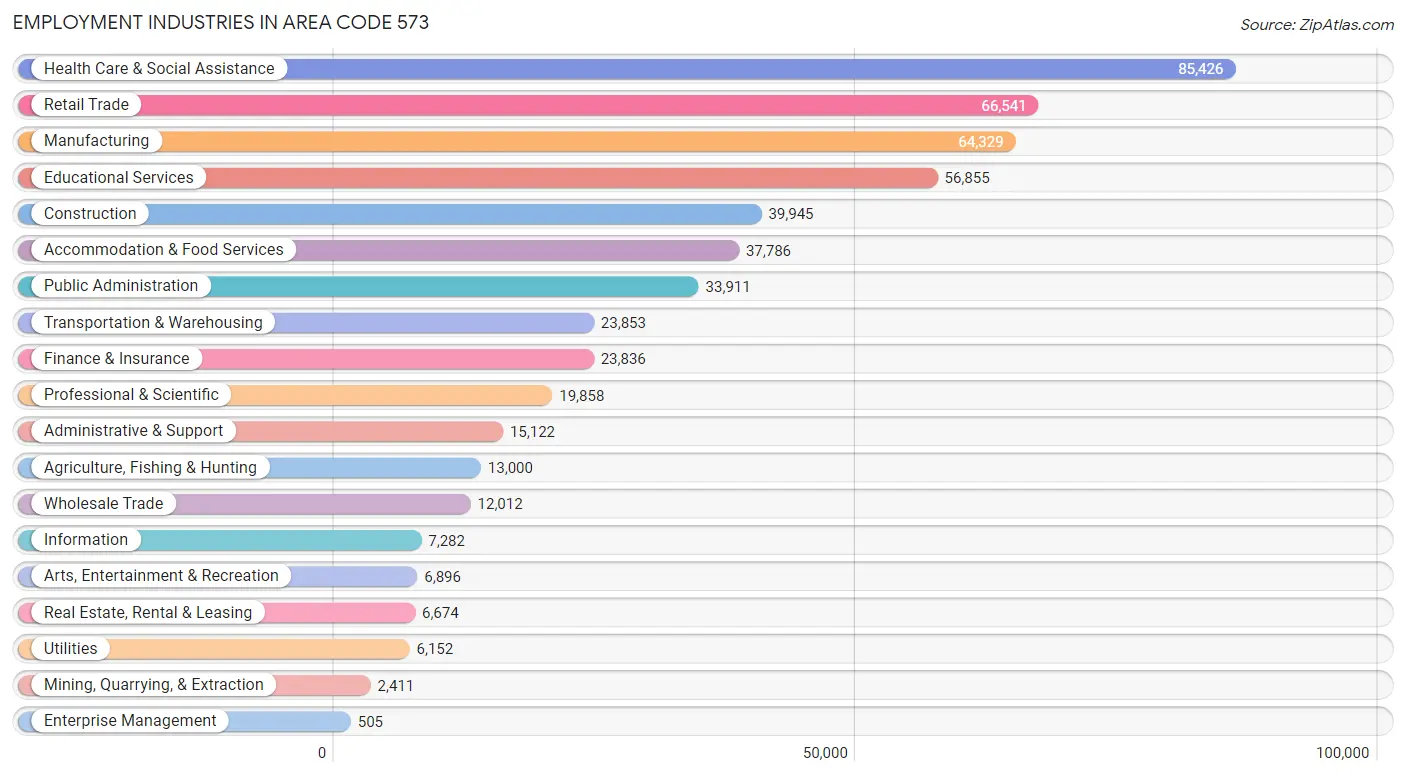
Employment Industries in Area Code 573
The major employment industries in Area Code 573 include Health Care & Social Assistance (85,426 | 15.6%), Retail Trade (66,541 | 12.2%), Manufacturing (64,329 | 11.8%), Educational Services (56,855 | 10.4%), and Construction (39,945 | 7.3%).
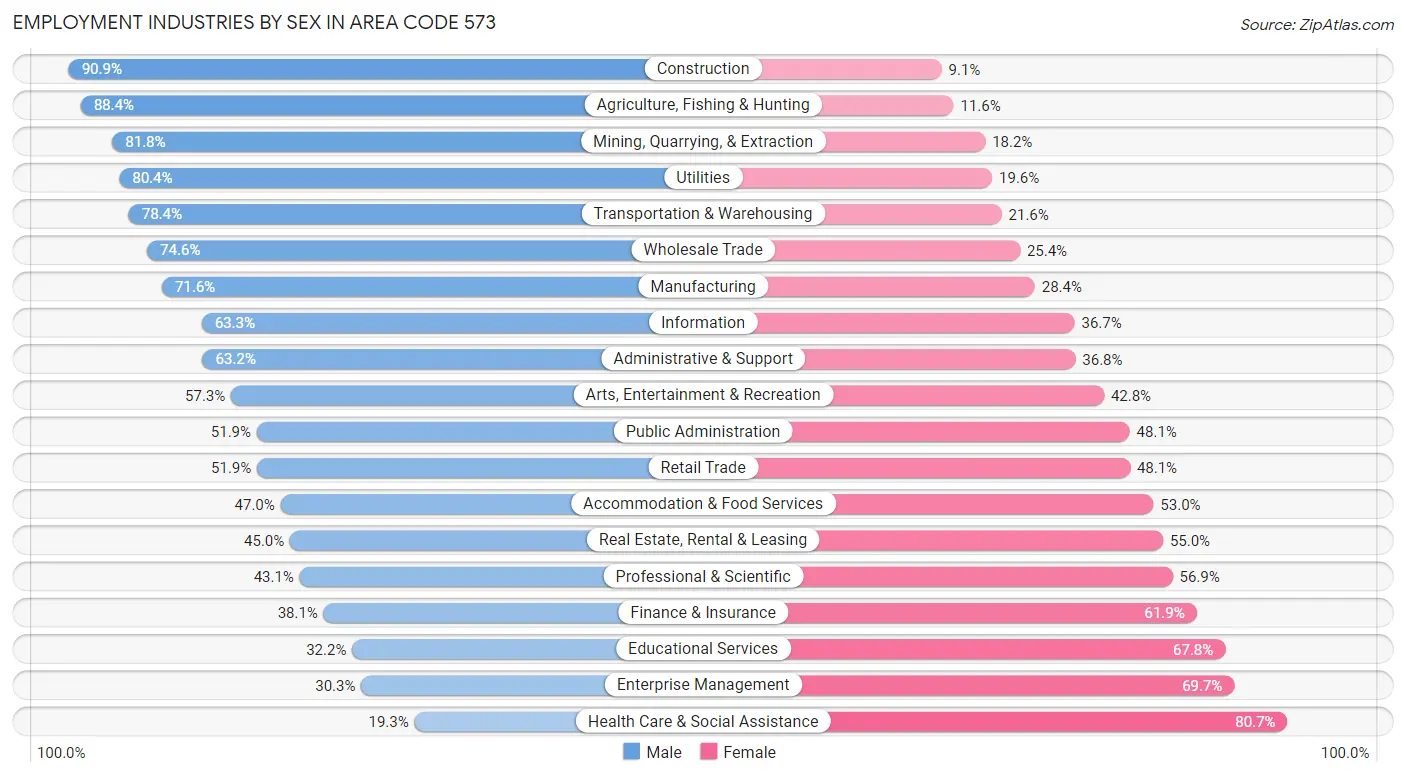
Employment Industries by Sex in Area Code 573
The Area Code 573 industries that see more men than women are Construction (90.9%), Agriculture, Fishing & Hunting (88.4%), and Mining, Quarrying, & Extraction (81.8%), whereas the industries that tend to have a higher number of women are Health Care & Social Assistance (80.7%), Enterprise Management (69.7%), and Educational Services (67.8%).
| Industry | Male | Female |
| Agriculture, Fishing & Hunting | 11,490 (88.4%) | 1,510 (11.6%) |
| Mining, Quarrying, & Extraction | 1,973 (81.8%) | 438 (18.2%) |
| Construction | 36,293 (90.9%) | 3,652 (9.1%) |
| Manufacturing | 46,035 (71.6%) | 18,294 (28.4%) |
| Wholesale Trade | 8,966 (74.6%) | 3,046 (25.4%) |
| Retail Trade | 34,518 (51.9%) | 32,023 (48.1%) |
| Transportation & Warehousing | 18,707 (78.4%) | 5,146 (21.6%) |
| Utilities | 4,946 (80.4%) | 1,206 (19.6%) |
| Information | 4,612 (63.3%) | 2,670 (36.7%) |
| Finance & Insurance | 9,079 (38.1%) | 14,757 (61.9%) |
| Real Estate, Rental & Leasing | 3,006 (45.0%) | 3,668 (55.0%) |
| Professional & Scientific | 8,551 (43.1%) | 11,307 (56.9%) |
| Enterprise Management | 153 (30.3%) | 352 (69.7%) |
| Administrative & Support | 9,552 (63.2%) | 5,570 (36.8%) |
| Educational Services | 18,297 (32.2%) | 38,558 (67.8%) |
| Health Care & Social Assistance | 16,472 (19.3%) | 68,954 (80.7%) |
| Arts, Entertainment & Recreation | 3,948 (57.3%) | 2,948 (42.7%) |
| Accommodation & Food Services | 17,764 (47.0%) | 20,022 (53.0%) |
| Public Administration | 17,610 (51.9%) | 16,301 (48.1%) |
| Total | 283,843 (51.9%) | 262,516 (48.0%) |
Education in Area Code 573
School Enrollment in Area Code 573
The most common levels of schooling among the 292,653 students in Area Code 573 are college / undergraduate (68,351 | 23.4%), high school (61,758 | 21.1%), and middle school (59,908 | 20.5%).
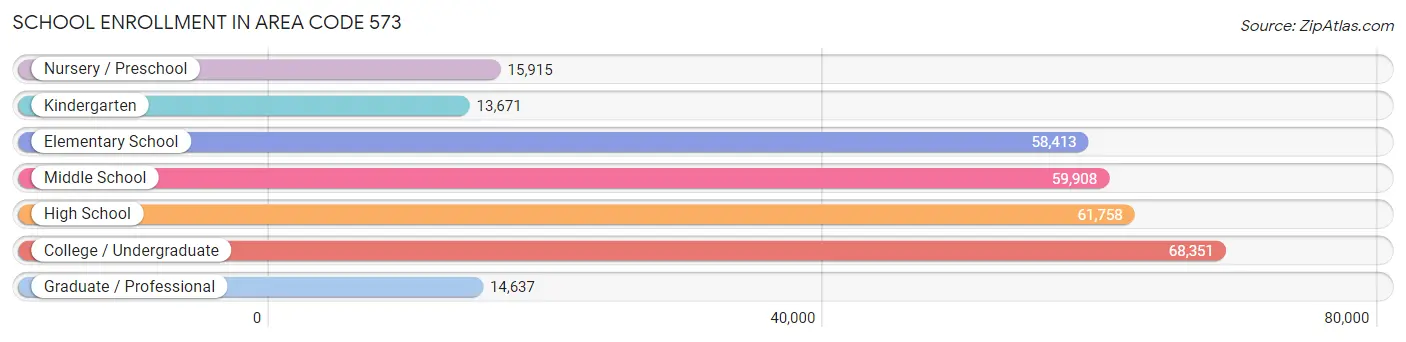
| School Level | # Students | % Students |
| Nursery / Preschool | 15,915 | 5.4% |
| Kindergarten | 13,671 | 4.7% |
| Elementary School | 58,413 | 20.0% |
| Middle School | 59,908 | 20.5% |
| High School | 61,758 | 21.1% |
| College / Undergraduate | 68,351 | 23.4% |
| Graduate / Professional | 14,637 | 5.0% |
| Total | 292,653 | 100.0% |
School Enrollment by Age by Funding Source in Area Code 573
Out of a total of 292,653 students who are enrolled in schools in Area Code 573, 40,583 (13.9%) attend a private institution, while the remaining 252,070 (86.1%) are enrolled in public schools. The age group of 3 to 4 year olds has the highest likelihood of being enrolled in private schools, with 3,443 (31.7% in the age bracket) enrolled. Conversely, the age group of 15 to 17 year olds has the lowest likelihood of being enrolled in a private school, with 39,895 (89.7% in the age bracket) attending a public institution.
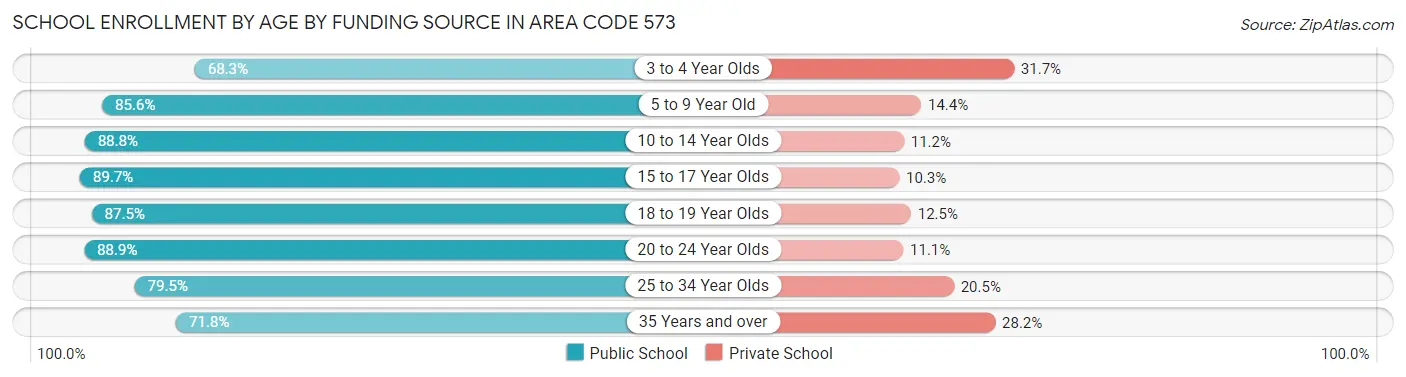
| Age Bracket | Public School | Private School |
| 3 to 4 Year Olds | 7,415 (68.3%) | 3,443 (31.7%) |
| 5 to 9 Year Old | 58,633 (85.6%) | 9,877 (14.4%) |
| 10 to 14 Year Olds | 65,634 (88.8%) | 8,278 (11.2%) |
| 15 to 17 Year Olds | 39,895 (89.7%) | 4,585 (10.3%) |
| 18 to 19 Year Olds | 24,696 (87.5%) | 3,529 (12.5%) |
| 20 to 24 Year Olds | 35,494 (88.9%) | 4,420 (11.1%) |
| 25 to 34 Year Olds | 11,418 (79.5%) | 2,945 (20.5%) |
| 35 Years and over | 8,896 (71.8%) | 3,495 (28.2%) |
| Total | 252,070 (86.1%) | 40,583 (13.9%) |
Educational Attainment by Field of Study in Area Code 573
Education (40,026 | 18.2%), business (39,415 | 18.0%), science & technology (25,262 | 11.5%), bio, nature & agricultural (20,423 | 9.3%), and arts & humanities (15,768 | 7.2%) are the most common fields of study among 219,298 individuals in Area Code 573 who have obtained a bachelor's degree or higher.
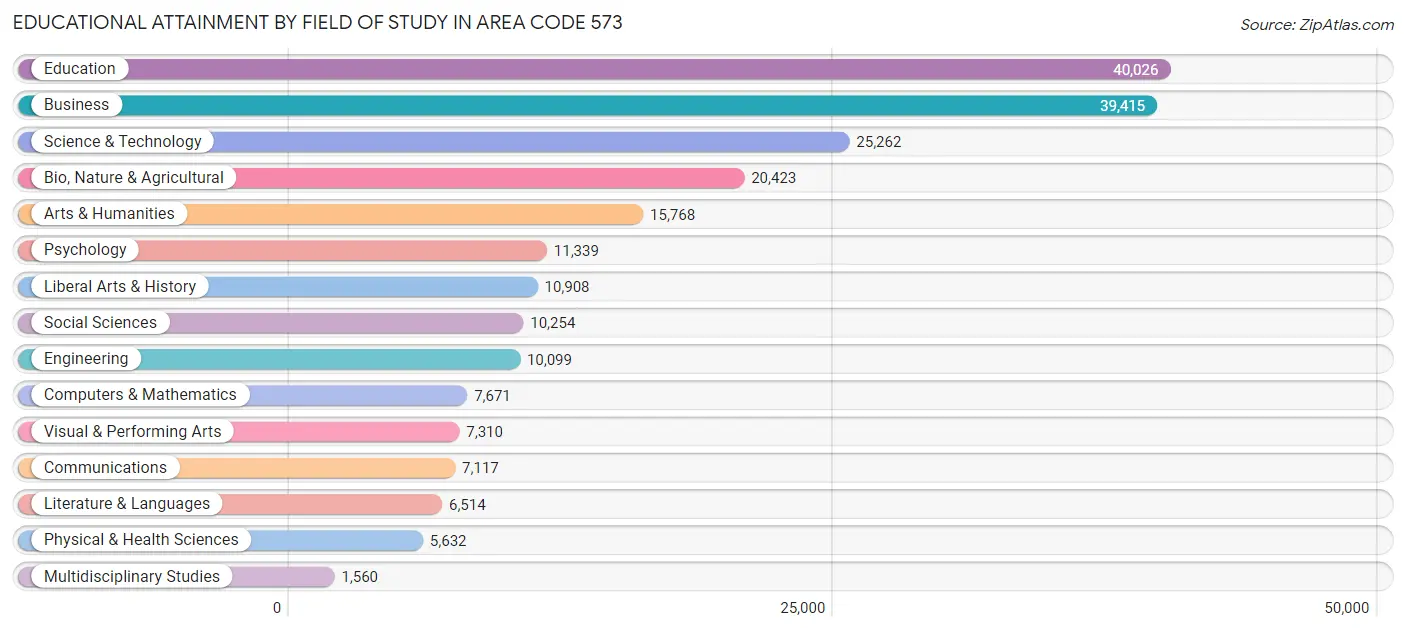
| Field of Study | # Graduates | % Graduates |
| Computers & Mathematics | 7,671 | 3.5% |
| Bio, Nature & Agricultural | 20,423 | 9.3% |
| Physical & Health Sciences | 5,632 | 2.6% |
| Psychology | 11,339 | 5.2% |
| Social Sciences | 10,254 | 4.7% |
| Engineering | 10,099 | 4.6% |
| Multidisciplinary Studies | 1,560 | 0.7% |
| Science & Technology | 25,262 | 11.5% |
| Business | 39,415 | 18.0% |
| Education | 40,026 | 18.2% |
| Literature & Languages | 6,514 | 3.0% |
| Liberal Arts & History | 10,908 | 5.0% |
| Visual & Performing Arts | 7,310 | 3.3% |
| Communications | 7,117 | 3.3% |
| Arts & Humanities | 15,768 | 7.2% |
| Total | 219,298 | 100.0% |
Transportation & Commute in Area Code 573
Vehicle Availability by Sex in Area Code 573
The most prevalent vehicle ownership categories in Area Code 573 are males with 2 vehicles (111,528, accounting for 39.9%) and females with 2 vehicles (99,077, making up 43.5%).
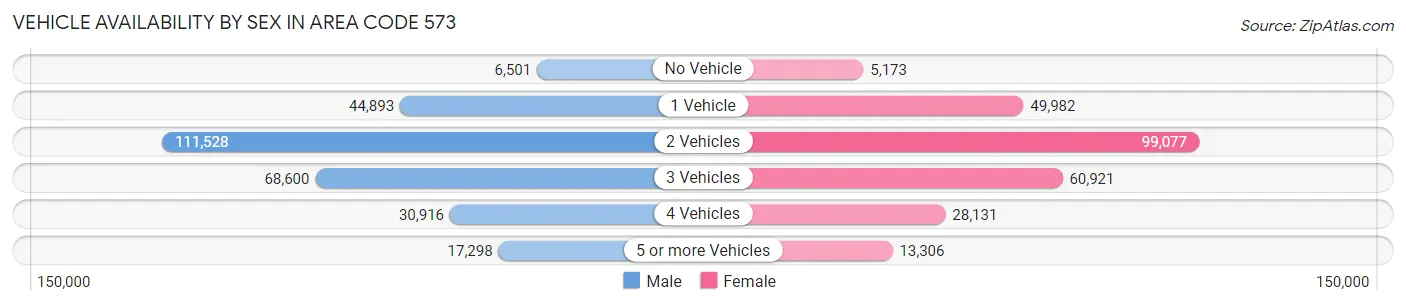
| Vehicles Available | Male | Female |
| No Vehicle | 6,501 (2.3%) | 5,173 (2.0%) |
| 1 Vehicle | 44,893 (16.1%) | 49,982 (19.5%) |
| 2 Vehicles | 111,528 (39.9%) | 99,077 (38.6%) |
| 3 Vehicles | 68,600 (24.5%) | 60,921 (23.7%) |
| 4 Vehicles | 30,916 (11.1%) | 28,131 (11.0%) |
| 5 or more Vehicles | 17,298 (6.2%) | 13,306 (5.2%) |
| Total | 279,736 (100.0%) | 256,590 (100.0%) |
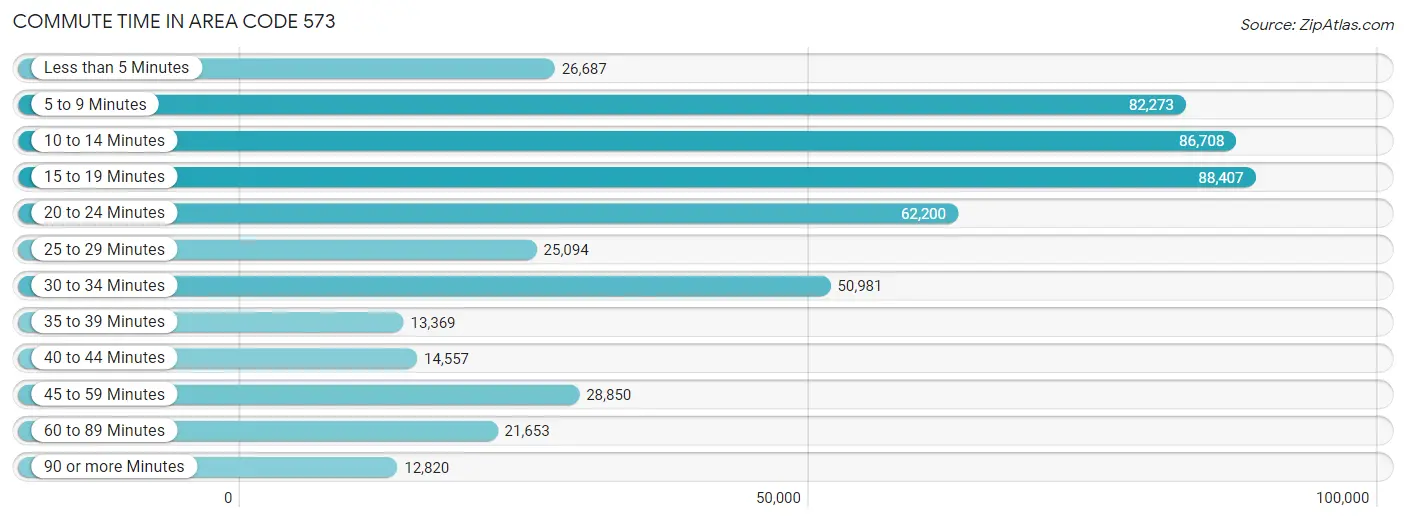
Commute Time in Area Code 573
The most frequently occuring commute durations in Area Code 573 are 15 to 19 minutes (88,407 commuters, 17.2%), 10 to 14 minutes (86,708 commuters, 16.9%), and 5 to 9 minutes (82,273 commuters, 16.0%).
| Commute Time | # Commuters | % Commuters |
| Less than 5 Minutes | 26,687 | 5.2% |
| 5 to 9 Minutes | 82,273 | 16.0% |
| 10 to 14 Minutes | 86,708 | 16.9% |
| 15 to 19 Minutes | 88,407 | 17.2% |
| 20 to 24 Minutes | 62,200 | 12.1% |
| 25 to 29 Minutes | 25,094 | 4.9% |
| 30 to 34 Minutes | 50,981 | 9.9% |
| 35 to 39 Minutes | 13,369 | 2.6% |
| 40 to 44 Minutes | 14,557 | 2.8% |
| 45 to 59 Minutes | 28,850 | 5.6% |
| 60 to 89 Minutes | 21,653 | 4.2% |
| 90 or more Minutes | 12,820 | 2.5% |
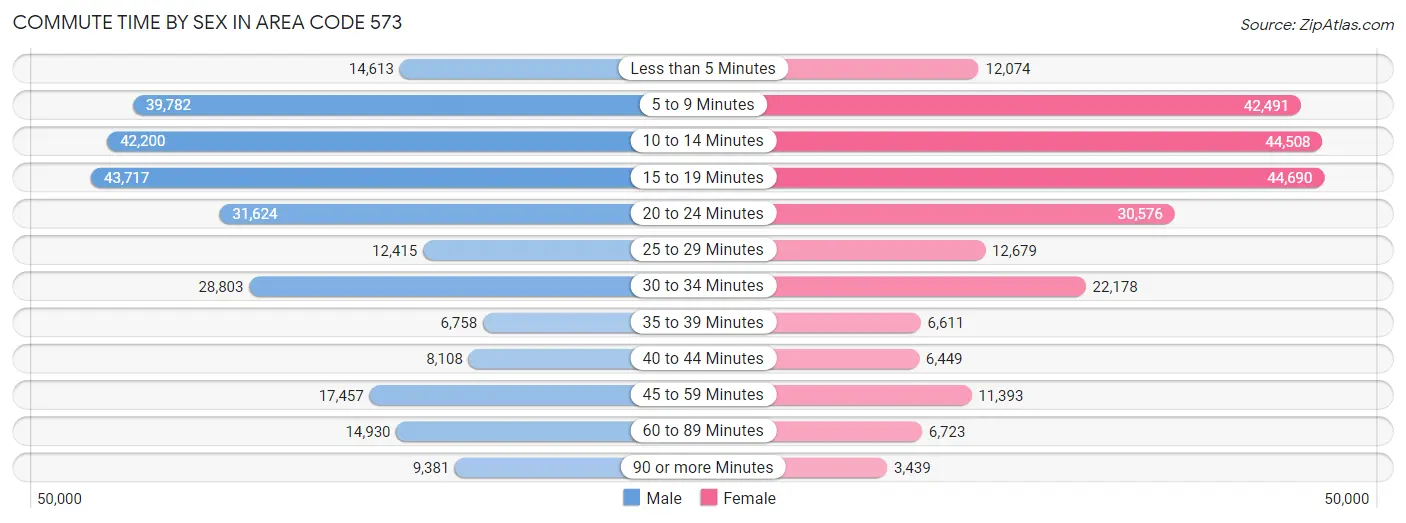
Commute Time by Sex in Area Code 573
The most common commute times in Area Code 573 are 15 to 19 minutes (43,717 commuters, 16.2%) for males and 15 to 19 minutes (44,690 commuters, 18.3%) for females.
| Commute Time | Male | Female |
| Less than 5 Minutes | 14,613 (5.4%) | 12,074 (5.0%) |
| 5 to 9 Minutes | 39,782 (14.7%) | 42,491 (17.4%) |
| 10 to 14 Minutes | 42,200 (15.6%) | 44,508 (18.3%) |
| 15 to 19 Minutes | 43,717 (16.2%) | 44,690 (18.3%) |
| 20 to 24 Minutes | 31,624 (11.7%) | 30,576 (12.5%) |
| 25 to 29 Minutes | 12,415 (4.6%) | 12,679 (5.2%) |
| 30 to 34 Minutes | 28,803 (10.7%) | 22,178 (9.1%) |
| 35 to 39 Minutes | 6,758 (2.5%) | 6,611 (2.7%) |
| 40 to 44 Minutes | 8,108 (3.0%) | 6,449 (2.6%) |
| 45 to 59 Minutes | 17,457 (6.5%) | 11,393 (4.7%) |
| 60 to 89 Minutes | 14,930 (5.5%) | 6,723 (2.8%) |
| 90 or more Minutes | 9,381 (3.5%) | 3,439 (1.4%) |
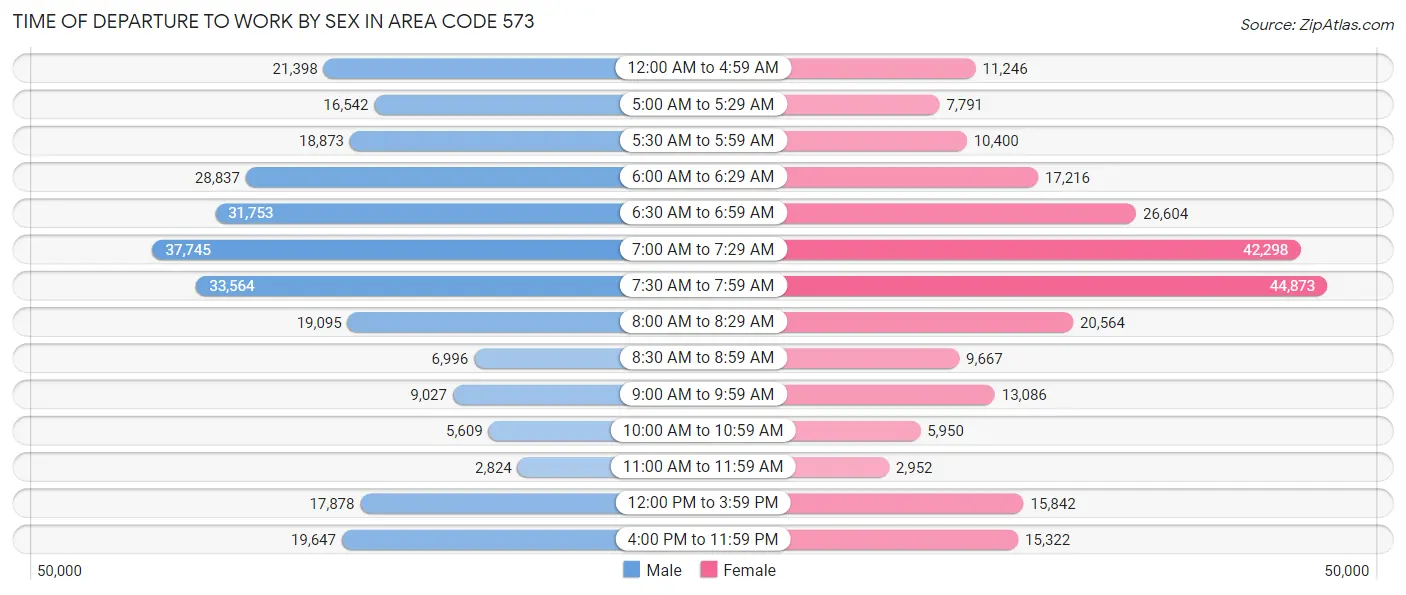
Time of Departure to Work by Sex in Area Code 573
The most frequent times of departure to work in Area Code 573 are 7:00 AM to 7:29 AM (37,745, 14.0%) for males and 7:30 AM to 7:59 AM (44,873, 18.4%) for females.
| Time of Departure | Male | Female |
| 12:00 AM to 4:59 AM | 21,398 (7.9%) | 11,246 (4.6%) |
| 5:00 AM to 5:29 AM | 16,542 (6.1%) | 7,791 (3.2%) |
| 5:30 AM to 5:59 AM | 18,873 (7.0%) | 10,400 (4.3%) |
| 6:00 AM to 6:29 AM | 28,837 (10.7%) | 17,216 (7.1%) |
| 6:30 AM to 6:59 AM | 31,753 (11.8%) | 26,604 (10.9%) |
| 7:00 AM to 7:29 AM | 37,745 (14.0%) | 42,298 (17.3%) |
| 7:30 AM to 7:59 AM | 33,564 (12.4%) | 44,873 (18.4%) |
| 8:00 AM to 8:29 AM | 19,095 (7.1%) | 20,564 (8.4%) |
| 8:30 AM to 8:59 AM | 6,996 (2.6%) | 9,667 (4.0%) |
| 9:00 AM to 9:59 AM | 9,027 (3.4%) | 13,086 (5.4%) |
| 10:00 AM to 10:59 AM | 5,609 (2.1%) | 5,950 (2.4%) |
| 11:00 AM to 11:59 AM | 2,824 (1.1%) | 2,952 (1.2%) |
| 12:00 PM to 3:59 PM | 17,878 (6.6%) | 15,842 (6.5%) |
| 4:00 PM to 11:59 PM | 19,647 (7.3%) | 15,322 (6.3%) |
| Total | 269,788 (100.0%) | 243,811 (100.0%) |
Housing Occupancy in Area Code 573
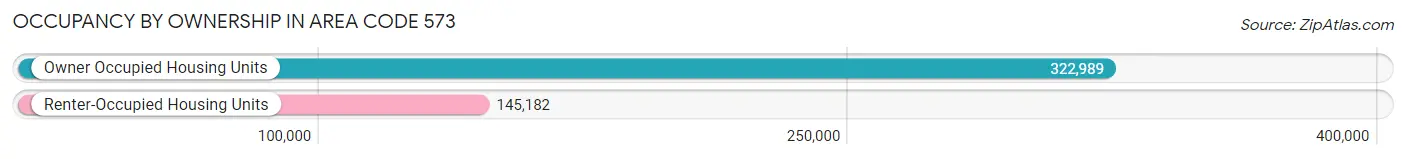
Occupancy by Ownership in Area Code 573
Of the total 468,171 dwellings in Area Code 573, owner-occupied units account for 322,989 (69.0%), while renter-occupied units make up 145,182 (31.0%).
| Occupancy | # Housing Units | % Housing Units |
| Owner Occupied Housing Units | 322,989 | 69.0% |
| Renter-Occupied Housing Units | 145,182 | 31.0% |
| Total Occupied Housing Units | 468,171 | 100.0% |
Occupancy by Household Size in Area Code 573
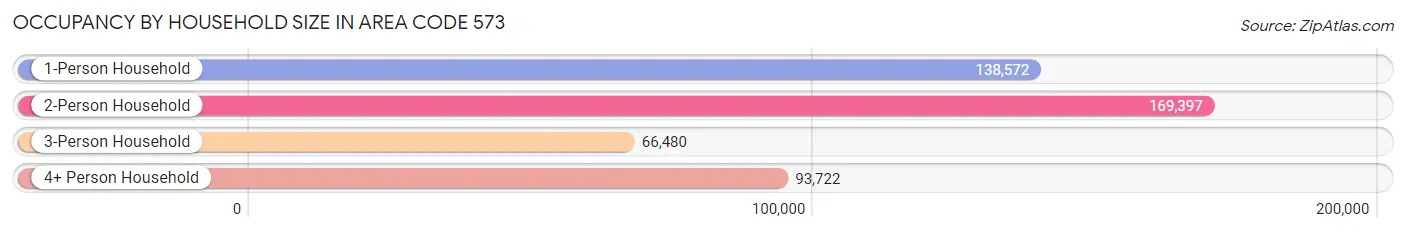
| Household Size | # Housing Units | % Housing Units |
| 1-Person Household | 138,572 | 29.6% |
| 2-Person Household | 169,397 | 36.2% |
| 3-Person Household | 66,480 | 14.2% |
| 4+ Person Household | 93,722 | 20.0% |
| Total Housing Units | 468,171 | 100.0% |
Occupancy by Ownership by Household Size in Area Code 573
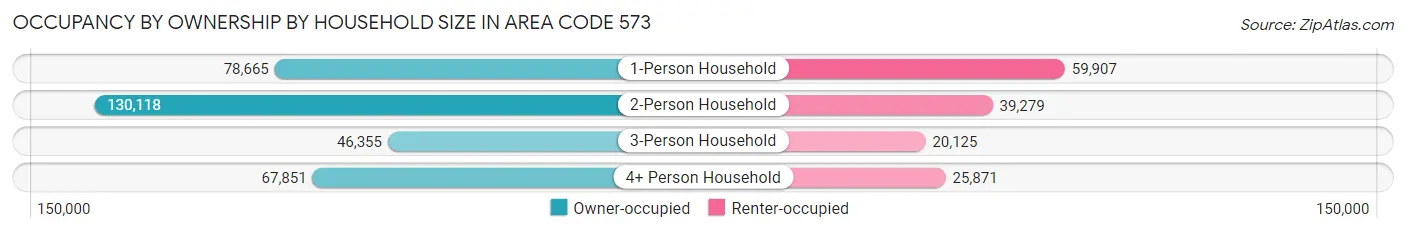
| Household Size | Owner-occupied | Renter-occupied |
| 1-Person Household | 78,665 (56.8%) | 59,907 (43.2%) |
| 2-Person Household | 130,118 (76.8%) | 39,279 (23.2%) |
| 3-Person Household | 46,355 (69.7%) | 20,125 (30.3%) |
| 4+ Person Household | 67,851 (72.4%) | 25,871 (27.6%) |
| Total Housing Units | 322,989 (69.0%) | 145,182 (31.0%) |
Occupancy by Educational Attainment in Area Code 573
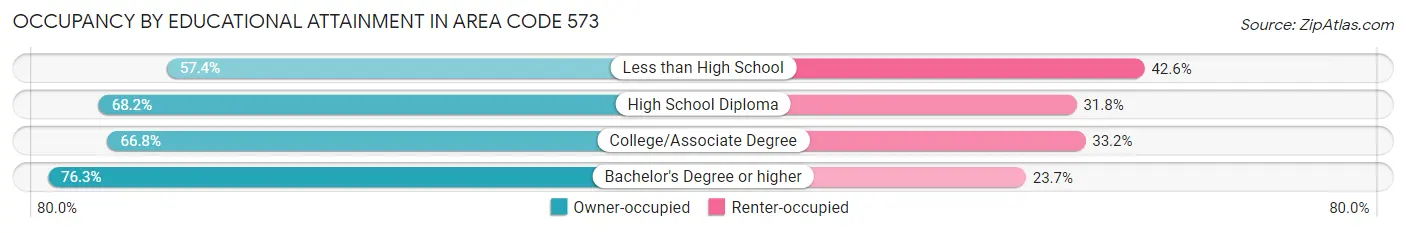
| Household Size | Owner-occupied | Renter-occupied |
| Less than High School | 25,052 (57.4%) | 18,563 (42.6%) |
| High School Diploma | 104,188 (68.2%) | 48,507 (31.8%) |
| College/Associate Degree | 96,240 (66.8%) | 47,768 (33.2%) |
| Bachelor's Degree or higher | 97,509 (76.3%) | 30,344 (23.7%) |
Occupancy by Age of Householder in Area Code 573
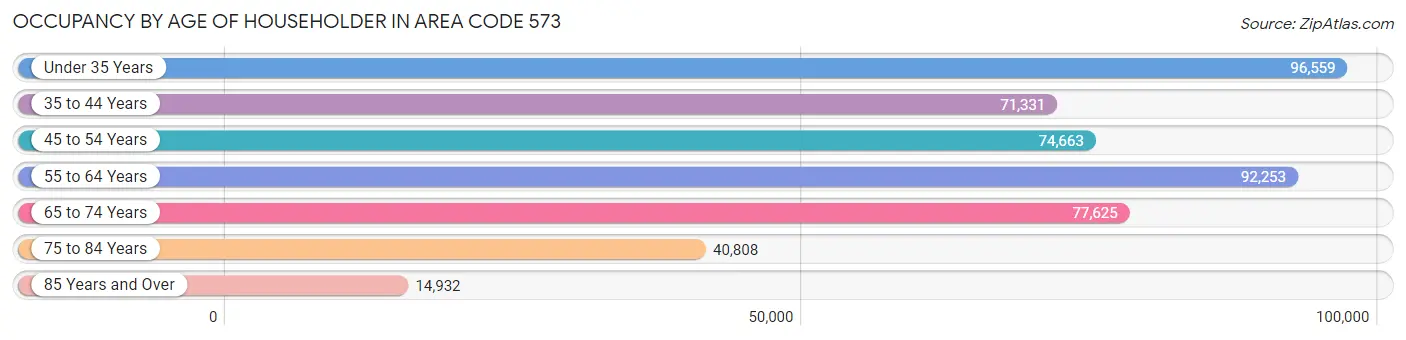
| Age Bracket | # Households | % Households |
| Under 35 Years | 96,559 | 20.6% |
| 35 to 44 Years | 71,331 | 15.2% |
| 45 to 54 Years | 74,663 | 16.0% |
| 55 to 64 Years | 92,253 | 19.7% |
| 65 to 74 Years | 77,625 | 16.6% |
| 75 to 84 Years | 40,808 | 8.7% |
| 85 Years and Over | 14,932 | 3.2% |
| Total | 468,171 | 100.0% |
Housing Finances in Area Code 573
Median Income by Occupancy in Area Code 573
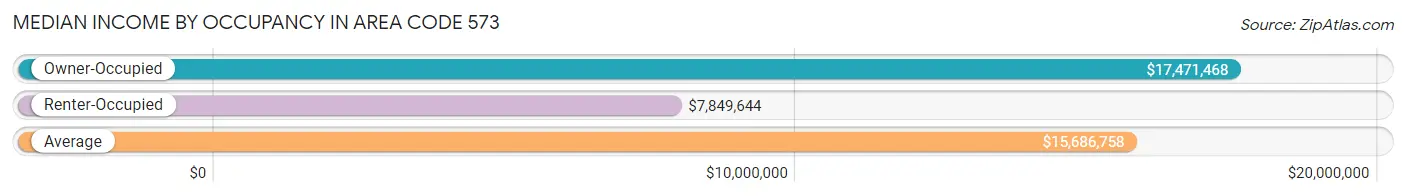
| Occupancy Type | # Households | Median Income |
| Owner-Occupied | 322,989 (69.0%) | $17,471,468 |
| Renter-Occupied | 145,182 (31.0%) | $7,849,644 |
| Average | 468,171 (100.0%) | $15,686,758 |
Occupancy by Householder Income Bracket in Area Code 573
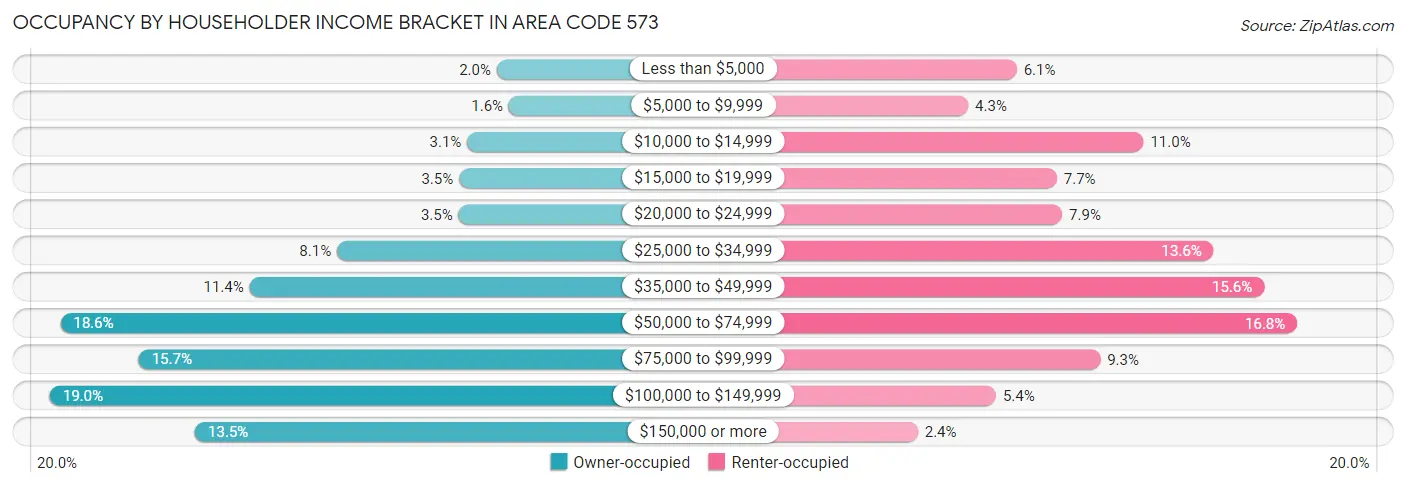
| Income Bracket | Owner-occupied | Renter-occupied |
| Less than $5,000 | 6,486 (2.0%) | 8,909 (6.1%) |
| $5,000 to $9,999 | 5,013 (1.5%) | 6,225 (4.3%) |
| $10,000 to $14,999 | 10,140 (3.1%) | 15,920 (11.0%) |
| $15,000 to $19,999 | 11,159 (3.5%) | 11,133 (7.7%) |
| $20,000 to $24,999 | 11,209 (3.5%) | 11,425 (7.9%) |
| $25,000 to $34,999 | 26,176 (8.1%) | 19,800 (13.6%) |
| $35,000 to $49,999 | 36,922 (11.4%) | 22,594 (15.6%) |
| $50,000 to $74,999 | 60,199 (18.6%) | 24,426 (16.8%) |
| $75,000 to $99,999 | 50,545 (15.7%) | 13,533 (9.3%) |
| $100,000 to $149,999 | 61,499 (19.0%) | 7,773 (5.3%) |
| $150,000 or more | 43,641 (13.5%) | 3,444 (2.4%) |
| Total | 322,989 (100.0%) | 145,182 (100.0%) |
Monthly Housing Cost Tiers in Area Code 573
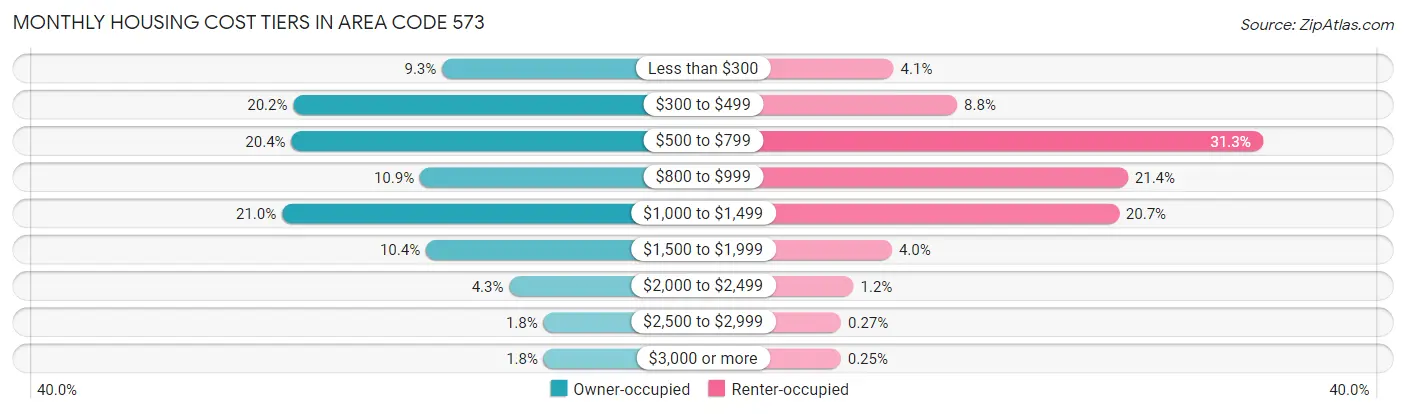
| Monthly Cost | Owner-occupied | Renter-occupied |
| Less than $300 | 29,863 (9.2%) | 6,005 (4.1%) |
| $300 to $499 | 65,260 (20.2%) | 12,804 (8.8%) |
| $500 to $799 | 65,713 (20.3%) | 45,461 (31.3%) |
| $800 to $999 | 35,156 (10.9%) | 31,054 (21.4%) |
| $1,000 to $1,499 | 67,949 (21.0%) | 30,091 (20.7%) |
| $1,500 to $1,999 | 33,721 (10.4%) | 5,839 (4.0%) |
| $2,000 to $2,499 | 13,885 (4.3%) | 1,726 (1.2%) |
| $2,500 to $2,999 | 5,761 (1.8%) | 391 (0.3%) |
| $3,000 or more | 5,681 (1.8%) | 359 (0.3%) |
| Total | 322,989 (100.0%) | 145,182 (100.0%) |
Physical Housing Characteristics in Area Code 573
Housing Structures in Area Code 573
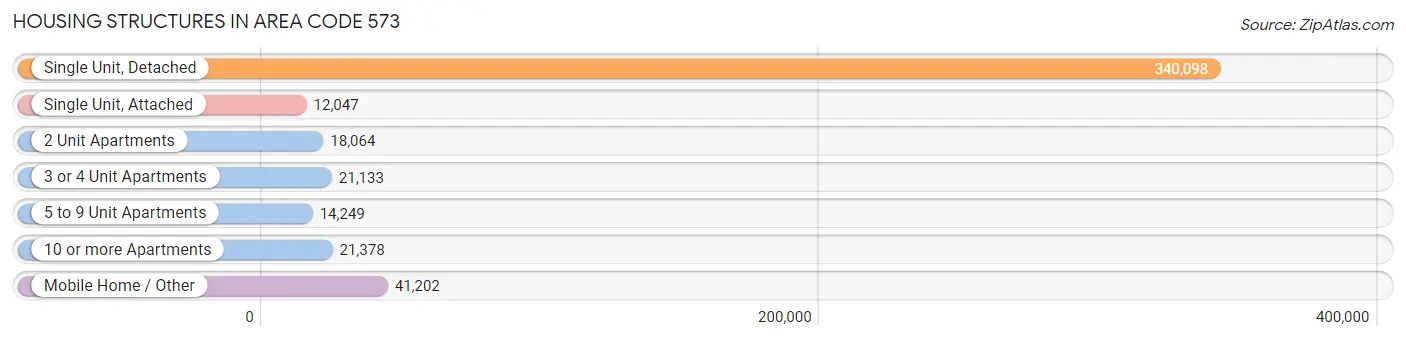
| Structure Type | # Housing Units | % Housing Units |
| Single Unit, Detached | 340,098 | 72.6% |
| Single Unit, Attached | 12,047 | 2.6% |
| 2 Unit Apartments | 18,064 | 3.9% |
| 3 or 4 Unit Apartments | 21,133 | 4.5% |
| 5 to 9 Unit Apartments | 14,249 | 3.0% |
| 10 or more Apartments | 21,378 | 4.6% |
| Mobile Home / Other | 41,202 | 8.8% |
| Total | 468,171 | 100.0% |
Housing Structures by Occupancy in Area Code 573
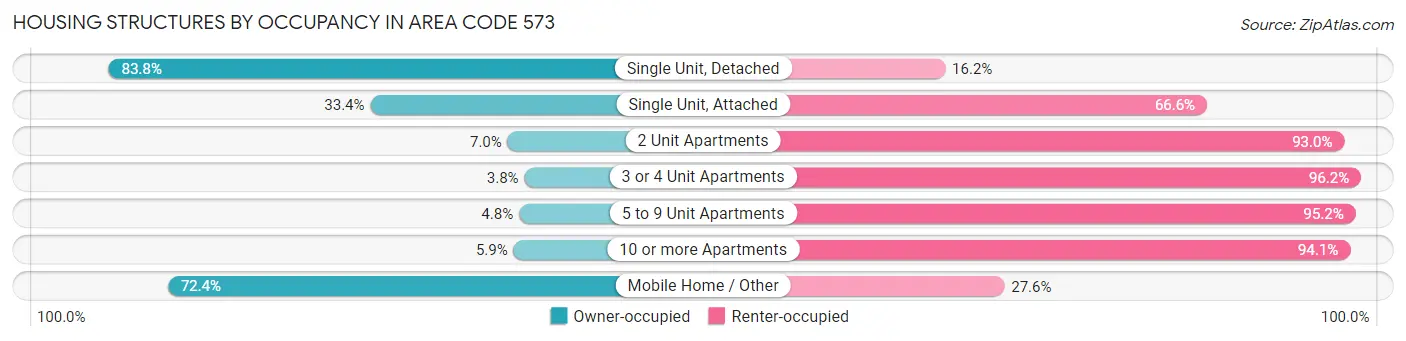
| Structure Type | Owner-occupied | Renter-occupied |
| Single Unit, Detached | 285,117 (83.8%) | 54,981 (16.2%) |
| Single Unit, Attached | 4,027 (33.4%) | 8,020 (66.6%) |
| 2 Unit Apartments | 1,265 (7.0%) | 16,799 (93.0%) |
| 3 or 4 Unit Apartments | 794 (3.8%) | 20,339 (96.2%) |
| 5 to 9 Unit Apartments | 686 (4.8%) | 13,563 (95.2%) |
| 10 or more Apartments | 1,253 (5.9%) | 20,125 (94.1%) |
| Mobile Home / Other | 29,847 (72.4%) | 11,355 (27.6%) |
| Total | 322,989 (69.0%) | 145,182 (31.0%) |
Housing Structures by Number of Rooms in Area Code 573
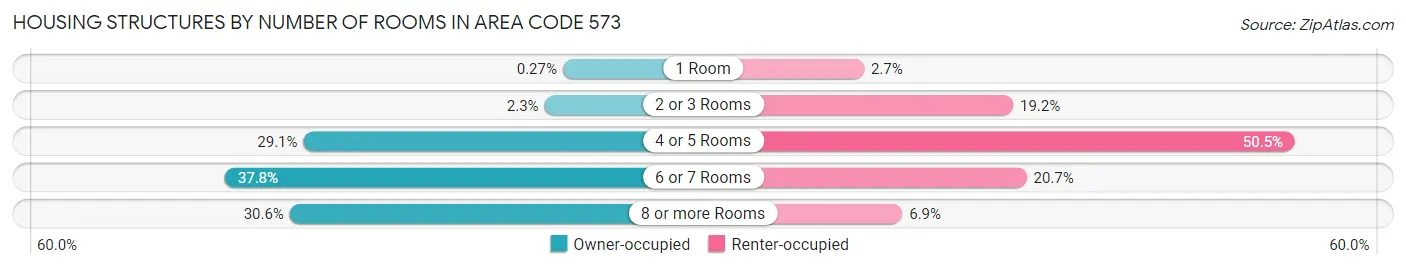
| Number of Rooms | Owner-occupied | Renter-occupied |
| 1 Room | 878 (0.3%) | 3,878 (2.7%) |
| 2 or 3 Rooms | 7,475 (2.3%) | 27,893 (19.2%) |
| 4 or 5 Rooms | 93,869 (29.1%) | 73,299 (50.5%) |
| 6 or 7 Rooms | 121,995 (37.8%) | 30,070 (20.7%) |
| 8 or more Rooms | 98,772 (30.6%) | 10,042 (6.9%) |
| Total | 322,989 (100.0%) | 145,182 (100.0%) |
Housing Structure by Heating Type in Area Code 573
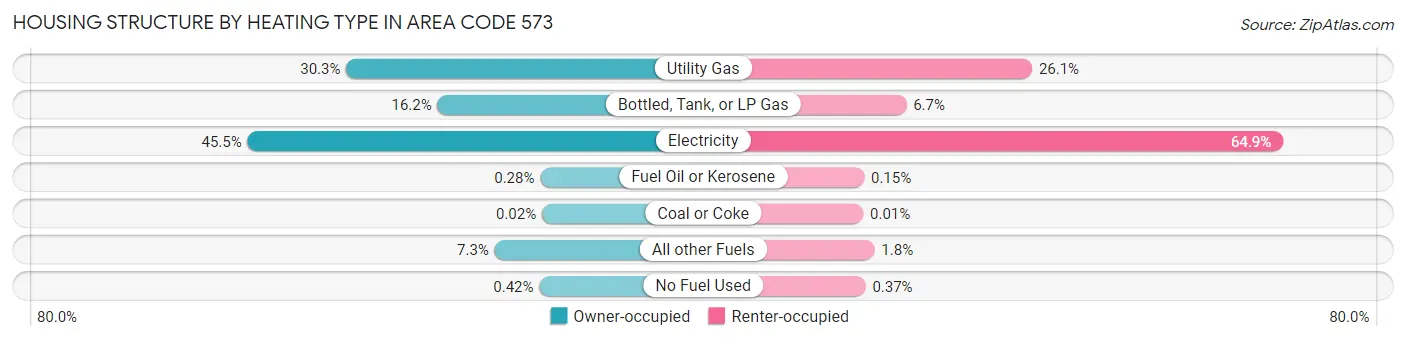
| Heating Type | Owner-occupied | Renter-occupied |
| Utility Gas | 97,762 (30.3%) | 37,914 (26.1%) |
| Bottled, Tank, or LP Gas | 52,199 (16.2%) | 9,681 (6.7%) |
| Electricity | 147,052 (45.5%) | 94,260 (64.9%) |
| Fuel Oil or Kerosene | 896 (0.3%) | 219 (0.2%) |
| Coal or Coke | 52 (0.0%) | 14 (0.0%) |
| All other Fuels | 23,667 (7.3%) | 2,559 (1.8%) |
| No Fuel Used | 1,361 (0.4%) | 535 (0.4%) |
| Total | 322,989 (100.0%) | 145,182 (100.0%) |
Household Vehicle Usage in Area Code 573
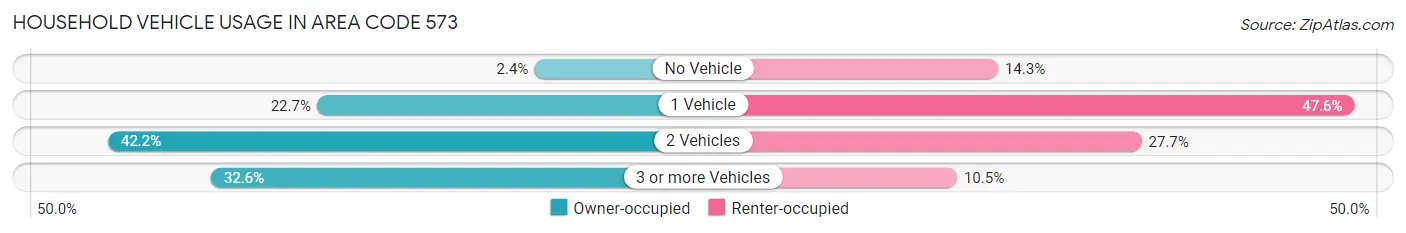
| Vehicles per Household | Owner-occupied | Renter-occupied |
| No Vehicle | 7,850 (2.4%) | 20,751 (14.3%) |
| 1 Vehicle | 73,404 (22.7%) | 69,041 (47.5%) |
| 2 Vehicles | 136,413 (42.2%) | 40,202 (27.7%) |
| 3 or more Vehicles | 105,322 (32.6%) | 15,188 (10.5%) |
| Total | 322,989 (100.0%) | 145,182 (100.0%) |
Real Estate & Mortgages in Area Code 573
Real Estate and Mortgage Overview in Area Code 573
| Characteristic | Without Mortgage | With Mortgage |
| Housing Units | 145,493 | 177,496 |
| Median Property Value | $33,259,600 | $40,942,698 |
| Median Household Income | $13,884,512 | $29,891 |
| Monthly Housing Costs | $113,195 | $5,521 |
| Real Estate Taxes | $242,734 | $3,964 |
Property Value by Mortgage Status in Area Code 573
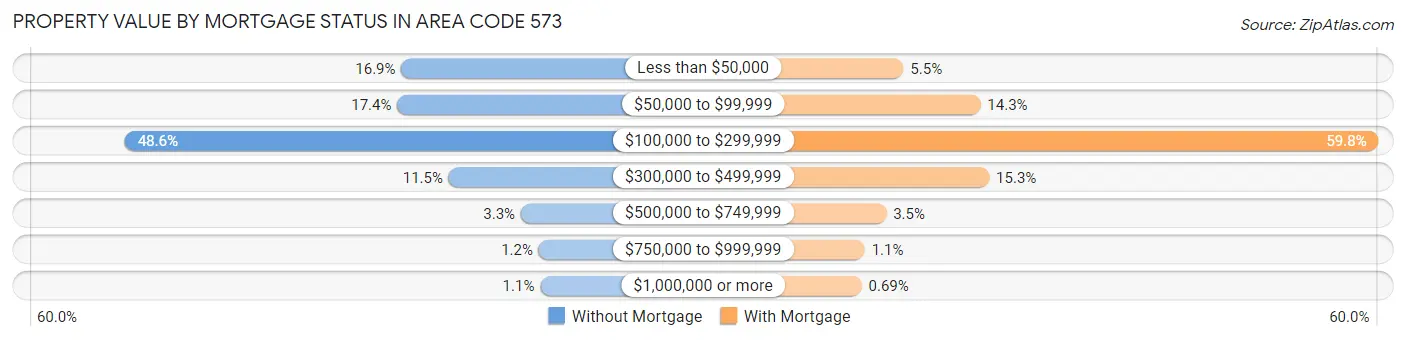
| Property Value | Without Mortgage | With Mortgage |
| Less than $50,000 | 24,650 (16.9%) | 9,709 (5.5%) |
| $50,000 to $99,999 | 25,337 (17.4%) | 25,336 (14.3%) |
| $100,000 to $299,999 | 70,634 (48.5%) | 106,072 (59.8%) |
| $300,000 to $499,999 | 16,759 (11.5%) | 27,096 (15.3%) |
| $500,000 to $749,999 | 4,776 (3.3%) | 6,209 (3.5%) |
| $750,000 to $999,999 | 1,784 (1.2%) | 1,856 (1.1%) |
| $1,000,000 or more | 1,553 (1.1%) | 1,218 (0.7%) |
| Total | 145,493 (100.0%) | 177,496 (100.0%) |
Household Income by Mortgage Status in Area Code 573
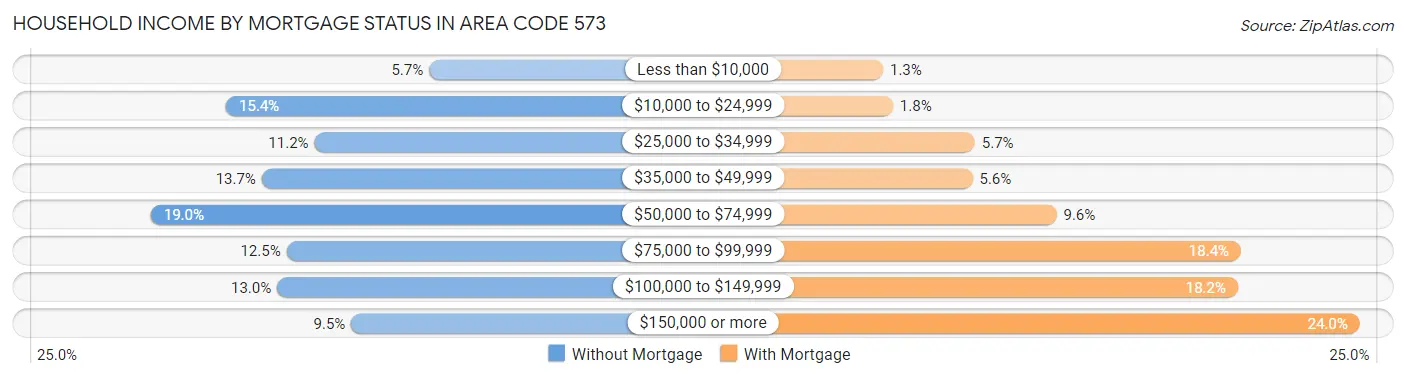
| Household Income | Without Mortgage | With Mortgage |
| Less than $10,000 | 8,346 (5.7%) | 2,332 (1.3%) |
| $10,000 to $24,999 | 22,423 (15.4%) | 3,153 (1.8%) |
| $25,000 to $34,999 | 16,291 (11.2%) | 10,085 (5.7%) |
| $35,000 to $49,999 | 19,941 (13.7%) | 9,885 (5.6%) |
| $50,000 to $74,999 | 27,625 (19.0%) | 16,981 (9.6%) |
| $75,000 to $99,999 | 18,234 (12.5%) | 32,574 (18.3%) |
| $100,000 to $149,999 | 18,883 (13.0%) | 32,311 (18.2%) |
| $150,000 or more | 13,750 (9.5%) | 42,616 (24.0%) |
| Total | 145,493 (100.0%) | 177,496 (100.0%) |
Property Value to Household Income Ratio in Area Code 573
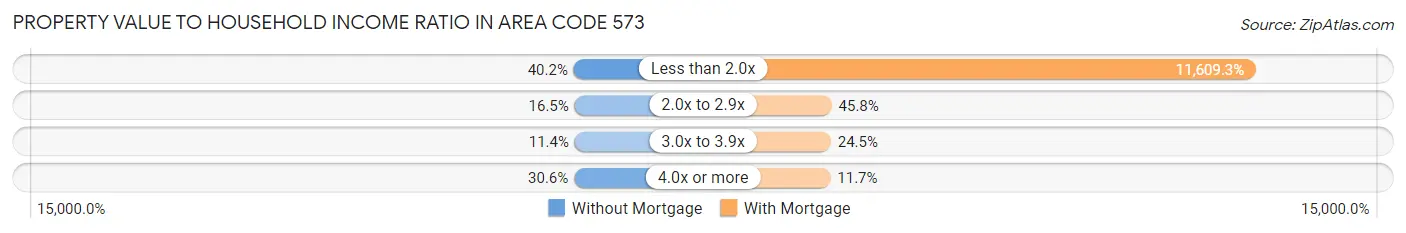
| Value-to-Income Ratio | Without Mortgage | With Mortgage |
| Less than 2.0x | 58,516 (40.2%) | 20,606,034 (11,609.3%) |
| 2.0x to 2.9x | 24,033 (16.5%) | 81,283 (45.8%) |
| 3.0x to 3.9x | 16,564 (11.4%) | 43,520 (24.5%) |
| 4.0x or more | 44,573 (30.6%) | 20,838 (11.7%) |
| Total | 145,493 (100.0%) | 177,496 (100.0%) |
Real Estate Taxes by Mortgage Status in Area Code 573
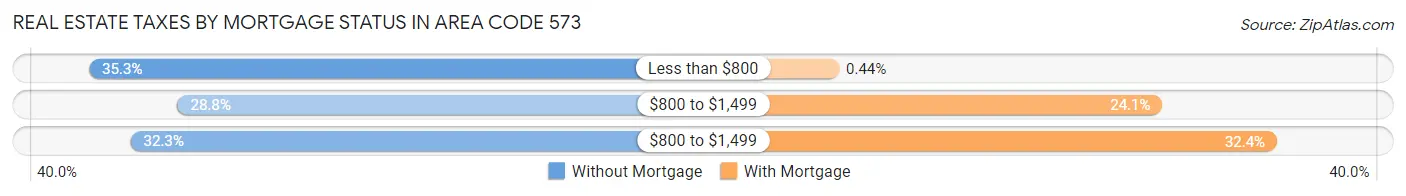
| Property Taxes | Without Mortgage | With Mortgage |
| Less than $800 | 51,340 (35.3%) | 787 (0.4%) |
| $800 to $1,499 | 41,934 (28.8%) | 42,694 (24.0%) |
| $800 to $1,499 | 46,937 (32.3%) | 57,566 (32.4%) |
| Total | 145,493 (100.0%) | 177,496 (100.0%) |
Health & Disability in Area Code 573
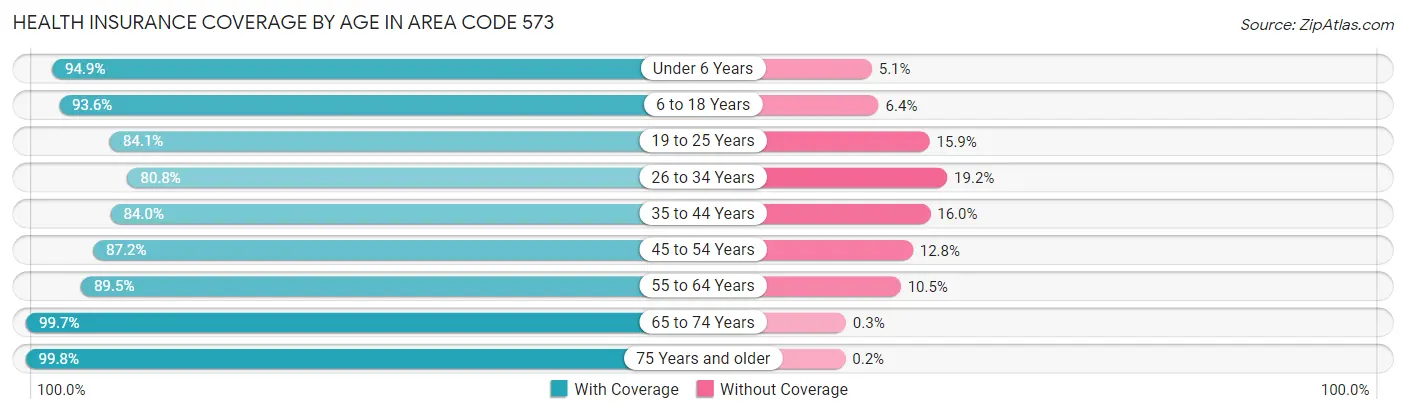
Health Insurance Coverage by Age in Area Code 573
| Age Bracket | With Coverage | Without Coverage |
| Under 6 Years | 79,688 (94.9%) | 4,310 (5.1%) |
| 6 to 18 Years | 186,237 (93.6%) | 12,759 (6.4%) |
| 19 to 25 Years | 103,181 (84.1%) | 19,517 (15.9%) |
| 26 to 34 Years | 106,201 (80.8%) | 25,211 (19.2%) |
| 35 to 44 Years | 117,253 (84.0%) | 22,377 (16.0%) |
| 45 to 54 Years | 119,630 (87.2%) | 17,523 (12.8%) |
| 55 to 64 Years | 141,729 (89.5%) | 16,670 (10.5%) |
| 65 to 74 Years | 122,276 (99.7%) | 369 (0.3%) |
| 75 Years and older | 82,132 (99.8%) | 164 (0.2%) |
| Total | 1,058,327 (89.9%) | 118,900 (10.1%) |
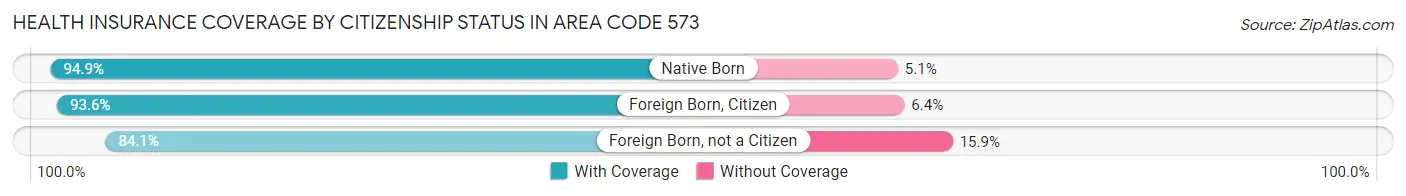
Health Insurance Coverage by Citizenship Status in Area Code 573
| Citizenship Status | With Coverage | Without Coverage |
| Native Born | 79,688 (94.9%) | 4,310 (5.1%) |
| Foreign Born, Citizen | 186,237 (93.6%) | 12,759 (6.4%) |
| Foreign Born, not a Citizen | 103,181 (84.1%) | 19,517 (15.9%) |
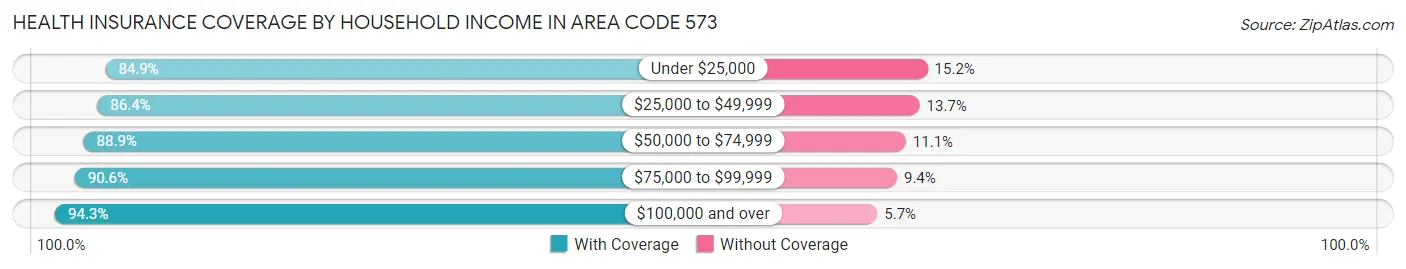
Health Insurance Coverage by Household Income in Area Code 573
| Household Income | With Coverage | Without Coverage |
| Under $25,000 | 140,880 (84.9%) | 25,150 (15.1%) |
| $25,000 to $49,999 | 192,637 (86.4%) | 30,444 (13.7%) |
| $50,000 to $74,999 | 191,958 (88.9%) | 23,899 (11.1%) |
| $75,000 to $99,999 | 165,218 (90.6%) | 17,166 (9.4%) |
| $100,000 and over | 348,786 (94.3%) | 21,152 (5.7%) |
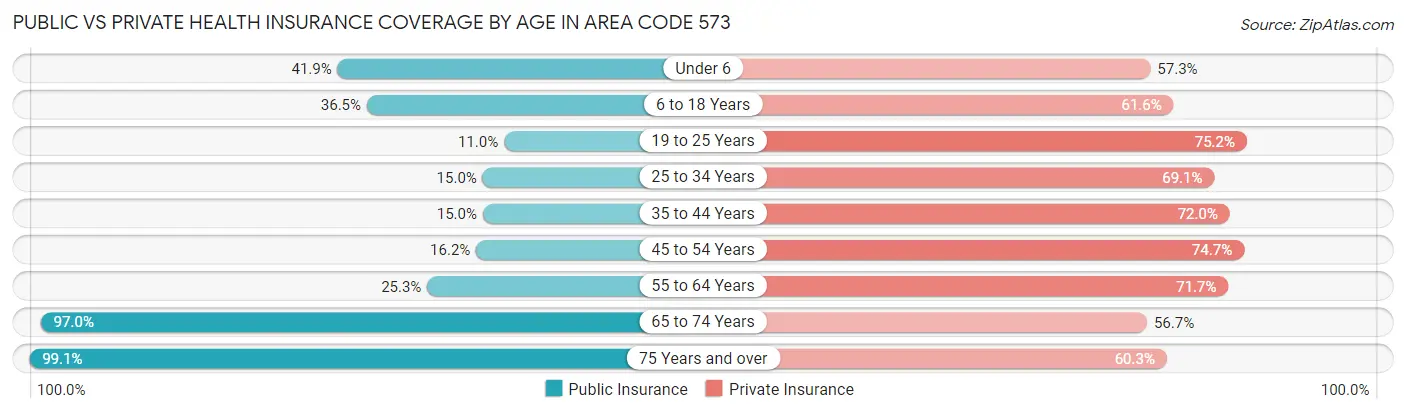
Public vs Private Health Insurance Coverage by Age in Area Code 573
| Age Bracket | Public Insurance | Private Insurance |
| Under 6 | 35,205 (41.9%) | 48,116 (57.3%) |
| 6 to 18 Years | 72,566 (36.5%) | 122,513 (61.6%) |
| 19 to 25 Years | 13,527 (11.0%) | 92,222 (75.2%) |
| 25 to 34 Years | 19,682 (15.0%) | 90,842 (69.1%) |
| 35 to 44 Years | 20,879 (14.9%) | 100,540 (72.0%) |
| 45 to 54 Years | 22,198 (16.2%) | 102,401 (74.7%) |
| 55 to 64 Years | 40,031 (25.3%) | 113,620 (71.7%) |
| 65 to 74 Years | 119,007 (97.0%) | 69,484 (56.7%) |
| 75 Years and over | 81,588 (99.1%) | 49,629 (60.3%) |
| Total | 424,683 (36.1%) | 789,367 (67.0%) |
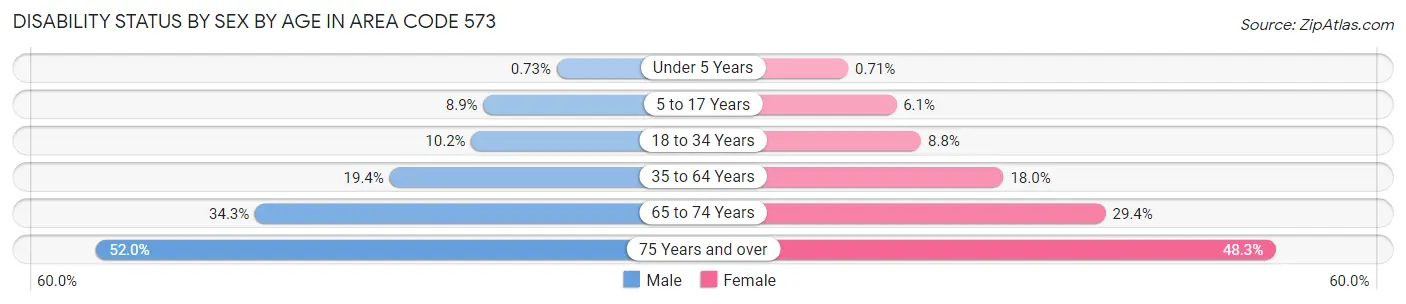
Disability Status by Sex by Age in Area Code 573
| Age Bracket | Male | Female |
| Under 5 Years | 261 (0.7%) | 242 (0.7%) |
| 5 to 17 Years | 8,982 (8.9%) | 5,773 (6.1%) |
| 18 to 34 Years | 14,001 (10.2%) | 11,888 (8.8%) |
| 35 to 64 Years | 41,534 (19.4%) | 39,703 (18.0%) |
| 65 to 74 Years | 20,112 (34.3%) | 18,824 (29.4%) |
| 75 Years and over | 18,093 (52.0%) | 22,921 (48.2%) |
Disability Class by Sex by Age in Area Code 573
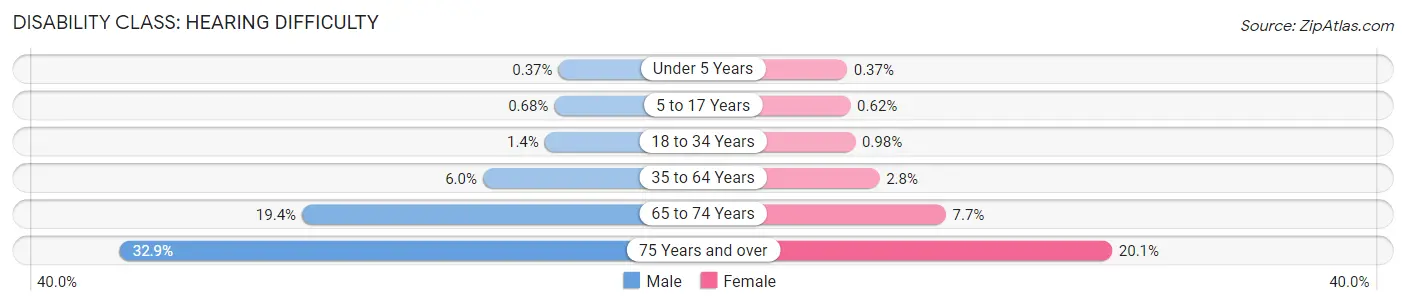
Disability Class: Hearing Difficulty
| Age Bracket | Male | Female |
| Under 5 Years | 130 (0.4%) | 125 (0.4%) |
| 5 to 17 Years | 684 (0.7%) | 592 (0.6%) |
| 18 to 34 Years | 1,899 (1.4%) | 1,319 (1.0%) |
| 35 to 64 Years | 12,835 (6.0%) | 6,141 (2.8%) |
| 65 to 74 Years | 11,370 (19.4%) | 4,942 (7.7%) |
| 75 Years and over | 11,455 (32.9%) | 9,525 (20.1%) |
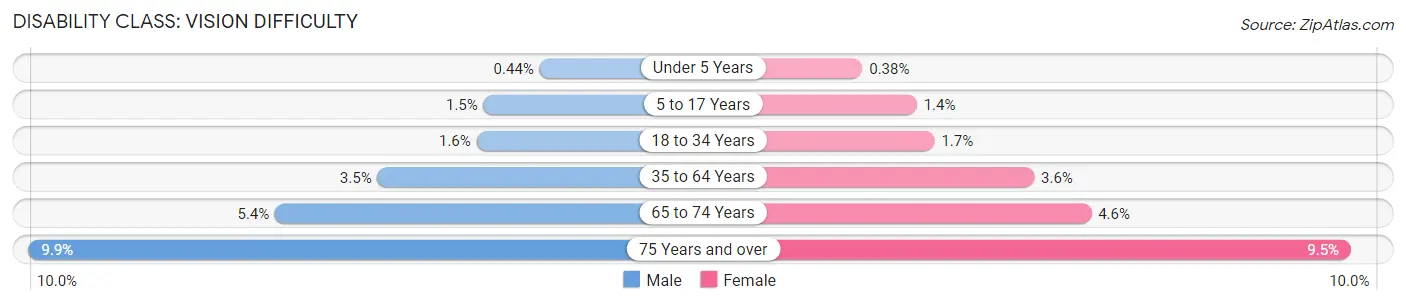
Disability Class: Vision Difficulty
| Age Bracket | Male | Female |
| Under 5 Years | 158 (0.4%) | 130 (0.4%) |
| 5 to 17 Years | 1,491 (1.5%) | 1,329 (1.4%) |
| 18 to 34 Years | 2,205 (1.6%) | 2,313 (1.7%) |
| 35 to 64 Years | 7,410 (3.5%) | 7,878 (3.6%) |
| 65 to 74 Years | 3,136 (5.3%) | 2,968 (4.6%) |
| 75 Years and over | 3,454 (9.9%) | 4,490 (9.5%) |
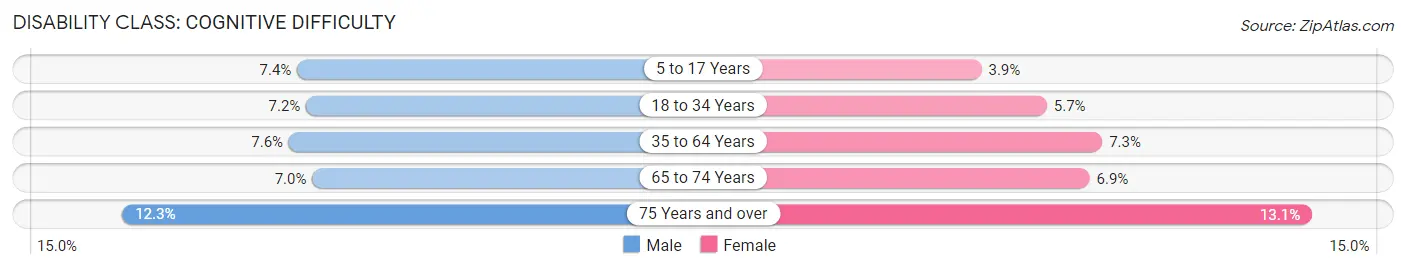
Disability Class: Cognitive Difficulty
| Age Bracket | Male | Female |
| 5 to 17 Years | 7,476 (7.4%) | 3,705 (3.9%) |
| 18 to 34 Years | 9,784 (7.2%) | 7,694 (5.7%) |
| 35 to 64 Years | 16,392 (7.6%) | 15,997 (7.2%) |
| 65 to 74 Years | 4,092 (7.0%) | 4,419 (6.9%) |
| 75 Years and over | 4,271 (12.3%) | 6,217 (13.1%) |
Disability Class: Ambulatory Difficulty
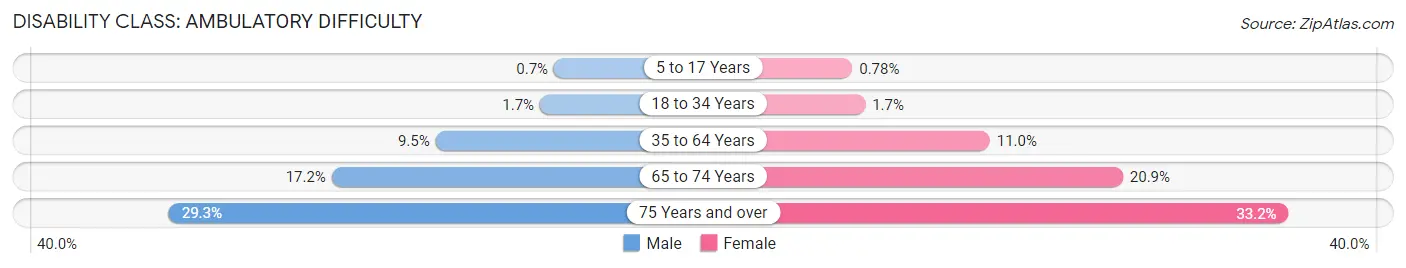
| Age Bracket | Male | Female |
| 5 to 17 Years | 703 (0.7%) | 740 (0.8%) |
| 18 to 34 Years | 2,375 (1.7%) | 2,339 (1.7%) |
| 35 to 64 Years | 20,379 (9.5%) | 24,233 (11.0%) |
| 65 to 74 Years | 10,077 (17.2%) | 13,368 (20.9%) |
| 75 Years and over | 10,188 (29.3%) | 15,753 (33.2%) |
Disability Class: Self-Care Difficulty
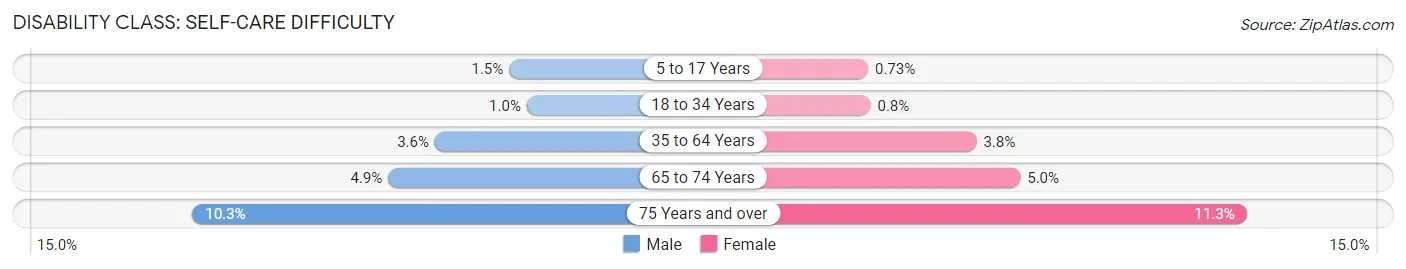
| Age Bracket | Male | Female |
| 5 to 17 Years | 1,523 (1.5%) | 698 (0.7%) |
| 18 to 34 Years | 1,399 (1.0%) | 1,079 (0.8%) |
| 35 to 64 Years | 7,682 (3.6%) | 8,279 (3.7%) |
| 65 to 74 Years | 2,858 (4.9%) | 3,183 (5.0%) |
| 75 Years and over | 3,593 (10.3%) | 5,356 (11.3%) |
Technology Access in Area Code 573
Computing Device Access in Area Code 573
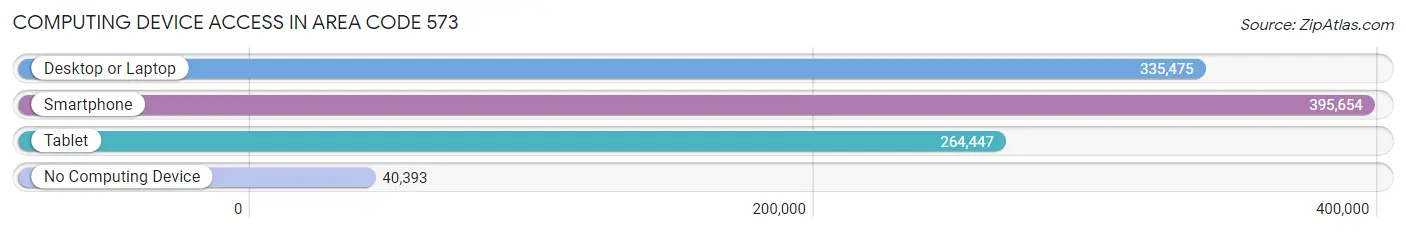
| Device Type | # Households | % Households |
| Desktop or Laptop | 335,475 | 71.7% |
| Smartphone | 395,654 | 84.5% |
| Tablet | 264,447 | 56.5% |
| No Computing Device | 40,393 | 8.6% |
| Total | 468,171 | 100.0% |
Internet Access in Area Code 573
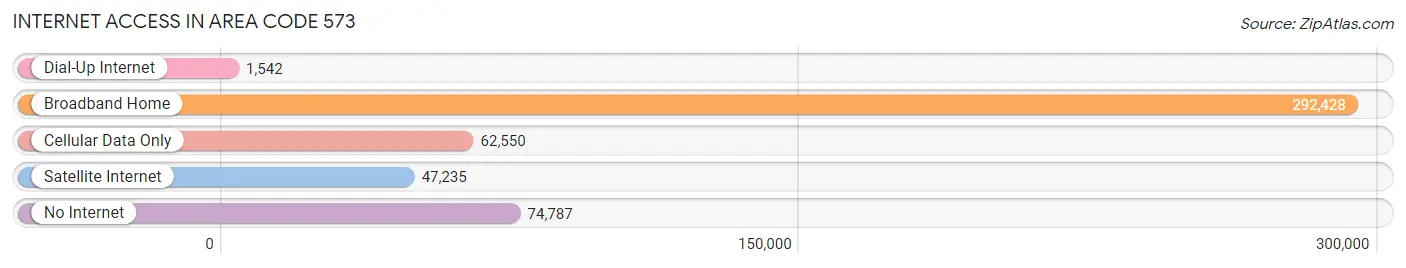
| Internet Type | # Households | % Households |
| Dial-Up Internet | 1,542 | 0.3% |
| Broadband Home | 292,428 | 62.5% |
| Cellular Data Only | 62,550 | 13.4% |
| Satellite Internet | 47,235 | 10.1% |
| No Internet | 74,787 | 16.0% |
| Total | 468,171 | 100.0% |
Area Code 573 Summary
Geography
Area code 573 is located in the state of Missouri. It covers the southeastern portion of the state, including the cities of Columbia, Jefferson City, and Cape Girardeau.
Social
Area code 573 is home to a diverse population of people from all walks of life. The area is known for its friendly and welcoming atmosphere, and its residents are proud of their heritage and culture.
Economics
Area code 573 is a major economic hub in the state of Missouri. The area is home to a number of large businesses, including the University of Missouri, the state government, and several Fortune 500 companies.
Demographics
Area code 573 is home to a population of over 1.5 million people. The area is predominantly white, with a large African American population. The median household income is slightly above the national average, and the unemployment rate is below the national average.
Common Questions
What is Per Capita Income in Area Code 573?
Per Capita income in Area Code 573 is $28,837.
What is the Median Family Income in Area Code 573?
Median Family Income in Area Code 573 is $72,050.
What is the Median Household income in Area Code 573?
Median Household Income in Area Code 573 is $57,043.
What is Income or Wage Gap in Area Code 573?
Income or Wage Gap in Area Code 573 is 28.6%.
Women in Area Code 573 earn 71.4 cents for every dollar earned by a man.
What is Family Income Deficit in Area Code 573?
Family Income Deficit in Area Code 573 is $9,713.
Families that are below poverty line in Area Code 573 earn $9,713 less on average than the poverty threshold level.
What is Inequality or Gini Index in Area Code 573?
Inequality or Gini Index in Area Code 573 is 118.70.
What is the Total Population of Area Code 573?
Total Population of Area Code 573 is 1,221,784.
What is the Total Male Population of Area Code 573?
Total Male Population of Area Code 573 is 614,087.
What is the Total Female Population of Area Code 573?
Total Female Population of Area Code 573 is 607,697.
What is the Ratio of Males per 100 Females in Area Code 573?
There are 101.05 Males per 100 Females in Area Code 573.
What is the Ratio of Females per 100 Males in Area Code 573?
There are 98.96 Females per 100 Males in Area Code 573.
What is the Median Population Age in Area Code 573?
Median Population Age in Area Code 573 is 43.2 Years.
What is the Average Family Size in Area Code 573
Average Family Size in Area Code 573 is 3.1 People.
What is the Average Household Size in Area Code 573
Average Household Size in Area Code 573 is 2.6 People.
How Large is the Labor Force in Area Code 573?
There are 552,069 People in the Labor Forcein in Area Code 573.
What is the Percentage of People in the Labor Force in Area Code 573?
56.0% of People are in the Labor Force in Area Code 573.
What is the Unemployment Rate in Area Code 573?
Unemployment Rate in Area Code 573 is 6.2%.