Washington County, MO Map & Demographics
Washington County Map
Washington County Overview
$28,191
PER CAPITA INCOME
$60,256
AVG FAMILY INCOME
$49,364
AVG HOUSEHOLD INCOME
34.9%
WAGE / INCOME GAP [ % ]
65.1¢/ $1
WAGE / INCOME GAP [ $ ]
$10,059
FAMILY INCOME DEFICIT
0.50
INEQUALITY / GINI INDEX
23,580
TOTAL POPULATION
12,260
MALE POPULATION
11,320
FEMALE POPULATION
108.30
MALES / 100 FEMALES
92.33
FEMALES / 100 MALES
39.8
MEDIAN AGE
3.0
AVG FAMILY SIZE
2.5
AVG HOUSEHOLD SIZE
9,652
LABOR FORCE [ PEOPLE ]
51.2%
PERCENT IN LABOR FORCE
4.4%
UNEMPLOYMENT RATE
Income in Washington County
Income Overview in Washington County
Per Capita Income in Washington County is $28,191, while median incomes of families and households are $60,256 and $49,364 respectively.
| Characteristic | Number | Measure |
| Per Capita Income | 23,580 | $28,191 |
| Median Family Income | 6,222 | $60,256 |
| Mean Family Income | 6,222 | $74,710 |
| Median Household Income | 9,032 | $49,364 |
| Mean Household Income | 9,032 | $73,374 |
| Income Deficit | 6,222 | $10,059 |
| Wage / Income Gap (%) | 23,580 | 34.90% |
| Wage / Income Gap ($) | 23,580 | 65.10¢ per $1 |
| Gini / Inequality Index | 23,580 | 0.50 |
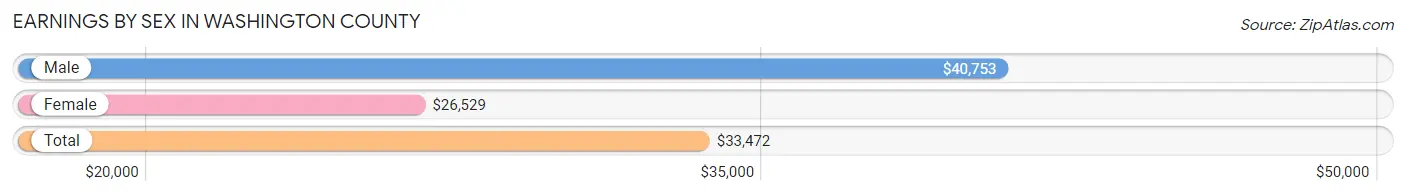
Earnings by Sex in Washington County
Average Earnings in Washington County are $33,472, $40,753 for men and $26,529 for women, a difference of 34.9%.
| Sex | Number | Average Earnings |
| Male | 5,687 (55.0%) | $40,753 |
| Female | 4,645 (45.0%) | $26,529 |
| Total | 10,332 (100.0%) | $33,472 |
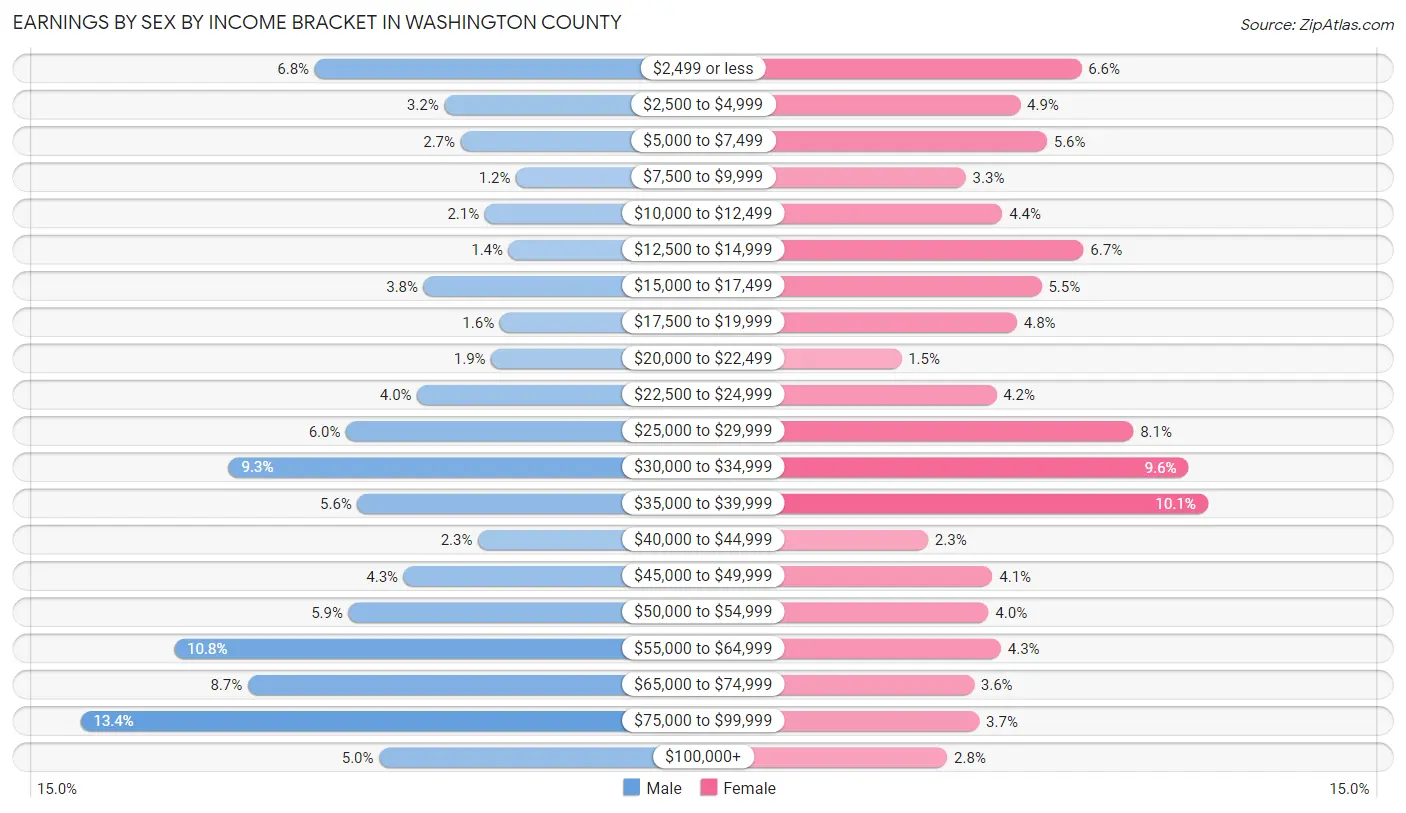
Earnings by Sex by Income Bracket in Washington County
The most common earnings brackets in Washington County are $75,000 to $99,999 for men (764 | 13.4%) and $35,000 to $39,999 for women (471 | 10.1%).
| Income | Male | Female |
| $2,499 or less | 389 (6.8%) | 306 (6.6%) |
| $2,500 to $4,999 | 182 (3.2%) | 226 (4.9%) |
| $5,000 to $7,499 | 156 (2.7%) | 261 (5.6%) |
| $7,500 to $9,999 | 67 (1.2%) | 155 (3.3%) |
| $10,000 to $12,499 | 117 (2.1%) | 203 (4.4%) |
| $12,500 to $14,999 | 79 (1.4%) | 309 (6.7%) |
| $15,000 to $17,499 | 215 (3.8%) | 254 (5.5%) |
| $17,500 to $19,999 | 93 (1.6%) | 222 (4.8%) |
| $20,000 to $22,499 | 107 (1.9%) | 71 (1.5%) |
| $22,500 to $24,999 | 225 (4.0%) | 195 (4.2%) |
| $25,000 to $29,999 | 339 (6.0%) | 374 (8.1%) |
| $30,000 to $34,999 | 527 (9.3%) | 446 (9.6%) |
| $35,000 to $39,999 | 321 (5.6%) | 471 (10.1%) |
| $40,000 to $44,999 | 128 (2.2%) | 106 (2.3%) |
| $45,000 to $49,999 | 247 (4.3%) | 190 (4.1%) |
| $50,000 to $54,999 | 335 (5.9%) | 185 (4.0%) |
| $55,000 to $64,999 | 614 (10.8%) | 201 (4.3%) |
| $65,000 to $74,999 | 496 (8.7%) | 166 (3.6%) |
| $75,000 to $99,999 | 764 (13.4%) | 173 (3.7%) |
| $100,000+ | 286 (5.0%) | 131 (2.8%) |
| Total | 5,687 (100.0%) | 4,645 (100.0%) |
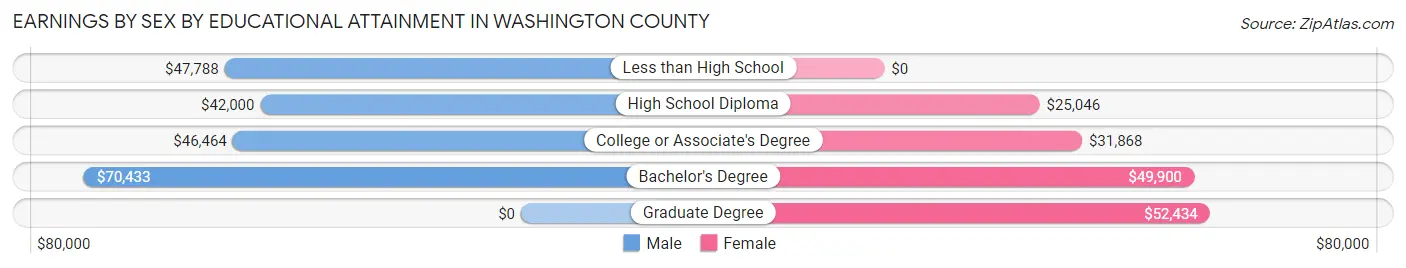
Earnings by Sex by Educational Attainment in Washington County
Average earnings in Washington County are $47,694 for men and $29,386 for women, a difference of 38.4%. Men with an educational attainment of bachelor's degree enjoy the highest average annual earnings of $70,433, while those with high school diploma education earn the least with $42,000. Women with an educational attainment of graduate degree earn the most with the average annual earnings of $52,434, while those with high school diploma education have the smallest earnings of $25,046.
| Educational Attainment | Male Income | Female Income |
| Less than High School | $47,788 | $0 |
| High School Diploma | $42,000 | $25,046 |
| College or Associate's Degree | $46,464 | $31,868 |
| Bachelor's Degree | $70,433 | $49,900 |
| Graduate Degree | - | - |
| Total | $47,694 | $29,386 |
Family Income in Washington County
Family Income Brackets in Washington County
According to the Washington County family income data, there are 1,076 families falling into the $50,000 to $74,999 income range, which is the most common income bracket and makes up 17.3% of all families. Conversely, the $200,000+ income bracket is the least frequent group with only 156 families (2.5%) belonging to this category.
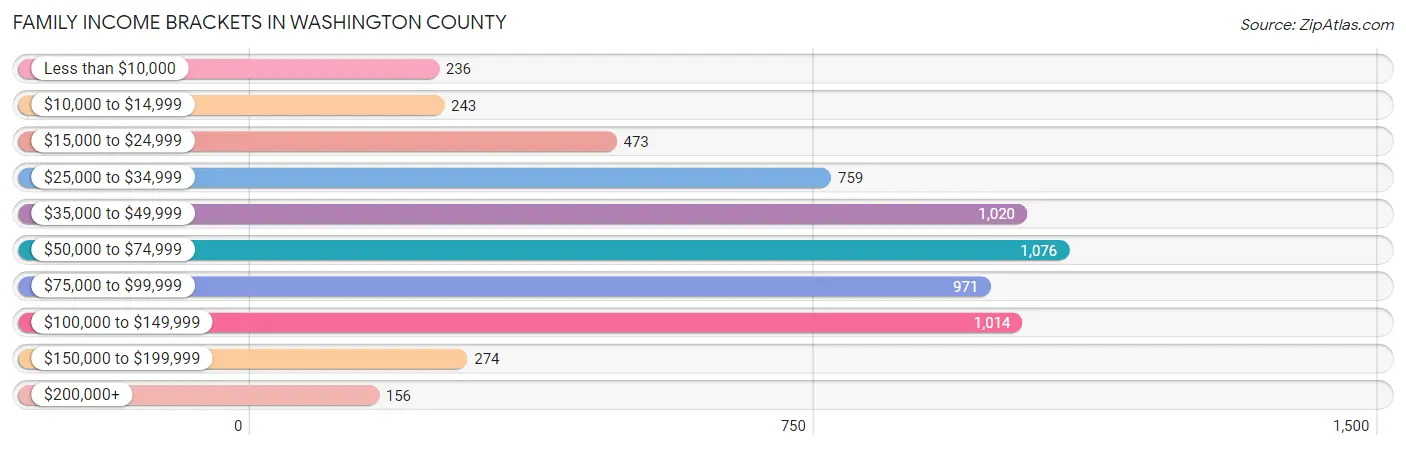
| Income Bracket | # Families | % Families |
| Less than $10,000 | 236 | 3.8% |
| $10,000 to $14,999 | 243 | 3.9% |
| $15,000 to $24,999 | 473 | 7.6% |
| $25,000 to $34,999 | 759 | 12.2% |
| $35,000 to $49,999 | 1,020 | 16.4% |
| $50,000 to $74,999 | 1,076 | 17.3% |
| $75,000 to $99,999 | 971 | 15.6% |
| $100,000 to $149,999 | 1,014 | 16.3% |
| $150,000 to $199,999 | 274 | 4.4% |
| $200,000+ | 156 | 2.5% |
Family Income by Famaliy Size in Washington County
7+ person families (91 | 1.5%) account for the highest median family income in Washington County with $122,552 per family, while 2-person families (3,070 | 49.3%) have the highest median income of $27,566 per family member.
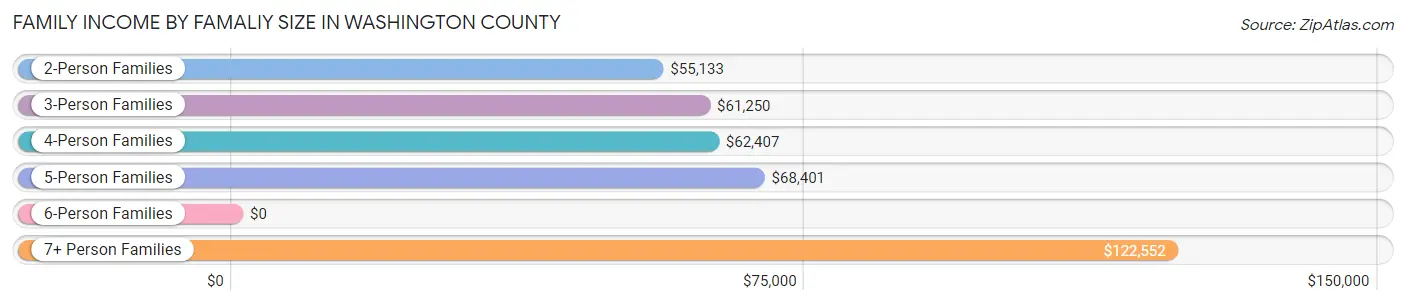
| Income Bracket | # Families | Median Income |
| 2-Person Families | 3,070 (49.3%) | $55,133 |
| 3-Person Families | 1,173 (18.9%) | $61,250 |
| 4-Person Families | 1,188 (19.1%) | $62,407 |
| 5-Person Families | 583 (9.4%) | $68,401 |
| 6-Person Families | 117 (1.9%) | $0 |
| 7+ Person Families | 91 (1.5%) | $122,552 |
| Total | 6,222 (100.0%) | $60,256 |
Family Income by Number of Earners in Washington County
The median family income in Washington County is $60,256, with families comprising 3+ earners (689) having the highest median family income of $119,637, while families with no earners (1,362) have the lowest median family income of $28,669, accounting for 11.1% and 21.9% of families, respectively.
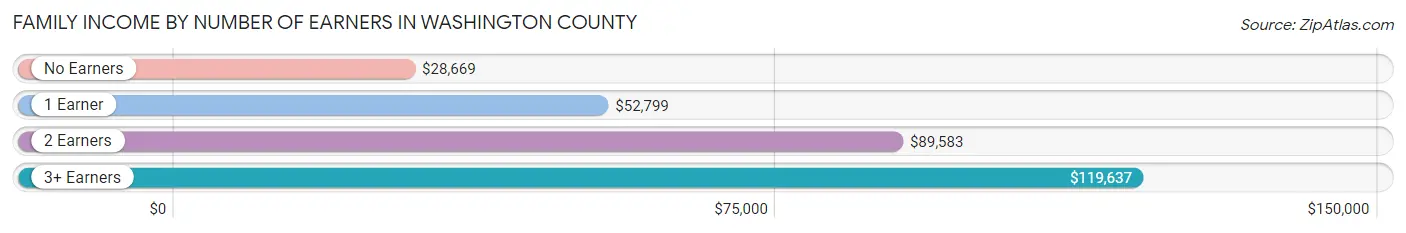
| Number of Earners | # Families | Median Income |
| No Earners | 1,362 (21.9%) | $28,669 |
| 1 Earner | 2,581 (41.5%) | $52,799 |
| 2 Earners | 1,590 (25.6%) | $89,583 |
| 3+ Earners | 689 (11.1%) | $119,637 |
| Total | 6,222 (100.0%) | $60,256 |
Household Income in Washington County
Household Income Brackets in Washington County
With 1,689 households falling in the category, the $50,000 to $74,999 income range is the most frequent in Washington County, accounting for 18.7% of all households. In contrast, only 226 households (2.5%) fall into the $200,000+ income bracket, making it the least populous group.
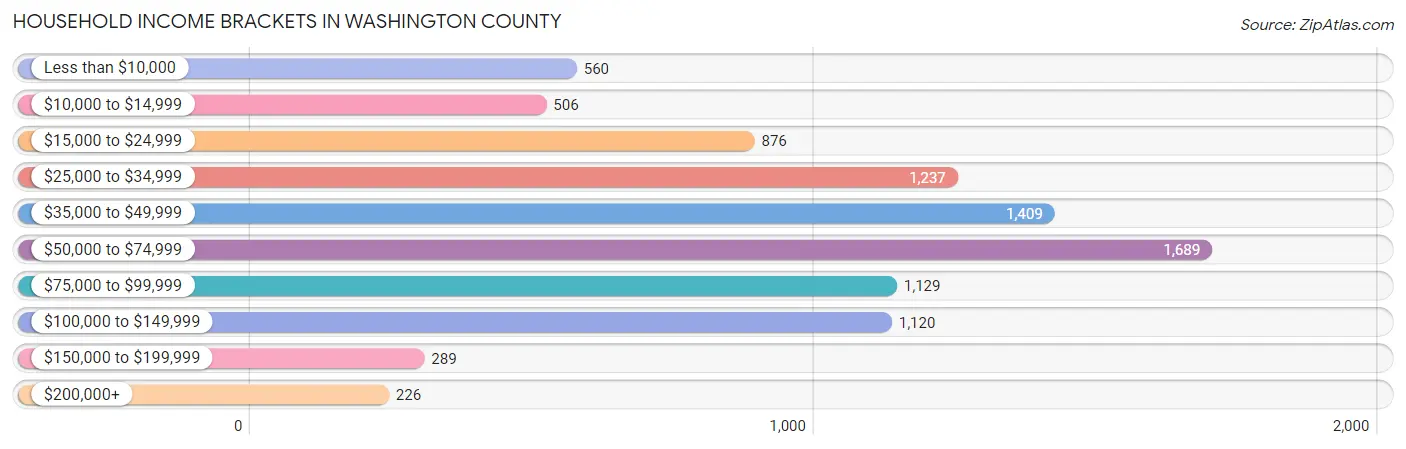
| Income Bracket | # Households | % Households |
| Less than $10,000 | 560 | 6.2% |
| $10,000 to $14,999 | 506 | 5.6% |
| $15,000 to $24,999 | 876 | 9.7% |
| $25,000 to $34,999 | 1,237 | 13.7% |
| $35,000 to $49,999 | 1,409 | 15.6% |
| $50,000 to $74,999 | 1,689 | 18.7% |
| $75,000 to $99,999 | 1,129 | 12.5% |
| $100,000 to $149,999 | 1,120 | 12.4% |
| $150,000 to $199,999 | 289 | 3.2% |
| $200,000+ | 226 | 2.5% |
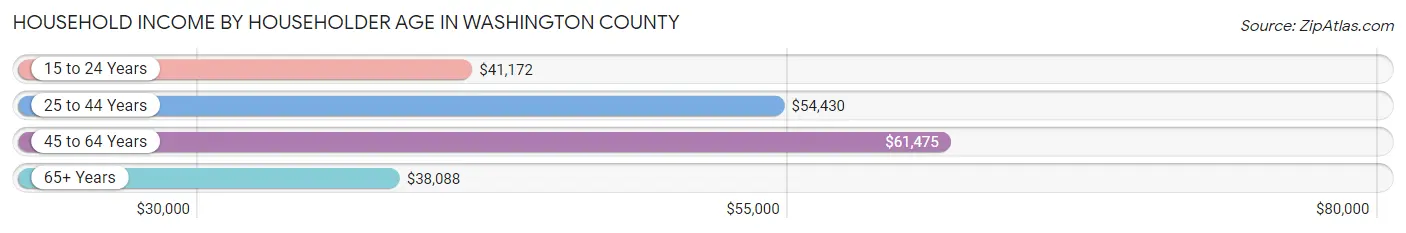
Household Income by Householder Age in Washington County
The median household income in Washington County is $49,364, with the highest median household income of $61,475 found in the 45 to 64 years age bracket for the primary householder. A total of 3,480 households (38.5%) fall into this category. Meanwhile, the 65+ years age bracket for the primary householder has the lowest median household income of $38,088, with 2,522 households (27.9%) in this group.
| Income Bracket | # Households | Median Income |
| 15 to 24 Years | 331 (3.7%) | $41,172 |
| 25 to 44 Years | 2,699 (29.9%) | $54,430 |
| 45 to 64 Years | 3,480 (38.5%) | $61,475 |
| 65+ Years | 2,522 (27.9%) | $38,088 |
| Total | 9,032 (100.0%) | $49,364 |
Poverty in Washington County
Income Below Poverty by Sex and Age in Washington County
With 16.9% poverty level for males and 20.3% for females among the residents of Washington County, under 5 year old males and 16 and 17 year old females are the most vulnerable to poverty, with 225 males (36.3%) and 213 females (51.7%) in their respective age groups living below the poverty level.
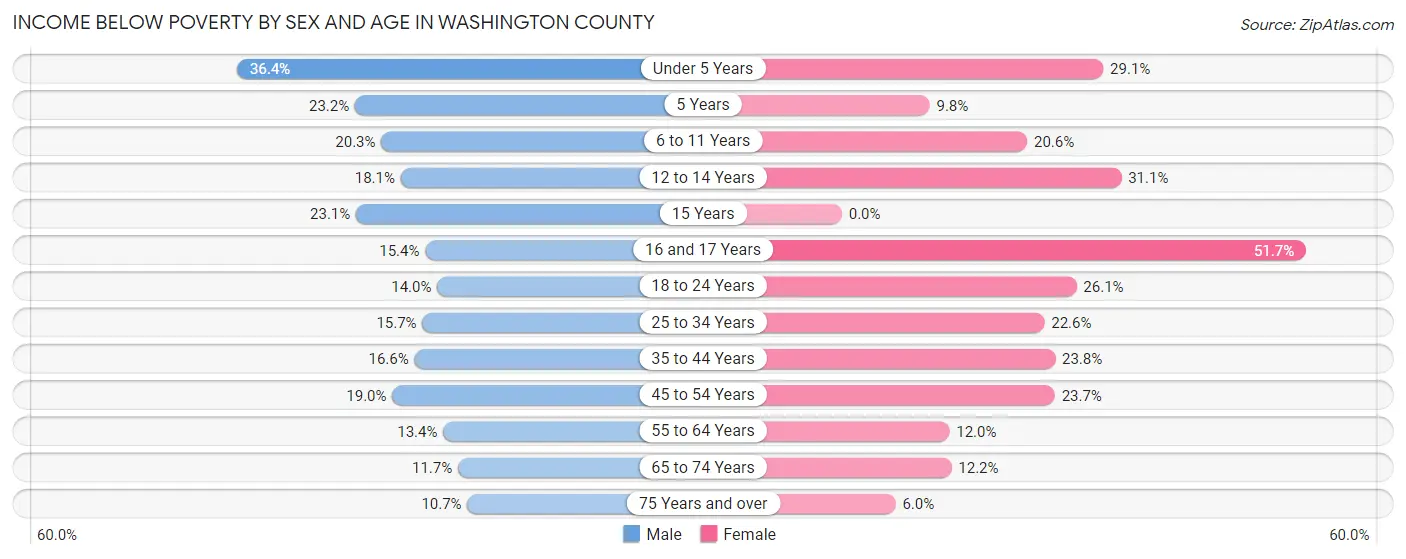
| Age Bracket | Male | Female |
| Under 5 Years | 225 (36.3%) | 186 (29.1%) |
| 5 Years | 29 (23.2%) | 25 (9.8%) |
| 6 to 11 Years | 227 (20.3%) | 196 (20.6%) |
| 12 to 14 Years | 80 (18.1%) | 89 (31.1%) |
| 15 Years | 21 (23.1%) | 0 (0.0%) |
| 16 and 17 Years | 61 (15.4%) | 213 (51.7%) |
| 18 to 24 Years | 120 (14.0%) | 203 (26.1%) |
| 25 to 34 Years | 203 (15.7%) | 299 (22.6%) |
| 35 to 44 Years | 219 (16.6%) | 319 (23.7%) |
| 45 to 54 Years | 309 (19.0%) | 341 (23.7%) |
| 55 to 64 Years | 216 (13.4%) | 199 (12.0%) |
| 65 to 74 Years | 130 (11.7%) | 153 (12.2%) |
| 75 Years and over | 74 (10.7%) | 45 (6.0%) |
| Total | 1,914 (16.9%) | 2,268 (20.3%) |
Income Above Poverty by Sex and Age in Washington County
According to the poverty statistics in Washington County, males aged 75 years and over and females aged 15 years are the age groups that are most secure financially, with 89.3% of males and 100.0% of females in these age groups living above the poverty line.
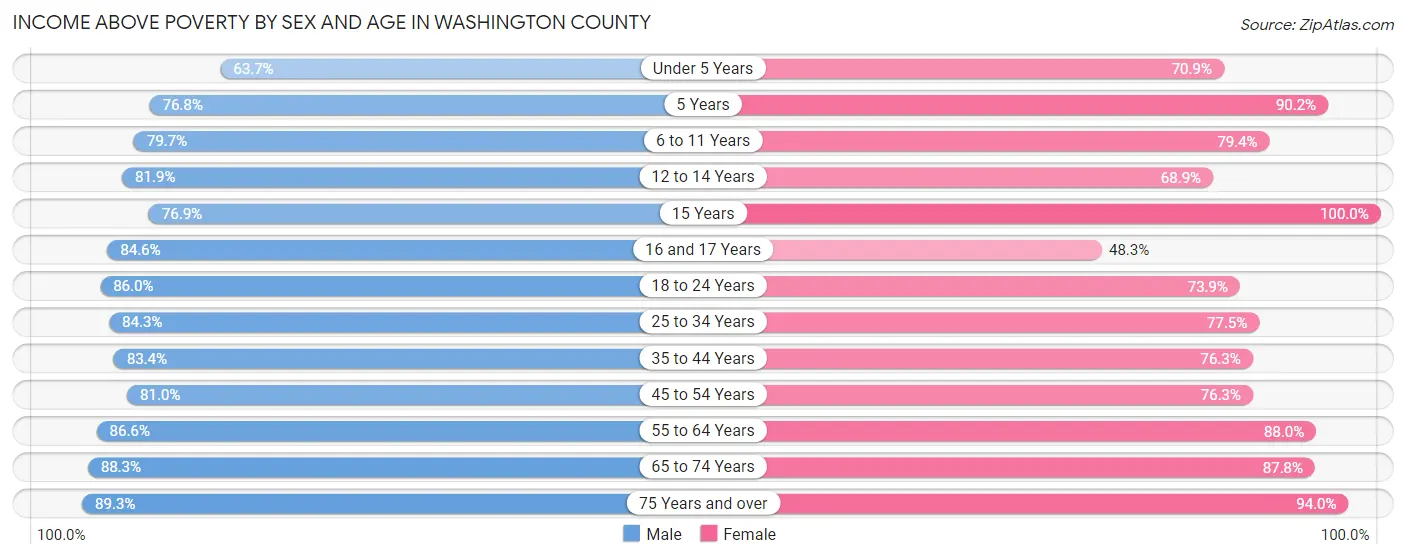
| Age Bracket | Male | Female |
| Under 5 Years | 394 (63.6%) | 453 (70.9%) |
| 5 Years | 96 (76.8%) | 231 (90.2%) |
| 6 to 11 Years | 893 (79.7%) | 754 (79.4%) |
| 12 to 14 Years | 362 (81.9%) | 197 (68.9%) |
| 15 Years | 70 (76.9%) | 86 (100.0%) |
| 16 and 17 Years | 336 (84.6%) | 199 (48.3%) |
| 18 to 24 Years | 735 (86.0%) | 574 (73.9%) |
| 25 to 34 Years | 1,091 (84.3%) | 1,027 (77.4%) |
| 35 to 44 Years | 1,103 (83.4%) | 1,024 (76.2%) |
| 45 to 54 Years | 1,314 (81.0%) | 1,097 (76.3%) |
| 55 to 64 Years | 1,400 (86.6%) | 1,464 (88.0%) |
| 65 to 74 Years | 978 (88.3%) | 1,101 (87.8%) |
| 75 Years and over | 619 (89.3%) | 707 (94.0%) |
| Total | 9,391 (83.1%) | 8,914 (79.7%) |
Income Below Poverty Among Married-Couple Families in Washington County
The poverty statistics for married-couple families in Washington County show that 9.9% or 451 of the total 4,538 families live below the poverty line. Families with 3 or 4 children have the highest poverty rate of 24.3%, comprising of 130 families. On the other hand, families with 5 or more children have the lowest poverty rate of 0.0%, which includes 0 families.
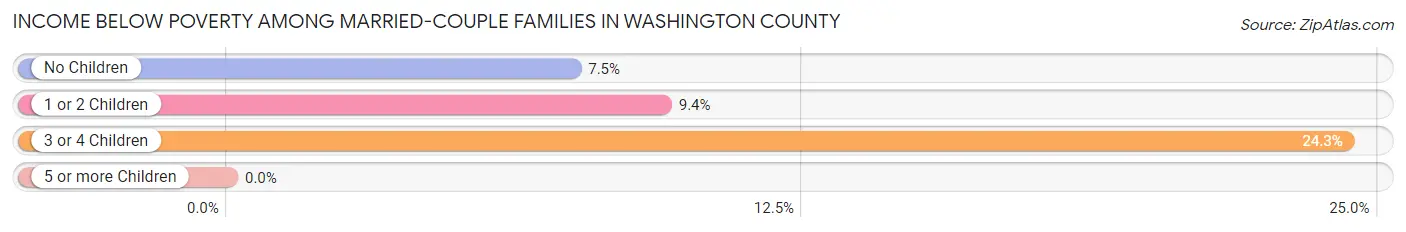
| Children | Above Poverty | Below Poverty |
| No Children | 2,625 (92.5%) | 212 (7.5%) |
| 1 or 2 Children | 1,046 (90.6%) | 109 (9.4%) |
| 3 or 4 Children | 405 (75.7%) | 130 (24.3%) |
| 5 or more Children | 11 (100.0%) | 0 (0.0%) |
| Total | 4,087 (90.1%) | 451 (9.9%) |
Income Below Poverty Among Single-Parent Households in Washington County
According to the poverty data in Washington County, 16.6% or 133 single-father households and 38.1% or 337 single-mother households are living below the poverty line. Among single-father households, those with 1 or 2 children have the highest poverty rate, with 128 households (22.8%) experiencing poverty. Likewise, among single-mother households, those with 5 or more children have the highest poverty rate, with 10 households (100.0%) falling below the poverty line.
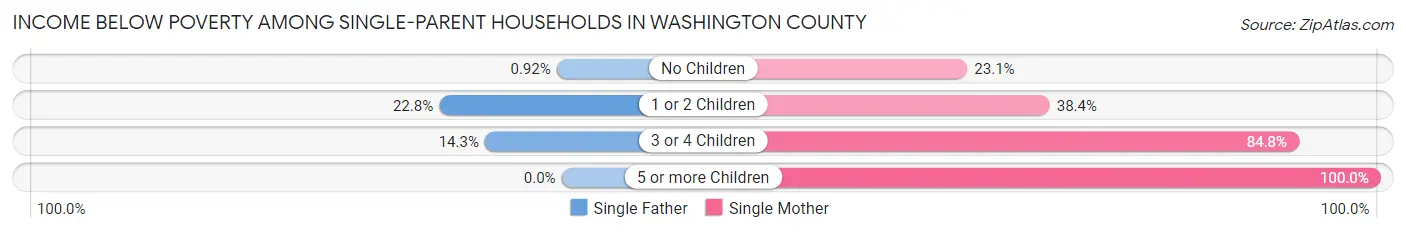
| Children | Single Father | Single Mother |
| No Children | 2 (0.9%) | 77 (23.1%) |
| 1 or 2 Children | 128 (22.8%) | 172 (38.4%) |
| 3 or 4 Children | 3 (14.3%) | 78 (84.8%) |
| 5 or more Children | 0 (0.0%) | 10 (100.0%) |
| Total | 133 (16.6%) | 337 (38.1%) |
Income Below Poverty Among Married-Couple vs Single-Parent Households in Washington County
The poverty data for Washington County shows that 451 of the married-couple family households (9.9%) and 470 of the single-parent households (27.9%) are living below the poverty level. Within the married-couple family households, those with 3 or 4 children have the highest poverty rate, with 130 households (24.3%) falling below the poverty line. Among the single-parent households, those with 5 or more children have the highest poverty rate, with 10 household (100.0%) living below poverty.
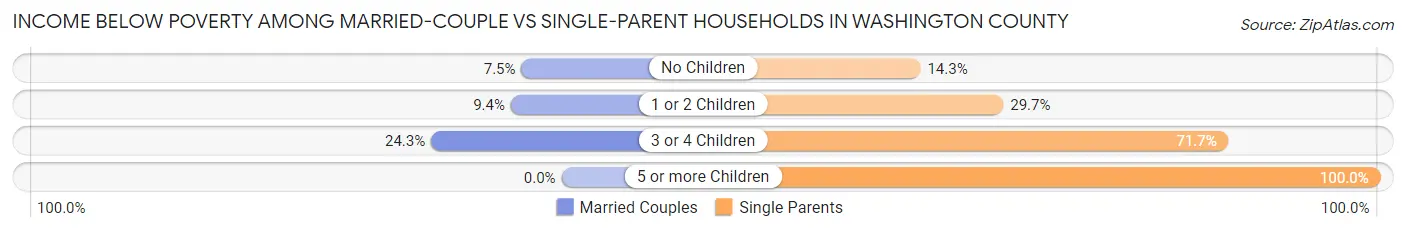
| Children | Married-Couple Families | Single-Parent Households |
| No Children | 212 (7.5%) | 79 (14.3%) |
| 1 or 2 Children | 109 (9.4%) | 300 (29.7%) |
| 3 or 4 Children | 130 (24.3%) | 81 (71.7%) |
| 5 or more Children | 0 (0.0%) | 10 (100.0%) |
| Total | 451 (9.9%) | 470 (27.9%) |
Race in Washington County
The most populous races in Washington County are White / Caucasian (21,942 | 93.0%), Two or more Races (1,086 | 4.6%), and Hispanic or Latino (397 | 1.7%).
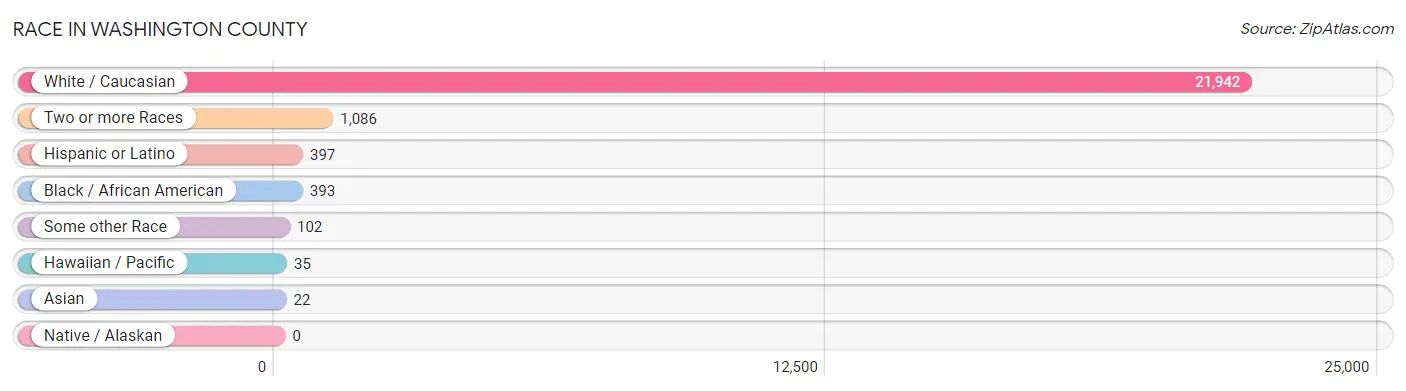
| Race | # Population | % Population |
| Asian | 22 | 0.1% |
| Black / African American | 393 | 1.7% |
| Hawaiian / Pacific | 35 | 0.2% |
| Hispanic or Latino | 397 | 1.7% |
| Native / Alaskan | 0 | 0.0% |
| White / Caucasian | 21,942 | 93.0% |
| Two or more Races | 1,086 | 4.6% |
| Some other Race | 102 | 0.4% |
| Total | 23,580 | 100.0% |
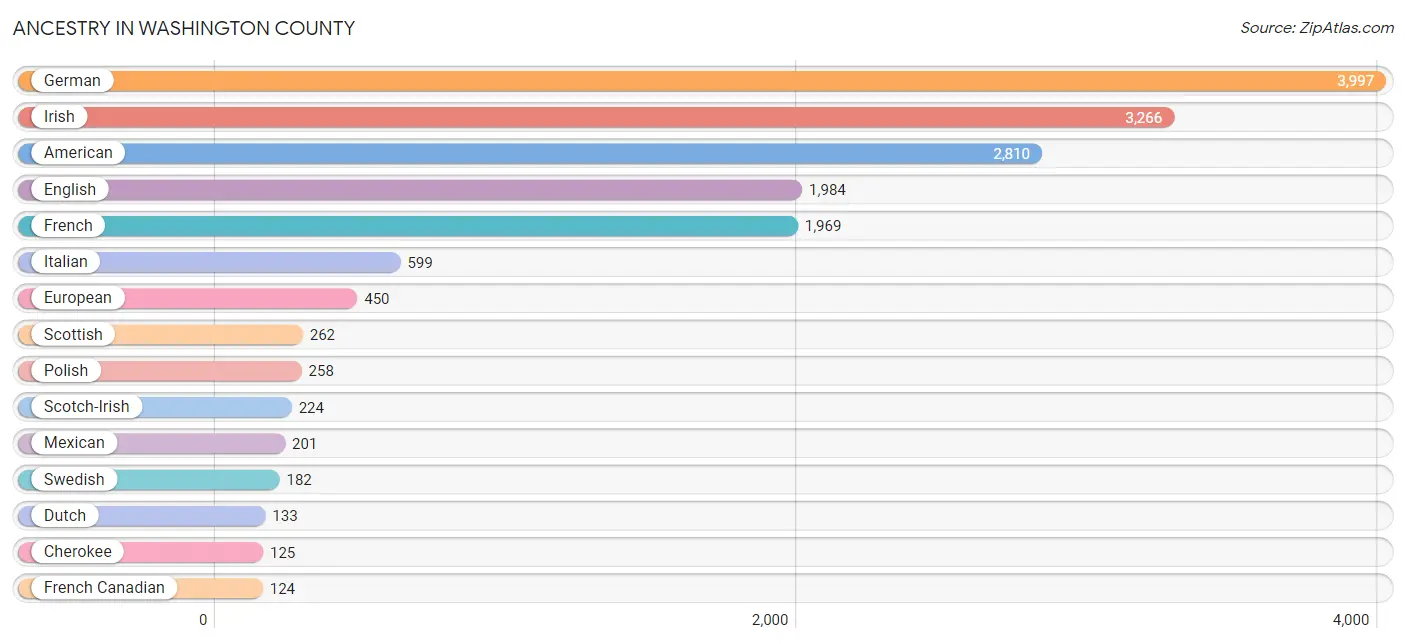
Ancestry in Washington County
The most populous ancestries reported in Washington County are German (3,997 | 17.0%), Irish (3,266 | 13.9%), American (2,810 | 11.9%), English (1,984 | 8.4%), and French (1,969 | 8.4%), together accounting for 59.5% of all Washington County residents.
| Ancestry | # Population | % Population |
| African | 4 | 0.0% |
| American | 2,810 | 11.9% |
| Apache | 21 | 0.1% |
| Arab | 9 | 0.0% |
| Austrian | 23 | 0.1% |
| Barbadian | 4 | 0.0% |
| Belgian | 13 | 0.1% |
| Bhutanese | 2 | 0.0% |
| Blackfeet | 12 | 0.1% |
| British | 70 | 0.3% |
| Burmese | 44 | 0.2% |
| Cambodian | 15 | 0.1% |
| Canadian | 43 | 0.2% |
| Central American | 33 | 0.1% |
| Cherokee | 125 | 0.5% |
| Chilean | 3 | 0.0% |
| Chippewa | 3 | 0.0% |
| Choctaw | 6 | 0.0% |
| Comanche | 21 | 0.1% |
| Czech | 14 | 0.1% |
| Danish | 88 | 0.4% |
| Dominican | 17 | 0.1% |
| Dutch | 133 | 0.6% |
| English | 1,984 | 8.4% |
| European | 450 | 1.9% |
| Finnish | 12 | 0.1% |
| French | 1,969 | 8.4% |
| French American Indian | 25 | 0.1% |
| French Canadian | 124 | 0.5% |
| German | 3,997 | 17.0% |
| Greek | 28 | 0.1% |
| Guamanian / Chamorro | 2 | 0.0% |
| Honduran | 27 | 0.1% |
| Hungarian | 21 | 0.1% |
| Indian (Asian) | 28 | 0.1% |
| Irish | 3,266 | 13.9% |
| Italian | 599 | 2.5% |
| Korean | 34 | 0.1% |
| Lebanese | 9 | 0.0% |
| Mexican | 201 | 0.9% |
| Native Hawaiian | 2 | 0.0% |
| Nicaraguan | 6 | 0.0% |
| Northern European | 34 | 0.1% |
| Norwegian | 101 | 0.4% |
| Pennsylvania German | 5 | 0.0% |
| Polish | 258 | 1.1% |
| Portuguese | 8 | 0.0% |
| Puerto Rican | 2 | 0.0% |
| Russian | 24 | 0.1% |
| Samoan | 2 | 0.0% |
| Scandinavian | 36 | 0.2% |
| Scotch-Irish | 224 | 0.9% |
| Scottish | 262 | 1.1% |
| Sioux | 4 | 0.0% |
| South American | 3 | 0.0% |
| Spaniard | 15 | 0.1% |
| Spanish | 18 | 0.1% |
| Sri Lankan | 2 | 0.0% |
| Subsaharan African | 4 | 0.0% |
| Swedish | 182 | 0.8% |
| Swiss | 16 | 0.1% |
| Ukrainian | 2 | 0.0% |
| Welsh | 42 | 0.2% |
| Yugoslavian | 7 | 0.0% | View All 64 Rows |
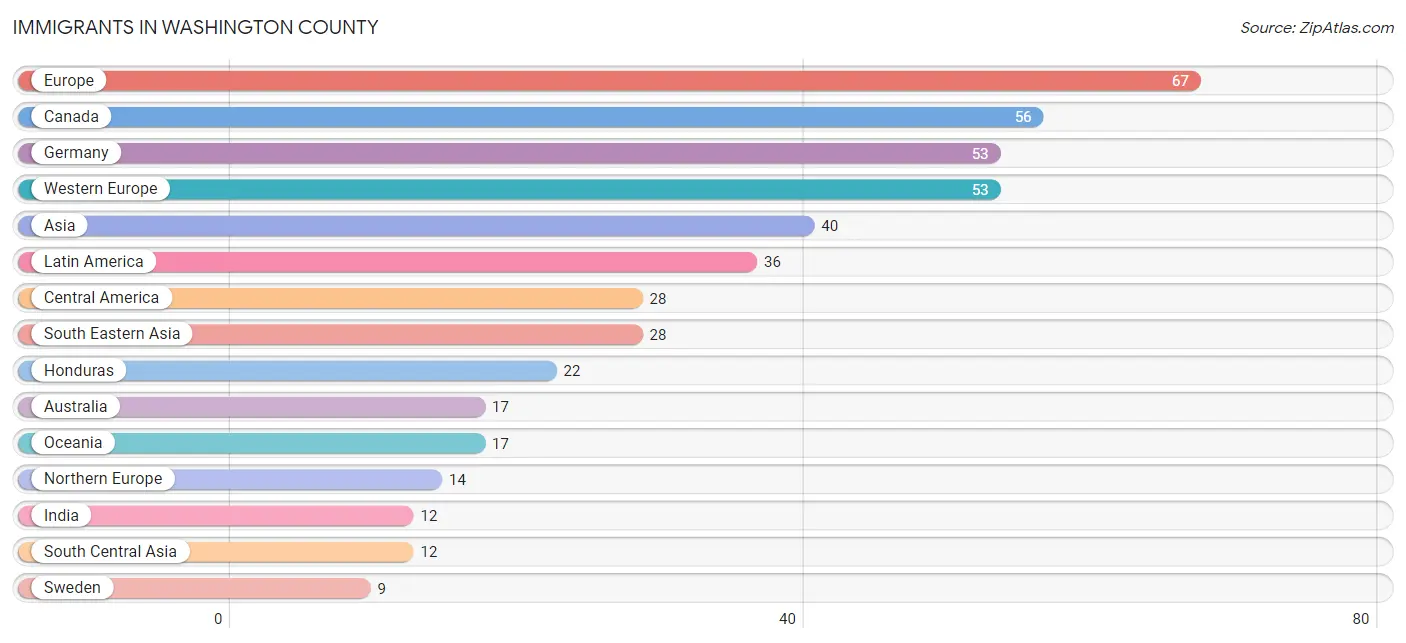
Immigrants in Washington County
The most numerous immigrant groups reported in Washington County came from Europe (67 | 0.3%), Canada (56 | 0.2%), Germany (53 | 0.2%), Western Europe (53 | 0.2%), and Asia (40 | 0.2%), together accounting for 1.1% of all Washington County residents.
| Immigration Origin | # Population | % Population |
| Asia | 40 | 0.2% |
| Australia | 17 | 0.1% |
| Canada | 56 | 0.2% |
| Central America | 28 | 0.1% |
| Chile | 3 | 0.0% |
| Colombia | 5 | 0.0% |
| Europe | 67 | 0.3% |
| Germany | 53 | 0.2% |
| Honduras | 22 | 0.1% |
| India | 12 | 0.1% |
| Laos | 3 | 0.0% |
| Latin America | 36 | 0.2% |
| Nicaragua | 6 | 0.0% |
| Northern Europe | 14 | 0.1% |
| Oceania | 17 | 0.1% |
| Philippines | 3 | 0.0% |
| South America | 8 | 0.0% |
| South Central Asia | 12 | 0.1% |
| South Eastern Asia | 28 | 0.1% |
| Sweden | 9 | 0.0% |
| Western Europe | 53 | 0.2% | View All 21 Rows |
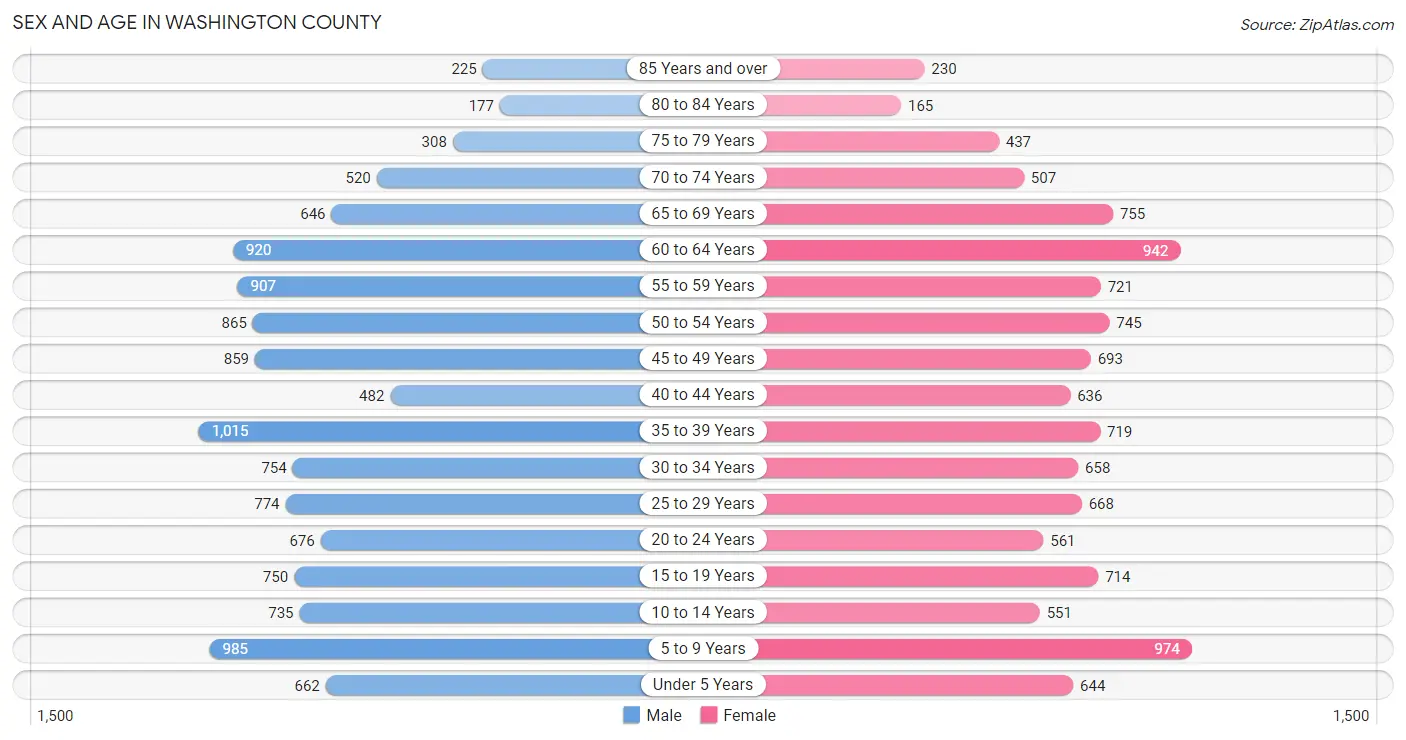
Sex and Age in Washington County
Sex and Age in Washington County
The most populous age groups in Washington County are 35 to 39 Years (1,015 | 8.3%) for men and 5 to 9 Years (974 | 8.6%) for women.
| Age Bracket | Male | Female |
| Under 5 Years | 662 (5.4%) | 644 (5.7%) |
| 5 to 9 Years | 985 (8.0%) | 974 (8.6%) |
| 10 to 14 Years | 735 (6.0%) | 551 (4.9%) |
| 15 to 19 Years | 750 (6.1%) | 714 (6.3%) |
| 20 to 24 Years | 676 (5.5%) | 561 (5.0%) |
| 25 to 29 Years | 774 (6.3%) | 668 (5.9%) |
| 30 to 34 Years | 754 (6.1%) | 658 (5.8%) |
| 35 to 39 Years | 1,015 (8.3%) | 719 (6.4%) |
| 40 to 44 Years | 482 (3.9%) | 636 (5.6%) |
| 45 to 49 Years | 859 (7.0%) | 693 (6.1%) |
| 50 to 54 Years | 865 (7.1%) | 745 (6.6%) |
| 55 to 59 Years | 907 (7.4%) | 721 (6.4%) |
| 60 to 64 Years | 920 (7.5%) | 942 (8.3%) |
| 65 to 69 Years | 646 (5.3%) | 755 (6.7%) |
| 70 to 74 Years | 520 (4.2%) | 507 (4.5%) |
| 75 to 79 Years | 308 (2.5%) | 437 (3.9%) |
| 80 to 84 Years | 177 (1.4%) | 165 (1.5%) |
| 85 Years and over | 225 (1.8%) | 230 (2.0%) |
| Total | 12,260 (100.0%) | 11,320 (100.0%) |
Families and Households in Washington County
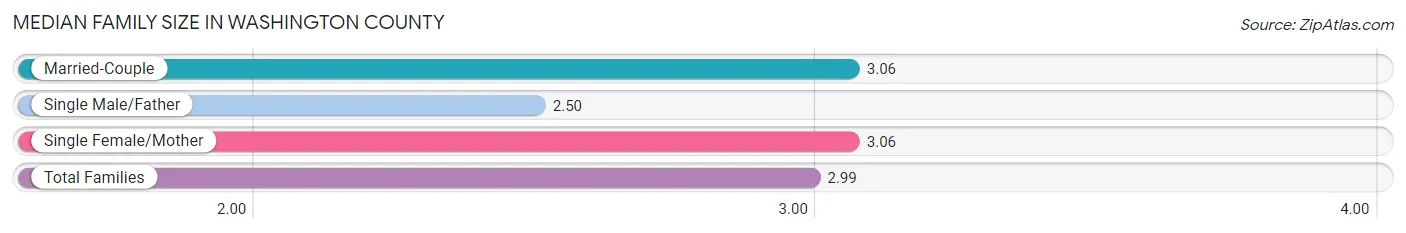
Median Family Size in Washington County
The median family size in Washington County is 2.99 persons per family, with married-couple families (4,538 | 72.9%) accounting for the largest median family size of 3.06 persons per family. On the other hand, single male/father families (800 | 12.9%) represent the smallest median family size with 2.50 persons per family.
| Family Type | # Families | Family Size |
| Married-Couple | 4,538 (72.9%) | 3.06 |
| Single Male/Father | 800 (12.9%) | 2.50 |
| Single Female/Mother | 884 (14.2%) | 3.06 |
| Total Families | 6,222 (100.0%) | 2.99 |
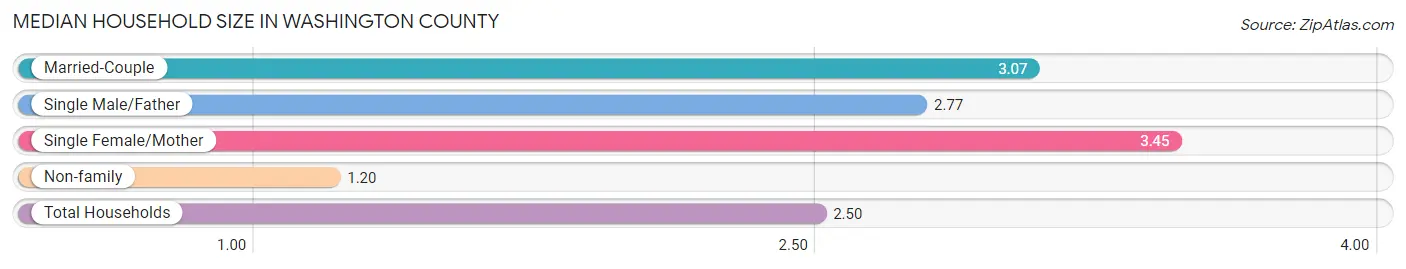
Median Household Size in Washington County
The median household size in Washington County is 2.50 persons per household, with single female/mother households (884 | 9.8%) accounting for the largest median household size of 3.45 persons per household. non-family households (2,810 | 31.1%) represent the smallest median household size with 1.20 persons per household.
| Household Type | # Households | Household Size |
| Married-Couple | 4,538 (50.2%) | 3.07 |
| Single Male/Father | 800 (8.9%) | 2.77 |
| Single Female/Mother | 884 (9.8%) | 3.45 |
| Non-family | 2,810 (31.1%) | 1.20 |
| Total Households | 9,032 (100.0%) | 2.50 |
Household Size by Marriage Status in Washington County
Out of a total of 9,032 households in Washington County, 6,222 (68.9%) are family households, while 2,810 (31.1%) are nonfamily households. The most numerous type of family households are 2-person households, comprising 2,799, and the most common type of nonfamily households are 1-person households, comprising 2,309.
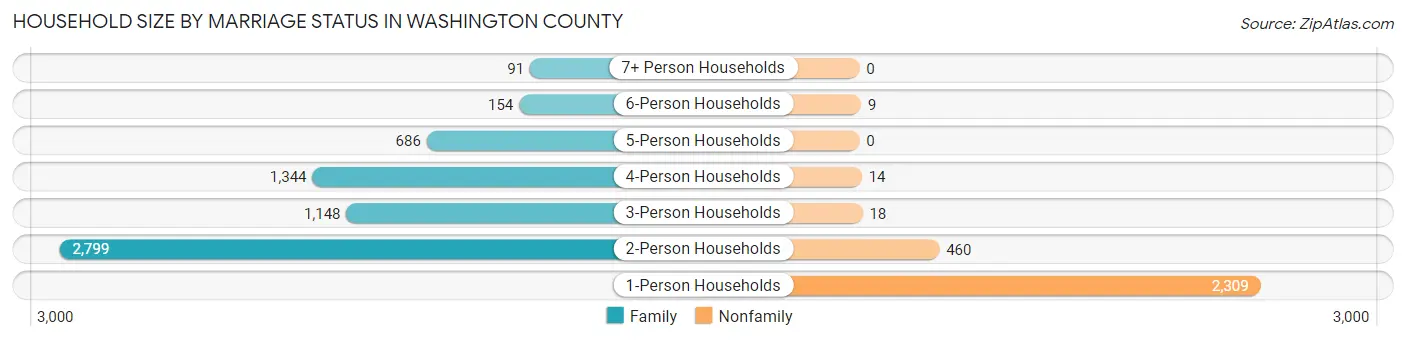
| Household Size | Family Households | Nonfamily Households |
| 1-Person Households | - | 2,309 (25.6%) |
| 2-Person Households | 2,799 (31.0%) | 460 (5.1%) |
| 3-Person Households | 1,148 (12.7%) | 18 (0.2%) |
| 4-Person Households | 1,344 (14.9%) | 14 (0.2%) |
| 5-Person Households | 686 (7.6%) | 0 (0.0%) |
| 6-Person Households | 154 (1.7%) | 9 (0.1%) |
| 7+ Person Households | 91 (1.0%) | 0 (0.0%) |
| Total | 6,222 (68.9%) | 2,810 (31.1%) |
Female Fertility in Washington County
Fertility by Age in Washington County
Average fertility rate in Washington County is 100.0 births per 1,000 women. Women in the age bracket of 20 to 34 years have the highest fertility rate with 189.0 births per 1,000 women. Women in the age bracket of 20 to 34 years acount for 74.5% of all women with births.
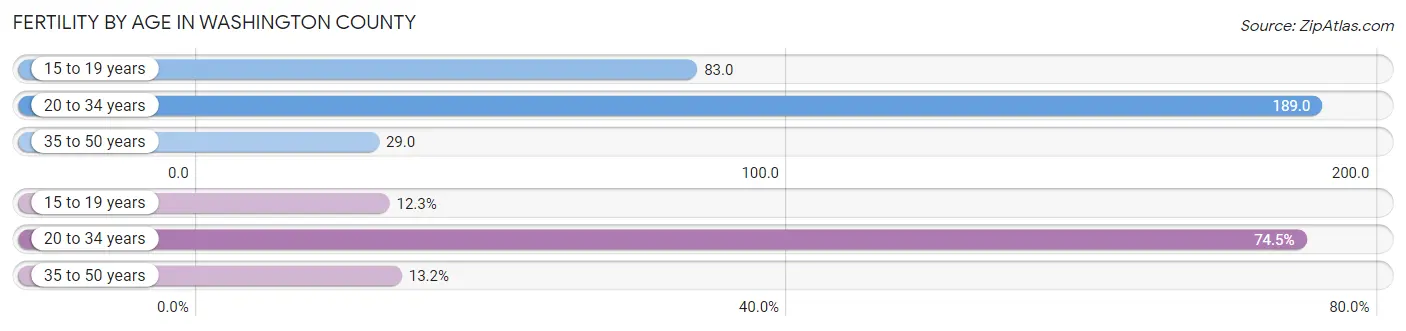
| Age Bracket | Women with Births | Births / 1,000 Women |
| 15 to 19 years | 59 (12.3%) | 83.0 |
| 20 to 34 years | 357 (74.5%) | 189.0 |
| 35 to 50 years | 63 (13.2%) | 29.0 |
| Total | 479 (100.0%) | 100.0 |
Fertility by Age by Marriage Status in Washington County
74.7% of women with births (479) in Washington County are married. The highest percentage of unmarried women with births falls into 15 to 19 years age bracket with 100.0% of them unmarried at the time of birth, while the lowest percentage of unmarried women with births belong to 20 to 34 years age bracket with 7.0% of them unmarried.
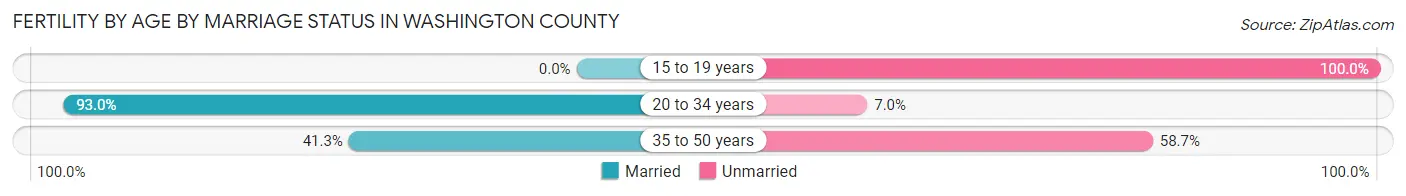
| Age Bracket | Married | Unmarried |
| 15 to 19 years | 0 (0.0%) | 59 (100.0%) |
| 20 to 34 years | 332 (93.0%) | 25 (7.0%) |
| 35 to 50 years | 26 (41.3%) | 37 (58.7%) |
| Total | 358 (74.7%) | 121 (25.3%) |
Fertility by Education in Washington County
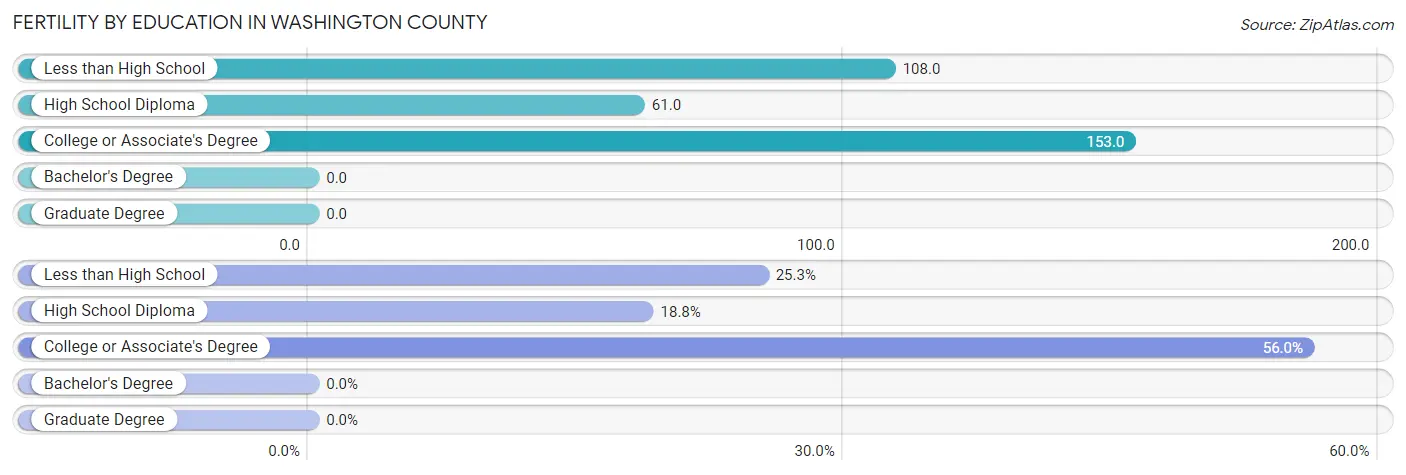
| Educational Attainment | Women with Births | Births / 1,000 Women |
| Less than High School | 121 (25.3%) | 108.0 |
| High School Diploma | 90 (18.8%) | 61.0 |
| College or Associate's Degree | 268 (55.9%) | 153.0 |
| Bachelor's Degree | 0 (0.0%) | 0.0 |
| Graduate Degree | 0 (0.0%) | 0.0 |
| Total | 479 (100.0%) | 100.0 |
Fertility by Education by Marriage Status in Washington County
25.3% of women with births in Washington County are unmarried. Women with the educational attainment of college or associate's degree are most likely to be married with 93.3% of them married at childbirth, while women with the educational attainment of less than high school are least likely to be married with 79.3% of them unmarried at childbirth.
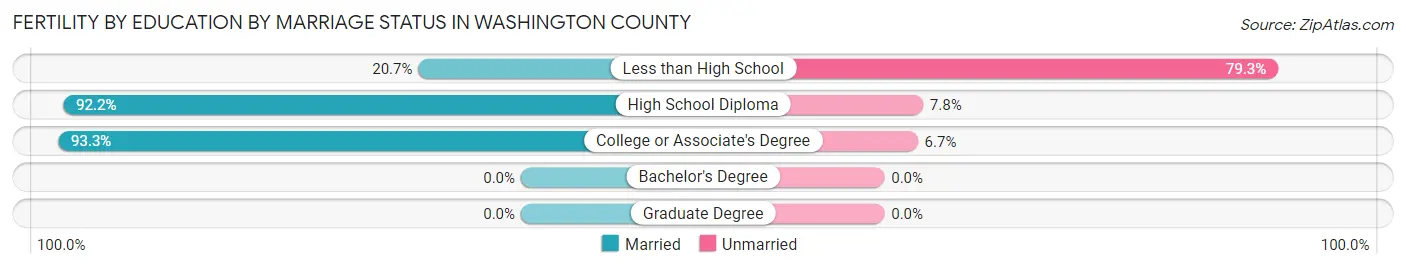
| Educational Attainment | Married | Unmarried |
| Less than High School | 25 (20.7%) | 96 (79.3%) |
| High School Diploma | 83 (92.2%) | 7 (7.8%) |
| College or Associate's Degree | 250 (93.3%) | 18 (6.7%) |
| Bachelor's Degree | 0 (0.0%) | 0 (0.0%) |
| Graduate Degree | 0 (0.0%) | 0 (0.0%) |
| Total | 358 (74.7%) | 121 (25.3%) |
Employment Characteristics in Washington County
Employment by Class of Employer in Washington County
Among the 9,003 employed individuals in Washington County, private company employees (6,010 | 66.8%), not-for-profit organizations (806 | 8.9%), and local government employees (627 | 7.0%) make up the most common classes of employment.

| Employer Class | # Employees | % Employees |
| Private Company Employees | 6,010 | 66.8% |
| Self-Employed (Incorporated) | 334 | 3.7% |
| Self-Employed (Not Incorporated) | 498 | 5.5% |
| Not-for-profit Organizations | 806 | 8.9% |
| Local Government Employees | 627 | 7.0% |
| State Government Employees | 269 | 3.0% |
| Federal Government Employees | 425 | 4.7% |
| Unpaid Family Workers | 34 | 0.4% |
| Total | 9,003 | 100.0% |
Employment Status by Age in Washington County
According to the labor force statistics for Washington County, out of the total population over 16 years of age (18,852), 51.2% or 9,652 individuals are in the labor force, with 4.4% or 425 of them unemployed. The age group with the highest labor force participation rate is 35 to 44 years, with 72.9% or 2,079 individuals in the labor force. Within the labor force, the 16 to 19 years age range has the highest percentage of unemployed individuals, with 8.3% or 37 of them being unemployed.
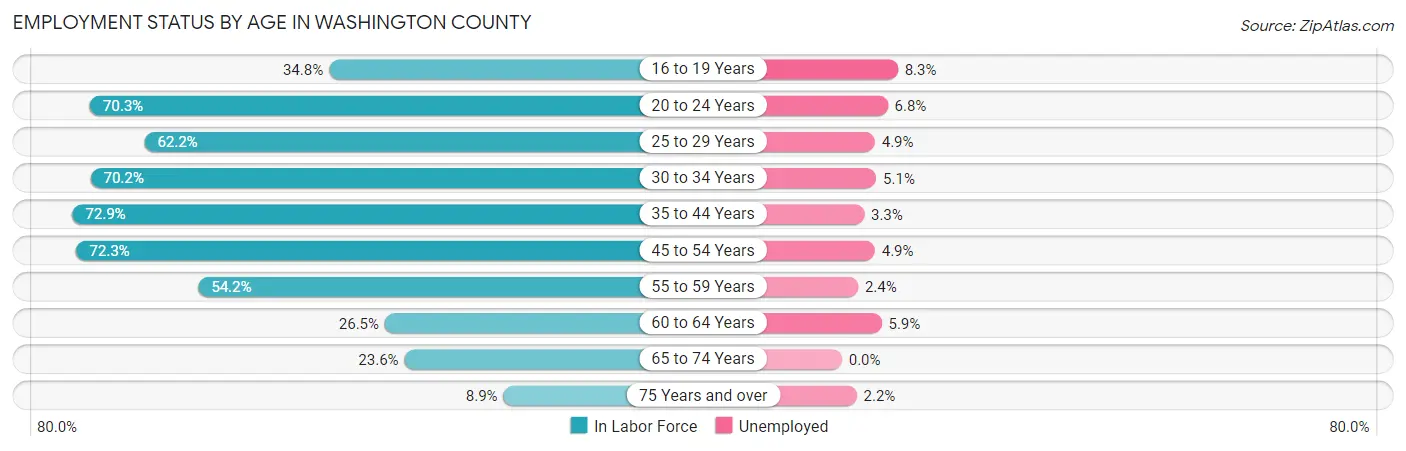
| Age Bracket | In Labor Force | Unemployed |
| 16 to 19 Years | 448 (34.8%) | 37 (8.3%) |
| 20 to 24 Years | 870 (70.3%) | 59 (6.8%) |
| 25 to 29 Years | 897 (62.2%) | 44 (4.9%) |
| 30 to 34 Years | 991 (70.2%) | 51 (5.1%) |
| 35 to 44 Years | 2,079 (72.9%) | 69 (3.3%) |
| 45 to 54 Years | 2,286 (72.3%) | 112 (4.9%) |
| 55 to 59 Years | 882 (54.2%) | 21 (2.4%) |
| 60 to 64 Years | 493 (26.5%) | 29 (5.9%) |
| 65 to 74 Years | 573 (23.6%) | 0 (0.0%) |
| 75 Years and over | 137 (8.9%) | 3 (2.2%) |
| Total | 9,652 (51.2%) | 425 (4.4%) |
Employment Status by Educational Attainment in Washington County
According to labor force statistics for Washington County, 61.7% of individuals (7,625) out of the total population between 25 and 64 years of age (12,358) are in the labor force, with 4.3% or 328 of them being unemployed. The group with the highest labor force participation rate are those with the educational attainment of bachelor's degree or higher, with 72.9% or 1,048 individuals in the labor force. Within the labor force, individuals with less than high school education have the highest percentage of unemployment, with 11.8% or 99 of them being unemployed.
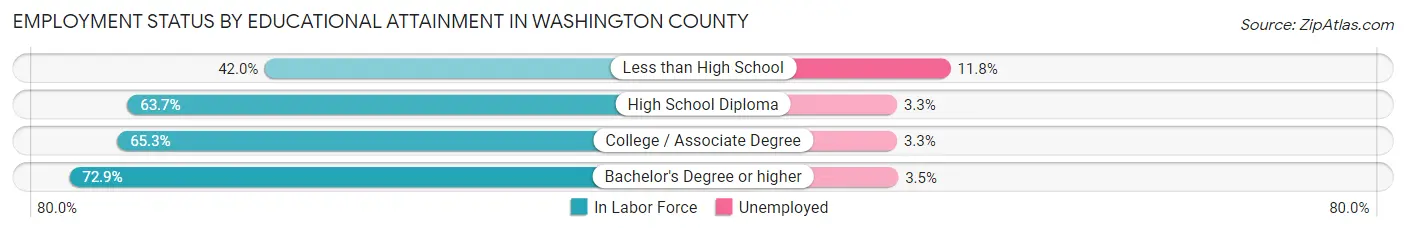
| Educational Attainment | In Labor Force | Unemployed |
| Less than High School | 838 (42.0%) | 236 (11.8%) |
| High School Diploma | 3,435 (63.7%) | 178 (3.3%) |
| College / Associate Degree | 2,306 (65.3%) | 117 (3.3%) |
| Bachelor's Degree or higher | 1,048 (72.9%) | 50 (3.5%) |
| Total | 7,625 (61.7%) | 531 (4.3%) |
Employment Occupations by Sex in Washington County
Management, Business, Science and Arts Occupations
The most common Management, Business, Science and Arts occupations in Washington County are Management (767 | 8.3%), Health Diagnosing & Treating (584 | 6.3%), Community & Social Service (576 | 6.2%), Health Technologists (353 | 3.8%), and Education Instruction & Library (352 | 3.8%).
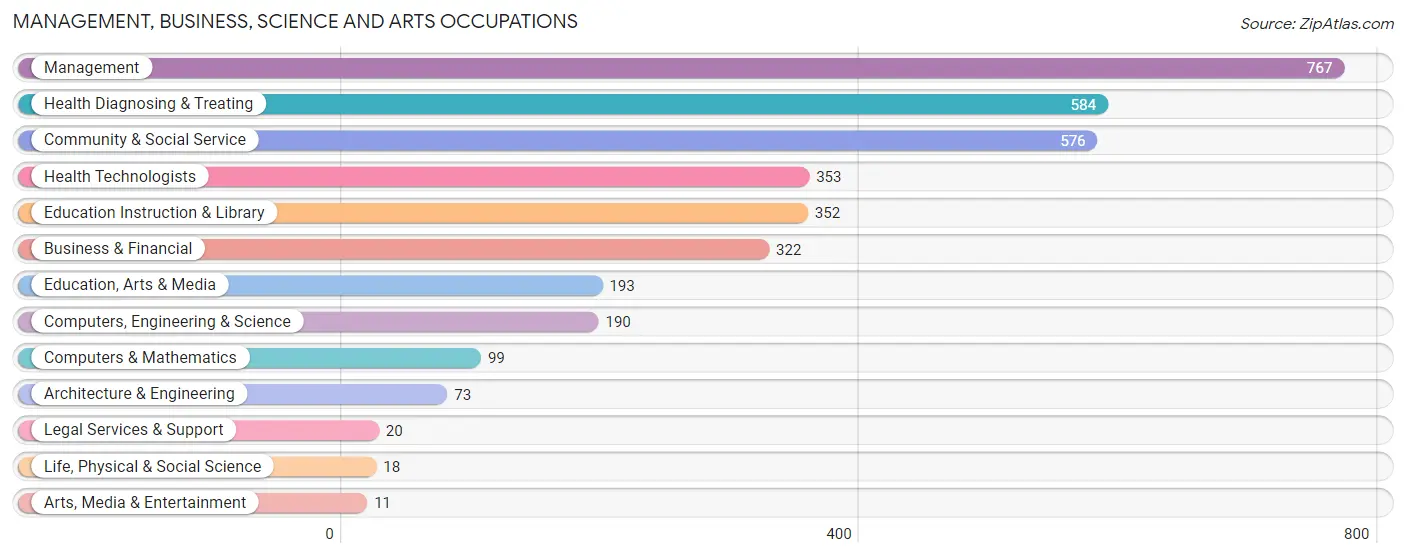
Management, Business, Science and Arts Occupations by Sex
Within the Management, Business, Science and Arts occupations in Washington County, the most male-oriented occupations are Life, Physical & Social Science (100.0%), Architecture & Engineering (95.9%), and Computers, Engineering & Science (77.4%), while the most female-oriented occupations are Legal Services & Support (100.0%), Arts, Media & Entertainment (100.0%), and Health Technologists (95.2%).
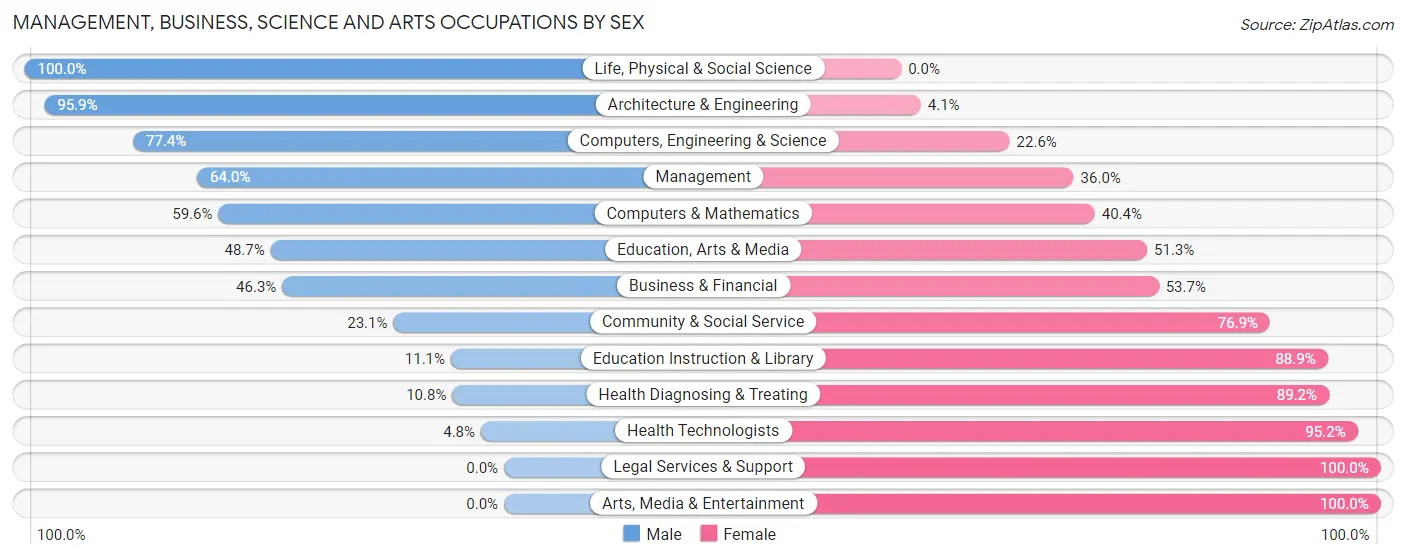
| Occupation | Male | Female |
| Management | 491 (64.0%) | 276 (36.0%) |
| Business & Financial | 149 (46.3%) | 173 (53.7%) |
| Computers, Engineering & Science | 147 (77.4%) | 43 (22.6%) |
| Computers & Mathematics | 59 (59.6%) | 40 (40.4%) |
| Architecture & Engineering | 70 (95.9%) | 3 (4.1%) |
| Life, Physical & Social Science | 18 (100.0%) | 0 (0.0%) |
| Community & Social Service | 133 (23.1%) | 443 (76.9%) |
| Education, Arts & Media | 94 (48.7%) | 99 (51.3%) |
| Legal Services & Support | 0 (0.0%) | 20 (100.0%) |
| Education Instruction & Library | 39 (11.1%) | 313 (88.9%) |
| Arts, Media & Entertainment | 0 (0.0%) | 11 (100.0%) |
| Health Diagnosing & Treating | 63 (10.8%) | 521 (89.2%) |
| Health Technologists | 17 (4.8%) | 336 (95.2%) |
| Total (Category) | 983 (40.3%) | 1,456 (59.7%) |
| Total (Overall) | 5,068 (54.9%) | 4,165 (45.1%) |
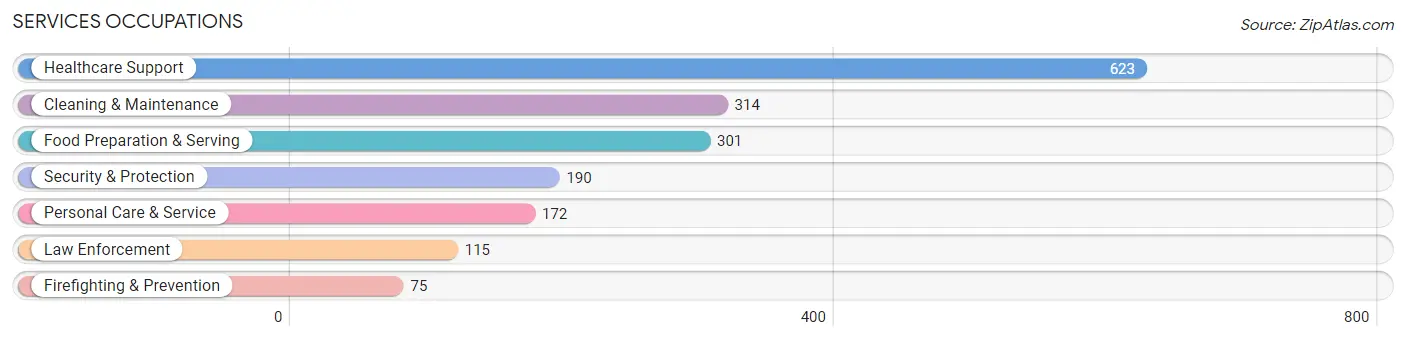
Services Occupations
The most common Services occupations in Washington County are Healthcare Support (623 | 6.8%), Cleaning & Maintenance (314 | 3.4%), Food Preparation & Serving (301 | 3.3%), Security & Protection (190 | 2.1%), and Personal Care & Service (172 | 1.9%).
Services Occupations by Sex
Within the Services occupations in Washington County, the most male-oriented occupations are Firefighting & Prevention (92.0%), Security & Protection (75.8%), and Law Enforcement (65.2%), while the most female-oriented occupations are Healthcare Support (75.9%), Personal Care & Service (58.1%), and Food Preparation & Serving (56.5%).
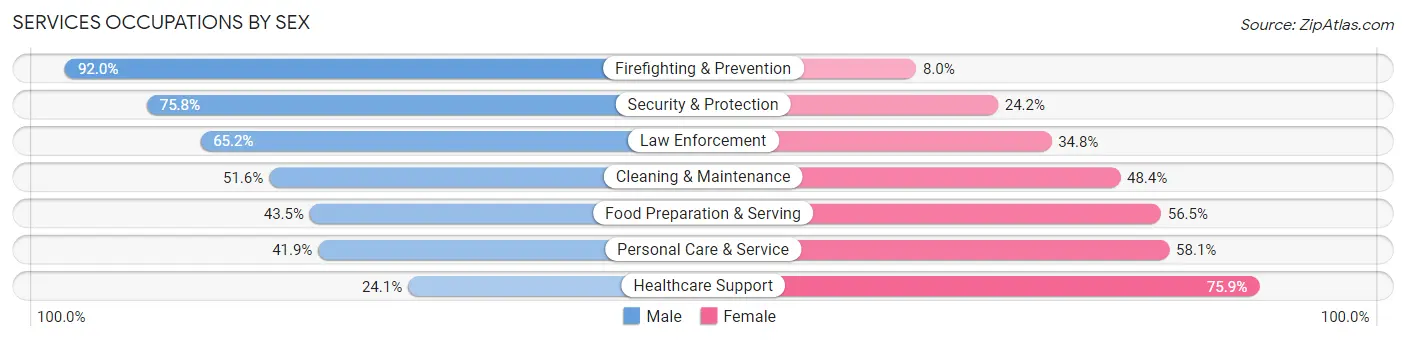
| Occupation | Male | Female |
| Healthcare Support | 150 (24.1%) | 473 (75.9%) |
| Security & Protection | 144 (75.8%) | 46 (24.2%) |
| Firefighting & Prevention | 69 (92.0%) | 6 (8.0%) |
| Law Enforcement | 75 (65.2%) | 40 (34.8%) |
| Food Preparation & Serving | 131 (43.5%) | 170 (56.5%) |
| Cleaning & Maintenance | 162 (51.6%) | 152 (48.4%) |
| Personal Care & Service | 72 (41.9%) | 100 (58.1%) |
| Total (Category) | 659 (41.2%) | 941 (58.8%) |
| Total (Overall) | 5,068 (54.9%) | 4,165 (45.1%) |
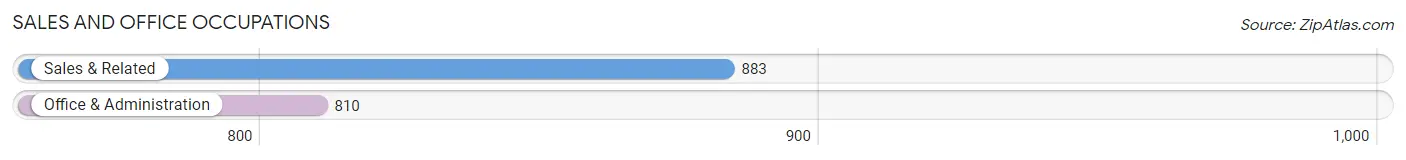
Sales and Office Occupations
The most common Sales and Office occupations in Washington County are Sales & Related (883 | 9.6%), and Office & Administration (810 | 8.8%).
Sales and Office Occupations by Sex
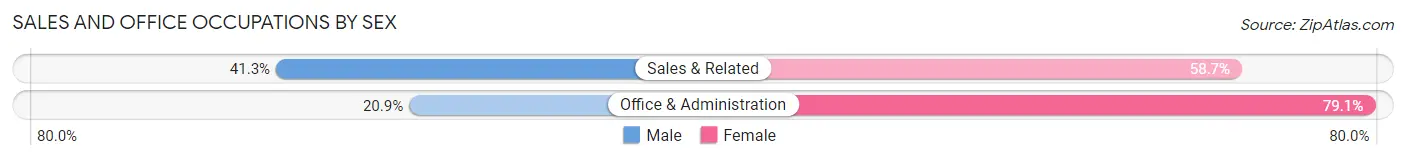
| Occupation | Male | Female |
| Sales & Related | 365 (41.3%) | 518 (58.7%) |
| Office & Administration | 169 (20.9%) | 641 (79.1%) |
| Total (Category) | 534 (31.5%) | 1,159 (68.5%) |
| Total (Overall) | 5,068 (54.9%) | 4,165 (45.1%) |
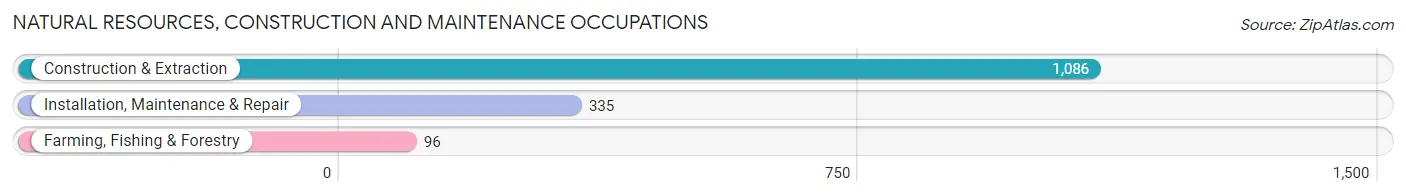
Natural Resources, Construction and Maintenance Occupations
The most common Natural Resources, Construction and Maintenance occupations in Washington County are Construction & Extraction (1,086 | 11.8%), Installation, Maintenance & Repair (335 | 3.6%), and Farming, Fishing & Forestry (96 | 1.0%).
Natural Resources, Construction and Maintenance Occupations by Sex
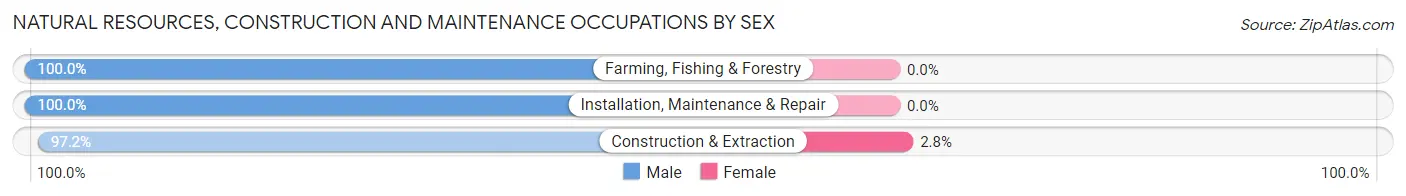
| Occupation | Male | Female |
| Farming, Fishing & Forestry | 96 (100.0%) | 0 (0.0%) |
| Construction & Extraction | 1,056 (97.2%) | 30 (2.8%) |
| Installation, Maintenance & Repair | 335 (100.0%) | 0 (0.0%) |
| Total (Category) | 1,487 (98.0%) | 30 (2.0%) |
| Total (Overall) | 5,068 (54.9%) | 4,165 (45.1%) |
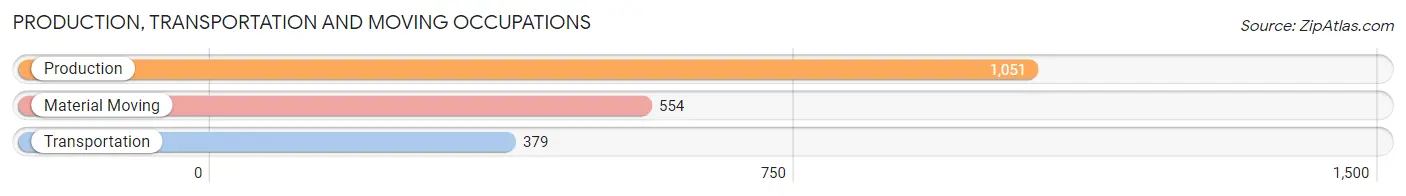
Production, Transportation and Moving Occupations
The most common Production, Transportation and Moving occupations in Washington County are Production (1,051 | 11.4%), Material Moving (554 | 6.0%), and Transportation (379 | 4.1%).
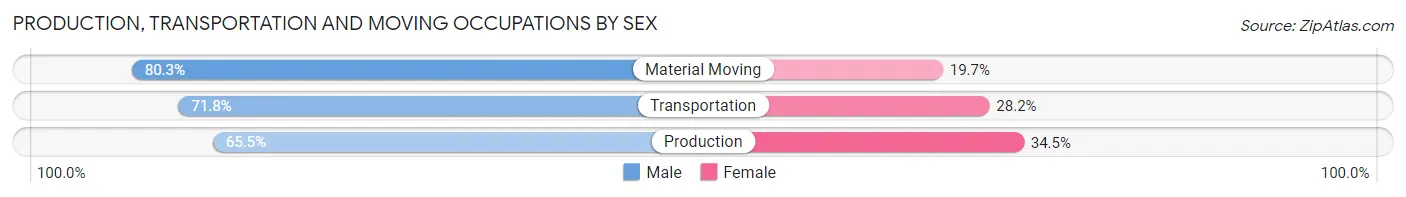
Production, Transportation and Moving Occupations by Sex
| Occupation | Male | Female |
| Production | 688 (65.5%) | 363 (34.5%) |
| Transportation | 272 (71.8%) | 107 (28.2%) |
| Material Moving | 445 (80.3%) | 109 (19.7%) |
| Total (Category) | 1,405 (70.8%) | 579 (29.2%) |
| Total (Overall) | 5,068 (54.9%) | 4,165 (45.1%) |
Employment Industries by Sex in Washington County
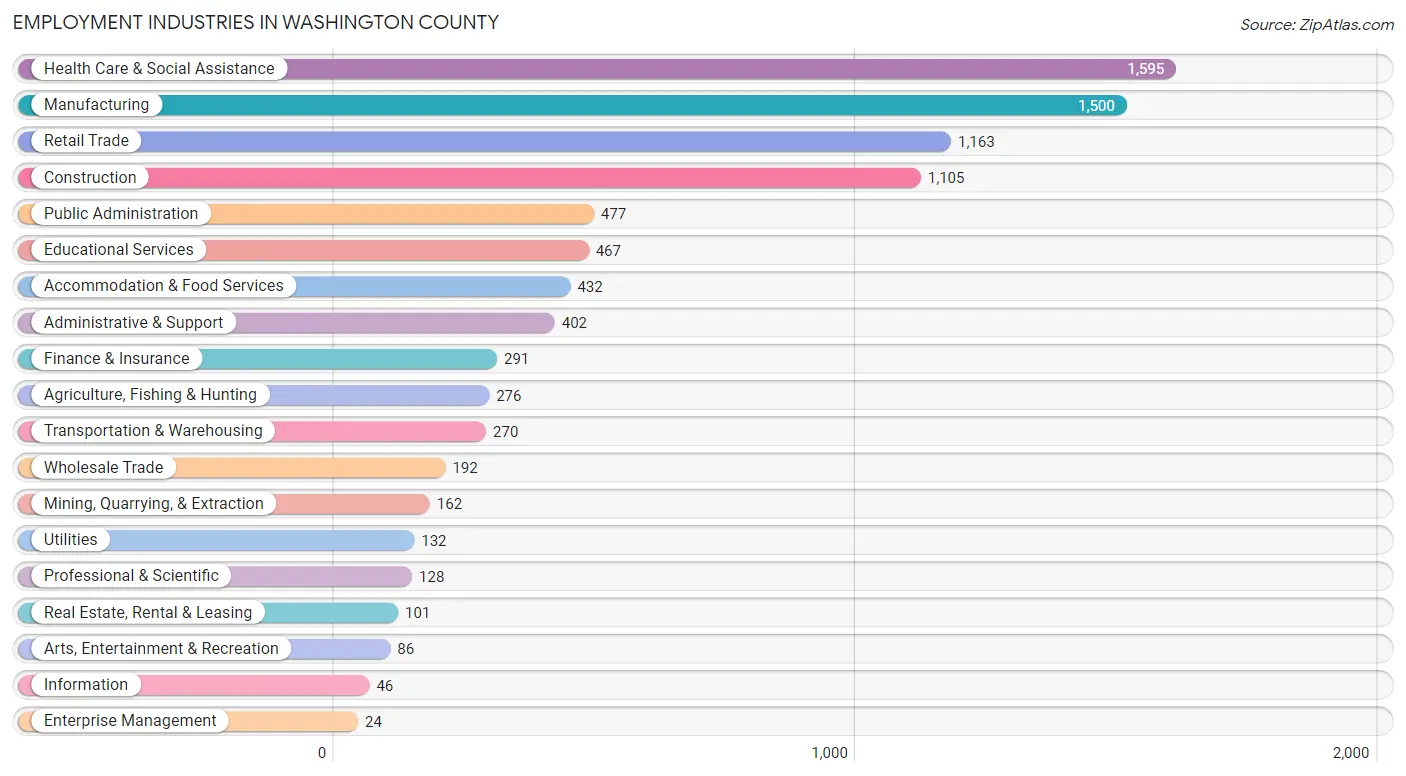
Employment Industries in Washington County
The major employment industries in Washington County include Health Care & Social Assistance (1,595 | 17.3%), Manufacturing (1,500 | 16.3%), Retail Trade (1,163 | 12.6%), Construction (1,105 | 12.0%), and Public Administration (477 | 5.2%).
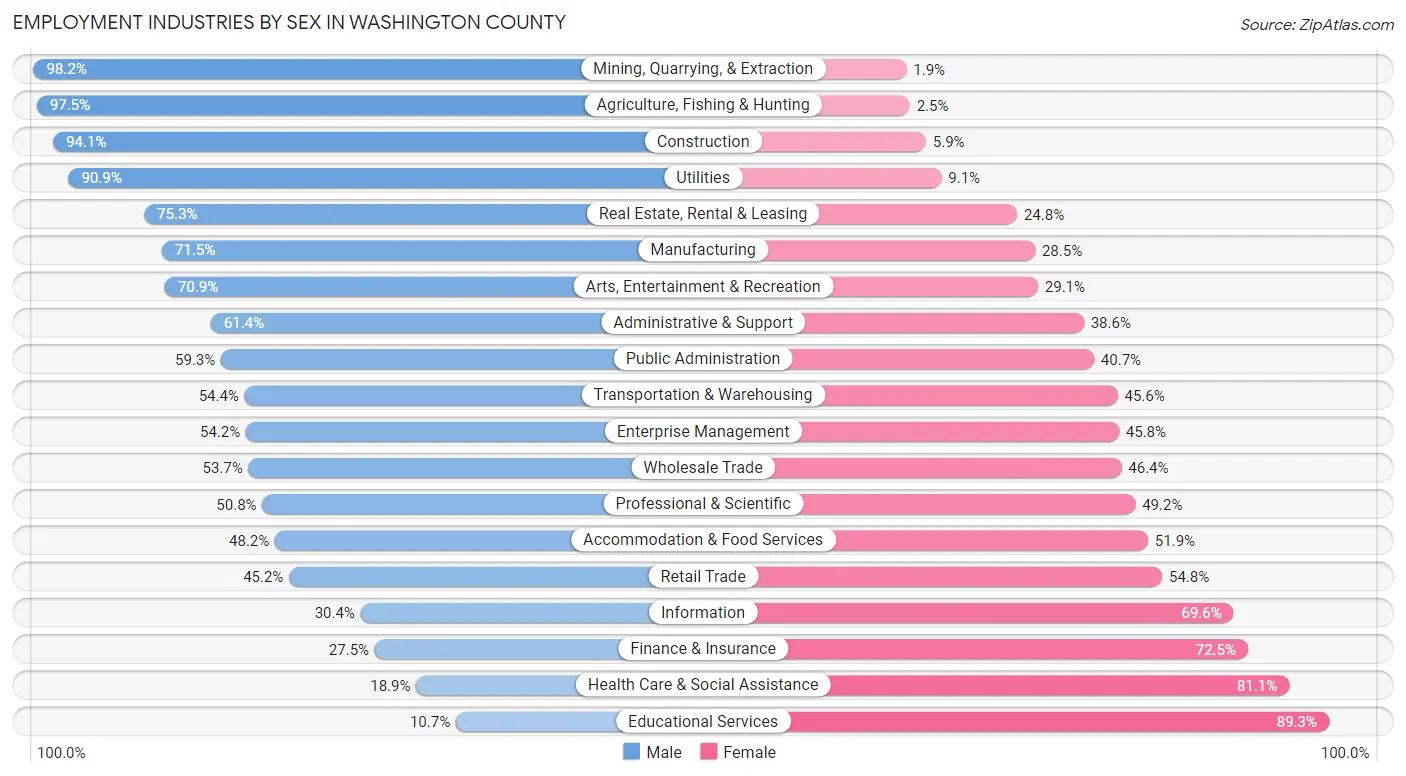
Employment Industries by Sex in Washington County
The Washington County industries that see more men than women are Mining, Quarrying, & Extraction (98.2%), Agriculture, Fishing & Hunting (97.5%), and Construction (94.1%), whereas the industries that tend to have a higher number of women are Educational Services (89.3%), Health Care & Social Assistance (81.1%), and Finance & Insurance (72.5%).
| Industry | Male | Female |
| Agriculture, Fishing & Hunting | 269 (97.5%) | 7 (2.5%) |
| Mining, Quarrying, & Extraction | 159 (98.2%) | 3 (1.8%) |
| Construction | 1,040 (94.1%) | 65 (5.9%) |
| Manufacturing | 1,073 (71.5%) | 427 (28.5%) |
| Wholesale Trade | 103 (53.6%) | 89 (46.4%) |
| Retail Trade | 526 (45.2%) | 637 (54.8%) |
| Transportation & Warehousing | 147 (54.4%) | 123 (45.6%) |
| Utilities | 120 (90.9%) | 12 (9.1%) |
| Information | 14 (30.4%) | 32 (69.6%) |
| Finance & Insurance | 80 (27.5%) | 211 (72.5%) |
| Real Estate, Rental & Leasing | 76 (75.2%) | 25 (24.7%) |
| Professional & Scientific | 65 (50.8%) | 63 (49.2%) |
| Enterprise Management | 13 (54.2%) | 11 (45.8%) |
| Administrative & Support | 247 (61.4%) | 155 (38.6%) |
| Educational Services | 50 (10.7%) | 417 (89.3%) |
| Health Care & Social Assistance | 302 (18.9%) | 1,293 (81.1%) |
| Arts, Entertainment & Recreation | 61 (70.9%) | 25 (29.1%) |
| Accommodation & Food Services | 208 (48.1%) | 224 (51.8%) |
| Public Administration | 283 (59.3%) | 194 (40.7%) |
| Total | 5,068 (54.9%) | 4,165 (45.1%) |
Education in Washington County
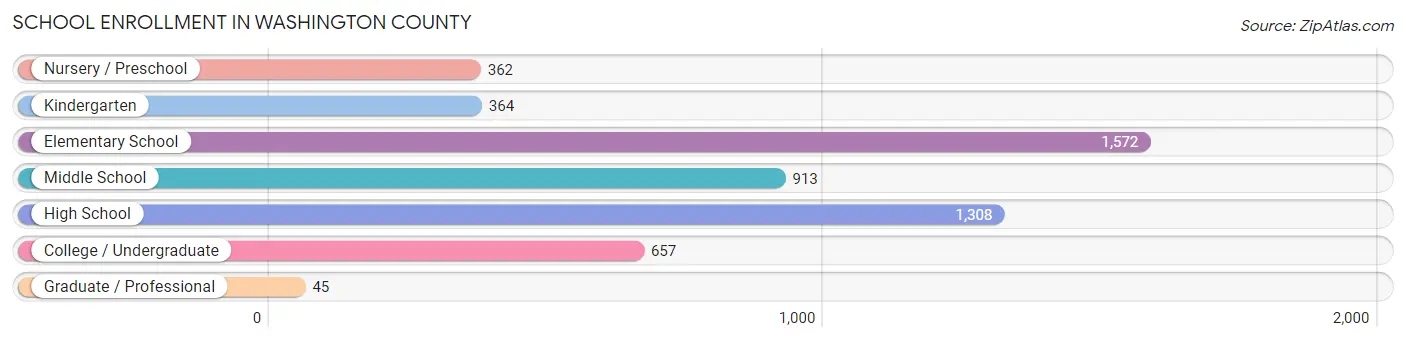
School Enrollment in Washington County
The most common levels of schooling among the 5,221 students in Washington County are elementary school (1,572 | 30.1%), high school (1,308 | 25.1%), and middle school (913 | 17.5%).
| School Level | # Students | % Students |
| Nursery / Preschool | 362 | 6.9% |
| Kindergarten | 364 | 7.0% |
| Elementary School | 1,572 | 30.1% |
| Middle School | 913 | 17.5% |
| High School | 1,308 | 25.1% |
| College / Undergraduate | 657 | 12.6% |
| Graduate / Professional | 45 | 0.9% |
| Total | 5,221 | 100.0% |
School Enrollment by Age by Funding Source in Washington County
Out of a total of 5,221 students who are enrolled in schools in Washington County, 684 (13.1%) attend a private institution, while the remaining 4,537 (86.9%) are enrolled in public schools. The age group of 35 years and over has the highest likelihood of being enrolled in private schools, with 38 (32.5% in the age bracket) enrolled. Conversely, the age group of 15 to 17 year olds has the lowest likelihood of being enrolled in a private school, with 948 (96.3% in the age bracket) attending a public institution.
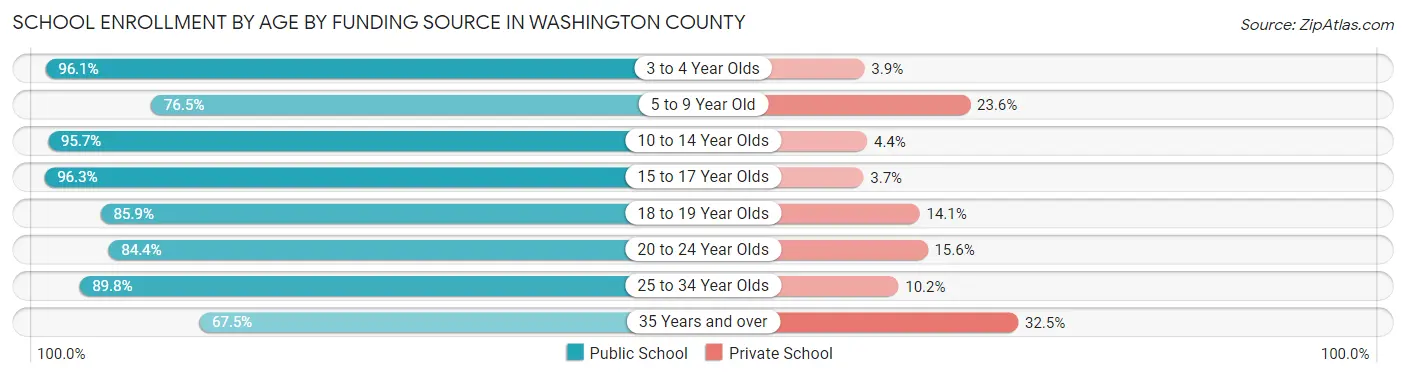
| Age Bracket | Public School | Private School |
| 3 to 4 Year Olds | 199 (96.1%) | 8 (3.9%) |
| 5 to 9 Year Old | 1,419 (76.4%) | 437 (23.5%) |
| 10 to 14 Year Olds | 1,230 (95.7%) | 56 (4.3%) |
| 15 to 17 Year Olds | 948 (96.3%) | 36 (3.7%) |
| 18 to 19 Year Olds | 249 (85.9%) | 41 (14.1%) |
| 20 to 24 Year Olds | 265 (84.4%) | 49 (15.6%) |
| 25 to 34 Year Olds | 150 (89.8%) | 17 (10.2%) |
| 35 Years and over | 79 (67.5%) | 38 (32.5%) |
| Total | 4,537 (86.9%) | 684 (13.1%) |
Educational Attainment by Field of Study in Washington County
Education (630 | 29.1%), science & technology (373 | 17.2%), business (370 | 17.1%), bio, nature & agricultural (158 | 7.3%), and social sciences (150 | 6.9%) are the most common fields of study among 2,168 individuals in Washington County who have obtained a bachelor's degree or higher.
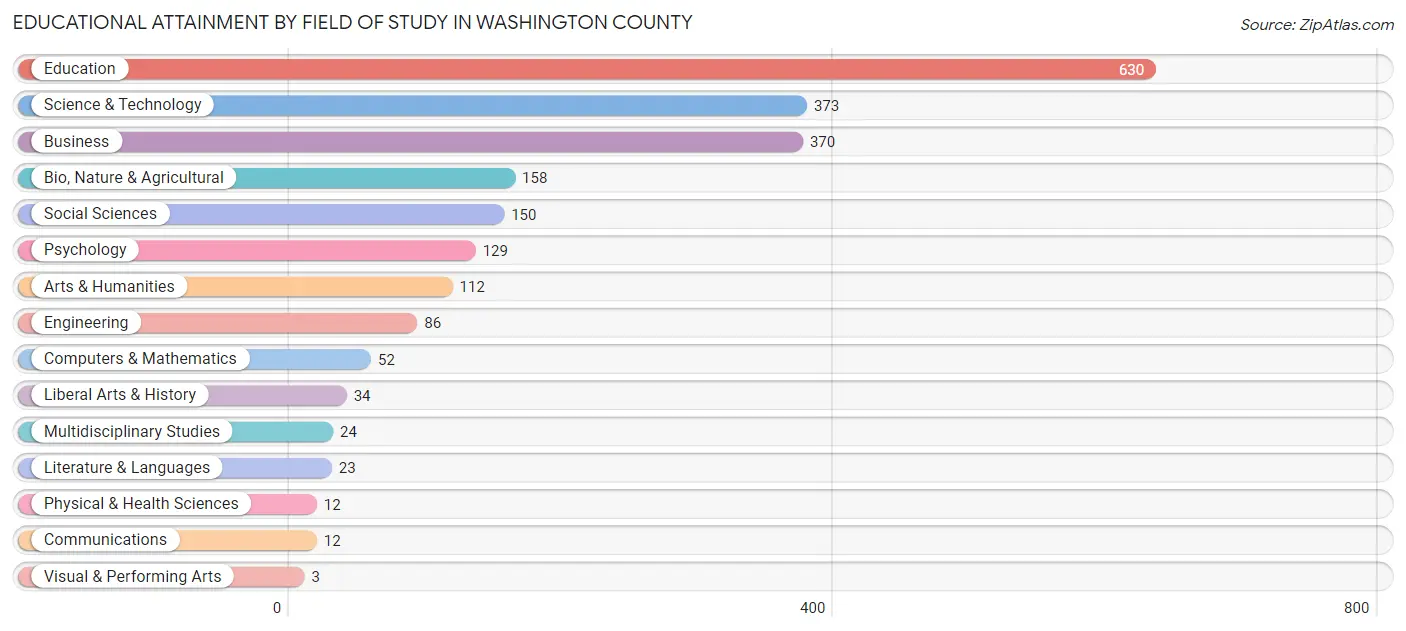
| Field of Study | # Graduates | % Graduates |
| Computers & Mathematics | 52 | 2.4% |
| Bio, Nature & Agricultural | 158 | 7.3% |
| Physical & Health Sciences | 12 | 0.5% |
| Psychology | 129 | 5.9% |
| Social Sciences | 150 | 6.9% |
| Engineering | 86 | 4.0% |
| Multidisciplinary Studies | 24 | 1.1% |
| Science & Technology | 373 | 17.2% |
| Business | 370 | 17.1% |
| Education | 630 | 29.1% |
| Literature & Languages | 23 | 1.1% |
| Liberal Arts & History | 34 | 1.6% |
| Visual & Performing Arts | 3 | 0.1% |
| Communications | 12 | 0.5% |
| Arts & Humanities | 112 | 5.2% |
| Total | 2,168 | 100.0% |
Transportation & Commute in Washington County
Vehicle Availability by Sex in Washington County
The most prevalent vehicle ownership categories in Washington County are males with 3 vehicles (1,819, accounting for 36.6%) and females with 3 vehicles (1,457, making up 45.2%).
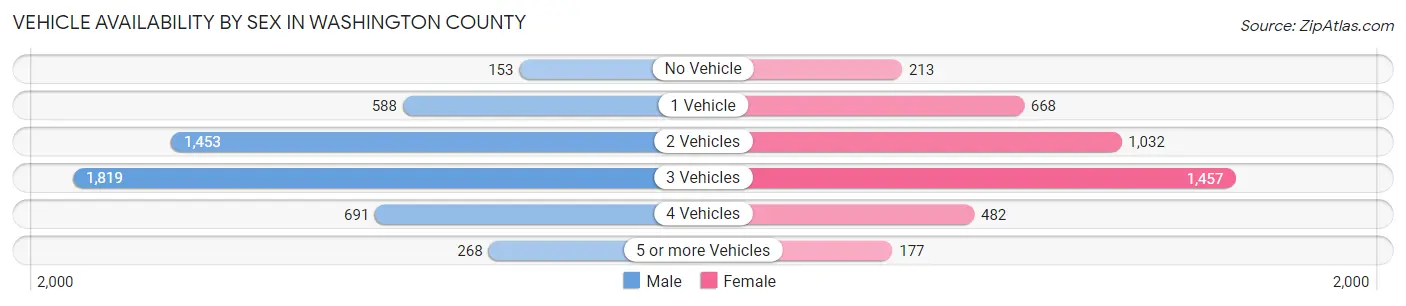
| Vehicles Available | Male | Female |
| No Vehicle | 153 (3.1%) | 213 (5.3%) |
| 1 Vehicle | 588 (11.8%) | 668 (16.6%) |
| 2 Vehicles | 1,453 (29.2%) | 1,032 (25.6%) |
| 3 Vehicles | 1,819 (36.6%) | 1,457 (36.2%) |
| 4 Vehicles | 691 (13.9%) | 482 (12.0%) |
| 5 or more Vehicles | 268 (5.4%) | 177 (4.4%) |
| Total | 4,972 (100.0%) | 4,029 (100.0%) |
Commute Time in Washington County
The most frequently occuring commute durations in Washington County are 60 to 89 minutes (1,231 commuters, 14.2%), 30 to 34 minutes (929 commuters, 10.7%), and 15 to 19 minutes (909 commuters, 10.5%).
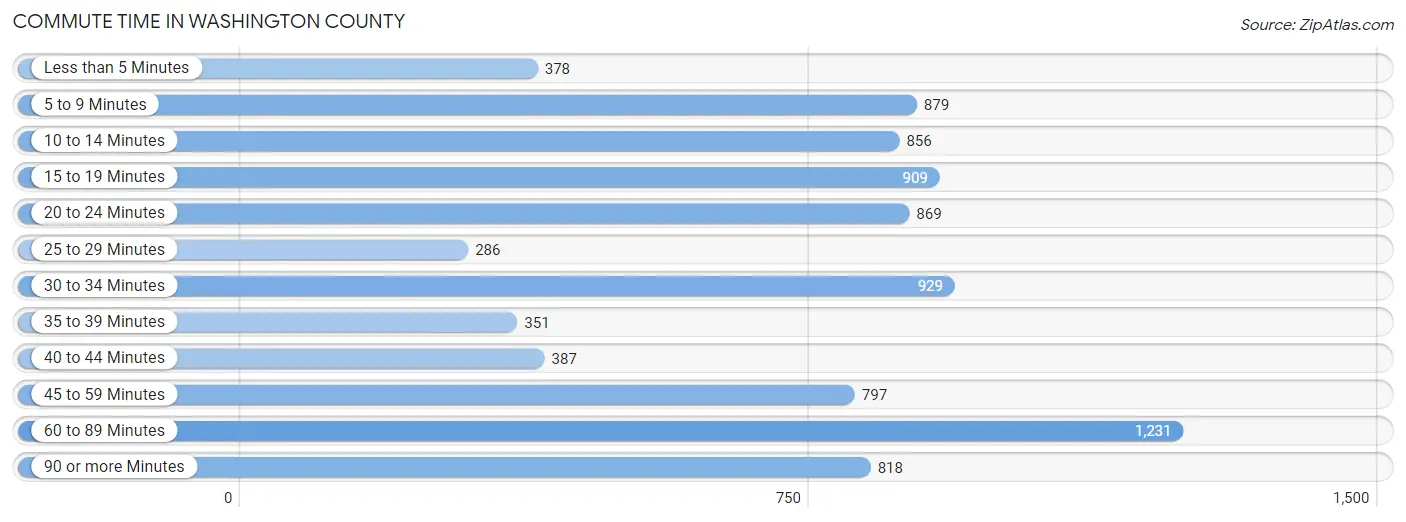
| Commute Time | # Commuters | % Commuters |
| Less than 5 Minutes | 378 | 4.3% |
| 5 to 9 Minutes | 879 | 10.1% |
| 10 to 14 Minutes | 856 | 9.9% |
| 15 to 19 Minutes | 909 | 10.5% |
| 20 to 24 Minutes | 869 | 10.0% |
| 25 to 29 Minutes | 286 | 3.3% |
| 30 to 34 Minutes | 929 | 10.7% |
| 35 to 39 Minutes | 351 | 4.0% |
| 40 to 44 Minutes | 387 | 4.4% |
| 45 to 59 Minutes | 797 | 9.2% |
| 60 to 89 Minutes | 1,231 | 14.2% |
| 90 or more Minutes | 818 | 9.4% |
Commute Time by Sex in Washington County
The most common commute times in Washington County are 60 to 89 minutes (954 commuters, 19.8%) for males and 10 to 14 minutes (547 commuters, 14.1%) for females.
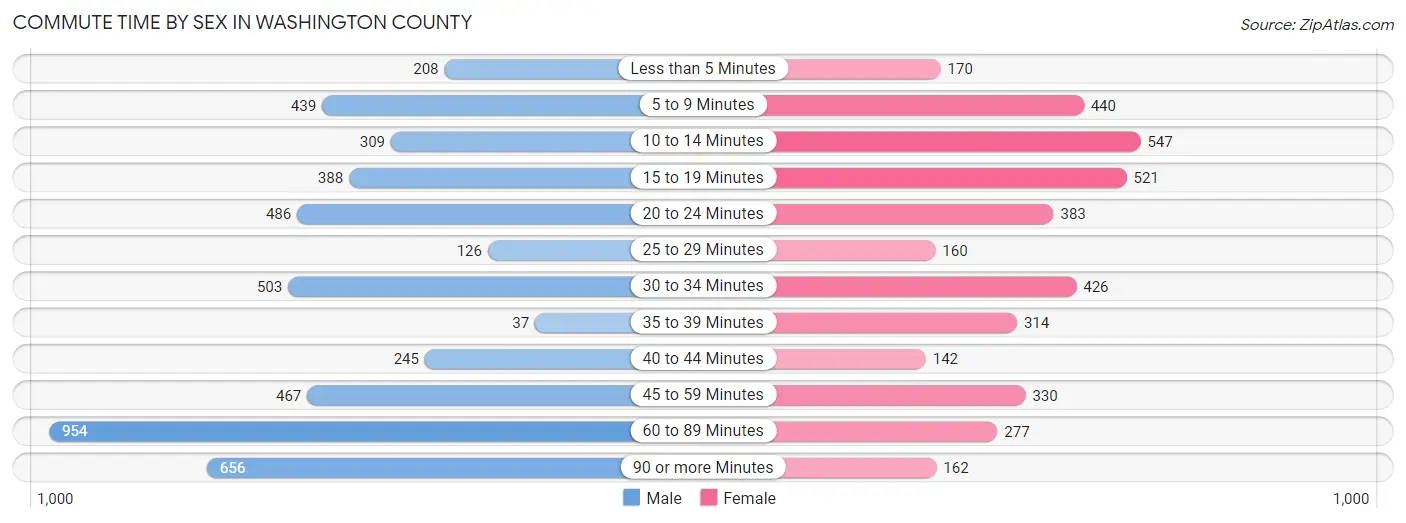
| Commute Time | Male | Female |
| Less than 5 Minutes | 208 (4.3%) | 170 (4.4%) |
| 5 to 9 Minutes | 439 (9.1%) | 440 (11.4%) |
| 10 to 14 Minutes | 309 (6.4%) | 547 (14.1%) |
| 15 to 19 Minutes | 388 (8.1%) | 521 (13.5%) |
| 20 to 24 Minutes | 486 (10.1%) | 383 (9.9%) |
| 25 to 29 Minutes | 126 (2.6%) | 160 (4.1%) |
| 30 to 34 Minutes | 503 (10.4%) | 426 (11.0%) |
| 35 to 39 Minutes | 37 (0.8%) | 314 (8.1%) |
| 40 to 44 Minutes | 245 (5.1%) | 142 (3.7%) |
| 45 to 59 Minutes | 467 (9.7%) | 330 (8.5%) |
| 60 to 89 Minutes | 954 (19.8%) | 277 (7.1%) |
| 90 or more Minutes | 656 (13.6%) | 162 (4.2%) |
Time of Departure to Work by Sex in Washington County
The most frequent times of departure to work in Washington County are 12:00 AM to 4:59 AM (970, 20.1%) for males and 7:30 AM to 7:59 AM (565, 14.6%) for females.
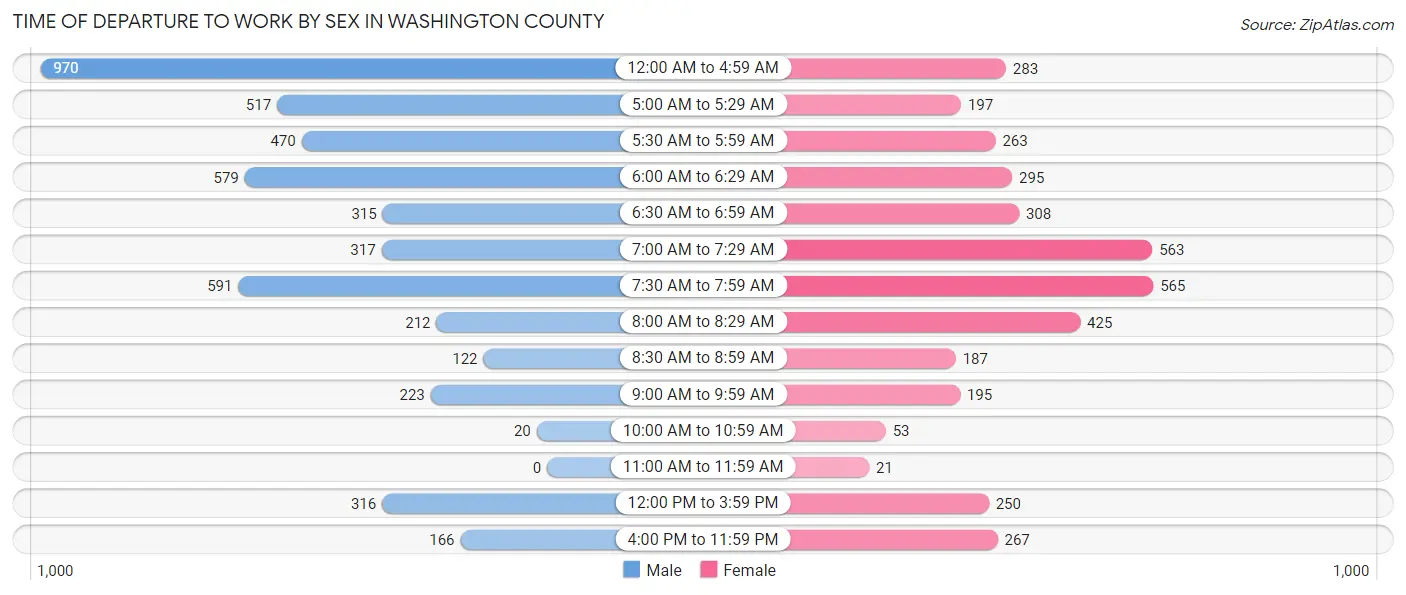
| Time of Departure | Male | Female |
| 12:00 AM to 4:59 AM | 970 (20.1%) | 283 (7.3%) |
| 5:00 AM to 5:29 AM | 517 (10.7%) | 197 (5.1%) |
| 5:30 AM to 5:59 AM | 470 (9.8%) | 263 (6.8%) |
| 6:00 AM to 6:29 AM | 579 (12.0%) | 295 (7.6%) |
| 6:30 AM to 6:59 AM | 315 (6.5%) | 308 (8.0%) |
| 7:00 AM to 7:29 AM | 317 (6.6%) | 563 (14.5%) |
| 7:30 AM to 7:59 AM | 591 (12.3%) | 565 (14.6%) |
| 8:00 AM to 8:29 AM | 212 (4.4%) | 425 (11.0%) |
| 8:30 AM to 8:59 AM | 122 (2.5%) | 187 (4.8%) |
| 9:00 AM to 9:59 AM | 223 (4.6%) | 195 (5.0%) |
| 10:00 AM to 10:59 AM | 20 (0.4%) | 53 (1.4%) |
| 11:00 AM to 11:59 AM | 0 (0.0%) | 21 (0.5%) |
| 12:00 PM to 3:59 PM | 316 (6.6%) | 250 (6.5%) |
| 4:00 PM to 11:59 PM | 166 (3.5%) | 267 (6.9%) |
| Total | 4,818 (100.0%) | 3,872 (100.0%) |
Housing Occupancy in Washington County
Occupancy by Ownership in Washington County
Of the total 9,032 dwellings in Washington County, owner-occupied units account for 7,097 (78.6%), while renter-occupied units make up 1,935 (21.4%).
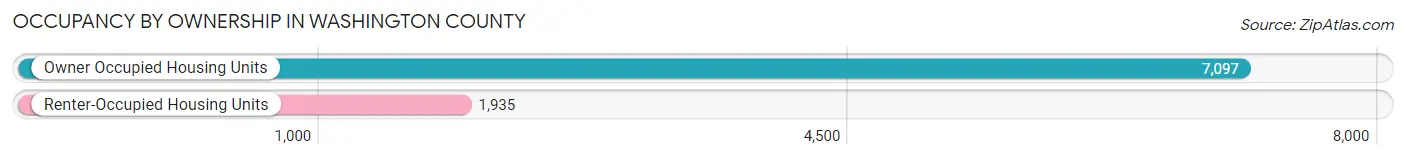
| Occupancy | # Housing Units | % Housing Units |
| Owner Occupied Housing Units | 7,097 | 78.6% |
| Renter-Occupied Housing Units | 1,935 | 21.4% |
| Total Occupied Housing Units | 9,032 | 100.0% |
Occupancy by Household Size in Washington County
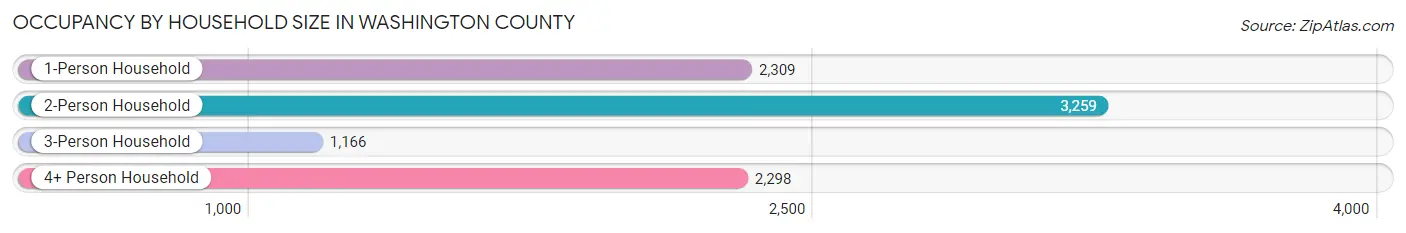
| Household Size | # Housing Units | % Housing Units |
| 1-Person Household | 2,309 | 25.6% |
| 2-Person Household | 3,259 | 36.1% |
| 3-Person Household | 1,166 | 12.9% |
| 4+ Person Household | 2,298 | 25.4% |
| Total Housing Units | 9,032 | 100.0% |
Occupancy by Ownership by Household Size in Washington County
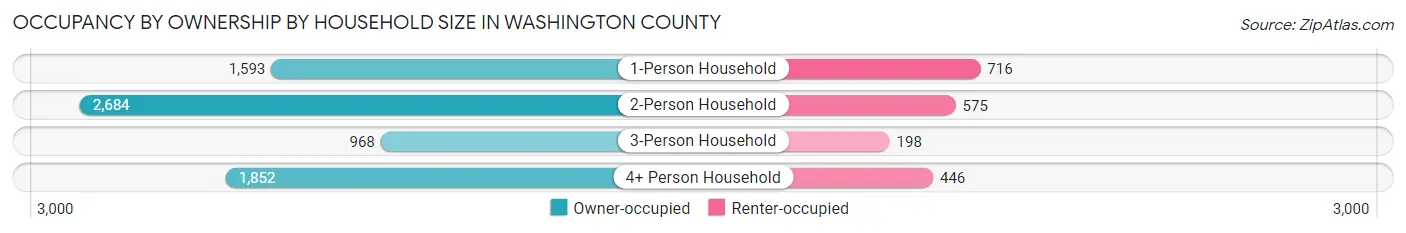
| Household Size | Owner-occupied | Renter-occupied |
| 1-Person Household | 1,593 (69.0%) | 716 (31.0%) |
| 2-Person Household | 2,684 (82.4%) | 575 (17.6%) |
| 3-Person Household | 968 (83.0%) | 198 (17.0%) |
| 4+ Person Household | 1,852 (80.6%) | 446 (19.4%) |
| Total Housing Units | 7,097 (78.6%) | 1,935 (21.4%) |
Occupancy by Educational Attainment in Washington County
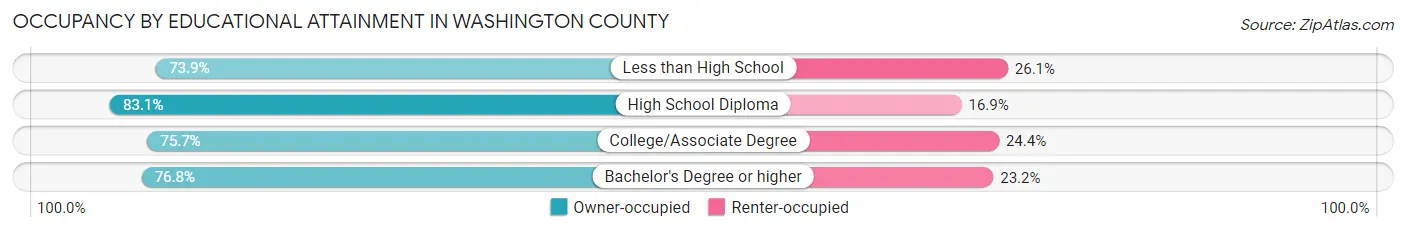
| Household Size | Owner-occupied | Renter-occupied |
| Less than High School | 1,211 (73.9%) | 428 (26.1%) |
| High School Diploma | 3,121 (83.1%) | 636 (16.9%) |
| College/Associate Degree | 1,786 (75.6%) | 575 (24.3%) |
| Bachelor's Degree or higher | 979 (76.8%) | 296 (23.2%) |
Occupancy by Age of Householder in Washington County
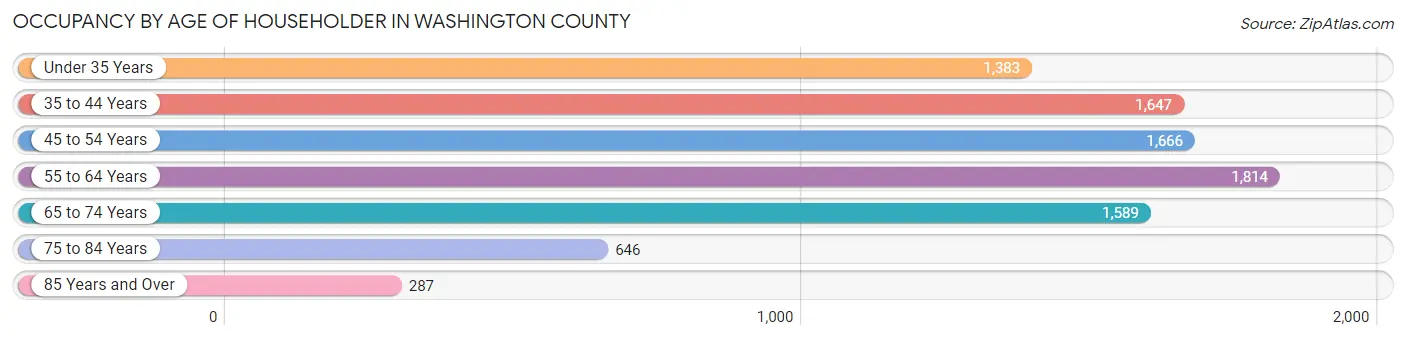
| Age Bracket | # Households | % Households |
| Under 35 Years | 1,383 | 15.3% |
| 35 to 44 Years | 1,647 | 18.2% |
| 45 to 54 Years | 1,666 | 18.4% |
| 55 to 64 Years | 1,814 | 20.1% |
| 65 to 74 Years | 1,589 | 17.6% |
| 75 to 84 Years | 646 | 7.1% |
| 85 Years and Over | 287 | 3.2% |
| Total | 9,032 | 100.0% |
Housing Finances in Washington County
Median Income by Occupancy in Washington County
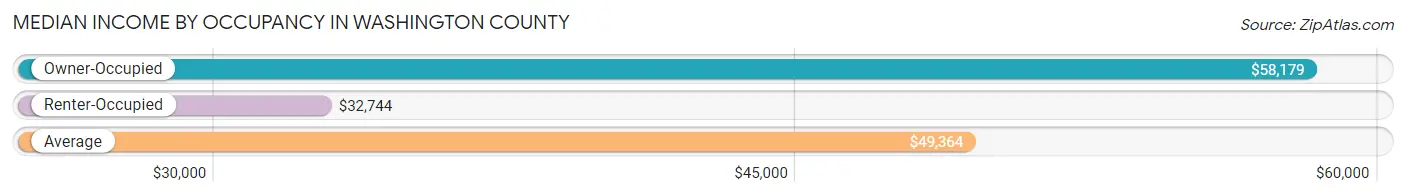
| Occupancy Type | # Households | Median Income |
| Owner-Occupied | 7,097 (78.6%) | $58,179 |
| Renter-Occupied | 1,935 (21.4%) | $32,744 |
| Average | 9,032 (100.0%) | $49,364 |
Occupancy by Householder Income Bracket in Washington County
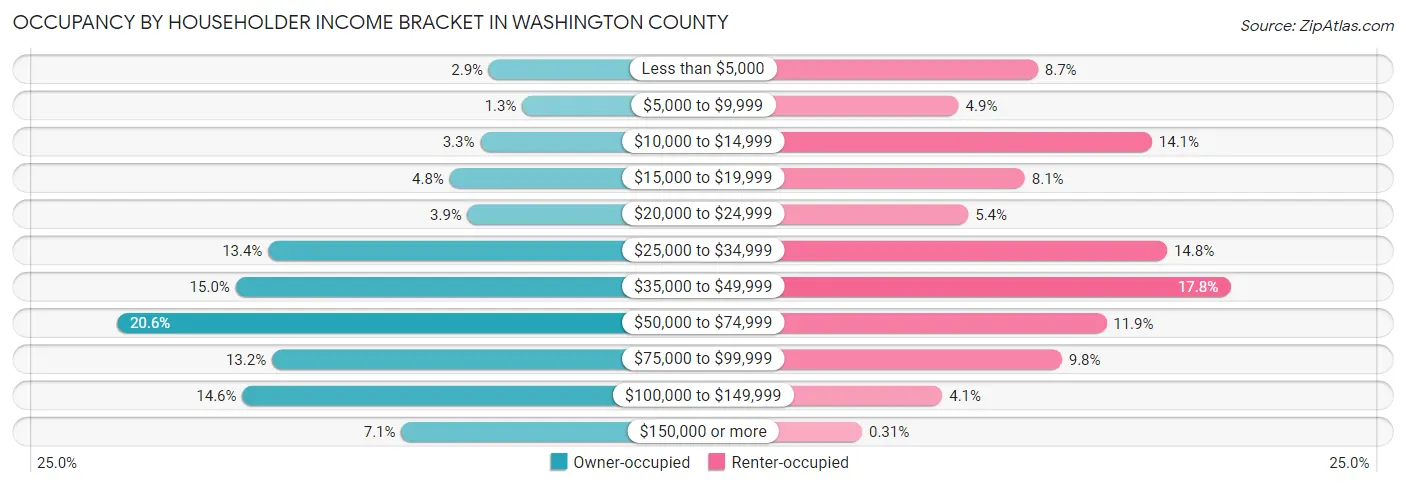
| Income Bracket | Owner-occupied | Renter-occupied |
| Less than $5,000 | 205 (2.9%) | 168 (8.7%) |
| $5,000 to $9,999 | 92 (1.3%) | 95 (4.9%) |
| $10,000 to $14,999 | 234 (3.3%) | 273 (14.1%) |
| $15,000 to $19,999 | 338 (4.8%) | 156 (8.1%) |
| $20,000 to $24,999 | 277 (3.9%) | 104 (5.4%) |
| $25,000 to $34,999 | 951 (13.4%) | 287 (14.8%) |
| $35,000 to $49,999 | 1,061 (14.9%) | 345 (17.8%) |
| $50,000 to $74,999 | 1,462 (20.6%) | 231 (11.9%) |
| $75,000 to $99,999 | 938 (13.2%) | 190 (9.8%) |
| $100,000 to $149,999 | 1,038 (14.6%) | 80 (4.1%) |
| $150,000 or more | 501 (7.1%) | 6 (0.3%) |
| Total | 7,097 (100.0%) | 1,935 (100.0%) |
Monthly Housing Cost Tiers in Washington County
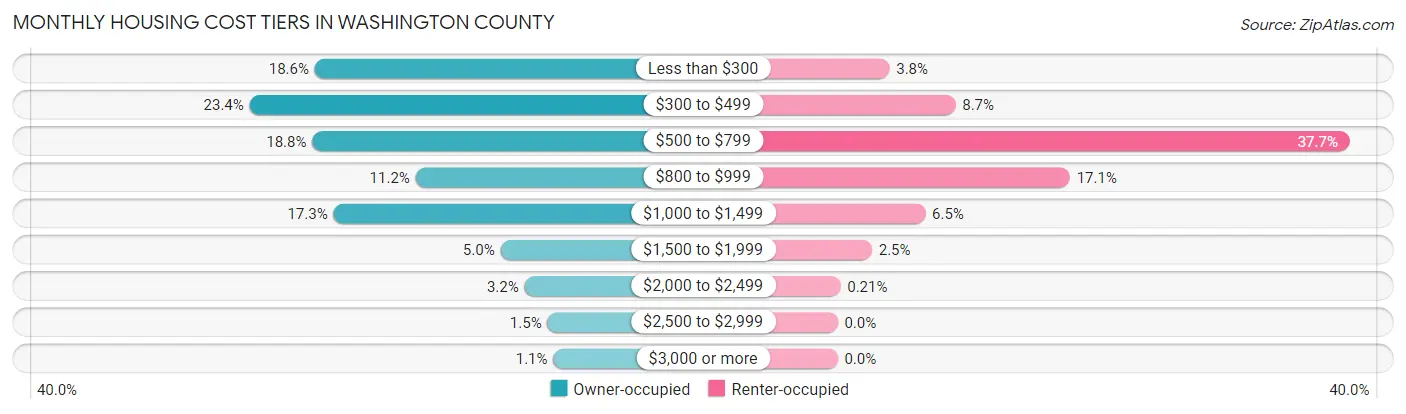
| Monthly Cost | Owner-occupied | Renter-occupied |
| Less than $300 | 1,322 (18.6%) | 74 (3.8%) |
| $300 to $499 | 1,663 (23.4%) | 168 (8.7%) |
| $500 to $799 | 1,335 (18.8%) | 730 (37.7%) |
| $800 to $999 | 795 (11.2%) | 331 (17.1%) |
| $1,000 to $1,499 | 1,224 (17.2%) | 125 (6.5%) |
| $1,500 to $1,999 | 351 (5.0%) | 49 (2.5%) |
| $2,000 to $2,499 | 226 (3.2%) | 4 (0.2%) |
| $2,500 to $2,999 | 106 (1.5%) | 0 (0.0%) |
| $3,000 or more | 75 (1.1%) | 0 (0.0%) |
| Total | 7,097 (100.0%) | 1,935 (100.0%) |
Physical Housing Characteristics in Washington County
Housing Structures in Washington County
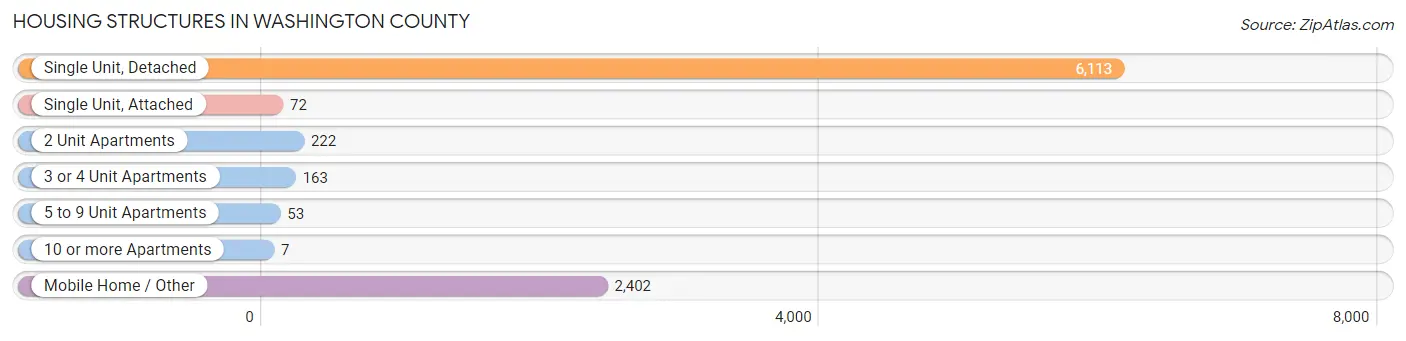
| Structure Type | # Housing Units | % Housing Units |
| Single Unit, Detached | 6,113 | 67.7% |
| Single Unit, Attached | 72 | 0.8% |
| 2 Unit Apartments | 222 | 2.5% |
| 3 or 4 Unit Apartments | 163 | 1.8% |
| 5 to 9 Unit Apartments | 53 | 0.6% |
| 10 or more Apartments | 7 | 0.1% |
| Mobile Home / Other | 2,402 | 26.6% |
| Total | 9,032 | 100.0% |
Housing Structures by Occupancy in Washington County
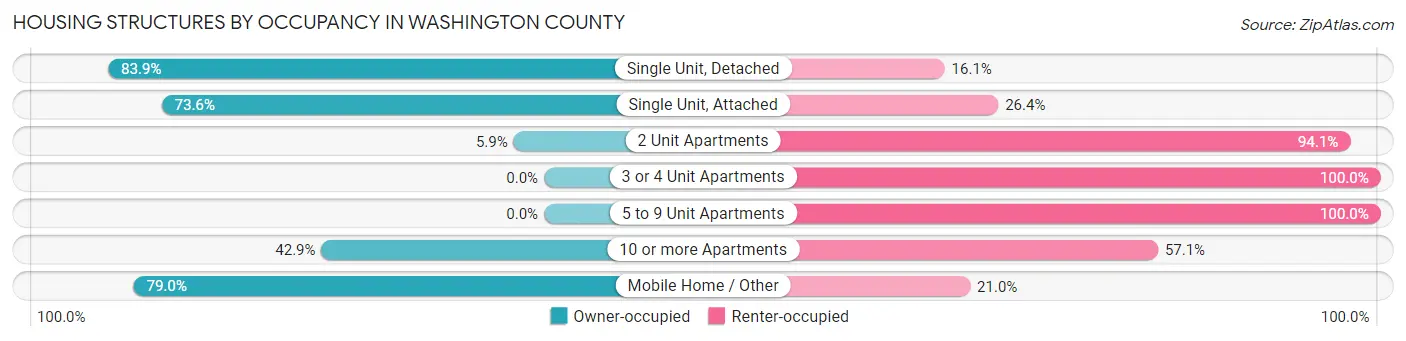
| Structure Type | Owner-occupied | Renter-occupied |
| Single Unit, Detached | 5,130 (83.9%) | 983 (16.1%) |
| Single Unit, Attached | 53 (73.6%) | 19 (26.4%) |
| 2 Unit Apartments | 13 (5.9%) | 209 (94.1%) |
| 3 or 4 Unit Apartments | 0 (0.0%) | 163 (100.0%) |
| 5 to 9 Unit Apartments | 0 (0.0%) | 53 (100.0%) |
| 10 or more Apartments | 3 (42.9%) | 4 (57.1%) |
| Mobile Home / Other | 1,898 (79.0%) | 504 (21.0%) |
| Total | 7,097 (78.6%) | 1,935 (21.4%) |
Housing Structures by Number of Rooms in Washington County
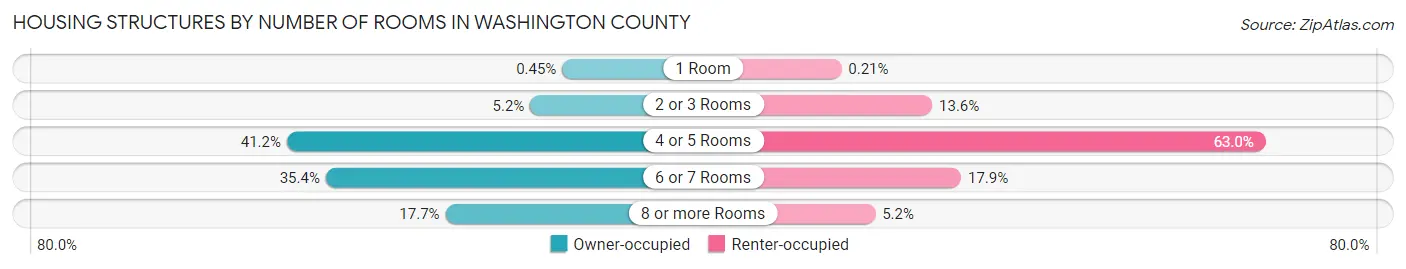
| Number of Rooms | Owner-occupied | Renter-occupied |
| 1 Room | 32 (0.4%) | 4 (0.2%) |
| 2 or 3 Rooms | 368 (5.2%) | 264 (13.6%) |
| 4 or 5 Rooms | 2,924 (41.2%) | 1,219 (63.0%) |
| 6 or 7 Rooms | 2,515 (35.4%) | 347 (17.9%) |
| 8 or more Rooms | 1,258 (17.7%) | 101 (5.2%) |
| Total | 7,097 (100.0%) | 1,935 (100.0%) |
Housing Structure by Heating Type in Washington County
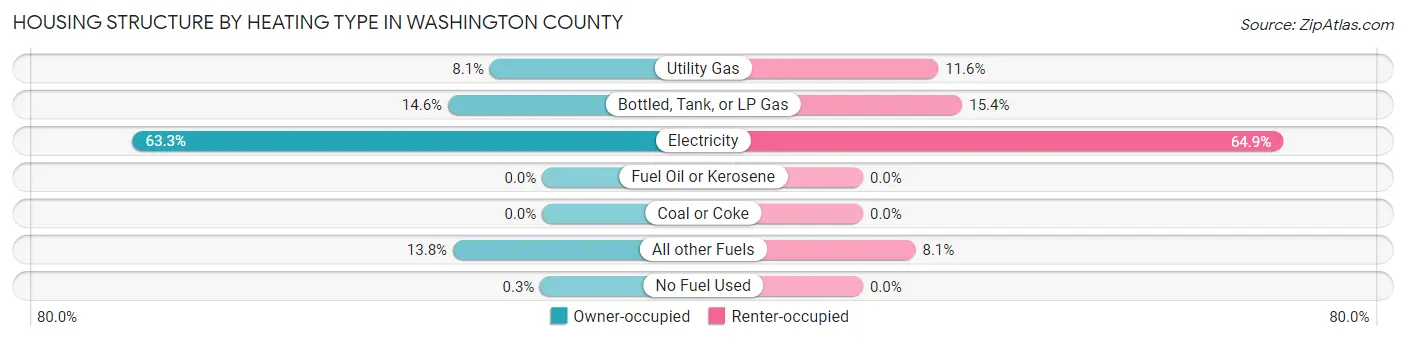
| Heating Type | Owner-occupied | Renter-occupied |
| Utility Gas | 572 (8.1%) | 225 (11.6%) |
| Bottled, Tank, or LP Gas | 1,033 (14.6%) | 297 (15.3%) |
| Electricity | 4,492 (63.3%) | 1,256 (64.9%) |
| Fuel Oil or Kerosene | 0 (0.0%) | 0 (0.0%) |
| Coal or Coke | 0 (0.0%) | 0 (0.0%) |
| All other Fuels | 979 (13.8%) | 157 (8.1%) |
| No Fuel Used | 21 (0.3%) | 0 (0.0%) |
| Total | 7,097 (100.0%) | 1,935 (100.0%) |
Household Vehicle Usage in Washington County
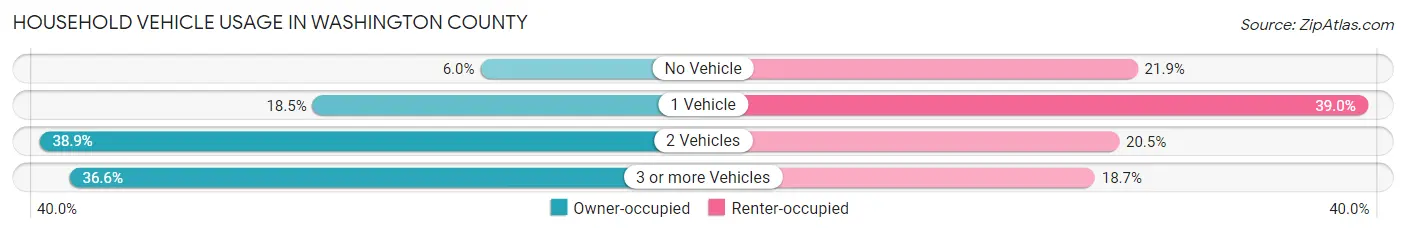
| Vehicles per Household | Owner-occupied | Renter-occupied |
| No Vehicle | 424 (6.0%) | 423 (21.9%) |
| 1 Vehicle | 1,313 (18.5%) | 755 (39.0%) |
| 2 Vehicles | 2,760 (38.9%) | 396 (20.5%) |
| 3 or more Vehicles | 2,600 (36.6%) | 361 (18.7%) |
| Total | 7,097 (100.0%) | 1,935 (100.0%) |
Real Estate & Mortgages in Washington County
Real Estate and Mortgage Overview in Washington County
| Characteristic | Without Mortgage | With Mortgage |
| Housing Units | 3,777 | 3,320 |
| Median Property Value | $87,700 | $145,900 |
| Median Household Income | $45,919 | $312 |
| Monthly Housing Costs | $360 | $75 |
| Real Estate Taxes | $520 | $247 |
Property Value by Mortgage Status in Washington County
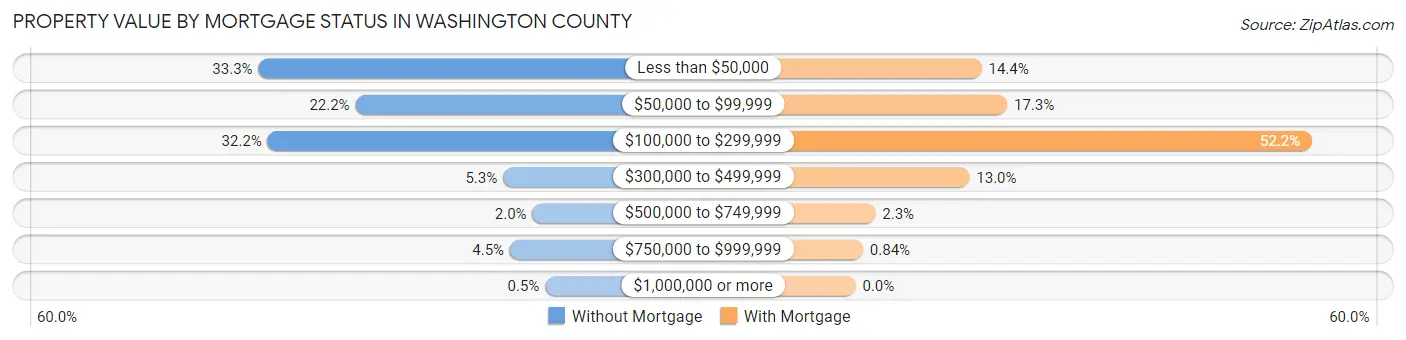
| Property Value | Without Mortgage | With Mortgage |
| Less than $50,000 | 1,257 (33.3%) | 478 (14.4%) |
| $50,000 to $99,999 | 838 (22.2%) | 575 (17.3%) |
| $100,000 to $299,999 | 1,217 (32.2%) | 1,732 (52.2%) |
| $300,000 to $499,999 | 201 (5.3%) | 432 (13.0%) |
| $500,000 to $749,999 | 74 (2.0%) | 75 (2.3%) |
| $750,000 to $999,999 | 171 (4.5%) | 28 (0.8%) |
| $1,000,000 or more | 19 (0.5%) | 0 (0.0%) |
| Total | 3,777 (100.0%) | 3,320 (100.0%) |
Household Income by Mortgage Status in Washington County
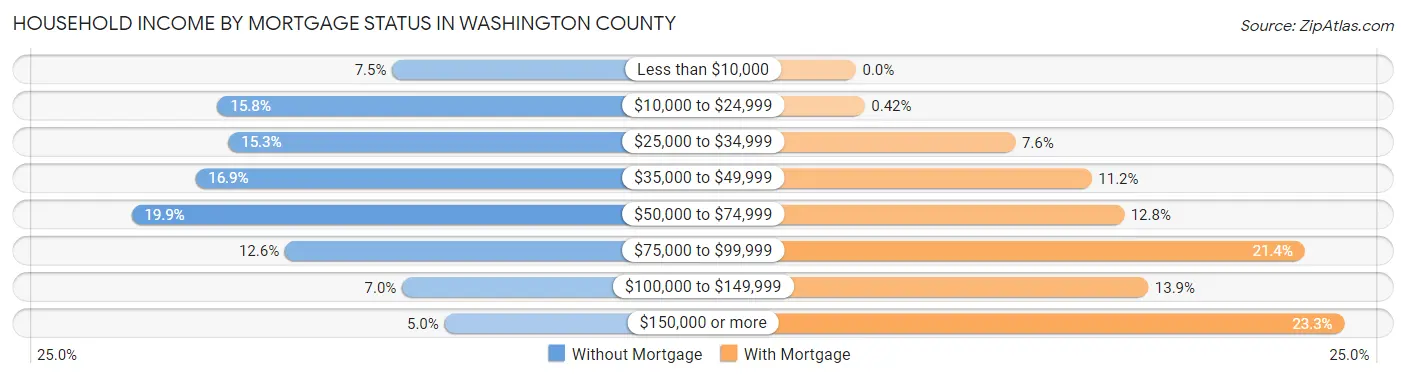
| Household Income | Without Mortgage | With Mortgage |
| Less than $10,000 | 283 (7.5%) | 0 (0.0%) |
| $10,000 to $24,999 | 597 (15.8%) | 14 (0.4%) |
| $25,000 to $34,999 | 578 (15.3%) | 252 (7.6%) |
| $35,000 to $49,999 | 637 (16.9%) | 373 (11.2%) |
| $50,000 to $74,999 | 752 (19.9%) | 424 (12.8%) |
| $75,000 to $99,999 | 476 (12.6%) | 710 (21.4%) |
| $100,000 to $149,999 | 265 (7.0%) | 462 (13.9%) |
| $150,000 or more | 189 (5.0%) | 773 (23.3%) |
| Total | 3,777 (100.0%) | 3,320 (100.0%) |
Property Value to Household Income Ratio in Washington County
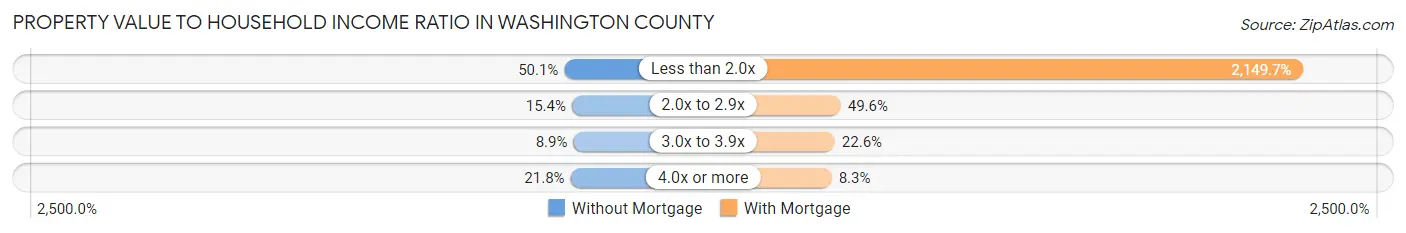
| Value-to-Income Ratio | Without Mortgage | With Mortgage |
| Less than 2.0x | 1,892 (50.1%) | 71,369 (2,149.7%) |
| 2.0x to 2.9x | 583 (15.4%) | 1,645 (49.5%) |
| 3.0x to 3.9x | 335 (8.9%) | 749 (22.6%) |
| 4.0x or more | 825 (21.8%) | 276 (8.3%) |
| Total | 3,777 (100.0%) | 3,320 (100.0%) |
Real Estate Taxes by Mortgage Status in Washington County
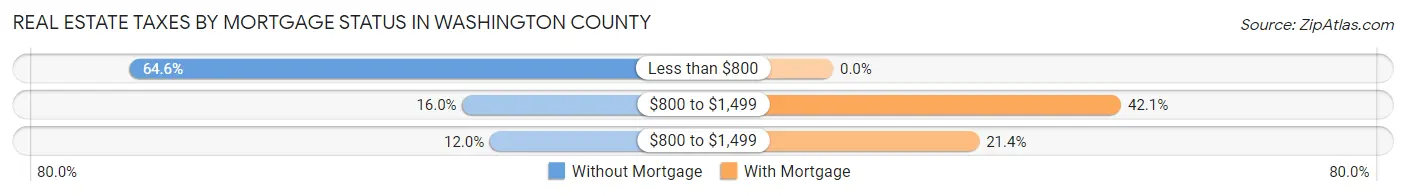
| Property Taxes | Without Mortgage | With Mortgage |
| Less than $800 | 2,441 (64.6%) | 0 (0.0%) |
| $800 to $1,499 | 605 (16.0%) | 1,397 (42.1%) |
| $800 to $1,499 | 453 (12.0%) | 709 (21.4%) |
| Total | 3,777 (100.0%) | 3,320 (100.0%) |
Health & Disability in Washington County
Health Insurance Coverage by Age in Washington County
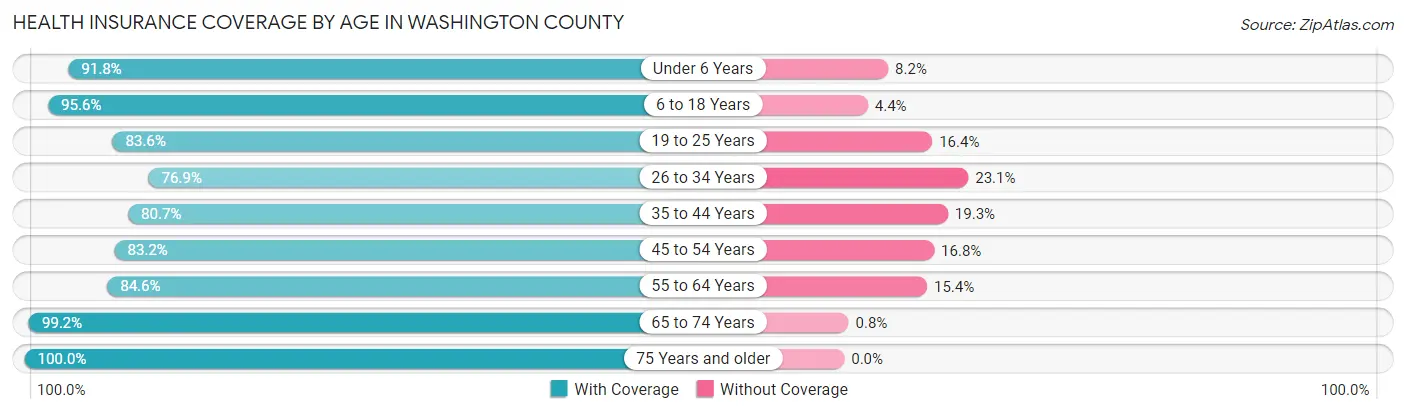
| Age Bracket | With Coverage | Without Coverage |
| Under 6 Years | 1,549 (91.8%) | 138 (8.2%) |
| 6 to 18 Years | 3,901 (95.6%) | 179 (4.4%) |
| 19 to 25 Years | 1,356 (83.6%) | 266 (16.4%) |
| 26 to 34 Years | 1,845 (76.9%) | 555 (23.1%) |
| 35 to 44 Years | 2,150 (80.7%) | 515 (19.3%) |
| 45 to 54 Years | 2,548 (83.2%) | 513 (16.8%) |
| 55 to 64 Years | 2,773 (84.6%) | 506 (15.4%) |
| 65 to 74 Years | 2,343 (99.2%) | 19 (0.8%) |
| 75 Years and older | 1,445 (100.0%) | 0 (0.0%) |
| Total | 19,910 (88.1%) | 2,691 (11.9%) |
Health Insurance Coverage by Citizenship Status in Washington County
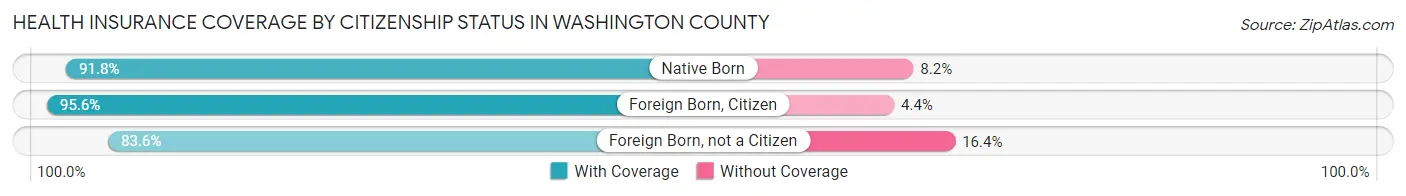
| Citizenship Status | With Coverage | Without Coverage |
| Native Born | 1,549 (91.8%) | 138 (8.2%) |
| Foreign Born, Citizen | 3,901 (95.6%) | 179 (4.4%) |
| Foreign Born, not a Citizen | 1,356 (83.6%) | 266 (16.4%) |
Health Insurance Coverage by Household Income in Washington County
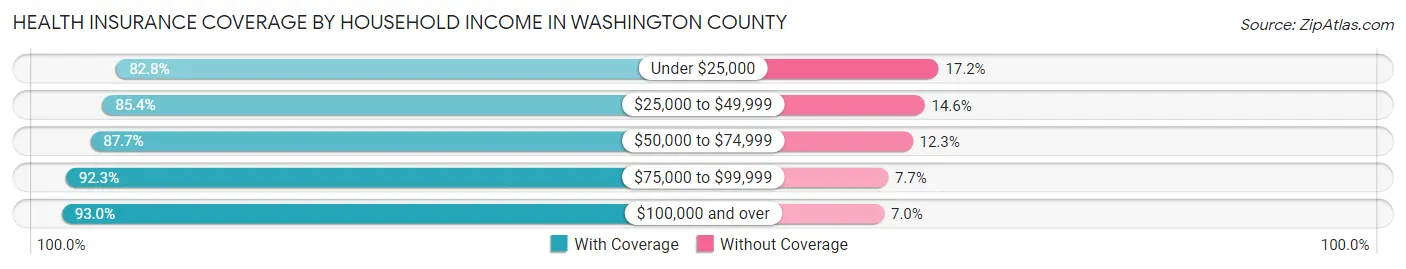
| Household Income | With Coverage | Without Coverage |
| Under $25,000 | 2,987 (82.8%) | 619 (17.2%) |
| $25,000 to $49,999 | 5,488 (85.4%) | 936 (14.6%) |
| $50,000 to $74,999 | 3,873 (87.7%) | 544 (12.3%) |
| $75,000 to $99,999 | 2,631 (92.3%) | 220 (7.7%) |
| $100,000 and over | 4,928 (93.0%) | 370 (7.0%) |
Public vs Private Health Insurance Coverage by Age in Washington County
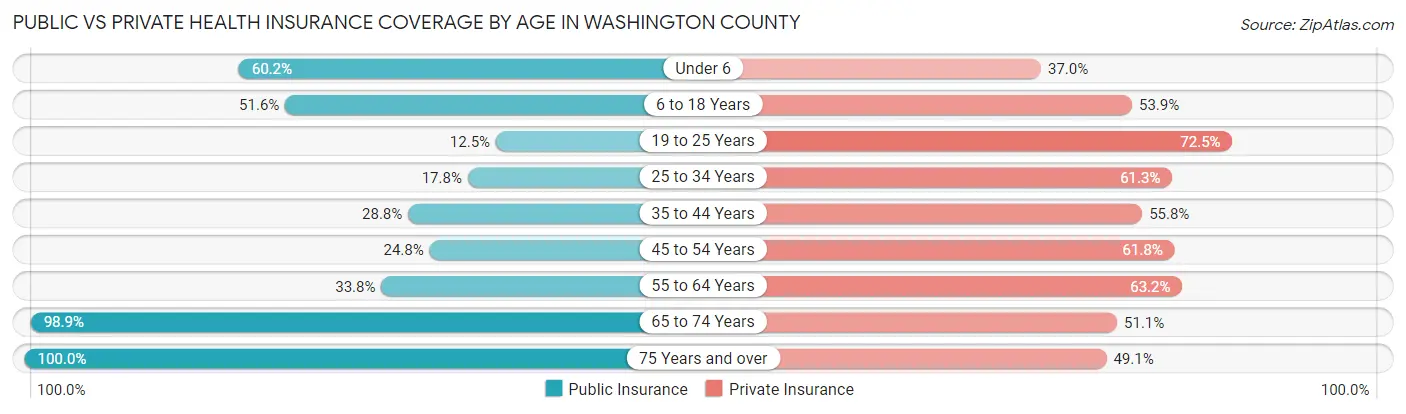
| Age Bracket | Public Insurance | Private Insurance |
| Under 6 | 1,016 (60.2%) | 624 (37.0%) |
| 6 to 18 Years | 2,107 (51.6%) | 2,198 (53.9%) |
| 19 to 25 Years | 203 (12.5%) | 1,176 (72.5%) |
| 25 to 34 Years | 426 (17.7%) | 1,472 (61.3%) |
| 35 to 44 Years | 768 (28.8%) | 1,486 (55.8%) |
| 45 to 54 Years | 760 (24.8%) | 1,891 (61.8%) |
| 55 to 64 Years | 1,108 (33.8%) | 2,072 (63.2%) |
| 65 to 74 Years | 2,335 (98.9%) | 1,207 (51.1%) |
| 75 Years and over | 1,445 (100.0%) | 710 (49.1%) |
| Total | 10,168 (45.0%) | 12,836 (56.8%) |
Disability Status by Sex by Age in Washington County
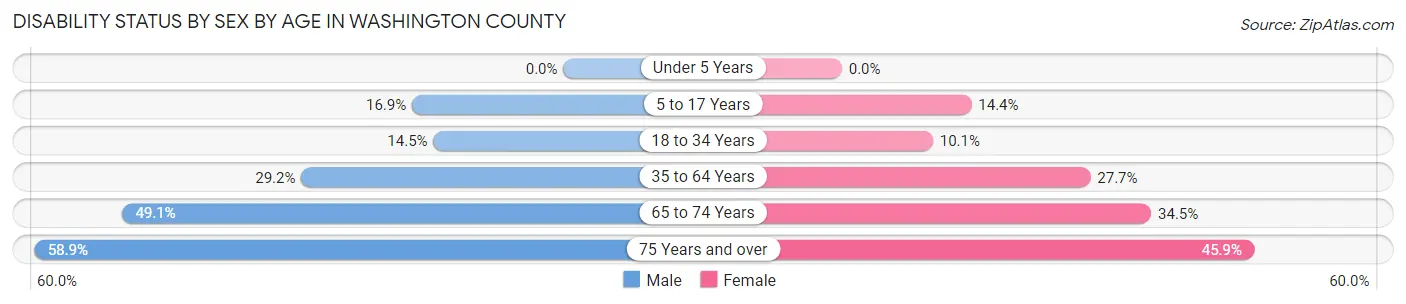
| Age Bracket | Male | Female |
| Under 5 Years | 0 (0.0%) | 0 (0.0%) |
| 5 to 17 Years | 372 (16.9%) | 292 (14.4%) |
| 18 to 34 Years | 311 (14.5%) | 213 (10.1%) |
| 35 to 64 Years | 1,331 (29.2%) | 1,230 (27.7%) |
| 65 to 74 Years | 544 (49.1%) | 432 (34.4%) |
| 75 Years and over | 408 (58.9%) | 345 (45.9%) |
Disability Class by Sex by Age in Washington County
Disability Class: Hearing Difficulty
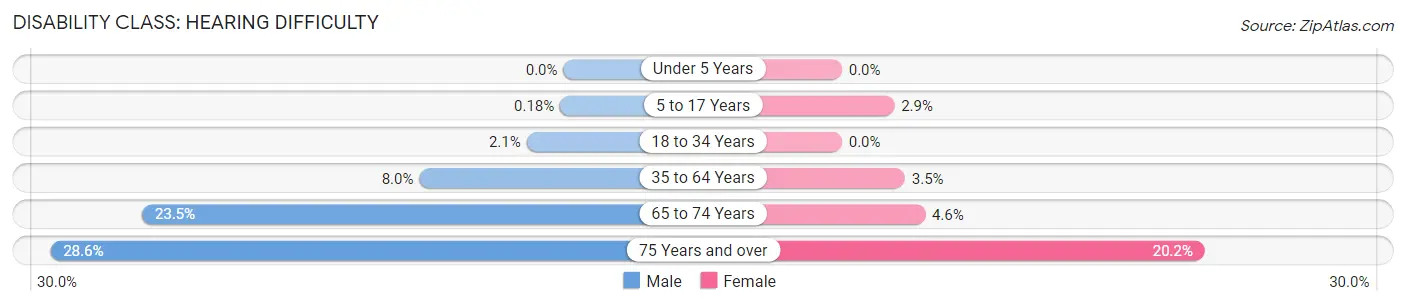
| Age Bracket | Male | Female |
| Under 5 Years | 0 (0.0%) | 0 (0.0%) |
| 5 to 17 Years | 4 (0.2%) | 59 (2.9%) |
| 18 to 34 Years | 44 (2.1%) | 0 (0.0%) |
| 35 to 64 Years | 366 (8.0%) | 156 (3.5%) |
| 65 to 74 Years | 260 (23.5%) | 58 (4.6%) |
| 75 Years and over | 198 (28.6%) | 152 (20.2%) |
Disability Class: Vision Difficulty
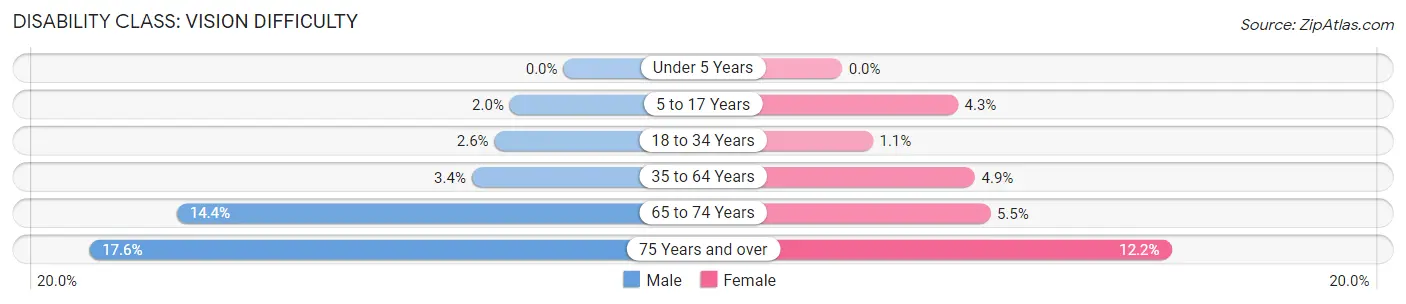
| Age Bracket | Male | Female |
| Under 5 Years | 0 (0.0%) | 0 (0.0%) |
| 5 to 17 Years | 44 (2.0%) | 87 (4.3%) |
| 18 to 34 Years | 55 (2.6%) | 24 (1.1%) |
| 35 to 64 Years | 155 (3.4%) | 219 (4.9%) |
| 65 to 74 Years | 159 (14.3%) | 69 (5.5%) |
| 75 Years and over | 122 (17.6%) | 92 (12.2%) |
Disability Class: Cognitive Difficulty
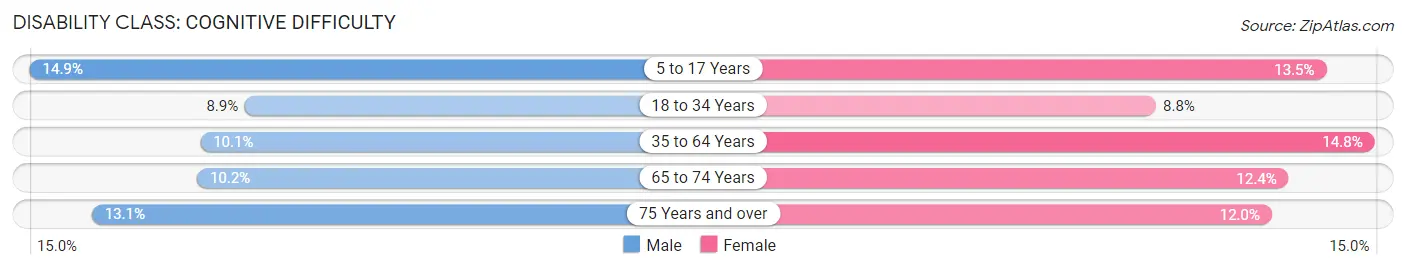
| Age Bracket | Male | Female |
| 5 to 17 Years | 328 (14.9%) | 273 (13.5%) |
| 18 to 34 Years | 191 (8.9%) | 184 (8.7%) |
| 35 to 64 Years | 461 (10.1%) | 659 (14.8%) |
| 65 to 74 Years | 113 (10.2%) | 156 (12.4%) |
| 75 Years and over | 91 (13.1%) | 90 (12.0%) |
Disability Class: Ambulatory Difficulty
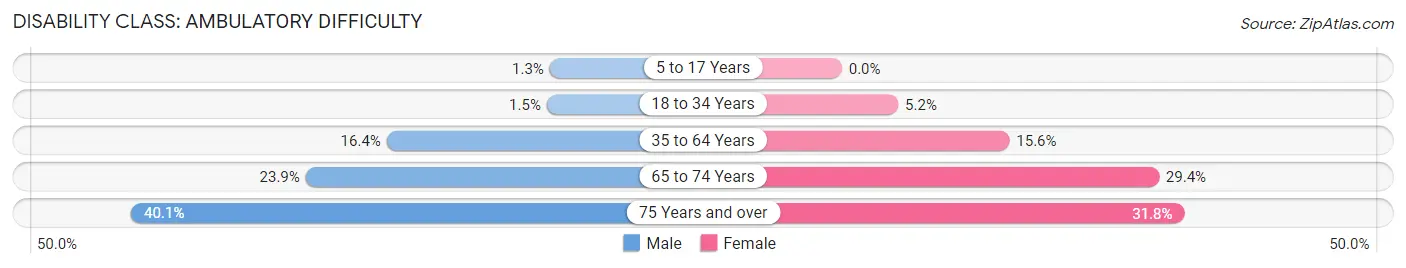
| Age Bracket | Male | Female |
| 5 to 17 Years | 28 (1.3%) | 0 (0.0%) |
| 18 to 34 Years | 33 (1.5%) | 110 (5.2%) |
| 35 to 64 Years | 748 (16.4%) | 691 (15.5%) |
| 65 to 74 Years | 265 (23.9%) | 369 (29.4%) |
| 75 Years and over | 278 (40.1%) | 239 (31.8%) |
Disability Class: Self-Care Difficulty
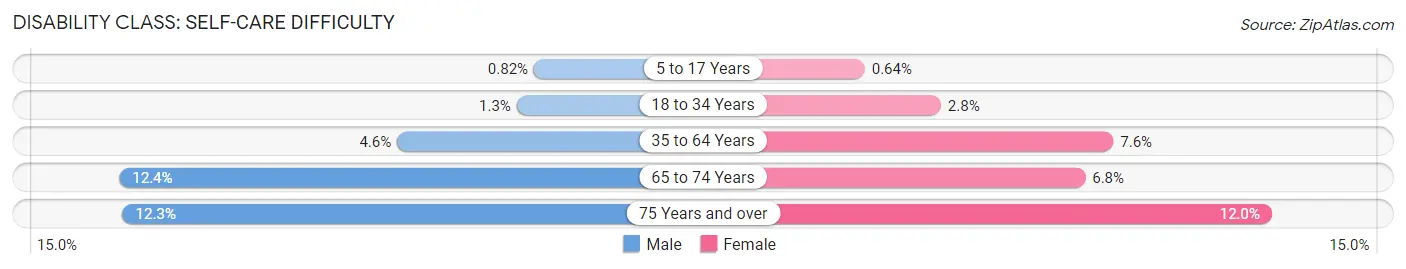
| Age Bracket | Male | Female |
| 5 to 17 Years | 18 (0.8%) | 13 (0.6%) |
| 18 to 34 Years | 28 (1.3%) | 58 (2.8%) |
| 35 to 64 Years | 211 (4.6%) | 336 (7.6%) |
| 65 to 74 Years | 137 (12.4%) | 85 (6.8%) |
| 75 Years and over | 85 (12.3%) | 90 (12.0%) |
Technology Access in Washington County
Computing Device Access in Washington County
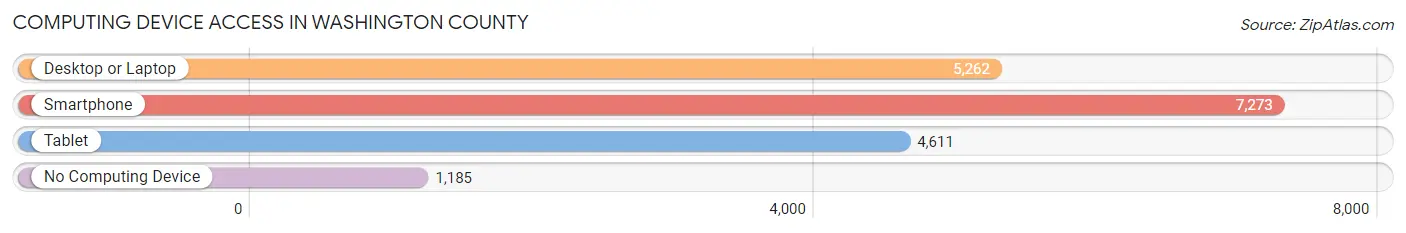
| Device Type | # Households | % Households |
| Desktop or Laptop | 5,262 | 58.3% |
| Smartphone | 7,273 | 80.5% |
| Tablet | 4,611 | 51.0% |
| No Computing Device | 1,185 | 13.1% |
| Total | 9,032 | 100.0% |
Internet Access in Washington County
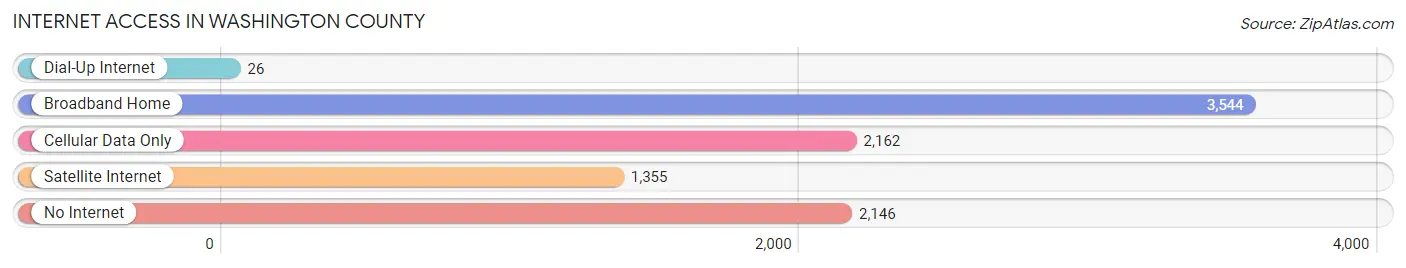
| Internet Type | # Households | % Households |
| Dial-Up Internet | 26 | 0.3% |
| Broadband Home | 3,544 | 39.2% |
| Cellular Data Only | 2,162 | 23.9% |
| Satellite Internet | 1,355 | 15.0% |
| No Internet | 2,146 | 23.8% |
| Total | 9,032 | 100.0% |
Washington County Summary
Introduction
Washington County, Missouri is located in the southeastern corner of the state and is part of the St. Louis metropolitan area. It is bordered by Jefferson County to the north, St. Francois County to the east, Iron County to the south, and Franklin County to the west. The county seat is Potosi, and the largest city is De Soto. The county was established in 1813 and named after George Washington, the first president of the United States.
History
The area that is now Washington County was first inhabited by Native Americans, including the Osage, Shawnee, and Delaware tribes. The first European settlers arrived in the area in the late 1700s. The county was officially established in 1813 and named after George Washington.
In the early 1800s, the county was largely agricultural, with small towns and villages scattered throughout the area. The county was also home to several lead mines, which provided employment for many of the residents. The lead mines were eventually closed in the late 1800s, and the county shifted to a more industrial economy.
In the late 1800s and early 1900s, the county experienced a period of rapid growth. The population increased from just over 5,000 in 1900 to more than 20,000 by 1930. This growth was largely due to the influx of immigrants from Europe, as well as the development of the county’s industrial sector.
Geography
Washington County is located in the southeastern corner of Missouri and is part of the St. Louis metropolitan area. It is bordered by Jefferson County to the north, St. Francois County to the east, Iron County to the south, and Franklin County to the west. The county covers an area of 545 square miles and is home to more than 25,000 people.
The terrain of the county is mostly rolling hills and valleys, with some flat areas in the northern part of the county. The highest point in the county is located in the northern part of the county, near the town of Potosi, and is 1,072 feet above sea level. The county is also home to several rivers and streams, including the Big River, which flows through the county from north to south.
Economy
Washington County’s economy is largely based on agriculture and manufacturing. The county is home to several large farms, which produce a variety of crops, including corn, soybeans, wheat, and hay. The county is also home to several manufacturing companies, which produce a variety of products, including automotive parts, furniture, and clothing.
The county is also home to several tourist attractions, including the Washington County Museum, the Potosi Brewery, and the Big River State Forest. These attractions bring in visitors from all over the state and help to boost the local economy.
Demographics
As of the 2010 census, the population of Washington County was 25,195. The population is largely white (90.3%), with small percentages of African Americans (4.2%), Hispanics (2.2%), and Asians (1.2%). The median household income in the county is $41,945, and the median home value is $117,400.
Conclusion
Washington County, Missouri is located in the southeastern corner of the state and is part of the St. Louis metropolitan area. It is bordered by Jefferson County to the north, St. Francois County to the east, Iron County to the south, and Franklin County to the west. The county was established in 1813 and named after George Washington, the first president of the United States. The county’s economy is largely based on agriculture and manufacturing, and the county is home to several tourist attractions. The population of the county is largely white, with small percentages of African Americans, Hispanics, and Asians.
Common Questions
What is Per Capita Income in Washington County?
Per Capita income in Washington County is $28,191.
What is the Median Family Income in Washington County?
Median Family Income in Washington County is $60,256.
What is the Median Household income in Washington County?
Median Household Income in Washington County is $49,364.
What is Income or Wage Gap in Washington County?
Income or Wage Gap in Washington County is 34.9%.
Women in Washington County earn 65.1 cents for every dollar earned by a man.
What is Family Income Deficit in Washington County?
Family Income Deficit in Washington County is $10,059.
Families that are below poverty line in Washington County earn $10,059 less on average than the poverty threshold level.
What is Inequality or Gini Index in Washington County?
Inequality or Gini Index in Washington County is 0.50.
What is the Total Population of Washington County?
Total Population of Washington County is 23,580.
What is the Total Male Population of Washington County?
Total Male Population of Washington County is 12,260.
What is the Total Female Population of Washington County?
Total Female Population of Washington County is 11,320.
What is the Ratio of Males per 100 Females in Washington County?
There are 108.30 Males per 100 Females in Washington County.
What is the Ratio of Females per 100 Males in Washington County?
There are 92.33 Females per 100 Males in Washington County.
What is the Median Population Age in Washington County?
Median Population Age in Washington County is 39.8 Years.
What is the Average Family Size in Washington County
Average Family Size in Washington County is 3.0 People.
What is the Average Household Size in Washington County
Average Household Size in Washington County is 2.5 People.
How Large is the Labor Force in Washington County?
There are 9,652 People in the Labor Forcein in Washington County.
What is the Percentage of People in the Labor Force in Washington County?
51.2% of People are in the Labor Force in Washington County.
What is the Unemployment Rate in Washington County?
Unemployment Rate in Washington County is 4.4%.