Ste. Genevieve County, MO Map & Demographics
Ste. Genevieve County Map
Ste. Genevieve County Overview
$33,060
PER CAPITA INCOME
$83,039
AVG FAMILY INCOME
$61,215
AVG HOUSEHOLD INCOME
39.7%
WAGE / INCOME GAP [ % ]
60.3¢/ $1
WAGE / INCOME GAP [ $ ]
$8,648
FAMILY INCOME DEFICIT
0.44
INEQUALITY / GINI INDEX
18,494
TOTAL POPULATION
9,537
MALE POPULATION
8,957
FEMALE POPULATION
106.48
MALES / 100 FEMALES
93.92
FEMALES / 100 MALES
44.0
MEDIAN AGE
3.1
AVG FAMILY SIZE
2.5
AVG HOUSEHOLD SIZE
8,974
LABOR FORCE [ PEOPLE ]
59.8%
PERCENT IN LABOR FORCE
4.8%
UNEMPLOYMENT RATE
Ste. Genevieve County Area Codes
Income in Ste. Genevieve County
Income Overview in Ste. Genevieve County
Per Capita Income in Ste. Genevieve County is $33,060, while median incomes of families and households are $83,039 and $61,215 respectively.
| Characteristic | Number | Measure |
| Per Capita Income | 18,494 | $33,060 |
| Median Family Income | 4,960 | $83,039 |
| Mean Family Income | 4,960 | $99,197 |
| Median Household Income | 7,121 | $61,215 |
| Mean Household Income | 7,121 | $83,592 |
| Income Deficit | 4,960 | $8,648 |
| Wage / Income Gap (%) | 18,494 | 39.67% |
| Wage / Income Gap ($) | 18,494 | 60.33¢ per $1 |
| Gini / Inequality Index | 18,494 | 0.44 |
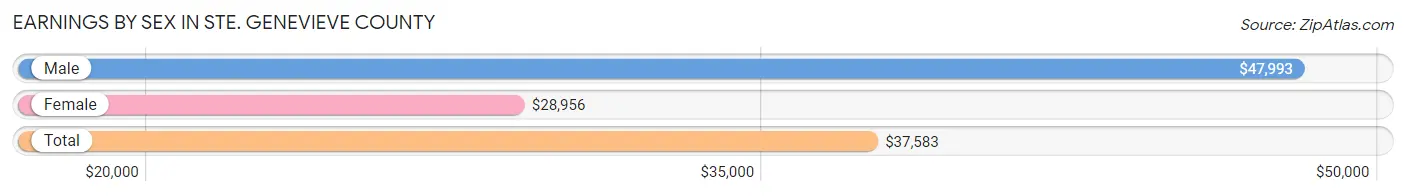
Earnings by Sex in Ste. Genevieve County
Average Earnings in Ste. Genevieve County are $37,583, $47,993 for men and $28,956 for women, a difference of 39.7%.
| Sex | Number | Average Earnings |
| Male | 5,113 (54.4%) | $47,993 |
| Female | 4,293 (45.6%) | $28,956 |
| Total | 9,406 (100.0%) | $37,583 |
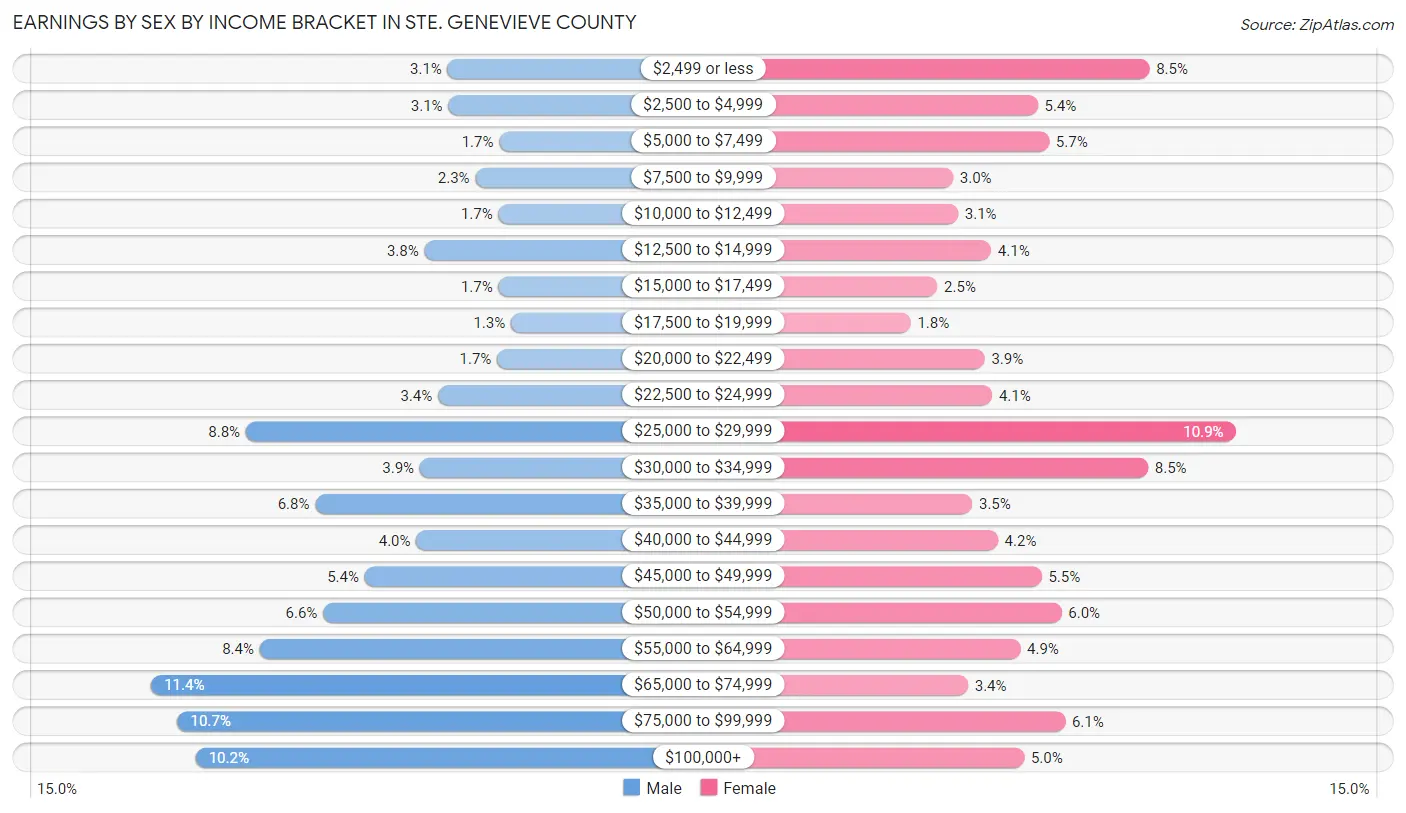
Earnings by Sex by Income Bracket in Ste. Genevieve County
The most common earnings brackets in Ste. Genevieve County are $65,000 to $74,999 for men (585 | 11.4%) and $25,000 to $29,999 for women (469 | 10.9%).
| Income | Male | Female |
| $2,499 or less | 159 (3.1%) | 365 (8.5%) |
| $2,500 to $4,999 | 158 (3.1%) | 230 (5.4%) |
| $5,000 to $7,499 | 85 (1.7%) | 244 (5.7%) |
| $7,500 to $9,999 | 119 (2.3%) | 128 (3.0%) |
| $10,000 to $12,499 | 86 (1.7%) | 134 (3.1%) |
| $12,500 to $14,999 | 192 (3.8%) | 174 (4.1%) |
| $15,000 to $17,499 | 86 (1.7%) | 109 (2.5%) |
| $17,500 to $19,999 | 68 (1.3%) | 77 (1.8%) |
| $20,000 to $22,499 | 88 (1.7%) | 166 (3.9%) |
| $22,500 to $24,999 | 173 (3.4%) | 175 (4.1%) |
| $25,000 to $29,999 | 449 (8.8%) | 469 (10.9%) |
| $30,000 to $34,999 | 199 (3.9%) | 363 (8.5%) |
| $35,000 to $39,999 | 349 (6.8%) | 151 (3.5%) |
| $40,000 to $44,999 | 204 (4.0%) | 182 (4.2%) |
| $45,000 to $49,999 | 278 (5.4%) | 235 (5.5%) |
| $50,000 to $54,999 | 338 (6.6%) | 259 (6.0%) |
| $55,000 to $64,999 | 429 (8.4%) | 209 (4.9%) |
| $65,000 to $74,999 | 585 (11.4%) | 146 (3.4%) |
| $75,000 to $99,999 | 547 (10.7%) | 263 (6.1%) |
| $100,000+ | 521 (10.2%) | 214 (5.0%) |
| Total | 5,113 (100.0%) | 4,293 (100.0%) |
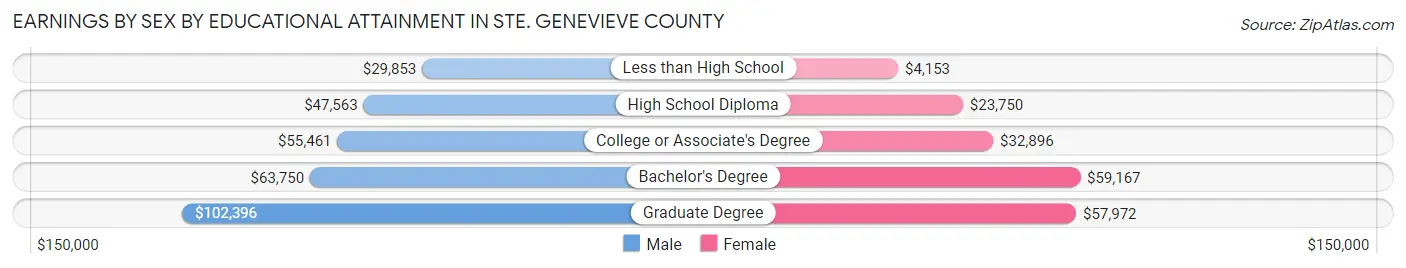
Earnings by Sex by Educational Attainment in Ste. Genevieve County
Average earnings in Ste. Genevieve County are $51,944 for men and $32,448 for women, a difference of 37.5%. Men with an educational attainment of graduate degree enjoy the highest average annual earnings of $102,396, while those with less than high school education earn the least with $29,853. Women with an educational attainment of bachelor's degree earn the most with the average annual earnings of $59,167, while those with less than high school education have the smallest earnings of $4,153.
| Educational Attainment | Male Income | Female Income |
| Less than High School | $29,853 | $4,153 |
| High School Diploma | $47,563 | $23,750 |
| College or Associate's Degree | $55,461 | $32,896 |
| Bachelor's Degree | $63,750 | $59,167 |
| Graduate Degree | $102,396 | $57,972 |
| Total | $51,944 | $32,448 |
Family Income in Ste. Genevieve County
Family Income Brackets in Ste. Genevieve County
According to the Ste. Genevieve County family income data, there are 1,250 families falling into the $100,000 to $149,999 income range, which is the most common income bracket and makes up 25.2% of all families. Conversely, the less than $10,000 income bracket is the least frequent group with only 64 families (1.3%) belonging to this category.
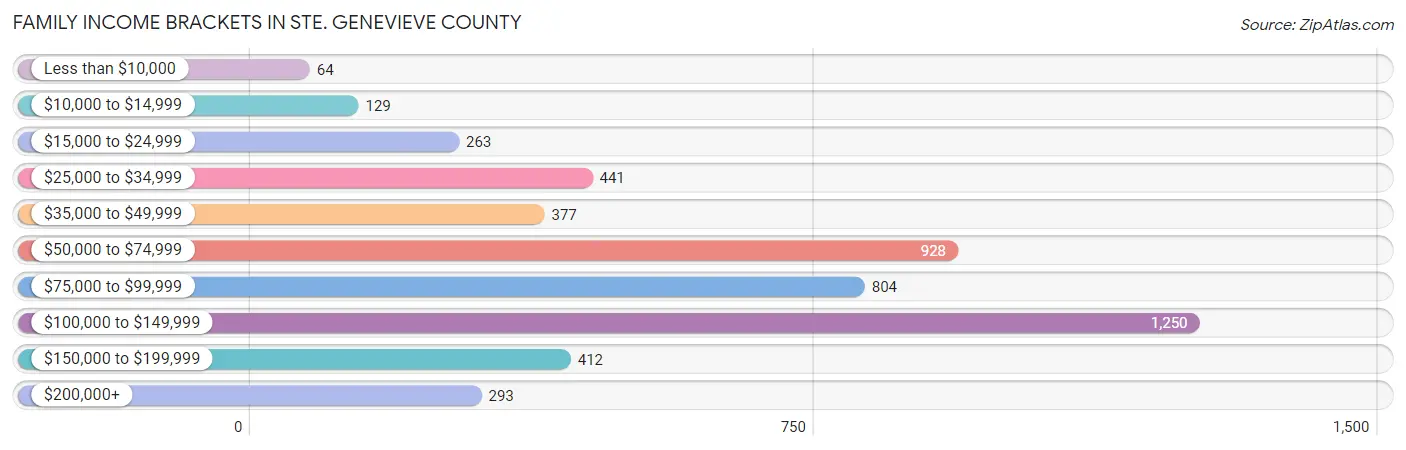
| Income Bracket | # Families | % Families |
| Less than $10,000 | 64 | 1.3% |
| $10,000 to $14,999 | 129 | 2.6% |
| $15,000 to $24,999 | 263 | 5.3% |
| $25,000 to $34,999 | 441 | 8.9% |
| $35,000 to $49,999 | 377 | 7.6% |
| $50,000 to $74,999 | 928 | 18.7% |
| $75,000 to $99,999 | 804 | 16.2% |
| $100,000 to $149,999 | 1,250 | 25.2% |
| $150,000 to $199,999 | 412 | 8.3% |
| $200,000+ | 293 | 5.9% |
Family Income by Famaliy Size in Ste. Genevieve County
7+ person families (48 | 1.0%) account for the highest median family income in Ste. Genevieve County with $137,931 per family, while 3-person families (1,041 | 21.0%) have the highest median income of $39,356 per family member.
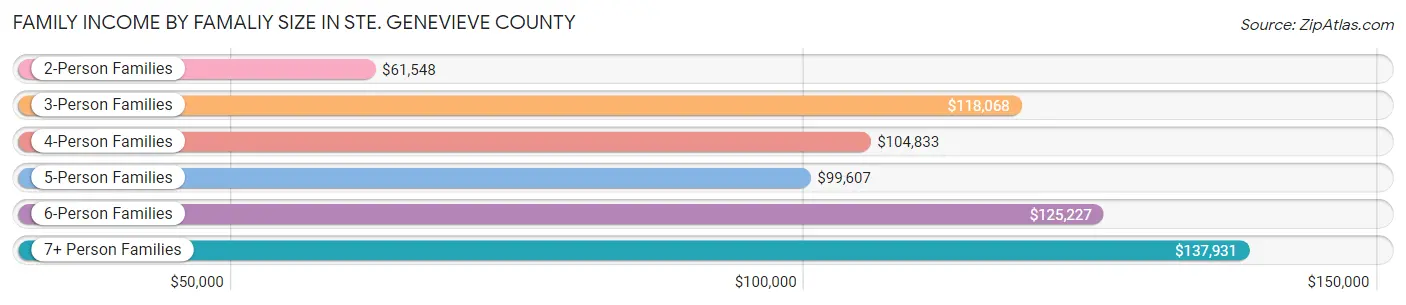
| Income Bracket | # Families | Median Income |
| 2-Person Families | 2,514 (50.7%) | $61,548 |
| 3-Person Families | 1,041 (21.0%) | $118,068 |
| 4-Person Families | 738 (14.9%) | $104,833 |
| 5-Person Families | 515 (10.4%) | $99,607 |
| 6-Person Families | 104 (2.1%) | $125,227 |
| 7+ Person Families | 48 (1.0%) | $137,931 |
| Total | 4,960 (100.0%) | $83,039 |
Family Income by Number of Earners in Ste. Genevieve County
The median family income in Ste. Genevieve County is $83,039, with families comprising 3+ earners (838) having the highest median family income of $125,435, while families with no earners (932) have the lowest median family income of $47,763, accounting for 16.9% and 18.8% of families, respectively.
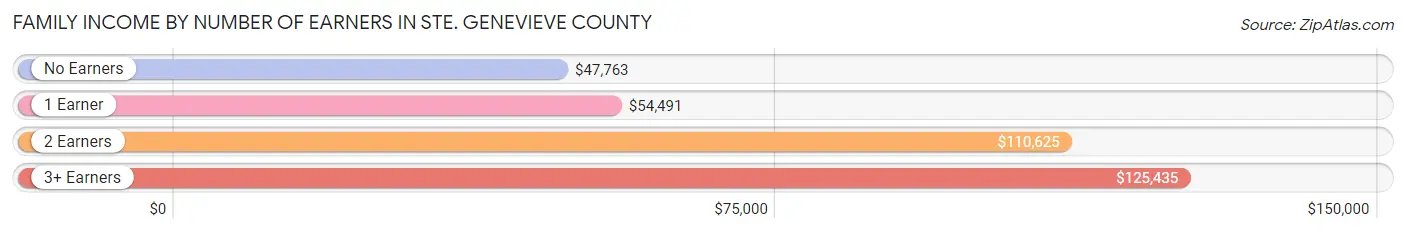
| Number of Earners | # Families | Median Income |
| No Earners | 932 (18.8%) | $47,763 |
| 1 Earner | 1,446 (29.1%) | $54,491 |
| 2 Earners | 1,744 (35.2%) | $110,625 |
| 3+ Earners | 838 (16.9%) | $125,435 |
| Total | 4,960 (100.0%) | $83,039 |
Household Income in Ste. Genevieve County
Household Income Brackets in Ste. Genevieve County
With 1,339 households falling in the category, the $100,000 to $149,999 income range is the most frequent in Ste. Genevieve County, accounting for 18.8% of all households. In contrast, only 178 households (2.5%) fall into the less than $10,000 income bracket, making it the least populous group.
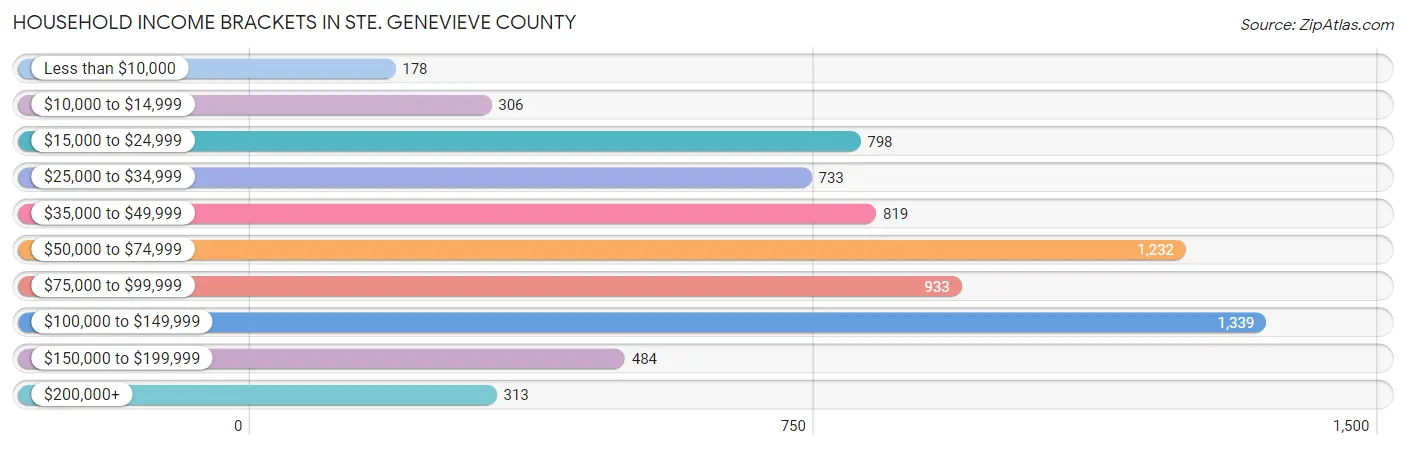
| Income Bracket | # Households | % Households |
| Less than $10,000 | 178 | 2.5% |
| $10,000 to $14,999 | 306 | 4.3% |
| $15,000 to $24,999 | 798 | 11.2% |
| $25,000 to $34,999 | 733 | 10.3% |
| $35,000 to $49,999 | 819 | 11.5% |
| $50,000 to $74,999 | 1,232 | 17.3% |
| $75,000 to $99,999 | 933 | 13.1% |
| $100,000 to $149,999 | 1,339 | 18.8% |
| $150,000 to $199,999 | 484 | 6.8% |
| $200,000+ | 313 | 4.4% |
Household Income by Householder Age in Ste. Genevieve County
The median household income in Ste. Genevieve County is $61,215, with the highest median household income of $83,657 found in the 25 to 44 years age bracket for the primary householder. A total of 1,703 households (23.9%) fall into this category. Meanwhile, the 65+ years age bracket for the primary householder has the lowest median household income of $41,071, with 2,328 households (32.7%) in this group.
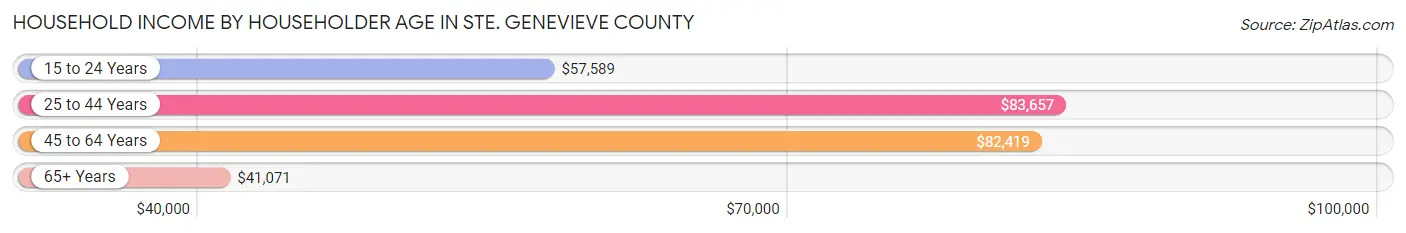
| Income Bracket | # Households | Median Income |
| 15 to 24 Years | 228 (3.2%) | $57,589 |
| 25 to 44 Years | 1,703 (23.9%) | $83,657 |
| 45 to 64 Years | 2,862 (40.2%) | $82,419 |
| 65+ Years | 2,328 (32.7%) | $41,071 |
| Total | 7,121 (100.0%) | $61,215 |
Poverty in Ste. Genevieve County
Income Below Poverty by Sex and Age in Ste. Genevieve County
With 7.6% poverty level for males and 11.0% for females among the residents of Ste. Genevieve County, 15 year old males and 16 and 17 year old females are the most vulnerable to poverty, with 32 males (34.8%) and 67 females (40.1%) in their respective age groups living below the poverty level.
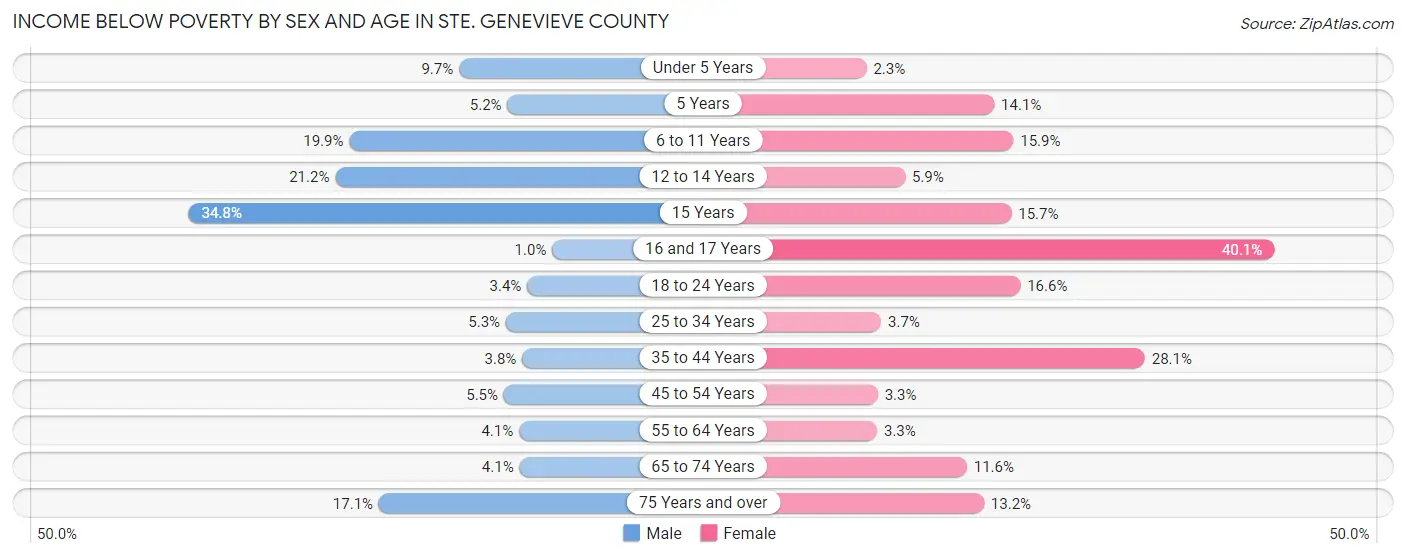
| Age Bracket | Male | Female |
| Under 5 Years | 46 (9.7%) | 11 (2.3%) |
| 5 Years | 7 (5.2%) | 14 (14.1%) |
| 6 to 11 Years | 127 (19.9%) | 96 (15.9%) |
| 12 to 14 Years | 87 (21.2%) | 13 (5.9%) |
| 15 Years | 32 (34.8%) | 28 (15.7%) |
| 16 and 17 Years | 3 (1.0%) | 67 (40.1%) |
| 18 to 24 Years | 23 (3.4%) | 107 (16.6%) |
| 25 to 34 Years | 54 (5.3%) | 34 (3.6%) |
| 35 to 44 Years | 41 (3.8%) | 270 (28.1%) |
| 45 to 54 Years | 62 (5.5%) | 36 (3.3%) |
| 55 to 64 Years | 63 (4.1%) | 48 (3.3%) |
| 65 to 74 Years | 47 (4.1%) | 126 (11.6%) |
| 75 Years and over | 108 (17.1%) | 110 (13.2%) |
| Total | 700 (7.6%) | 960 (11.0%) |
Income Above Poverty by Sex and Age in Ste. Genevieve County
According to the poverty statistics in Ste. Genevieve County, males aged 16 and 17 years and females aged under 5 years are the age groups that are most secure financially, with 99.0% of males and 97.7% of females in these age groups living above the poverty line.
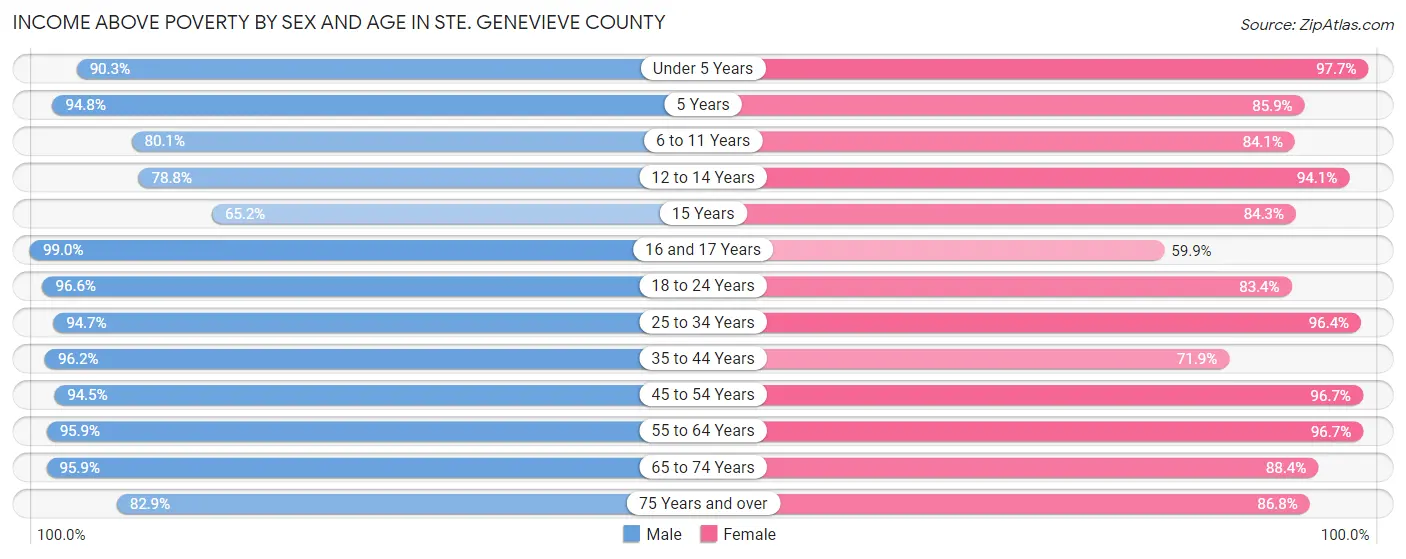
| Age Bracket | Male | Female |
| Under 5 Years | 429 (90.3%) | 470 (97.7%) |
| 5 Years | 128 (94.8%) | 85 (85.9%) |
| 6 to 11 Years | 512 (80.1%) | 507 (84.1%) |
| 12 to 14 Years | 324 (78.8%) | 209 (94.1%) |
| 15 Years | 60 (65.2%) | 150 (84.3%) |
| 16 and 17 Years | 288 (99.0%) | 100 (59.9%) |
| 18 to 24 Years | 662 (96.6%) | 539 (83.4%) |
| 25 to 34 Years | 960 (94.7%) | 898 (96.4%) |
| 35 to 44 Years | 1,031 (96.2%) | 690 (71.9%) |
| 45 to 54 Years | 1,062 (94.5%) | 1,044 (96.7%) |
| 55 to 64 Years | 1,470 (95.9%) | 1,421 (96.7%) |
| 65 to 74 Years | 1,107 (95.9%) | 960 (88.4%) |
| 75 Years and over | 523 (82.9%) | 724 (86.8%) |
| Total | 8,556 (92.4%) | 7,797 (89.0%) |
Income Below Poverty Among Married-Couple Families in Ste. Genevieve County
The poverty statistics for married-couple families in Ste. Genevieve County show that 3.5% or 144 of the total 4,080 families live below the poverty line. Families with no children have the highest poverty rate of 3.9%, comprising of 109 families. On the other hand, families with 5 or more children have the lowest poverty rate of 0.0%, which includes 0 families.
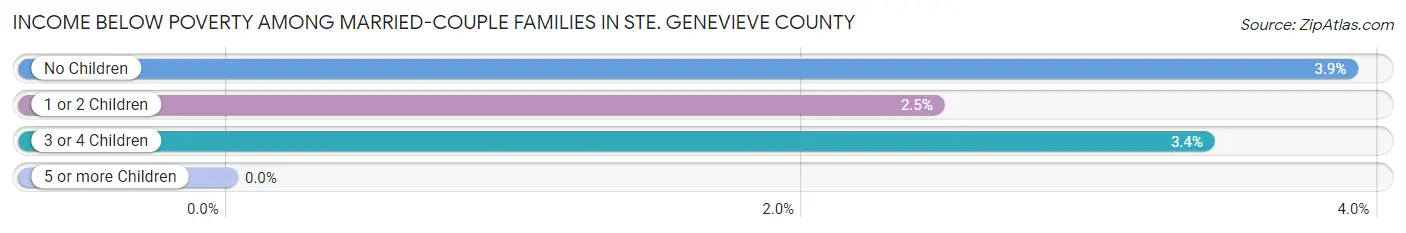
| Children | Above Poverty | Below Poverty |
| No Children | 2,687 (96.1%) | 109 (3.9%) |
| 1 or 2 Children | 833 (97.5%) | 21 (2.5%) |
| 3 or 4 Children | 398 (96.6%) | 14 (3.4%) |
| 5 or more Children | 18 (100.0%) | 0 (0.0%) |
| Total | 3,936 (96.5%) | 144 (3.5%) |
Income Below Poverty Among Single-Parent Households in Ste. Genevieve County
According to the poverty data in Ste. Genevieve County, 7.0% or 29 single-father households and 37.6% or 174 single-mother households are living below the poverty line. Among single-father households, those with 3 or 4 children have the highest poverty rate, with 6 households (14.0%) experiencing poverty. Likewise, among single-mother households, those with 3 or 4 children have the highest poverty rate, with 72 households (85.7%) falling below the poverty line.
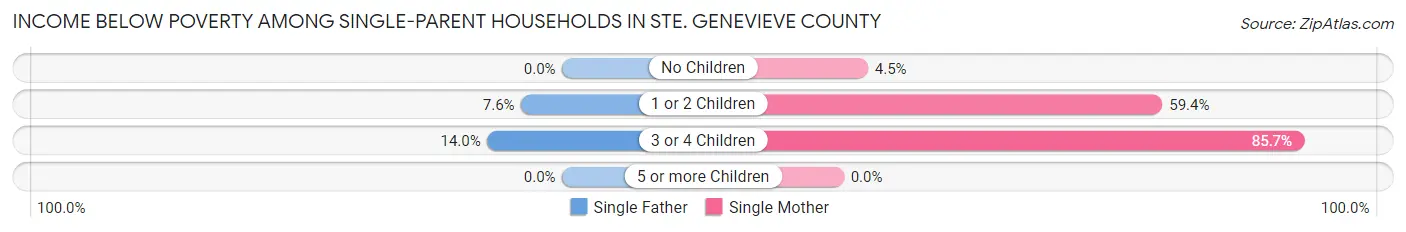
| Children | Single Father | Single Mother |
| No Children | 0 (0.0%) | 10 (4.5%) |
| 1 or 2 Children | 23 (7.6%) | 92 (59.4%) |
| 3 or 4 Children | 6 (14.0%) | 72 (85.7%) |
| 5 or more Children | 0 (0.0%) | 0 (0.0%) |
| Total | 29 (7.0%) | 174 (37.6%) |
Income Below Poverty Among Married-Couple vs Single-Parent Households in Ste. Genevieve County
The poverty data for Ste. Genevieve County shows that 144 of the married-couple family households (3.5%) and 203 of the single-parent households (23.1%) are living below the poverty level. Within the married-couple family households, those with no children have the highest poverty rate, with 109 households (3.9%) falling below the poverty line. Among the single-parent households, those with 3 or 4 children have the highest poverty rate, with 78 household (61.4%) living below poverty.
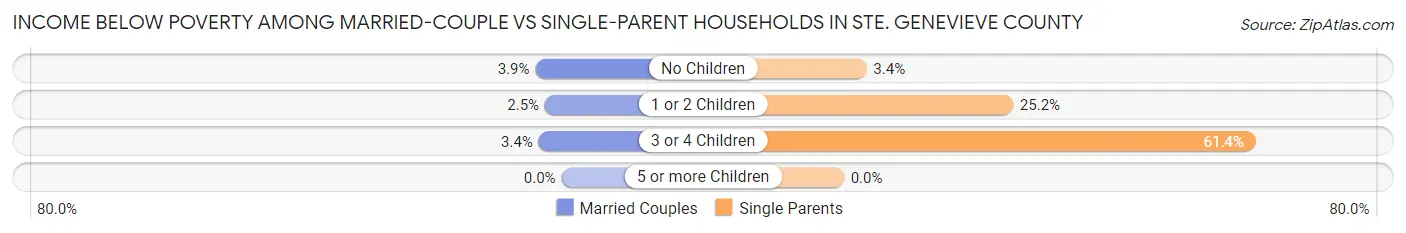
| Children | Married-Couple Families | Single-Parent Households |
| No Children | 109 (3.9%) | 10 (3.4%) |
| 1 or 2 Children | 21 (2.5%) | 115 (25.2%) |
| 3 or 4 Children | 14 (3.4%) | 78 (61.4%) |
| 5 or more Children | 0 (0.0%) | 0 (0.0%) |
| Total | 144 (3.5%) | 203 (23.1%) |
Race in Ste. Genevieve County
The most populous races in Ste. Genevieve County are White / Caucasian (17,479 | 94.5%), Two or more Races (563 | 3.0%), and Black / African American (283 | 1.5%).
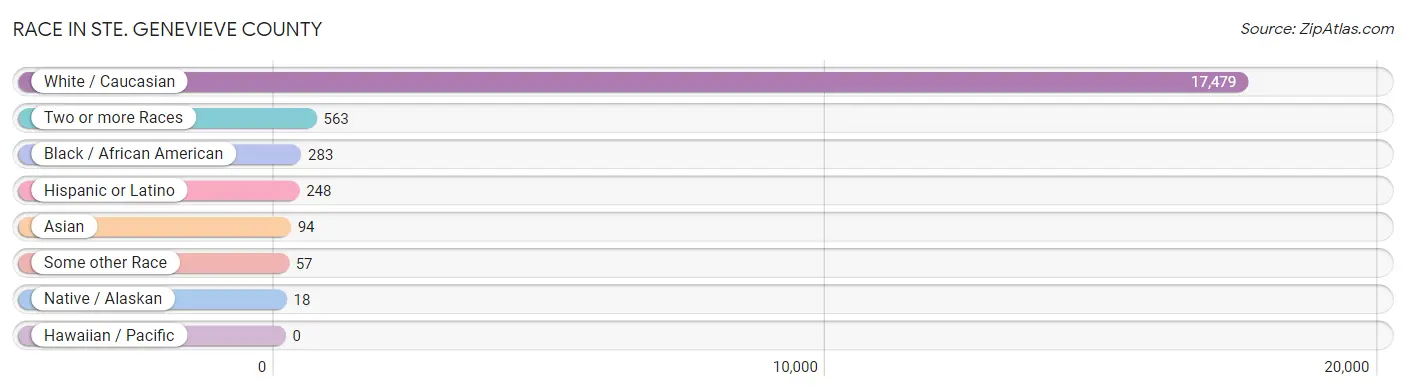
| Race | # Population | % Population |
| Asian | 94 | 0.5% |
| Black / African American | 283 | 1.5% |
| Hawaiian / Pacific | 0 | 0.0% |
| Hispanic or Latino | 248 | 1.3% |
| Native / Alaskan | 18 | 0.1% |
| White / Caucasian | 17,479 | 94.5% |
| Two or more Races | 563 | 3.0% |
| Some other Race | 57 | 0.3% |
| Total | 18,494 | 100.0% |
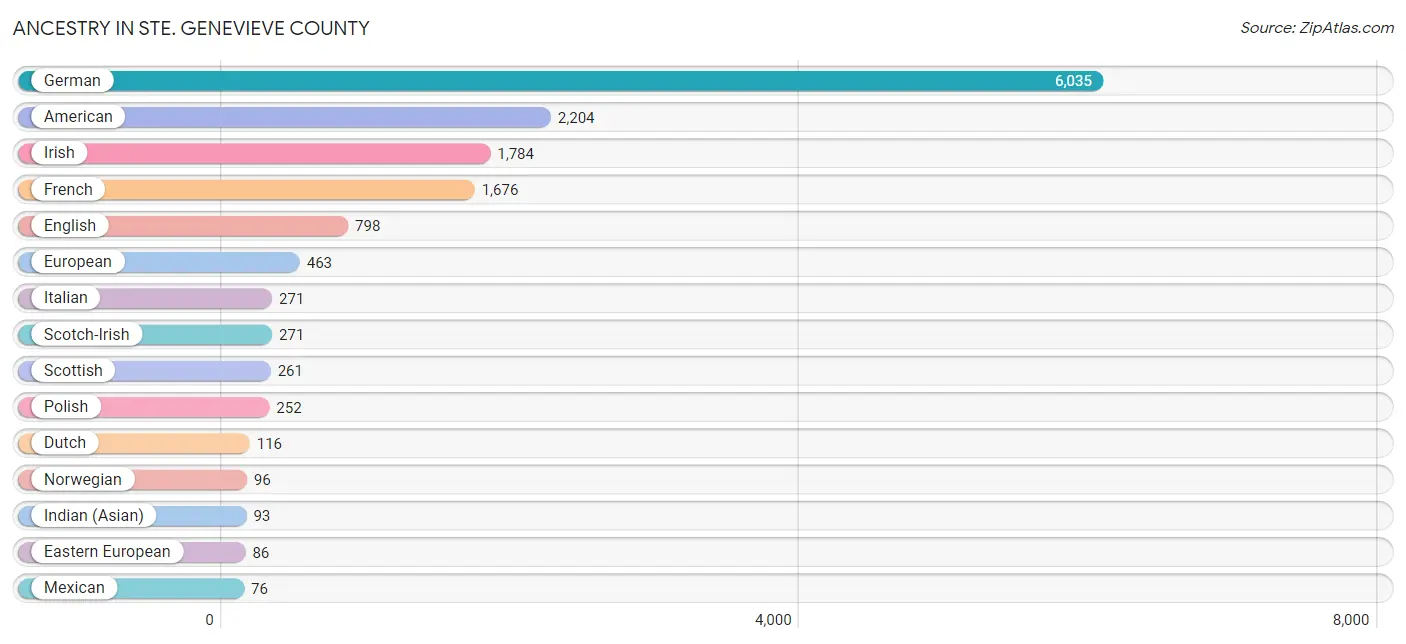
Ancestry in Ste. Genevieve County
The most populous ancestries reported in Ste. Genevieve County are German (6,035 | 32.6%), American (2,204 | 11.9%), Irish (1,784 | 9.7%), French (1,676 | 9.1%), and English (798 | 4.3%), together accounting for 67.6% of all Ste. Genevieve County residents.
| Ancestry | # Population | % Population |
| African | 21 | 0.1% |
| American | 2,204 | 11.9% |
| Arab | 9 | 0.1% |
| Belgian | 2 | 0.0% |
| Blackfeet | 4 | 0.0% |
| British | 7 | 0.0% |
| Central American | 48 | 0.3% |
| Cherokee | 41 | 0.2% |
| Cheyenne | 4 | 0.0% |
| Chickasaw | 28 | 0.2% |
| Croatian | 35 | 0.2% |
| Czech | 41 | 0.2% |
| Czechoslovakian | 10 | 0.1% |
| Dutch | 116 | 0.6% |
| Eastern European | 86 | 0.5% |
| English | 798 | 4.3% |
| European | 463 | 2.5% |
| French | 1,676 | 9.1% |
| French American Indian | 19 | 0.1% |
| French Canadian | 53 | 0.3% |
| German | 6,035 | 32.6% |
| Greek | 33 | 0.2% |
| Hmong | 23 | 0.1% |
| Hungarian | 26 | 0.1% |
| Indian (Asian) | 93 | 0.5% |
| Inupiat | 3 | 0.0% |
| Irish | 1,784 | 9.7% |
| Italian | 271 | 1.5% |
| Lebanese | 9 | 0.1% |
| Mexican | 76 | 0.4% |
| Norwegian | 96 | 0.5% |
| Polish | 252 | 1.4% |
| Puerto Rican | 43 | 0.2% |
| Romanian | 2 | 0.0% |
| Russian | 31 | 0.2% |
| Salvadoran | 48 | 0.3% |
| Scandinavian | 23 | 0.1% |
| Scotch-Irish | 271 | 1.5% |
| Scottish | 261 | 1.4% |
| Slovak | 16 | 0.1% |
| Spanish | 52 | 0.3% |
| Sri Lankan | 20 | 0.1% |
| Subsaharan African | 21 | 0.1% |
| Swedish | 7 | 0.0% |
| Swiss | 16 | 0.1% |
| Thai | 19 | 0.1% |
| Ukrainian | 1 | 0.0% |
| Welsh | 7 | 0.0% | View All 48 Rows |
Immigrants in Ste. Genevieve County
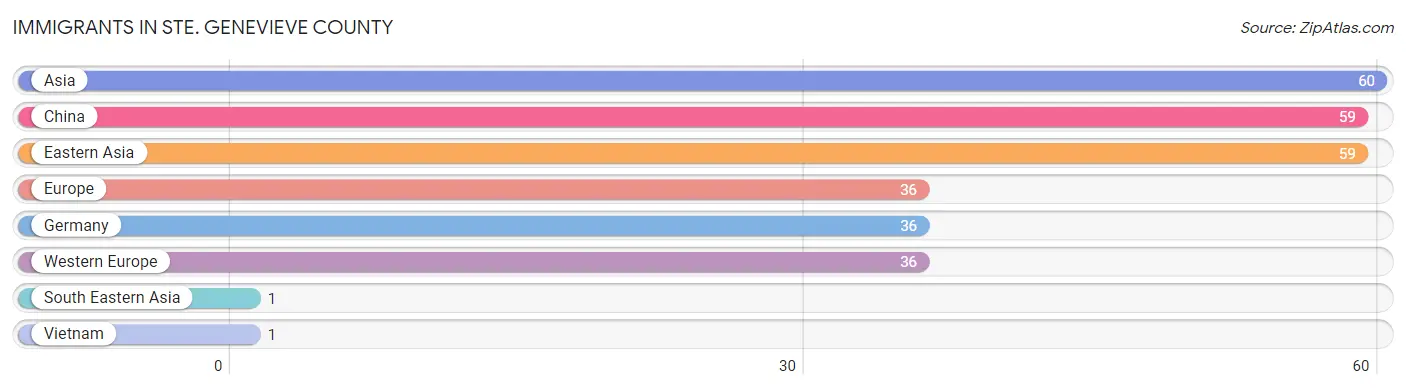
The most numerous immigrant groups reported in Ste. Genevieve County came from Asia (60 | 0.3%), China (59 | 0.3%), Eastern Asia (59 | 0.3%), Europe (36 | 0.2%), and Germany (36 | 0.2%), together accounting for 1.3% of all Ste. Genevieve County residents.
| Immigration Origin | # Population | % Population |
| Asia | 60 | 0.3% |
| China | 59 | 0.3% |
| Eastern Asia | 59 | 0.3% |
| Europe | 36 | 0.2% |
| Germany | 36 | 0.2% |
| South Eastern Asia | 1 | 0.0% |
| Vietnam | 1 | 0.0% |
| Western Europe | 36 | 0.2% | View All 8 Rows |
Sex and Age in Ste. Genevieve County
Sex and Age in Ste. Genevieve County
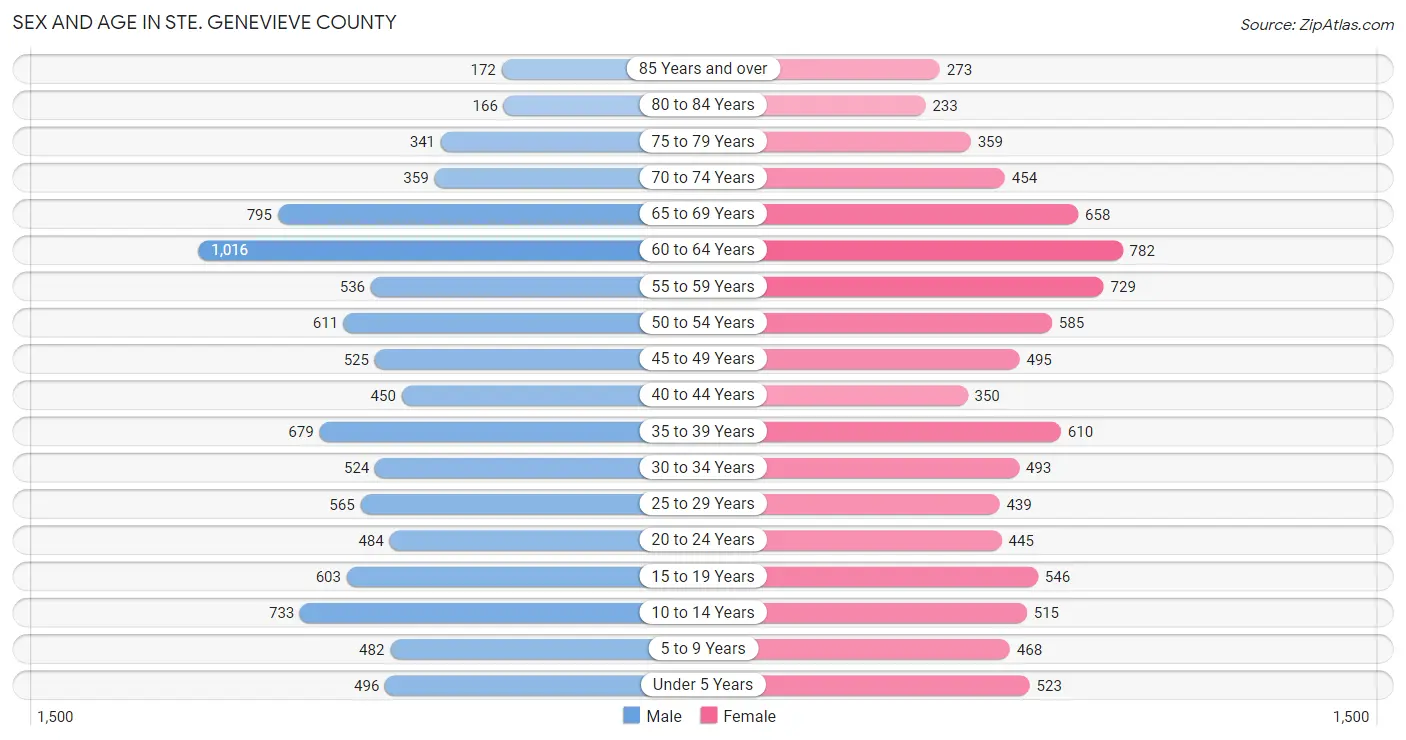
The most populous age groups in Ste. Genevieve County are 60 to 64 Years (1,016 | 10.6%) for men and 60 to 64 Years (782 | 8.7%) for women.
| Age Bracket | Male | Female |
| Under 5 Years | 496 (5.2%) | 523 (5.8%) |
| 5 to 9 Years | 482 (5.1%) | 468 (5.2%) |
| 10 to 14 Years | 733 (7.7%) | 515 (5.8%) |
| 15 to 19 Years | 603 (6.3%) | 546 (6.1%) |
| 20 to 24 Years | 484 (5.1%) | 445 (5.0%) |
| 25 to 29 Years | 565 (5.9%) | 439 (4.9%) |
| 30 to 34 Years | 524 (5.5%) | 493 (5.5%) |
| 35 to 39 Years | 679 (7.1%) | 610 (6.8%) |
| 40 to 44 Years | 450 (4.7%) | 350 (3.9%) |
| 45 to 49 Years | 525 (5.5%) | 495 (5.5%) |
| 50 to 54 Years | 611 (6.4%) | 585 (6.5%) |
| 55 to 59 Years | 536 (5.6%) | 729 (8.1%) |
| 60 to 64 Years | 1,016 (10.6%) | 782 (8.7%) |
| 65 to 69 Years | 795 (8.3%) | 658 (7.3%) |
| 70 to 74 Years | 359 (3.8%) | 454 (5.1%) |
| 75 to 79 Years | 341 (3.6%) | 359 (4.0%) |
| 80 to 84 Years | 166 (1.7%) | 233 (2.6%) |
| 85 Years and over | 172 (1.8%) | 273 (3.0%) |
| Total | 9,537 (100.0%) | 8,957 (100.0%) |
Families and Households in Ste. Genevieve County
Median Family Size in Ste. Genevieve County
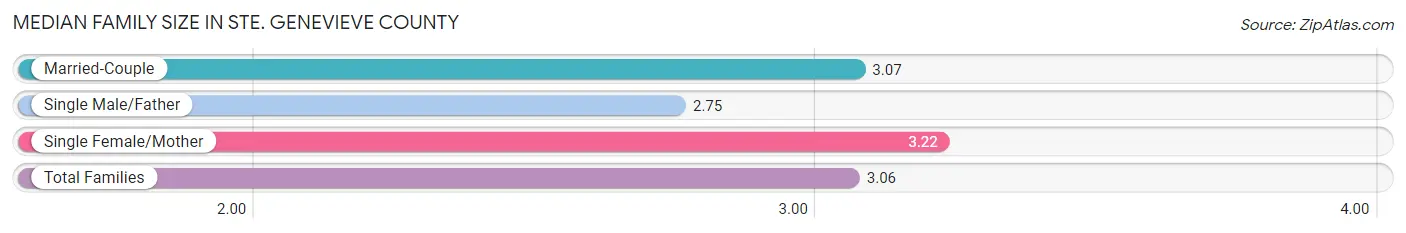
The median family size in Ste. Genevieve County is 3.06 persons per family, with single female/mother families (463 | 9.3%) accounting for the largest median family size of 3.22 persons per family. On the other hand, single male/father families (417 | 8.4%) represent the smallest median family size with 2.75 persons per family.
| Family Type | # Families | Family Size |
| Married-Couple | 4,080 (82.3%) | 3.07 |
| Single Male/Father | 417 (8.4%) | 2.75 |
| Single Female/Mother | 463 (9.3%) | 3.22 |
| Total Families | 4,960 (100.0%) | 3.06 |
Median Household Size in Ste. Genevieve County
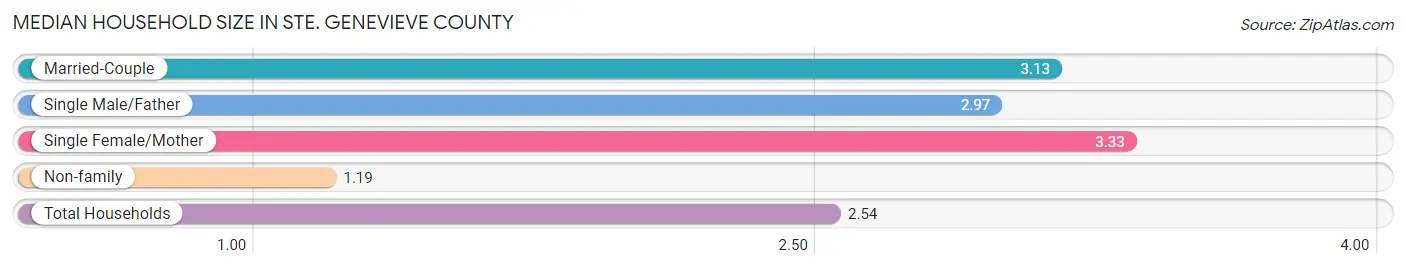
The median household size in Ste. Genevieve County is 2.54 persons per household, with single female/mother households (463 | 6.5%) accounting for the largest median household size of 3.33 persons per household. non-family households (2,161 | 30.3%) represent the smallest median household size with 1.19 persons per household.
| Household Type | # Households | Household Size |
| Married-Couple | 4,080 (57.3%) | 3.13 |
| Single Male/Father | 417 (5.9%) | 2.97 |
| Single Female/Mother | 463 (6.5%) | 3.33 |
| Non-family | 2,161 (30.3%) | 1.19 |
| Total Households | 7,121 (100.0%) | 2.54 |
Household Size by Marriage Status in Ste. Genevieve County
Out of a total of 7,121 households in Ste. Genevieve County, 4,960 (69.7%) are family households, while 2,161 (30.3%) are nonfamily households. The most numerous type of family households are 2-person households, comprising 2,443, and the most common type of nonfamily households are 1-person households, comprising 1,804.
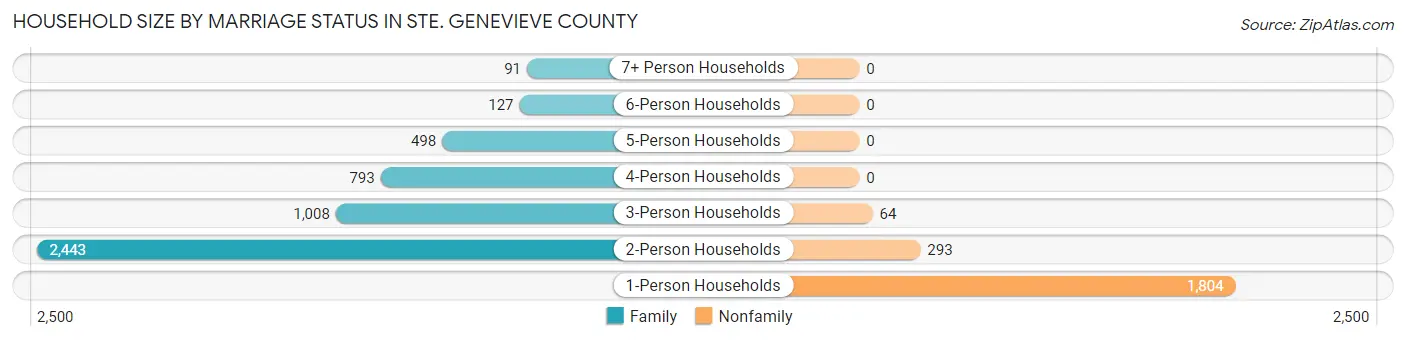
| Household Size | Family Households | Nonfamily Households |
| 1-Person Households | - | 1,804 (25.3%) |
| 2-Person Households | 2,443 (34.3%) | 293 (4.1%) |
| 3-Person Households | 1,008 (14.2%) | 64 (0.9%) |
| 4-Person Households | 793 (11.1%) | 0 (0.0%) |
| 5-Person Households | 498 (7.0%) | 0 (0.0%) |
| 6-Person Households | 127 (1.8%) | 0 (0.0%) |
| 7+ Person Households | 91 (1.3%) | 0 (0.0%) |
| Total | 4,960 (69.7%) | 2,161 (30.3%) |
Female Fertility in Ste. Genevieve County
Fertility by Age in Ste. Genevieve County
Average fertility rate in Ste. Genevieve County is 41.0 births per 1,000 women. Women in the age bracket of 20 to 34 years have the highest fertility rate with 65.0 births per 1,000 women. Women in the age bracket of 20 to 34 years acount for 62.9% of all women with births.
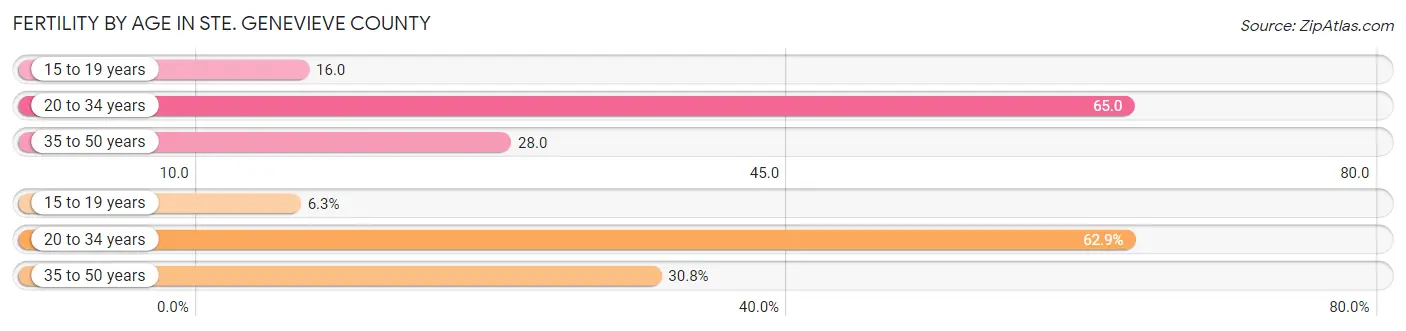
| Age Bracket | Women with Births | Births / 1,000 Women |
| 15 to 19 years | 9 (6.3%) | 16.0 |
| 20 to 34 years | 90 (62.9%) | 65.0 |
| 35 to 50 years | 44 (30.8%) | 28.0 |
| Total | 143 (100.0%) | 41.0 |
Fertility by Age by Marriage Status in Ste. Genevieve County
71.3% of women with births (143) in Ste. Genevieve County are married. The highest percentage of unmarried women with births falls into 15 to 19 years age bracket with 100.0% of them unmarried at the time of birth, while the lowest percentage of unmarried women with births belong to 20 to 34 years age bracket with 8.9% of them unmarried.
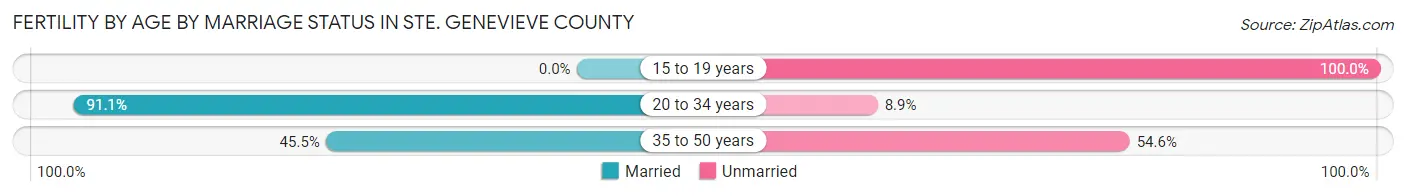
| Age Bracket | Married | Unmarried |
| 15 to 19 years | 0 (0.0%) | 9 (100.0%) |
| 20 to 34 years | 82 (91.1%) | 8 (8.9%) |
| 35 to 50 years | 20 (45.5%) | 24 (54.5%) |
| Total | 102 (71.3%) | 41 (28.7%) |
Fertility by Education in Ste. Genevieve County
Average fertility rate in Ste. Genevieve County is 41.0 births per 1,000 women. Women with the education attainment of bachelor's degree have the highest fertility rate of 69.0 births per 1,000 women, while women with the education attainment of high school diploma have the lowest fertility at 16.0 births per 1,000 women. Women with the education attainment of college or associate's degree represent 53.1% of all women with births.
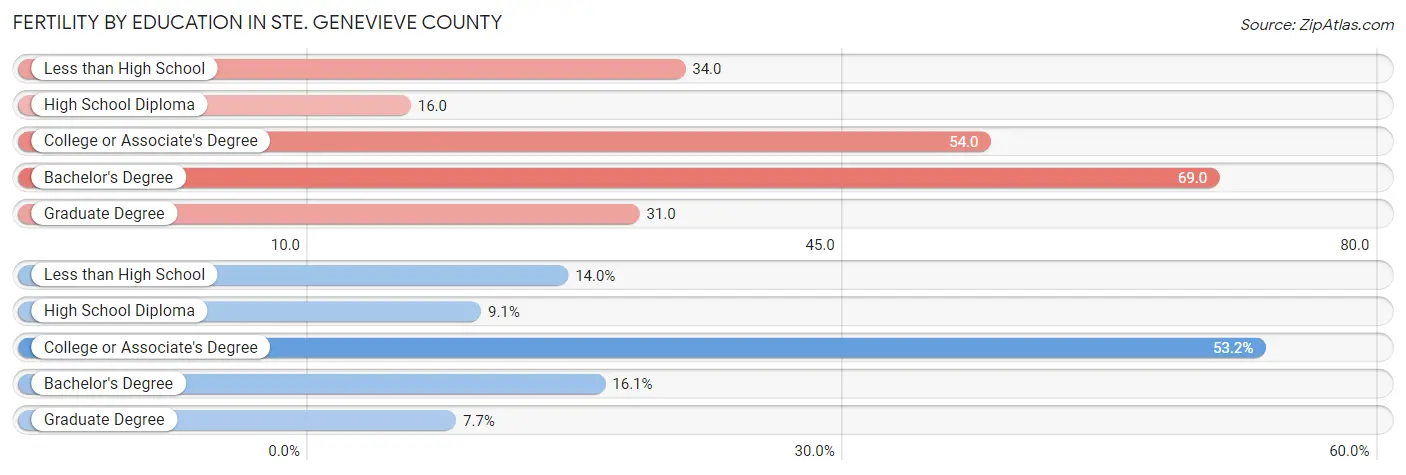
| Educational Attainment | Women with Births | Births / 1,000 Women |
| Less than High School | 20 (14.0%) | 34.0 |
| High School Diploma | 13 (9.1%) | 16.0 |
| College or Associate's Degree | 76 (53.1%) | 54.0 |
| Bachelor's Degree | 23 (16.1%) | 69.0 |
| Graduate Degree | 11 (7.7%) | 31.0 |
| Total | 143 (100.0%) | 41.0 |
Fertility by Education by Marriage Status in Ste. Genevieve County
28.7% of women with births in Ste. Genevieve County are unmarried. Women with the educational attainment of college or associate's degree are most likely to be married with 100.0% of them married at childbirth, while women with the educational attainment of less than high school are least likely to be married with 100.0% of them unmarried at childbirth.
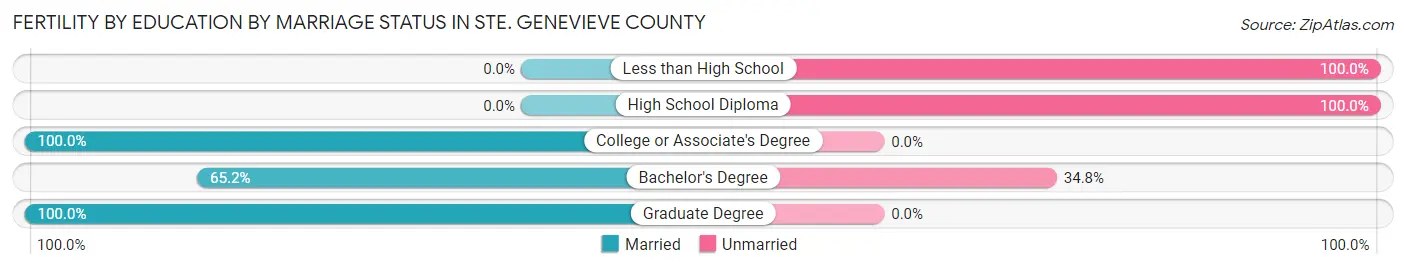
| Educational Attainment | Married | Unmarried |
| Less than High School | 0 (0.0%) | 20 (100.0%) |
| High School Diploma | 0 (0.0%) | 13 (100.0%) |
| College or Associate's Degree | 76 (100.0%) | 0 (0.0%) |
| Bachelor's Degree | 15 (65.2%) | 8 (34.8%) |
| Graduate Degree | 11 (100.0%) | 0 (0.0%) |
| Total | 102 (71.3%) | 41 (28.7%) |
Employment Characteristics in Ste. Genevieve County
Employment by Class of Employer in Ste. Genevieve County
Among the 8,261 employed individuals in Ste. Genevieve County, private company employees (5,727 | 69.3%), not-for-profit organizations (733 | 8.9%), and local government employees (666 | 8.1%) make up the most common classes of employment.
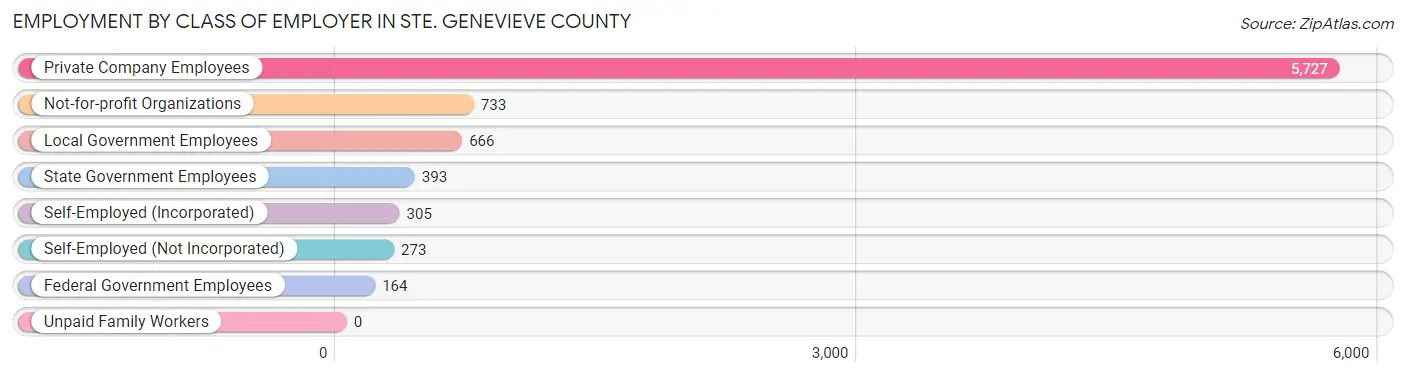
| Employer Class | # Employees | % Employees |
| Private Company Employees | 5,727 | 69.3% |
| Self-Employed (Incorporated) | 305 | 3.7% |
| Self-Employed (Not Incorporated) | 273 | 3.3% |
| Not-for-profit Organizations | 733 | 8.9% |
| Local Government Employees | 666 | 8.1% |
| State Government Employees | 393 | 4.8% |
| Federal Government Employees | 164 | 2.0% |
| Unpaid Family Workers | 0 | 0.0% |
| Total | 8,261 | 100.0% |
Employment Status by Age in Ste. Genevieve County
According to the labor force statistics for Ste. Genevieve County, out of the total population over 16 years of age (15,007), 59.8% or 8,974 individuals are in the labor force, with 4.8% or 431 of them unemployed. The age group with the highest labor force participation rate is 25 to 29 years, with 93.2% or 936 individuals in the labor force. Within the labor force, the 25 to 29 years age range has the highest percentage of unemployed individuals, with 13.9% or 130 of them being unemployed.
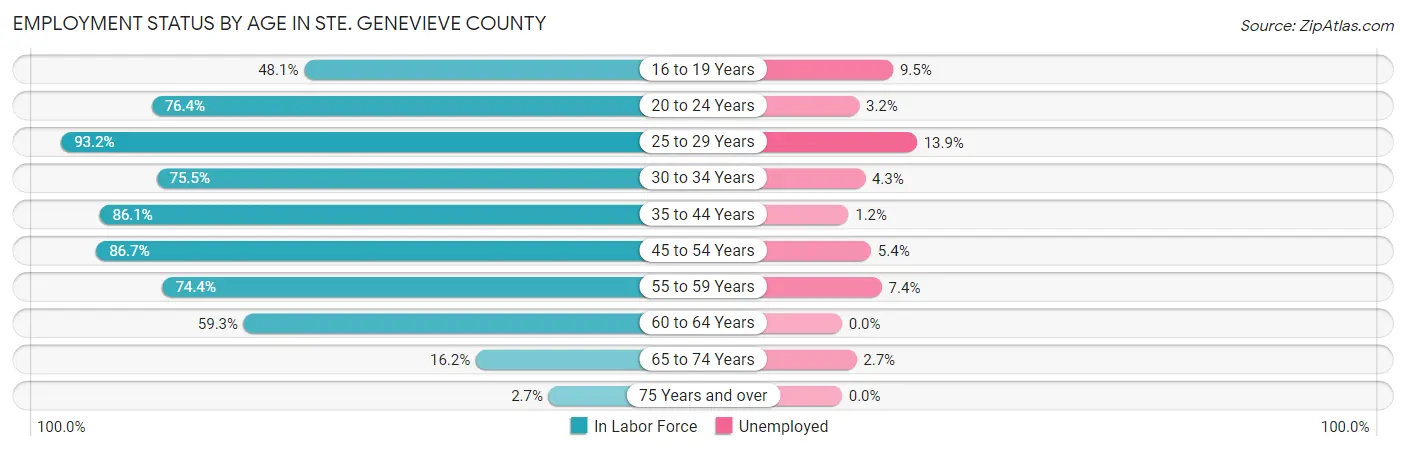
| Age Bracket | In Labor Force | Unemployed |
| 16 to 19 Years | 423 (48.1%) | 40 (9.5%) |
| 20 to 24 Years | 710 (76.4%) | 23 (3.2%) |
| 25 to 29 Years | 936 (93.2%) | 130 (13.9%) |
| 30 to 34 Years | 768 (75.5%) | 33 (4.3%) |
| 35 to 44 Years | 1,799 (86.1%) | 22 (1.2%) |
| 45 to 54 Years | 1,921 (86.7%) | 104 (5.4%) |
| 55 to 59 Years | 941 (74.4%) | 70 (7.4%) |
| 60 to 64 Years | 1,066 (59.3%) | 0 (0.0%) |
| 65 to 74 Years | 367 (16.2%) | 10 (2.7%) |
| 75 Years and over | 42 (2.7%) | 0 (0.0%) |
| Total | 8,974 (59.8%) | 431 (4.8%) |
Employment Status by Educational Attainment in Ste. Genevieve County
According to labor force statistics for Ste. Genevieve County, 79.1% of individuals (7,427) out of the total population between 25 and 64 years of age (9,389) are in the labor force, with 4.8% or 356 of them being unemployed. The group with the highest labor force participation rate are those with the educational attainment of bachelor's degree or higher, with 87.0% or 1,448 individuals in the labor force. Within the labor force, individuals with high school diploma education have the highest percentage of unemployment, with 7.6% or 196 of them being unemployed.
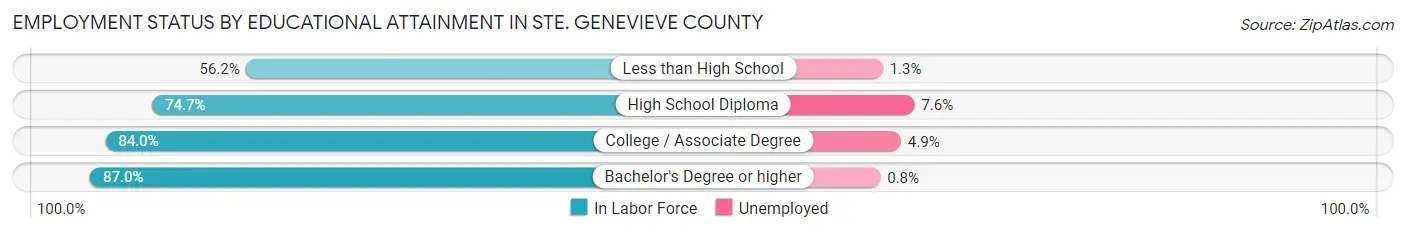
| Educational Attainment | In Labor Force | Unemployed |
| Less than High School | 380 (56.2%) | 9 (1.3%) |
| High School Diploma | 2,579 (74.7%) | 262 (7.6%) |
| College / Associate Degree | 3,021 (84.0%) | 176 (4.9%) |
| Bachelor's Degree or higher | 1,448 (87.0%) | 13 (0.8%) |
| Total | 7,427 (79.1%) | 451 (4.8%) |
Employment Occupations by Sex in Ste. Genevieve County
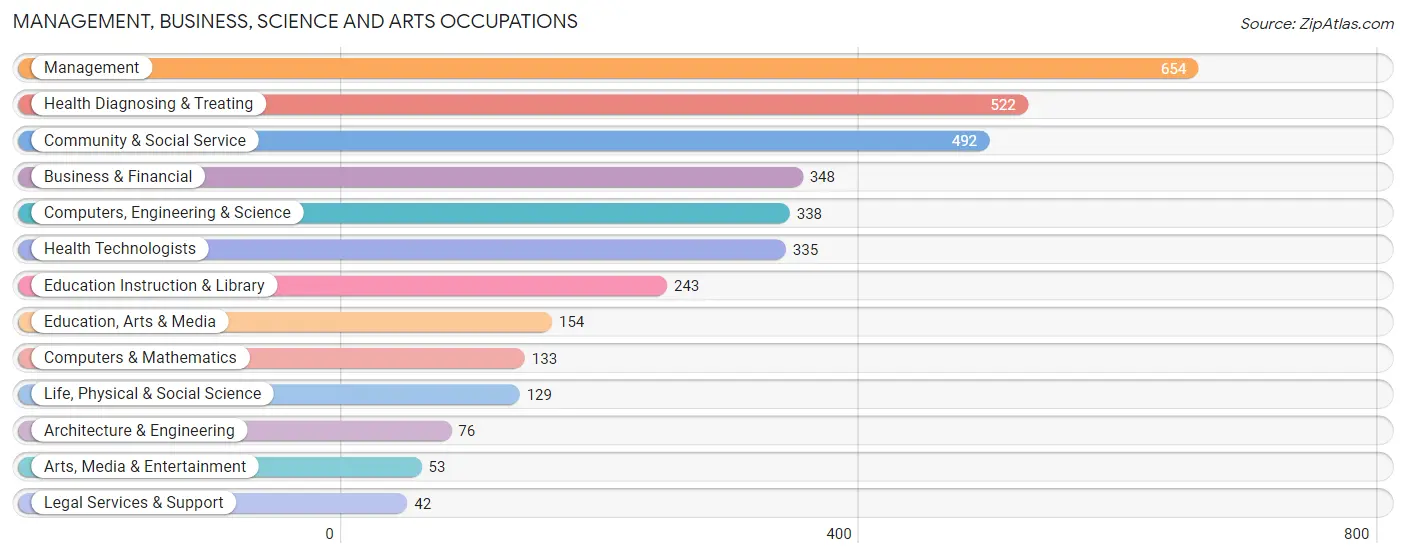
Management, Business, Science and Arts Occupations
The most common Management, Business, Science and Arts occupations in Ste. Genevieve County are Management (654 | 7.7%), Health Diagnosing & Treating (522 | 6.1%), Community & Social Service (492 | 5.8%), Business & Financial (348 | 4.1%), and Computers, Engineering & Science (338 | 4.0%).
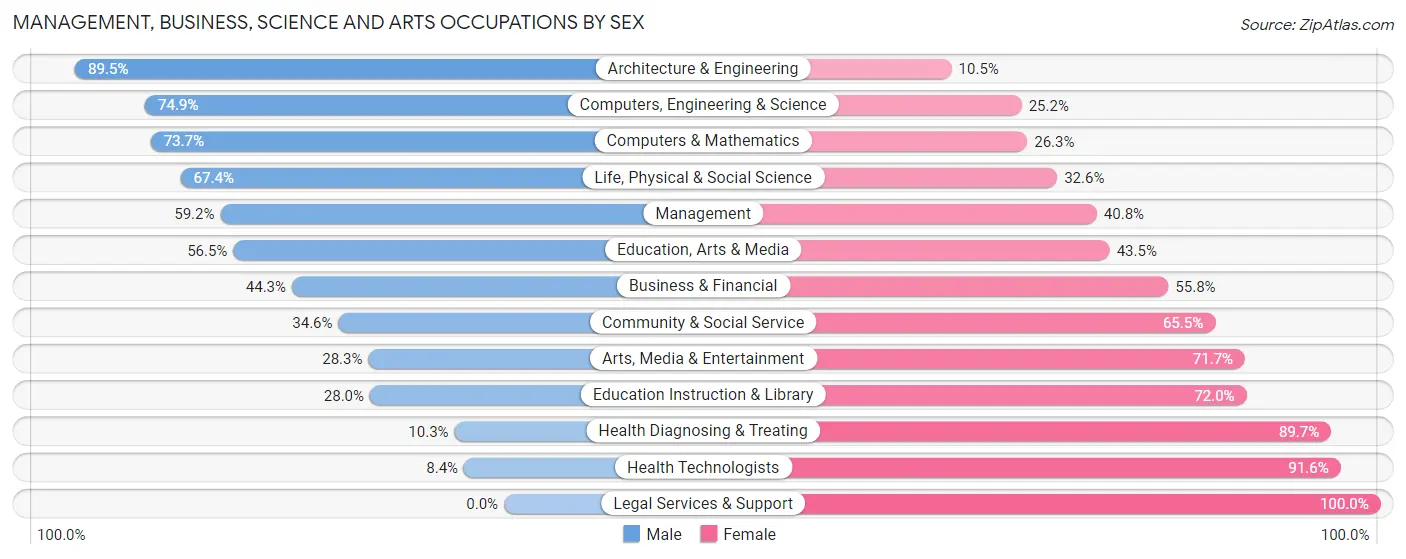
Management, Business, Science and Arts Occupations by Sex
Within the Management, Business, Science and Arts occupations in Ste. Genevieve County, the most male-oriented occupations are Architecture & Engineering (89.5%), Computers, Engineering & Science (74.9%), and Computers & Mathematics (73.7%), while the most female-oriented occupations are Legal Services & Support (100.0%), Health Technologists (91.6%), and Health Diagnosing & Treating (89.7%).
| Occupation | Male | Female |
| Management | 387 (59.2%) | 267 (40.8%) |
| Business & Financial | 154 (44.3%) | 194 (55.7%) |
| Computers, Engineering & Science | 253 (74.9%) | 85 (25.2%) |
| Computers & Mathematics | 98 (73.7%) | 35 (26.3%) |
| Architecture & Engineering | 68 (89.5%) | 8 (10.5%) |
| Life, Physical & Social Science | 87 (67.4%) | 42 (32.6%) |
| Community & Social Service | 170 (34.5%) | 322 (65.4%) |
| Education, Arts & Media | 87 (56.5%) | 67 (43.5%) |
| Legal Services & Support | 0 (0.0%) | 42 (100.0%) |
| Education Instruction & Library | 68 (28.0%) | 175 (72.0%) |
| Arts, Media & Entertainment | 15 (28.3%) | 38 (71.7%) |
| Health Diagnosing & Treating | 54 (10.3%) | 468 (89.7%) |
| Health Technologists | 28 (8.4%) | 307 (91.6%) |
| Total (Category) | 1,018 (43.2%) | 1,336 (56.8%) |
| Total (Overall) | 4,758 (55.7%) | 3,781 (44.3%) |
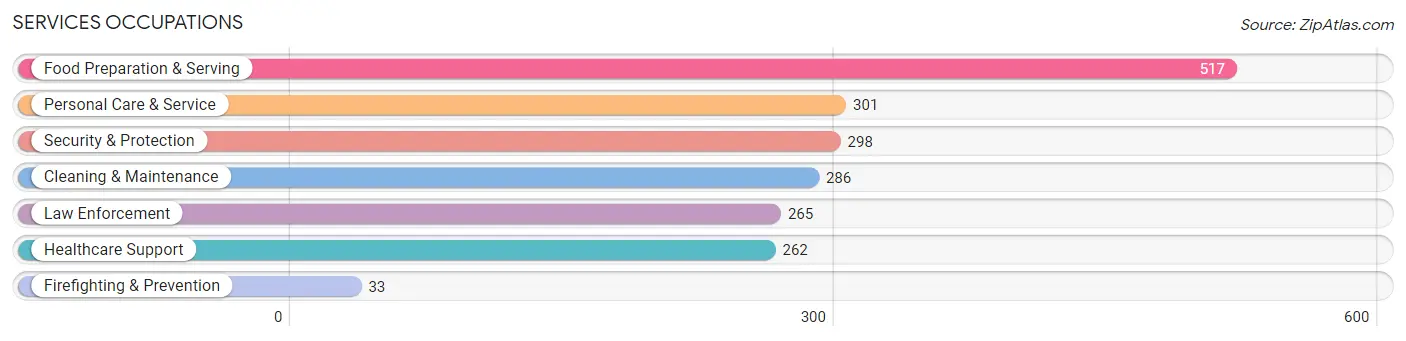
Services Occupations
The most common Services occupations in Ste. Genevieve County are Food Preparation & Serving (517 | 6.0%), Personal Care & Service (301 | 3.5%), Security & Protection (298 | 3.5%), Cleaning & Maintenance (286 | 3.4%), and Law Enforcement (265 | 3.1%).
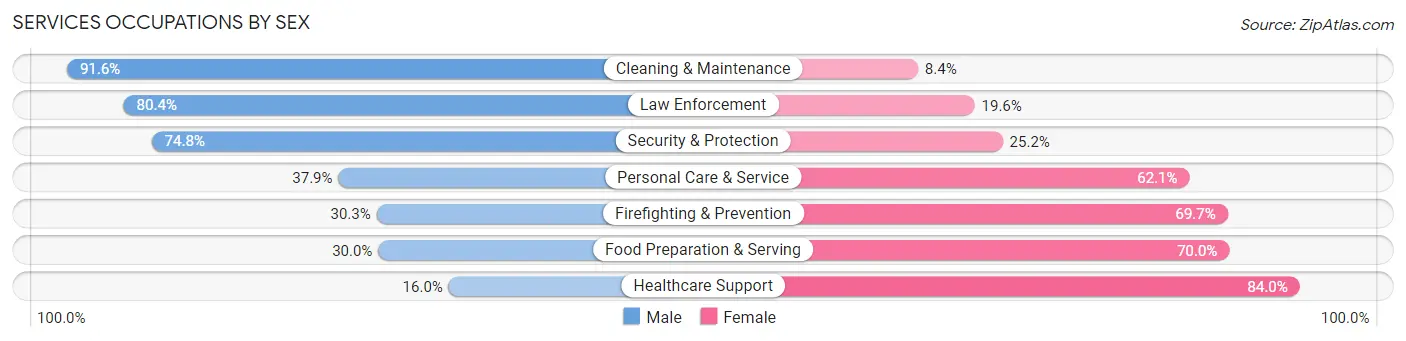
Services Occupations by Sex
Within the Services occupations in Ste. Genevieve County, the most male-oriented occupations are Cleaning & Maintenance (91.6%), Law Enforcement (80.4%), and Security & Protection (74.8%), while the most female-oriented occupations are Healthcare Support (84.0%), Food Preparation & Serving (70.0%), and Firefighting & Prevention (69.7%).
| Occupation | Male | Female |
| Healthcare Support | 42 (16.0%) | 220 (84.0%) |
| Security & Protection | 223 (74.8%) | 75 (25.2%) |
| Firefighting & Prevention | 10 (30.3%) | 23 (69.7%) |
| Law Enforcement | 213 (80.4%) | 52 (19.6%) |
| Food Preparation & Serving | 155 (30.0%) | 362 (70.0%) |
| Cleaning & Maintenance | 262 (91.6%) | 24 (8.4%) |
| Personal Care & Service | 114 (37.9%) | 187 (62.1%) |
| Total (Category) | 796 (47.8%) | 868 (52.2%) |
| Total (Overall) | 4,758 (55.7%) | 3,781 (44.3%) |
Sales and Office Occupations
The most common Sales and Office occupations in Ste. Genevieve County are Office & Administration (1,052 | 12.3%), and Sales & Related (694 | 8.1%).

Sales and Office Occupations by Sex

| Occupation | Male | Female |
| Sales & Related | 375 (54.0%) | 319 (46.0%) |
| Office & Administration | 146 (13.9%) | 906 (86.1%) |
| Total (Category) | 521 (29.8%) | 1,225 (70.2%) |
| Total (Overall) | 4,758 (55.7%) | 3,781 (44.3%) |
Natural Resources, Construction and Maintenance Occupations
The most common Natural Resources, Construction and Maintenance occupations in Ste. Genevieve County are Construction & Extraction (710 | 8.3%), Installation, Maintenance & Repair (568 | 6.7%), and Farming, Fishing & Forestry (95 | 1.1%).
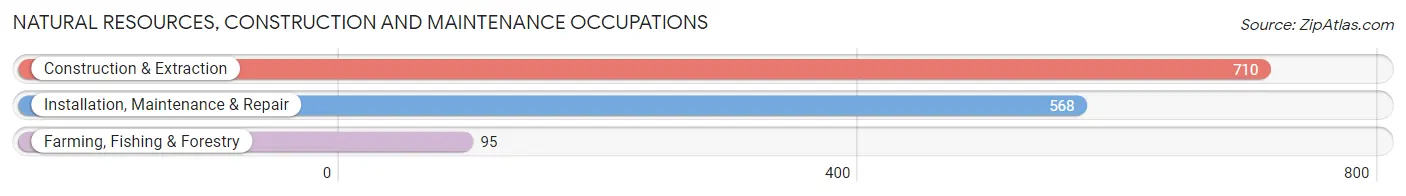
Natural Resources, Construction and Maintenance Occupations by Sex

| Occupation | Male | Female |
| Farming, Fishing & Forestry | 95 (100.0%) | 0 (0.0%) |
| Construction & Extraction | 698 (98.3%) | 12 (1.7%) |
| Installation, Maintenance & Repair | 566 (99.7%) | 2 (0.4%) |
| Total (Category) | 1,359 (99.0%) | 14 (1.0%) |
| Total (Overall) | 4,758 (55.7%) | 3,781 (44.3%) |
Production, Transportation and Moving Occupations
The most common Production, Transportation and Moving occupations in Ste. Genevieve County are Production (725 | 8.5%), Material Moving (340 | 4.0%), and Transportation (337 | 4.0%).
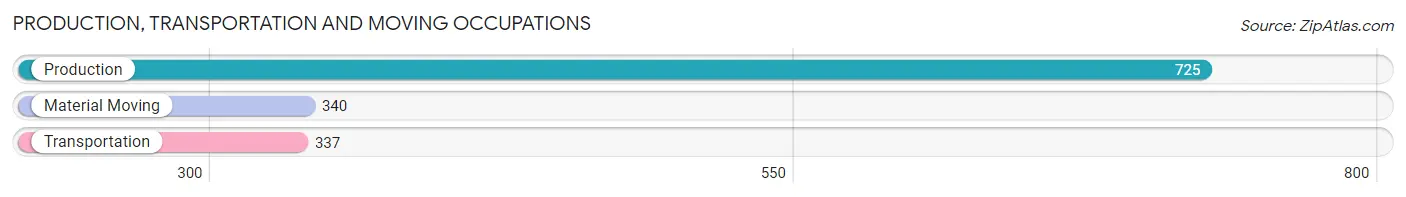
Production, Transportation and Moving Occupations by Sex
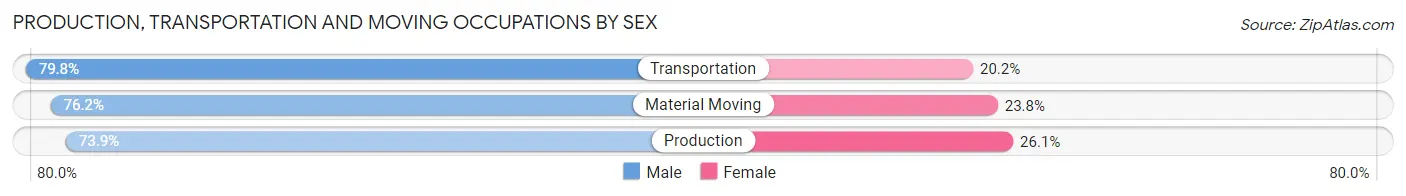
| Occupation | Male | Female |
| Production | 536 (73.9%) | 189 (26.1%) |
| Transportation | 269 (79.8%) | 68 (20.2%) |
| Material Moving | 259 (76.2%) | 81 (23.8%) |
| Total (Category) | 1,064 (75.9%) | 338 (24.1%) |
| Total (Overall) | 4,758 (55.7%) | 3,781 (44.3%) |
Employment Industries by Sex in Ste. Genevieve County
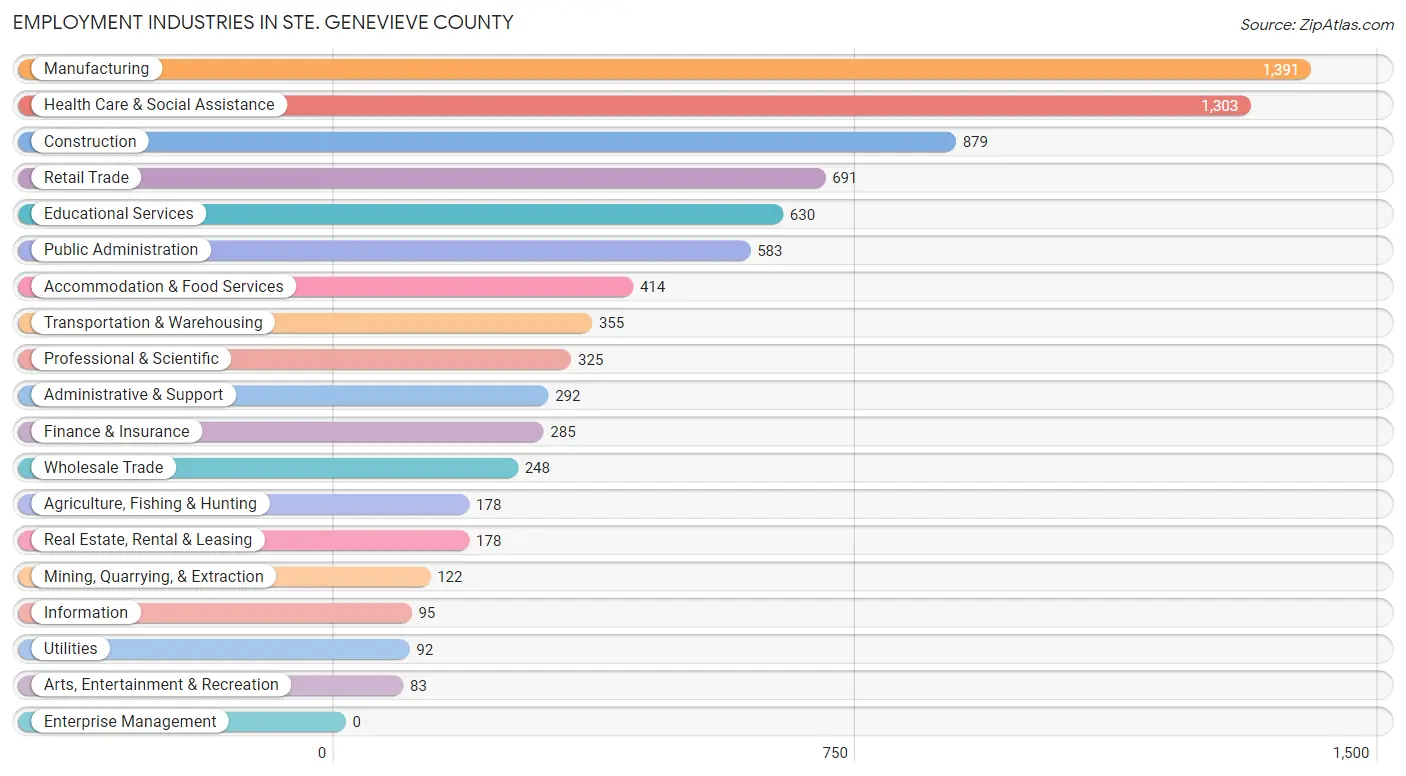
Employment Industries in Ste. Genevieve County
The major employment industries in Ste. Genevieve County include Manufacturing (1,391 | 16.3%), Health Care & Social Assistance (1,303 | 15.3%), Construction (879 | 10.3%), Retail Trade (691 | 8.1%), and Educational Services (630 | 7.4%).
Employment Industries by Sex in Ste. Genevieve County
The Ste. Genevieve County industries that see more men than women are Real Estate, Rental & Leasing (96.6%), Construction (94.4%), and Mining, Quarrying, & Extraction (82.8%), whereas the industries that tend to have a higher number of women are Health Care & Social Assistance (87.3%), Arts, Entertainment & Recreation (85.5%), and Finance & Insurance (72.3%).
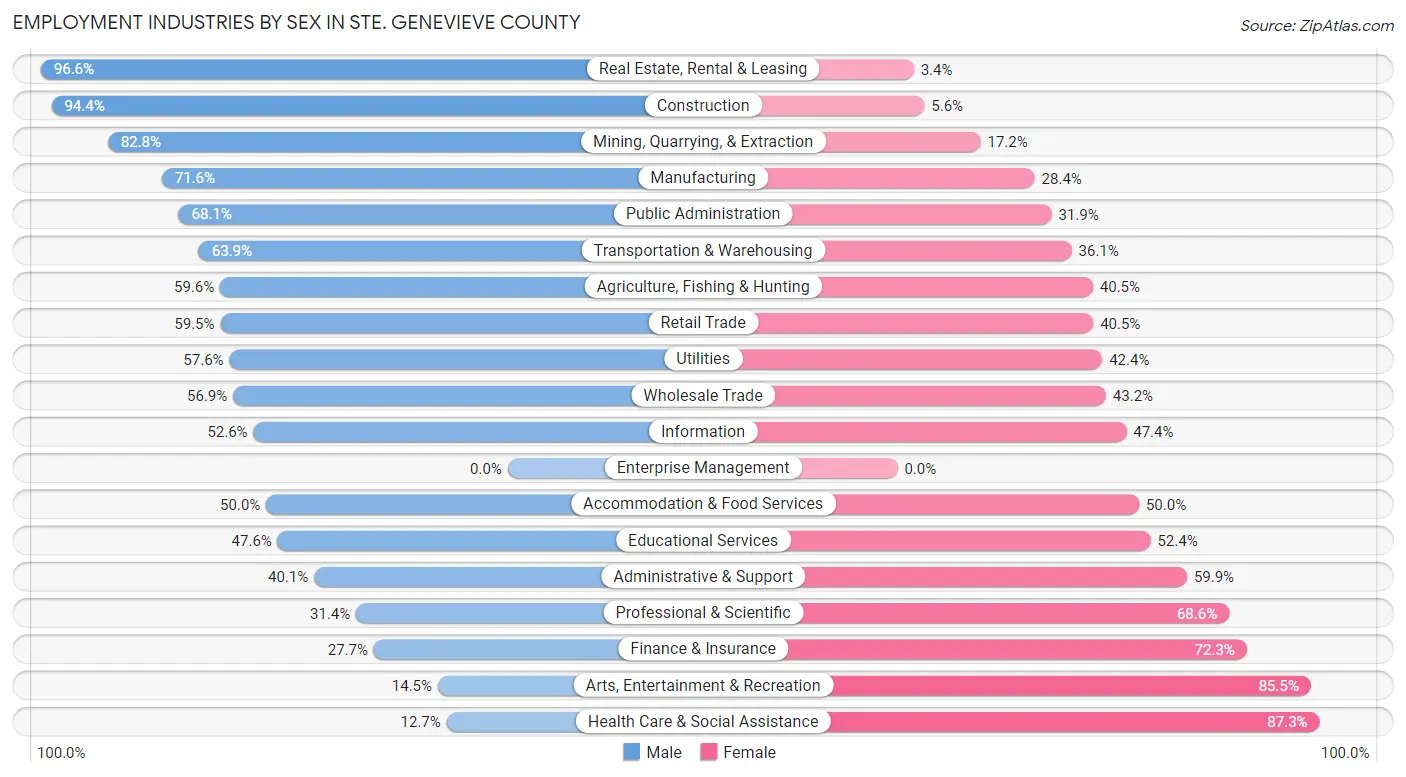
| Industry | Male | Female |
| Agriculture, Fishing & Hunting | 106 (59.6%) | 72 (40.5%) |
| Mining, Quarrying, & Extraction | 101 (82.8%) | 21 (17.2%) |
| Construction | 830 (94.4%) | 49 (5.6%) |
| Manufacturing | 996 (71.6%) | 395 (28.4%) |
| Wholesale Trade | 141 (56.9%) | 107 (43.1%) |
| Retail Trade | 411 (59.5%) | 280 (40.5%) |
| Transportation & Warehousing | 227 (63.9%) | 128 (36.1%) |
| Utilities | 53 (57.6%) | 39 (42.4%) |
| Information | 50 (52.6%) | 45 (47.4%) |
| Finance & Insurance | 79 (27.7%) | 206 (72.3%) |
| Real Estate, Rental & Leasing | 172 (96.6%) | 6 (3.4%) |
| Professional & Scientific | 102 (31.4%) | 223 (68.6%) |
| Enterprise Management | 0 (0.0%) | 0 (0.0%) |
| Administrative & Support | 117 (40.1%) | 175 (59.9%) |
| Educational Services | 300 (47.6%) | 330 (52.4%) |
| Health Care & Social Assistance | 165 (12.7%) | 1,138 (87.3%) |
| Arts, Entertainment & Recreation | 12 (14.5%) | 71 (85.5%) |
| Accommodation & Food Services | 207 (50.0%) | 207 (50.0%) |
| Public Administration | 397 (68.1%) | 186 (31.9%) |
| Total | 4,758 (55.7%) | 3,781 (44.3%) |
Education in Ste. Genevieve County
School Enrollment in Ste. Genevieve County
The most common levels of schooling among the 3,670 students in Ste. Genevieve County are middle school (951 | 25.9%), high school (933 | 25.4%), and elementary school (829 | 22.6%).
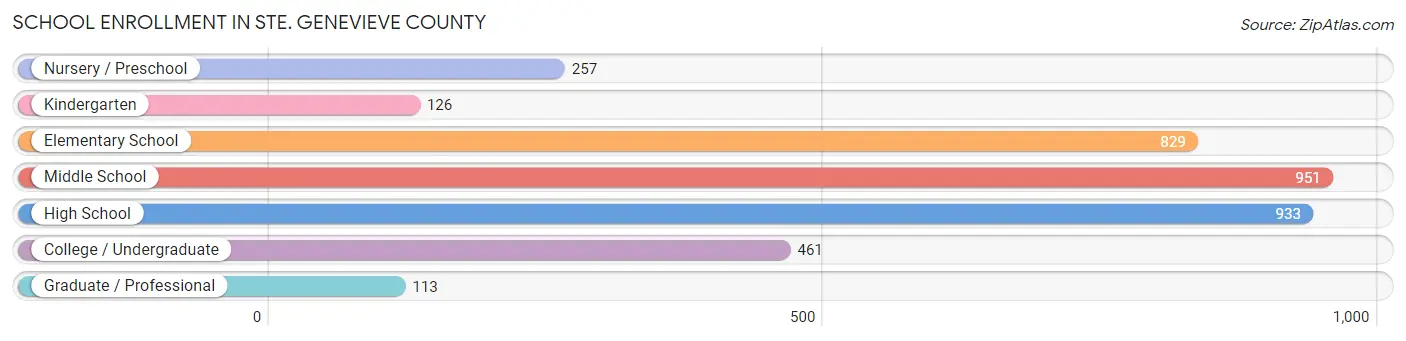
| School Level | # Students | % Students |
| Nursery / Preschool | 257 | 7.0% |
| Kindergarten | 126 | 3.4% |
| Elementary School | 829 | 22.6% |
| Middle School | 951 | 25.9% |
| High School | 933 | 25.4% |
| College / Undergraduate | 461 | 12.6% |
| Graduate / Professional | 113 | 3.1% |
| Total | 3,670 | 100.0% |
School Enrollment by Age by Funding Source in Ste. Genevieve County
Out of a total of 3,670 students who are enrolled in schools in Ste. Genevieve County, 906 (24.7%) attend a private institution, while the remaining 2,764 (75.3%) are enrolled in public schools. The age group of 3 to 4 year olds has the highest likelihood of being enrolled in private schools, with 129 (73.7% in the age bracket) enrolled. Conversely, the age group of 20 to 24 year olds has the lowest likelihood of being enrolled in a private school, with 253 (84.6% in the age bracket) attending a public institution.
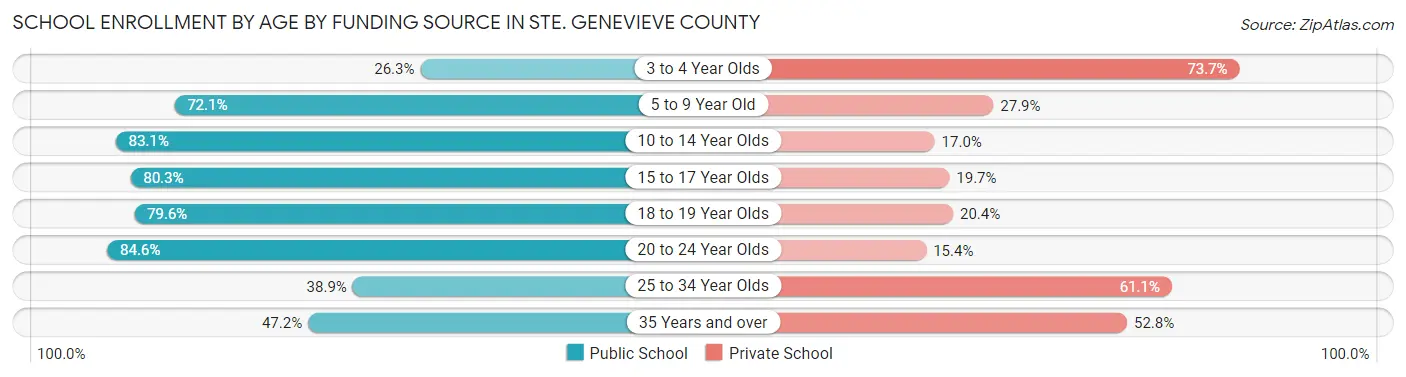
| Age Bracket | Public School | Private School |
| 3 to 4 Year Olds | 46 (26.3%) | 129 (73.7%) |
| 5 to 9 Year Old | 595 (72.1%) | 230 (27.9%) |
| 10 to 14 Year Olds | 990 (83.1%) | 202 (17.0%) |
| 15 to 17 Year Olds | 571 (80.3%) | 140 (19.7%) |
| 18 to 19 Year Olds | 215 (79.6%) | 55 (20.4%) |
| 20 to 24 Year Olds | 253 (84.6%) | 46 (15.4%) |
| 25 to 34 Year Olds | 7 (38.9%) | 11 (61.1%) |
| 35 Years and over | 85 (47.2%) | 95 (52.8%) |
| Total | 2,764 (75.3%) | 906 (24.7%) |
Educational Attainment by Field of Study in Ste. Genevieve County
Business (623 | 26.1%), education (538 | 22.5%), science & technology (349 | 14.6%), arts & humanities (245 | 10.3%), and computers & mathematics (111 | 4.6%) are the most common fields of study among 2,389 individuals in Ste. Genevieve County who have obtained a bachelor's degree or higher.
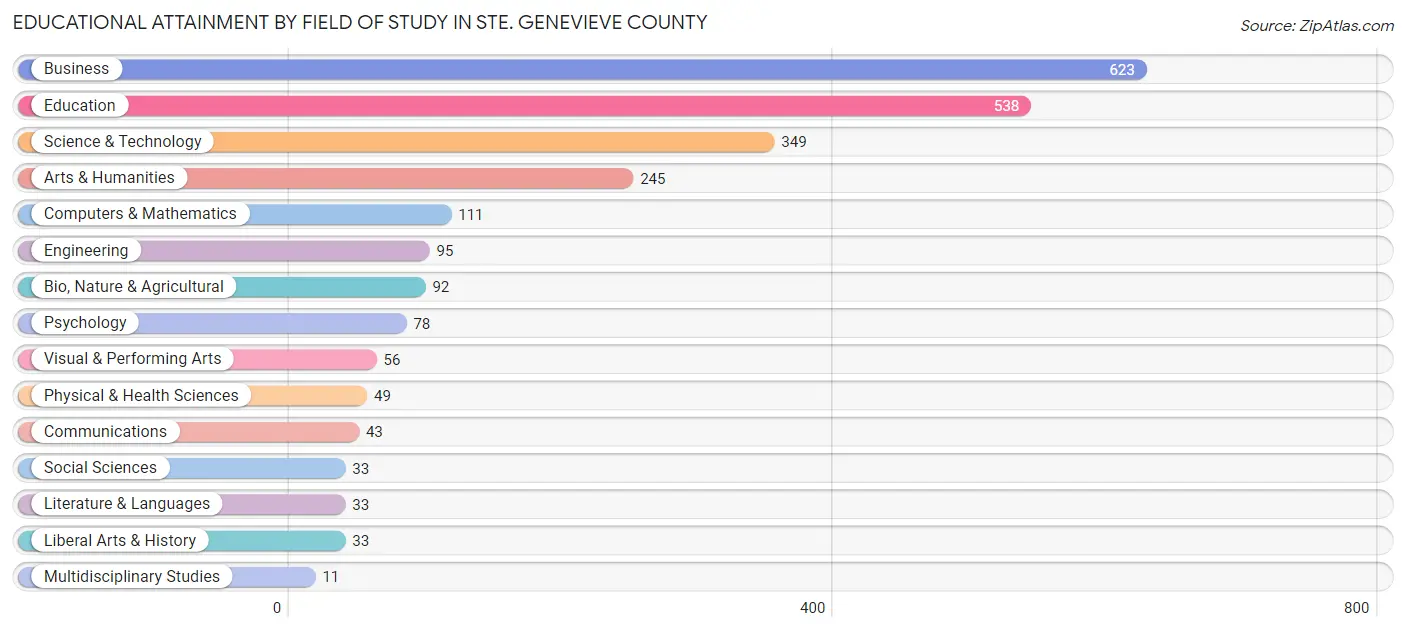
| Field of Study | # Graduates | % Graduates |
| Computers & Mathematics | 111 | 4.6% |
| Bio, Nature & Agricultural | 92 | 3.8% |
| Physical & Health Sciences | 49 | 2.1% |
| Psychology | 78 | 3.3% |
| Social Sciences | 33 | 1.4% |
| Engineering | 95 | 4.0% |
| Multidisciplinary Studies | 11 | 0.5% |
| Science & Technology | 349 | 14.6% |
| Business | 623 | 26.1% |
| Education | 538 | 22.5% |
| Literature & Languages | 33 | 1.4% |
| Liberal Arts & History | 33 | 1.4% |
| Visual & Performing Arts | 56 | 2.3% |
| Communications | 43 | 1.8% |
| Arts & Humanities | 245 | 10.3% |
| Total | 2,389 | 100.0% |
Transportation & Commute in Ste. Genevieve County
Vehicle Availability by Sex in Ste. Genevieve County
The most prevalent vehicle ownership categories in Ste. Genevieve County are males with 2 vehicles (1,492, accounting for 32.3%) and females with 2 vehicles (1,328, making up 41.1%).
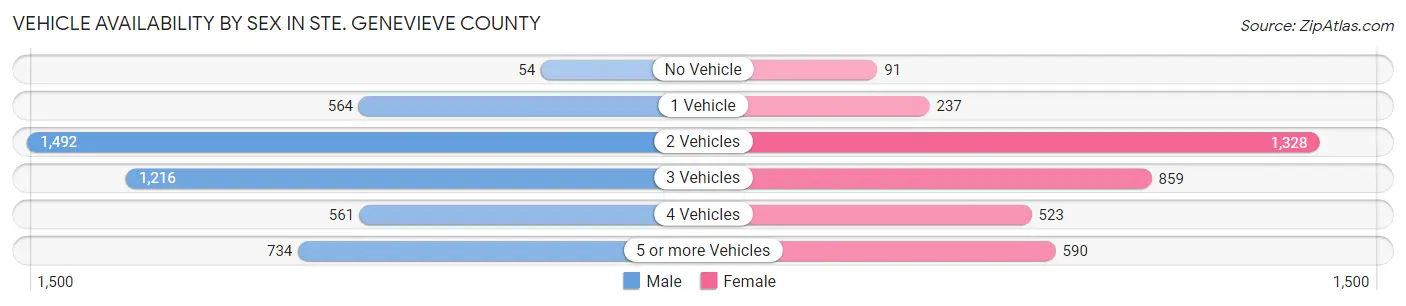
| Vehicles Available | Male | Female |
| No Vehicle | 54 (1.2%) | 91 (2.5%) |
| 1 Vehicle | 564 (12.2%) | 237 (6.5%) |
| 2 Vehicles | 1,492 (32.3%) | 1,328 (36.6%) |
| 3 Vehicles | 1,216 (26.3%) | 859 (23.7%) |
| 4 Vehicles | 561 (12.1%) | 523 (14.4%) |
| 5 or more Vehicles | 734 (15.9%) | 590 (16.3%) |
| Total | 4,621 (100.0%) | 3,628 (100.0%) |
Commute Time in Ste. Genevieve County
The most frequently occuring commute durations in Ste. Genevieve County are 15 to 19 minutes (1,048 commuters, 13.4%), 60 to 89 minutes (914 commuters, 11.7%), and 30 to 34 minutes (858 commuters, 11.0%).
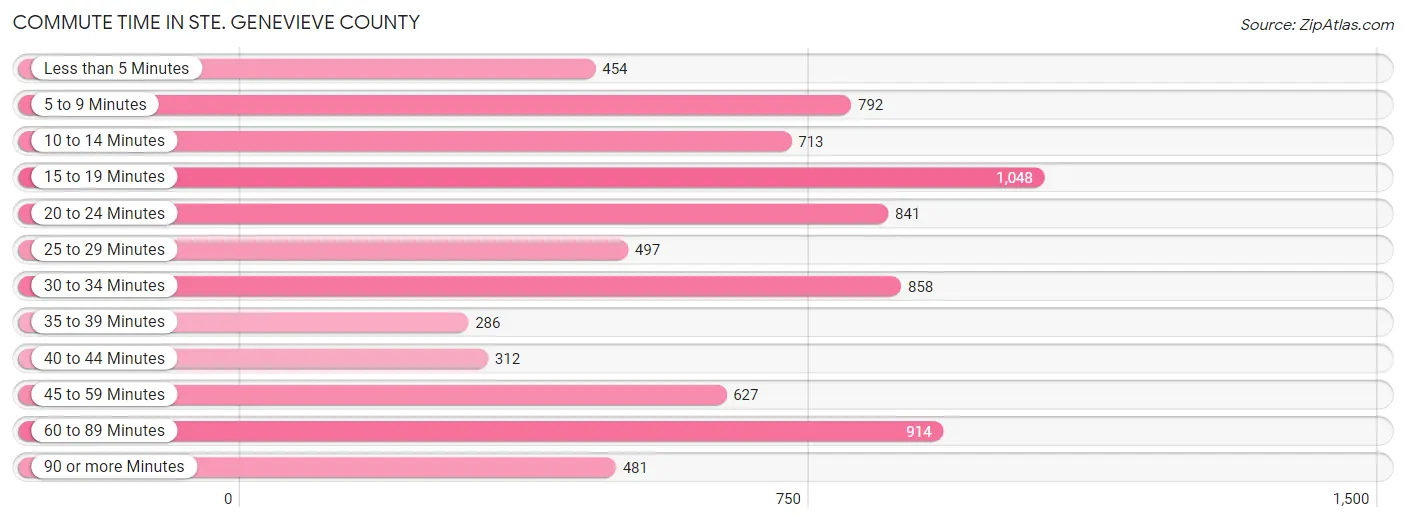
| Commute Time | # Commuters | % Commuters |
| Less than 5 Minutes | 454 | 5.8% |
| 5 to 9 Minutes | 792 | 10.1% |
| 10 to 14 Minutes | 713 | 9.1% |
| 15 to 19 Minutes | 1,048 | 13.4% |
| 20 to 24 Minutes | 841 | 10.7% |
| 25 to 29 Minutes | 497 | 6.4% |
| 30 to 34 Minutes | 858 | 11.0% |
| 35 to 39 Minutes | 286 | 3.7% |
| 40 to 44 Minutes | 312 | 4.0% |
| 45 to 59 Minutes | 627 | 8.0% |
| 60 to 89 Minutes | 914 | 11.7% |
| 90 or more Minutes | 481 | 6.1% |
Commute Time by Sex in Ste. Genevieve County
The most common commute times in Ste. Genevieve County are 60 to 89 minutes (610 commuters, 13.9%) for males and 15 to 19 minutes (536 commuters, 15.6%) for females.
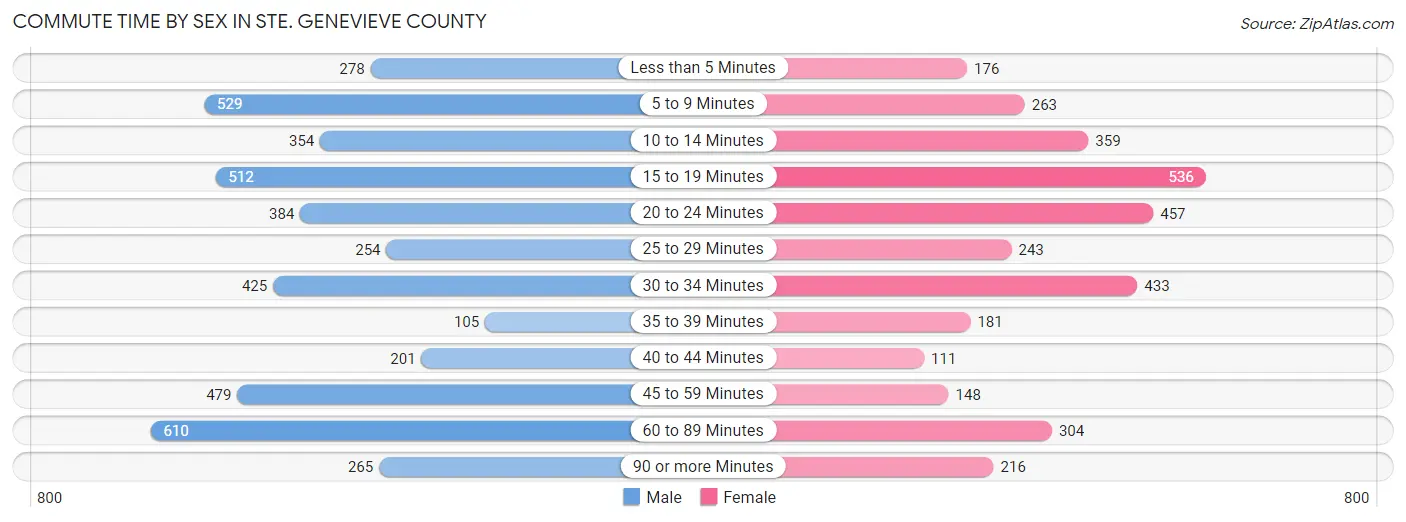
| Commute Time | Male | Female |
| Less than 5 Minutes | 278 (6.3%) | 176 (5.1%) |
| 5 to 9 Minutes | 529 (12.0%) | 263 (7.7%) |
| 10 to 14 Minutes | 354 (8.1%) | 359 (10.5%) |
| 15 to 19 Minutes | 512 (11.7%) | 536 (15.6%) |
| 20 to 24 Minutes | 384 (8.7%) | 457 (13.3%) |
| 25 to 29 Minutes | 254 (5.8%) | 243 (7.1%) |
| 30 to 34 Minutes | 425 (9.7%) | 433 (12.6%) |
| 35 to 39 Minutes | 105 (2.4%) | 181 (5.3%) |
| 40 to 44 Minutes | 201 (4.6%) | 111 (3.2%) |
| 45 to 59 Minutes | 479 (10.9%) | 148 (4.3%) |
| 60 to 89 Minutes | 610 (13.9%) | 304 (8.9%) |
| 90 or more Minutes | 265 (6.0%) | 216 (6.3%) |
Time of Departure to Work by Sex in Ste. Genevieve County
The most frequent times of departure to work in Ste. Genevieve County are 7:00 AM to 7:29 AM (651, 14.8%) for males and 7:00 AM to 7:29 AM (576, 16.8%) for females.
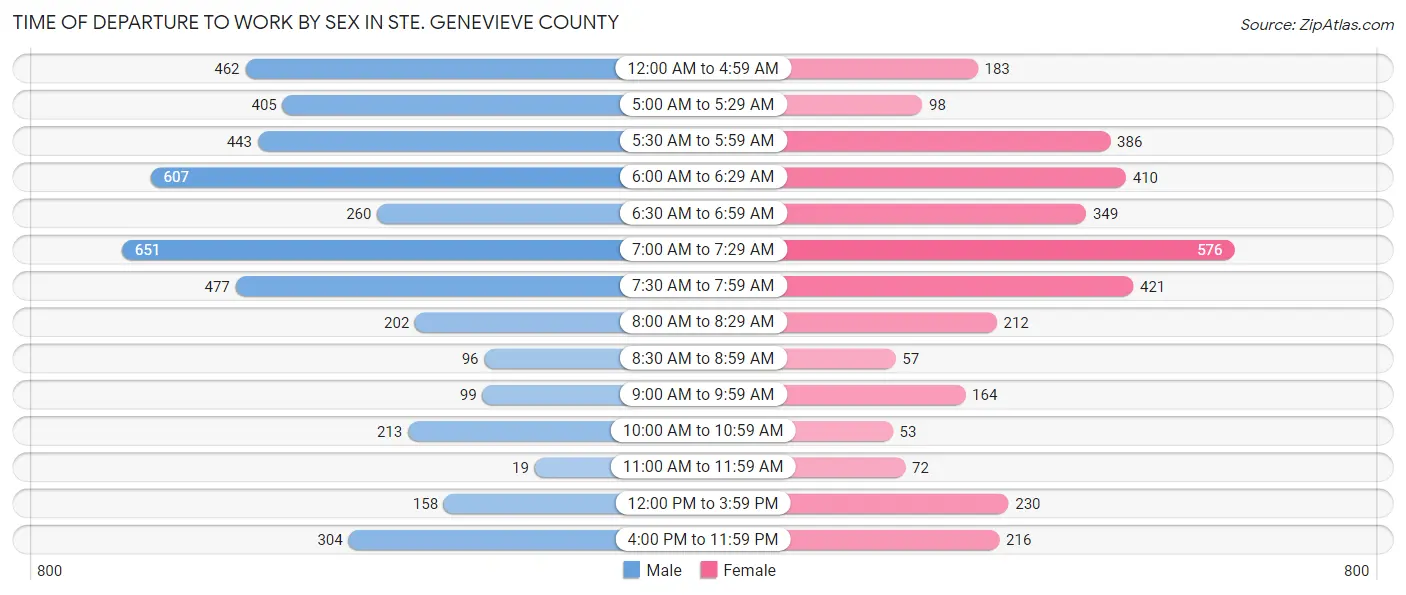
| Time of Departure | Male | Female |
| 12:00 AM to 4:59 AM | 462 (10.5%) | 183 (5.3%) |
| 5:00 AM to 5:29 AM | 405 (9.2%) | 98 (2.9%) |
| 5:30 AM to 5:59 AM | 443 (10.1%) | 386 (11.3%) |
| 6:00 AM to 6:29 AM | 607 (13.8%) | 410 (12.0%) |
| 6:30 AM to 6:59 AM | 260 (5.9%) | 349 (10.2%) |
| 7:00 AM to 7:29 AM | 651 (14.8%) | 576 (16.8%) |
| 7:30 AM to 7:59 AM | 477 (10.8%) | 421 (12.3%) |
| 8:00 AM to 8:29 AM | 202 (4.6%) | 212 (6.2%) |
| 8:30 AM to 8:59 AM | 96 (2.2%) | 57 (1.7%) |
| 9:00 AM to 9:59 AM | 99 (2.2%) | 164 (4.8%) |
| 10:00 AM to 10:59 AM | 213 (4.9%) | 53 (1.5%) |
| 11:00 AM to 11:59 AM | 19 (0.4%) | 72 (2.1%) |
| 12:00 PM to 3:59 PM | 158 (3.6%) | 230 (6.7%) |
| 4:00 PM to 11:59 PM | 304 (6.9%) | 216 (6.3%) |
| Total | 4,396 (100.0%) | 3,427 (100.0%) |
Housing Occupancy in Ste. Genevieve County
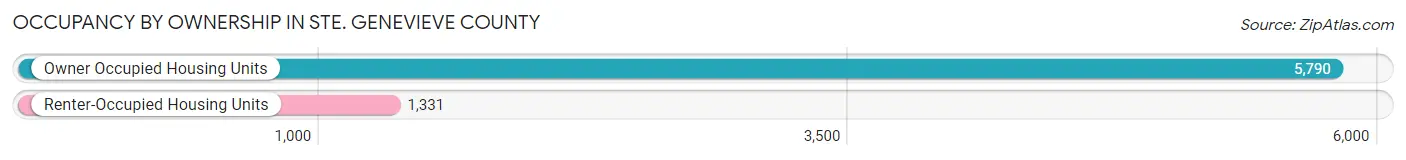
Occupancy by Ownership in Ste. Genevieve County
Of the total 7,121 dwellings in Ste. Genevieve County, owner-occupied units account for 5,790 (81.3%), while renter-occupied units make up 1,331 (18.7%).
| Occupancy | # Housing Units | % Housing Units |
| Owner Occupied Housing Units | 5,790 | 81.3% |
| Renter-Occupied Housing Units | 1,331 | 18.7% |
| Total Occupied Housing Units | 7,121 | 100.0% |
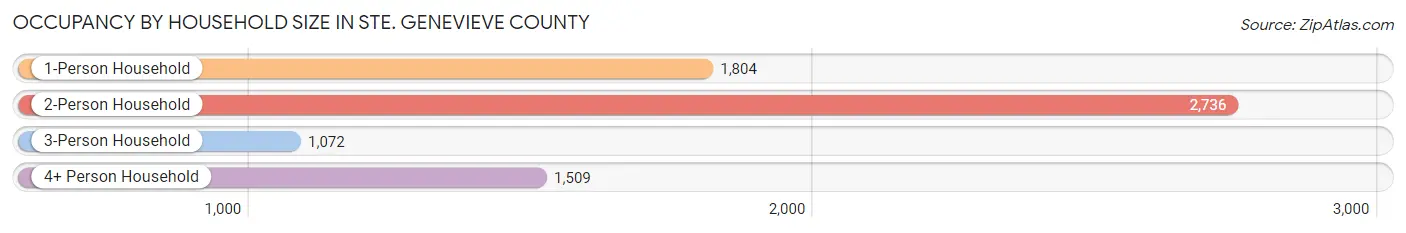
Occupancy by Household Size in Ste. Genevieve County
| Household Size | # Housing Units | % Housing Units |
| 1-Person Household | 1,804 | 25.3% |
| 2-Person Household | 2,736 | 38.4% |
| 3-Person Household | 1,072 | 15.0% |
| 4+ Person Household | 1,509 | 21.2% |
| Total Housing Units | 7,121 | 100.0% |
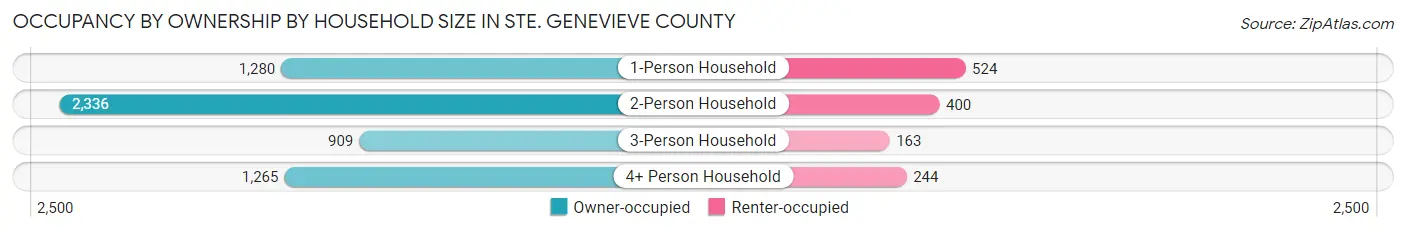
Occupancy by Ownership by Household Size in Ste. Genevieve County
| Household Size | Owner-occupied | Renter-occupied |
| 1-Person Household | 1,280 (71.0%) | 524 (29.0%) |
| 2-Person Household | 2,336 (85.4%) | 400 (14.6%) |
| 3-Person Household | 909 (84.8%) | 163 (15.2%) |
| 4+ Person Household | 1,265 (83.8%) | 244 (16.2%) |
| Total Housing Units | 5,790 (81.3%) | 1,331 (18.7%) |
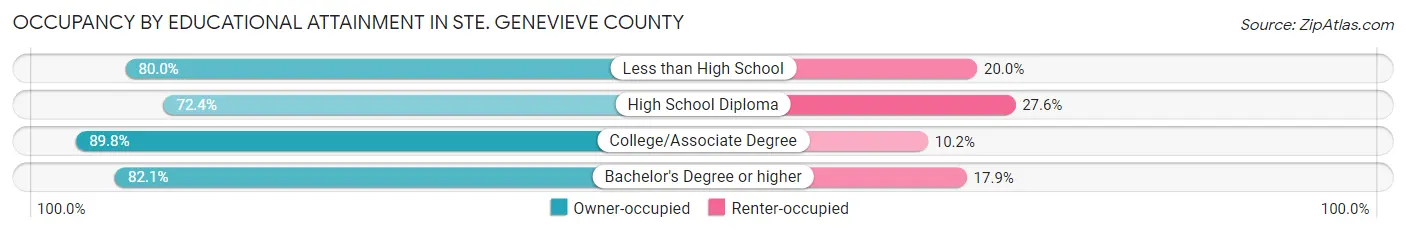
Occupancy by Educational Attainment in Ste. Genevieve County
| Household Size | Owner-occupied | Renter-occupied |
| Less than High School | 516 (80.0%) | 129 (20.0%) |
| High School Diploma | 1,848 (72.4%) | 703 (27.6%) |
| College/Associate Degree | 2,392 (89.8%) | 273 (10.2%) |
| Bachelor's Degree or higher | 1,034 (82.1%) | 226 (17.9%) |
Occupancy by Age of Householder in Ste. Genevieve County
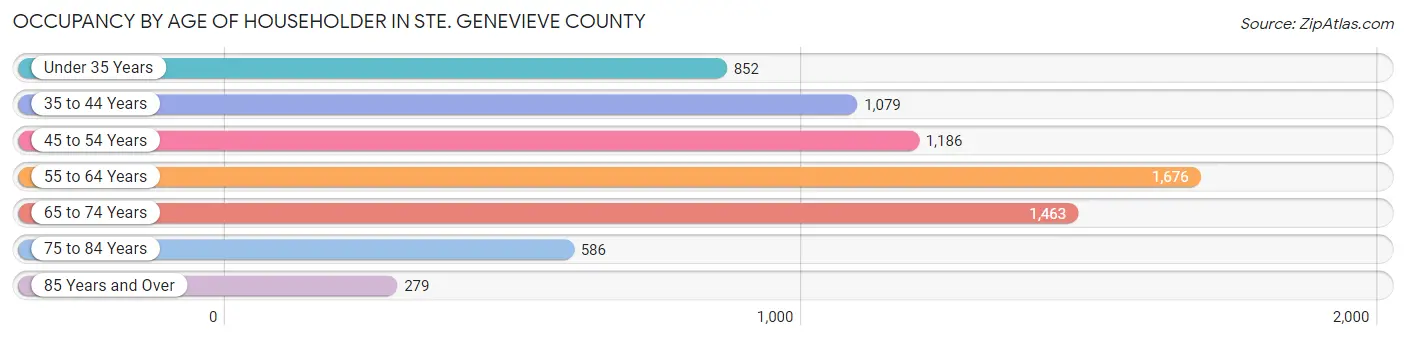
| Age Bracket | # Households | % Households |
| Under 35 Years | 852 | 12.0% |
| 35 to 44 Years | 1,079 | 15.1% |
| 45 to 54 Years | 1,186 | 16.7% |
| 55 to 64 Years | 1,676 | 23.5% |
| 65 to 74 Years | 1,463 | 20.5% |
| 75 to 84 Years | 586 | 8.2% |
| 85 Years and Over | 279 | 3.9% |
| Total | 7,121 | 100.0% |
Housing Finances in Ste. Genevieve County
Median Income by Occupancy in Ste. Genevieve County
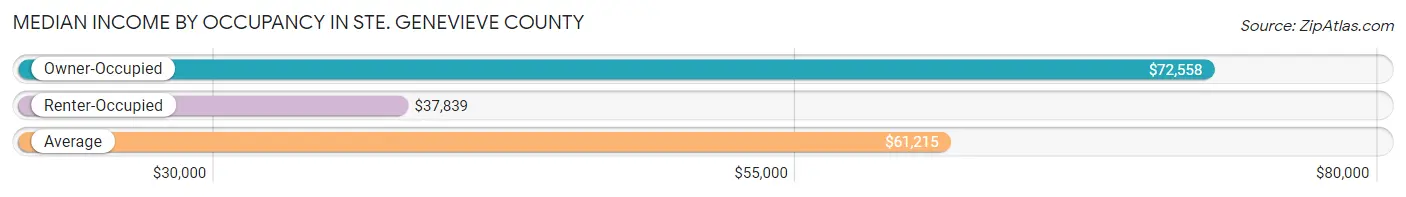
| Occupancy Type | # Households | Median Income |
| Owner-Occupied | 5,790 (81.3%) | $72,558 |
| Renter-Occupied | 1,331 (18.7%) | $37,839 |
| Average | 7,121 (100.0%) | $61,215 |
Occupancy by Householder Income Bracket in Ste. Genevieve County
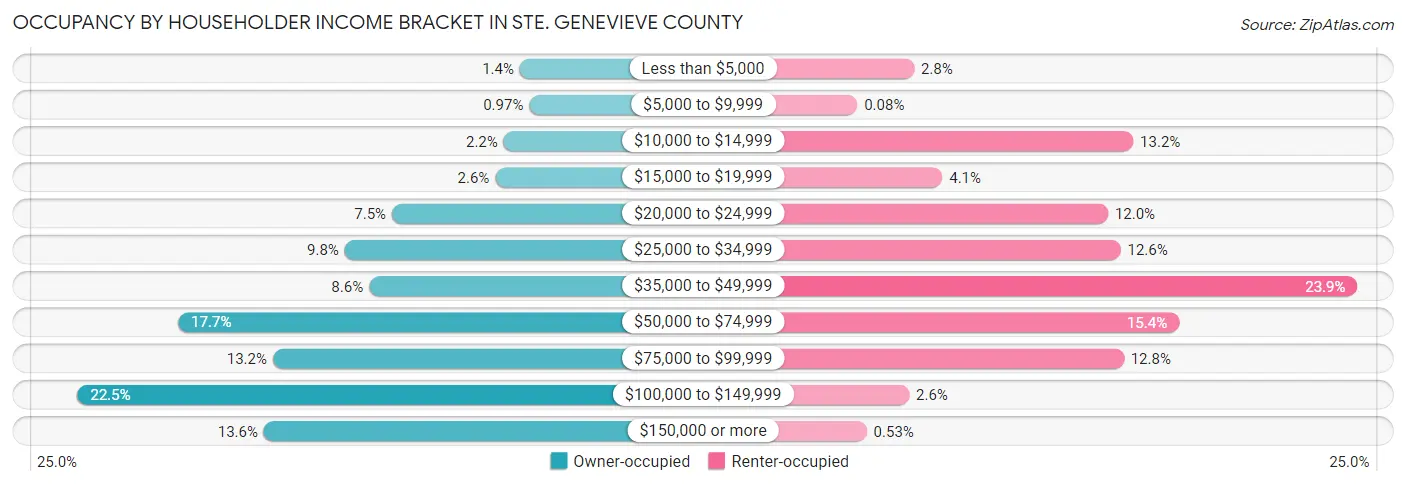
| Income Bracket | Owner-occupied | Renter-occupied |
| Less than $5,000 | 82 (1.4%) | 37 (2.8%) |
| $5,000 to $9,999 | 56 (1.0%) | 1 (0.1%) |
| $10,000 to $14,999 | 127 (2.2%) | 176 (13.2%) |
| $15,000 to $19,999 | 150 (2.6%) | 55 (4.1%) |
| $20,000 to $24,999 | 435 (7.5%) | 160 (12.0%) |
| $25,000 to $34,999 | 565 (9.8%) | 168 (12.6%) |
| $35,000 to $49,999 | 498 (8.6%) | 318 (23.9%) |
| $50,000 to $74,999 | 1,024 (17.7%) | 205 (15.4%) |
| $75,000 to $99,999 | 763 (13.2%) | 170 (12.8%) |
| $100,000 to $149,999 | 1,302 (22.5%) | 34 (2.5%) |
| $150,000 or more | 788 (13.6%) | 7 (0.5%) |
| Total | 5,790 (100.0%) | 1,331 (100.0%) |
Monthly Housing Cost Tiers in Ste. Genevieve County
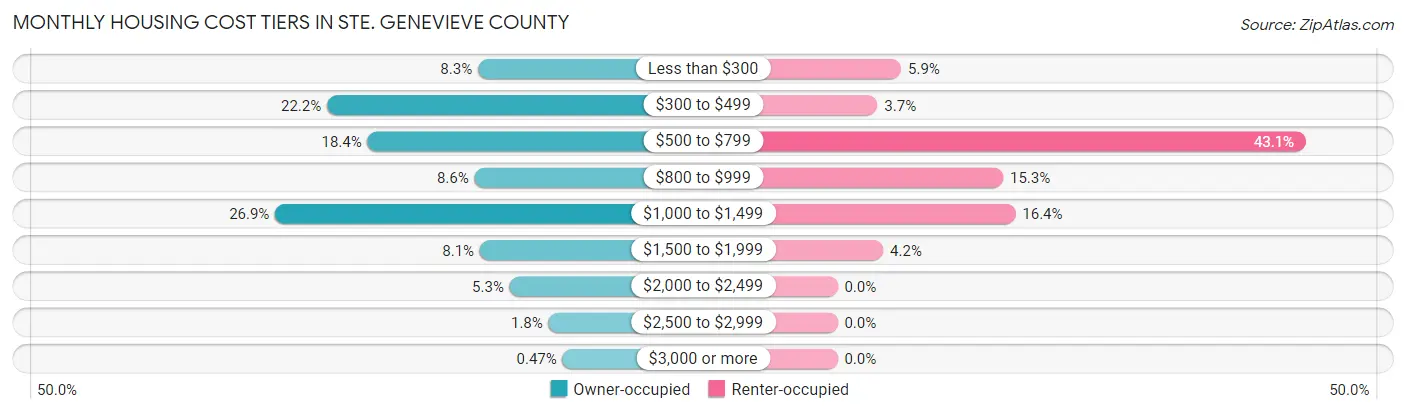
| Monthly Cost | Owner-occupied | Renter-occupied |
| Less than $300 | 478 (8.3%) | 78 (5.9%) |
| $300 to $499 | 1,283 (22.2%) | 49 (3.7%) |
| $500 to $799 | 1,067 (18.4%) | 574 (43.1%) |
| $800 to $999 | 497 (8.6%) | 203 (15.2%) |
| $1,000 to $1,499 | 1,559 (26.9%) | 218 (16.4%) |
| $1,500 to $1,999 | 468 (8.1%) | 56 (4.2%) |
| $2,000 to $2,499 | 309 (5.3%) | 0 (0.0%) |
| $2,500 to $2,999 | 102 (1.8%) | 0 (0.0%) |
| $3,000 or more | 27 (0.5%) | 0 (0.0%) |
| Total | 5,790 (100.0%) | 1,331 (100.0%) |
Physical Housing Characteristics in Ste. Genevieve County
Housing Structures in Ste. Genevieve County
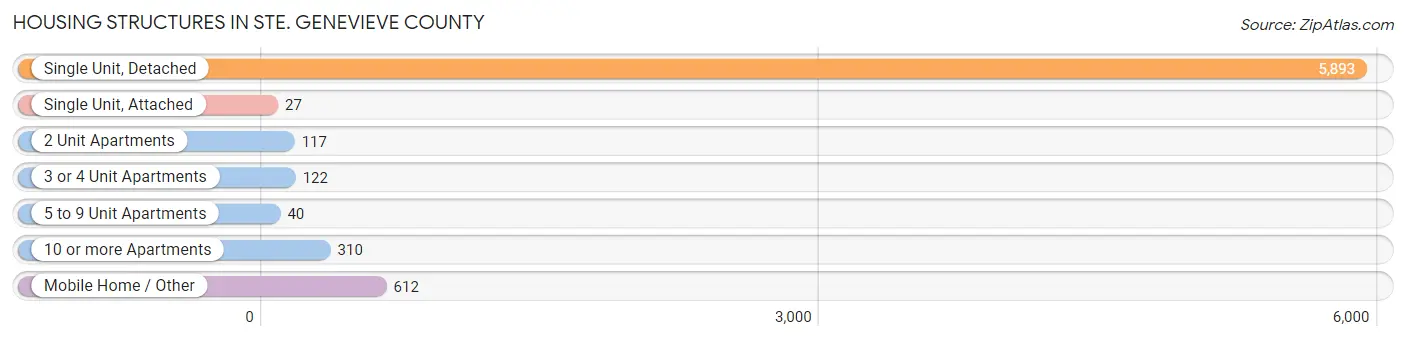
| Structure Type | # Housing Units | % Housing Units |
| Single Unit, Detached | 5,893 | 82.8% |
| Single Unit, Attached | 27 | 0.4% |
| 2 Unit Apartments | 117 | 1.6% |
| 3 or 4 Unit Apartments | 122 | 1.7% |
| 5 to 9 Unit Apartments | 40 | 0.6% |
| 10 or more Apartments | 310 | 4.3% |
| Mobile Home / Other | 612 | 8.6% |
| Total | 7,121 | 100.0% |
Housing Structures by Occupancy in Ste. Genevieve County
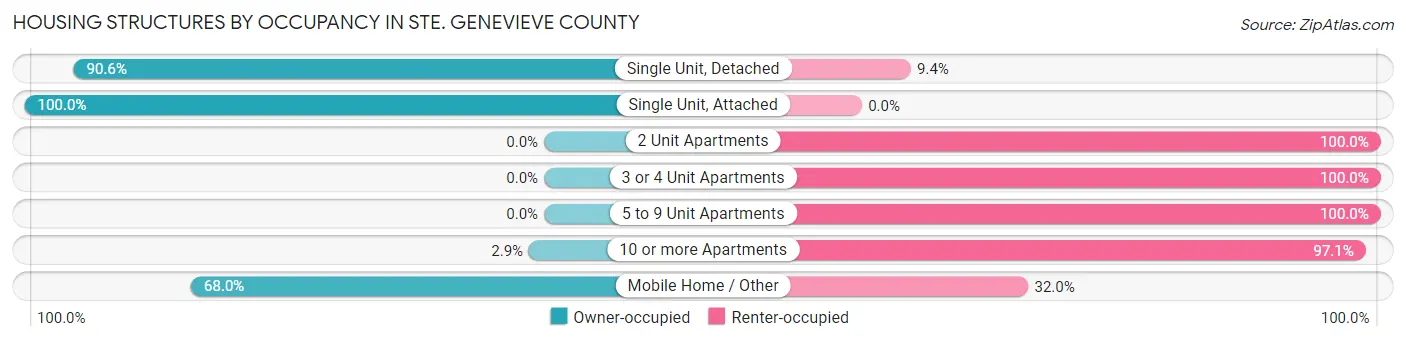
| Structure Type | Owner-occupied | Renter-occupied |
| Single Unit, Detached | 5,338 (90.6%) | 555 (9.4%) |
| Single Unit, Attached | 27 (100.0%) | 0 (0.0%) |
| 2 Unit Apartments | 0 (0.0%) | 117 (100.0%) |
| 3 or 4 Unit Apartments | 0 (0.0%) | 122 (100.0%) |
| 5 to 9 Unit Apartments | 0 (0.0%) | 40 (100.0%) |
| 10 or more Apartments | 9 (2.9%) | 301 (97.1%) |
| Mobile Home / Other | 416 (68.0%) | 196 (32.0%) |
| Total | 5,790 (81.3%) | 1,331 (18.7%) |
Housing Structures by Number of Rooms in Ste. Genevieve County
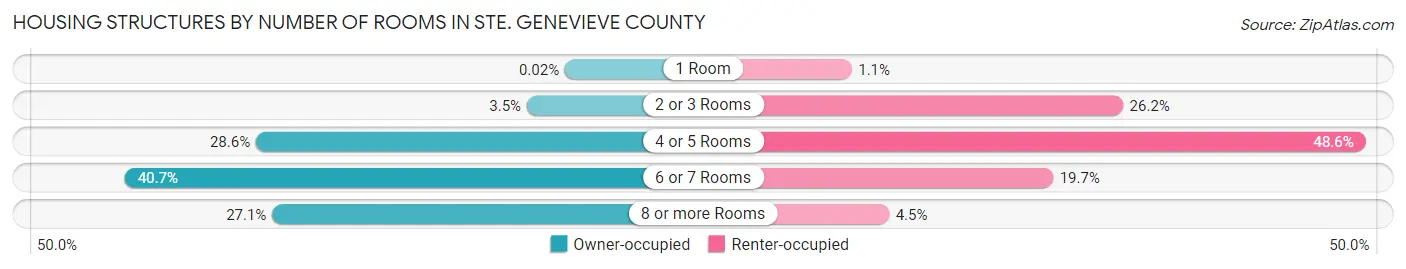
| Number of Rooms | Owner-occupied | Renter-occupied |
| 1 Room | 1 (0.0%) | 14 (1.1%) |
| 2 or 3 Rooms | 205 (3.5%) | 348 (26.2%) |
| 4 or 5 Rooms | 1,656 (28.6%) | 647 (48.6%) |
| 6 or 7 Rooms | 2,359 (40.7%) | 262 (19.7%) |
| 8 or more Rooms | 1,569 (27.1%) | 60 (4.5%) |
| Total | 5,790 (100.0%) | 1,331 (100.0%) |
Housing Structure by Heating Type in Ste. Genevieve County
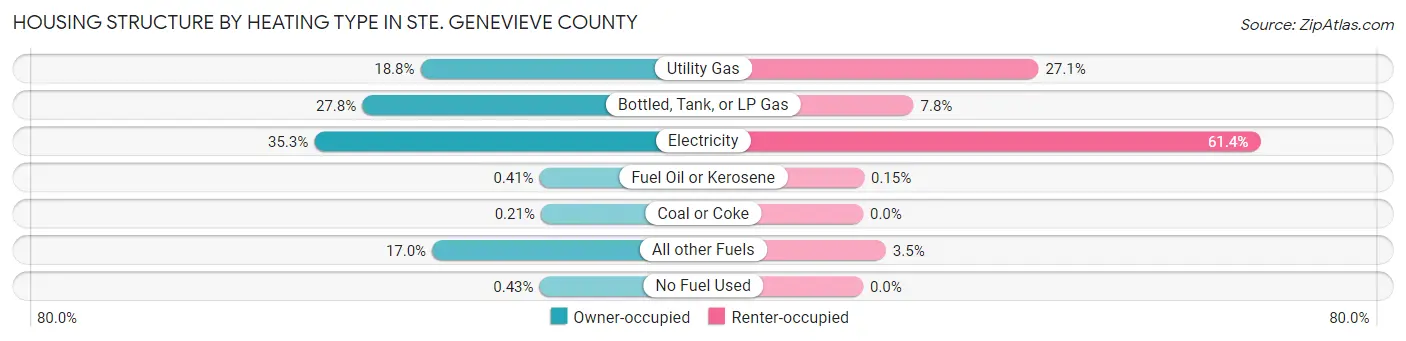
| Heating Type | Owner-occupied | Renter-occupied |
| Utility Gas | 1,090 (18.8%) | 361 (27.1%) |
| Bottled, Tank, or LP Gas | 1,612 (27.8%) | 104 (7.8%) |
| Electricity | 2,041 (35.2%) | 817 (61.4%) |
| Fuel Oil or Kerosene | 24 (0.4%) | 2 (0.2%) |
| Coal or Coke | 12 (0.2%) | 0 (0.0%) |
| All other Fuels | 986 (17.0%) | 47 (3.5%) |
| No Fuel Used | 25 (0.4%) | 0 (0.0%) |
| Total | 5,790 (100.0%) | 1,331 (100.0%) |
Household Vehicle Usage in Ste. Genevieve County
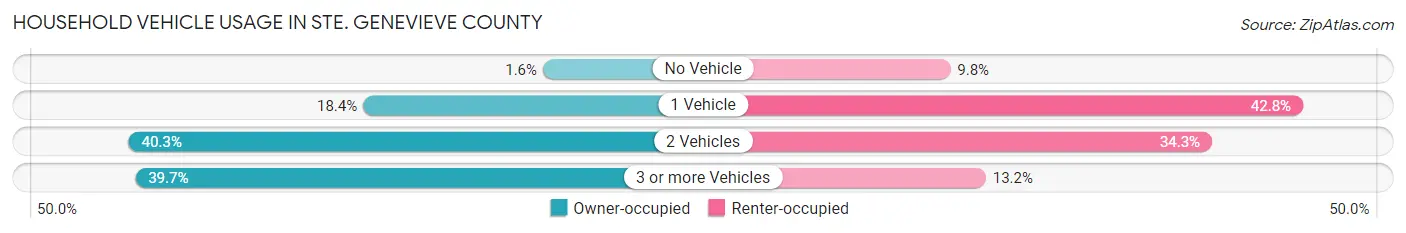
| Vehicles per Household | Owner-occupied | Renter-occupied |
| No Vehicle | 94 (1.6%) | 131 (9.8%) |
| 1 Vehicle | 1,066 (18.4%) | 569 (42.7%) |
| 2 Vehicles | 2,333 (40.3%) | 456 (34.3%) |
| 3 or more Vehicles | 2,297 (39.7%) | 175 (13.2%) |
| Total | 5,790 (100.0%) | 1,331 (100.0%) |
Real Estate & Mortgages in Ste. Genevieve County
Real Estate and Mortgage Overview in Ste. Genevieve County
| Characteristic | Without Mortgage | With Mortgage |
| Housing Units | 2,653 | 3,137 |
| Median Property Value | $197,100 | $198,100 |
| Median Household Income | $47,917 | $568 |
| Monthly Housing Costs | $442 | $27 |
| Real Estate Taxes | $1,359 | $32 |
Property Value by Mortgage Status in Ste. Genevieve County
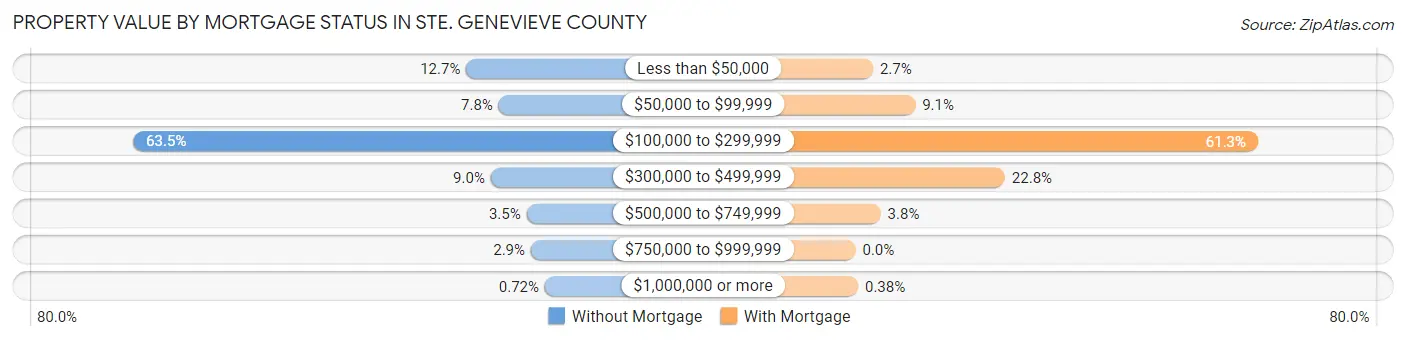
| Property Value | Without Mortgage | With Mortgage |
| Less than $50,000 | 337 (12.7%) | 83 (2.6%) |
| $50,000 to $99,999 | 206 (7.8%) | 285 (9.1%) |
| $100,000 to $299,999 | 1,684 (63.5%) | 1,923 (61.3%) |
| $300,000 to $499,999 | 238 (9.0%) | 714 (22.8%) |
| $500,000 to $749,999 | 93 (3.5%) | 120 (3.8%) |
| $750,000 to $999,999 | 76 (2.9%) | 0 (0.0%) |
| $1,000,000 or more | 19 (0.7%) | 12 (0.4%) |
| Total | 2,653 (100.0%) | 3,137 (100.0%) |
Household Income by Mortgage Status in Ste. Genevieve County
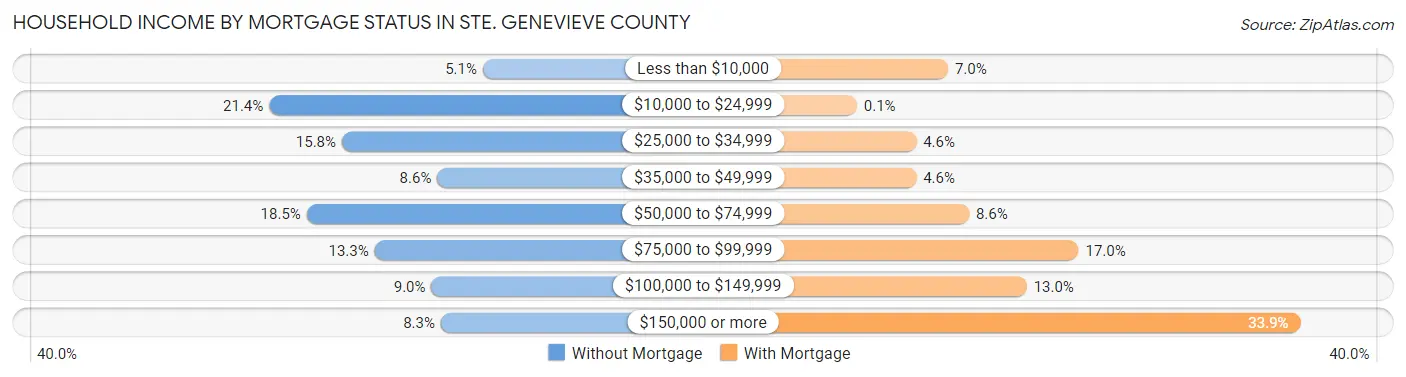
| Household Income | Without Mortgage | With Mortgage |
| Less than $10,000 | 135 (5.1%) | 221 (7.0%) |
| $10,000 to $24,999 | 567 (21.4%) | 3 (0.1%) |
| $25,000 to $34,999 | 420 (15.8%) | 145 (4.6%) |
| $35,000 to $49,999 | 227 (8.6%) | 145 (4.6%) |
| $50,000 to $74,999 | 491 (18.5%) | 271 (8.6%) |
| $75,000 to $99,999 | 354 (13.3%) | 533 (17.0%) |
| $100,000 to $149,999 | 239 (9.0%) | 409 (13.0%) |
| $150,000 or more | 220 (8.3%) | 1,063 (33.9%) |
| Total | 2,653 (100.0%) | 3,137 (100.0%) |
Property Value to Household Income Ratio in Ste. Genevieve County
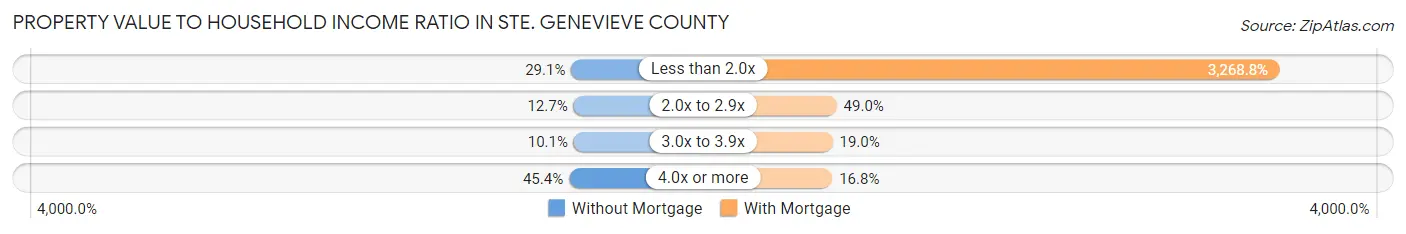
| Value-to-Income Ratio | Without Mortgage | With Mortgage |
| Less than 2.0x | 771 (29.1%) | 102,542 (3,268.8%) |
| 2.0x to 2.9x | 337 (12.7%) | 1,536 (49.0%) |
| 3.0x to 3.9x | 269 (10.1%) | 597 (19.0%) |
| 4.0x or more | 1,205 (45.4%) | 526 (16.8%) |
| Total | 2,653 (100.0%) | 3,137 (100.0%) |
Real Estate Taxes by Mortgage Status in Ste. Genevieve County
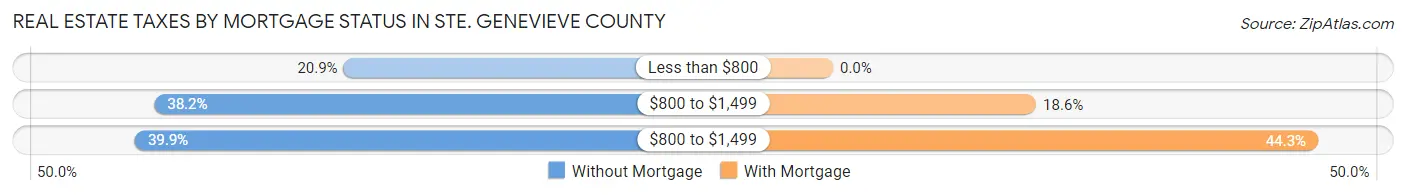
| Property Taxes | Without Mortgage | With Mortgage |
| Less than $800 | 554 (20.9%) | 0 (0.0%) |
| $800 to $1,499 | 1,012 (38.2%) | 582 (18.5%) |
| $800 to $1,499 | 1,059 (39.9%) | 1,389 (44.3%) |
| Total | 2,653 (100.0%) | 3,137 (100.0%) |
Health & Disability in Ste. Genevieve County
Health Insurance Coverage by Age in Ste. Genevieve County
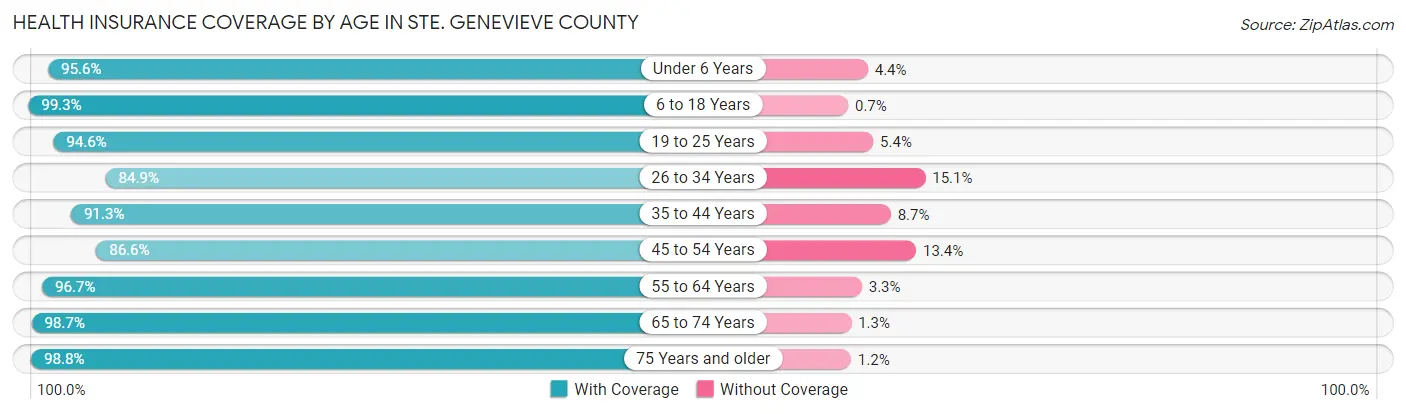
| Age Bracket | With Coverage | Without Coverage |
| Under 6 Years | 1,222 (95.6%) | 56 (4.4%) |
| 6 to 18 Years | 2,845 (99.3%) | 20 (0.7%) |
| 19 to 25 Years | 1,285 (94.6%) | 73 (5.4%) |
| 26 to 34 Years | 1,461 (84.9%) | 260 (15.1%) |
| 35 to 44 Years | 1,856 (91.3%) | 176 (8.7%) |
| 45 to 54 Years | 1,909 (86.6%) | 295 (13.4%) |
| 55 to 64 Years | 2,904 (96.7%) | 98 (3.3%) |
| 65 to 74 Years | 2,211 (98.7%) | 29 (1.3%) |
| 75 Years and older | 1,447 (98.8%) | 18 (1.2%) |
| Total | 17,140 (94.4%) | 1,025 (5.6%) |
Health Insurance Coverage by Citizenship Status in Ste. Genevieve County

| Citizenship Status | With Coverage | Without Coverage |
| Native Born | 1,222 (95.6%) | 56 (4.4%) |
| Foreign Born, Citizen | 2,845 (99.3%) | 20 (0.7%) |
| Foreign Born, not a Citizen | 1,285 (94.6%) | 73 (5.4%) |
Health Insurance Coverage by Household Income in Ste. Genevieve County
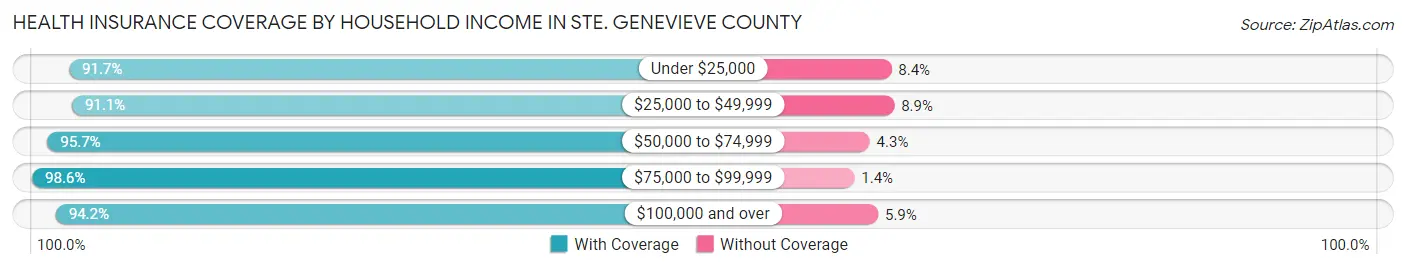
| Household Income | With Coverage | Without Coverage |
| Under $25,000 | 1,944 (91.6%) | 177 (8.4%) |
| $25,000 to $49,999 | 2,606 (91.1%) | 254 (8.9%) |
| $50,000 to $74,999 | 2,774 (95.7%) | 124 (4.3%) |
| $75,000 to $99,999 | 2,865 (98.6%) | 41 (1.4%) |
| $100,000 and over | 6,899 (94.2%) | 429 (5.9%) |
Public vs Private Health Insurance Coverage by Age in Ste. Genevieve County
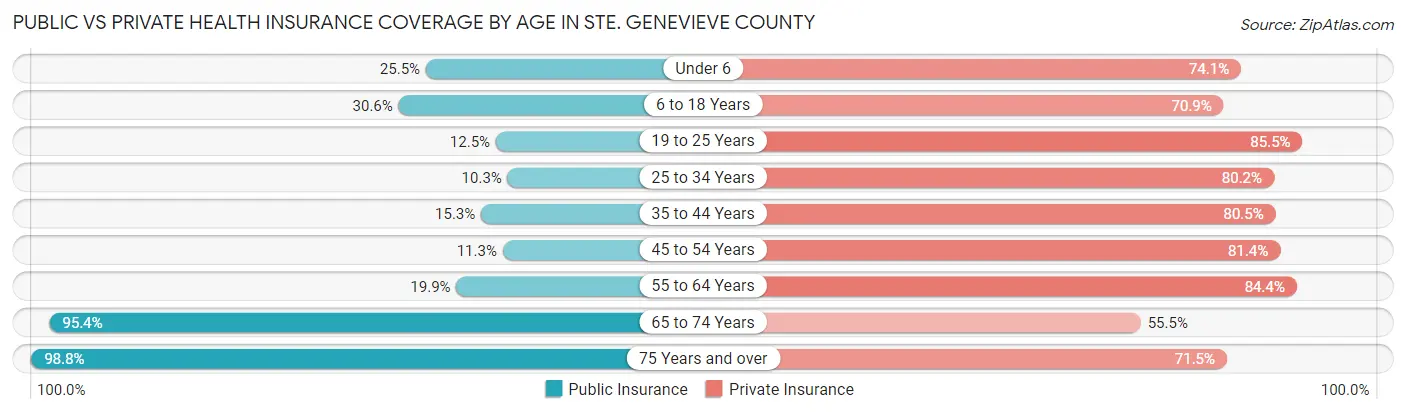
| Age Bracket | Public Insurance | Private Insurance |
| Under 6 | 326 (25.5%) | 947 (74.1%) |
| 6 to 18 Years | 876 (30.6%) | 2,030 (70.9%) |
| 19 to 25 Years | 170 (12.5%) | 1,161 (85.5%) |
| 25 to 34 Years | 178 (10.3%) | 1,380 (80.2%) |
| 35 to 44 Years | 310 (15.3%) | 1,636 (80.5%) |
| 45 to 54 Years | 248 (11.3%) | 1,793 (81.4%) |
| 55 to 64 Years | 596 (19.9%) | 2,535 (84.4%) |
| 65 to 74 Years | 2,137 (95.4%) | 1,243 (55.5%) |
| 75 Years and over | 1,447 (98.8%) | 1,047 (71.5%) |
| Total | 6,288 (34.6%) | 13,772 (75.8%) |
Disability Status by Sex by Age in Ste. Genevieve County
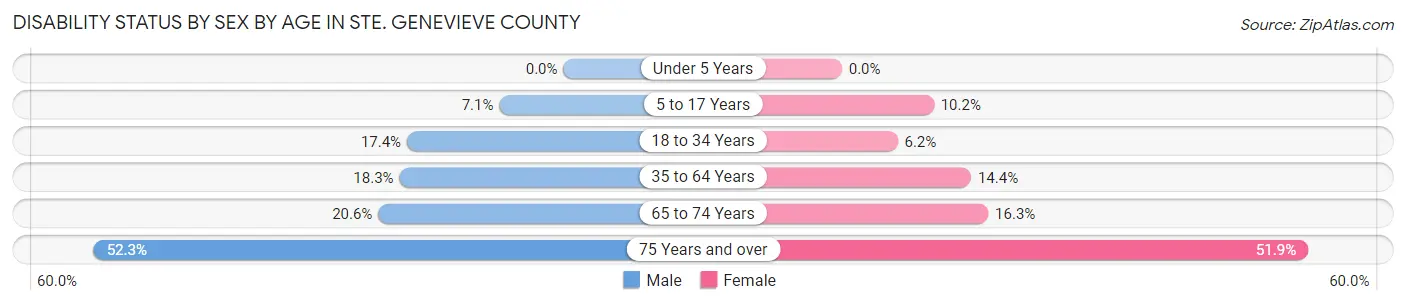
| Age Bracket | Male | Female |
| Under 5 Years | 0 (0.0%) | 0 (0.0%) |
| 5 to 17 Years | 114 (7.1%) | 136 (10.2%) |
| 18 to 34 Years | 296 (17.4%) | 98 (6.2%) |
| 35 to 64 Years | 681 (18.3%) | 505 (14.4%) |
| 65 to 74 Years | 238 (20.6%) | 177 (16.3%) |
| 75 Years and over | 330 (52.3%) | 433 (51.9%) |
Disability Class by Sex by Age in Ste. Genevieve County
Disability Class: Hearing Difficulty
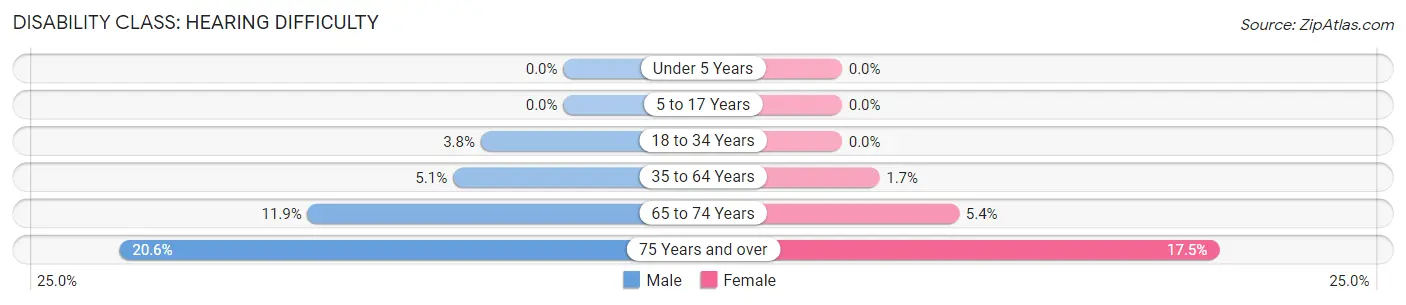
| Age Bracket | Male | Female |
| Under 5 Years | 0 (0.0%) | 0 (0.0%) |
| 5 to 17 Years | 0 (0.0%) | 0 (0.0%) |
| 18 to 34 Years | 65 (3.8%) | 0 (0.0%) |
| 35 to 64 Years | 191 (5.1%) | 61 (1.7%) |
| 65 to 74 Years | 137 (11.9%) | 59 (5.4%) |
| 75 Years and over | 130 (20.6%) | 146 (17.5%) |
Disability Class: Vision Difficulty
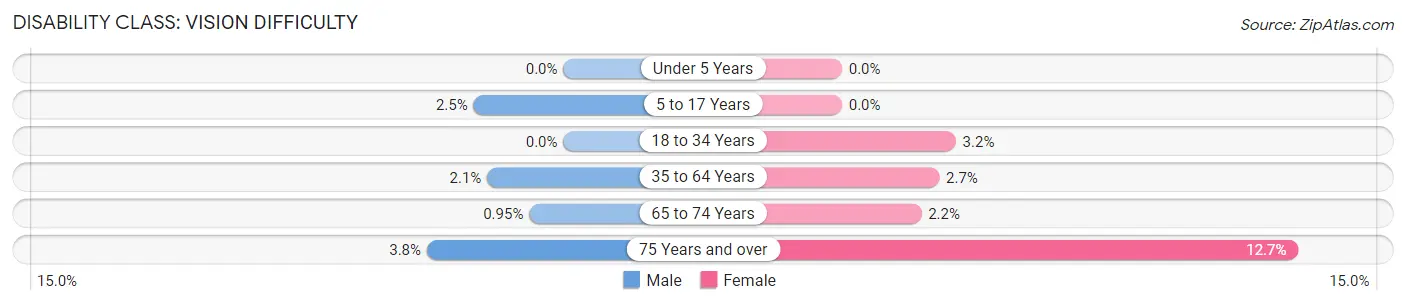
| Age Bracket | Male | Female |
| Under 5 Years | 0 (0.0%) | 0 (0.0%) |
| 5 to 17 Years | 40 (2.5%) | 0 (0.0%) |
| 18 to 34 Years | 0 (0.0%) | 50 (3.2%) |
| 35 to 64 Years | 79 (2.1%) | 95 (2.7%) |
| 65 to 74 Years | 11 (0.9%) | 24 (2.2%) |
| 75 Years and over | 24 (3.8%) | 106 (12.7%) |
Disability Class: Cognitive Difficulty
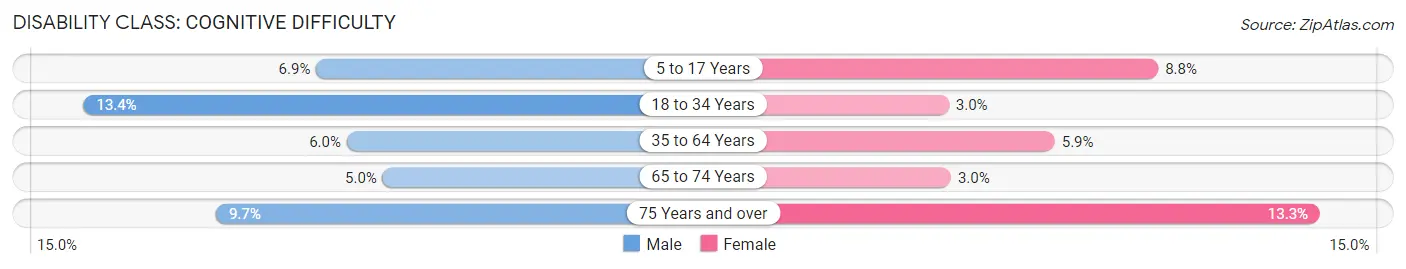
| Age Bracket | Male | Female |
| 5 to 17 Years | 110 (6.9%) | 117 (8.8%) |
| 18 to 34 Years | 227 (13.4%) | 47 (3.0%) |
| 35 to 64 Years | 225 (6.0%) | 208 (5.9%) |
| 65 to 74 Years | 58 (5.0%) | 33 (3.0%) |
| 75 Years and over | 61 (9.7%) | 111 (13.3%) |
Disability Class: Ambulatory Difficulty
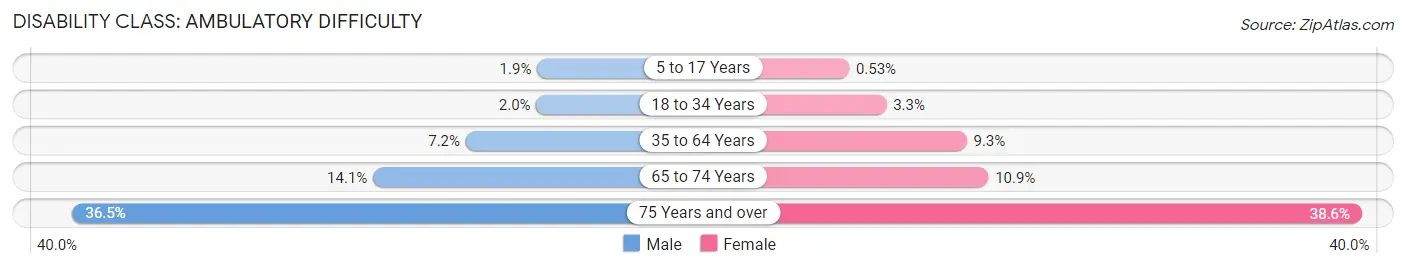
| Age Bracket | Male | Female |
| 5 to 17 Years | 31 (1.9%) | 7 (0.5%) |
| 18 to 34 Years | 34 (2.0%) | 52 (3.3%) |
| 35 to 64 Years | 270 (7.2%) | 325 (9.3%) |
| 65 to 74 Years | 163 (14.1%) | 118 (10.9%) |
| 75 Years and over | 230 (36.4%) | 322 (38.6%) |
Disability Class: Self-Care Difficulty
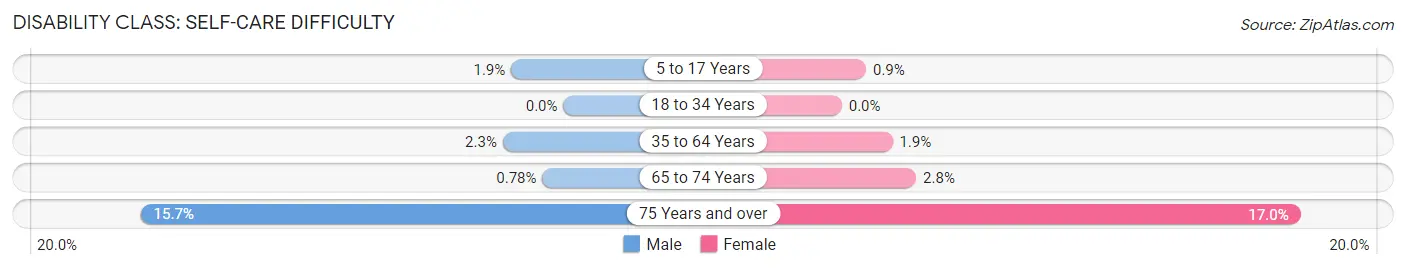
| Age Bracket | Male | Female |
| 5 to 17 Years | 31 (1.9%) | 12 (0.9%) |
| 18 to 34 Years | 0 (0.0%) | 0 (0.0%) |
| 35 to 64 Years | 84 (2.2%) | 66 (1.9%) |
| 65 to 74 Years | 9 (0.8%) | 30 (2.8%) |
| 75 Years and over | 99 (15.7%) | 142 (17.0%) |
Technology Access in Ste. Genevieve County
Computing Device Access in Ste. Genevieve County
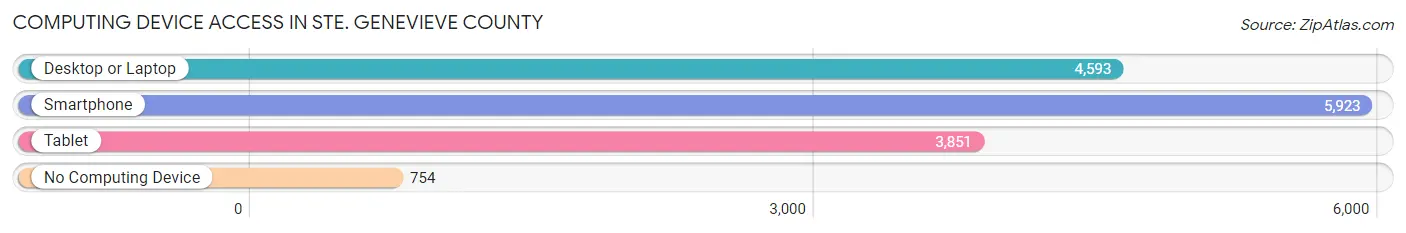
| Device Type | # Households | % Households |
| Desktop or Laptop | 4,593 | 64.5% |
| Smartphone | 5,923 | 83.2% |
| Tablet | 3,851 | 54.1% |
| No Computing Device | 754 | 10.6% |
| Total | 7,121 | 100.0% |
Internet Access in Ste. Genevieve County
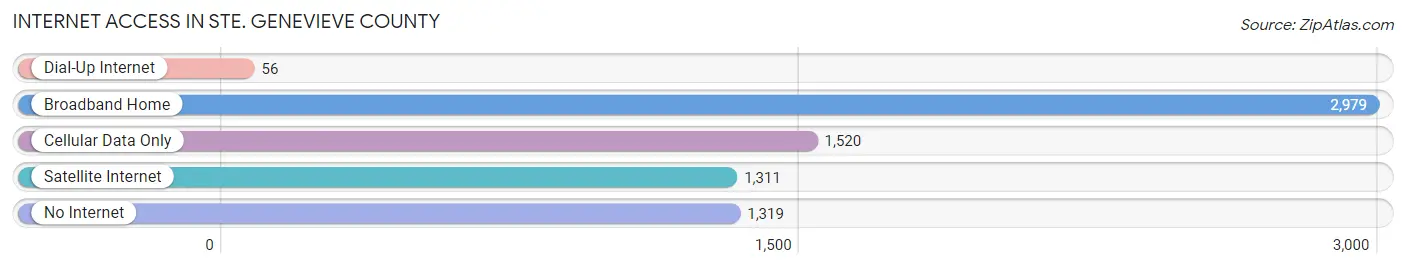
| Internet Type | # Households | % Households |
| Dial-Up Internet | 56 | 0.8% |
| Broadband Home | 2,979 | 41.8% |
| Cellular Data Only | 1,520 | 21.3% |
| Satellite Internet | 1,311 | 18.4% |
| No Internet | 1,319 | 18.5% |
| Total | 7,121 | 100.0% |
Ste. Genevieve County Summary
Ste. Genevieve County is located in the southeastern corner of Missouri, and is part of the St. Louis Metropolitan Statistical Area. The county is bordered by Perry County to the north, Jefferson County to the east, St. Francois County to the south, and Washington County to the west. Ste. Genevieve County covers an area of 545 square miles and has a population of 18,145, according to the 2010 census.
Geography
Ste. Genevieve County is located in the Ozark Plateau region of Missouri. The county is mostly rural, with rolling hills and valleys. The highest point in the county is located in the northwest corner, at an elevation of 1,068 feet. The county is drained by the Big River, which flows through the center of the county. Other major waterways include the Apple Creek, which flows through the eastern part of the county, and the Saline Creek, which flows through the western part of the county.
The county is home to several state parks, including the Big River State Forest, which covers an area of over 8,000 acres. The forest is home to a variety of wildlife, including deer, turkey, and small game. Other parks in the county include the Hawn State Park, which is located in the northern part of the county, and the Johnson’s Shut-Ins State Park, which is located in the southern part of the county.
History
Ste. Genevieve County was established in 1812, and was named after the city of Ste. Genevieve, which was founded in 1735 by French settlers. The county was originally part of the Louisiana Territory, and was later part of the Missouri Territory. The county was home to several Native American tribes, including the Osage, Shawnee, and Kickapoo.
The county was an important center of trade and commerce during the 19th century, and was home to several steamboat landings. The county was also home to several iron ore mines, which were important to the local economy.
Economy
The economy of Ste. Genevieve County is largely based on agriculture. The county is home to several large farms, which produce a variety of crops, including corn, soybeans, wheat, and hay. The county is also home to several wineries, which produce a variety of wines.
The county is also home to several manufacturing companies, which produce a variety of products, including furniture, clothing, and automotive parts. The county is also home to several retail stores, which sell a variety of goods.
Demographics
According to the 2010 census, the population of Ste. Genevieve County was 18,145. The population is largely white (94.3%), with small percentages of African American (2.3%), Hispanic (1.2%), and Asian (0.7%) residents. The median household income in the county is $41,945, and the median home value is $117,400.
The county is home to several educational institutions, including the Ste. Genevieve County R-II School District, which serves the county’s public school students. The county is also home to several private schools, including the Ste. Genevieve Academy and the Ste. Genevieve Catholic School.
Ste. Genevieve County is a rural county with a rich history and a diverse economy. The county is home to several state parks, which provide recreational opportunities for residents and visitors alike. The county is also home to several educational institutions, which provide educational opportunities for the county’s residents. The county is a great place to live, work, and raise a family.
Common Questions
What is Per Capita Income in Ste. Genevieve County?
Per Capita income in Ste. Genevieve County is $33,060.
What is the Median Family Income in Ste. Genevieve County?
Median Family Income in Ste. Genevieve County is $83,039.
What is the Median Household income in Ste. Genevieve County?
Median Household Income in Ste. Genevieve County is $61,215.
What is Income or Wage Gap in Ste. Genevieve County?
Income or Wage Gap in Ste. Genevieve County is 39.7%.
Women in Ste. Genevieve County earn 60.3 cents for every dollar earned by a man.
What is Family Income Deficit in Ste. Genevieve County?
Family Income Deficit in Ste. Genevieve County is $8,648.
Families that are below poverty line in Ste. Genevieve County earn $8,648 less on average than the poverty threshold level.
What is Inequality or Gini Index in Ste. Genevieve County?
Inequality or Gini Index in Ste. Genevieve County is 0.44.
What is the Total Population of Ste. Genevieve County?
Total Population of Ste. Genevieve County is 18,494.
What is the Total Male Population of Ste. Genevieve County?
Total Male Population of Ste. Genevieve County is 9,537.
What is the Total Female Population of Ste. Genevieve County?
Total Female Population of Ste. Genevieve County is 8,957.
What is the Ratio of Males per 100 Females in Ste. Genevieve County?
There are 106.48 Males per 100 Females in Ste. Genevieve County.
What is the Ratio of Females per 100 Males in Ste. Genevieve County?
There are 93.92 Females per 100 Males in Ste. Genevieve County.
What is the Median Population Age in Ste. Genevieve County?
Median Population Age in Ste. Genevieve County is 44.0 Years.
What is the Average Family Size in Ste. Genevieve County
Average Family Size in Ste. Genevieve County is 3.1 People.
What is the Average Household Size in Ste. Genevieve County
Average Household Size in Ste. Genevieve County is 2.5 People.
How Large is the Labor Force in Ste. Genevieve County?
There are 8,974 People in the Labor Forcein in Ste. Genevieve County.
What is the Percentage of People in the Labor Force in Ste. Genevieve County?
59.8% of People are in the Labor Force in Ste. Genevieve County.
What is the Unemployment Rate in Ste. Genevieve County?
Unemployment Rate in Ste. Genevieve County is 4.8%.