St. Francois County, MO Map & Demographics
St. Francois County Map
St. Francois County Overview
$25,304
PER CAPITA INCOME
$63,063
AVG FAMILY INCOME
$53,083
AVG HOUSEHOLD INCOME
27.9%
WAGE / INCOME GAP [ % ]
72.1¢/ $1
WAGE / INCOME GAP [ $ ]
$8,538
FAMILY INCOME DEFICIT
0.43
INEQUALITY / GINI INDEX
66,814
TOTAL POPULATION
35,470
MALE POPULATION
31,344
FEMALE POPULATION
113.16
MALES / 100 FEMALES
88.37
FEMALES / 100 MALES
39.4
MEDIAN AGE
3.1
AVG FAMILY SIZE
2.5
AVG HOUSEHOLD SIZE
28,166
LABOR FORCE [ PEOPLE ]
51.7%
PERCENT IN LABOR FORCE
4.8%
UNEMPLOYMENT RATE
Income in St. Francois County
Income Overview in St. Francois County
Per Capita Income in St. Francois County is $25,304, while median incomes of families and households are $63,063 and $53,083 respectively.
| Characteristic | Number | Measure |
| Per Capita Income | 66,814 | $25,304 |
| Median Family Income | 16,040 | $63,063 |
| Mean Family Income | 16,040 | $79,247 |
| Median Household Income | 23,973 | $53,083 |
| Mean Household Income | 23,973 | $69,486 |
| Income Deficit | 16,040 | $8,538 |
| Wage / Income Gap (%) | 66,814 | 27.94% |
| Wage / Income Gap ($) | 66,814 | 72.06¢ per $1 |
| Gini / Inequality Index | 66,814 | 0.43 |
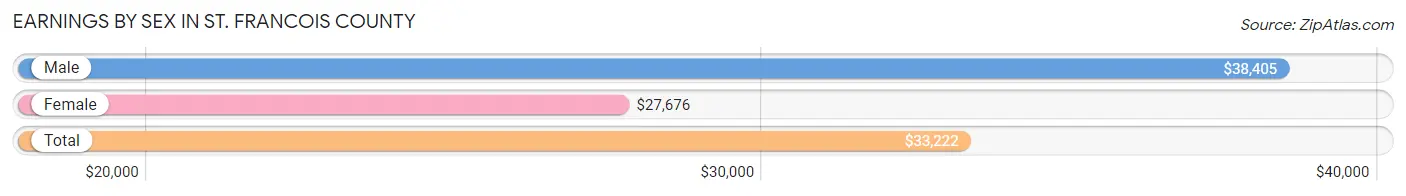
Earnings by Sex in St. Francois County
Average Earnings in St. Francois County are $33,222, $38,405 for men and $27,676 for women, a difference of 27.9%.
| Sex | Number | Average Earnings |
| Male | 16,192 (54.3%) | $38,405 |
| Female | 13,623 (45.7%) | $27,676 |
| Total | 29,815 (100.0%) | $33,222 |
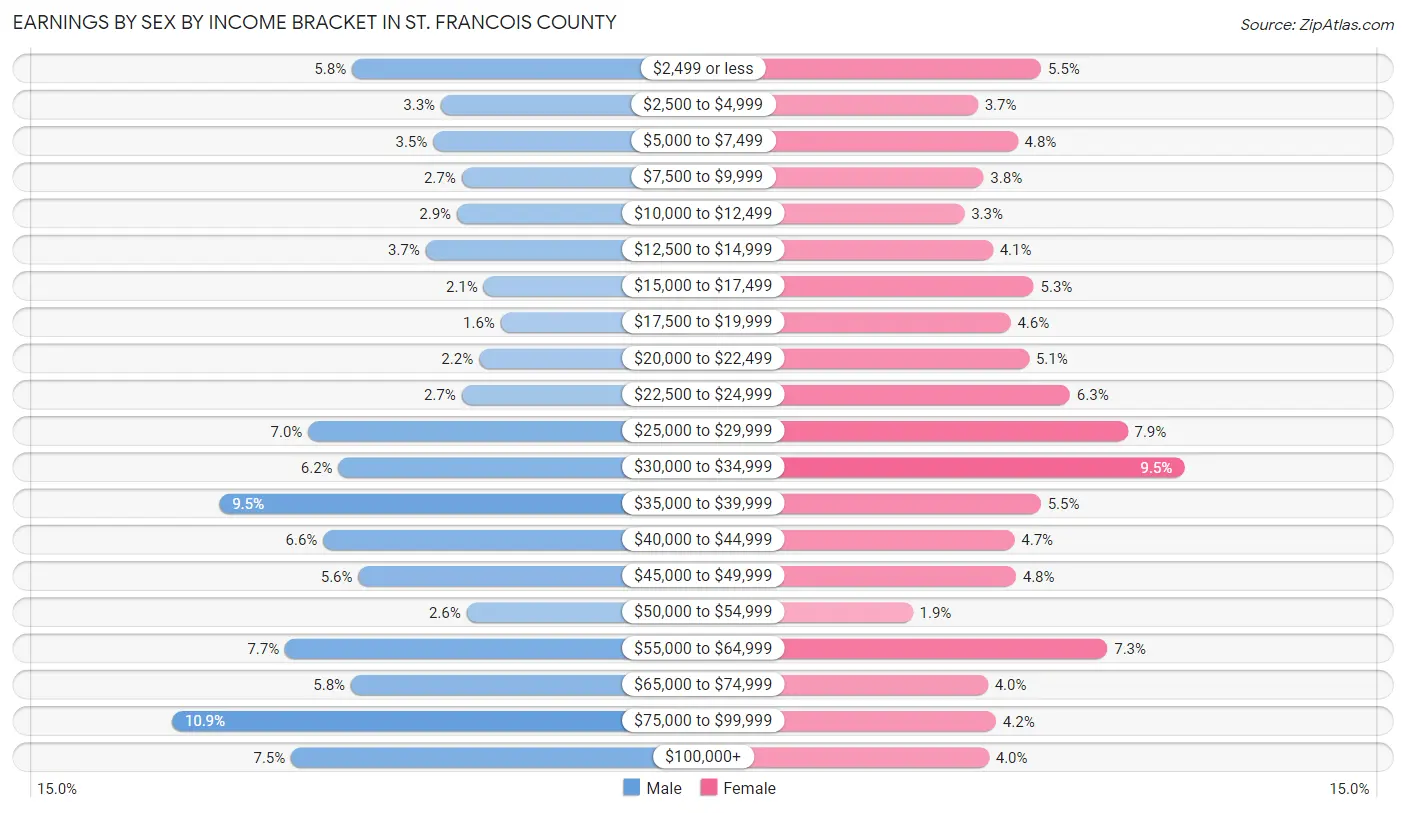
Earnings by Sex by Income Bracket in St. Francois County
The most common earnings brackets in St. Francois County are $75,000 to $99,999 for men (1,758 | 10.9%) and $30,000 to $34,999 for women (1,292 | 9.5%).
| Income | Male | Female |
| $2,499 or less | 939 (5.8%) | 744 (5.5%) |
| $2,500 to $4,999 | 534 (3.3%) | 501 (3.7%) |
| $5,000 to $7,499 | 570 (3.5%) | 654 (4.8%) |
| $7,500 to $9,999 | 440 (2.7%) | 523 (3.8%) |
| $10,000 to $12,499 | 462 (2.9%) | 450 (3.3%) |
| $12,500 to $14,999 | 604 (3.7%) | 558 (4.1%) |
| $15,000 to $17,499 | 340 (2.1%) | 715 (5.2%) |
| $17,500 to $19,999 | 262 (1.6%) | 626 (4.6%) |
| $20,000 to $22,499 | 361 (2.2%) | 698 (5.1%) |
| $22,500 to $24,999 | 440 (2.7%) | 854 (6.3%) |
| $25,000 to $29,999 | 1,139 (7.0%) | 1,075 (7.9%) |
| $30,000 to $34,999 | 1,000 (6.2%) | 1,292 (9.5%) |
| $35,000 to $39,999 | 1,543 (9.5%) | 742 (5.4%) |
| $40,000 to $44,999 | 1,070 (6.6%) | 641 (4.7%) |
| $45,000 to $49,999 | 910 (5.6%) | 647 (4.8%) |
| $50,000 to $54,999 | 417 (2.6%) | 252 (1.8%) |
| $55,000 to $64,999 | 1,243 (7.7%) | 997 (7.3%) |
| $65,000 to $74,999 | 944 (5.8%) | 540 (4.0%) |
| $75,000 to $99,999 | 1,758 (10.9%) | 571 (4.2%) |
| $100,000+ | 1,216 (7.5%) | 543 (4.0%) |
| Total | 16,192 (100.0%) | 13,623 (100.0%) |
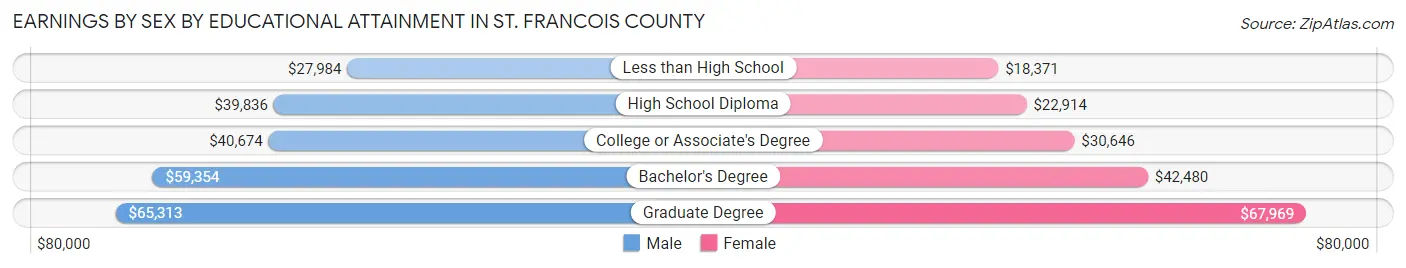
Earnings by Sex by Educational Attainment in St. Francois County
Average earnings in St. Francois County are $41,968 for men and $30,634 for women, a difference of 27.0%. Men with an educational attainment of graduate degree enjoy the highest average annual earnings of $65,313, while those with less than high school education earn the least with $27,984. Women with an educational attainment of graduate degree earn the most with the average annual earnings of $67,969, while those with less than high school education have the smallest earnings of $18,371.
| Educational Attainment | Male Income | Female Income |
| Less than High School | $27,984 | $18,371 |
| High School Diploma | $39,836 | $22,914 |
| College or Associate's Degree | $40,674 | $30,646 |
| Bachelor's Degree | $59,354 | $42,480 |
| Graduate Degree | $65,313 | $67,969 |
| Total | $41,968 | $30,634 |
Family Income in St. Francois County
Family Income Brackets in St. Francois County
According to the St. Francois County family income data, there are 3,048 families falling into the $50,000 to $74,999 income range, which is the most common income bracket and makes up 19.0% of all families. Conversely, the $10,000 to $14,999 income bracket is the least frequent group with only 465 families (2.9%) belonging to this category.
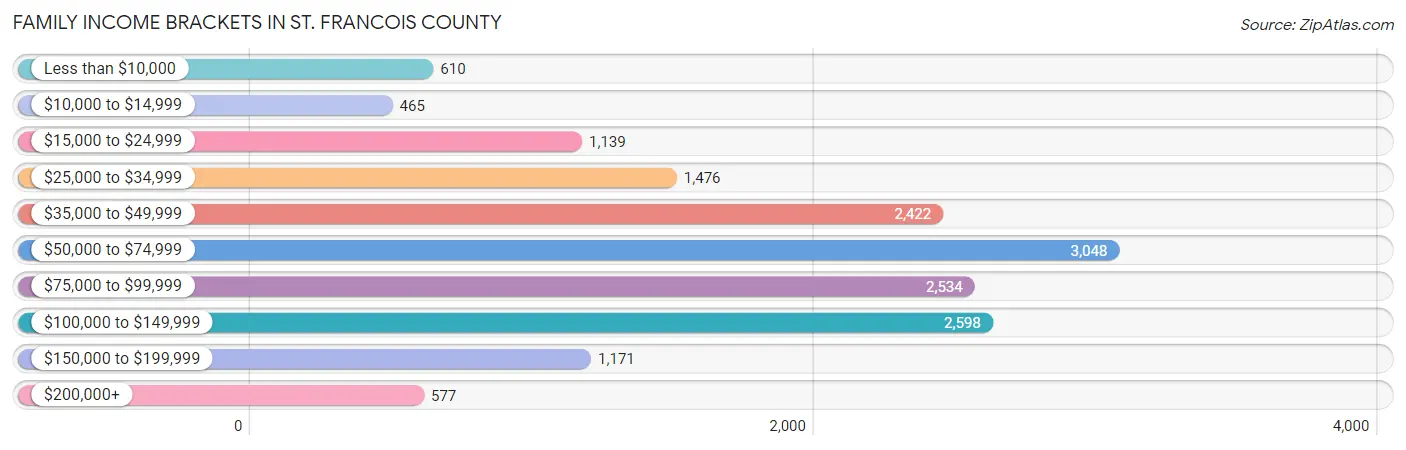
| Income Bracket | # Families | % Families |
| Less than $10,000 | 610 | 3.8% |
| $10,000 to $14,999 | 465 | 2.9% |
| $15,000 to $24,999 | 1,139 | 7.1% |
| $25,000 to $34,999 | 1,476 | 9.2% |
| $35,000 to $49,999 | 2,422 | 15.1% |
| $50,000 to $74,999 | 3,048 | 19.0% |
| $75,000 to $99,999 | 2,534 | 15.8% |
| $100,000 to $149,999 | 2,598 | 16.2% |
| $150,000 to $199,999 | 1,171 | 7.3% |
| $200,000+ | 577 | 3.6% |
Family Income by Famaliy Size in St. Francois County
7+ person families (204 | 1.3%) account for the highest median family income in St. Francois County with $187,031 per family, while 2-person families (7,579 | 47.2%) have the highest median income of $27,890 per family member.
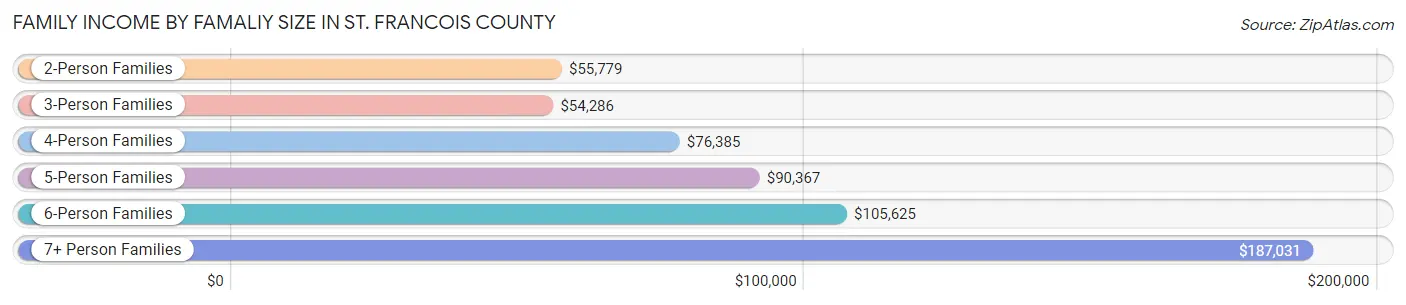
| Income Bracket | # Families | Median Income |
| 2-Person Families | 7,579 (47.2%) | $55,779 |
| 3-Person Families | 3,950 (24.6%) | $54,286 |
| 4-Person Families | 2,738 (17.1%) | $76,385 |
| 5-Person Families | 1,151 (7.2%) | $90,367 |
| 6-Person Families | 418 (2.6%) | $105,625 |
| 7+ Person Families | 204 (1.3%) | $187,031 |
| Total | 16,040 (100.0%) | $63,063 |
Family Income by Number of Earners in St. Francois County
The median family income in St. Francois County is $63,063, with families comprising 3+ earners (1,792) having the highest median family income of $117,778, while families with no earners (3,101) have the lowest median family income of $40,222, accounting for 11.2% and 19.3% of families, respectively.
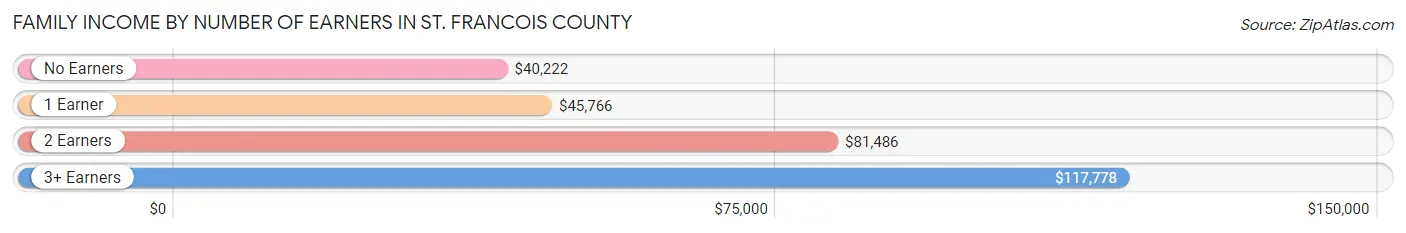
| Number of Earners | # Families | Median Income |
| No Earners | 3,101 (19.3%) | $40,222 |
| 1 Earner | 5,365 (33.5%) | $45,766 |
| 2 Earners | 5,782 (36.0%) | $81,486 |
| 3+ Earners | 1,792 (11.2%) | $117,778 |
| Total | 16,040 (100.0%) | $63,063 |
Household Income in St. Francois County
Household Income Brackets in St. Francois County
With 4,099 households falling in the category, the $50,000 to $74,999 income range is the most frequent in St. Francois County, accounting for 17.1% of all households. In contrast, only 695 households (2.9%) fall into the $200,000+ income bracket, making it the least populous group.
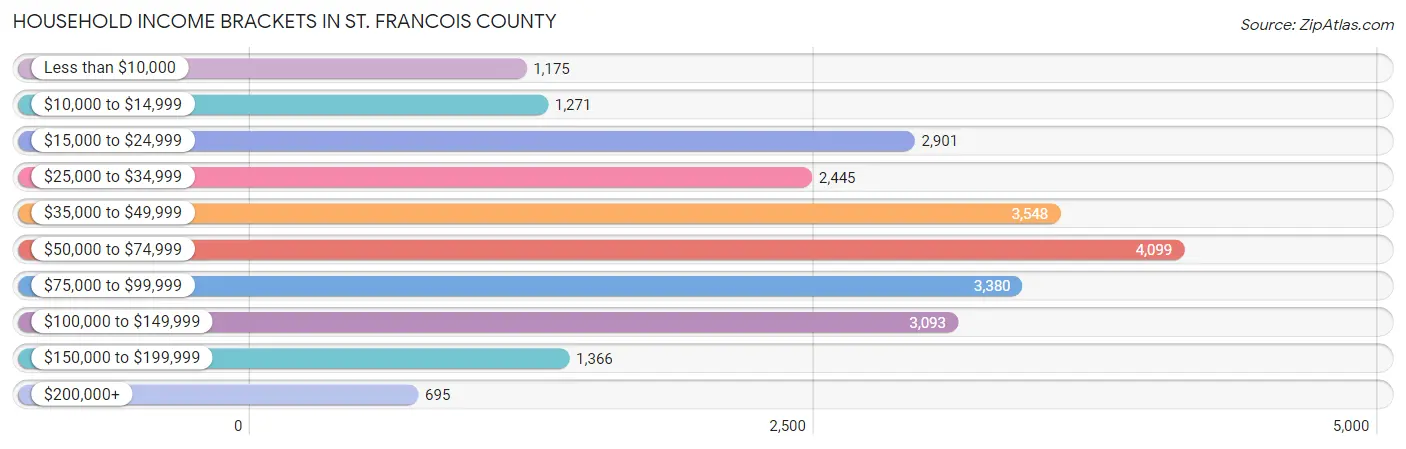
| Income Bracket | # Households | % Households |
| Less than $10,000 | 1,175 | 4.9% |
| $10,000 to $14,999 | 1,271 | 5.3% |
| $15,000 to $24,999 | 2,901 | 12.1% |
| $25,000 to $34,999 | 2,445 | 10.2% |
| $35,000 to $49,999 | 3,548 | 14.8% |
| $50,000 to $74,999 | 4,099 | 17.1% |
| $75,000 to $99,999 | 3,380 | 14.1% |
| $100,000 to $149,999 | 3,093 | 12.9% |
| $150,000 to $199,999 | 1,366 | 5.7% |
| $200,000+ | 695 | 2.9% |
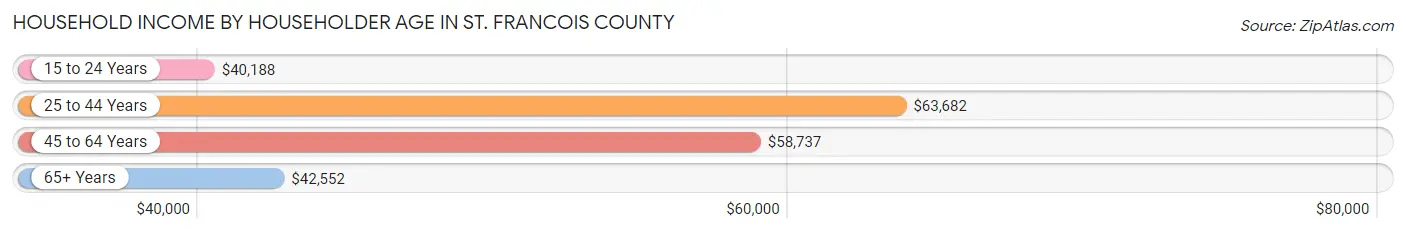
Household Income by Householder Age in St. Francois County
The median household income in St. Francois County is $53,083, with the highest median household income of $63,682 found in the 25 to 44 years age bracket for the primary householder. A total of 7,012 households (29.2%) fall into this category. Meanwhile, the 15 to 24 years age bracket for the primary householder has the lowest median household income of $40,188, with 1,010 households (4.2%) in this group.
| Income Bracket | # Households | Median Income |
| 15 to 24 Years | 1,010 (4.2%) | $40,188 |
| 25 to 44 Years | 7,012 (29.2%) | $63,682 |
| 45 to 64 Years | 9,049 (37.8%) | $58,737 |
| 65+ Years | 6,902 (28.8%) | $42,552 |
| Total | 23,973 (100.0%) | $53,083 |
Poverty in St. Francois County
Income Below Poverty by Sex and Age in St. Francois County
With 16.8% poverty level for males and 18.4% for females among the residents of St. Francois County, 15 year old males and 5 year old females are the most vulnerable to poverty, with 136 males (30.5%) and 154 females (33.5%) in their respective age groups living below the poverty level.
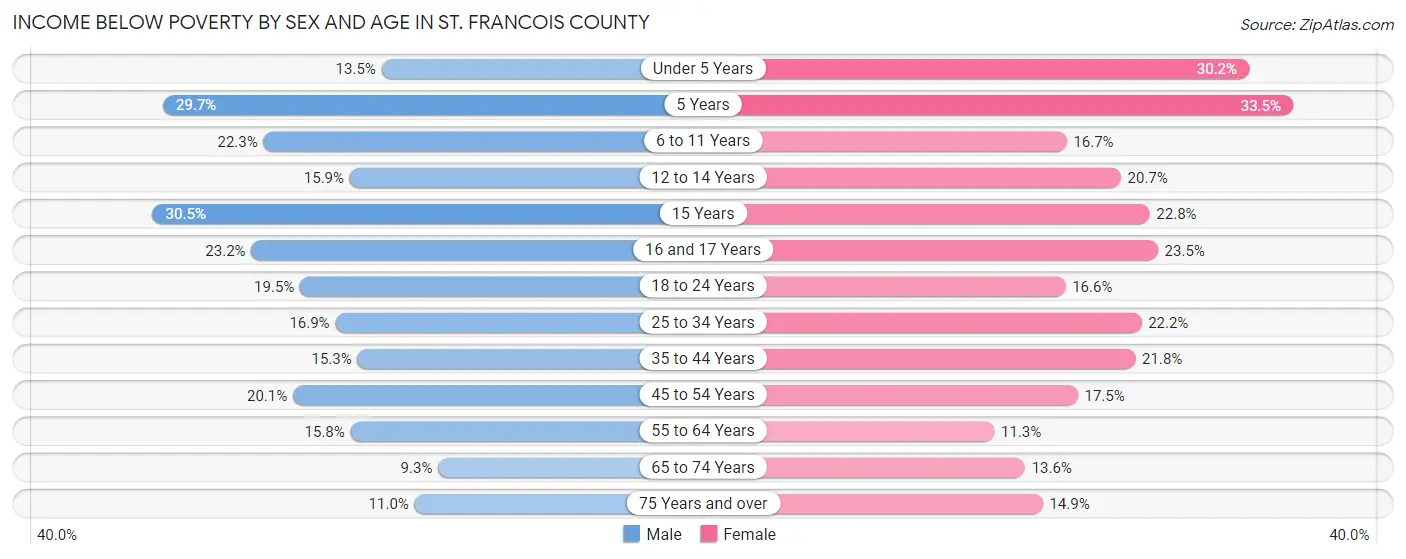
| Age Bracket | Male | Female |
| Under 5 Years | 234 (13.5%) | 544 (30.2%) |
| 5 Years | 88 (29.7%) | 154 (33.5%) |
| 6 to 11 Years | 526 (22.3%) | 373 (16.7%) |
| 12 to 14 Years | 198 (15.9%) | 214 (20.7%) |
| 15 Years | 136 (30.5%) | 74 (22.8%) |
| 16 and 17 Years | 201 (23.2%) | 219 (23.4%) |
| 18 to 24 Years | 552 (19.5%) | 381 (16.6%) |
| 25 to 34 Years | 722 (16.9%) | 885 (22.2%) |
| 35 to 44 Years | 560 (15.3%) | 843 (21.8%) |
| 45 to 54 Years | 804 (20.1%) | 652 (17.5%) |
| 55 to 64 Years | 632 (15.8%) | 470 (11.3%) |
| 65 to 74 Years | 271 (9.3%) | 438 (13.6%) |
| 75 Years and over | 194 (11.0%) | 384 (14.9%) |
| Total | 5,118 (16.8%) | 5,631 (18.4%) |
Income Above Poverty by Sex and Age in St. Francois County
According to the poverty statistics in St. Francois County, males aged 65 to 74 years and females aged 55 to 64 years are the age groups that are most secure financially, with 90.7% of males and 88.7% of females in these age groups living above the poverty line.
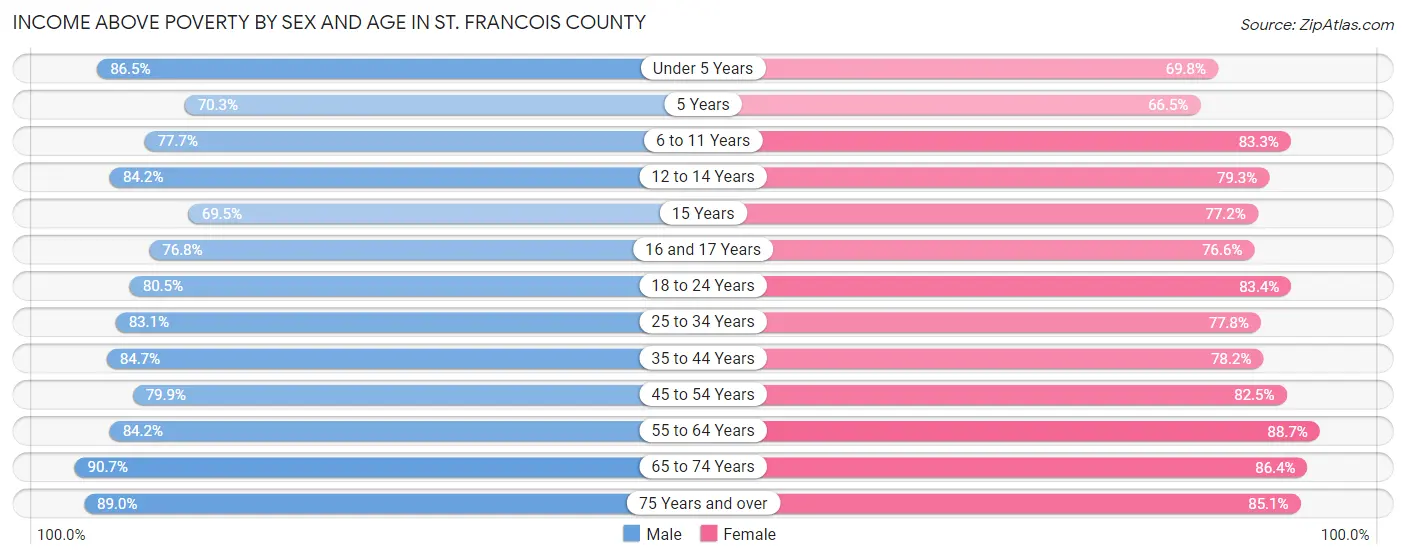
| Age Bracket | Male | Female |
| Under 5 Years | 1,501 (86.5%) | 1,256 (69.8%) |
| 5 Years | 208 (70.3%) | 306 (66.5%) |
| 6 to 11 Years | 1,837 (77.7%) | 1,863 (83.3%) |
| 12 to 14 Years | 1,051 (84.2%) | 820 (79.3%) |
| 15 Years | 310 (69.5%) | 250 (77.2%) |
| 16 and 17 Years | 667 (76.8%) | 715 (76.5%) |
| 18 to 24 Years | 2,273 (80.5%) | 1,916 (83.4%) |
| 25 to 34 Years | 3,545 (83.1%) | 3,096 (77.8%) |
| 35 to 44 Years | 3,104 (84.7%) | 3,028 (78.2%) |
| 45 to 54 Years | 3,202 (79.9%) | 3,073 (82.5%) |
| 55 to 64 Years | 3,367 (84.2%) | 3,685 (88.7%) |
| 65 to 74 Years | 2,645 (90.7%) | 2,788 (86.4%) |
| 75 Years and over | 1,564 (89.0%) | 2,193 (85.1%) |
| Total | 25,274 (83.2%) | 24,989 (81.6%) |
Income Below Poverty Among Married-Couple Families in St. Francois County
The poverty statistics for married-couple families in St. Francois County show that 8.1% or 927 of the total 11,504 families live below the poverty line. Families with 3 or 4 children have the highest poverty rate of 16.3%, comprising of 131 families. On the other hand, families with 5 or more children have the lowest poverty rate of 0.0%, which includes 0 families.
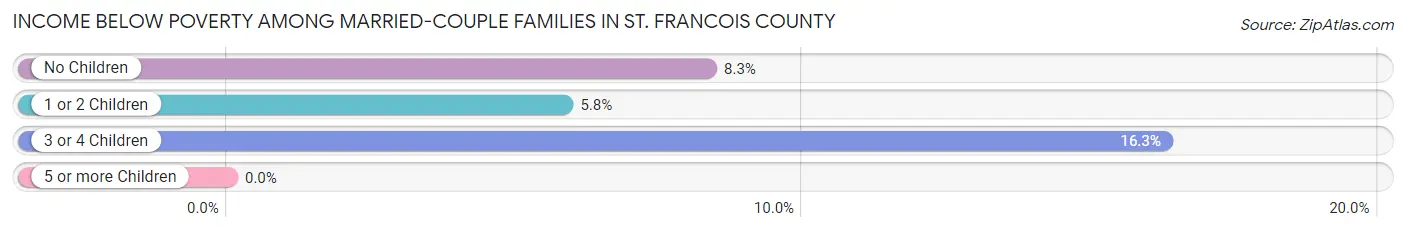
| Children | Above Poverty | Below Poverty |
| No Children | 6,340 (91.7%) | 577 (8.3%) |
| 1 or 2 Children | 3,534 (94.2%) | 219 (5.8%) |
| 3 or 4 Children | 674 (83.7%) | 131 (16.3%) |
| 5 or more Children | 29 (100.0%) | 0 (0.0%) |
| Total | 10,577 (91.9%) | 927 (8.1%) |
Income Below Poverty Among Single-Parent Households in St. Francois County
According to the poverty data in St. Francois County, 11.6% or 176 single-father households and 36.2% or 1,092 single-mother households are living below the poverty line. Among single-father households, those with 3 or 4 children have the highest poverty rate, with 37 households (90.2%) experiencing poverty. Likewise, among single-mother households, those with 3 or 4 children have the highest poverty rate, with 149 households (75.2%) falling below the poverty line.
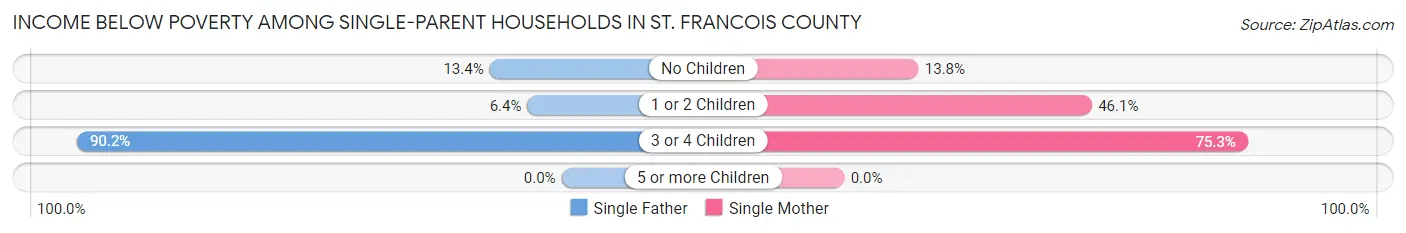
| Children | Single Father | Single Mother |
| No Children | 85 (13.4%) | 144 (13.8%) |
| 1 or 2 Children | 54 (6.4%) | 799 (46.1%) |
| 3 or 4 Children | 37 (90.2%) | 149 (75.2%) |
| 5 or more Children | 0 (0.0%) | 0 (0.0%) |
| Total | 176 (11.6%) | 1,092 (36.2%) |
Income Below Poverty Among Married-Couple vs Single-Parent Households in St. Francois County
The poverty data for St. Francois County shows that 927 of the married-couple family households (8.1%) and 1,268 of the single-parent households (28.0%) are living below the poverty level. Within the married-couple family households, those with 3 or 4 children have the highest poverty rate, with 131 households (16.3%) falling below the poverty line. Among the single-parent households, those with 3 or 4 children have the highest poverty rate, with 186 household (77.8%) living below poverty.
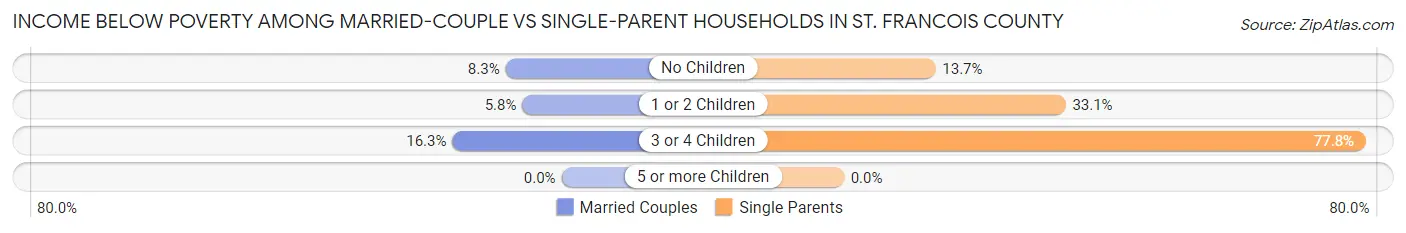
| Children | Married-Couple Families | Single-Parent Households |
| No Children | 577 (8.3%) | 229 (13.7%) |
| 1 or 2 Children | 219 (5.8%) | 853 (33.1%) |
| 3 or 4 Children | 131 (16.3%) | 186 (77.8%) |
| 5 or more Children | 0 (0.0%) | 0 (0.0%) |
| Total | 927 (8.1%) | 1,268 (28.0%) |
Race in St. Francois County
The most populous races in St. Francois County are White / Caucasian (61,049 | 91.4%), Two or more Races (2,590 | 3.9%), and Black / African American (1,976 | 3.0%).
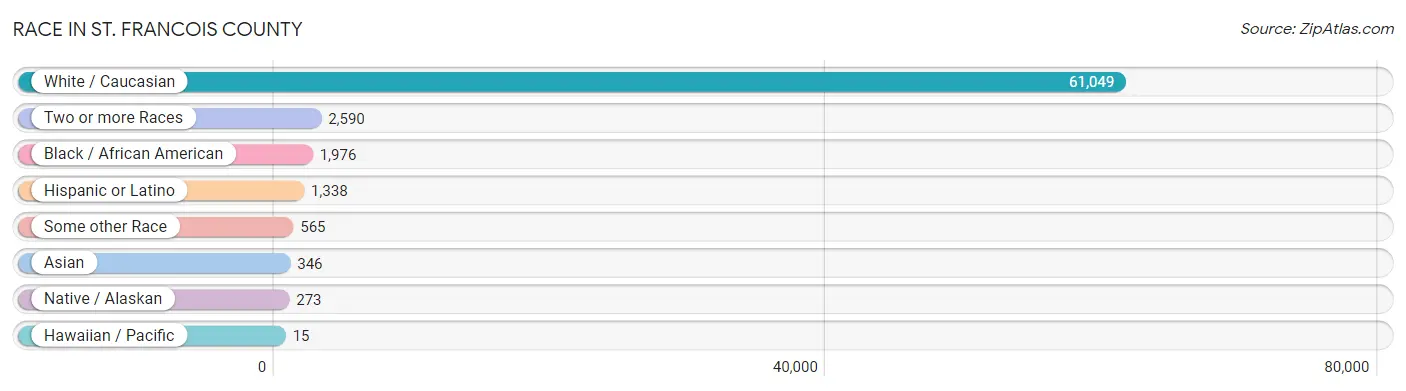
| Race | # Population | % Population |
| Asian | 346 | 0.5% |
| Black / African American | 1,976 | 3.0% |
| Hawaiian / Pacific | 15 | 0.0% |
| Hispanic or Latino | 1,338 | 2.0% |
| Native / Alaskan | 273 | 0.4% |
| White / Caucasian | 61,049 | 91.4% |
| Two or more Races | 2,590 | 3.9% |
| Some other Race | 565 | 0.9% |
| Total | 66,814 | 100.0% |
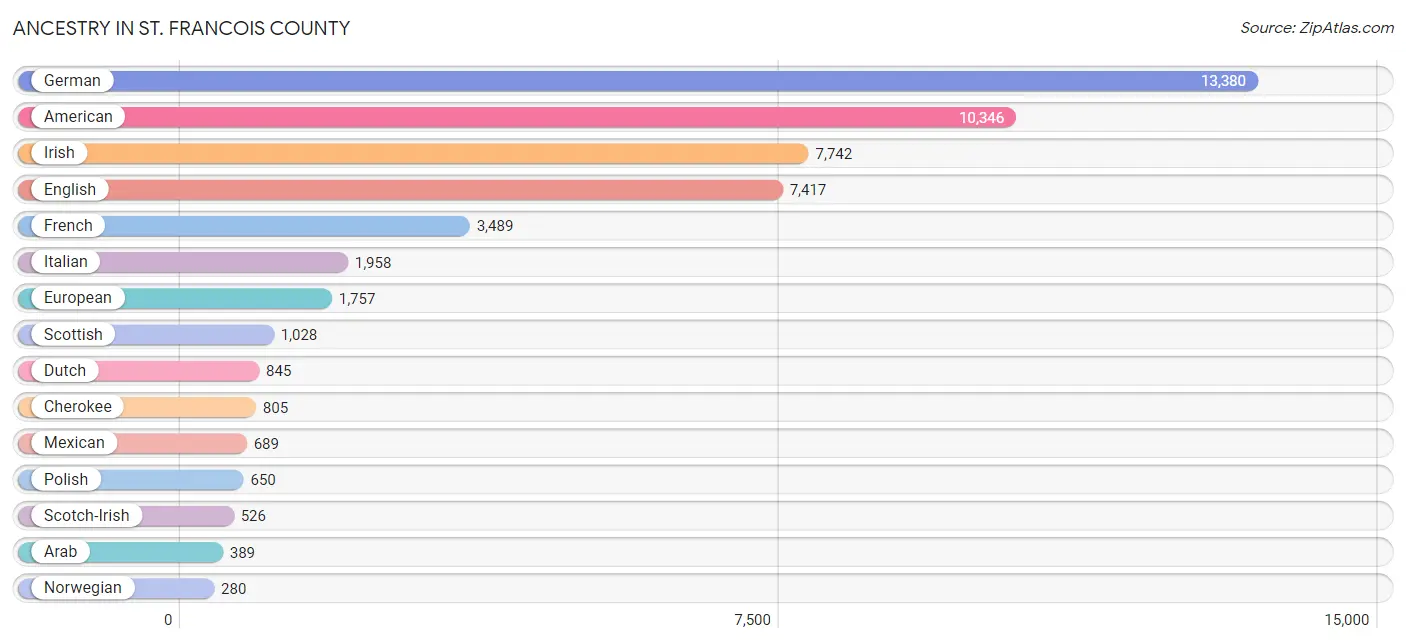
Ancestry in St. Francois County
The most populous ancestries reported in St. Francois County are German (13,380 | 20.0%), American (10,346 | 15.5%), Irish (7,742 | 11.6%), English (7,417 | 11.1%), and French (3,489 | 5.2%), together accounting for 63.4% of all St. Francois County residents.
| Ancestry | # Population | % Population |
| African | 210 | 0.3% |
| American | 10,346 | 15.5% |
| Apache | 69 | 0.1% |
| Arab | 389 | 0.6% |
| Argentinean | 72 | 0.1% |
| Australian | 4 | 0.0% |
| Austrian | 12 | 0.0% |
| Belgian | 46 | 0.1% |
| Bhutanese | 55 | 0.1% |
| Blackfeet | 50 | 0.1% |
| British | 272 | 0.4% |
| Burmese | 67 | 0.1% |
| Canadian | 9 | 0.0% |
| Celtic | 16 | 0.0% |
| Central American | 100 | 0.2% |
| Cherokee | 805 | 1.2% |
| Chickasaw | 5 | 0.0% |
| Chippewa | 2 | 0.0% |
| Choctaw | 224 | 0.3% |
| Colombian | 205 | 0.3% |
| Comanche | 9 | 0.0% |
| Creek | 6 | 0.0% |
| Croatian | 46 | 0.1% |
| Crow | 42 | 0.1% |
| Czech | 63 | 0.1% |
| Czechoslovakian | 183 | 0.3% |
| Danish | 155 | 0.2% |
| Dutch | 845 | 1.3% |
| Dutch West Indian | 10 | 0.0% |
| Eastern European | 44 | 0.1% |
| Egyptian | 26 | 0.0% |
| English | 7,417 | 11.1% |
| European | 1,757 | 2.6% |
| Filipino | 22 | 0.0% |
| Finnish | 7 | 0.0% |
| French | 3,489 | 5.2% |
| French American Indian | 24 | 0.0% |
| French Canadian | 151 | 0.2% |
| German | 13,380 | 20.0% |
| Greek | 35 | 0.1% |
| Guatemalan | 26 | 0.0% |
| Honduran | 49 | 0.1% |
| Hungarian | 112 | 0.2% |
| Indian (Asian) | 7 | 0.0% |
| Irish | 7,742 | 11.6% |
| Iroquois | 11 | 0.0% |
| Italian | 1,958 | 2.9% |
| Jamaican | 12 | 0.0% |
| Jordanian | 20 | 0.0% |
| Korean | 115 | 0.2% |
| Lebanese | 80 | 0.1% |
| Lithuanian | 8 | 0.0% |
| Mexican | 689 | 1.0% |
| Mexican American Indian | 19 | 0.0% |
| Moroccan | 7 | 0.0% |
| Native Hawaiian | 53 | 0.1% |
| Navajo | 1 | 0.0% |
| Northern European | 54 | 0.1% |
| Norwegian | 280 | 0.4% |
| Pakistani | 36 | 0.1% |
| Polish | 650 | 1.0% |
| Puerto Rican | 116 | 0.2% |
| Romanian | 7 | 0.0% |
| Russian | 83 | 0.1% |
| Salvadoran | 25 | 0.0% |
| Samoan | 15 | 0.0% |
| Scandinavian | 94 | 0.1% |
| Scotch-Irish | 526 | 0.8% |
| Scottish | 1,028 | 1.5% |
| Sioux | 12 | 0.0% |
| Slovak | 31 | 0.1% |
| Somali | 7 | 0.0% |
| South American | 277 | 0.4% |
| Spaniard | 74 | 0.1% |
| Subsaharan African | 217 | 0.3% |
| Swedish | 192 | 0.3% |
| Swiss | 132 | 0.2% |
| Ukrainian | 26 | 0.0% |
| Welsh | 140 | 0.2% |
| Yugoslavian | 172 | 0.3% | View All 80 Rows |
Immigrants in St. Francois County
The most numerous immigrant groups reported in St. Francois County came from Latin America (403 | 0.6%), Africa (328 | 0.5%), Northern Africa (282 | 0.4%), Asia (270 | 0.4%), and South America (208 | 0.3%), together accounting for 2.2% of all St. Francois County residents.
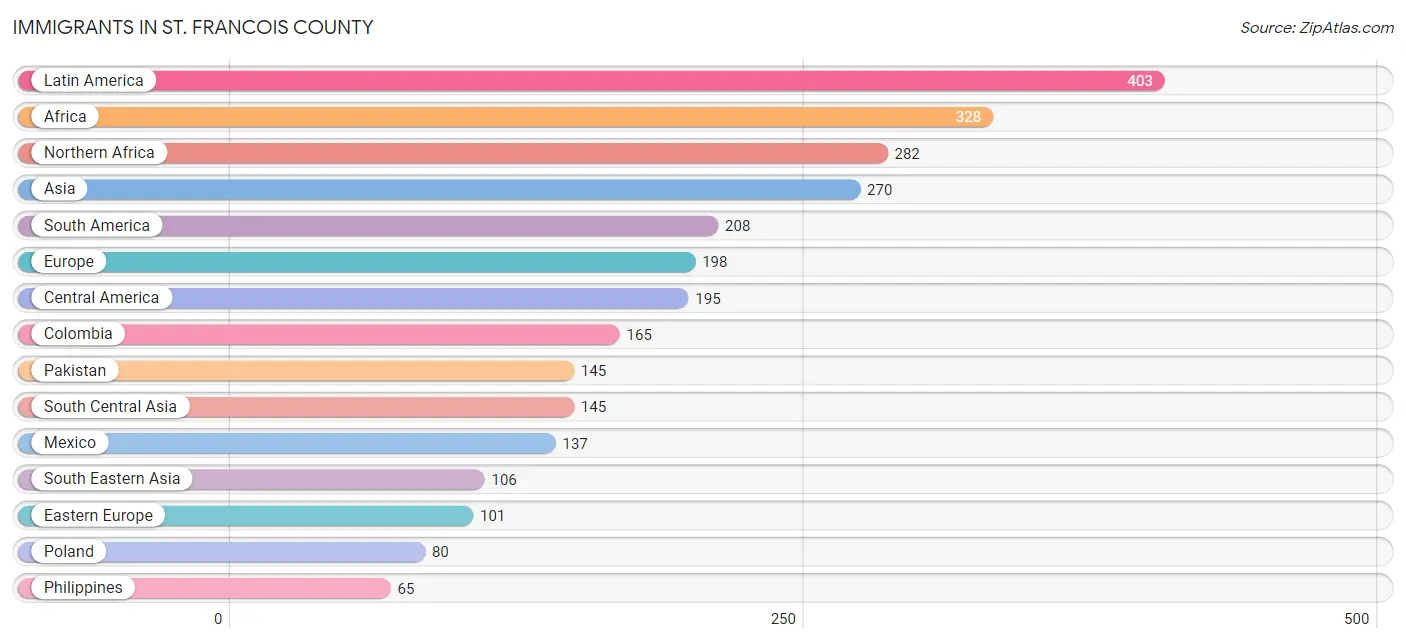
| Immigration Origin | # Population | % Population |
| Africa | 328 | 0.5% |
| Argentina | 43 | 0.1% |
| Asia | 270 | 0.4% |
| Australia | 4 | 0.0% |
| Cambodia | 15 | 0.0% |
| Central America | 195 | 0.3% |
| Colombia | 165 | 0.3% |
| Eastern Africa | 7 | 0.0% |
| Eastern Asia | 8 | 0.0% |
| Eastern Europe | 101 | 0.2% |
| Egypt | 26 | 0.0% |
| El Salvador | 25 | 0.0% |
| England | 36 | 0.1% |
| Europe | 198 | 0.3% |
| France | 20 | 0.0% |
| Germany | 4 | 0.0% |
| Guatemala | 33 | 0.1% |
| Iraq | 11 | 0.0% |
| Kenya | 7 | 0.0% |
| Korea | 8 | 0.0% |
| Latin America | 403 | 0.6% |
| Mexico | 137 | 0.2% |
| Northern Africa | 282 | 0.4% |
| Northern Europe | 55 | 0.1% |
| Oceania | 4 | 0.0% |
| Pakistan | 145 | 0.2% |
| Philippines | 65 | 0.1% |
| Poland | 80 | 0.1% |
| Romania | 7 | 0.0% |
| Russia | 14 | 0.0% |
| Singapore | 8 | 0.0% |
| South Africa | 39 | 0.1% |
| South America | 208 | 0.3% |
| South Central Asia | 145 | 0.2% |
| South Eastern Asia | 106 | 0.2% |
| Southern Europe | 18 | 0.0% |
| Thailand | 4 | 0.0% |
| Vietnam | 14 | 0.0% |
| Western Asia | 11 | 0.0% |
| Western Europe | 24 | 0.0% | View All 40 Rows |
Sex and Age in St. Francois County
Sex and Age in St. Francois County
The most populous age groups in St. Francois County are 30 to 34 Years (2,868 | 8.1%) for men and 55 to 59 Years (2,241 | 7.1%) for women.
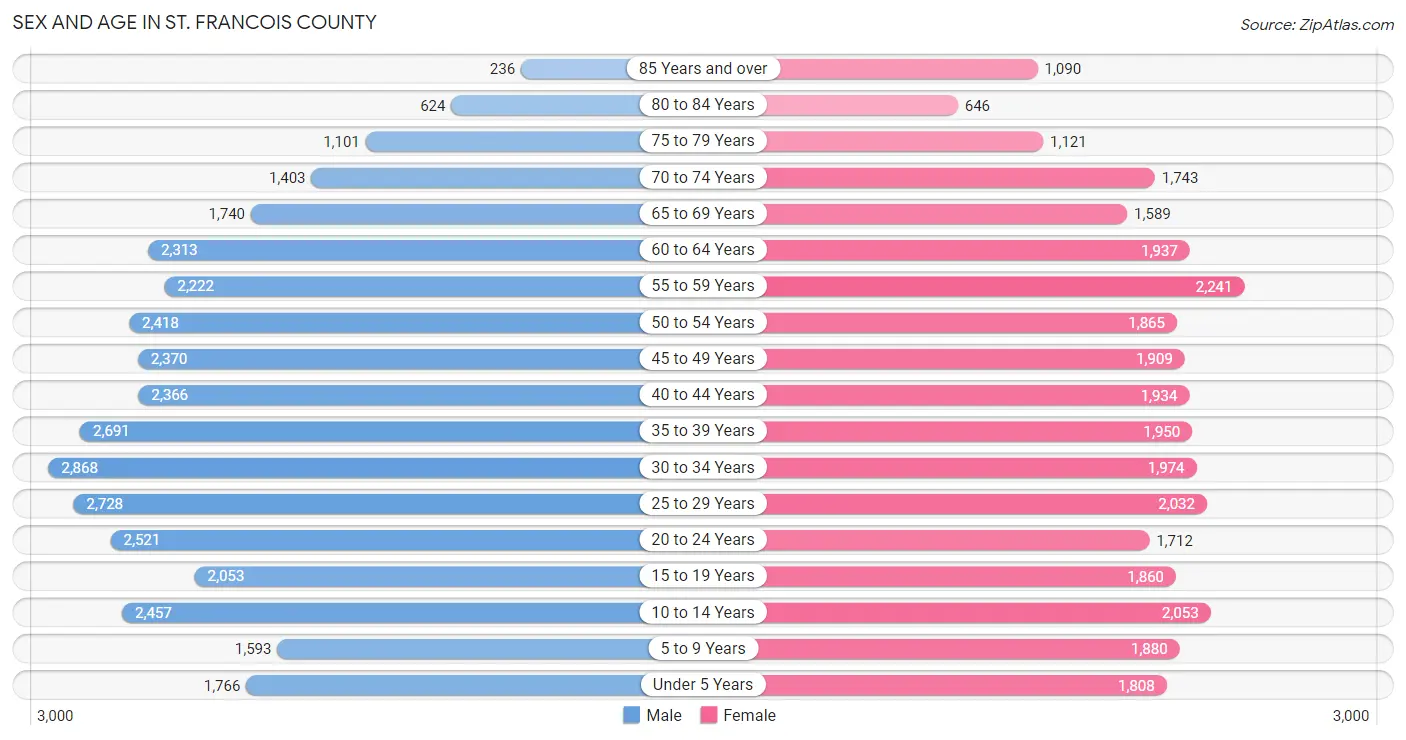
| Age Bracket | Male | Female |
| Under 5 Years | 1,766 (5.0%) | 1,808 (5.8%) |
| 5 to 9 Years | 1,593 (4.5%) | 1,880 (6.0%) |
| 10 to 14 Years | 2,457 (6.9%) | 2,053 (6.6%) |
| 15 to 19 Years | 2,053 (5.8%) | 1,860 (5.9%) |
| 20 to 24 Years | 2,521 (7.1%) | 1,712 (5.5%) |
| 25 to 29 Years | 2,728 (7.7%) | 2,032 (6.5%) |
| 30 to 34 Years | 2,868 (8.1%) | 1,974 (6.3%) |
| 35 to 39 Years | 2,691 (7.6%) | 1,950 (6.2%) |
| 40 to 44 Years | 2,366 (6.7%) | 1,934 (6.2%) |
| 45 to 49 Years | 2,370 (6.7%) | 1,909 (6.1%) |
| 50 to 54 Years | 2,418 (6.8%) | 1,865 (5.9%) |
| 55 to 59 Years | 2,222 (6.3%) | 2,241 (7.1%) |
| 60 to 64 Years | 2,313 (6.5%) | 1,937 (6.2%) |
| 65 to 69 Years | 1,740 (4.9%) | 1,589 (5.1%) |
| 70 to 74 Years | 1,403 (4.0%) | 1,743 (5.6%) |
| 75 to 79 Years | 1,101 (3.1%) | 1,121 (3.6%) |
| 80 to 84 Years | 624 (1.8%) | 646 (2.1%) |
| 85 Years and over | 236 (0.7%) | 1,090 (3.5%) |
| Total | 35,470 (100.0%) | 31,344 (100.0%) |
Families and Households in St. Francois County
Median Family Size in St. Francois County
The median family size in St. Francois County is 3.07 persons per family, with married-couple families (11,504 | 71.7%) accounting for the largest median family size of 3.17 persons per family. On the other hand, single male/father families (1,523 | 9.5%) represent the smallest median family size with 2.81 persons per family.
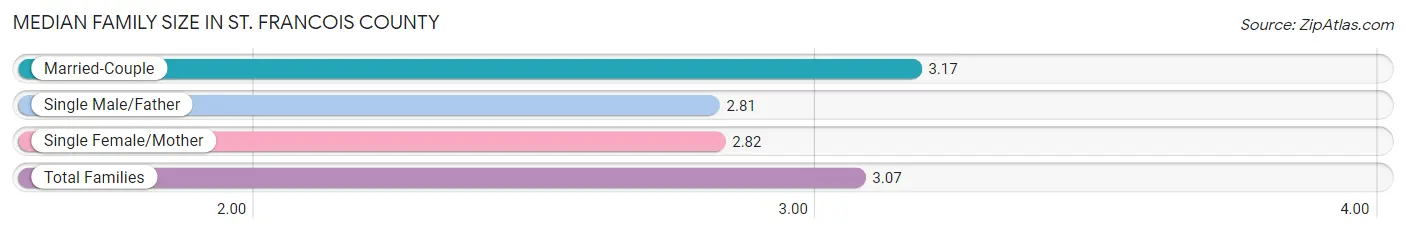
| Family Type | # Families | Family Size |
| Married-Couple | 11,504 (71.7%) | 3.17 |
| Single Male/Father | 1,523 (9.5%) | 2.81 |
| Single Female/Mother | 3,013 (18.8%) | 2.82 |
| Total Families | 16,040 (100.0%) | 3.07 |
Median Household Size in St. Francois County
The median household size in St. Francois County is 2.55 persons per household, with single male/father households (1,523 | 6.4%) accounting for the largest median household size of 3.34 persons per household. non-family households (7,933 | 33.1%) represent the smallest median household size with 1.20 persons per household.
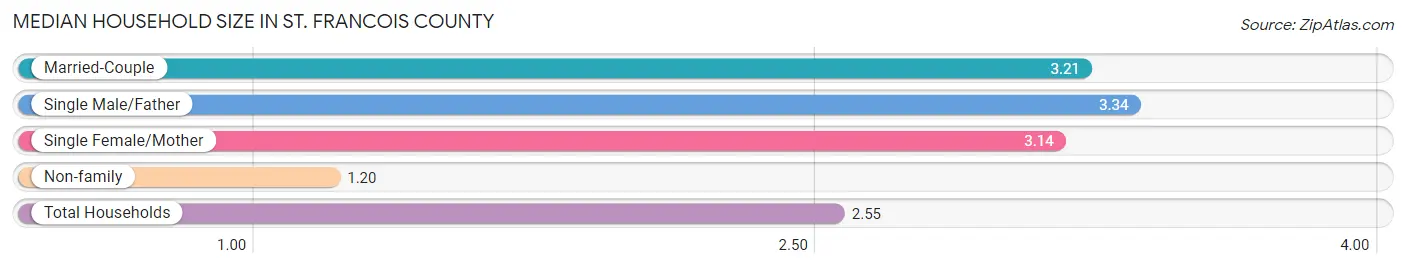
| Household Type | # Households | Household Size |
| Married-Couple | 11,504 (48.0%) | 3.21 |
| Single Male/Father | 1,523 (6.4%) | 3.34 |
| Single Female/Mother | 3,013 (12.6%) | 3.14 |
| Non-family | 7,933 (33.1%) | 1.20 |
| Total Households | 23,973 (100.0%) | 2.55 |
Household Size by Marriage Status in St. Francois County
Out of a total of 23,973 households in St. Francois County, 16,040 (66.9%) are family households, while 7,933 (33.1%) are nonfamily households. The most numerous type of family households are 2-person households, comprising 6,954, and the most common type of nonfamily households are 1-person households, comprising 6,471.
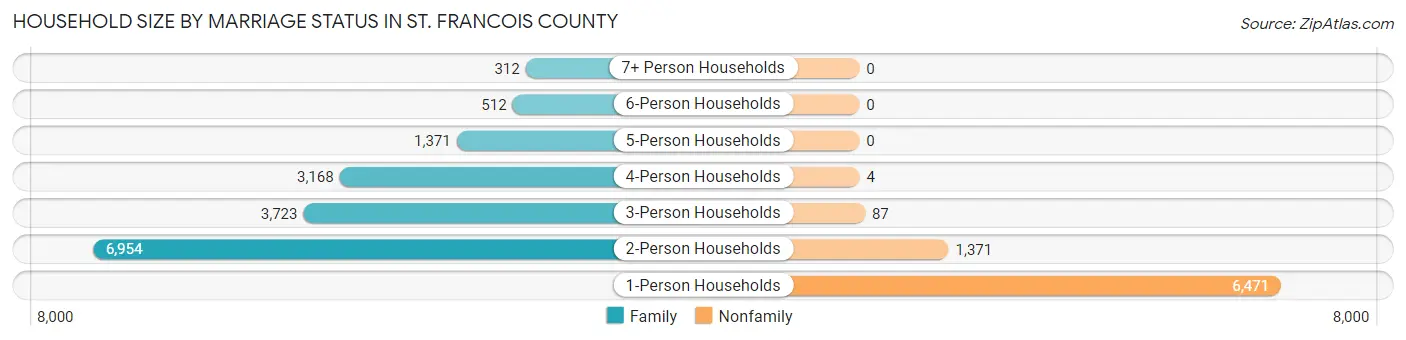
| Household Size | Family Households | Nonfamily Households |
| 1-Person Households | - | 6,471 (27.0%) |
| 2-Person Households | 6,954 (29.0%) | 1,371 (5.7%) |
| 3-Person Households | 3,723 (15.5%) | 87 (0.4%) |
| 4-Person Households | 3,168 (13.2%) | 4 (0.0%) |
| 5-Person Households | 1,371 (5.7%) | 0 (0.0%) |
| 6-Person Households | 512 (2.1%) | 0 (0.0%) |
| 7+ Person Households | 312 (1.3%) | 0 (0.0%) |
| Total | 16,040 (66.9%) | 7,933 (33.1%) |
Female Fertility in St. Francois County
Fertility by Age in St. Francois County
Average fertility rate in St. Francois County is 65.0 births per 1,000 women. Women in the age bracket of 20 to 34 years have the highest fertility rate with 107.0 births per 1,000 women. Women in the age bracket of 20 to 34 years acount for 68.8% of all women with births.
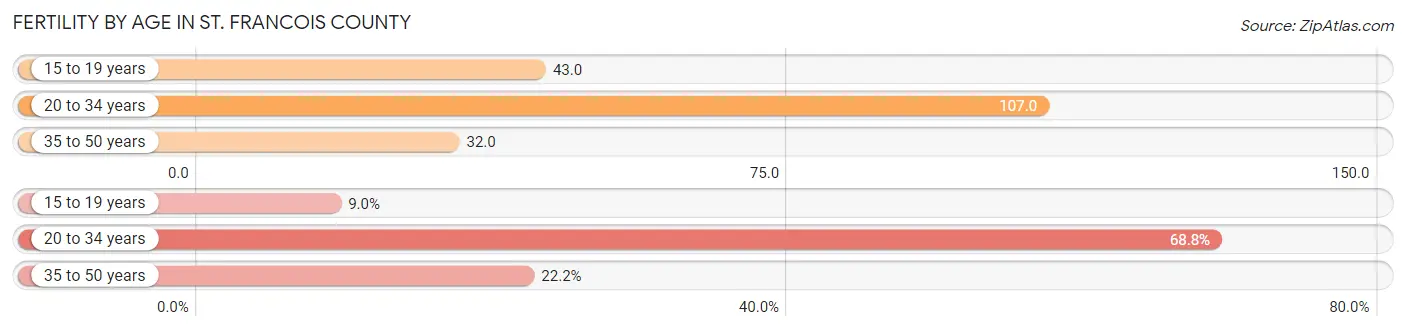
| Age Bracket | Women with Births | Births / 1,000 Women |
| 15 to 19 years | 80 (9.0%) | 43.0 |
| 20 to 34 years | 609 (68.8%) | 107.0 |
| 35 to 50 years | 196 (22.2%) | 32.0 |
| Total | 885 (100.0%) | 65.0 |
Fertility by Age by Marriage Status in St. Francois County
55.6% of women with births (885) in St. Francois County are married. The highest percentage of unmarried women with births falls into 15 to 19 years age bracket with 100.0% of them unmarried at the time of birth, while the lowest percentage of unmarried women with births belong to 35 to 50 years age bracket with 5.6% of them unmarried.
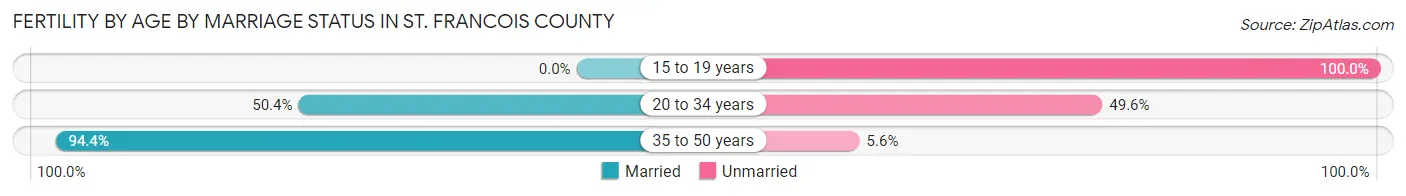
| Age Bracket | Married | Unmarried |
| 15 to 19 years | 0 (0.0%) | 80 (100.0%) |
| 20 to 34 years | 307 (50.4%) | 302 (49.6%) |
| 35 to 50 years | 185 (94.4%) | 11 (5.6%) |
| Total | 492 (55.6%) | 393 (44.4%) |
Fertility by Education in St. Francois County
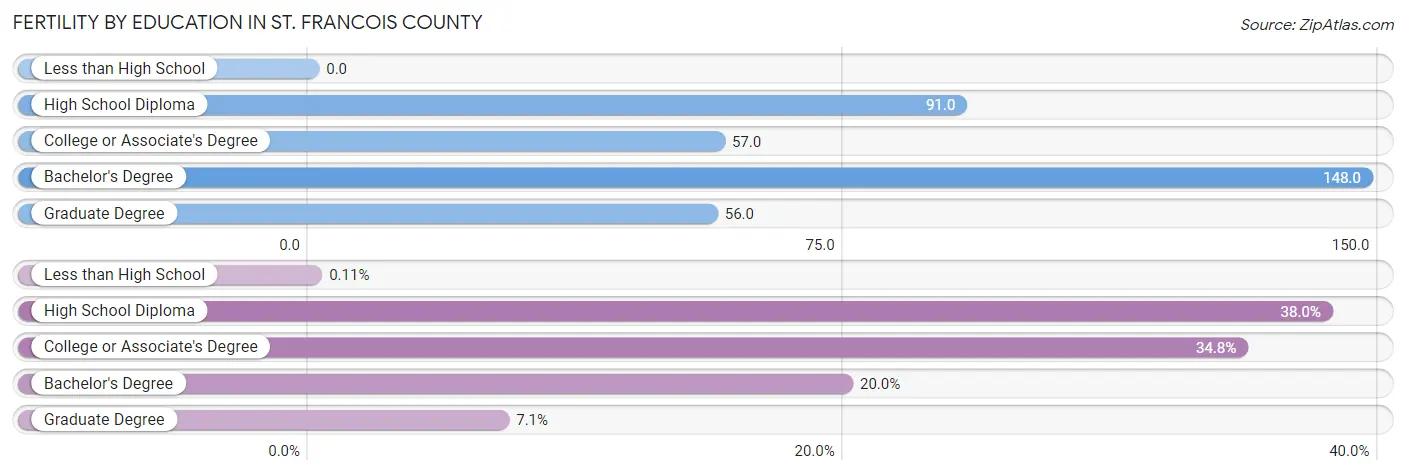
| Educational Attainment | Women with Births | Births / 1,000 Women |
| Less than High School | 1 (0.1%) | 0.0 |
| High School Diploma | 336 (38.0%) | 91.0 |
| College or Associate's Degree | 308 (34.8%) | 57.0 |
| Bachelor's Degree | 177 (20.0%) | 148.0 |
| Graduate Degree | 63 (7.1%) | 56.0 |
| Total | 885 (100.0%) | 65.0 |
Fertility by Education by Marriage Status in St. Francois County
44.4% of women with births in St. Francois County are unmarried. Women with the educational attainment of bachelor's degree are most likely to be married with 100.0% of them married at childbirth, while women with the educational attainment of less than high school are least likely to be married with 100.0% of them unmarried at childbirth.
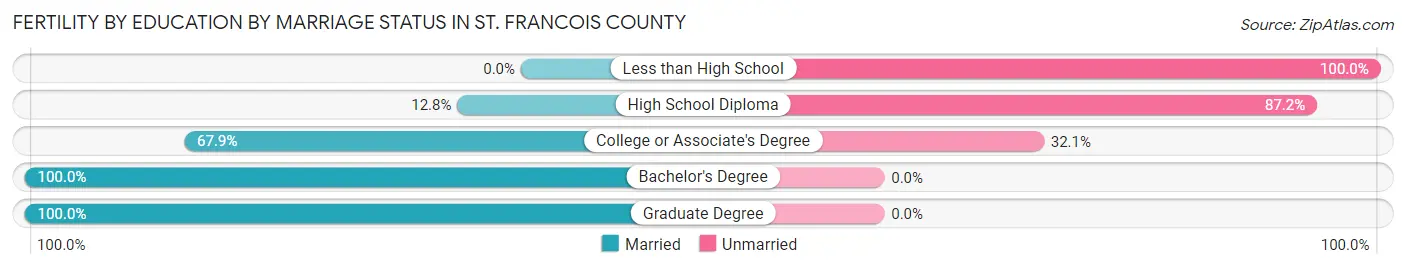
| Educational Attainment | Married | Unmarried |
| Less than High School | 0 (0.0%) | 1 (100.0%) |
| High School Diploma | 43 (12.8%) | 293 (87.2%) |
| College or Associate's Degree | 209 (67.9%) | 99 (32.1%) |
| Bachelor's Degree | 177 (100.0%) | 0 (0.0%) |
| Graduate Degree | 63 (100.0%) | 0 (0.0%) |
| Total | 492 (55.6%) | 393 (44.4%) |
Employment Characteristics in St. Francois County
Employment by Class of Employer in St. Francois County
Among the 26,358 employed individuals in St. Francois County, private company employees (17,833 | 67.7%), state government employees (2,423 | 9.2%), and local government employees (2,166 | 8.2%) make up the most common classes of employment.
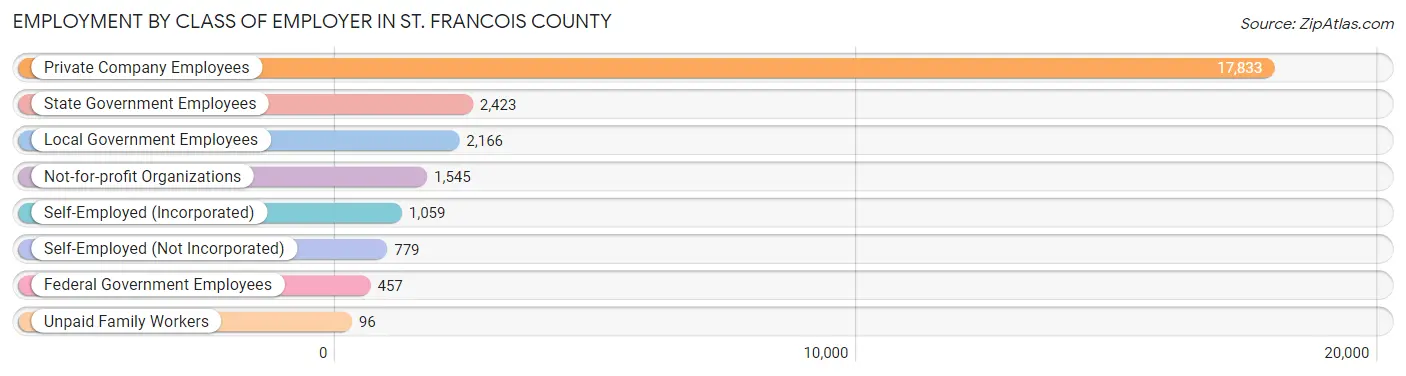
| Employer Class | # Employees | % Employees |
| Private Company Employees | 17,833 | 67.7% |
| Self-Employed (Incorporated) | 1,059 | 4.0% |
| Self-Employed (Not Incorporated) | 779 | 3.0% |
| Not-for-profit Organizations | 1,545 | 5.9% |
| Local Government Employees | 2,166 | 8.2% |
| State Government Employees | 2,423 | 9.2% |
| Federal Government Employees | 457 | 1.7% |
| Unpaid Family Workers | 96 | 0.4% |
| Total | 26,358 | 100.0% |
Employment Status by Age in St. Francois County
According to the labor force statistics for St. Francois County, out of the total population over 16 years of age (54,479), 51.7% or 28,166 individuals are in the labor force, with 4.8% or 1,352 of them unemployed. The age group with the highest labor force participation rate is 20 to 24 years, with 73.3% or 3,103 individuals in the labor force. Within the labor force, the 16 to 19 years age range has the highest percentage of unemployed individuals, with 12.9% or 189 of them being unemployed.
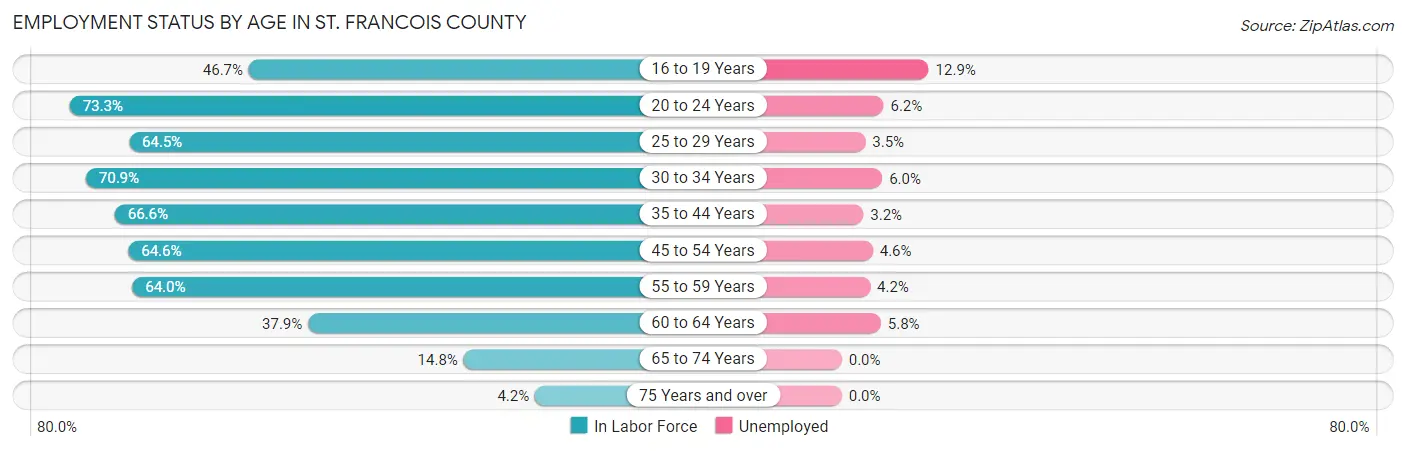
| Age Bracket | In Labor Force | Unemployed |
| 16 to 19 Years | 1,464 (46.7%) | 189 (12.9%) |
| 20 to 24 Years | 3,103 (73.3%) | 192 (6.2%) |
| 25 to 29 Years | 3,070 (64.5%) | 107 (3.5%) |
| 30 to 34 Years | 3,433 (70.9%) | 206 (6.0%) |
| 35 to 44 Years | 5,955 (66.6%) | 191 (3.2%) |
| 45 to 54 Years | 5,531 (64.6%) | 254 (4.6%) |
| 55 to 59 Years | 2,856 (64.0%) | 120 (4.2%) |
| 60 to 64 Years | 1,611 (37.9%) | 93 (5.8%) |
| 65 to 74 Years | 958 (14.8%) | 0 (0.0%) |
| 75 Years and over | 202 (4.2%) | 0 (0.0%) |
| Total | 28,166 (51.7%) | 1,352 (4.8%) |
Employment Status by Educational Attainment in St. Francois County
According to labor force statistics for St. Francois County, 62.7% of individuals (22,458) out of the total population between 25 and 64 years of age (35,818) are in the labor force, with 4.3% or 966 of them being unemployed. The group with the highest labor force participation rate are those with the educational attainment of bachelor's degree or higher, with 84.0% or 4,681 individuals in the labor force. Within the labor force, individuals with less than high school education have the highest percentage of unemployment, with 9.1% or 146 of them being unemployed.
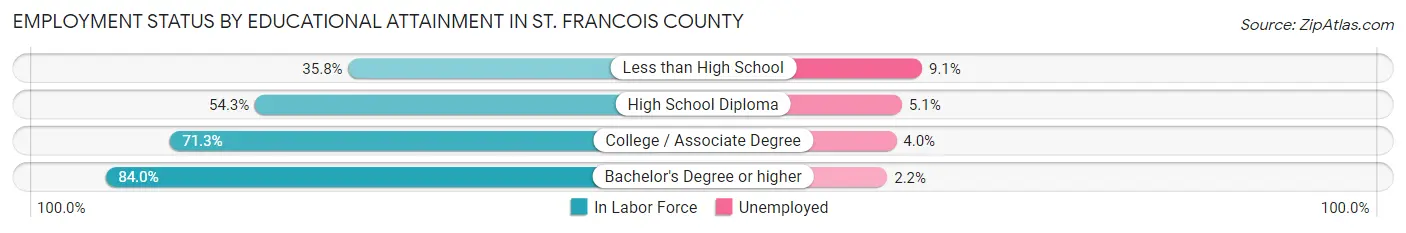
| Educational Attainment | In Labor Force | Unemployed |
| Less than High School | 1,599 (35.8%) | 406 (9.1%) |
| High School Diploma | 7,067 (54.3%) | 664 (5.1%) |
| College / Associate Degree | 9,101 (71.3%) | 511 (4.0%) |
| Bachelor's Degree or higher | 4,681 (84.0%) | 123 (2.2%) |
| Total | 22,458 (62.7%) | 1,540 (4.3%) |
Employment Occupations by Sex in St. Francois County
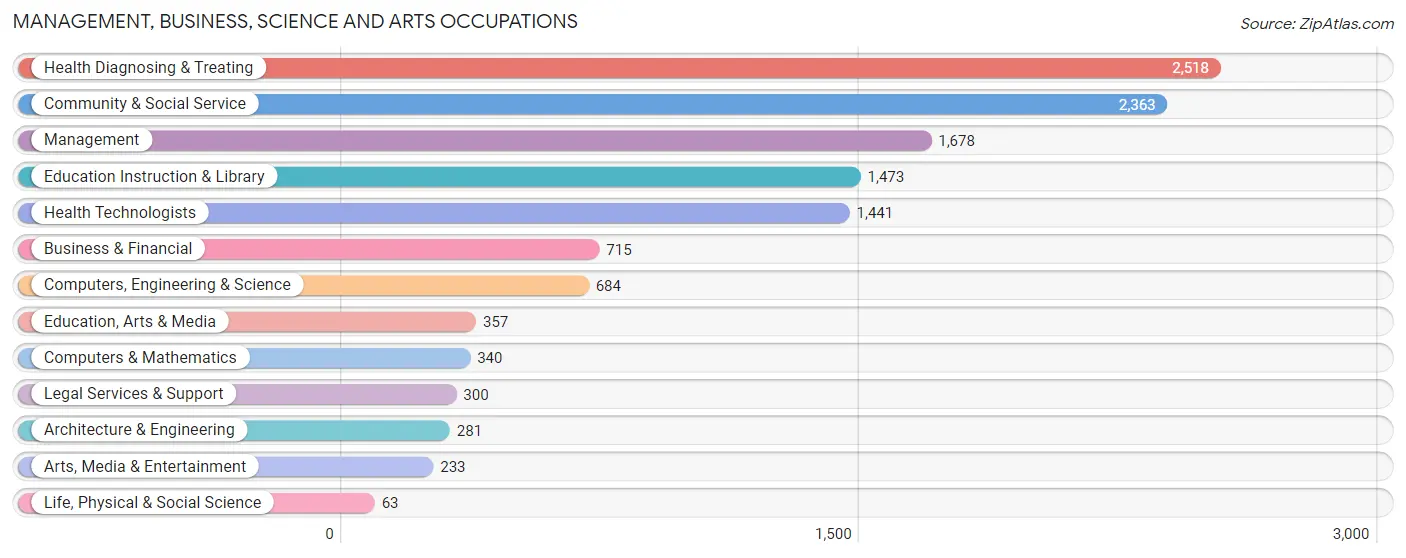
Management, Business, Science and Arts Occupations
The most common Management, Business, Science and Arts occupations in St. Francois County are Health Diagnosing & Treating (2,518 | 9.4%), Community & Social Service (2,363 | 8.8%), Management (1,678 | 6.3%), Education Instruction & Library (1,473 | 5.5%), and Health Technologists (1,441 | 5.4%).
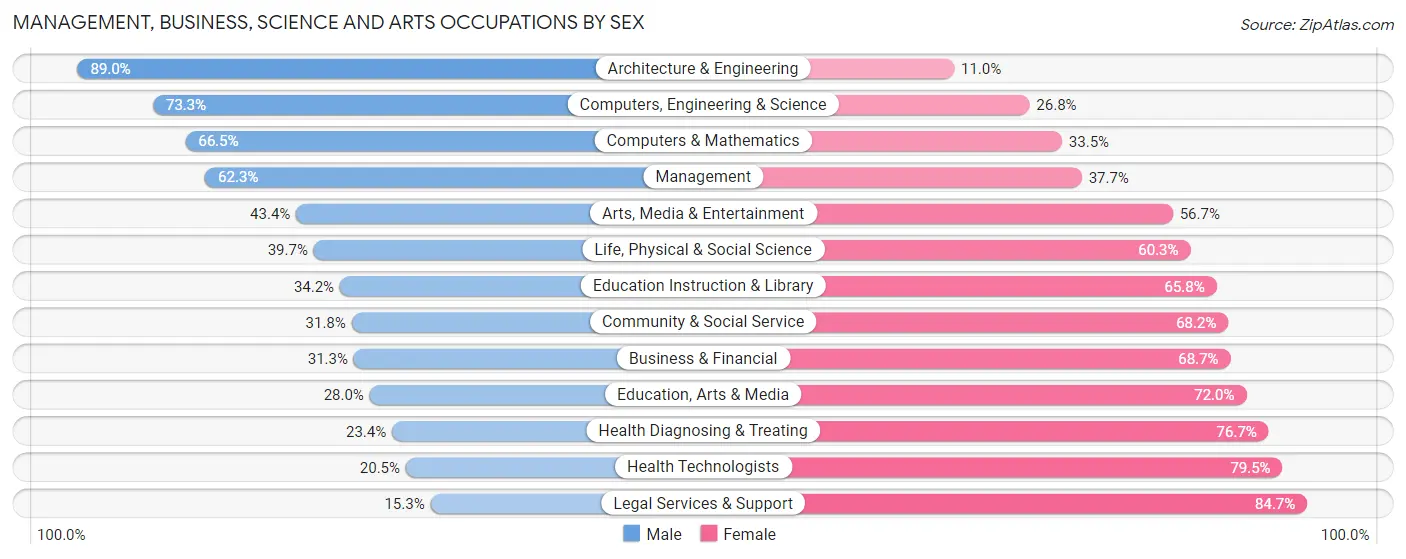
Management, Business, Science and Arts Occupations by Sex
Within the Management, Business, Science and Arts occupations in St. Francois County, the most male-oriented occupations are Architecture & Engineering (89.0%), Computers, Engineering & Science (73.3%), and Computers & Mathematics (66.5%), while the most female-oriented occupations are Legal Services & Support (84.7%), Health Technologists (79.5%), and Health Diagnosing & Treating (76.6%).
| Occupation | Male | Female |
| Management | 1,046 (62.3%) | 632 (37.7%) |
| Business & Financial | 224 (31.3%) | 491 (68.7%) |
| Computers, Engineering & Science | 501 (73.3%) | 183 (26.8%) |
| Computers & Mathematics | 226 (66.5%) | 114 (33.5%) |
| Architecture & Engineering | 250 (89.0%) | 31 (11.0%) |
| Life, Physical & Social Science | 25 (39.7%) | 38 (60.3%) |
| Community & Social Service | 751 (31.8%) | 1,612 (68.2%) |
| Education, Arts & Media | 100 (28.0%) | 257 (72.0%) |
| Legal Services & Support | 46 (15.3%) | 254 (84.7%) |
| Education Instruction & Library | 504 (34.2%) | 969 (65.8%) |
| Arts, Media & Entertainment | 101 (43.3%) | 132 (56.7%) |
| Health Diagnosing & Treating | 588 (23.4%) | 1,930 (76.6%) |
| Health Technologists | 295 (20.5%) | 1,146 (79.5%) |
| Total (Category) | 3,110 (39.1%) | 4,848 (60.9%) |
| Total (Overall) | 14,243 (53.1%) | 12,573 (46.9%) |
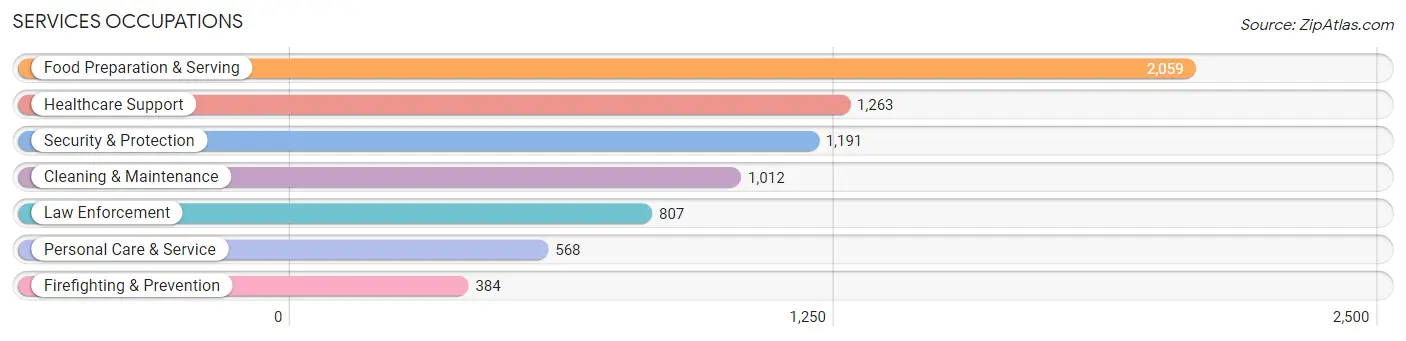
Services Occupations
The most common Services occupations in St. Francois County are Food Preparation & Serving (2,059 | 7.7%), Healthcare Support (1,263 | 4.7%), Security & Protection (1,191 | 4.4%), Cleaning & Maintenance (1,012 | 3.8%), and Law Enforcement (807 | 3.0%).
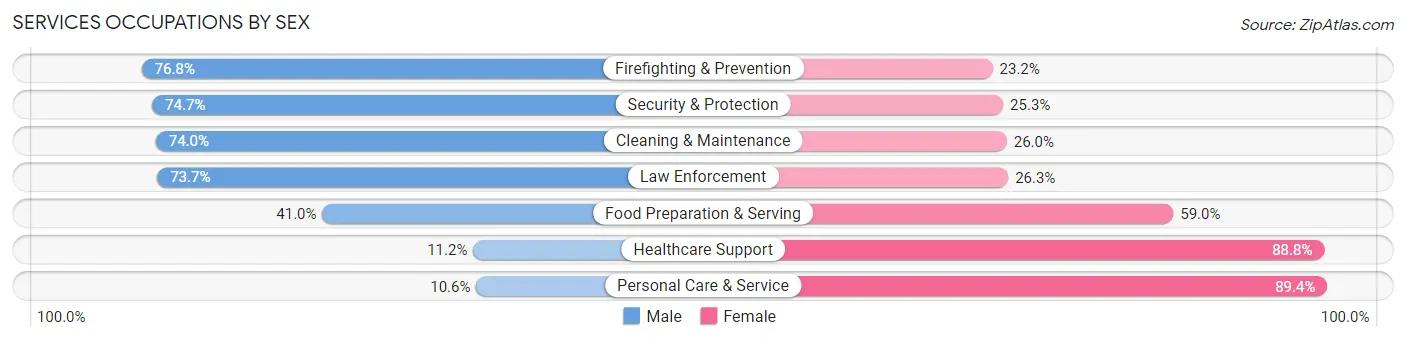
Services Occupations by Sex
Within the Services occupations in St. Francois County, the most male-oriented occupations are Firefighting & Prevention (76.8%), Security & Protection (74.7%), and Cleaning & Maintenance (74.0%), while the most female-oriented occupations are Personal Care & Service (89.4%), Healthcare Support (88.8%), and Food Preparation & Serving (59.0%).
| Occupation | Male | Female |
| Healthcare Support | 141 (11.2%) | 1,122 (88.8%) |
| Security & Protection | 890 (74.7%) | 301 (25.3%) |
| Firefighting & Prevention | 295 (76.8%) | 89 (23.2%) |
| Law Enforcement | 595 (73.7%) | 212 (26.3%) |
| Food Preparation & Serving | 845 (41.0%) | 1,214 (59.0%) |
| Cleaning & Maintenance | 749 (74.0%) | 263 (26.0%) |
| Personal Care & Service | 60 (10.6%) | 508 (89.4%) |
| Total (Category) | 2,685 (44.1%) | 3,408 (55.9%) |
| Total (Overall) | 14,243 (53.1%) | 12,573 (46.9%) |
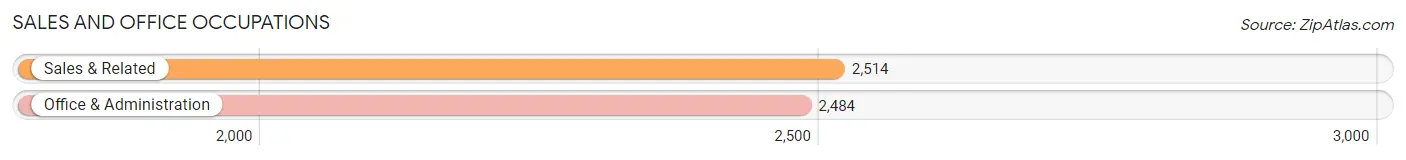
Sales and Office Occupations
The most common Sales and Office occupations in St. Francois County are Sales & Related (2,514 | 9.4%), and Office & Administration (2,484 | 9.3%).
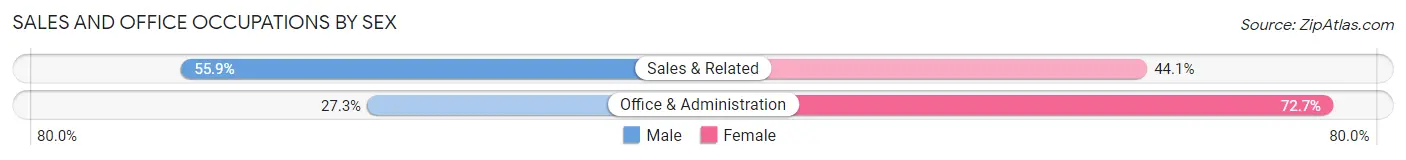
Sales and Office Occupations by Sex
| Occupation | Male | Female |
| Sales & Related | 1,405 (55.9%) | 1,109 (44.1%) |
| Office & Administration | 679 (27.3%) | 1,805 (72.7%) |
| Total (Category) | 2,084 (41.7%) | 2,914 (58.3%) |
| Total (Overall) | 14,243 (53.1%) | 12,573 (46.9%) |
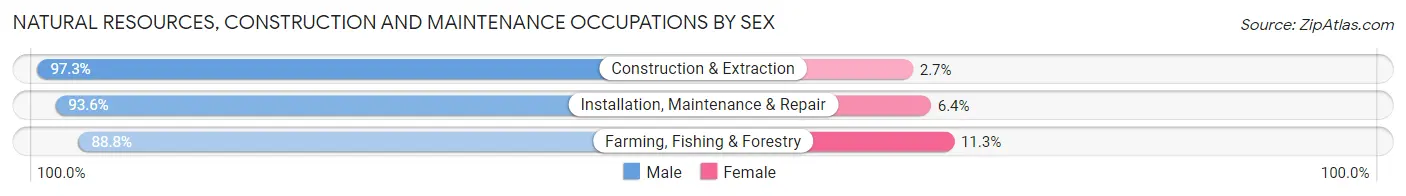
Natural Resources, Construction and Maintenance Occupations
The most common Natural Resources, Construction and Maintenance occupations in St. Francois County are Construction & Extraction (1,791 | 6.7%), Installation, Maintenance & Repair (1,012 | 3.8%), and Farming, Fishing & Forestry (80 | 0.3%).

Natural Resources, Construction and Maintenance Occupations by Sex
| Occupation | Male | Female |
| Farming, Fishing & Forestry | 71 (88.7%) | 9 (11.3%) |
| Construction & Extraction | 1,743 (97.3%) | 48 (2.7%) |
| Installation, Maintenance & Repair | 947 (93.6%) | 65 (6.4%) |
| Total (Category) | 2,761 (95.8%) | 122 (4.2%) |
| Total (Overall) | 14,243 (53.1%) | 12,573 (46.9%) |
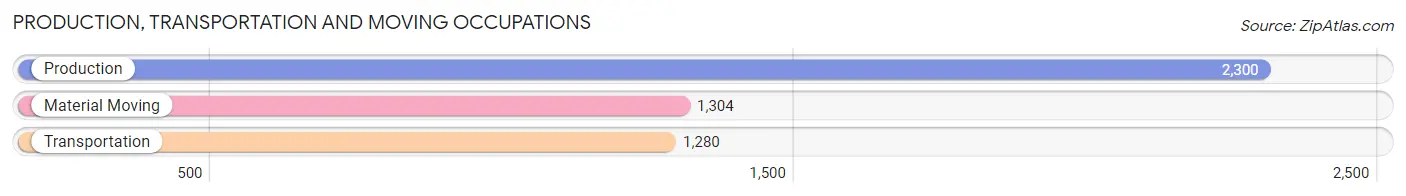
Production, Transportation and Moving Occupations
The most common Production, Transportation and Moving occupations in St. Francois County are Production (2,300 | 8.6%), Material Moving (1,304 | 4.9%), and Transportation (1,280 | 4.8%).
Production, Transportation and Moving Occupations by Sex
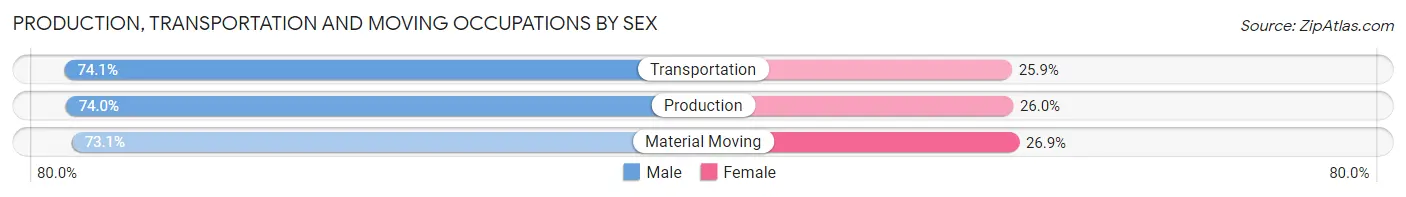
| Occupation | Male | Female |
| Production | 1,701 (74.0%) | 599 (26.0%) |
| Transportation | 949 (74.1%) | 331 (25.9%) |
| Material Moving | 953 (73.1%) | 351 (26.9%) |
| Total (Category) | 3,603 (73.8%) | 1,281 (26.2%) |
| Total (Overall) | 14,243 (53.1%) | 12,573 (46.9%) |
Employment Industries by Sex in St. Francois County
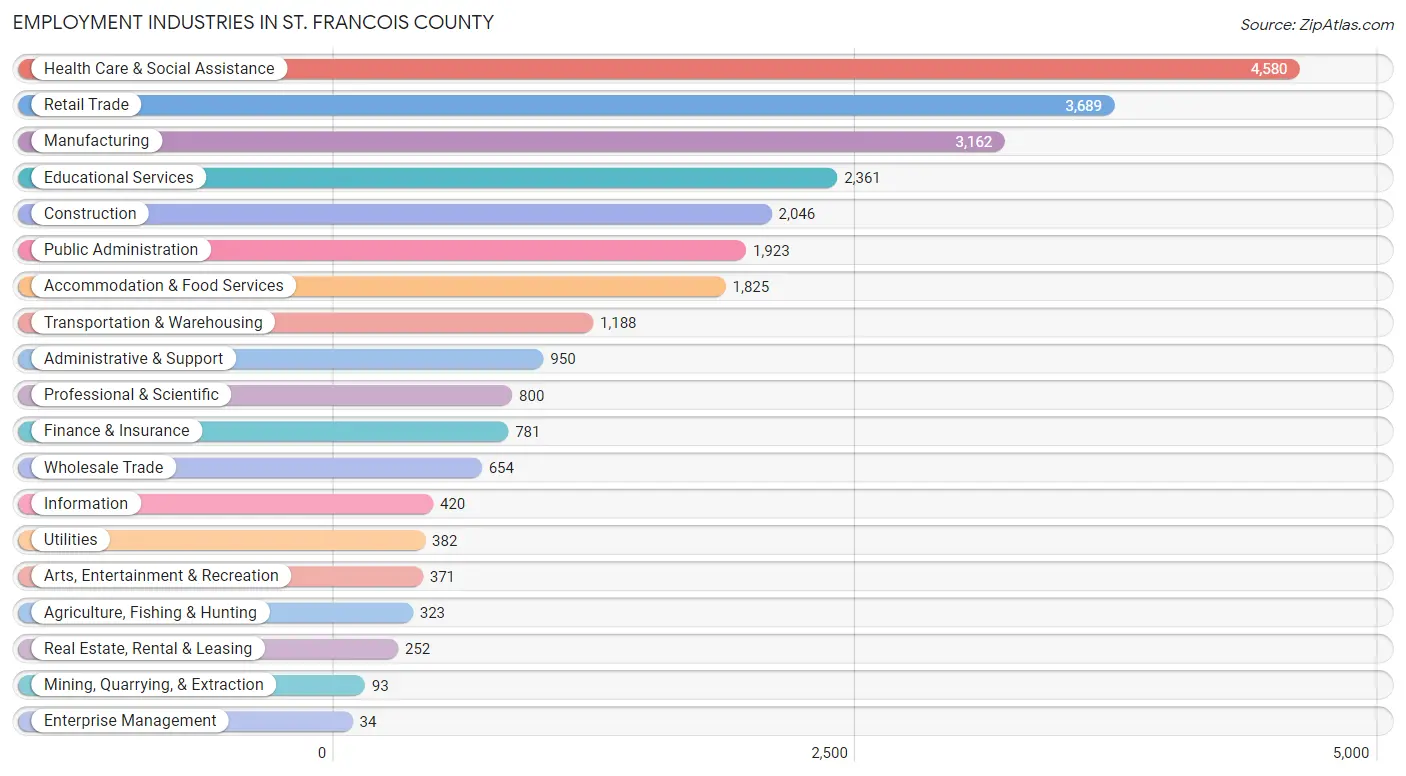
Employment Industries in St. Francois County
The major employment industries in St. Francois County include Health Care & Social Assistance (4,580 | 17.1%), Retail Trade (3,689 | 13.8%), Manufacturing (3,162 | 11.8%), Educational Services (2,361 | 8.8%), and Construction (2,046 | 7.6%).
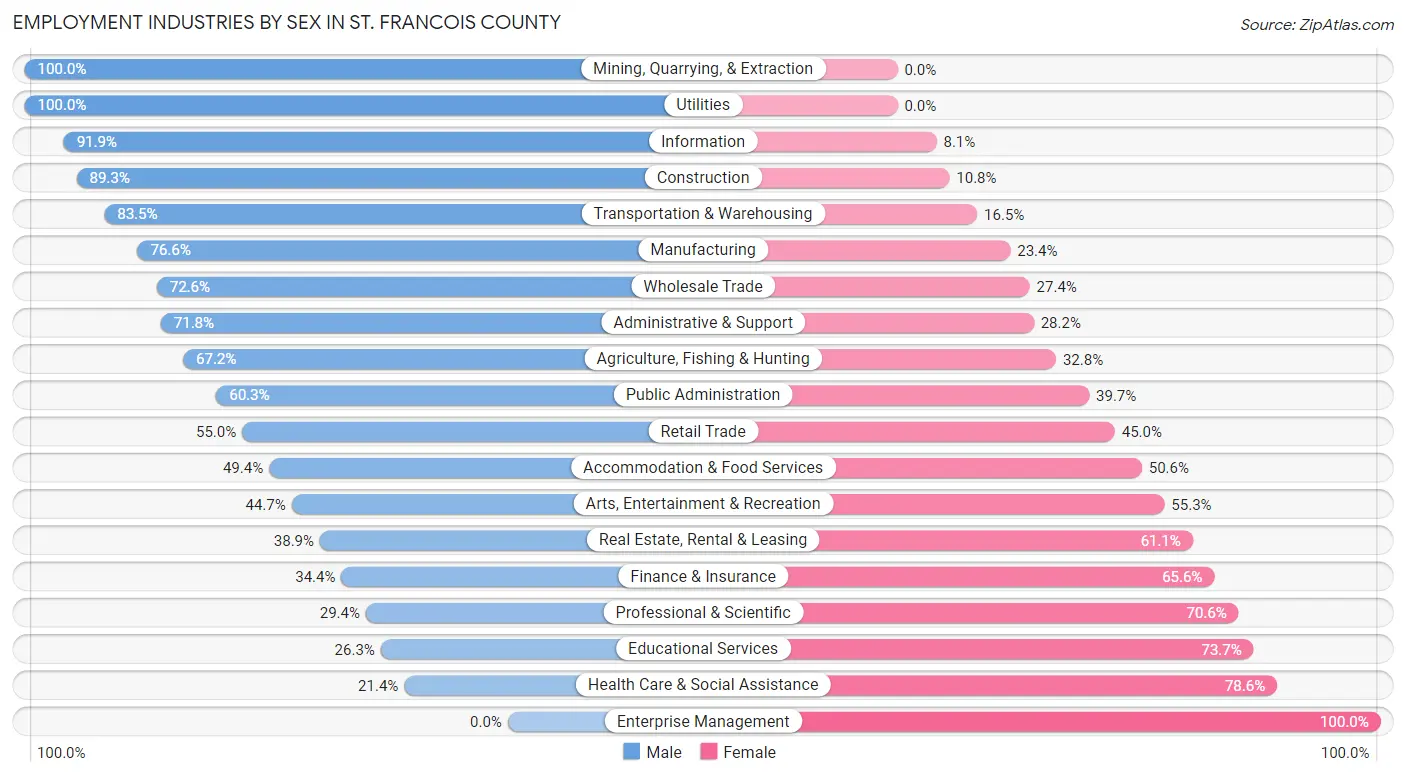
Employment Industries by Sex in St. Francois County
The St. Francois County industries that see more men than women are Mining, Quarrying, & Extraction (100.0%), Utilities (100.0%), and Information (91.9%), whereas the industries that tend to have a higher number of women are Enterprise Management (100.0%), Health Care & Social Assistance (78.6%), and Educational Services (73.7%).
| Industry | Male | Female |
| Agriculture, Fishing & Hunting | 217 (67.2%) | 106 (32.8%) |
| Mining, Quarrying, & Extraction | 93 (100.0%) | 0 (0.0%) |
| Construction | 1,826 (89.2%) | 220 (10.7%) |
| Manufacturing | 2,423 (76.6%) | 739 (23.4%) |
| Wholesale Trade | 475 (72.6%) | 179 (27.4%) |
| Retail Trade | 2,029 (55.0%) | 1,660 (45.0%) |
| Transportation & Warehousing | 992 (83.5%) | 196 (16.5%) |
| Utilities | 382 (100.0%) | 0 (0.0%) |
| Information | 386 (91.9%) | 34 (8.1%) |
| Finance & Insurance | 269 (34.4%) | 512 (65.6%) |
| Real Estate, Rental & Leasing | 98 (38.9%) | 154 (61.1%) |
| Professional & Scientific | 235 (29.4%) | 565 (70.6%) |
| Enterprise Management | 0 (0.0%) | 34 (100.0%) |
| Administrative & Support | 682 (71.8%) | 268 (28.2%) |
| Educational Services | 621 (26.3%) | 1,740 (73.7%) |
| Health Care & Social Assistance | 982 (21.4%) | 3,598 (78.6%) |
| Arts, Entertainment & Recreation | 166 (44.7%) | 205 (55.3%) |
| Accommodation & Food Services | 902 (49.4%) | 923 (50.6%) |
| Public Administration | 1,160 (60.3%) | 763 (39.7%) |
| Total | 14,243 (53.1%) | 12,573 (46.9%) |
Education in St. Francois County
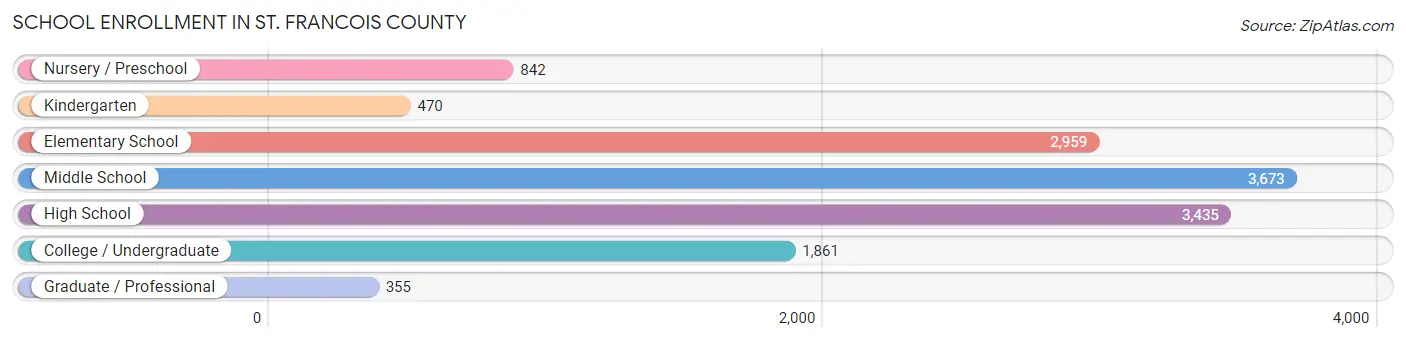
School Enrollment in St. Francois County
The most common levels of schooling among the 13,595 students in St. Francois County are middle school (3,673 | 27.0%), high school (3,435 | 25.3%), and elementary school (2,959 | 21.8%).
| School Level | # Students | % Students |
| Nursery / Preschool | 842 | 6.2% |
| Kindergarten | 470 | 3.5% |
| Elementary School | 2,959 | 21.8% |
| Middle School | 3,673 | 27.0% |
| High School | 3,435 | 25.3% |
| College / Undergraduate | 1,861 | 13.7% |
| Graduate / Professional | 355 | 2.6% |
| Total | 13,595 | 100.0% |
School Enrollment by Age by Funding Source in St. Francois County
Out of a total of 13,595 students who are enrolled in schools in St. Francois County, 1,455 (10.7%) attend a private institution, while the remaining 12,140 (89.3%) are enrolled in public schools. The age group of 35 years and over has the highest likelihood of being enrolled in private schools, with 350 (46.2% in the age bracket) enrolled. Conversely, the age group of 15 to 17 year olds has the lowest likelihood of being enrolled in a private school, with 2,384 (95.6% in the age bracket) attending a public institution.
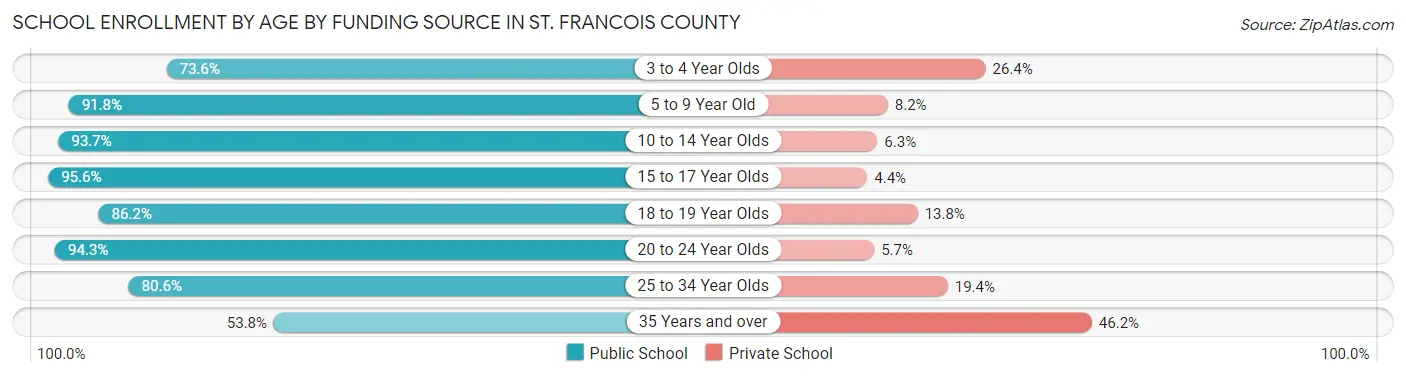
| Age Bracket | Public School | Private School |
| 3 to 4 Year Olds | 420 (73.6%) | 151 (26.4%) |
| 5 to 9 Year Old | 2,833 (91.8%) | 254 (8.2%) |
| 10 to 14 Year Olds | 4,151 (93.7%) | 278 (6.3%) |
| 15 to 17 Year Olds | 2,384 (95.6%) | 110 (4.4%) |
| 18 to 19 Year Olds | 800 (86.2%) | 128 (13.8%) |
| 20 to 24 Year Olds | 514 (94.3%) | 31 (5.7%) |
| 25 to 34 Year Olds | 632 (80.6%) | 152 (19.4%) |
| 35 Years and over | 407 (53.8%) | 350 (46.2%) |
| Total | 12,140 (89.3%) | 1,455 (10.7%) |
Educational Attainment by Field of Study in St. Francois County
Education (1,687 | 21.0%), business (1,528 | 19.1%), science & technology (1,322 | 16.5%), arts & humanities (726 | 9.0%), and psychology (544 | 6.8%) are the most common fields of study among 8,018 individuals in St. Francois County who have obtained a bachelor's degree or higher.
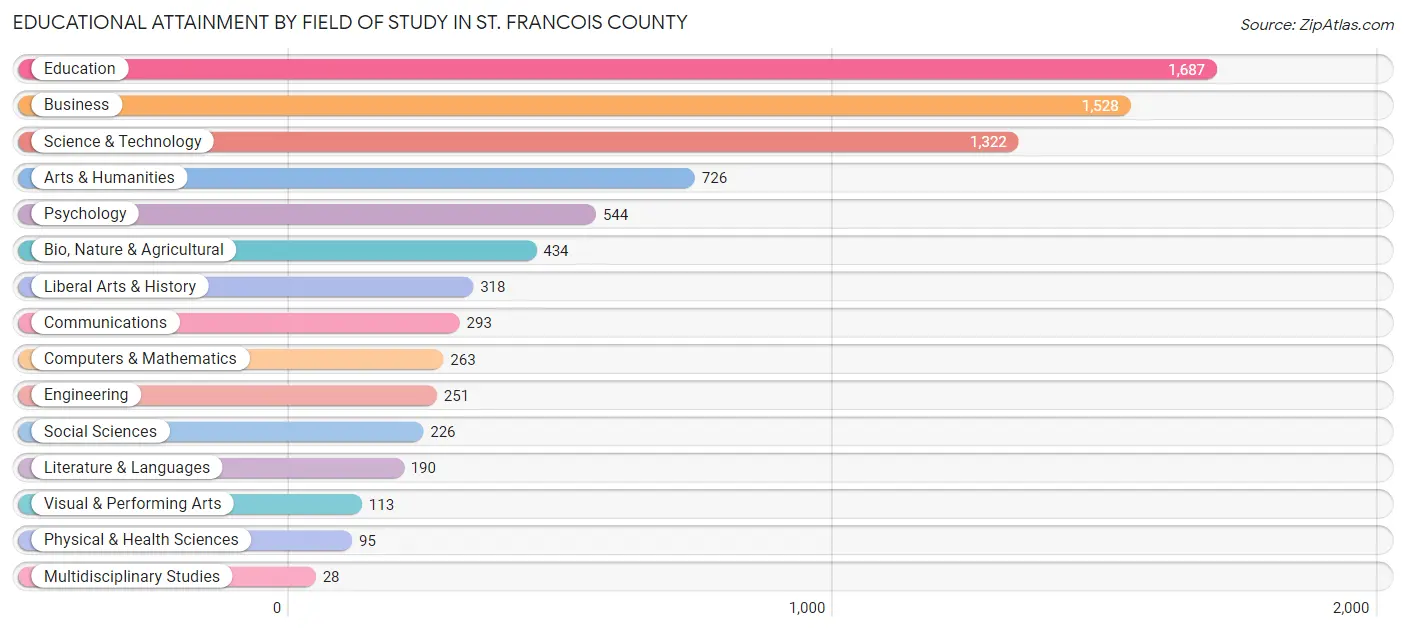
| Field of Study | # Graduates | % Graduates |
| Computers & Mathematics | 263 | 3.3% |
| Bio, Nature & Agricultural | 434 | 5.4% |
| Physical & Health Sciences | 95 | 1.2% |
| Psychology | 544 | 6.8% |
| Social Sciences | 226 | 2.8% |
| Engineering | 251 | 3.1% |
| Multidisciplinary Studies | 28 | 0.4% |
| Science & Technology | 1,322 | 16.5% |
| Business | 1,528 | 19.1% |
| Education | 1,687 | 21.0% |
| Literature & Languages | 190 | 2.4% |
| Liberal Arts & History | 318 | 4.0% |
| Visual & Performing Arts | 113 | 1.4% |
| Communications | 293 | 3.6% |
| Arts & Humanities | 726 | 9.0% |
| Total | 8,018 | 100.0% |
Transportation & Commute in St. Francois County
Vehicle Availability by Sex in St. Francois County
The most prevalent vehicle ownership categories in St. Francois County are males with 2 vehicles (5,052, accounting for 36.3%) and females with 2 vehicles (4,698, making up 40.7%).
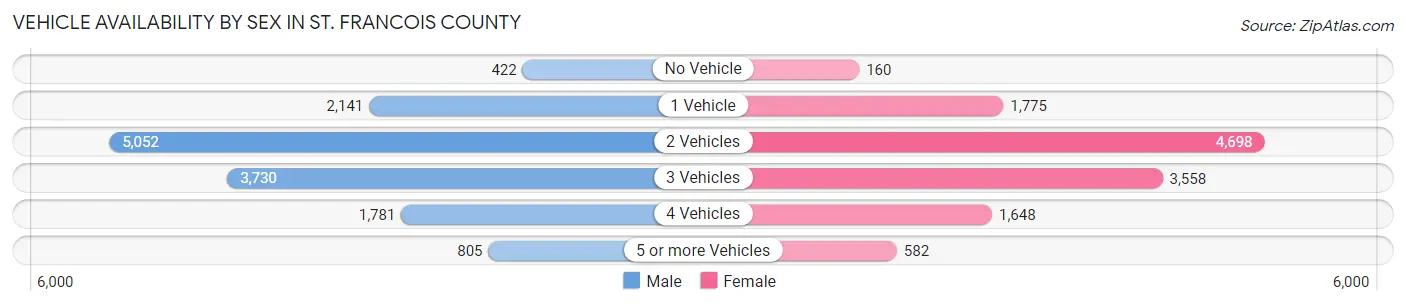
| Vehicles Available | Male | Female |
| No Vehicle | 422 (3.0%) | 160 (1.3%) |
| 1 Vehicle | 2,141 (15.4%) | 1,775 (14.3%) |
| 2 Vehicles | 5,052 (36.3%) | 4,698 (37.8%) |
| 3 Vehicles | 3,730 (26.8%) | 3,558 (28.6%) |
| 4 Vehicles | 1,781 (12.8%) | 1,648 (13.3%) |
| 5 or more Vehicles | 805 (5.8%) | 582 (4.7%) |
| Total | 13,931 (100.0%) | 12,421 (100.0%) |
Commute Time in St. Francois County
The most frequently occuring commute durations in St. Francois County are 15 to 19 minutes (5,106 commuters, 20.5%), 10 to 14 minutes (3,693 commuters, 14.8%), and 5 to 9 minutes (3,568 commuters, 14.3%).
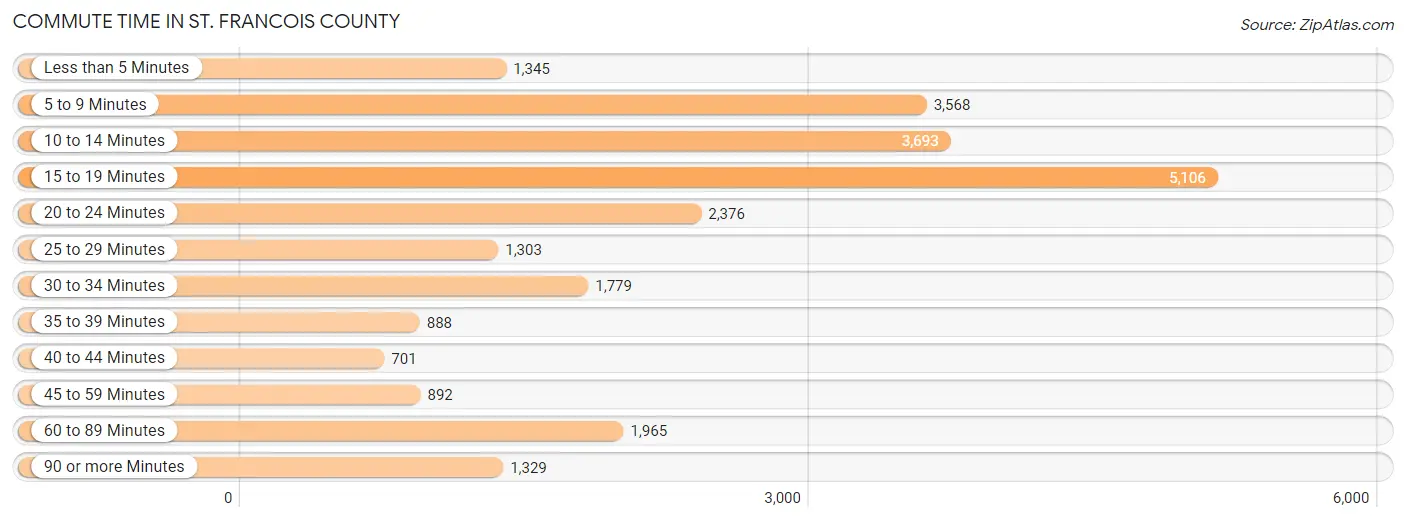
| Commute Time | # Commuters | % Commuters |
| Less than 5 Minutes | 1,345 | 5.4% |
| 5 to 9 Minutes | 3,568 | 14.3% |
| 10 to 14 Minutes | 3,693 | 14.8% |
| 15 to 19 Minutes | 5,106 | 20.5% |
| 20 to 24 Minutes | 2,376 | 9.5% |
| 25 to 29 Minutes | 1,303 | 5.2% |
| 30 to 34 Minutes | 1,779 | 7.1% |
| 35 to 39 Minutes | 888 | 3.6% |
| 40 to 44 Minutes | 701 | 2.8% |
| 45 to 59 Minutes | 892 | 3.6% |
| 60 to 89 Minutes | 1,965 | 7.9% |
| 90 or more Minutes | 1,329 | 5.3% |
Commute Time by Sex in St. Francois County
The most common commute times in St. Francois County are 15 to 19 minutes (2,200 commuters, 16.4%) for males and 15 to 19 minutes (2,906 commuters, 25.2%) for females.
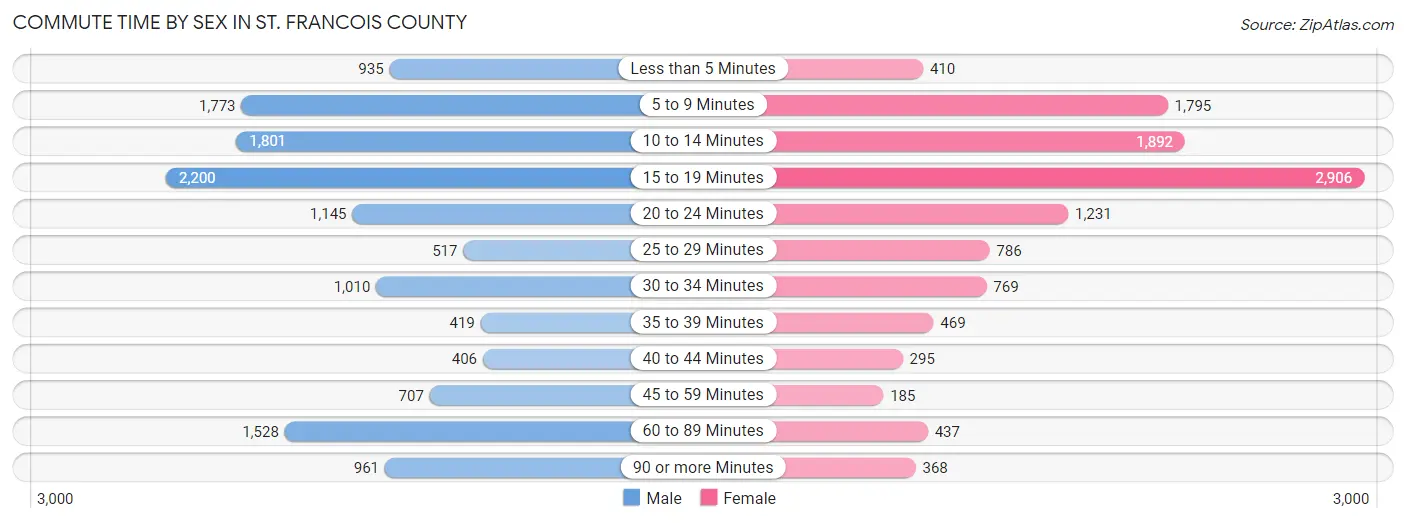
| Commute Time | Male | Female |
| Less than 5 Minutes | 935 (7.0%) | 410 (3.5%) |
| 5 to 9 Minutes | 1,773 (13.2%) | 1,795 (15.5%) |
| 10 to 14 Minutes | 1,801 (13.4%) | 1,892 (16.4%) |
| 15 to 19 Minutes | 2,200 (16.4%) | 2,906 (25.2%) |
| 20 to 24 Minutes | 1,145 (8.5%) | 1,231 (10.7%) |
| 25 to 29 Minutes | 517 (3.9%) | 786 (6.8%) |
| 30 to 34 Minutes | 1,010 (7.5%) | 769 (6.7%) |
| 35 to 39 Minutes | 419 (3.1%) | 469 (4.1%) |
| 40 to 44 Minutes | 406 (3.0%) | 295 (2.6%) |
| 45 to 59 Minutes | 707 (5.3%) | 185 (1.6%) |
| 60 to 89 Minutes | 1,528 (11.4%) | 437 (3.8%) |
| 90 or more Minutes | 961 (7.2%) | 368 (3.2%) |
Time of Departure to Work by Sex in St. Francois County
The most frequent times of departure to work in St. Francois County are 12:00 AM to 4:59 AM (1,684, 12.6%) for males and 7:00 AM to 7:29 AM (2,031, 17.6%) for females.
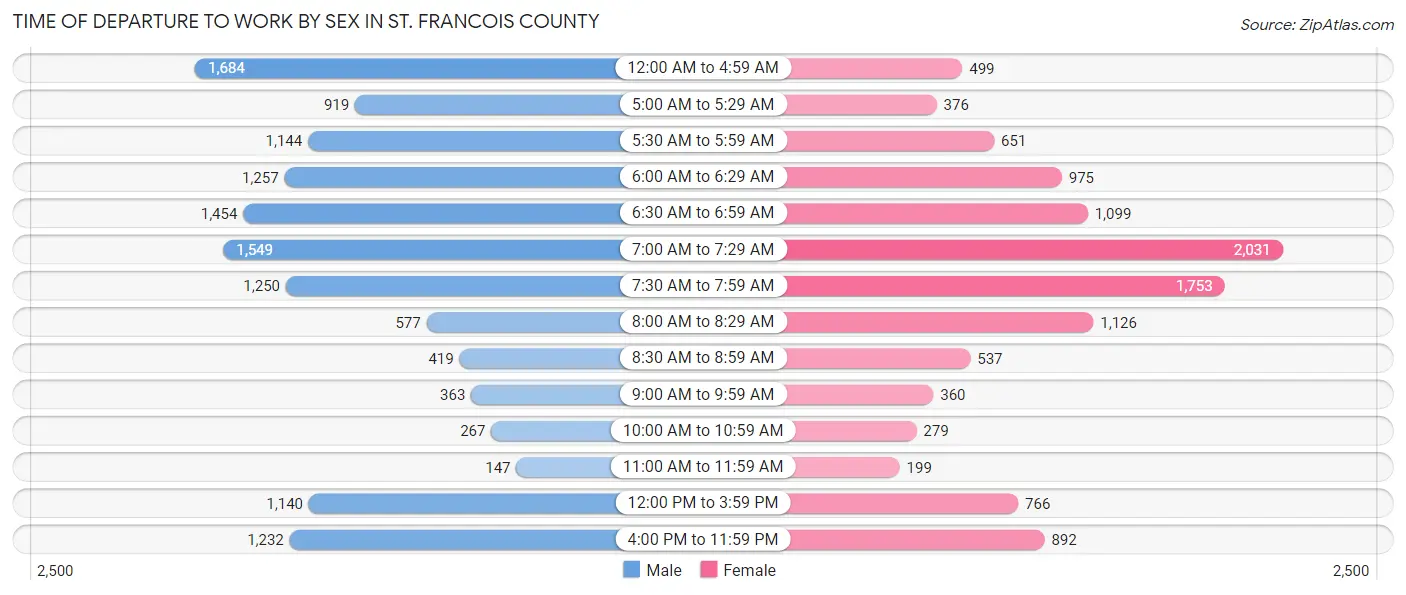
| Time of Departure | Male | Female |
| 12:00 AM to 4:59 AM | 1,684 (12.6%) | 499 (4.3%) |
| 5:00 AM to 5:29 AM | 919 (6.9%) | 376 (3.3%) |
| 5:30 AM to 5:59 AM | 1,144 (8.5%) | 651 (5.6%) |
| 6:00 AM to 6:29 AM | 1,257 (9.4%) | 975 (8.5%) |
| 6:30 AM to 6:59 AM | 1,454 (10.8%) | 1,099 (9.5%) |
| 7:00 AM to 7:29 AM | 1,549 (11.6%) | 2,031 (17.6%) |
| 7:30 AM to 7:59 AM | 1,250 (9.3%) | 1,753 (15.2%) |
| 8:00 AM to 8:29 AM | 577 (4.3%) | 1,126 (9.8%) |
| 8:30 AM to 8:59 AM | 419 (3.1%) | 537 (4.6%) |
| 9:00 AM to 9:59 AM | 363 (2.7%) | 360 (3.1%) |
| 10:00 AM to 10:59 AM | 267 (2.0%) | 279 (2.4%) |
| 11:00 AM to 11:59 AM | 147 (1.1%) | 199 (1.7%) |
| 12:00 PM to 3:59 PM | 1,140 (8.5%) | 766 (6.6%) |
| 4:00 PM to 11:59 PM | 1,232 (9.2%) | 892 (7.7%) |
| Total | 13,402 (100.0%) | 11,543 (100.0%) |
Housing Occupancy in St. Francois County
Occupancy by Ownership in St. Francois County
Of the total 23,973 dwellings in St. Francois County, owner-occupied units account for 16,575 (69.1%), while renter-occupied units make up 7,398 (30.9%).
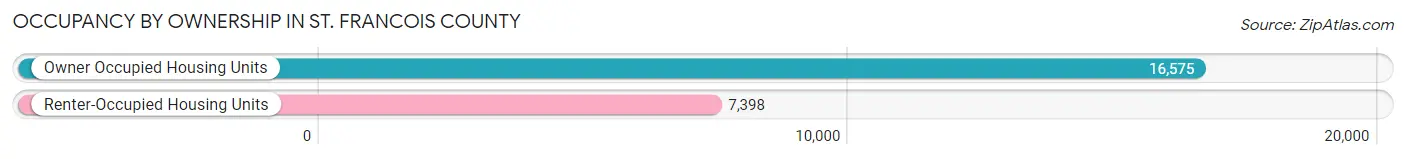
| Occupancy | # Housing Units | % Housing Units |
| Owner Occupied Housing Units | 16,575 | 69.1% |
| Renter-Occupied Housing Units | 7,398 | 30.9% |
| Total Occupied Housing Units | 23,973 | 100.0% |
Occupancy by Household Size in St. Francois County
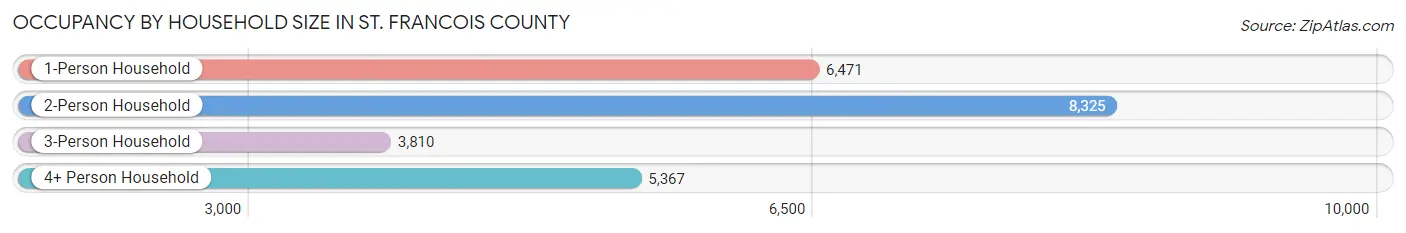
| Household Size | # Housing Units | % Housing Units |
| 1-Person Household | 6,471 | 27.0% |
| 2-Person Household | 8,325 | 34.7% |
| 3-Person Household | 3,810 | 15.9% |
| 4+ Person Household | 5,367 | 22.4% |
| Total Housing Units | 23,973 | 100.0% |
Occupancy by Ownership by Household Size in St. Francois County
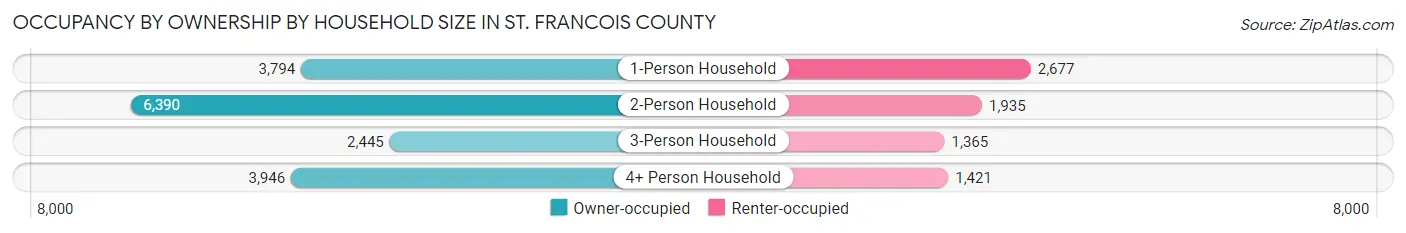
| Household Size | Owner-occupied | Renter-occupied |
| 1-Person Household | 3,794 (58.6%) | 2,677 (41.4%) |
| 2-Person Household | 6,390 (76.8%) | 1,935 (23.2%) |
| 3-Person Household | 2,445 (64.2%) | 1,365 (35.8%) |
| 4+ Person Household | 3,946 (73.5%) | 1,421 (26.5%) |
| Total Housing Units | 16,575 (69.1%) | 7,398 (30.9%) |
Occupancy by Educational Attainment in St. Francois County
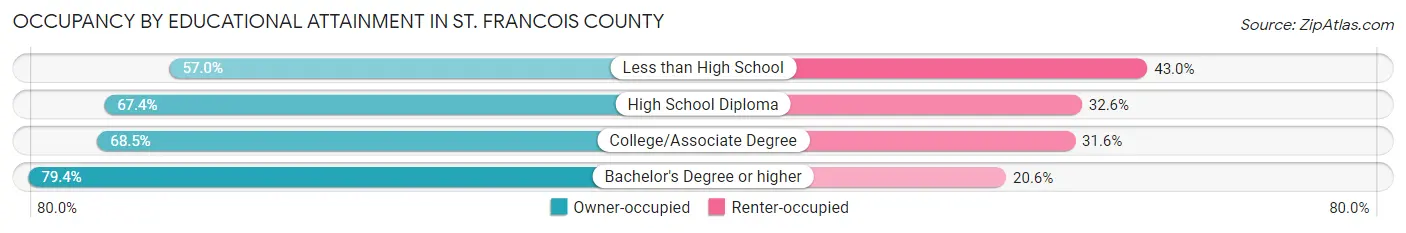
| Household Size | Owner-occupied | Renter-occupied |
| Less than High School | 1,238 (57.0%) | 934 (43.0%) |
| High School Diploma | 5,523 (67.4%) | 2,675 (32.6%) |
| College/Associate Degree | 6,169 (68.4%) | 2,843 (31.6%) |
| Bachelor's Degree or higher | 3,645 (79.4%) | 946 (20.6%) |
Occupancy by Age of Householder in St. Francois County
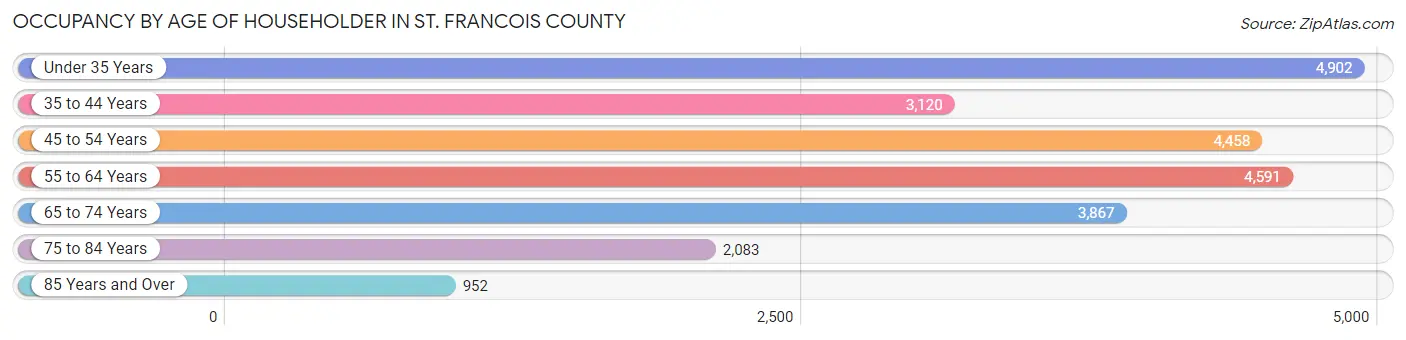
| Age Bracket | # Households | % Households |
| Under 35 Years | 4,902 | 20.4% |
| 35 to 44 Years | 3,120 | 13.0% |
| 45 to 54 Years | 4,458 | 18.6% |
| 55 to 64 Years | 4,591 | 19.2% |
| 65 to 74 Years | 3,867 | 16.1% |
| 75 to 84 Years | 2,083 | 8.7% |
| 85 Years and Over | 952 | 4.0% |
| Total | 23,973 | 100.0% |
Housing Finances in St. Francois County
Median Income by Occupancy in St. Francois County
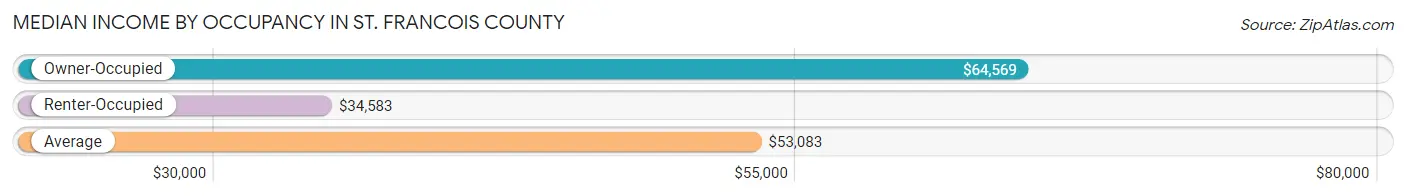
| Occupancy Type | # Households | Median Income |
| Owner-Occupied | 16,575 (69.1%) | $64,569 |
| Renter-Occupied | 7,398 (30.9%) | $34,583 |
| Average | 23,973 (100.0%) | $53,083 |
Occupancy by Householder Income Bracket in St. Francois County
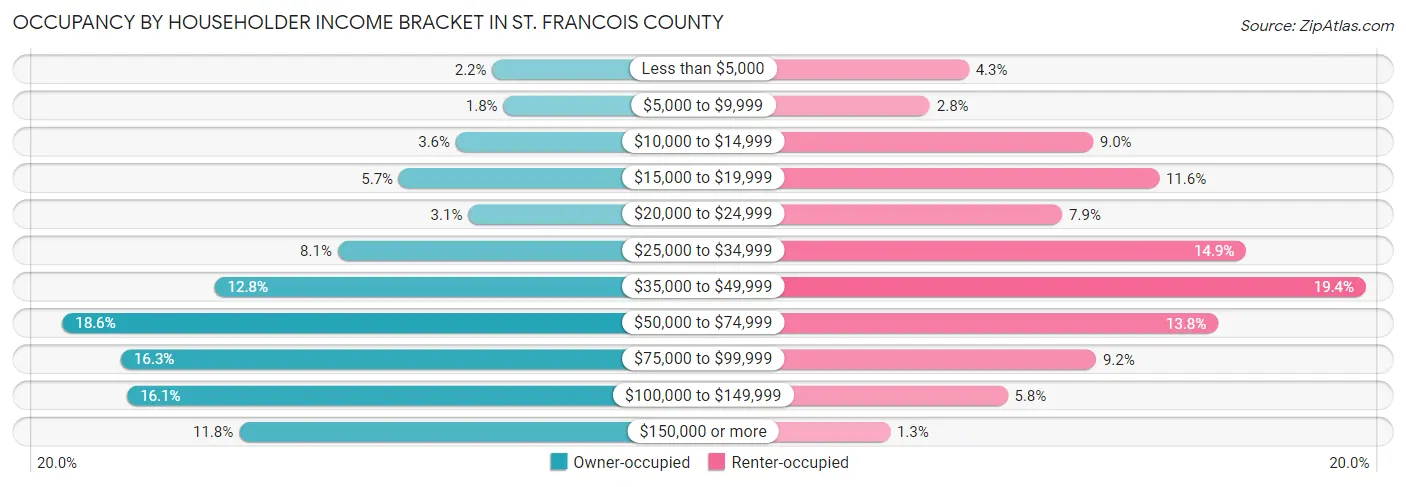
| Income Bracket | Owner-occupied | Renter-occupied |
| Less than $5,000 | 362 (2.2%) | 319 (4.3%) |
| $5,000 to $9,999 | 292 (1.8%) | 209 (2.8%) |
| $10,000 to $14,999 | 592 (3.6%) | 669 (9.0%) |
| $15,000 to $19,999 | 952 (5.7%) | 855 (11.6%) |
| $20,000 to $24,999 | 513 (3.1%) | 582 (7.9%) |
| $25,000 to $34,999 | 1,337 (8.1%) | 1,101 (14.9%) |
| $35,000 to $49,999 | 2,115 (12.8%) | 1,438 (19.4%) |
| $50,000 to $74,999 | 3,077 (18.6%) | 1,022 (13.8%) |
| $75,000 to $99,999 | 2,707 (16.3%) | 678 (9.2%) |
| $100,000 to $149,999 | 2,667 (16.1%) | 428 (5.8%) |
| $150,000 or more | 1,961 (11.8%) | 97 (1.3%) |
| Total | 16,575 (100.0%) | 7,398 (100.0%) |
Monthly Housing Cost Tiers in St. Francois County
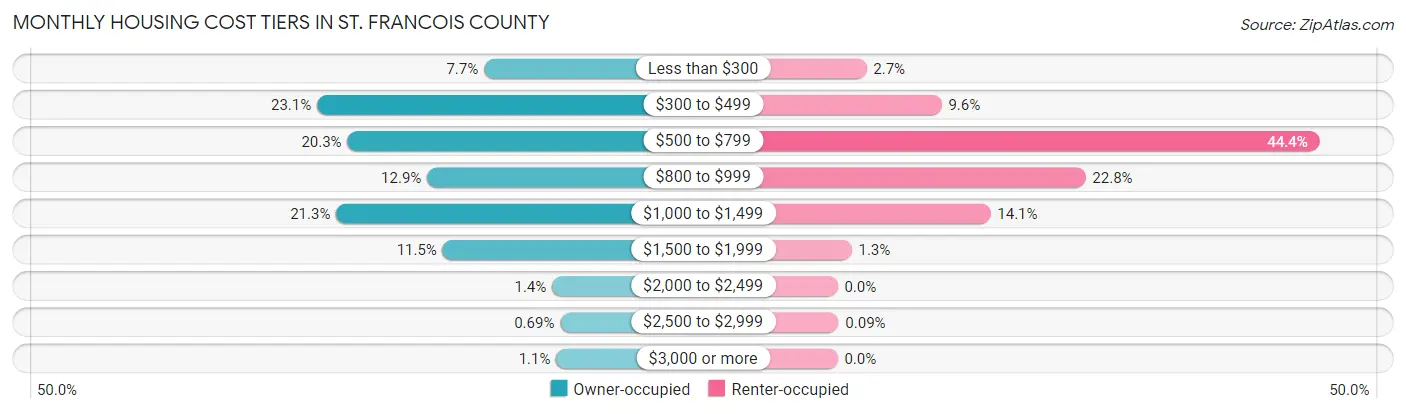
| Monthly Cost | Owner-occupied | Renter-occupied |
| Less than $300 | 1,277 (7.7%) | 197 (2.7%) |
| $300 to $499 | 3,825 (23.1%) | 709 (9.6%) |
| $500 to $799 | 3,362 (20.3%) | 3,284 (44.4%) |
| $800 to $999 | 2,144 (12.9%) | 1,689 (22.8%) |
| $1,000 to $1,499 | 3,532 (21.3%) | 1,042 (14.1%) |
| $1,500 to $1,999 | 1,908 (11.5%) | 96 (1.3%) |
| $2,000 to $2,499 | 238 (1.4%) | 0 (0.0%) |
| $2,500 to $2,999 | 115 (0.7%) | 7 (0.1%) |
| $3,000 or more | 174 (1.1%) | 0 (0.0%) |
| Total | 16,575 (100.0%) | 7,398 (100.0%) |
Physical Housing Characteristics in St. Francois County
Housing Structures in St. Francois County
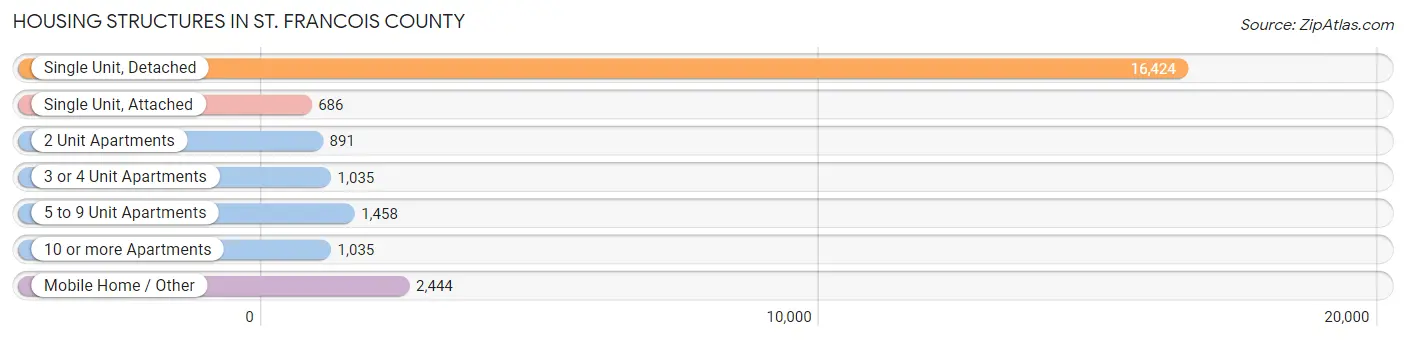
| Structure Type | # Housing Units | % Housing Units |
| Single Unit, Detached | 16,424 | 68.5% |
| Single Unit, Attached | 686 | 2.9% |
| 2 Unit Apartments | 891 | 3.7% |
| 3 or 4 Unit Apartments | 1,035 | 4.3% |
| 5 to 9 Unit Apartments | 1,458 | 6.1% |
| 10 or more Apartments | 1,035 | 4.3% |
| Mobile Home / Other | 2,444 | 10.2% |
| Total | 23,973 | 100.0% |
Housing Structures by Occupancy in St. Francois County
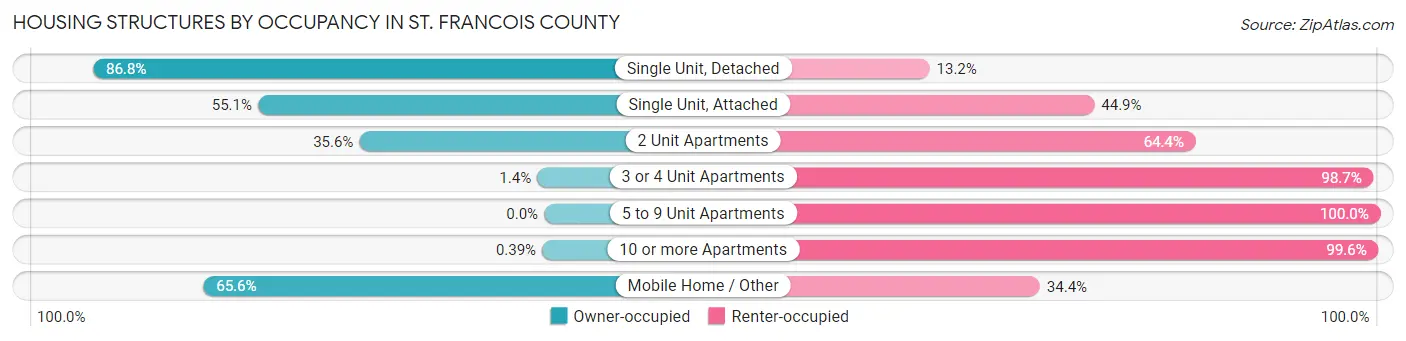
| Structure Type | Owner-occupied | Renter-occupied |
| Single Unit, Detached | 14,259 (86.8%) | 2,165 (13.2%) |
| Single Unit, Attached | 378 (55.1%) | 308 (44.9%) |
| 2 Unit Apartments | 317 (35.6%) | 574 (64.4%) |
| 3 or 4 Unit Apartments | 14 (1.3%) | 1,021 (98.7%) |
| 5 to 9 Unit Apartments | 0 (0.0%) | 1,458 (100.0%) |
| 10 or more Apartments | 4 (0.4%) | 1,031 (99.6%) |
| Mobile Home / Other | 1,603 (65.6%) | 841 (34.4%) |
| Total | 16,575 (69.1%) | 7,398 (30.9%) |
Housing Structures by Number of Rooms in St. Francois County
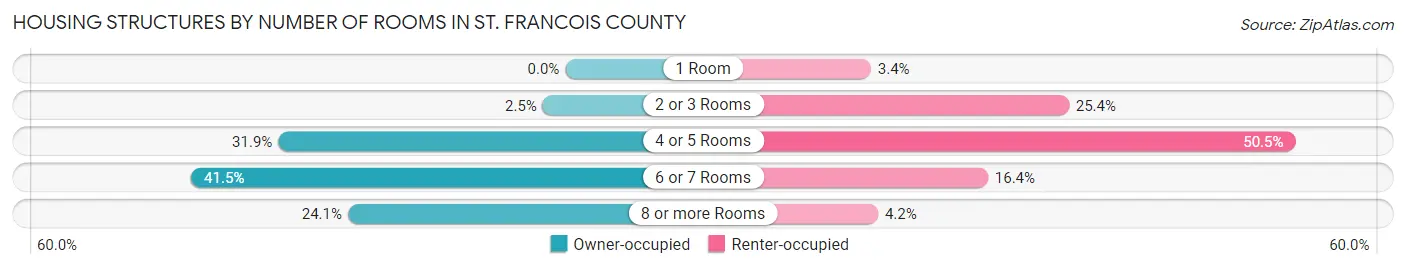
| Number of Rooms | Owner-occupied | Renter-occupied |
| 1 Room | 0 (0.0%) | 254 (3.4%) |
| 2 or 3 Rooms | 415 (2.5%) | 1,879 (25.4%) |
| 4 or 5 Rooms | 5,280 (31.9%) | 3,738 (50.5%) |
| 6 or 7 Rooms | 6,881 (41.5%) | 1,215 (16.4%) |
| 8 or more Rooms | 3,999 (24.1%) | 312 (4.2%) |
| Total | 16,575 (100.0%) | 7,398 (100.0%) |
Housing Structure by Heating Type in St. Francois County
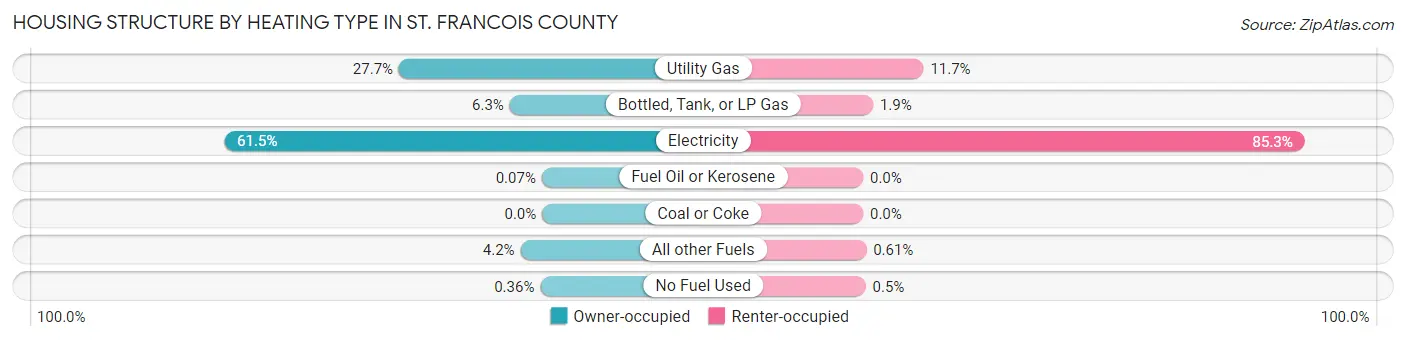
| Heating Type | Owner-occupied | Renter-occupied |
| Utility Gas | 4,586 (27.7%) | 863 (11.7%) |
| Bottled, Tank, or LP Gas | 1,037 (6.3%) | 141 (1.9%) |
| Electricity | 10,187 (61.5%) | 6,312 (85.3%) |
| Fuel Oil or Kerosene | 11 (0.1%) | 0 (0.0%) |
| Coal or Coke | 0 (0.0%) | 0 (0.0%) |
| All other Fuels | 694 (4.2%) | 45 (0.6%) |
| No Fuel Used | 60 (0.4%) | 37 (0.5%) |
| Total | 16,575 (100.0%) | 7,398 (100.0%) |
Household Vehicle Usage in St. Francois County
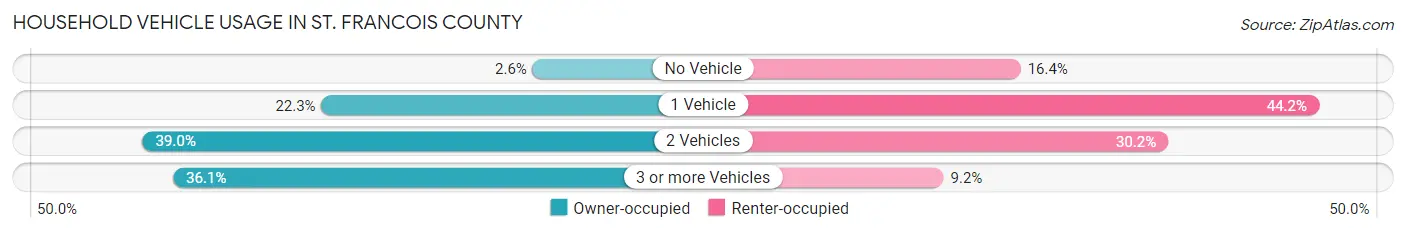
| Vehicles per Household | Owner-occupied | Renter-occupied |
| No Vehicle | 426 (2.6%) | 1,214 (16.4%) |
| 1 Vehicle | 3,695 (22.3%) | 3,272 (44.2%) |
| 2 Vehicles | 6,463 (39.0%) | 2,231 (30.2%) |
| 3 or more Vehicles | 5,991 (36.1%) | 681 (9.2%) |
| Total | 16,575 (100.0%) | 7,398 (100.0%) |
Real Estate & Mortgages in St. Francois County
Real Estate and Mortgage Overview in St. Francois County
| Characteristic | Without Mortgage | With Mortgage |
| Housing Units | 6,687 | 9,888 |
| Median Property Value | $118,600 | $153,400 |
| Median Household Income | $49,338 | $1,329 |
| Monthly Housing Costs | $405 | $148 |
| Real Estate Taxes | $1,031 | $189 |
Property Value by Mortgage Status in St. Francois County
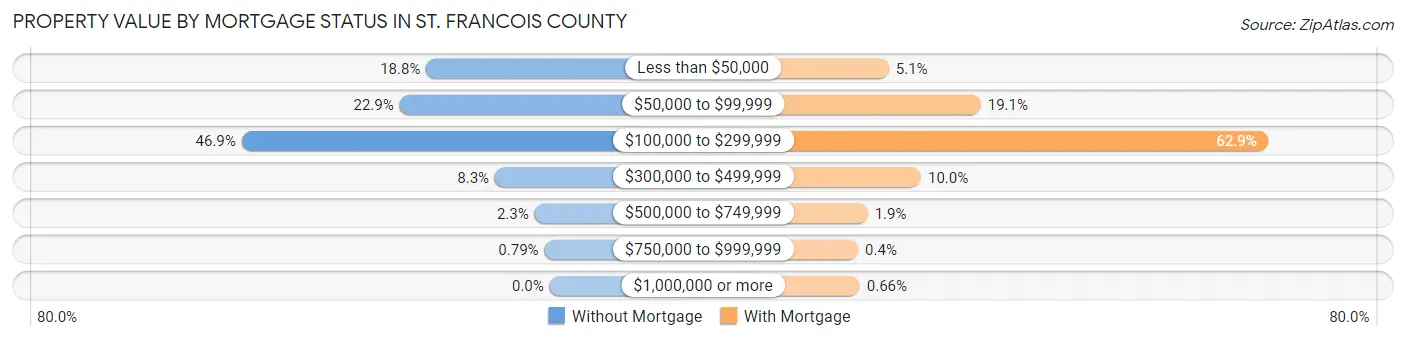
| Property Value | Without Mortgage | With Mortgage |
| Less than $50,000 | 1,257 (18.8%) | 501 (5.1%) |
| $50,000 to $99,999 | 1,529 (22.9%) | 1,888 (19.1%) |
| $100,000 to $299,999 | 3,138 (46.9%) | 6,223 (62.9%) |
| $300,000 to $499,999 | 557 (8.3%) | 987 (10.0%) |
| $500,000 to $749,999 | 153 (2.3%) | 184 (1.9%) |
| $750,000 to $999,999 | 53 (0.8%) | 40 (0.4%) |
| $1,000,000 or more | 0 (0.0%) | 65 (0.7%) |
| Total | 6,687 (100.0%) | 9,888 (100.0%) |
Household Income by Mortgage Status in St. Francois County
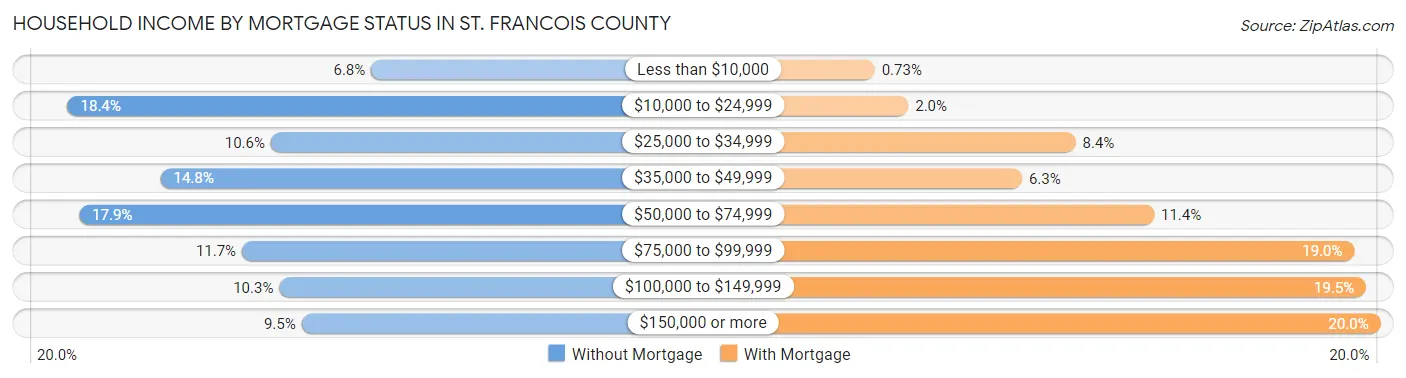
| Household Income | Without Mortgage | With Mortgage |
| Less than $10,000 | 455 (6.8%) | 72 (0.7%) |
| $10,000 to $24,999 | 1,228 (18.4%) | 199 (2.0%) |
| $25,000 to $34,999 | 710 (10.6%) | 829 (8.4%) |
| $35,000 to $49,999 | 991 (14.8%) | 627 (6.3%) |
| $50,000 to $74,999 | 1,198 (17.9%) | 1,124 (11.4%) |
| $75,000 to $99,999 | 784 (11.7%) | 1,879 (19.0%) |
| $100,000 to $149,999 | 689 (10.3%) | 1,923 (19.5%) |
| $150,000 or more | 632 (9.5%) | 1,978 (20.0%) |
| Total | 6,687 (100.0%) | 9,888 (100.0%) |
Property Value to Household Income Ratio in St. Francois County
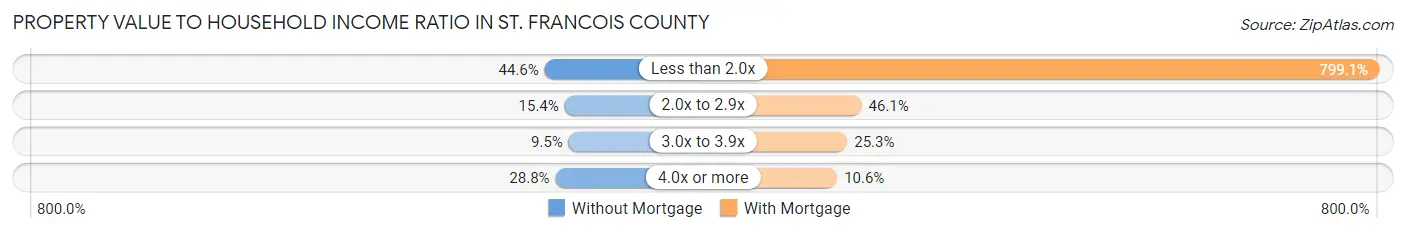
| Value-to-Income Ratio | Without Mortgage | With Mortgage |
| Less than 2.0x | 2,980 (44.6%) | 79,013 (799.1%) |
| 2.0x to 2.9x | 1,030 (15.4%) | 4,556 (46.1%) |
| 3.0x to 3.9x | 637 (9.5%) | 2,498 (25.3%) |
| 4.0x or more | 1,928 (28.8%) | 1,045 (10.6%) |
| Total | 6,687 (100.0%) | 9,888 (100.0%) |
Real Estate Taxes by Mortgage Status in St. Francois County
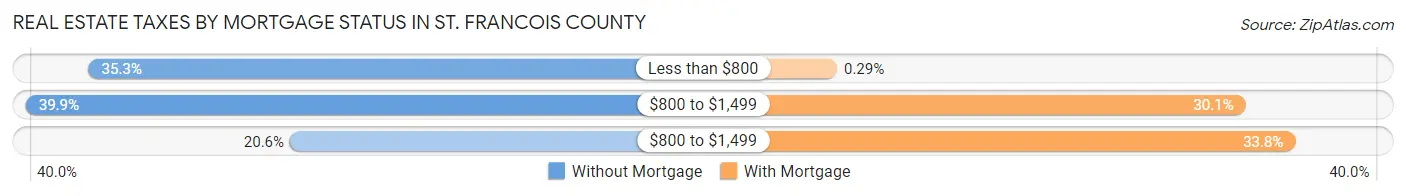
| Property Taxes | Without Mortgage | With Mortgage |
| Less than $800 | 2,362 (35.3%) | 29 (0.3%) |
| $800 to $1,499 | 2,669 (39.9%) | 2,979 (30.1%) |
| $800 to $1,499 | 1,379 (20.6%) | 3,338 (33.8%) |
| Total | 6,687 (100.0%) | 9,888 (100.0%) |
Health & Disability in St. Francois County
Health Insurance Coverage by Age in St. Francois County
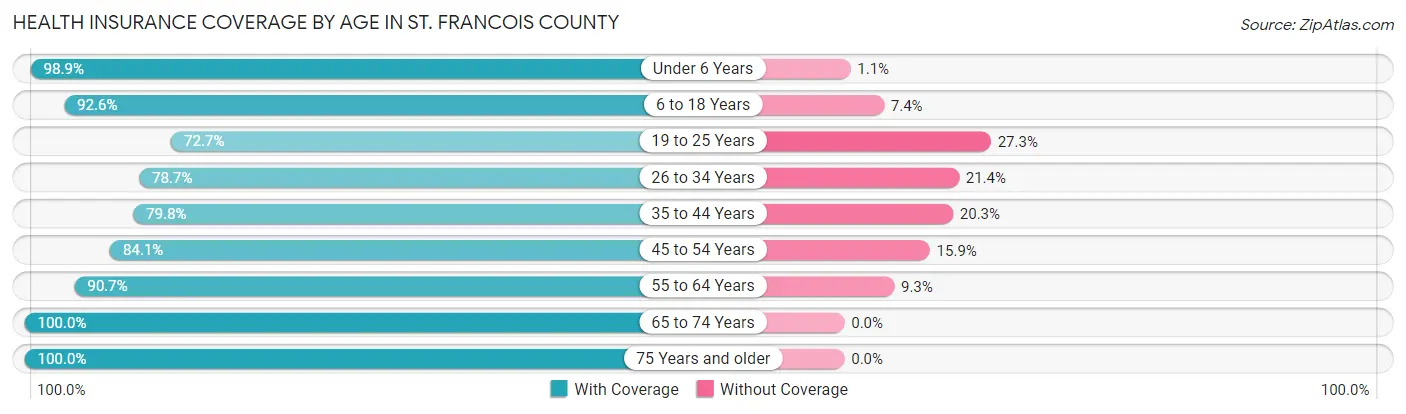
| Age Bracket | With Coverage | Without Coverage |
| Under 6 Years | 4,291 (98.9%) | 49 (1.1%) |
| 6 to 18 Years | 9,718 (92.6%) | 773 (7.4%) |
| 19 to 25 Years | 3,687 (72.7%) | 1,385 (27.3%) |
| 26 to 34 Years | 5,990 (78.6%) | 1,626 (21.3%) |
| 35 to 44 Years | 6,009 (79.7%) | 1,526 (20.3%) |
| 45 to 54 Years | 6,490 (84.1%) | 1,229 (15.9%) |
| 55 to 64 Years | 7,398 (90.7%) | 756 (9.3%) |
| 65 to 74 Years | 6,142 (100.0%) | 0 (0.0%) |
| 75 Years and older | 4,335 (100.0%) | 0 (0.0%) |
| Total | 54,060 (88.0%) | 7,344 (12.0%) |
Health Insurance Coverage by Citizenship Status in St. Francois County
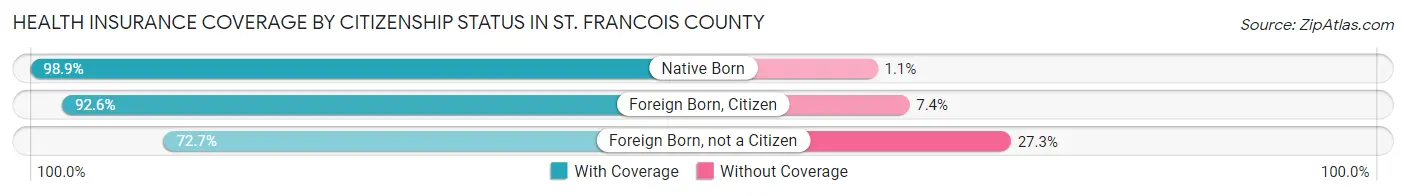
| Citizenship Status | With Coverage | Without Coverage |
| Native Born | 4,291 (98.9%) | 49 (1.1%) |
| Foreign Born, Citizen | 9,718 (92.6%) | 773 (7.4%) |
| Foreign Born, not a Citizen | 3,687 (72.7%) | 1,385 (27.3%) |
Health Insurance Coverage by Household Income in St. Francois County
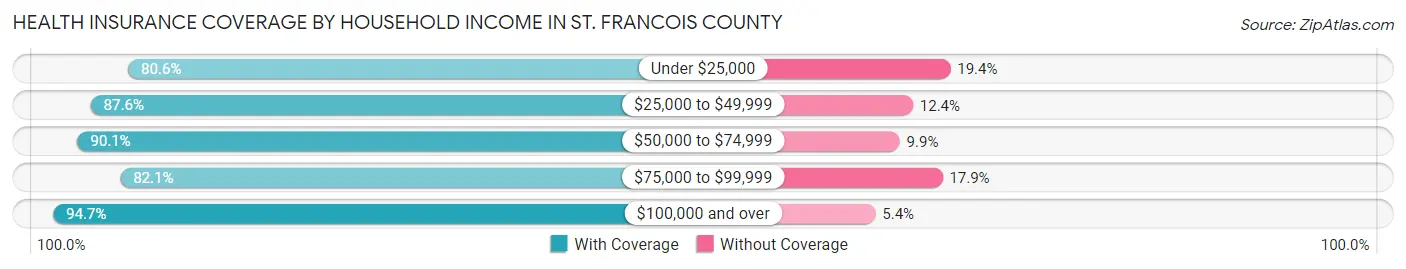
| Household Income | With Coverage | Without Coverage |
| Under $25,000 | 7,707 (80.6%) | 1,854 (19.4%) |
| $25,000 to $49,999 | 11,364 (87.6%) | 1,606 (12.4%) |
| $50,000 to $74,999 | 9,842 (90.1%) | 1,082 (9.9%) |
| $75,000 to $99,999 | 8,406 (82.1%) | 1,835 (17.9%) |
| $100,000 and over | 16,391 (94.7%) | 927 (5.3%) |
Public vs Private Health Insurance Coverage by Age in St. Francois County
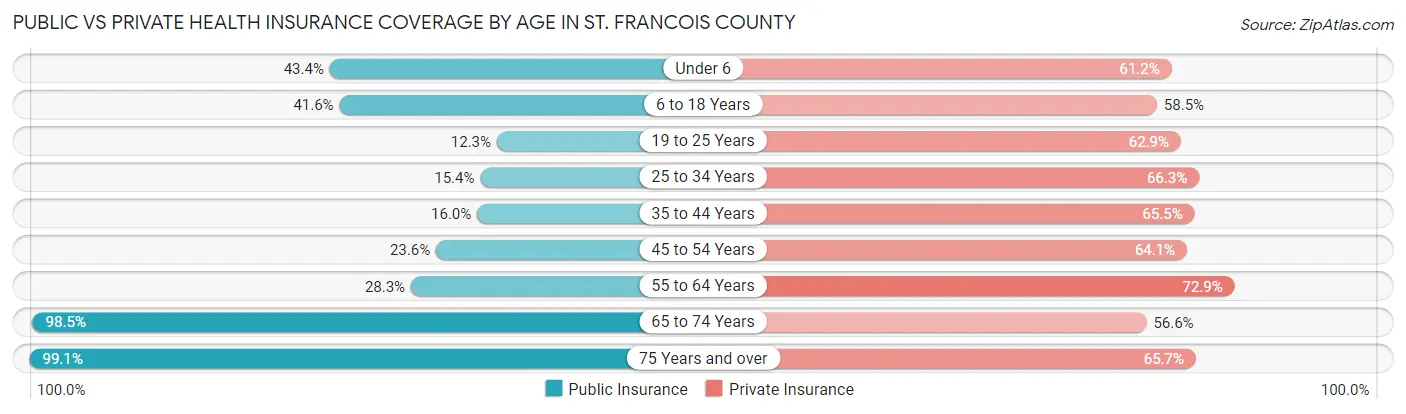
| Age Bracket | Public Insurance | Private Insurance |
| Under 6 | 1,882 (43.4%) | 2,656 (61.2%) |
| 6 to 18 Years | 4,360 (41.6%) | 6,136 (58.5%) |
| 19 to 25 Years | 626 (12.3%) | 3,192 (62.9%) |
| 25 to 34 Years | 1,174 (15.4%) | 5,050 (66.3%) |
| 35 to 44 Years | 1,206 (16.0%) | 4,934 (65.5%) |
| 45 to 54 Years | 1,825 (23.6%) | 4,945 (64.1%) |
| 55 to 64 Years | 2,307 (28.3%) | 5,945 (72.9%) |
| 65 to 74 Years | 6,050 (98.5%) | 3,473 (56.6%) |
| 75 Years and over | 4,295 (99.1%) | 2,848 (65.7%) |
| Total | 23,725 (38.6%) | 39,179 (63.8%) |
Disability Status by Sex by Age in St. Francois County
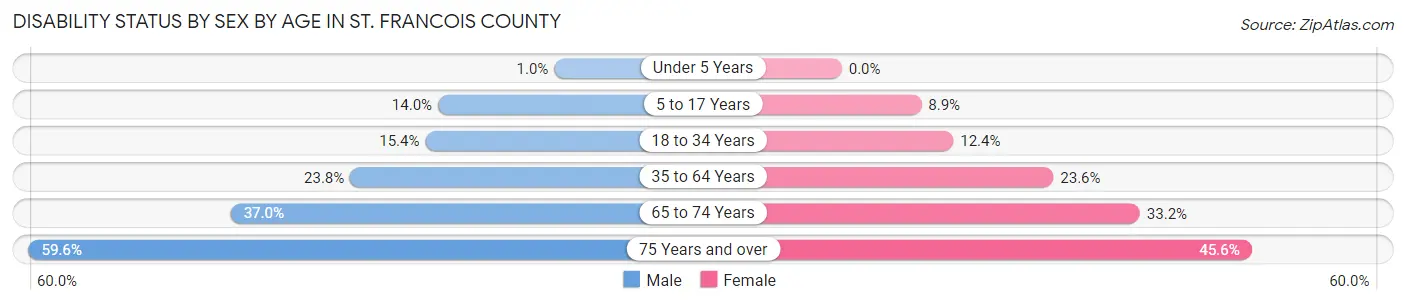
| Age Bracket | Male | Female |
| Under 5 Years | 18 (1.0%) | 0 (0.0%) |
| 5 to 17 Years | 747 (14.0%) | 460 (8.9%) |
| 18 to 34 Years | 1,094 (15.4%) | 781 (12.4%) |
| 35 to 64 Years | 2,769 (23.7%) | 2,769 (23.6%) |
| 65 to 74 Years | 1,080 (37.0%) | 1,071 (33.2%) |
| 75 Years and over | 1,047 (59.6%) | 1,176 (45.6%) |
Disability Class by Sex by Age in St. Francois County
Disability Class: Hearing Difficulty
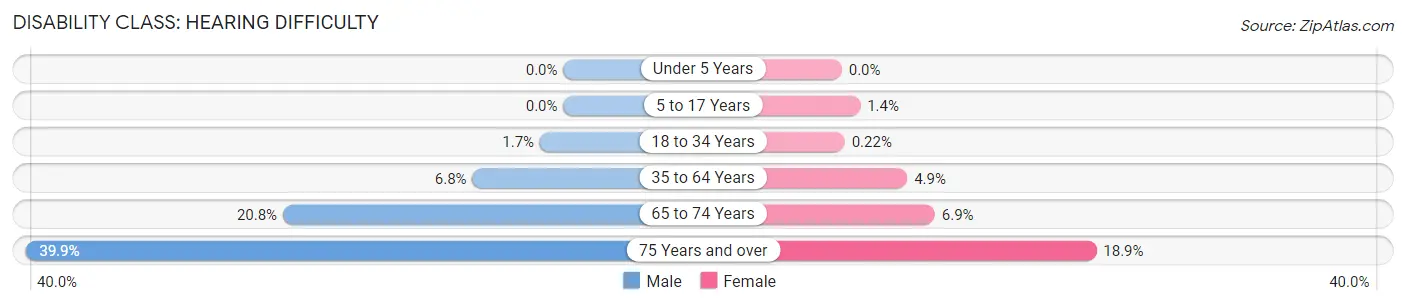
| Age Bracket | Male | Female |
| Under 5 Years | 0 (0.0%) | 0 (0.0%) |
| 5 to 17 Years | 0 (0.0%) | 71 (1.4%) |
| 18 to 34 Years | 124 (1.7%) | 14 (0.2%) |
| 35 to 64 Years | 787 (6.8%) | 571 (4.9%) |
| 65 to 74 Years | 607 (20.8%) | 223 (6.9%) |
| 75 Years and over | 701 (39.9%) | 487 (18.9%) |
Disability Class: Vision Difficulty
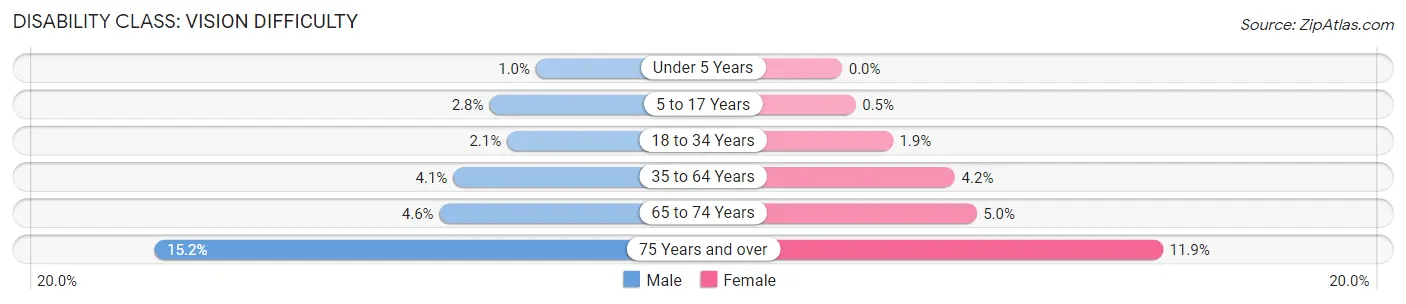
| Age Bracket | Male | Female |
| Under 5 Years | 18 (1.0%) | 0 (0.0%) |
| 5 to 17 Years | 147 (2.8%) | 26 (0.5%) |
| 18 to 34 Years | 149 (2.1%) | 118 (1.9%) |
| 35 to 64 Years | 477 (4.1%) | 492 (4.2%) |
| 65 to 74 Years | 134 (4.6%) | 161 (5.0%) |
| 75 Years and over | 267 (15.2%) | 307 (11.9%) |
Disability Class: Cognitive Difficulty
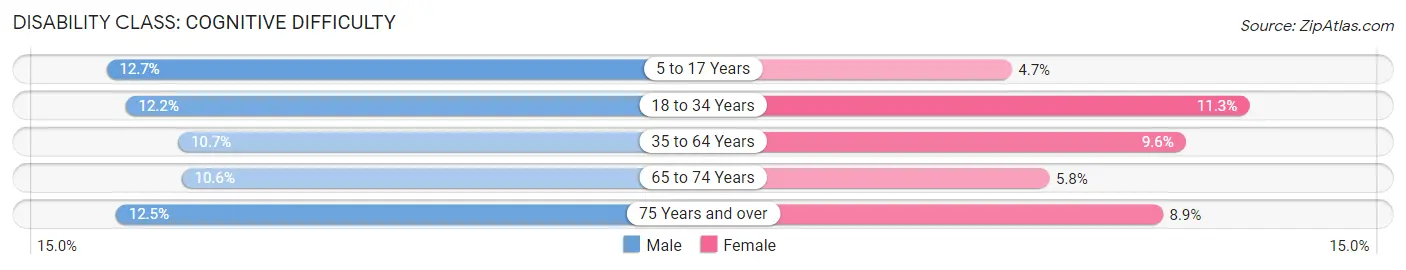
| Age Bracket | Male | Female |
| 5 to 17 Years | 680 (12.7%) | 245 (4.7%) |
| 18 to 34 Years | 868 (12.2%) | 713 (11.3%) |
| 35 to 64 Years | 1,251 (10.7%) | 1,125 (9.6%) |
| 65 to 74 Years | 310 (10.6%) | 186 (5.8%) |
| 75 Years and over | 219 (12.5%) | 230 (8.9%) |
Disability Class: Ambulatory Difficulty
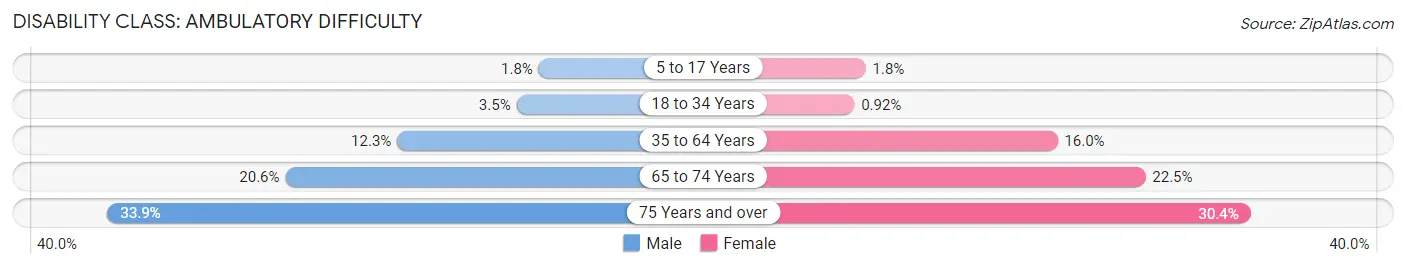
| Age Bracket | Male | Female |
| 5 to 17 Years | 98 (1.8%) | 92 (1.8%) |
| 18 to 34 Years | 248 (3.5%) | 58 (0.9%) |
| 35 to 64 Years | 1,439 (12.3%) | 1,881 (16.0%) |
| 65 to 74 Years | 602 (20.6%) | 727 (22.5%) |
| 75 Years and over | 595 (33.9%) | 782 (30.3%) |
Disability Class: Self-Care Difficulty
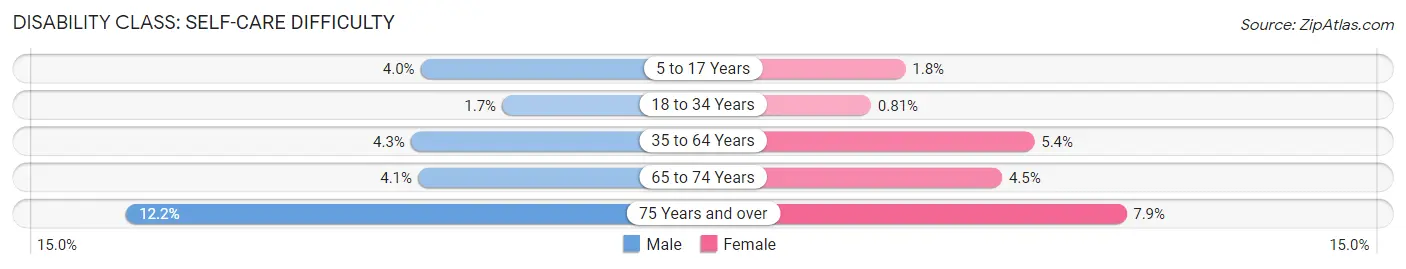
| Age Bracket | Male | Female |
| 5 to 17 Years | 213 (4.0%) | 92 (1.8%) |
| 18 to 34 Years | 122 (1.7%) | 51 (0.8%) |
| 35 to 64 Years | 495 (4.3%) | 630 (5.4%) |
| 65 to 74 Years | 118 (4.1%) | 144 (4.5%) |
| 75 Years and over | 214 (12.2%) | 204 (7.9%) |
Technology Access in St. Francois County
Computing Device Access in St. Francois County
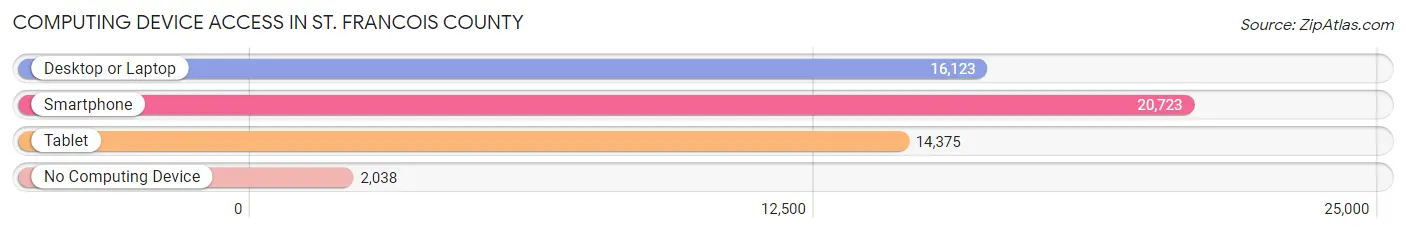
| Device Type | # Households | % Households |
| Desktop or Laptop | 16,123 | 67.2% |
| Smartphone | 20,723 | 86.4% |
| Tablet | 14,375 | 60.0% |
| No Computing Device | 2,038 | 8.5% |
| Total | 23,973 | 100.0% |
Internet Access in St. Francois County
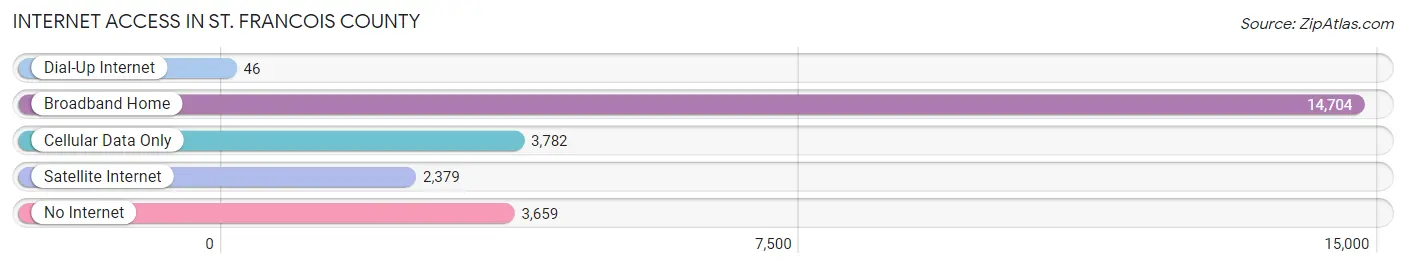
| Internet Type | # Households | % Households |
| Dial-Up Internet | 46 | 0.2% |
| Broadband Home | 14,704 | 61.3% |
| Cellular Data Only | 3,782 | 15.8% |
| Satellite Internet | 2,379 | 9.9% |
| No Internet | 3,659 | 15.3% |
| Total | 23,973 | 100.0% |
St. Francois County Summary
St. Francois County is located in the southeastern corner of Missouri, and is part of the St. Louis Metropolitan Statistical Area. The county is bordered by Iron County to the north, Madison County to the east, Ste. Genevieve County to the south, and Washington County to the west. The county seat is Farmington, and the largest city is Park Hills.
History
St. Francois County was established in 1821, and was named after the St. Francois River, which runs through the county. The county was originally part of Ste. Genevieve County, and was later divided into St. Francois and Washington Counties. The county was originally inhabited by the Osage and Missouri Native American tribes, and was later settled by French and German immigrants.
The county was an important center of mining and industry in the 19th and 20th centuries. Lead and zinc were mined in the area, and the county was home to several steel mills and other factories. The county was also an important agricultural center, with corn, soybeans, and hay being the main crops.
Geography
St. Francois County covers an area of 545 square miles, and is located in the Ozark Plateau region of Missouri. The county is mostly hilly, with the highest point being Pilot Knob, which has an elevation of 1,064 feet. The county is drained by the St. Francois River and its tributaries, including the Big River, Flat River, and Whitewater River.
The county is home to several state parks, including St. Francois State Park, which is located on the banks of the St. Francois River. The park offers camping, fishing, and hiking opportunities. Other parks in the county include Big River State Forest, Johnson's Shut-Ins State Park, and Washington State Park.
Economy
St. Francois County has a diverse economy, with the largest employers being the manufacturing, healthcare, and retail sectors. The county is home to several large manufacturing companies, including Noranda Aluminum, which produces aluminum products, and U.S. Steel, which produces steel products. The county is also home to several healthcare facilities, including Parkland Health Center and Mineral Area Regional Medical Center.
Retail is also an important part of the county's economy, with several large shopping centers located in the county. The largest shopping center is the St. Francois Centre, which is located in Park Hills. The county is also home to several smaller retail stores, including grocery stores, clothing stores, and home improvement stores.
Demographics
As of the 2010 census, St. Francois County had a population of 65,359. The population was spread out, with 24.3% under the age of 18, 8.2% from 18 to 24, 28.2% from 25 to 44, 24.3% from 45 to 64, and 14.0% who were 65 years of age or older. The median age was 37.4 years.
The racial makeup of the county was 92.2% White, 4.2% African American, 0.4% Native American, 0.7% Asian, 0.1% Pacific Islander, 0.7% from other races, and 1.7% from two or more races. Hispanic or Latino of any race were 2.2% of the population.
The median income for a household in the county was $41,945, and the median income for a family was $50,945. The per capita income for the county was $20,945. About 11.2% of families and 14.3% of the population were below the poverty line, including 19.2% of those under age 18 and 8.7% of those age 65 or over.
Common Questions
What is Per Capita Income in St. Francois County?
Per Capita income in St. Francois County is $25,304.
What is the Median Family Income in St. Francois County?
Median Family Income in St. Francois County is $63,063.
What is the Median Household income in St. Francois County?
Median Household Income in St. Francois County is $53,083.
What is Income or Wage Gap in St. Francois County?
Income or Wage Gap in St. Francois County is 27.9%.
Women in St. Francois County earn 72.1 cents for every dollar earned by a man.
What is Family Income Deficit in St. Francois County?
Family Income Deficit in St. Francois County is $8,538.
Families that are below poverty line in St. Francois County earn $8,538 less on average than the poverty threshold level.
What is Inequality or Gini Index in St. Francois County?
Inequality or Gini Index in St. Francois County is 0.43.
What is the Total Population of St. Francois County?
Total Population of St. Francois County is 66,814.
What is the Total Male Population of St. Francois County?
Total Male Population of St. Francois County is 35,470.
What is the Total Female Population of St. Francois County?
Total Female Population of St. Francois County is 31,344.
What is the Ratio of Males per 100 Females in St. Francois County?
There are 113.16 Males per 100 Females in St. Francois County.
What is the Ratio of Females per 100 Males in St. Francois County?
There are 88.37 Females per 100 Males in St. Francois County.
What is the Median Population Age in St. Francois County?
Median Population Age in St. Francois County is 39.4 Years.
What is the Average Family Size in St. Francois County
Average Family Size in St. Francois County is 3.1 People.
What is the Average Household Size in St. Francois County
Average Household Size in St. Francois County is 2.5 People.
How Large is the Labor Force in St. Francois County?
There are 28,166 People in the Labor Forcein in St. Francois County.
What is the Percentage of People in the Labor Force in St. Francois County?
51.7% of People are in the Labor Force in St. Francois County.
What is the Unemployment Rate in St. Francois County?
Unemployment Rate in St. Francois County is 4.8%.