Shannon County, MO Map & Demographics
Shannon County Map
Shannon County Overview
$23,661
PER CAPITA INCOME
$62,931
AVG FAMILY INCOME
$46,767
AVG HOUSEHOLD INCOME
39.7%
WAGE / INCOME GAP [ % ]
60.3¢/ $1
WAGE / INCOME GAP [ $ ]
0.40
INEQUALITY / GINI INDEX
7,132
TOTAL POPULATION
3,637
MALE POPULATION
3,495
FEMALE POPULATION
104.06
MALES / 100 FEMALES
96.10
FEMALES / 100 MALES
46.9
MEDIAN AGE
3.1
AVG FAMILY SIZE
2.5
AVG HOUSEHOLD SIZE
2,765
LABOR FORCE [ PEOPLE ]
47.9%
PERCENT IN LABOR FORCE
2.7%
UNEMPLOYMENT RATE
Income in Shannon County
Income Overview in Shannon County
Per Capita Income in Shannon County is $23,661, while median incomes of families and households are $62,931 and $46,767 respectively.
| Characteristic | Number | Measure |
| Per Capita Income | 7,132 | $23,661 |
| Median Family Income | 1,864 | $62,931 |
| Mean Family Income | 1,864 | $67,192 |
| Median Household Income | 2,753 | $46,767 |
| Mean Household Income | 2,753 | $57,484 |
| Income Deficit | 1,864 | $0 |
| Wage / Income Gap (%) | 7,132 | 39.75% |
| Wage / Income Gap ($) | 7,132 | 60.25¢ per $1 |
| Gini / Inequality Index | 7,132 | 0.40 |
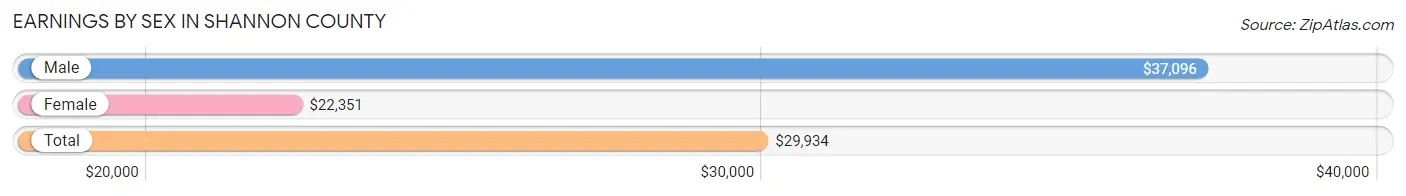
Earnings by Sex in Shannon County
Average Earnings in Shannon County are $29,934, $37,096 for men and $22,351 for women, a difference of 39.8%.
| Sex | Number | Average Earnings |
| Male | 1,665 (57.0%) | $37,096 |
| Female | 1,254 (43.0%) | $22,351 |
| Total | 2,919 (100.0%) | $29,934 |
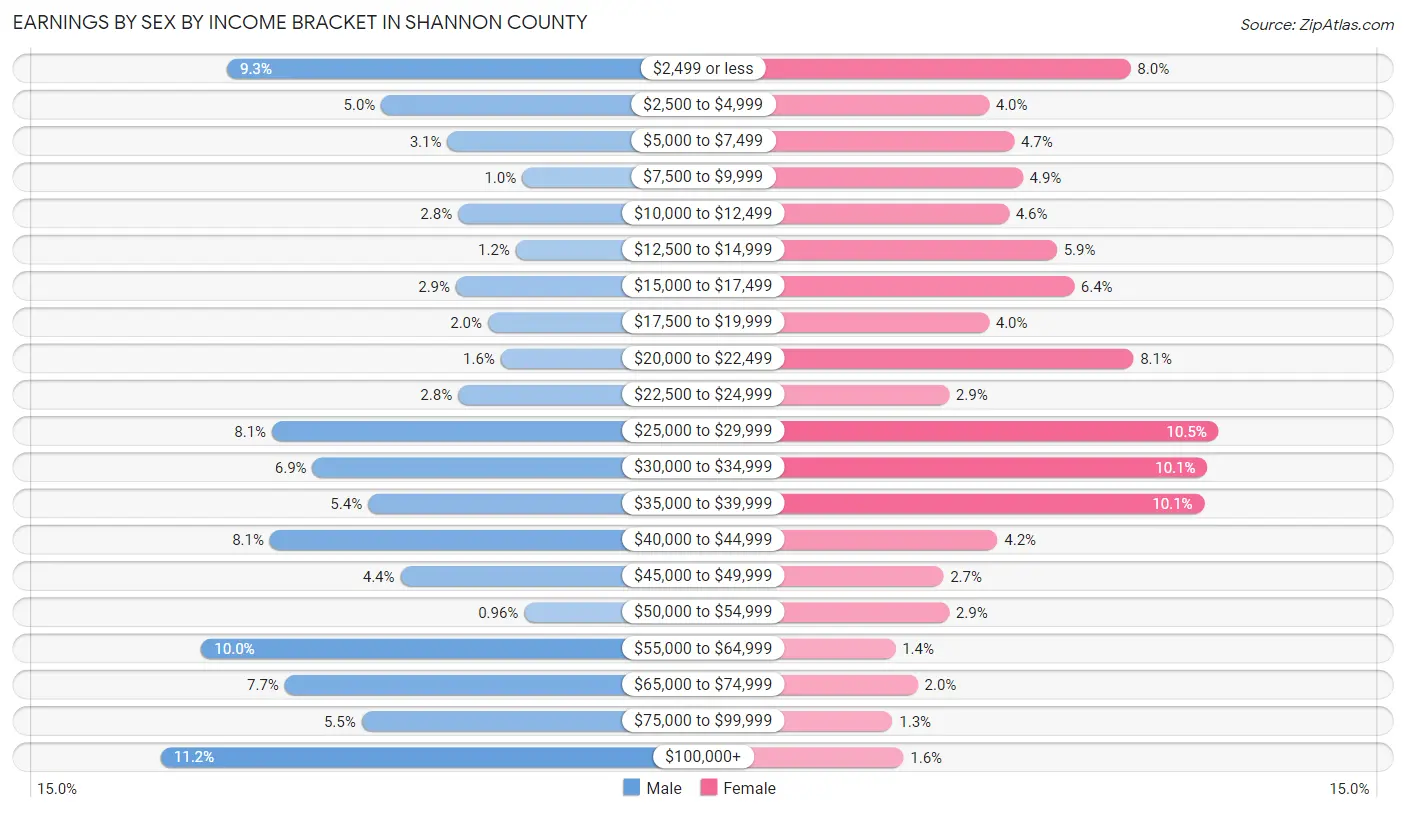
Earnings by Sex by Income Bracket in Shannon County
The most common earnings brackets in Shannon County are $100,000+ for men (186 | 11.2%) and $25,000 to $29,999 for women (131 | 10.4%).
| Income | Male | Female |
| $2,499 or less | 155 (9.3%) | 100 (8.0%) |
| $2,500 to $4,999 | 83 (5.0%) | 50 (4.0%) |
| $5,000 to $7,499 | 52 (3.1%) | 59 (4.7%) |
| $7,500 to $9,999 | 17 (1.0%) | 62 (4.9%) |
| $10,000 to $12,499 | 47 (2.8%) | 57 (4.5%) |
| $12,500 to $14,999 | 20 (1.2%) | 74 (5.9%) |
| $15,000 to $17,499 | 48 (2.9%) | 80 (6.4%) |
| $17,500 to $19,999 | 33 (2.0%) | 50 (4.0%) |
| $20,000 to $22,499 | 27 (1.6%) | 101 (8.1%) |
| $22,500 to $24,999 | 47 (2.8%) | 36 (2.9%) |
| $25,000 to $29,999 | 134 (8.1%) | 131 (10.4%) |
| $30,000 to $34,999 | 115 (6.9%) | 127 (10.1%) |
| $35,000 to $39,999 | 89 (5.3%) | 126 (10.1%) |
| $40,000 to $44,999 | 135 (8.1%) | 53 (4.2%) |
| $45,000 to $49,999 | 74 (4.4%) | 34 (2.7%) |
| $50,000 to $54,999 | 16 (1.0%) | 36 (2.9%) |
| $55,000 to $64,999 | 167 (10.0%) | 17 (1.4%) |
| $65,000 to $74,999 | 128 (7.7%) | 25 (2.0%) |
| $75,000 to $99,999 | 92 (5.5%) | 16 (1.3%) |
| $100,000+ | 186 (11.2%) | 20 (1.6%) |
| Total | 1,665 (100.0%) | 1,254 (100.0%) |
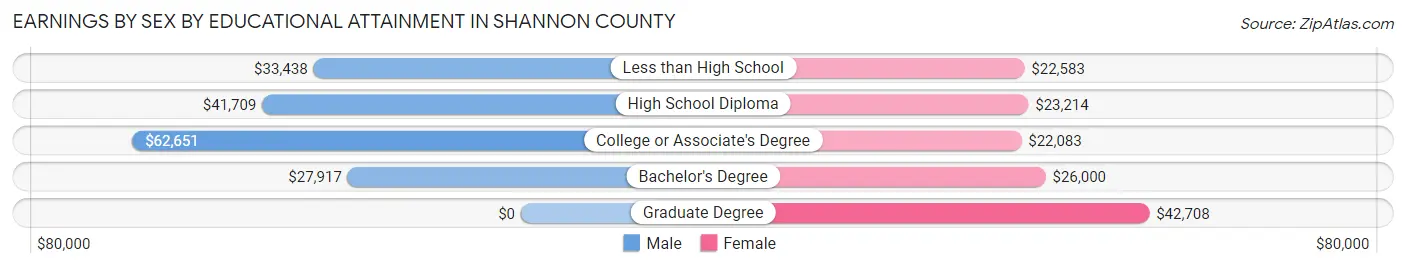
Earnings by Sex by Educational Attainment in Shannon County
Average earnings in Shannon County are $42,897 for men and $26,711 for women, a difference of 37.7%. Men with an educational attainment of college or associate's degree enjoy the highest average annual earnings of $62,651, while those with bachelor's degree education earn the least with $27,917. Women with an educational attainment of graduate degree earn the most with the average annual earnings of $42,708, while those with college or associate's degree education have the smallest earnings of $22,083.
| Educational Attainment | Male Income | Female Income |
| Less than High School | $33,438 | $22,583 |
| High School Diploma | $41,709 | $23,214 |
| College or Associate's Degree | $62,651 | $22,083 |
| Bachelor's Degree | $27,917 | $26,000 |
| Graduate Degree | - | - |
| Total | $42,897 | $26,711 |
Family Income in Shannon County
Family Income Brackets in Shannon County
According to the Shannon County family income data, there are 526 families falling into the $50,000 to $74,999 income range, which is the most common income bracket and makes up 28.2% of all families. Conversely, the $200,000+ income bracket is the least frequent group with only 22 families (1.2%) belonging to this category.
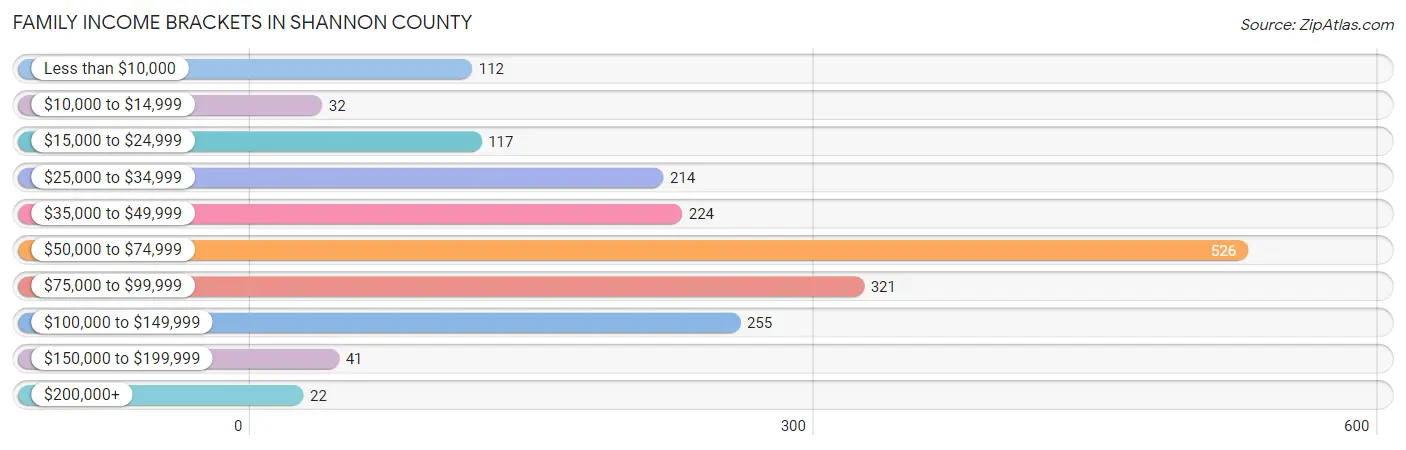
| Income Bracket | # Families | % Families |
| Less than $10,000 | 112 | 6.0% |
| $10,000 to $14,999 | 32 | 1.7% |
| $15,000 to $24,999 | 117 | 6.3% |
| $25,000 to $34,999 | 214 | 11.5% |
| $35,000 to $49,999 | 224 | 12.0% |
| $50,000 to $74,999 | 526 | 28.2% |
| $75,000 to $99,999 | 321 | 17.2% |
| $100,000 to $149,999 | 255 | 13.7% |
| $150,000 to $199,999 | 41 | 2.2% |
| $200,000+ | 22 | 1.2% |
Family Income by Famaliy Size in Shannon County
5-person families (143 | 7.7%) account for the highest median family income in Shannon County with $96,034 per family, while 2-person families (1,078 | 57.8%) have the highest median income of $25,200 per family member.
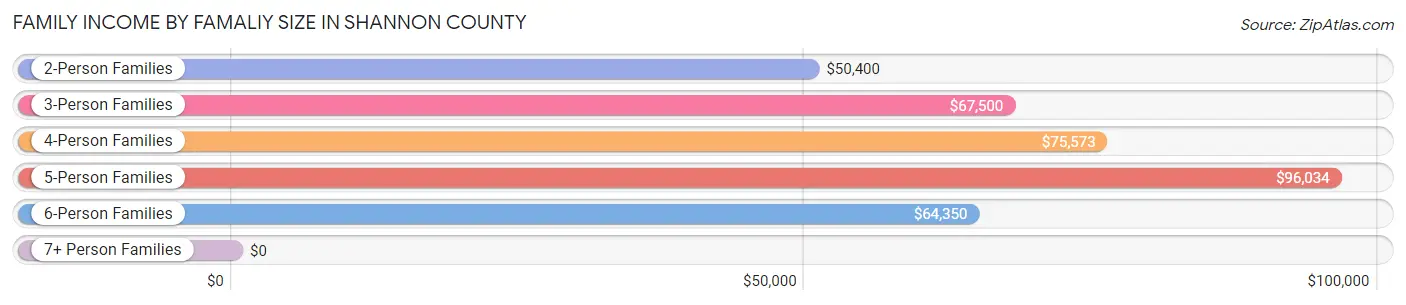
| Income Bracket | # Families | Median Income |
| 2-Person Families | 1,078 (57.8%) | $50,400 |
| 3-Person Families | 316 (17.0%) | $67,500 |
| 4-Person Families | 141 (7.6%) | $75,573 |
| 5-Person Families | 143 (7.7%) | $96,034 |
| 6-Person Families | 181 (9.7%) | $64,350 |
| 7+ Person Families | 5 (0.3%) | $0 |
| Total | 1,864 (100.0%) | $62,931 |
Family Income by Number of Earners in Shannon County
The median family income in Shannon County is $62,931, with families comprising 3+ earners (118) having the highest median family income of $94,643, while families with no earners (572) have the lowest median family income of $31,875, accounting for 6.3% and 30.7% of families, respectively.
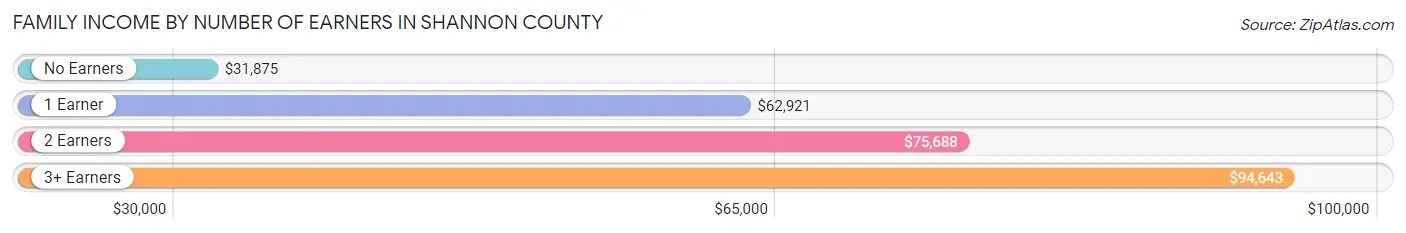
| Number of Earners | # Families | Median Income |
| No Earners | 572 (30.7%) | $31,875 |
| 1 Earner | 514 (27.6%) | $62,921 |
| 2 Earners | 660 (35.4%) | $75,688 |
| 3+ Earners | 118 (6.3%) | $94,643 |
| Total | 1,864 (100.0%) | $62,931 |
Household Income in Shannon County
Household Income Brackets in Shannon County
With 578 households falling in the category, the $50,000 to $74,999 income range is the most frequent in Shannon County, accounting for 21.0% of all households. In contrast, only 33 households (1.2%) fall into the $200,000+ income bracket, making it the least populous group.
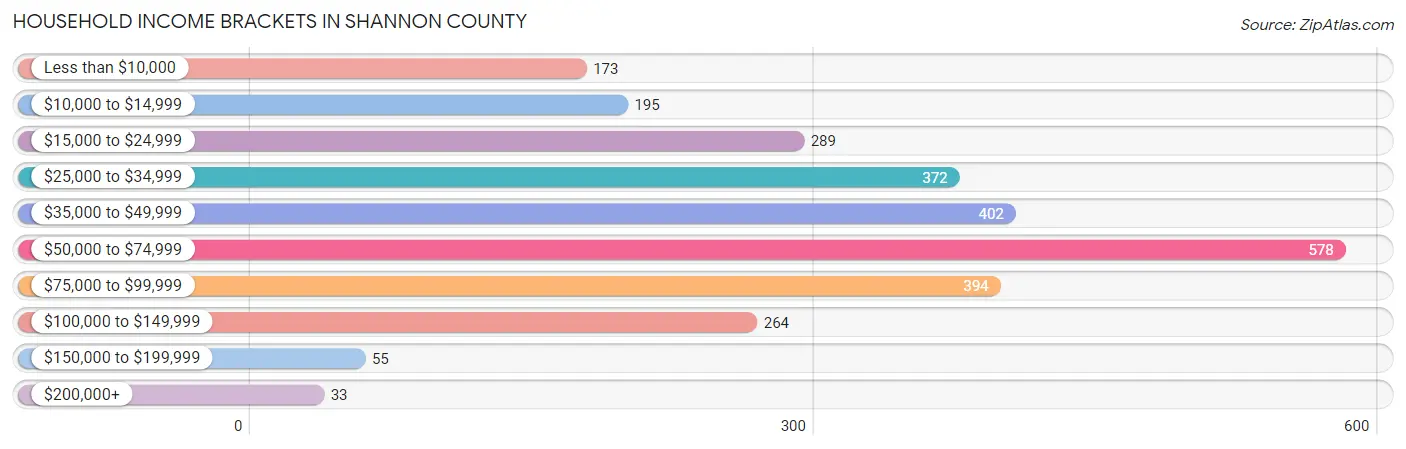
| Income Bracket | # Households | % Households |
| Less than $10,000 | 173 | 6.3% |
| $10,000 to $14,999 | 195 | 7.1% |
| $15,000 to $24,999 | 289 | 10.5% |
| $25,000 to $34,999 | 372 | 13.5% |
| $35,000 to $49,999 | 402 | 14.6% |
| $50,000 to $74,999 | 578 | 21.0% |
| $75,000 to $99,999 | 394 | 14.3% |
| $100,000 to $149,999 | 264 | 9.6% |
| $150,000 to $199,999 | 55 | 2.0% |
| $200,000+ | 33 | 1.2% |
Household Income by Householder Age in Shannon County
The median household income in Shannon County is $46,767, with the highest median household income of $64,632 found in the 25 to 44 years age bracket for the primary householder. A total of 698 households (25.4%) fall into this category. Meanwhile, the 65+ years age bracket for the primary householder has the lowest median household income of $35,982, with 919 households (33.4%) in this group.
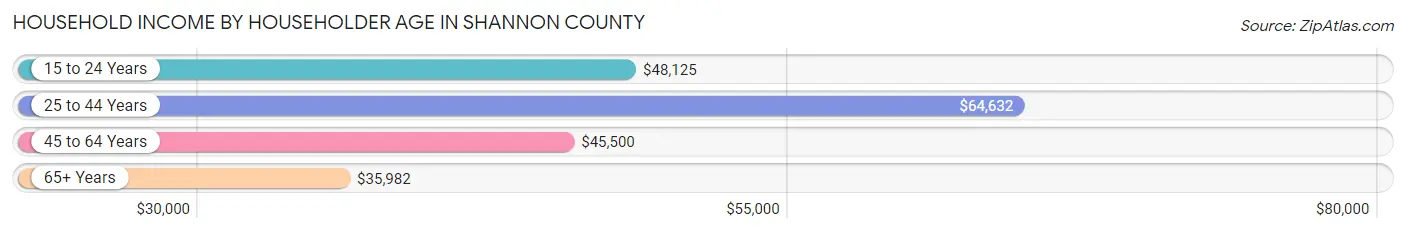
| Income Bracket | # Households | Median Income |
| 15 to 24 Years | 48 (1.7%) | $48,125 |
| 25 to 44 Years | 698 (25.4%) | $64,632 |
| 45 to 64 Years | 1,088 (39.5%) | $45,500 |
| 65+ Years | 919 (33.4%) | $35,982 |
| Total | 2,753 (100.0%) | $46,767 |
Poverty in Shannon County
Income Below Poverty by Sex and Age in Shannon County
With 12.2% poverty level for males and 17.2% for females among the residents of Shannon County, 45 to 54 year old males and 75 year old and over females are the most vulnerable to poverty, with 104 males (23.0%) and 139 females (40.3%) in their respective age groups living below the poverty level.
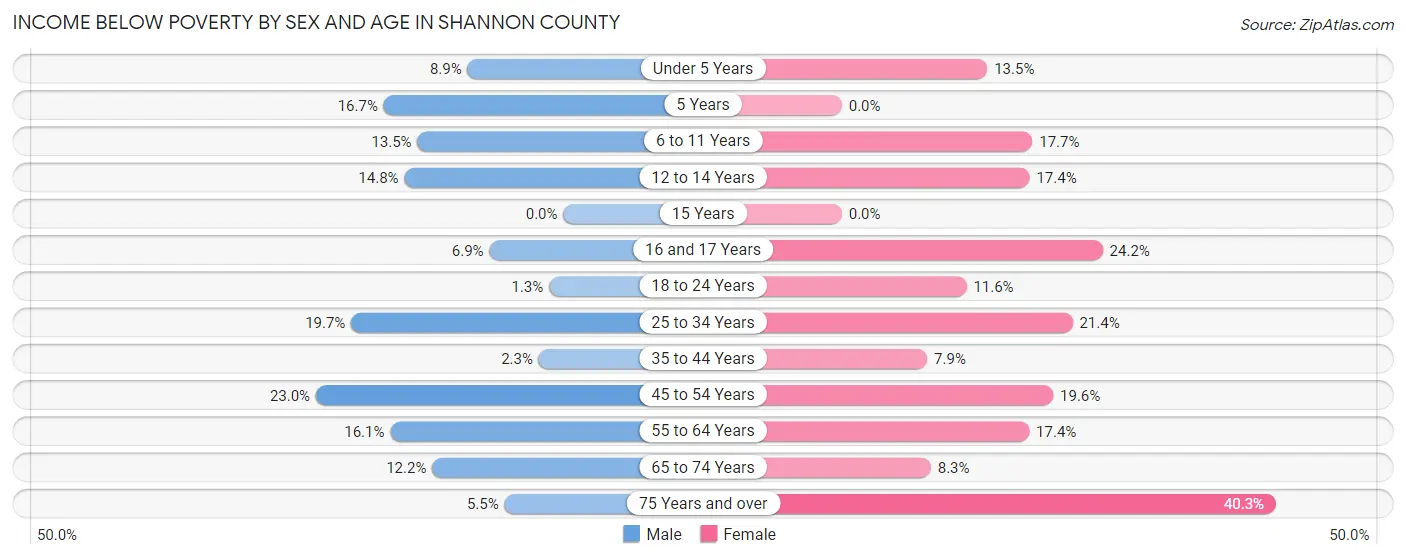
| Age Bracket | Male | Female |
| Under 5 Years | 16 (8.9%) | 22 (13.5%) |
| 5 Years | 1 (16.7%) | 0 (0.0%) |
| 6 to 11 Years | 47 (13.5%) | 32 (17.7%) |
| 12 to 14 Years | 9 (14.7%) | 23 (17.4%) |
| 15 Years | 0 (0.0%) | 0 (0.0%) |
| 16 and 17 Years | 7 (6.9%) | 23 (24.2%) |
| 18 to 24 Years | 3 (1.3%) | 25 (11.6%) |
| 25 to 34 Years | 75 (19.7%) | 73 (21.4%) |
| 35 to 44 Years | 9 (2.3%) | 29 (7.9%) |
| 45 to 54 Years | 104 (23.0%) | 80 (19.6%) |
| 55 to 64 Years | 92 (16.1%) | 100 (17.4%) |
| 65 to 74 Years | 56 (12.2%) | 40 (8.3%) |
| 75 Years and over | 16 (5.5%) | 139 (40.3%) |
| Total | 435 (12.2%) | 586 (17.2%) |
Income Above Poverty by Sex and Age in Shannon County
According to the poverty statistics in Shannon County, males aged 15 years and females aged 5 years are the age groups that are most secure financially, with 100.0% of males and 100.0% of females in these age groups living above the poverty line.
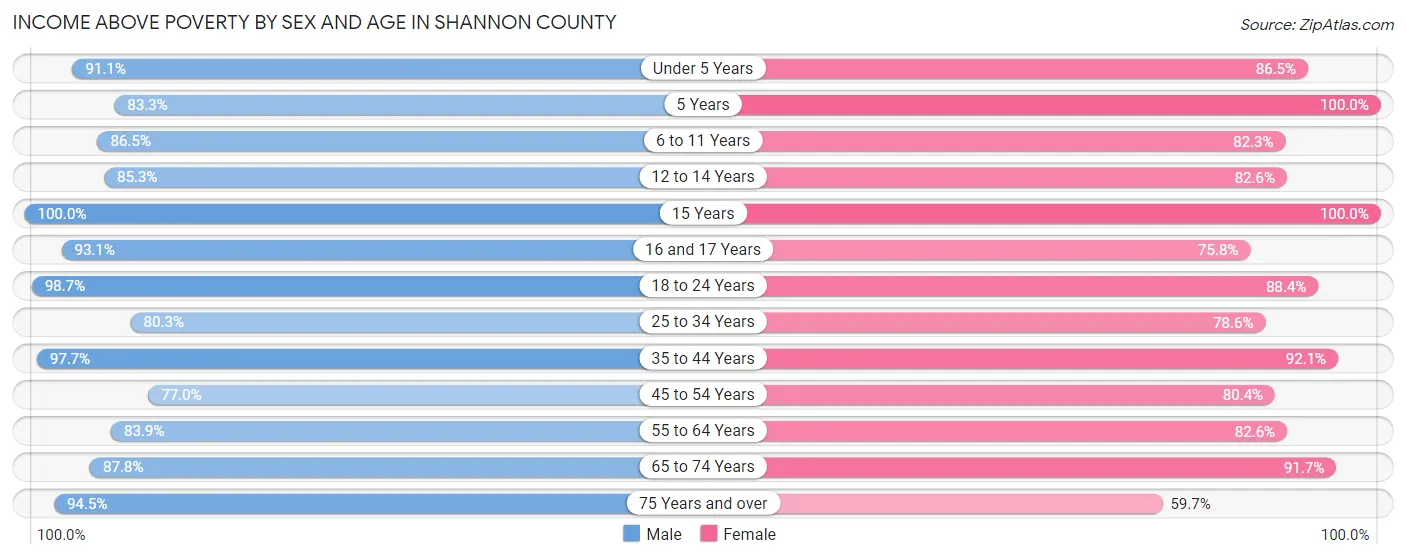
| Age Bracket | Male | Female |
| Under 5 Years | 164 (91.1%) | 141 (86.5%) |
| 5 Years | 5 (83.3%) | 89 (100.0%) |
| 6 to 11 Years | 300 (86.5%) | 149 (82.3%) |
| 12 to 14 Years | 52 (85.3%) | 109 (82.6%) |
| 15 Years | 78 (100.0%) | 8 (100.0%) |
| 16 and 17 Years | 95 (93.1%) | 72 (75.8%) |
| 18 to 24 Years | 222 (98.7%) | 191 (88.4%) |
| 25 to 34 Years | 306 (80.3%) | 268 (78.6%) |
| 35 to 44 Years | 386 (97.7%) | 337 (92.1%) |
| 45 to 54 Years | 349 (77.0%) | 328 (80.4%) |
| 55 to 64 Years | 481 (83.9%) | 475 (82.6%) |
| 65 to 74 Years | 404 (87.8%) | 444 (91.7%) |
| 75 Years and over | 277 (94.5%) | 206 (59.7%) |
| Total | 3,119 (87.8%) | 2,817 (82.8%) |
Income Below Poverty Among Married-Couple Families in Shannon County
The poverty statistics for married-couple families in Shannon County show that 3.6% or 57 of the total 1,586 families live below the poverty line. Families with 1 or 2 children have the highest poverty rate of 6.4%, comprising of 17 families. On the other hand, families with 3 or 4 children have the lowest poverty rate of 0.0%, which includes 0 families.
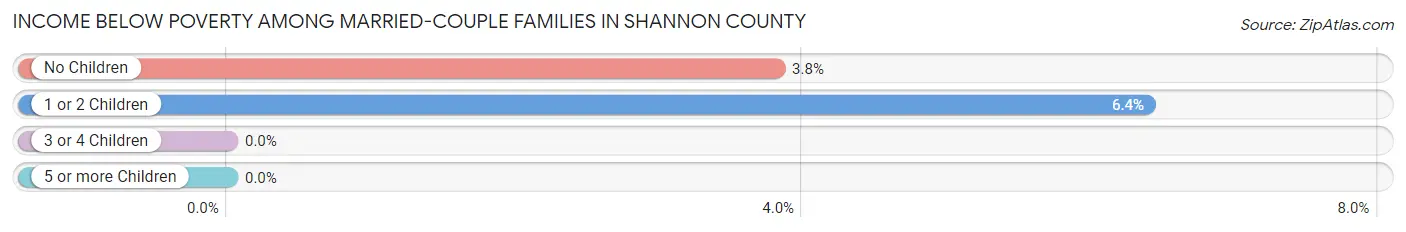
| Children | Above Poverty | Below Poverty |
| No Children | 1,011 (96.2%) | 40 (3.8%) |
| 1 or 2 Children | 249 (93.6%) | 17 (6.4%) |
| 3 or 4 Children | 269 (100.0%) | 0 (0.0%) |
| 5 or more Children | 0 (0.0%) | 0 (0.0%) |
| Total | 1,529 (96.4%) | 57 (3.6%) |
Income Below Poverty Among Single-Parent Households in Shannon County
According to the poverty data in Shannon County, 42.2% or 54 single-father households and 48.7% or 73 single-mother households are living below the poverty line. Among single-father households, those with no children have the highest poverty rate, with 48 households (53.3%) experiencing poverty. Likewise, among single-mother households, those with 5 or more children have the highest poverty rate, with 11 households (100.0%) falling below the poverty line.
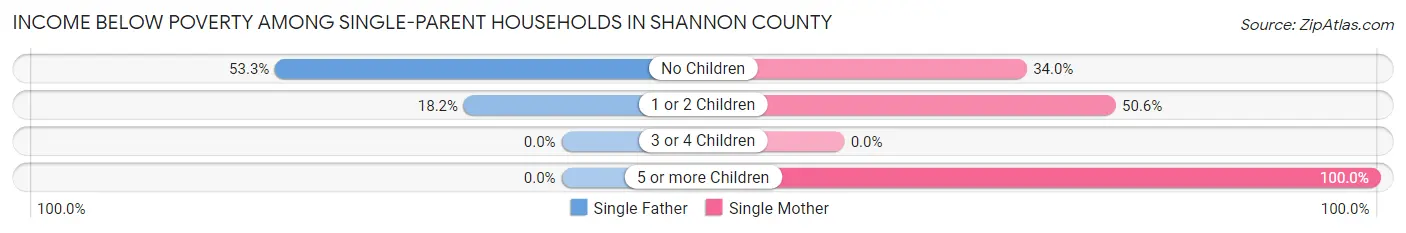
| Children | Single Father | Single Mother |
| No Children | 48 (53.3%) | 17 (34.0%) |
| 1 or 2 Children | 6 (18.2%) | 45 (50.6%) |
| 3 or 4 Children | 0 (0.0%) | 0 (0.0%) |
| 5 or more Children | 0 (0.0%) | 11 (100.0%) |
| Total | 54 (42.2%) | 73 (48.7%) |
Income Below Poverty Among Married-Couple vs Single-Parent Households in Shannon County
The poverty data for Shannon County shows that 57 of the married-couple family households (3.6%) and 127 of the single-parent households (45.7%) are living below the poverty level. Within the married-couple family households, those with 1 or 2 children have the highest poverty rate, with 17 households (6.4%) falling below the poverty line. Among the single-parent households, those with 5 or more children have the highest poverty rate, with 11 household (100.0%) living below poverty.
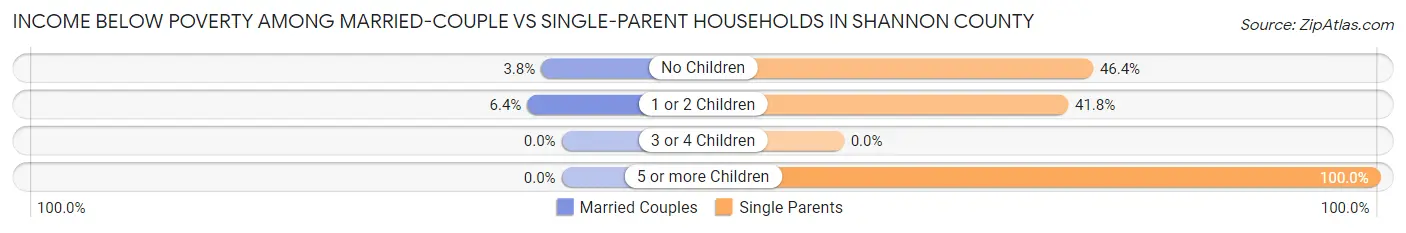
| Children | Married-Couple Families | Single-Parent Households |
| No Children | 40 (3.8%) | 65 (46.4%) |
| 1 or 2 Children | 17 (6.4%) | 51 (41.8%) |
| 3 or 4 Children | 0 (0.0%) | 0 (0.0%) |
| 5 or more Children | 0 (0.0%) | 11 (100.0%) |
| Total | 57 (3.6%) | 127 (45.7%) |
Race in Shannon County
The most populous races in Shannon County are White / Caucasian (6,635 | 93.0%), Two or more Races (444 | 6.2%), and Hispanic or Latino (27 | 0.4%).
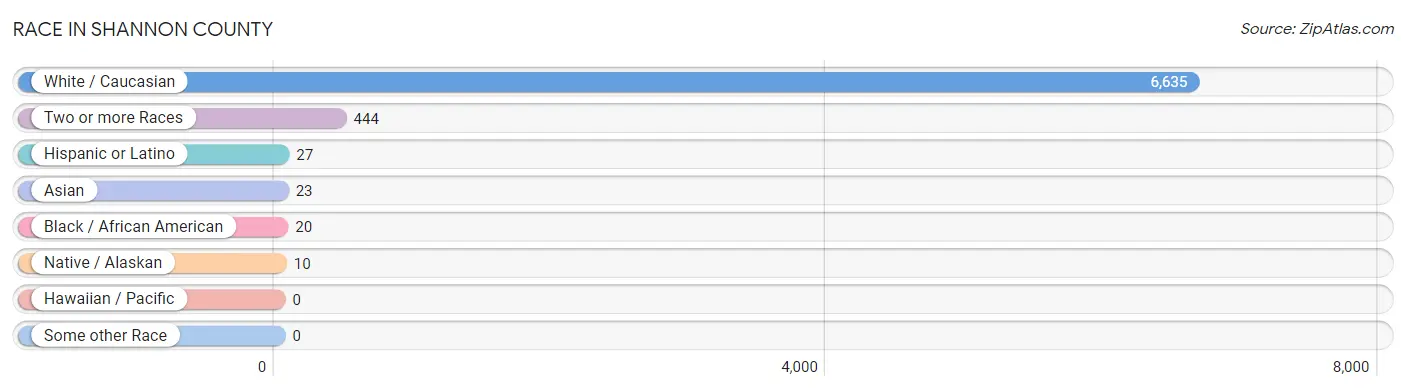
| Race | # Population | % Population |
| Asian | 23 | 0.3% |
| Black / African American | 20 | 0.3% |
| Hawaiian / Pacific | 0 | 0.0% |
| Hispanic or Latino | 27 | 0.4% |
| Native / Alaskan | 10 | 0.1% |
| White / Caucasian | 6,635 | 93.0% |
| Two or more Races | 444 | 6.2% |
| Some other Race | 0 | 0.0% |
| Total | 7,132 | 100.0% |
Ancestry in Shannon County
The most populous ancestries reported in Shannon County are German (1,254 | 17.6%), American (801 | 11.2%), English (744 | 10.4%), Irish (670 | 9.4%), and French (363 | 5.1%), together accounting for 53.7% of all Shannon County residents.
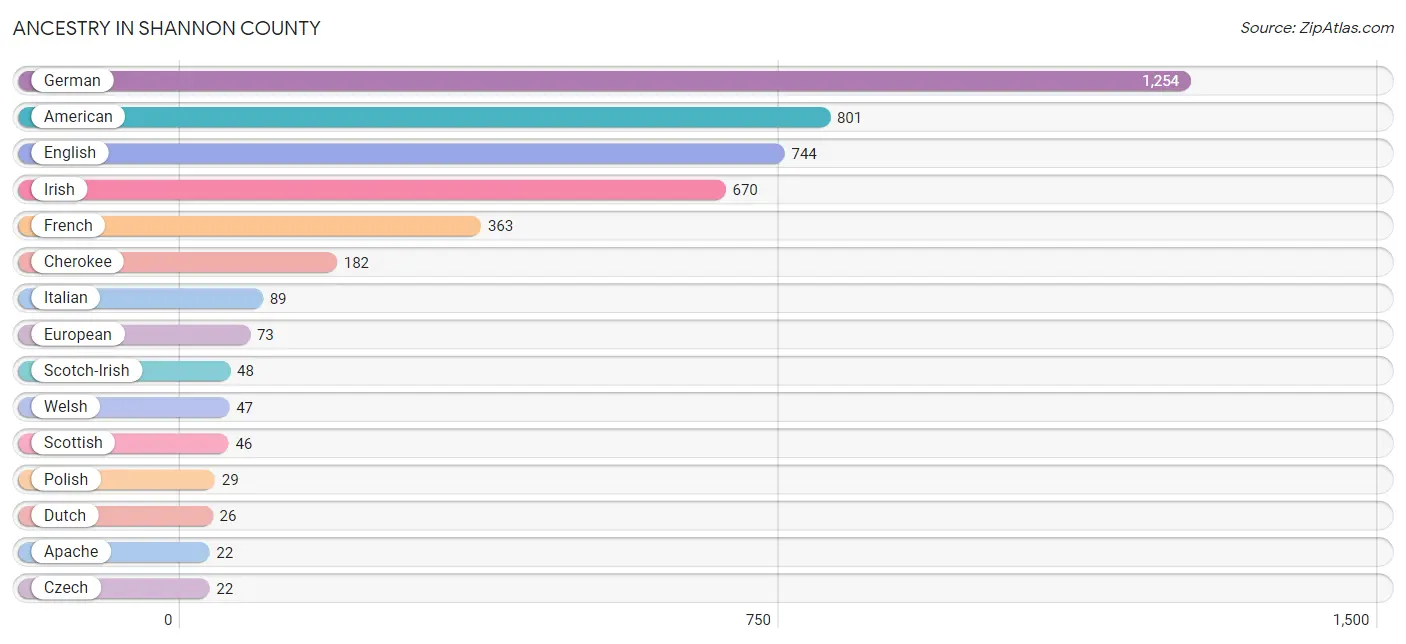
| Ancestry | # Population | % Population |
| American | 801 | 11.2% |
| Apache | 22 | 0.3% |
| Austrian | 10 | 0.1% |
| Belgian | 3 | 0.0% |
| Blackfeet | 4 | 0.1% |
| British | 12 | 0.2% |
| Celtic | 9 | 0.1% |
| Cherokee | 182 | 2.5% |
| Cuban | 21 | 0.3% |
| Czech | 22 | 0.3% |
| Dutch | 26 | 0.4% |
| Dutch West Indian | 6 | 0.1% |
| English | 744 | 10.4% |
| European | 73 | 1.0% |
| French | 363 | 5.1% |
| German | 1,254 | 17.6% |
| Ghanaian | 3 | 0.0% |
| Guamanian / Chamorro | 2 | 0.0% |
| Hungarian | 10 | 0.1% |
| Irish | 670 | 9.4% |
| Italian | 89 | 1.3% |
| Korean | 3 | 0.0% |
| Mexican | 6 | 0.1% |
| Mongolian | 3 | 0.0% |
| Native Hawaiian | 19 | 0.3% |
| Norwegian | 11 | 0.2% |
| Osage | 16 | 0.2% |
| Polish | 29 | 0.4% |
| Romanian | 13 | 0.2% |
| Scandinavian | 15 | 0.2% |
| Scotch-Irish | 48 | 0.7% |
| Scottish | 46 | 0.6% |
| Slavic | 18 | 0.3% |
| Sri Lankan | 20 | 0.3% |
| Subsaharan African | 3 | 0.0% |
| Swedish | 8 | 0.1% |
| Swiss | 15 | 0.2% |
| Ukrainian | 6 | 0.1% |
| Welsh | 47 | 0.7% | View All 39 Rows |
Immigrants in Shannon County
The most numerous immigrant groups reported in Shannon County came from Asia (23 | 0.3%), South Eastern Asia (23 | 0.3%), Vietnam (20 | 0.3%), Europe (14 | 0.2%), and England (8 | 0.1%), together accounting for 1.2% of all Shannon County residents.
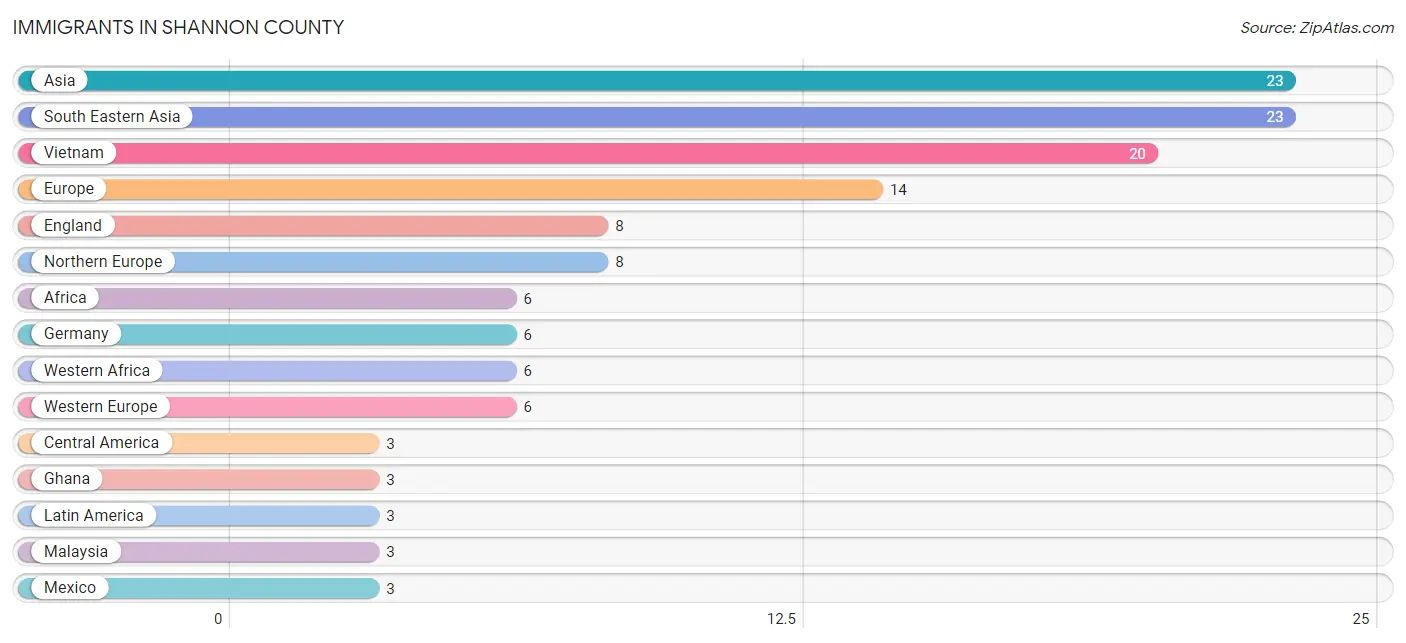
| Immigration Origin | # Population | % Population |
| Africa | 6 | 0.1% |
| Asia | 23 | 0.3% |
| Central America | 3 | 0.0% |
| England | 8 | 0.1% |
| Europe | 14 | 0.2% |
| Germany | 6 | 0.1% |
| Ghana | 3 | 0.0% |
| Latin America | 3 | 0.0% |
| Malaysia | 3 | 0.0% |
| Mexico | 3 | 0.0% |
| Nigeria | 3 | 0.0% |
| Northern Europe | 8 | 0.1% |
| South Eastern Asia | 23 | 0.3% |
| Vietnam | 20 | 0.3% |
| Western Africa | 6 | 0.1% |
| Western Europe | 6 | 0.1% | View All 16 Rows |
Sex and Age in Shannon County
Sex and Age in Shannon County
The most populous age groups in Shannon County are 60 to 64 Years (323 | 8.9%) for men and 75 to 79 Years (299 | 8.6%) for women.
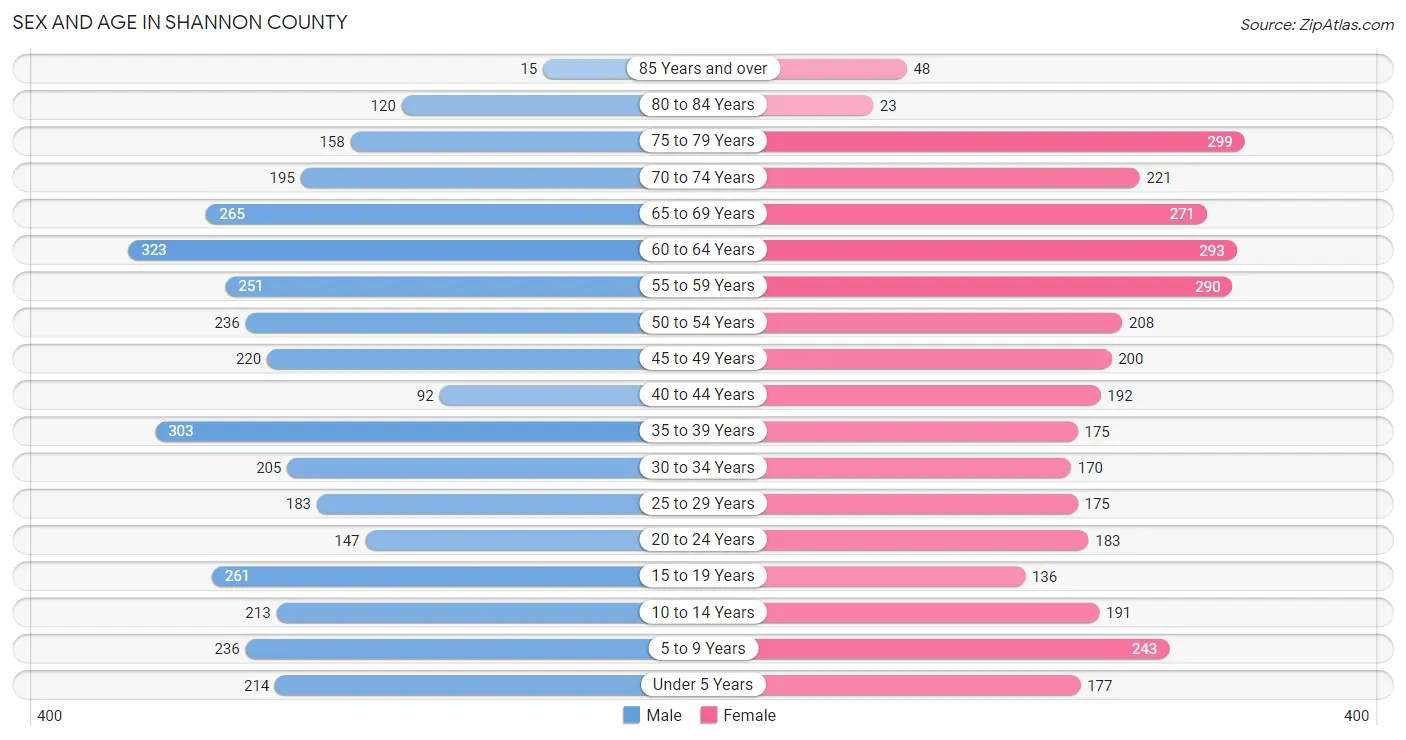
| Age Bracket | Male | Female |
| Under 5 Years | 214 (5.9%) | 177 (5.1%) |
| 5 to 9 Years | 236 (6.5%) | 243 (7.0%) |
| 10 to 14 Years | 213 (5.9%) | 191 (5.5%) |
| 15 to 19 Years | 261 (7.2%) | 136 (3.9%) |
| 20 to 24 Years | 147 (4.0%) | 183 (5.2%) |
| 25 to 29 Years | 183 (5.0%) | 175 (5.0%) |
| 30 to 34 Years | 205 (5.6%) | 170 (4.9%) |
| 35 to 39 Years | 303 (8.3%) | 175 (5.0%) |
| 40 to 44 Years | 92 (2.5%) | 192 (5.5%) |
| 45 to 49 Years | 220 (6.0%) | 200 (5.7%) |
| 50 to 54 Years | 236 (6.5%) | 208 (5.9%) |
| 55 to 59 Years | 251 (6.9%) | 290 (8.3%) |
| 60 to 64 Years | 323 (8.9%) | 293 (8.4%) |
| 65 to 69 Years | 265 (7.3%) | 271 (7.7%) |
| 70 to 74 Years | 195 (5.4%) | 221 (6.3%) |
| 75 to 79 Years | 158 (4.3%) | 299 (8.6%) |
| 80 to 84 Years | 120 (3.3%) | 23 (0.7%) |
| 85 Years and over | 15 (0.4%) | 48 (1.4%) |
| Total | 3,637 (100.0%) | 3,495 (100.0%) |
Families and Households in Shannon County
Median Family Size in Shannon County
The median family size in Shannon County is 3.06 persons per family, with single female/mother families (150 | 8.1%) accounting for the largest median family size of 3.57 persons per family. On the other hand, married-couple families (1,586 | 85.1%) represent the smallest median family size with 3.00 persons per family.
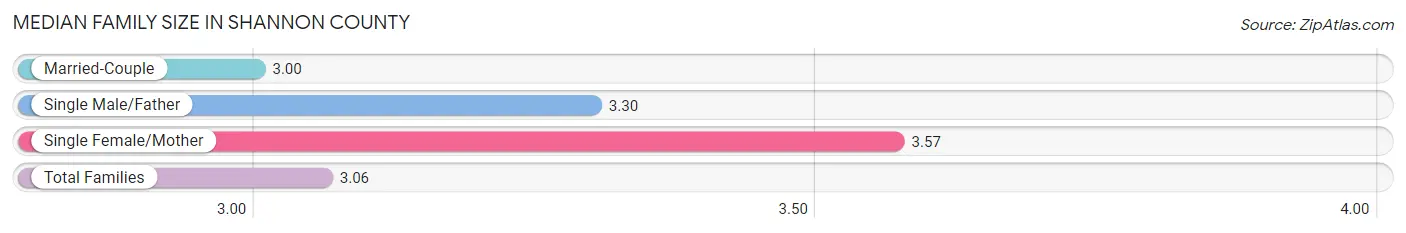
| Family Type | # Families | Family Size |
| Married-Couple | 1,586 (85.1%) | 3.00 |
| Single Male/Father | 128 (6.9%) | 3.30 |
| Single Female/Mother | 150 (8.1%) | 3.57 |
| Total Families | 1,864 (100.0%) | 3.06 |
Median Household Size in Shannon County
The median household size in Shannon County is 2.55 persons per household, with single female/mother households (150 | 5.4%) accounting for the largest median household size of 3.9 persons per household. non-family households (889 | 32.3%) represent the smallest median household size with 1.36 persons per household.
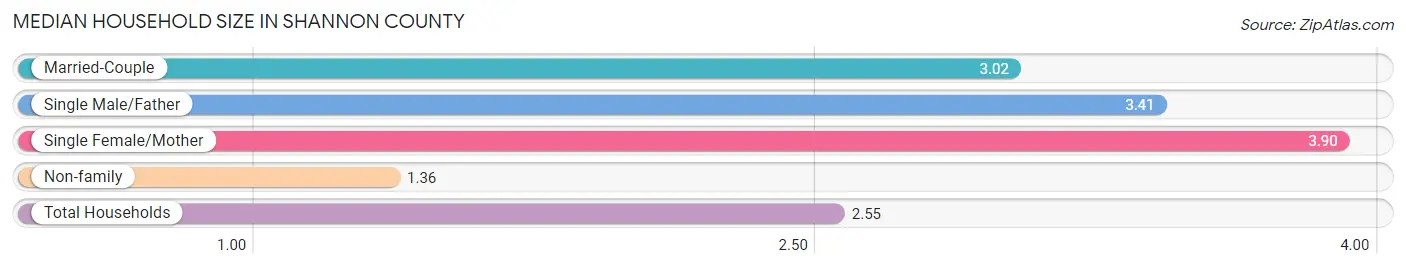
| Household Type | # Households | Household Size |
| Married-Couple | 1,586 (57.6%) | 3.02 |
| Single Male/Father | 128 (4.6%) | 3.41 |
| Single Female/Mother | 150 (5.4%) | 3.90 |
| Non-family | 889 (32.3%) | 1.36 |
| Total Households | 2,753 (100.0%) | 2.55 |
Household Size by Marriage Status in Shannon County
Out of a total of 2,753 households in Shannon County, 1,864 (67.7%) are family households, while 889 (32.3%) are nonfamily households. The most numerous type of family households are 2-person households, comprising 1,054, and the most common type of nonfamily households are 1-person households, comprising 721.
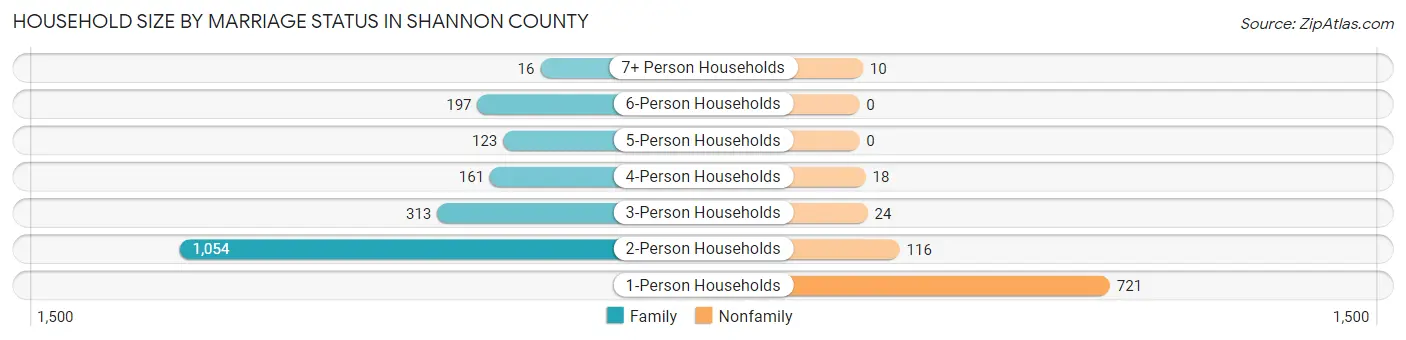
| Household Size | Family Households | Nonfamily Households |
| 1-Person Households | - | 721 (26.2%) |
| 2-Person Households | 1,054 (38.3%) | 116 (4.2%) |
| 3-Person Households | 313 (11.4%) | 24 (0.9%) |
| 4-Person Households | 161 (5.9%) | 18 (0.6%) |
| 5-Person Households | 123 (4.5%) | 0 (0.0%) |
| 6-Person Households | 197 (7.2%) | 0 (0.0%) |
| 7+ Person Households | 16 (0.6%) | 10 (0.4%) |
| Total | 1,864 (67.7%) | 889 (32.3%) |
Female Fertility in Shannon County
Fertility by Age in Shannon County
Average fertility rate in Shannon County is 131.0 births per 1,000 women. Women in the age bracket of 35 to 50 years have the highest fertility rate with 191.0 births per 1,000 women. Women in the age bracket of 35 to 50 years acount for 67.5% of all women with births.
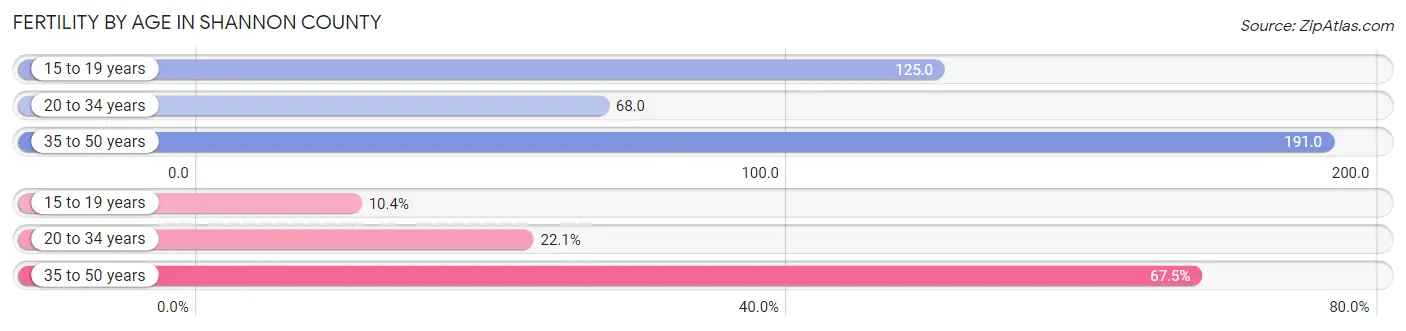
| Age Bracket | Women with Births | Births / 1,000 Women |
| 15 to 19 years | 17 (10.4%) | 125.0 |
| 20 to 34 years | 36 (22.1%) | 68.0 |
| 35 to 50 years | 110 (67.5%) | 191.0 |
| Total | 163 (100.0%) | 131.0 |
Fertility by Age by Marriage Status in Shannon County
80.4% of women with births (163) in Shannon County are married. The highest percentage of unmarried women with births falls into 15 to 19 years age bracket with 100.0% of them unmarried at the time of birth, while the lowest percentage of unmarried women with births belong to 35 to 50 years age bracket with 7.3% of them unmarried.
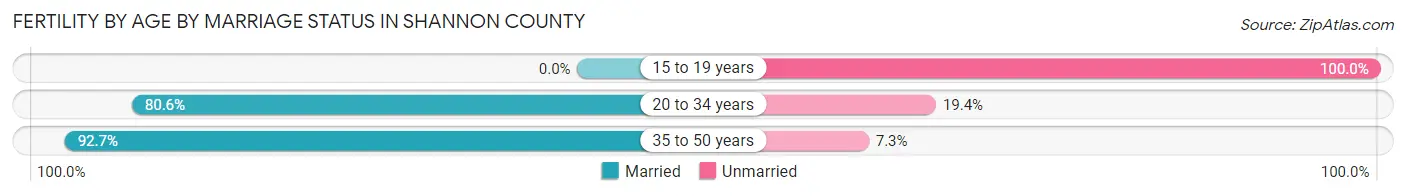
| Age Bracket | Married | Unmarried |
| 15 to 19 years | 0 (0.0%) | 17 (100.0%) |
| 20 to 34 years | 29 (80.6%) | 7 (19.4%) |
| 35 to 50 years | 102 (92.7%) | 8 (7.3%) |
| Total | 131 (80.4%) | 32 (19.6%) |
Fertility by Education in Shannon County
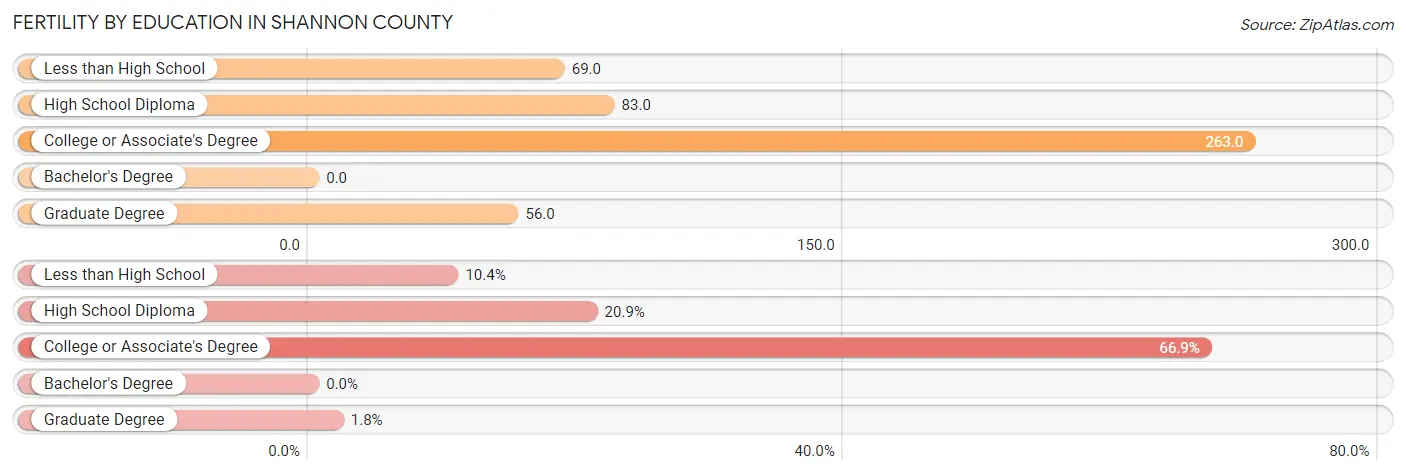
| Educational Attainment | Women with Births | Births / 1,000 Women |
| Less than High School | 17 (10.4%) | 69.0 |
| High School Diploma | 34 (20.9%) | 83.0 |
| College or Associate's Degree | 109 (66.9%) | 263.0 |
| Bachelor's Degree | 0 (0.0%) | 0.0 |
| Graduate Degree | 3 (1.8%) | 56.0 |
| Total | 163 (100.0%) | 131.0 |
Fertility by Education by Marriage Status in Shannon County
19.6% of women with births in Shannon County are unmarried. Women with the educational attainment of less than high school are most likely to be married with 100.0% of them married at childbirth, while women with the educational attainment of high school diploma are least likely to be married with 73.5% of them unmarried at childbirth.
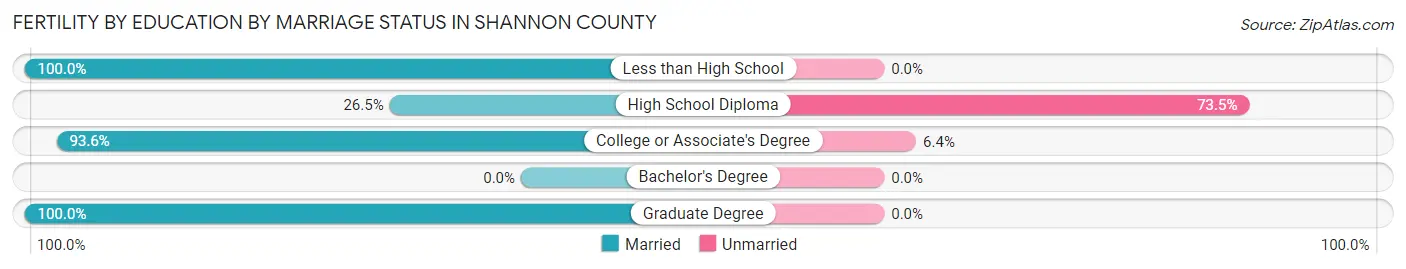
| Educational Attainment | Married | Unmarried |
| Less than High School | 17 (100.0%) | 0 (0.0%) |
| High School Diploma | 9 (26.5%) | 25 (73.5%) |
| College or Associate's Degree | 102 (93.6%) | 7 (6.4%) |
| Bachelor's Degree | 0 (0.0%) | 0 (0.0%) |
| Graduate Degree | 3 (100.0%) | 0 (0.0%) |
| Total | 131 (80.4%) | 32 (19.6%) |
Employment Characteristics in Shannon County
Employment by Class of Employer in Shannon County
Among the 2,672 employed individuals in Shannon County, private company employees (1,437 | 53.8%), not-for-profit organizations (328 | 12.3%), and self-employed (not incorporated) (307 | 11.5%) make up the most common classes of employment.
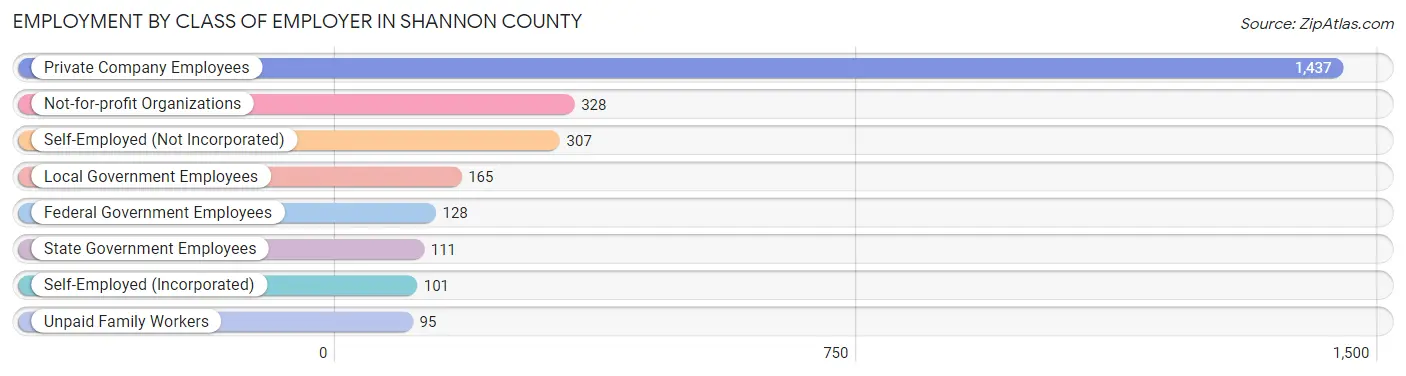
| Employer Class | # Employees | % Employees |
| Private Company Employees | 1,437 | 53.8% |
| Self-Employed (Incorporated) | 101 | 3.8% |
| Self-Employed (Not Incorporated) | 307 | 11.5% |
| Not-for-profit Organizations | 328 | 12.3% |
| Local Government Employees | 165 | 6.2% |
| State Government Employees | 111 | 4.2% |
| Federal Government Employees | 128 | 4.8% |
| Unpaid Family Workers | 95 | 3.6% |
| Total | 2,672 | 100.0% |
Employment Status by Age in Shannon County
According to the labor force statistics for Shannon County, out of the total population over 16 years of age (5,772), 47.9% or 2,765 individuals are in the labor force, with 2.7% or 75 of them unemployed. The age group with the highest labor force participation rate is 20 to 24 years, with 92.4% or 305 individuals in the labor force. Within the labor force, the 16 to 19 years age range has the highest percentage of unemployed individuals, with 26.6% or 41 of them being unemployed.
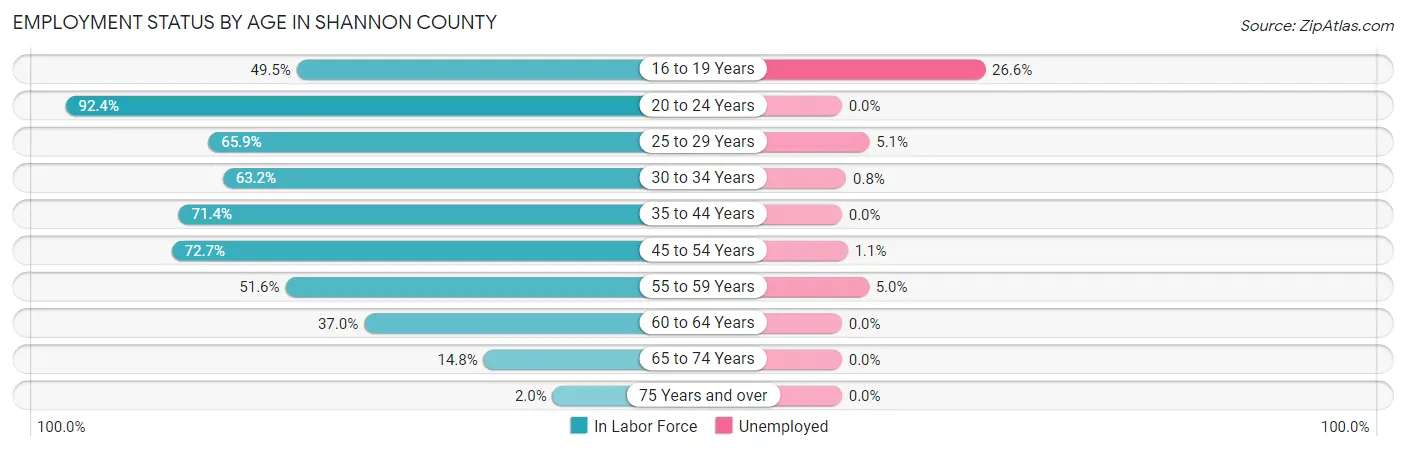
| Age Bracket | In Labor Force | Unemployed |
| 16 to 19 Years | 154 (49.5%) | 41 (26.6%) |
| 20 to 24 Years | 305 (92.4%) | 0 (0.0%) |
| 25 to 29 Years | 236 (65.9%) | 12 (5.1%) |
| 30 to 34 Years | 237 (63.2%) | 2 (0.8%) |
| 35 to 44 Years | 544 (71.4%) | 0 (0.0%) |
| 45 to 54 Years | 628 (72.7%) | 7 (1.1%) |
| 55 to 59 Years | 279 (51.6%) | 14 (5.0%) |
| 60 to 64 Years | 228 (37.0%) | 0 (0.0%) |
| 65 to 74 Years | 141 (14.8%) | 0 (0.0%) |
| 75 Years and over | 13 (2.0%) | 0 (0.0%) |
| Total | 2,765 (47.9%) | 75 (2.7%) |
Employment Status by Educational Attainment in Shannon County
According to labor force statistics for Shannon County, 61.2% of individuals (2,152) out of the total population between 25 and 64 years of age (3,516) are in the labor force, with 1.6% or 34 of them being unemployed. The group with the highest labor force participation rate are those with the educational attainment of bachelor's degree or higher, with 74.8% or 410 individuals in the labor force. Within the labor force, individuals with high school diploma education have the highest percentage of unemployment, with 2.6% or 26 of them being unemployed.
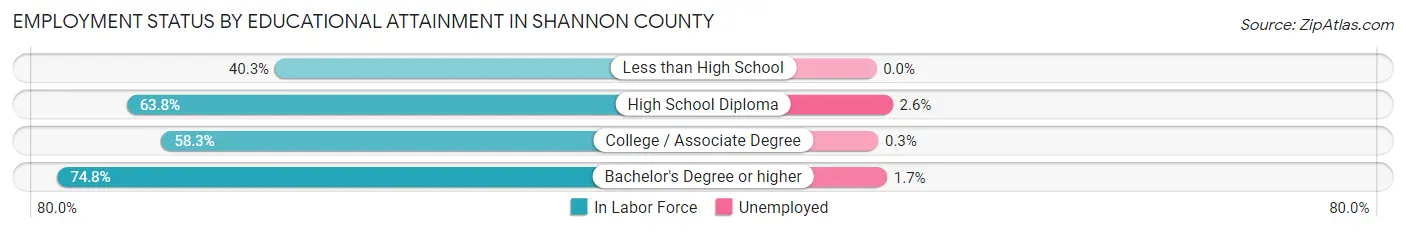
| Educational Attainment | In Labor Force | Unemployed |
| Less than High School | 163 (40.3%) | 0 (0.0%) |
| High School Diploma | 983 (63.8%) | 40 (2.6%) |
| College / Associate Degree | 596 (58.3%) | 3 (0.3%) |
| Bachelor's Degree or higher | 410 (74.8%) | 9 (1.7%) |
| Total | 2,152 (61.2%) | 56 (1.6%) |
Employment Occupations by Sex in Shannon County
Management, Business, Science and Arts Occupations
The most common Management, Business, Science and Arts occupations in Shannon County are Community & Social Service (336 | 12.5%), Management (163 | 6.1%), Education Instruction & Library (149 | 5.5%), Health Diagnosing & Treating (113 | 4.2%), and Education, Arts & Media (103 | 3.8%).
Management, Business, Science and Arts Occupations by Sex
Within the Management, Business, Science and Arts occupations in Shannon County, the most male-oriented occupations are Life, Physical & Social Science (100.0%), Computers & Mathematics (66.7%), and Management (66.3%), while the most female-oriented occupations are Architecture & Engineering (100.0%), Legal Services & Support (100.0%), and Arts, Media & Entertainment (86.2%).
| Occupation | Male | Female |
| Management | 108 (66.3%) | 55 (33.7%) |
| Business & Financial | 24 (45.3%) | 29 (54.7%) |
| Computers, Engineering & Science | 19 (61.3%) | 12 (38.7%) |
| Computers & Mathematics | 16 (66.7%) | 8 (33.3%) |
| Architecture & Engineering | 0 (0.0%) | 4 (100.0%) |
| Life, Physical & Social Science | 3 (100.0%) | 0 (0.0%) |
| Community & Social Service | 100 (29.8%) | 236 (70.2%) |
| Education, Arts & Media | 38 (36.9%) | 65 (63.1%) |
| Legal Services & Support | 0 (0.0%) | 19 (100.0%) |
| Education Instruction & Library | 53 (35.6%) | 96 (64.4%) |
| Arts, Media & Entertainment | 9 (13.9%) | 56 (86.2%) |
| Health Diagnosing & Treating | 22 (19.5%) | 91 (80.5%) |
| Health Technologists | 22 (26.8%) | 60 (73.2%) |
| Total (Category) | 273 (39.2%) | 423 (60.8%) |
| Total (Overall) | 1,554 (57.8%) | 1,135 (42.2%) |
Services Occupations
The most common Services occupations in Shannon County are Cleaning & Maintenance (147 | 5.5%), Security & Protection (127 | 4.7%), Law Enforcement (115 | 4.3%), Food Preparation & Serving (89 | 3.3%), and Healthcare Support (65 | 2.4%).
Services Occupations by Sex
Within the Services occupations in Shannon County, the most male-oriented occupations are Firefighting & Prevention (100.0%), Security & Protection (89.0%), and Law Enforcement (87.8%), while the most female-oriented occupations are Healthcare Support (100.0%), Personal Care & Service (75.9%), and Cleaning & Maintenance (68.0%).
| Occupation | Male | Female |
| Healthcare Support | 0 (0.0%) | 65 (100.0%) |
| Security & Protection | 113 (89.0%) | 14 (11.0%) |
| Firefighting & Prevention | 12 (100.0%) | 0 (0.0%) |
| Law Enforcement | 101 (87.8%) | 14 (12.2%) |
| Food Preparation & Serving | 43 (48.3%) | 46 (51.7%) |
| Cleaning & Maintenance | 47 (32.0%) | 100 (68.0%) |
| Personal Care & Service | 7 (24.1%) | 22 (75.9%) |
| Total (Category) | 210 (46.0%) | 247 (54.0%) |
| Total (Overall) | 1,554 (57.8%) | 1,135 (42.2%) |
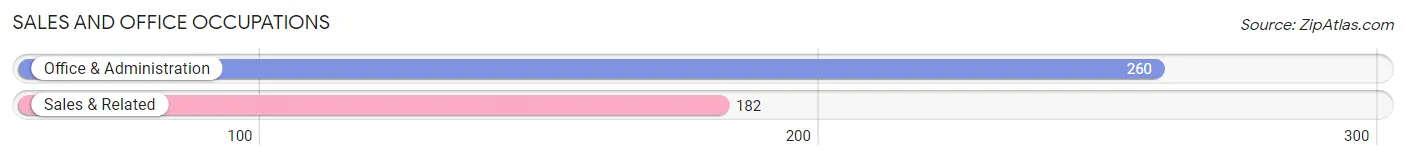
Sales and Office Occupations
The most common Sales and Office occupations in Shannon County are Office & Administration (260 | 9.7%), and Sales & Related (182 | 6.8%).
Sales and Office Occupations by Sex
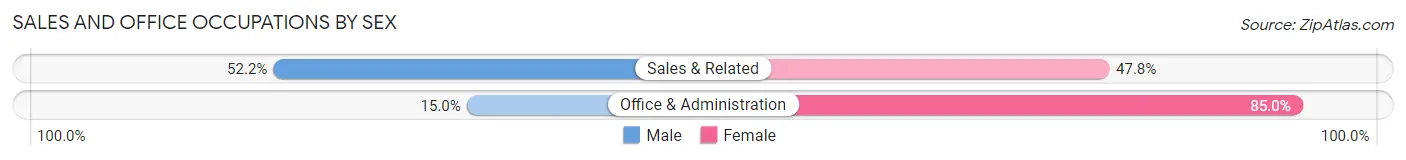
| Occupation | Male | Female |
| Sales & Related | 95 (52.2%) | 87 (47.8%) |
| Office & Administration | 39 (15.0%) | 221 (85.0%) |
| Total (Category) | 134 (30.3%) | 308 (69.7%) |
| Total (Overall) | 1,554 (57.8%) | 1,135 (42.2%) |
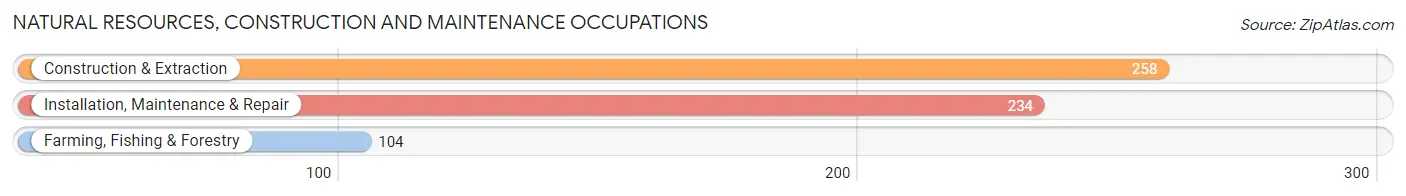
Natural Resources, Construction and Maintenance Occupations
The most common Natural Resources, Construction and Maintenance occupations in Shannon County are Construction & Extraction (258 | 9.6%), Installation, Maintenance & Repair (234 | 8.7%), and Farming, Fishing & Forestry (104 | 3.9%).
Natural Resources, Construction and Maintenance Occupations by Sex
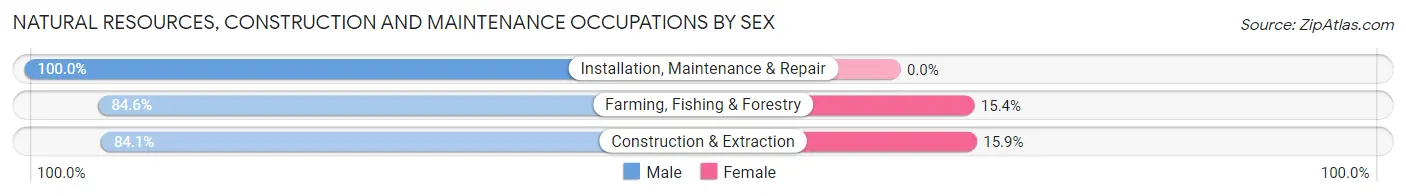
| Occupation | Male | Female |
| Farming, Fishing & Forestry | 88 (84.6%) | 16 (15.4%) |
| Construction & Extraction | 217 (84.1%) | 41 (15.9%) |
| Installation, Maintenance & Repair | 234 (100.0%) | 0 (0.0%) |
| Total (Category) | 539 (90.4%) | 57 (9.6%) |
| Total (Overall) | 1,554 (57.8%) | 1,135 (42.2%) |
Production, Transportation and Moving Occupations
The most common Production, Transportation and Moving occupations in Shannon County are Production (231 | 8.6%), Transportation (149 | 5.5%), and Material Moving (118 | 4.4%).
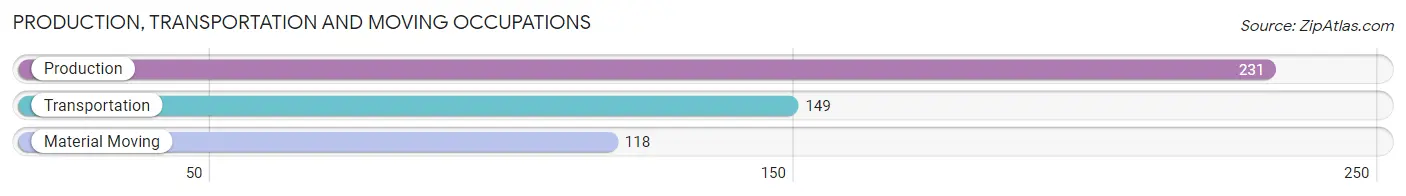
Production, Transportation and Moving Occupations by Sex
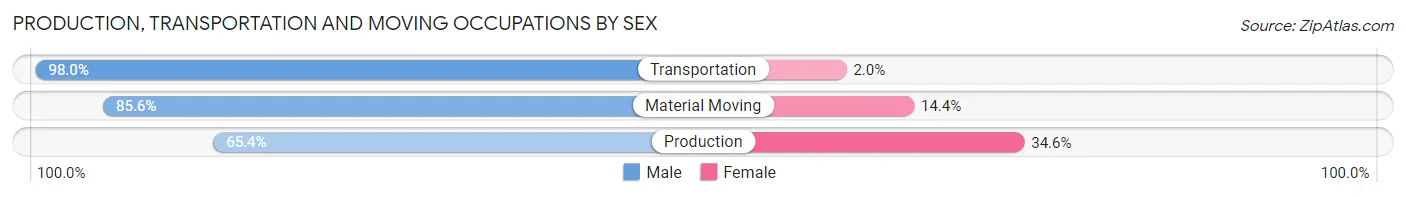
| Occupation | Male | Female |
| Production | 151 (65.4%) | 80 (34.6%) |
| Transportation | 146 (98.0%) | 3 (2.0%) |
| Material Moving | 101 (85.6%) | 17 (14.4%) |
| Total (Category) | 398 (79.9%) | 100 (20.1%) |
| Total (Overall) | 1,554 (57.8%) | 1,135 (42.2%) |
Employment Industries by Sex in Shannon County
Employment Industries in Shannon County
The major employment industries in Shannon County include Manufacturing (400 | 14.9%), Construction (337 | 12.5%), Retail Trade (260 | 9.7%), Educational Services (231 | 8.6%), and Public Administration (204 | 7.6%).
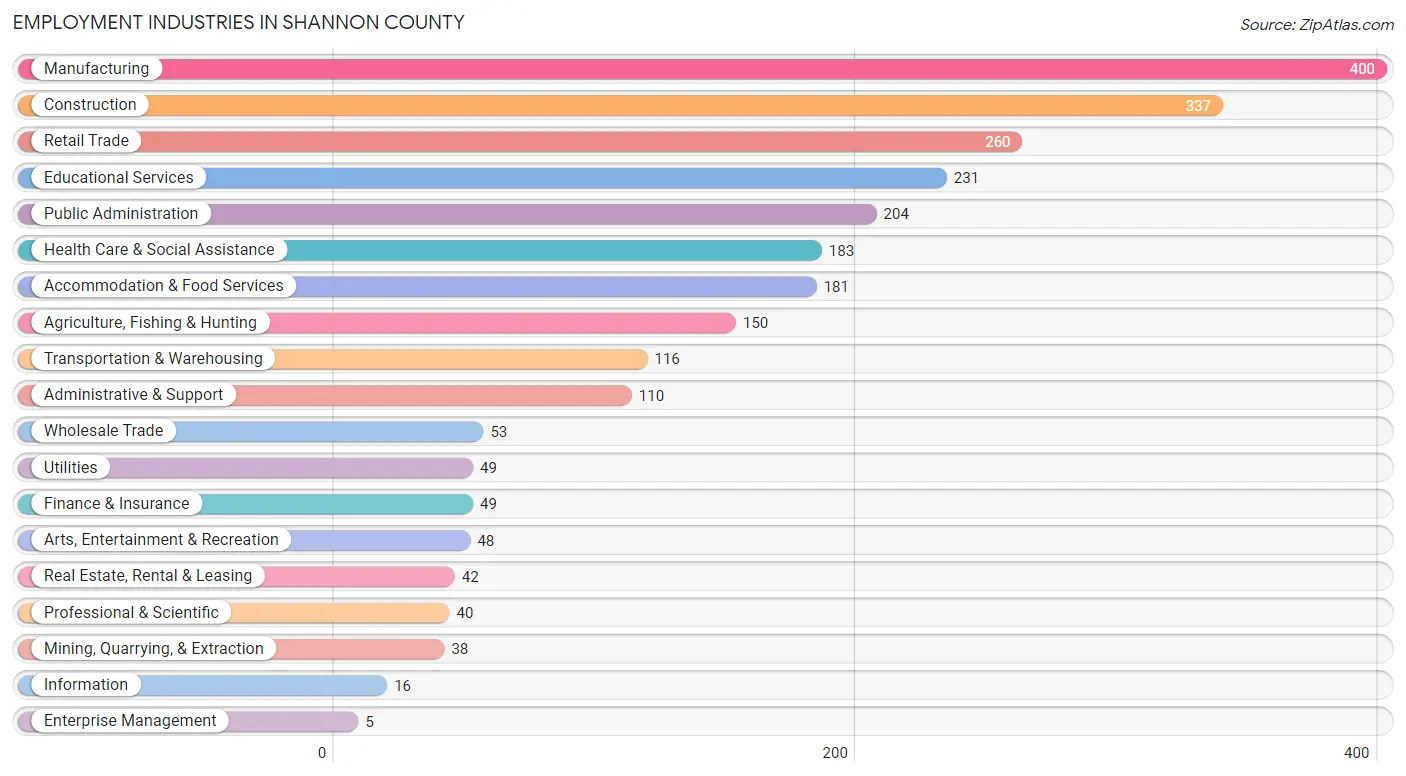
Employment Industries by Sex in Shannon County
The Shannon County industries that see more men than women are Utilities (100.0%), Enterprise Management (100.0%), and Agriculture, Fishing & Hunting (89.3%), whereas the industries that tend to have a higher number of women are Real Estate, Rental & Leasing (100.0%), Finance & Insurance (93.9%), and Arts, Entertainment & Recreation (87.5%).
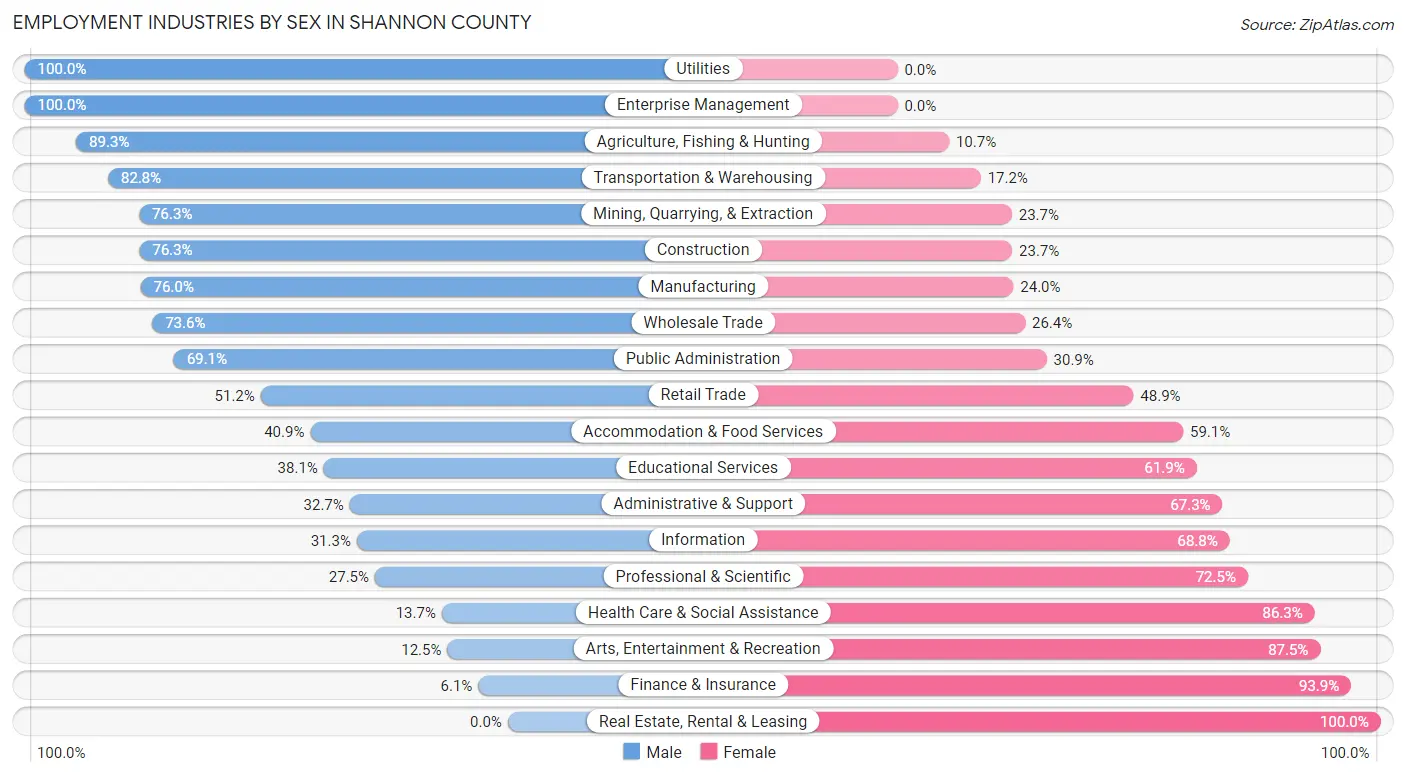
| Industry | Male | Female |
| Agriculture, Fishing & Hunting | 134 (89.3%) | 16 (10.7%) |
| Mining, Quarrying, & Extraction | 29 (76.3%) | 9 (23.7%) |
| Construction | 257 (76.3%) | 80 (23.7%) |
| Manufacturing | 304 (76.0%) | 96 (24.0%) |
| Wholesale Trade | 39 (73.6%) | 14 (26.4%) |
| Retail Trade | 133 (51.1%) | 127 (48.8%) |
| Transportation & Warehousing | 96 (82.8%) | 20 (17.2%) |
| Utilities | 49 (100.0%) | 0 (0.0%) |
| Information | 5 (31.2%) | 11 (68.8%) |
| Finance & Insurance | 3 (6.1%) | 46 (93.9%) |
| Real Estate, Rental & Leasing | 0 (0.0%) | 42 (100.0%) |
| Professional & Scientific | 11 (27.5%) | 29 (72.5%) |
| Enterprise Management | 5 (100.0%) | 0 (0.0%) |
| Administrative & Support | 36 (32.7%) | 74 (67.3%) |
| Educational Services | 88 (38.1%) | 143 (61.9%) |
| Health Care & Social Assistance | 25 (13.7%) | 158 (86.3%) |
| Arts, Entertainment & Recreation | 6 (12.5%) | 42 (87.5%) |
| Accommodation & Food Services | 74 (40.9%) | 107 (59.1%) |
| Public Administration | 141 (69.1%) | 63 (30.9%) |
| Total | 1,554 (57.8%) | 1,135 (42.2%) |
Education in Shannon County
School Enrollment in Shannon County
The most common levels of schooling among the 1,474 students in Shannon County are elementary school (386 | 26.2%), middle school (381 | 25.9%), and high school (274 | 18.6%).
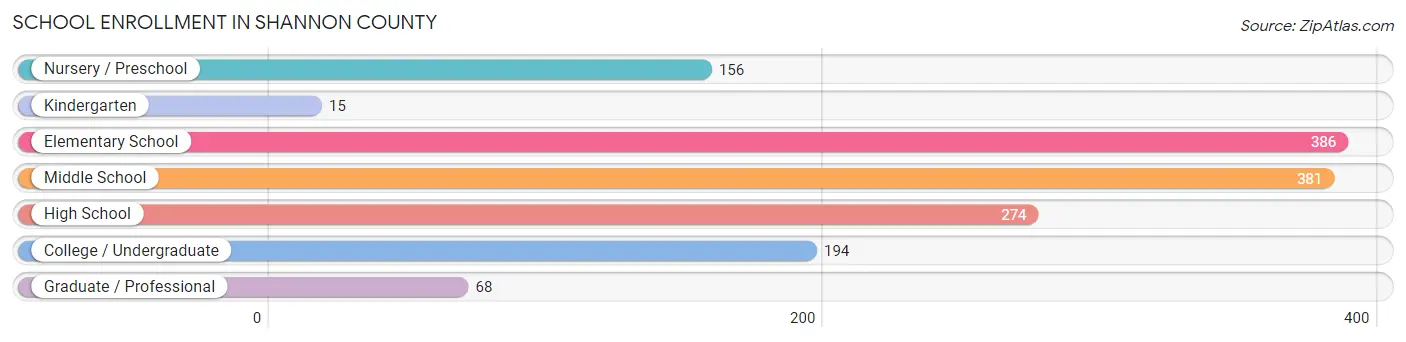
| School Level | # Students | % Students |
| Nursery / Preschool | 156 | 10.6% |
| Kindergarten | 15 | 1.0% |
| Elementary School | 386 | 26.2% |
| Middle School | 381 | 25.9% |
| High School | 274 | 18.6% |
| College / Undergraduate | 194 | 13.2% |
| Graduate / Professional | 68 | 4.6% |
| Total | 1,474 | 100.0% |
School Enrollment by Age by Funding Source in Shannon County
Out of a total of 1,474 students who are enrolled in schools in Shannon County, 139 (9.4%) attend a private institution, while the remaining 1,335 (90.6%) are enrolled in public schools. The age group of 20 to 24 year olds has the highest likelihood of being enrolled in private schools, with 27 (75.0% in the age bracket) enrolled. Conversely, the age group of 3 to 4 year olds has the lowest likelihood of being enrolled in a private school, with 54 (100.0% in the age bracket) attending a public institution.
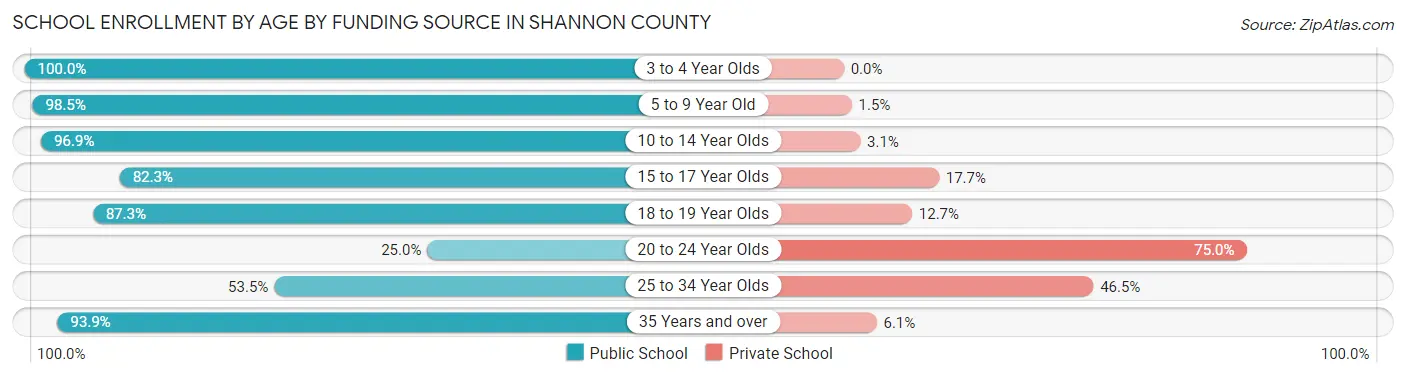
| Age Bracket | Public School | Private School |
| 3 to 4 Year Olds | 54 (100.0%) | 0 (0.0%) |
| 5 to 9 Year Old | 467 (98.5%) | 7 (1.5%) |
| 10 to 14 Year Olds | 380 (96.9%) | 12 (3.1%) |
| 15 to 17 Year Olds | 195 (82.3%) | 42 (17.7%) |
| 18 to 19 Year Olds | 55 (87.3%) | 8 (12.7%) |
| 20 to 24 Year Olds | 9 (25.0%) | 27 (75.0%) |
| 25 to 34 Year Olds | 38 (53.5%) | 33 (46.5%) |
| 35 Years and over | 138 (93.9%) | 9 (6.1%) |
| Total | 1,335 (90.6%) | 139 (9.4%) |
Educational Attainment by Field of Study in Shannon County
Education (276 | 35.1%), science & technology (123 | 15.6%), liberal arts & history (101 | 12.8%), business (60 | 7.6%), and social sciences (45 | 5.7%) are the most common fields of study among 787 individuals in Shannon County who have obtained a bachelor's degree or higher.
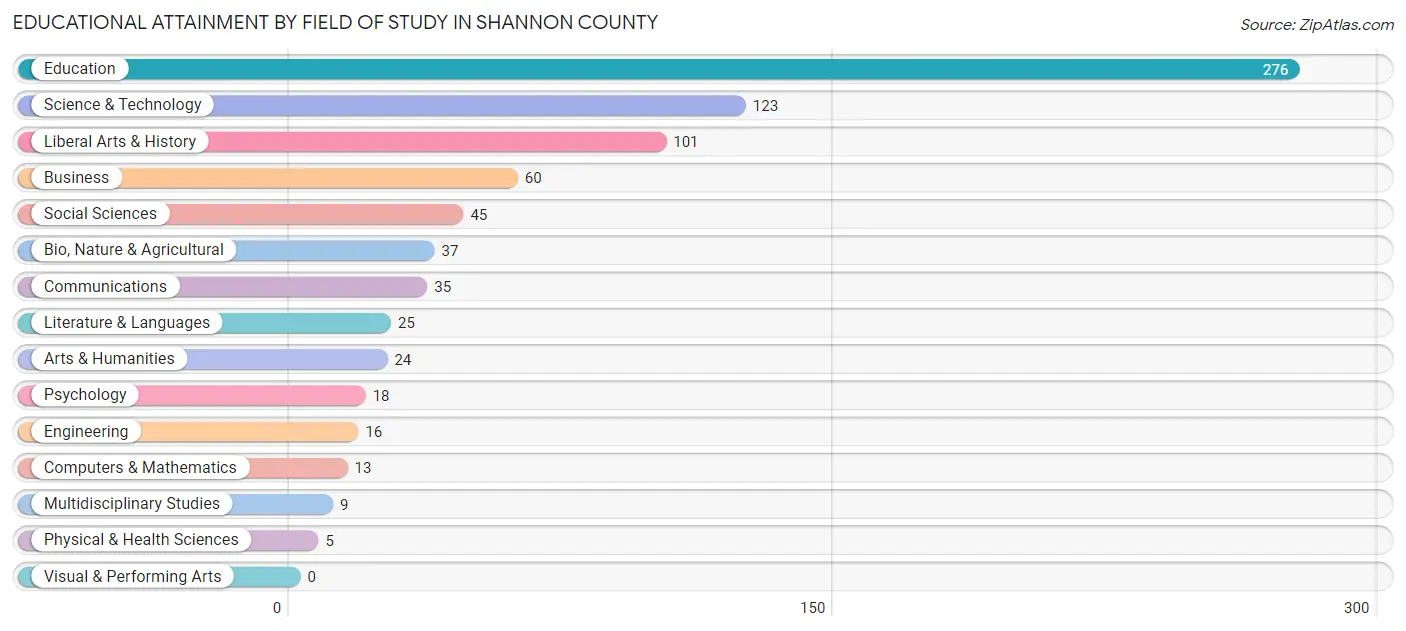
| Field of Study | # Graduates | % Graduates |
| Computers & Mathematics | 13 | 1.7% |
| Bio, Nature & Agricultural | 37 | 4.7% |
| Physical & Health Sciences | 5 | 0.6% |
| Psychology | 18 | 2.3% |
| Social Sciences | 45 | 5.7% |
| Engineering | 16 | 2.0% |
| Multidisciplinary Studies | 9 | 1.1% |
| Science & Technology | 123 | 15.6% |
| Business | 60 | 7.6% |
| Education | 276 | 35.1% |
| Literature & Languages | 25 | 3.2% |
| Liberal Arts & History | 101 | 12.8% |
| Visual & Performing Arts | 0 | 0.0% |
| Communications | 35 | 4.4% |
| Arts & Humanities | 24 | 3.0% |
| Total | 787 | 100.0% |
Transportation & Commute in Shannon County
Vehicle Availability by Sex in Shannon County
The most prevalent vehicle ownership categories in Shannon County are males with 2 vehicles (586, accounting for 38.2%) and females with 2 vehicles (392, making up 51.6%).
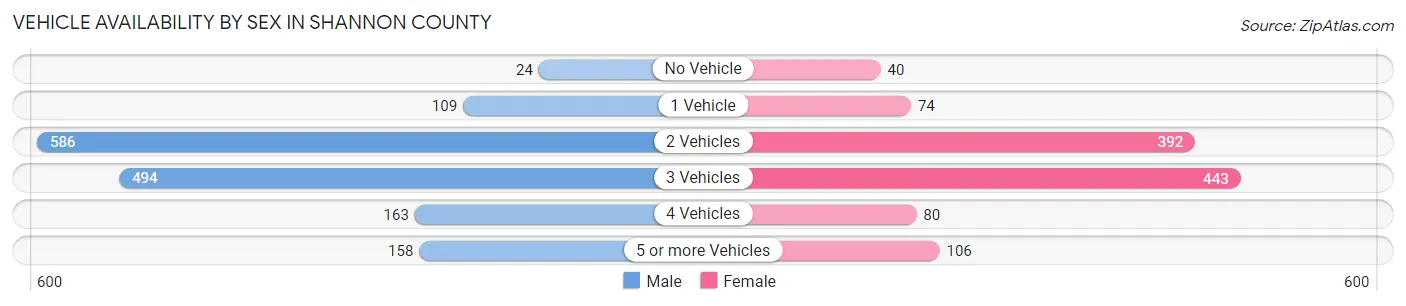
| Vehicles Available | Male | Female |
| No Vehicle | 24 (1.6%) | 40 (3.5%) |
| 1 Vehicle | 109 (7.1%) | 74 (6.5%) |
| 2 Vehicles | 586 (38.2%) | 392 (34.5%) |
| 3 Vehicles | 494 (32.2%) | 443 (39.0%) |
| 4 Vehicles | 163 (10.6%) | 80 (7.0%) |
| 5 or more Vehicles | 158 (10.3%) | 106 (9.3%) |
| Total | 1,534 (100.0%) | 1,135 (100.0%) |
Commute Time in Shannon County
The most frequently occuring commute durations in Shannon County are 15 to 19 minutes (399 commuters, 16.2%), 5 to 9 minutes (385 commuters, 15.6%), and 10 to 14 minutes (305 commuters, 12.4%).
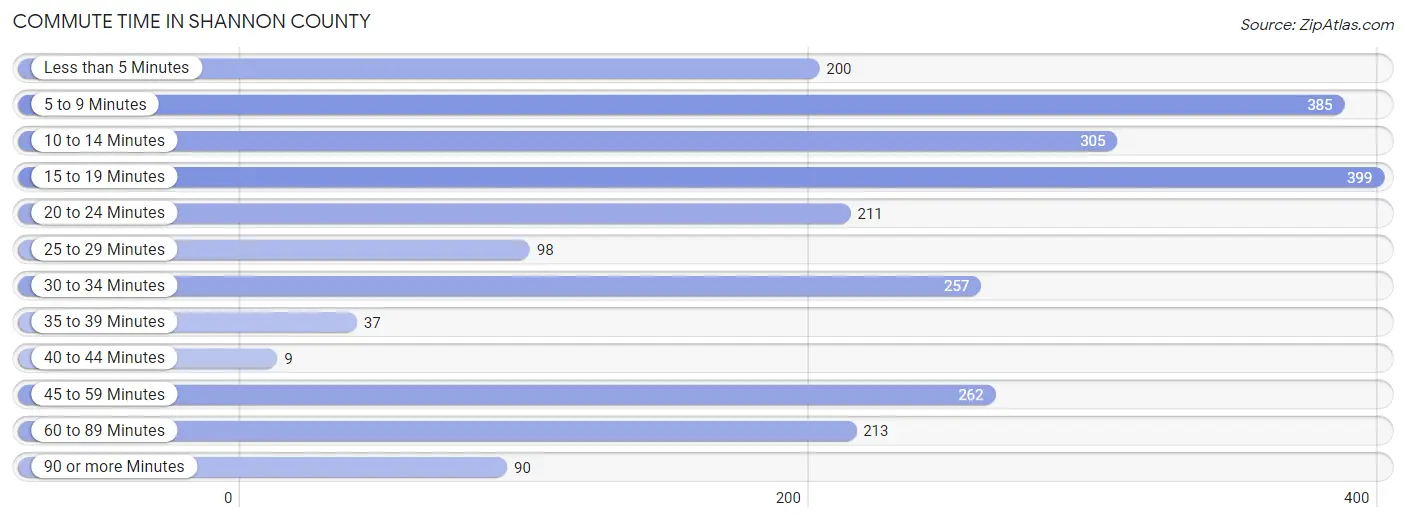
| Commute Time | # Commuters | % Commuters |
| Less than 5 Minutes | 200 | 8.1% |
| 5 to 9 Minutes | 385 | 15.6% |
| 10 to 14 Minutes | 305 | 12.4% |
| 15 to 19 Minutes | 399 | 16.2% |
| 20 to 24 Minutes | 211 | 8.6% |
| 25 to 29 Minutes | 98 | 4.0% |
| 30 to 34 Minutes | 257 | 10.4% |
| 35 to 39 Minutes | 37 | 1.5% |
| 40 to 44 Minutes | 9 | 0.4% |
| 45 to 59 Minutes | 262 | 10.6% |
| 60 to 89 Minutes | 213 | 8.6% |
| 90 or more Minutes | 90 | 3.6% |
Commute Time by Sex in Shannon County
The most common commute times in Shannon County are 5 to 9 minutes (262 commuters, 18.6%) for males and 15 to 19 minutes (214 commuters, 20.2%) for females.
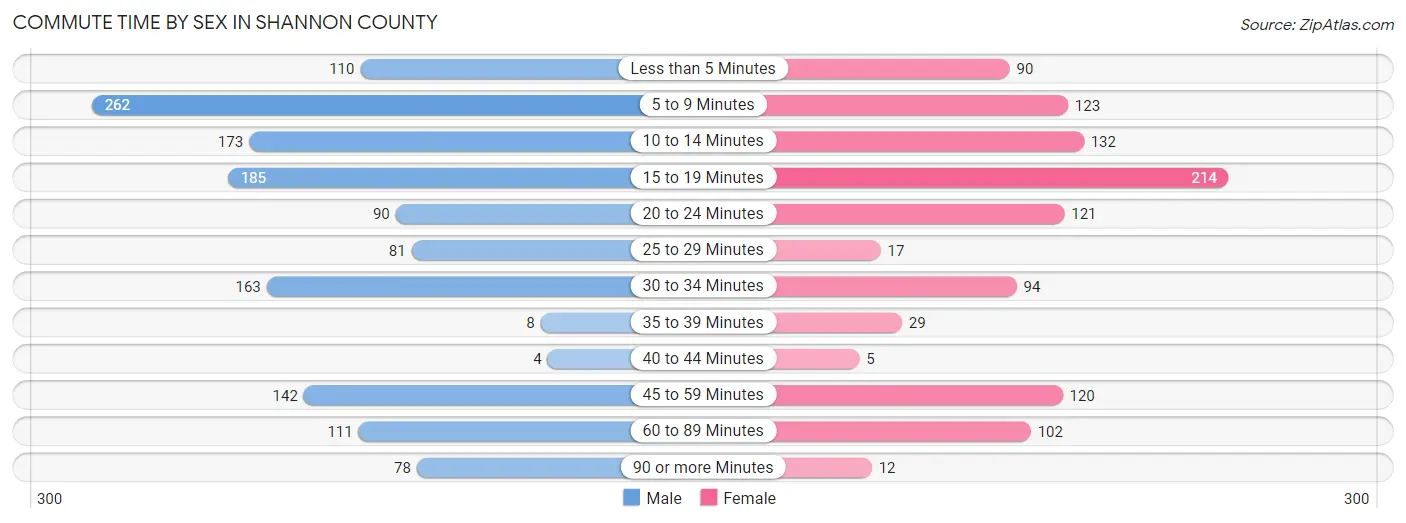
| Commute Time | Male | Female |
| Less than 5 Minutes | 110 (7.8%) | 90 (8.5%) |
| 5 to 9 Minutes | 262 (18.6%) | 123 (11.6%) |
| 10 to 14 Minutes | 173 (12.3%) | 132 (12.5%) |
| 15 to 19 Minutes | 185 (13.2%) | 214 (20.2%) |
| 20 to 24 Minutes | 90 (6.4%) | 121 (11.4%) |
| 25 to 29 Minutes | 81 (5.8%) | 17 (1.6%) |
| 30 to 34 Minutes | 163 (11.6%) | 94 (8.9%) |
| 35 to 39 Minutes | 8 (0.6%) | 29 (2.7%) |
| 40 to 44 Minutes | 4 (0.3%) | 5 (0.5%) |
| 45 to 59 Minutes | 142 (10.1%) | 120 (11.3%) |
| 60 to 89 Minutes | 111 (7.9%) | 102 (9.6%) |
| 90 or more Minutes | 78 (5.5%) | 12 (1.1%) |
Time of Departure to Work by Sex in Shannon County
The most frequent times of departure to work in Shannon County are 6:30 AM to 6:59 AM (269, 19.1%) for males and 7:00 AM to 7:29 AM (288, 27.2%) for females.
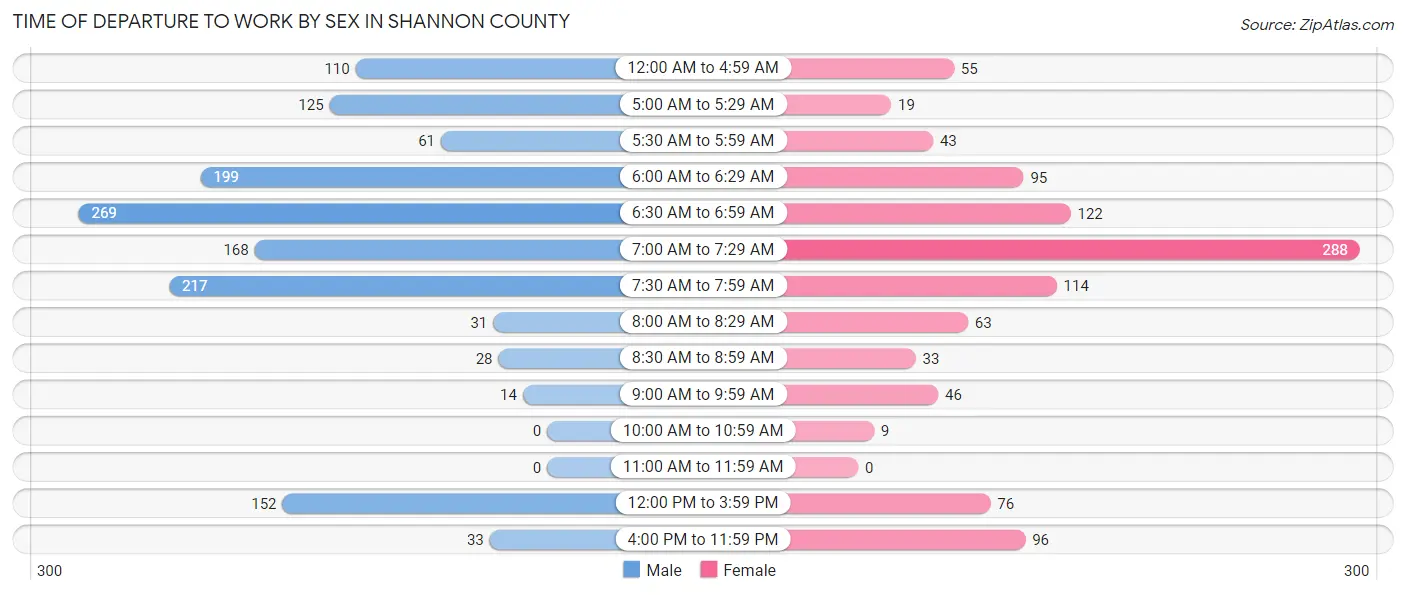
| Time of Departure | Male | Female |
| 12:00 AM to 4:59 AM | 110 (7.8%) | 55 (5.2%) |
| 5:00 AM to 5:29 AM | 125 (8.9%) | 19 (1.8%) |
| 5:30 AM to 5:59 AM | 61 (4.3%) | 43 (4.1%) |
| 6:00 AM to 6:29 AM | 199 (14.1%) | 95 (9.0%) |
| 6:30 AM to 6:59 AM | 269 (19.1%) | 122 (11.5%) |
| 7:00 AM to 7:29 AM | 168 (11.9%) | 288 (27.2%) |
| 7:30 AM to 7:59 AM | 217 (15.4%) | 114 (10.8%) |
| 8:00 AM to 8:29 AM | 31 (2.2%) | 63 (5.9%) |
| 8:30 AM to 8:59 AM | 28 (2.0%) | 33 (3.1%) |
| 9:00 AM to 9:59 AM | 14 (1.0%) | 46 (4.3%) |
| 10:00 AM to 10:59 AM | 0 (0.0%) | 9 (0.9%) |
| 11:00 AM to 11:59 AM | 0 (0.0%) | 0 (0.0%) |
| 12:00 PM to 3:59 PM | 152 (10.8%) | 76 (7.2%) |
| 4:00 PM to 11:59 PM | 33 (2.4%) | 96 (9.1%) |
| Total | 1,407 (100.0%) | 1,059 (100.0%) |
Housing Occupancy in Shannon County
Occupancy by Ownership in Shannon County
Of the total 2,753 dwellings in Shannon County, owner-occupied units account for 2,250 (81.7%), while renter-occupied units make up 503 (18.3%).
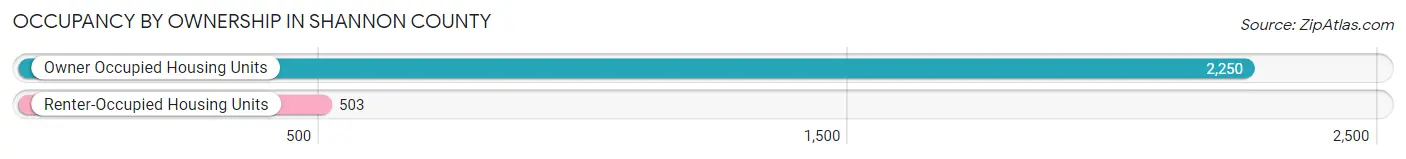
| Occupancy | # Housing Units | % Housing Units |
| Owner Occupied Housing Units | 2,250 | 81.7% |
| Renter-Occupied Housing Units | 503 | 18.3% |
| Total Occupied Housing Units | 2,753 | 100.0% |
Occupancy by Household Size in Shannon County
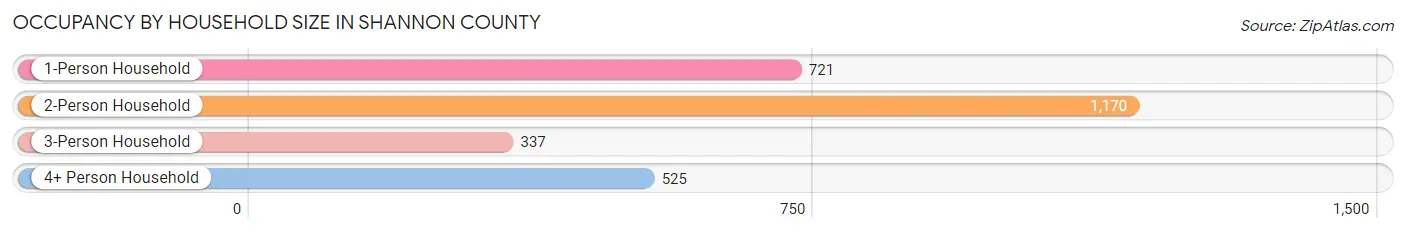
| Household Size | # Housing Units | % Housing Units |
| 1-Person Household | 721 | 26.2% |
| 2-Person Household | 1,170 | 42.5% |
| 3-Person Household | 337 | 12.2% |
| 4+ Person Household | 525 | 19.1% |
| Total Housing Units | 2,753 | 100.0% |
Occupancy by Ownership by Household Size in Shannon County
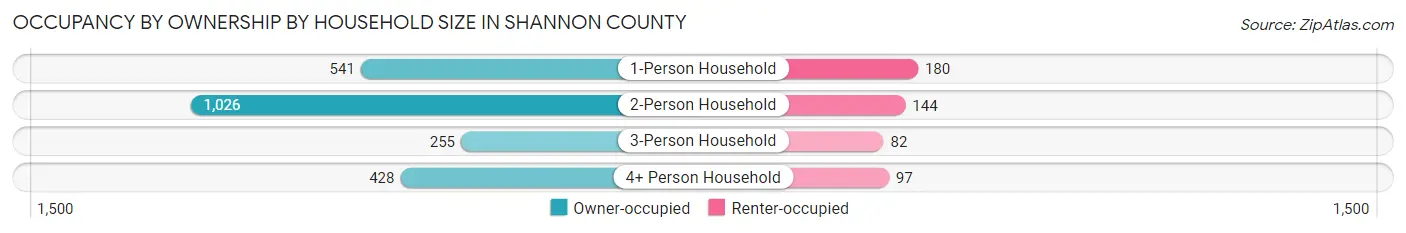
| Household Size | Owner-occupied | Renter-occupied |
| 1-Person Household | 541 (75.0%) | 180 (25.0%) |
| 2-Person Household | 1,026 (87.7%) | 144 (12.3%) |
| 3-Person Household | 255 (75.7%) | 82 (24.3%) |
| 4+ Person Household | 428 (81.5%) | 97 (18.5%) |
| Total Housing Units | 2,250 (81.7%) | 503 (18.3%) |
Occupancy by Educational Attainment in Shannon County
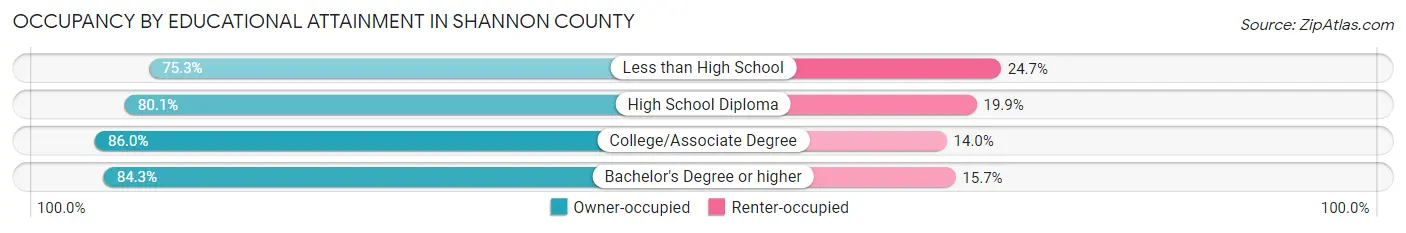
| Household Size | Owner-occupied | Renter-occupied |
| Less than High School | 259 (75.3%) | 85 (24.7%) |
| High School Diploma | 994 (80.1%) | 247 (19.9%) |
| College/Associate Degree | 616 (86.0%) | 100 (14.0%) |
| Bachelor's Degree or higher | 381 (84.3%) | 71 (15.7%) |
Occupancy by Age of Householder in Shannon County
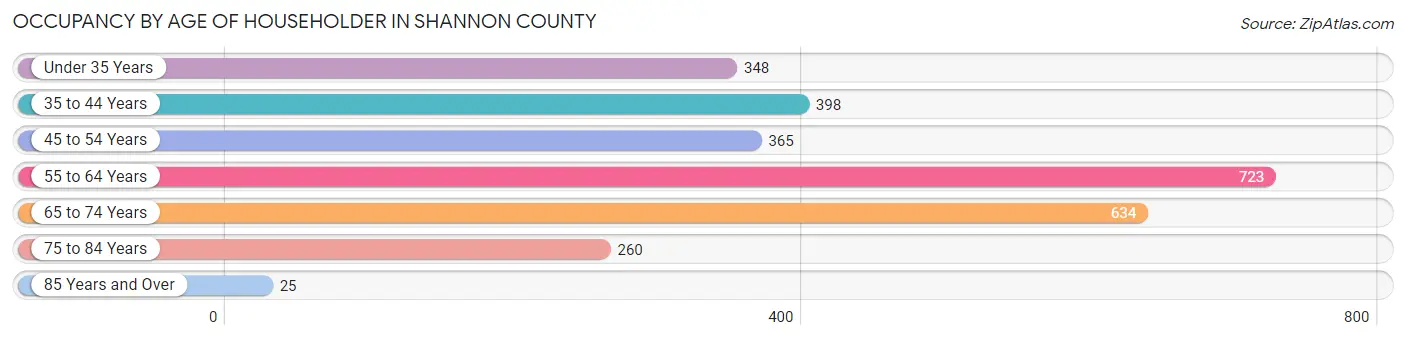
| Age Bracket | # Households | % Households |
| Under 35 Years | 348 | 12.6% |
| 35 to 44 Years | 398 | 14.5% |
| 45 to 54 Years | 365 | 13.3% |
| 55 to 64 Years | 723 | 26.3% |
| 65 to 74 Years | 634 | 23.0% |
| 75 to 84 Years | 260 | 9.4% |
| 85 Years and Over | 25 | 0.9% |
| Total | 2,753 | 100.0% |
Housing Finances in Shannon County
Median Income by Occupancy in Shannon County
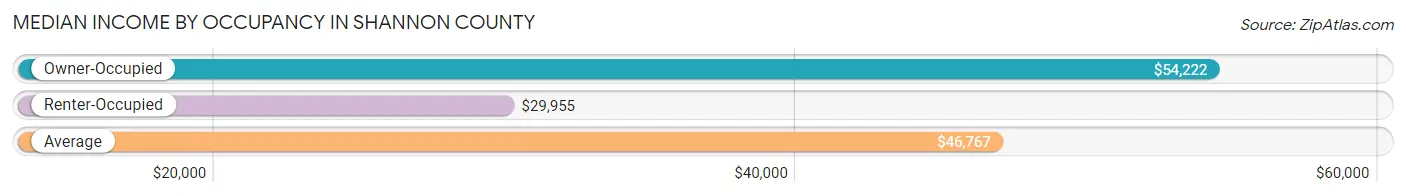
| Occupancy Type | # Households | Median Income |
| Owner-Occupied | 2,250 (81.7%) | $54,222 |
| Renter-Occupied | 503 (18.3%) | $29,955 |
| Average | 2,753 (100.0%) | $46,767 |
Occupancy by Householder Income Bracket in Shannon County
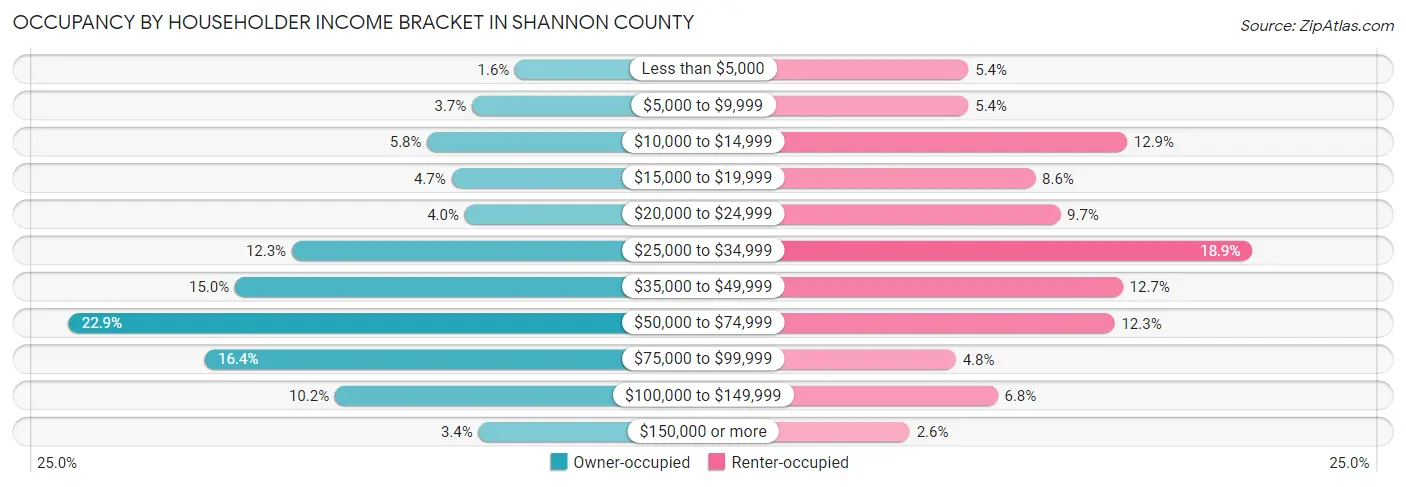
| Income Bracket | Owner-occupied | Renter-occupied |
| Less than $5,000 | 37 (1.6%) | 27 (5.4%) |
| $5,000 to $9,999 | 83 (3.7%) | 27 (5.4%) |
| $10,000 to $14,999 | 131 (5.8%) | 65 (12.9%) |
| $15,000 to $19,999 | 105 (4.7%) | 43 (8.6%) |
| $20,000 to $24,999 | 91 (4.0%) | 49 (9.7%) |
| $25,000 to $34,999 | 276 (12.3%) | 95 (18.9%) |
| $35,000 to $49,999 | 337 (15.0%) | 64 (12.7%) |
| $50,000 to $74,999 | 515 (22.9%) | 62 (12.3%) |
| $75,000 to $99,999 | 369 (16.4%) | 24 (4.8%) |
| $100,000 to $149,999 | 230 (10.2%) | 34 (6.8%) |
| $150,000 or more | 76 (3.4%) | 13 (2.6%) |
| Total | 2,250 (100.0%) | 503 (100.0%) |
Monthly Housing Cost Tiers in Shannon County
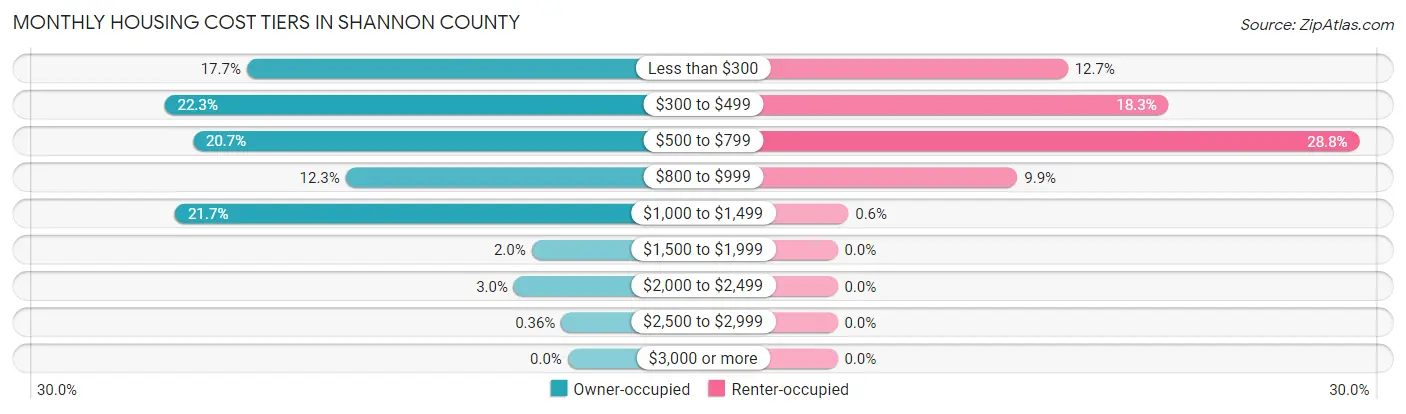
| Monthly Cost | Owner-occupied | Renter-occupied |
| Less than $300 | 399 (17.7%) | 64 (12.7%) |
| $300 to $499 | 501 (22.3%) | 92 (18.3%) |
| $500 to $799 | 466 (20.7%) | 145 (28.8%) |
| $800 to $999 | 276 (12.3%) | 50 (9.9%) |
| $1,000 to $1,499 | 488 (21.7%) | 3 (0.6%) |
| $1,500 to $1,999 | 45 (2.0%) | 0 (0.0%) |
| $2,000 to $2,499 | 67 (3.0%) | 0 (0.0%) |
| $2,500 to $2,999 | 8 (0.4%) | 0 (0.0%) |
| $3,000 or more | 0 (0.0%) | 0 (0.0%) |
| Total | 2,250 (100.0%) | 503 (100.0%) |
Physical Housing Characteristics in Shannon County
Housing Structures in Shannon County
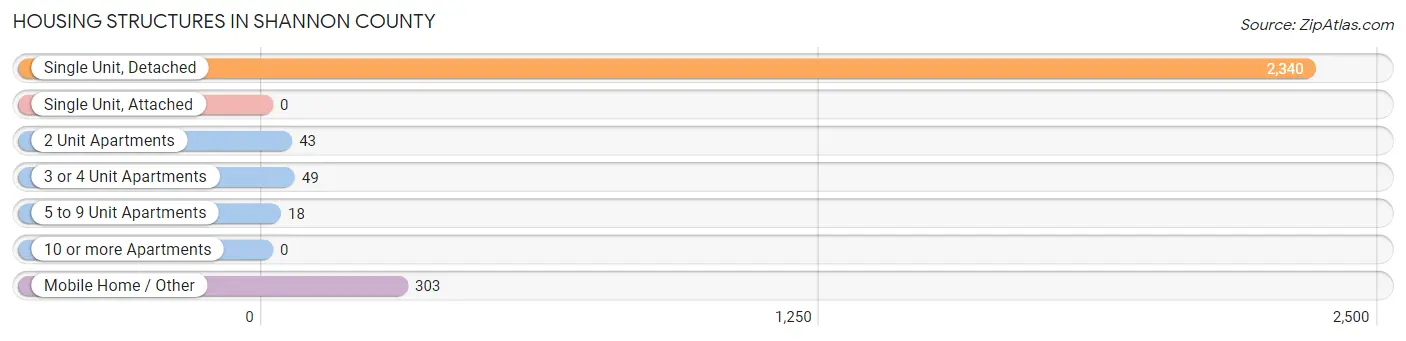
| Structure Type | # Housing Units | % Housing Units |
| Single Unit, Detached | 2,340 | 85.0% |
| Single Unit, Attached | 0 | 0.0% |
| 2 Unit Apartments | 43 | 1.6% |
| 3 or 4 Unit Apartments | 49 | 1.8% |
| 5 to 9 Unit Apartments | 18 | 0.6% |
| 10 or more Apartments | 0 | 0.0% |
| Mobile Home / Other | 303 | 11.0% |
| Total | 2,753 | 100.0% |
Housing Structures by Occupancy in Shannon County
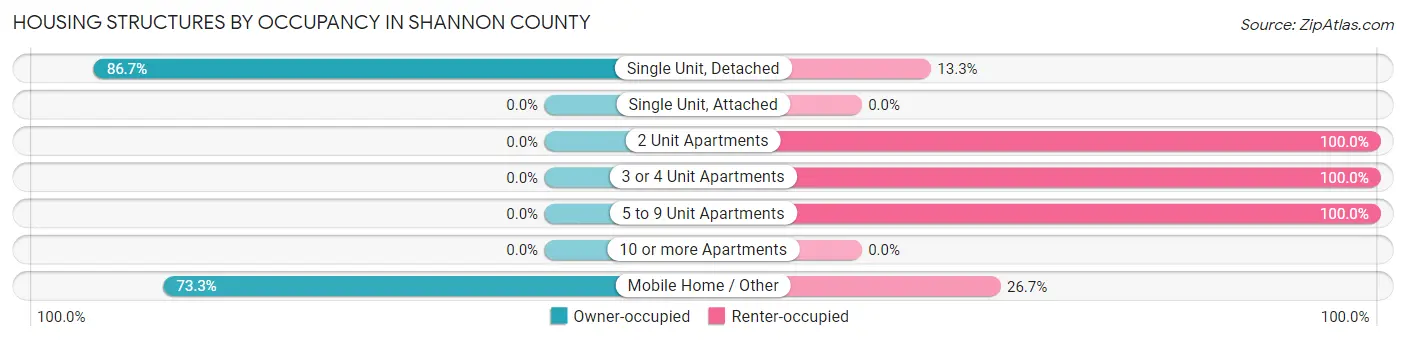
| Structure Type | Owner-occupied | Renter-occupied |
| Single Unit, Detached | 2,028 (86.7%) | 312 (13.3%) |
| Single Unit, Attached | 0 (0.0%) | 0 (0.0%) |
| 2 Unit Apartments | 0 (0.0%) | 43 (100.0%) |
| 3 or 4 Unit Apartments | 0 (0.0%) | 49 (100.0%) |
| 5 to 9 Unit Apartments | 0 (0.0%) | 18 (100.0%) |
| 10 or more Apartments | 0 (0.0%) | 0 (0.0%) |
| Mobile Home / Other | 222 (73.3%) | 81 (26.7%) |
| Total | 2,250 (81.7%) | 503 (18.3%) |
Housing Structures by Number of Rooms in Shannon County
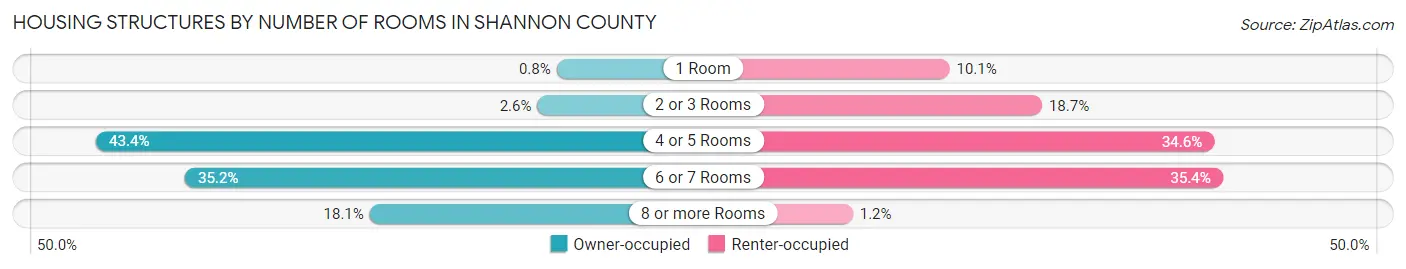
| Number of Rooms | Owner-occupied | Renter-occupied |
| 1 Room | 18 (0.8%) | 51 (10.1%) |
| 2 or 3 Rooms | 58 (2.6%) | 94 (18.7%) |
| 4 or 5 Rooms | 976 (43.4%) | 174 (34.6%) |
| 6 or 7 Rooms | 791 (35.2%) | 178 (35.4%) |
| 8 or more Rooms | 407 (18.1%) | 6 (1.2%) |
| Total | 2,250 (100.0%) | 503 (100.0%) |
Housing Structure by Heating Type in Shannon County
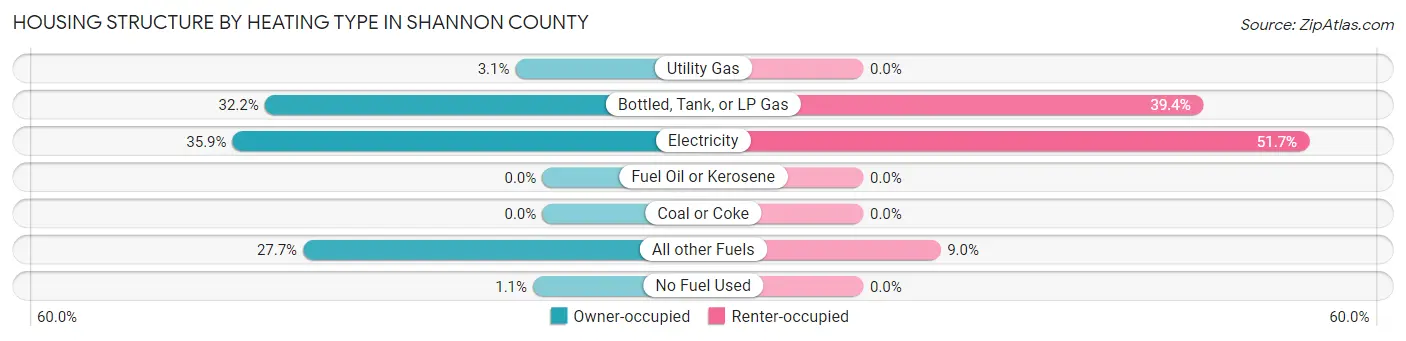
| Heating Type | Owner-occupied | Renter-occupied |
| Utility Gas | 70 (3.1%) | 0 (0.0%) |
| Bottled, Tank, or LP Gas | 724 (32.2%) | 198 (39.4%) |
| Electricity | 808 (35.9%) | 260 (51.7%) |
| Fuel Oil or Kerosene | 0 (0.0%) | 0 (0.0%) |
| Coal or Coke | 0 (0.0%) | 0 (0.0%) |
| All other Fuels | 624 (27.7%) | 45 (8.9%) |
| No Fuel Used | 24 (1.1%) | 0 (0.0%) |
| Total | 2,250 (100.0%) | 503 (100.0%) |
Household Vehicle Usage in Shannon County
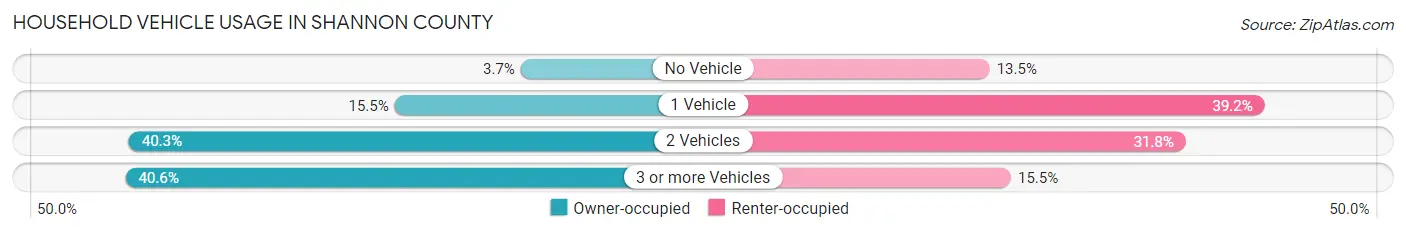
| Vehicles per Household | Owner-occupied | Renter-occupied |
| No Vehicle | 83 (3.7%) | 68 (13.5%) |
| 1 Vehicle | 348 (15.5%) | 197 (39.2%) |
| 2 Vehicles | 906 (40.3%) | 160 (31.8%) |
| 3 or more Vehicles | 913 (40.6%) | 78 (15.5%) |
| Total | 2,250 (100.0%) | 503 (100.0%) |
Real Estate & Mortgages in Shannon County
Real Estate and Mortgage Overview in Shannon County
| Characteristic | Without Mortgage | With Mortgage |
| Housing Units | 1,195 | 1,055 |
| Median Property Value | $160,800 | $129,200 |
| Median Household Income | $35,254 | $18 |
| Monthly Housing Costs | $401 | $0 |
| Real Estate Taxes | $596 | $54 |
Property Value by Mortgage Status in Shannon County
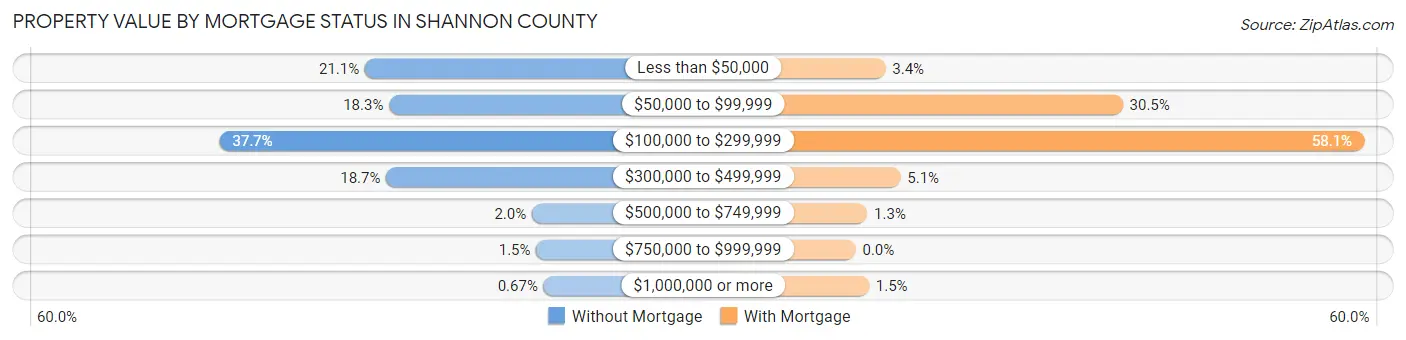
| Property Value | Without Mortgage | With Mortgage |
| Less than $50,000 | 252 (21.1%) | 36 (3.4%) |
| $50,000 to $99,999 | 219 (18.3%) | 322 (30.5%) |
| $100,000 to $299,999 | 451 (37.7%) | 613 (58.1%) |
| $300,000 to $499,999 | 223 (18.7%) | 54 (5.1%) |
| $500,000 to $749,999 | 24 (2.0%) | 14 (1.3%) |
| $750,000 to $999,999 | 18 (1.5%) | 0 (0.0%) |
| $1,000,000 or more | 8 (0.7%) | 16 (1.5%) |
| Total | 1,195 (100.0%) | 1,055 (100.0%) |
Household Income by Mortgage Status in Shannon County
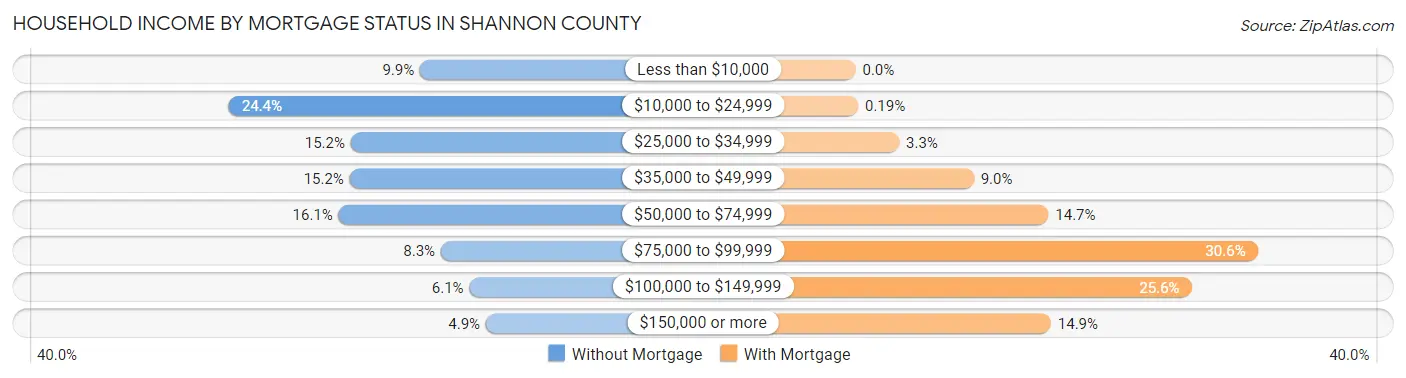
| Household Income | Without Mortgage | With Mortgage |
| Less than $10,000 | 118 (9.9%) | 0 (0.0%) |
| $10,000 to $24,999 | 292 (24.4%) | 2 (0.2%) |
| $25,000 to $34,999 | 181 (15.1%) | 35 (3.3%) |
| $35,000 to $49,999 | 182 (15.2%) | 95 (9.0%) |
| $50,000 to $74,999 | 192 (16.1%) | 155 (14.7%) |
| $75,000 to $99,999 | 99 (8.3%) | 323 (30.6%) |
| $100,000 to $149,999 | 73 (6.1%) | 270 (25.6%) |
| $150,000 or more | 58 (4.9%) | 157 (14.9%) |
| Total | 1,195 (100.0%) | 1,055 (100.0%) |
Property Value to Household Income Ratio in Shannon County
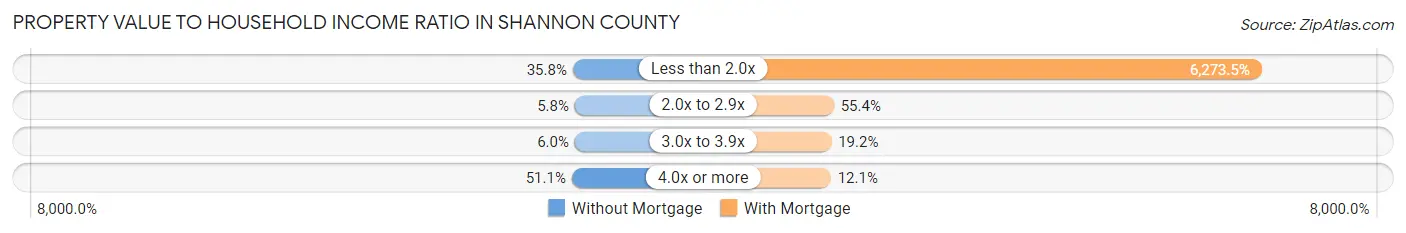
| Value-to-Income Ratio | Without Mortgage | With Mortgage |
| Less than 2.0x | 428 (35.8%) | 66,185 (6,273.5%) |
| 2.0x to 2.9x | 69 (5.8%) | 584 (55.4%) |
| 3.0x to 3.9x | 72 (6.0%) | 202 (19.2%) |
| 4.0x or more | 610 (51.0%) | 128 (12.1%) |
| Total | 1,195 (100.0%) | 1,055 (100.0%) |
Real Estate Taxes by Mortgage Status in Shannon County
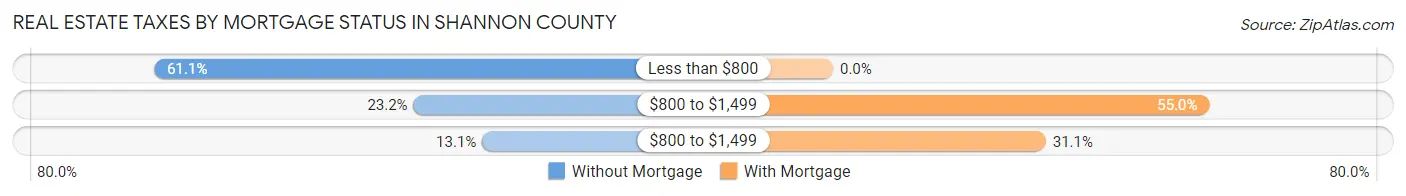
| Property Taxes | Without Mortgage | With Mortgage |
| Less than $800 | 730 (61.1%) | 0 (0.0%) |
| $800 to $1,499 | 277 (23.2%) | 580 (55.0%) |
| $800 to $1,499 | 157 (13.1%) | 328 (31.1%) |
| Total | 1,195 (100.0%) | 1,055 (100.0%) |
Health & Disability in Shannon County
Health Insurance Coverage by Age in Shannon County
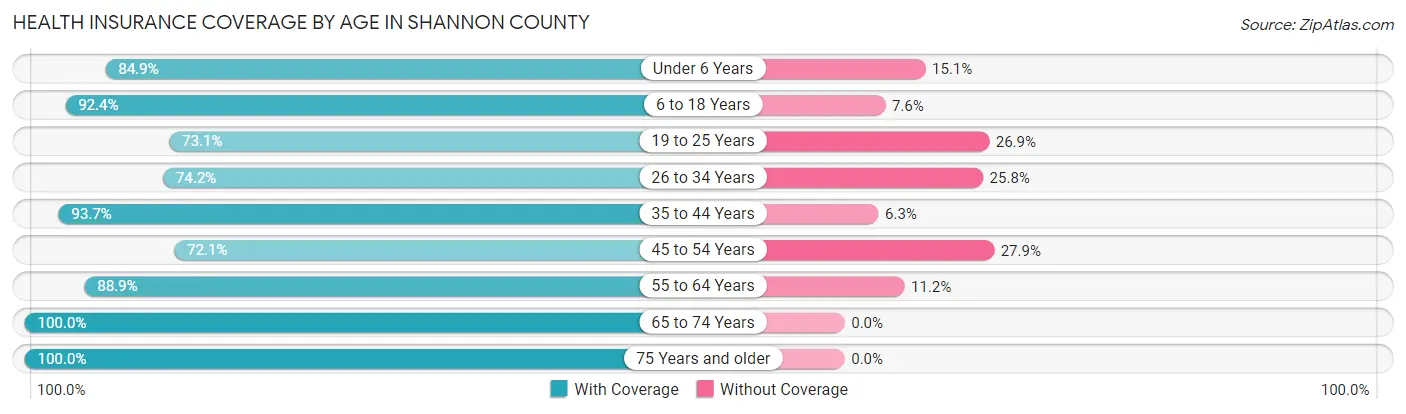
| Age Bracket | With Coverage | Without Coverage |
| Under 6 Years | 423 (84.9%) | 75 (15.1%) |
| 6 to 18 Years | 1,048 (92.4%) | 86 (7.6%) |
| 19 to 25 Years | 339 (73.1%) | 125 (26.9%) |
| 26 to 34 Years | 463 (74.2%) | 161 (25.8%) |
| 35 to 44 Years | 713 (93.7%) | 48 (6.3%) |
| 45 to 54 Years | 621 (72.1%) | 240 (27.9%) |
| 55 to 64 Years | 1,020 (88.8%) | 128 (11.2%) |
| 65 to 74 Years | 944 (100.0%) | 0 (0.0%) |
| 75 Years and older | 638 (100.0%) | 0 (0.0%) |
| Total | 6,209 (87.8%) | 863 (12.2%) |
Health Insurance Coverage by Citizenship Status in Shannon County
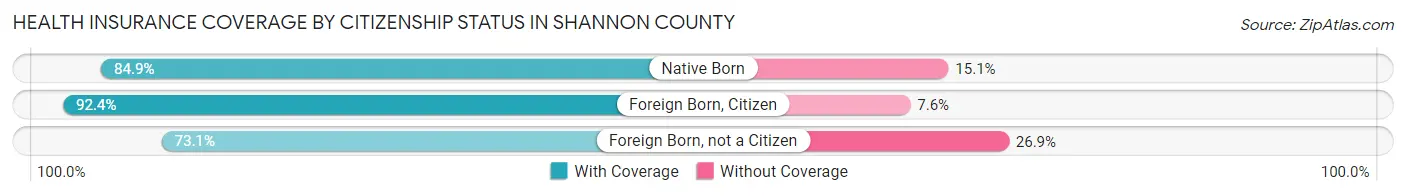
| Citizenship Status | With Coverage | Without Coverage |
| Native Born | 423 (84.9%) | 75 (15.1%) |
| Foreign Born, Citizen | 1,048 (92.4%) | 86 (7.6%) |
| Foreign Born, not a Citizen | 339 (73.1%) | 125 (26.9%) |
Health Insurance Coverage by Household Income in Shannon County
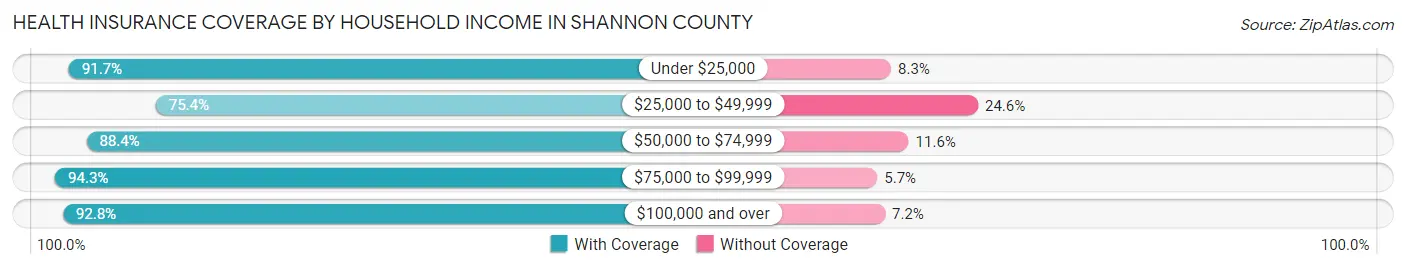
| Household Income | With Coverage | Without Coverage |
| Under $25,000 | 1,038 (91.7%) | 94 (8.3%) |
| $25,000 to $49,999 | 1,208 (75.4%) | 394 (24.6%) |
| $50,000 to $74,999 | 1,534 (88.4%) | 201 (11.6%) |
| $75,000 to $99,999 | 1,233 (94.3%) | 75 (5.7%) |
| $100,000 and over | 1,163 (92.8%) | 90 (7.2%) |
Public vs Private Health Insurance Coverage by Age in Shannon County
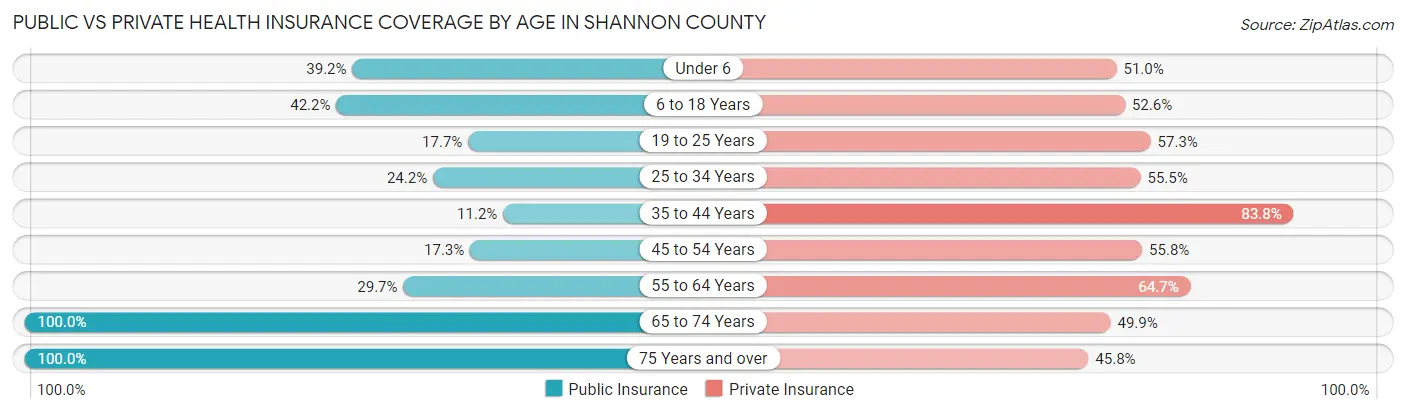
| Age Bracket | Public Insurance | Private Insurance |
| Under 6 | 195 (39.2%) | 254 (51.0%) |
| 6 to 18 Years | 478 (42.1%) | 596 (52.6%) |
| 19 to 25 Years | 82 (17.7%) | 266 (57.3%) |
| 25 to 34 Years | 151 (24.2%) | 346 (55.4%) |
| 35 to 44 Years | 85 (11.2%) | 638 (83.8%) |
| 45 to 54 Years | 149 (17.3%) | 480 (55.7%) |
| 55 to 64 Years | 341 (29.7%) | 743 (64.7%) |
| 65 to 74 Years | 944 (100.0%) | 471 (49.9%) |
| 75 Years and over | 638 (100.0%) | 292 (45.8%) |
| Total | 3,063 (43.3%) | 4,086 (57.8%) |
Disability Status by Sex by Age in Shannon County
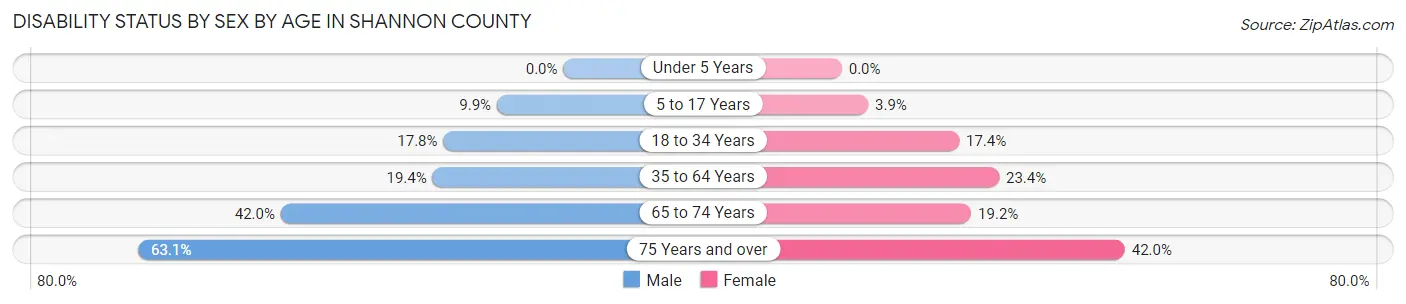
| Age Bracket | Male | Female |
| Under 5 Years | 0 (0.0%) | 0 (0.0%) |
| 5 to 17 Years | 62 (9.9%) | 21 (3.9%) |
| 18 to 34 Years | 108 (17.8%) | 97 (17.4%) |
| 35 to 64 Years | 276 (19.4%) | 315 (23.4%) |
| 65 to 74 Years | 193 (42.0%) | 93 (19.2%) |
| 75 Years and over | 185 (63.1%) | 145 (42.0%) |
Disability Class by Sex by Age in Shannon County
Disability Class: Hearing Difficulty
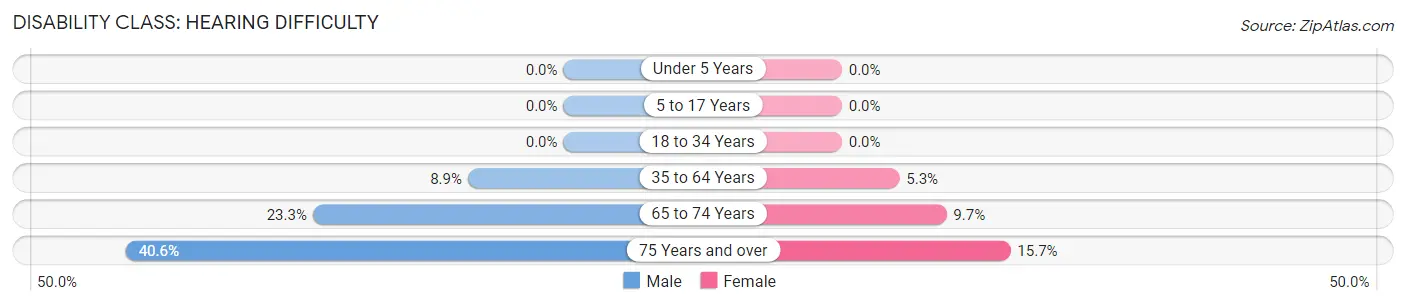
| Age Bracket | Male | Female |
| Under 5 Years | 0 (0.0%) | 0 (0.0%) |
| 5 to 17 Years | 0 (0.0%) | 0 (0.0%) |
| 18 to 34 Years | 0 (0.0%) | 0 (0.0%) |
| 35 to 64 Years | 126 (8.9%) | 72 (5.3%) |
| 65 to 74 Years | 107 (23.3%) | 47 (9.7%) |
| 75 Years and over | 119 (40.6%) | 54 (15.7%) |
Disability Class: Vision Difficulty
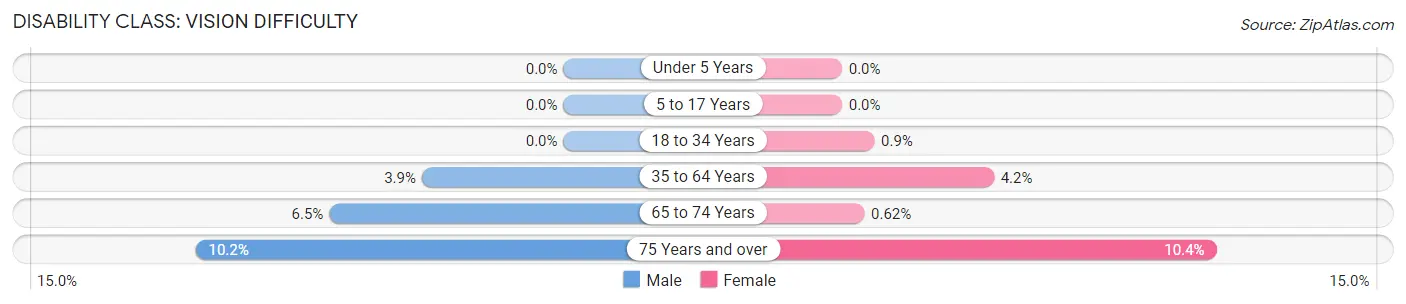
| Age Bracket | Male | Female |
| Under 5 Years | 0 (0.0%) | 0 (0.0%) |
| 5 to 17 Years | 0 (0.0%) | 0 (0.0%) |
| 18 to 34 Years | 0 (0.0%) | 5 (0.9%) |
| 35 to 64 Years | 56 (3.9%) | 57 (4.2%) |
| 65 to 74 Years | 30 (6.5%) | 3 (0.6%) |
| 75 Years and over | 30 (10.2%) | 36 (10.4%) |
Disability Class: Cognitive Difficulty
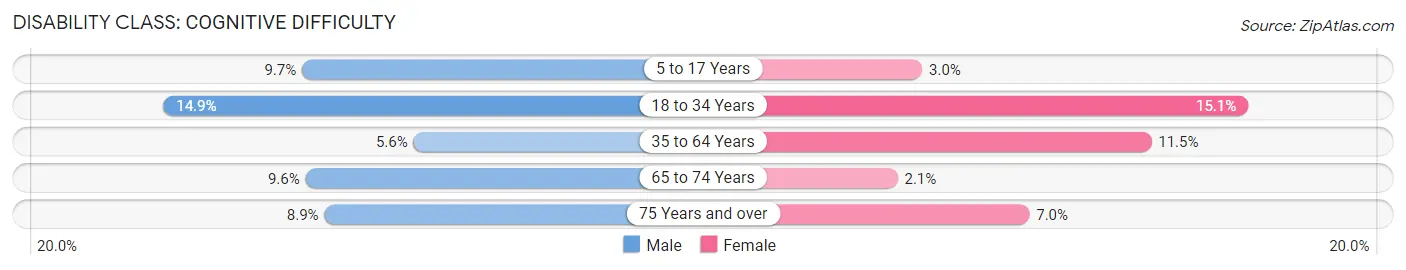
| Age Bracket | Male | Female |
| 5 to 17 Years | 61 (9.7%) | 16 (3.0%) |
| 18 to 34 Years | 90 (14.8%) | 84 (15.1%) |
| 35 to 64 Years | 79 (5.6%) | 155 (11.5%) |
| 65 to 74 Years | 44 (9.6%) | 10 (2.1%) |
| 75 Years and over | 26 (8.9%) | 24 (7.0%) |
Disability Class: Ambulatory Difficulty
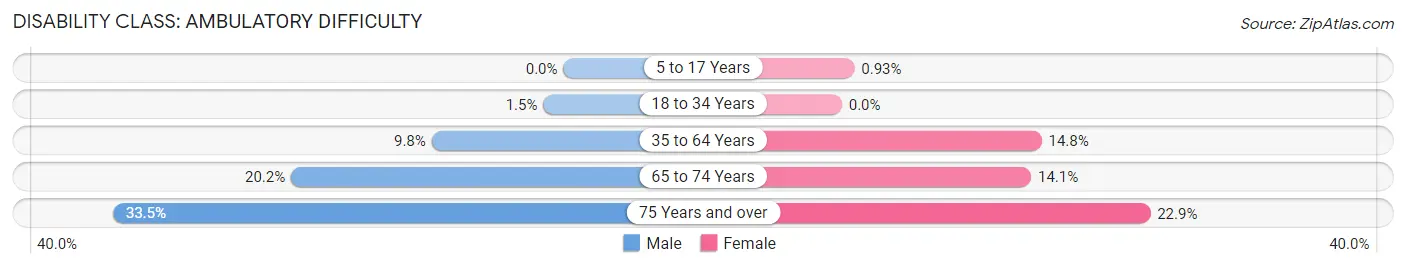
| Age Bracket | Male | Female |
| 5 to 17 Years | 0 (0.0%) | 5 (0.9%) |
| 18 to 34 Years | 9 (1.5%) | 0 (0.0%) |
| 35 to 64 Years | 139 (9.8%) | 200 (14.8%) |
| 65 to 74 Years | 93 (20.2%) | 68 (14.1%) |
| 75 Years and over | 98 (33.5%) | 79 (22.9%) |
Disability Class: Self-Care Difficulty
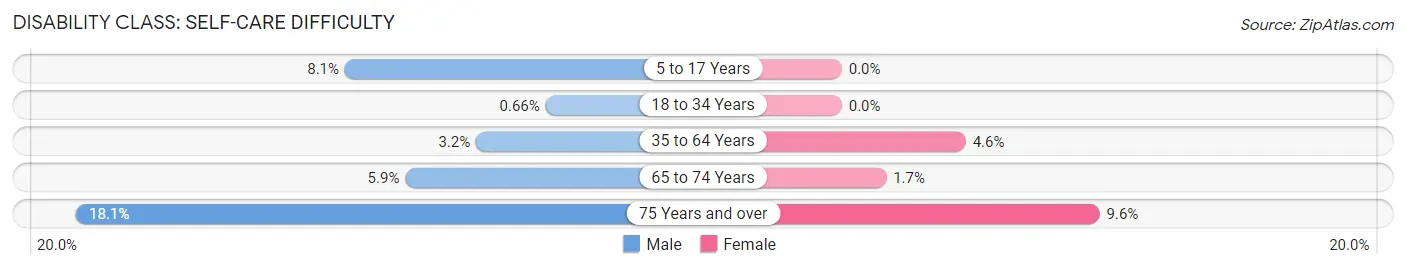
| Age Bracket | Male | Female |
| 5 to 17 Years | 51 (8.1%) | 0 (0.0%) |
| 18 to 34 Years | 4 (0.7%) | 0 (0.0%) |
| 35 to 64 Years | 46 (3.2%) | 62 (4.6%) |
| 65 to 74 Years | 27 (5.9%) | 8 (1.7%) |
| 75 Years and over | 53 (18.1%) | 33 (9.6%) |
Technology Access in Shannon County
Computing Device Access in Shannon County
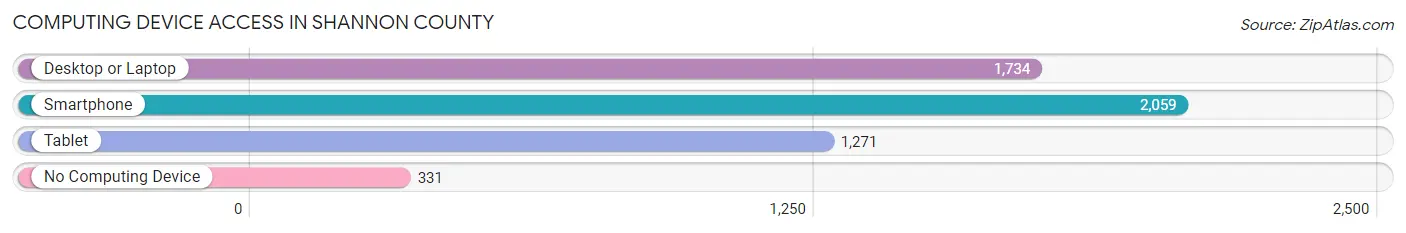
| Device Type | # Households | % Households |
| Desktop or Laptop | 1,734 | 63.0% |
| Smartphone | 2,059 | 74.8% |
| Tablet | 1,271 | 46.2% |
| No Computing Device | 331 | 12.0% |
| Total | 2,753 | 100.0% |
Internet Access in Shannon County
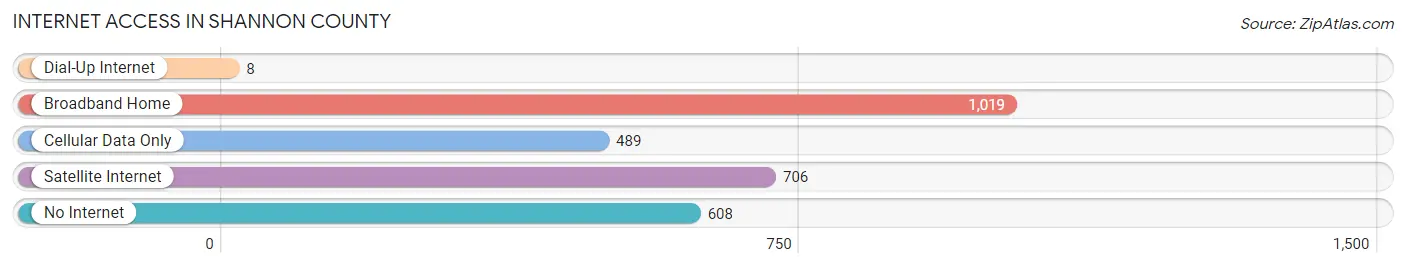
| Internet Type | # Households | % Households |
| Dial-Up Internet | 8 | 0.3% |
| Broadband Home | 1,019 | 37.0% |
| Cellular Data Only | 489 | 17.8% |
| Satellite Internet | 706 | 25.6% |
| No Internet | 608 | 22.1% |
| Total | 2,753 | 100.0% |
Shannon County Summary
Shannon County is located in the southern part of Missouri, and is part of the Ozark Plateau. It is bordered by Carter County to the north, Oregon County to the east, Howell County to the south, and Texas County to the west. The county seat is Eminence, and the largest city is Winona. The county was established in 1841 and named after George Shannon, a member of the Lewis and Clark Expedition.
Geography
Shannon County covers an area of 576 square miles, making it the second-smallest county in Missouri. The county is mostly rural, with the majority of the land being used for farming and forestry. The terrain is mostly hilly, with the highest point being Pilot Knob at 1,068 feet. The county is home to several rivers and streams, including the Current River, Jacks Fork, and the Eleven Point River. The county is also home to several state parks, including Montauk State Park, Johnson's Shut-Ins State Park, and Big Spring State Park.
Demographics
As of the 2010 census, Shannon County had a population of 8,441. The population density was 14.6 people per square mile. The racial makeup of the county was 97.2% White, 0.3% African American, 0.3% Native American, 0.2% Asian, 0.1% Pacific Islander, 0.7% from other races, and 1.2% from two or more races. Hispanic or Latino of any race were 1.7% of the population.
The median income for a household in the county was $27,917, and the median income for a family was $33,917. The per capita income for the county was $14,945. About 18.2% of the population was below the poverty line.
Economy
The economy of Shannon County is largely based on agriculture and forestry. The county is home to several large farms, and the majority of the land is used for growing crops such as corn, soybeans, and wheat. The county is also home to several timber companies, which harvest and process timber for use in construction and other industries.
In addition to agriculture and forestry, Shannon County is home to several small businesses, including restaurants, retail stores, and service providers. The county is also home to several tourist attractions, including Montauk State Park, Johnson's Shut-Ins State Park, and Big Spring State Park.
Conclusion
Shannon County is a rural county located in the southern part of Missouri. It is home to several rivers and streams, state parks, and a variety of businesses. The economy of the county is largely based on agriculture and forestry, and the county is home to several large farms and timber companies. The population of the county is mostly white, and the median income for a household is $27,917. Shannon County is a great place to live and work, and offers a variety of activities and attractions for visitors and residents alike.
Common Questions
What is Per Capita Income in Shannon County?
Per Capita income in Shannon County is $23,661.
What is the Median Family Income in Shannon County?
Median Family Income in Shannon County is $62,931.
What is the Median Household income in Shannon County?
Median Household Income in Shannon County is $46,767.
What is Income or Wage Gap in Shannon County?
Income or Wage Gap in Shannon County is 39.7%.
Women in Shannon County earn 60.3 cents for every dollar earned by a man.
What is Inequality or Gini Index in Shannon County?
Inequality or Gini Index in Shannon County is 0.40.
What is the Total Population of Shannon County?
Total Population of Shannon County is 7,132.
What is the Total Male Population of Shannon County?
Total Male Population of Shannon County is 3,637.
What is the Total Female Population of Shannon County?
Total Female Population of Shannon County is 3,495.
What is the Ratio of Males per 100 Females in Shannon County?
There are 104.06 Males per 100 Females in Shannon County.
What is the Ratio of Females per 100 Males in Shannon County?
There are 96.10 Females per 100 Males in Shannon County.
What is the Median Population Age in Shannon County?
Median Population Age in Shannon County is 46.9 Years.
What is the Average Family Size in Shannon County
Average Family Size in Shannon County is 3.1 People.
What is the Average Household Size in Shannon County
Average Household Size in Shannon County is 2.5 People.
How Large is the Labor Force in Shannon County?
There are 2,765 People in the Labor Forcein in Shannon County.
What is the Percentage of People in the Labor Force in Shannon County?
47.9% of People are in the Labor Force in Shannon County.
What is the Unemployment Rate in Shannon County?
Unemployment Rate in Shannon County is 2.7%.