Reynolds County, MO Map & Demographics
Reynolds County Map
Reynolds County Overview
$25,204
PER CAPITA INCOME
$54,623
AVG FAMILY INCOME
$43,856
AVG HOUSEHOLD INCOME
35.8%
WAGE / INCOME GAP [ % ]
64.2¢/ $1
WAGE / INCOME GAP [ $ ]
$10,243
FAMILY INCOME DEFICIT
0.43
INEQUALITY / GINI INDEX
6,102
TOTAL POPULATION
3,177
MALE POPULATION
2,925
FEMALE POPULATION
108.62
MALES / 100 FEMALES
92.07
FEMALES / 100 MALES
46.2
MEDIAN AGE
3.2
AVG FAMILY SIZE
2.6
AVG HOUSEHOLD SIZE
2,725
LABOR FORCE [ PEOPLE ]
52.9%
PERCENT IN LABOR FORCE
10.0%
UNEMPLOYMENT RATE
Reynolds County Area Codes
Income in Reynolds County
Income Overview in Reynolds County
Per Capita Income in Reynolds County is $25,204, while median incomes of families and households are $54,623 and $43,856 respectively.
| Characteristic | Number | Measure |
| Per Capita Income | 6,102 | $25,204 |
| Median Family Income | 1,452 | $54,623 |
| Mean Family Income | 1,452 | $66,517 |
| Median Household Income | 2,309 | $43,856 |
| Mean Household Income | 2,309 | $56,608 |
| Income Deficit | 1,452 | $10,243 |
| Wage / Income Gap (%) | 6,102 | 35.83% |
| Wage / Income Gap ($) | 6,102 | 64.17¢ per $1 |
| Gini / Inequality Index | 6,102 | 0.43 |
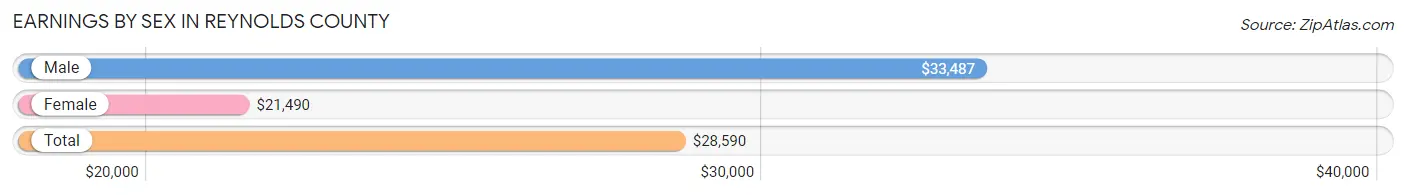
Earnings by Sex in Reynolds County
Average Earnings in Reynolds County are $28,590, $33,487 for men and $21,490 for women, a difference of 35.8%.
| Sex | Number | Average Earnings |
| Male | 1,554 (53.8%) | $33,487 |
| Female | 1,335 (46.2%) | $21,490 |
| Total | 2,889 (100.0%) | $28,590 |
Earnings by Sex by Income Bracket in Reynolds County
The most common earnings brackets in Reynolds County are $75,000 to $99,999 for men (209 | 13.5%) and $35,000 to $39,999 for women (210 | 15.7%).
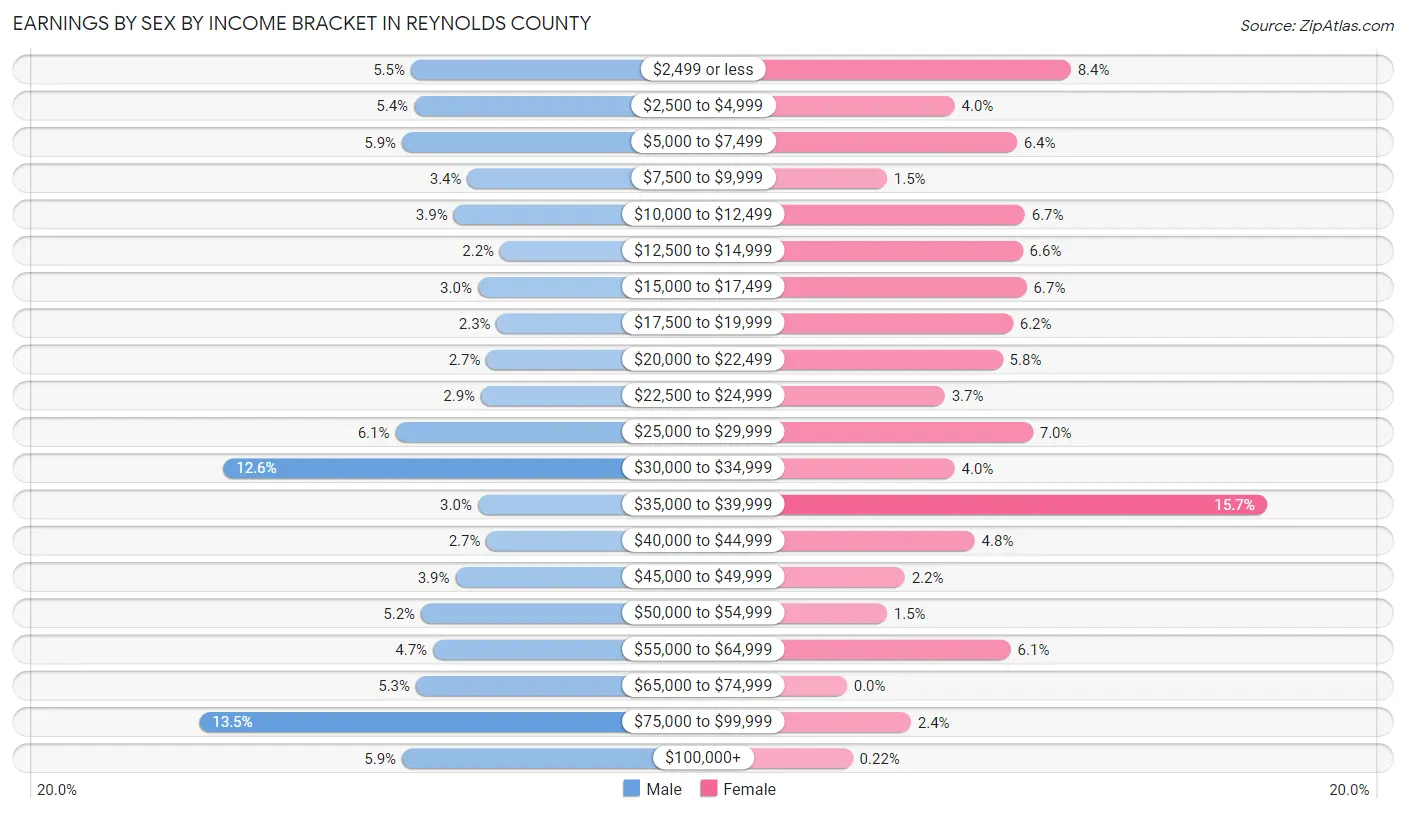
| Income | Male | Female |
| $2,499 or less | 86 (5.5%) | 112 (8.4%) |
| $2,500 to $4,999 | 84 (5.4%) | 54 (4.0%) |
| $5,000 to $7,499 | 91 (5.9%) | 85 (6.4%) |
| $7,500 to $9,999 | 53 (3.4%) | 20 (1.5%) |
| $10,000 to $12,499 | 61 (3.9%) | 89 (6.7%) |
| $12,500 to $14,999 | 34 (2.2%) | 88 (6.6%) |
| $15,000 to $17,499 | 47 (3.0%) | 90 (6.7%) |
| $17,500 to $19,999 | 36 (2.3%) | 83 (6.2%) |
| $20,000 to $22,499 | 42 (2.7%) | 78 (5.8%) |
| $22,500 to $24,999 | 45 (2.9%) | 49 (3.7%) |
| $25,000 to $29,999 | 95 (6.1%) | 93 (7.0%) |
| $30,000 to $34,999 | 195 (12.6%) | 54 (4.0%) |
| $35,000 to $39,999 | 47 (3.0%) | 210 (15.7%) |
| $40,000 to $44,999 | 42 (2.7%) | 64 (4.8%) |
| $45,000 to $49,999 | 60 (3.9%) | 29 (2.2%) |
| $50,000 to $54,999 | 80 (5.1%) | 20 (1.5%) |
| $55,000 to $64,999 | 73 (4.7%) | 82 (6.1%) |
| $65,000 to $74,999 | 83 (5.3%) | 0 (0.0%) |
| $75,000 to $99,999 | 209 (13.5%) | 32 (2.4%) |
| $100,000+ | 91 (5.9%) | 3 (0.2%) |
| Total | 1,554 (100.0%) | 1,335 (100.0%) |
Earnings by Sex by Educational Attainment in Reynolds County
Average earnings in Reynolds County are $37,554 for men and $24,333 for women, a difference of 35.2%. Men with an educational attainment of college or associate's degree enjoy the highest average annual earnings of $54,196, while those with high school diploma education earn the least with $34,186. Women with an educational attainment of graduate degree earn the most with the average annual earnings of $48,500, while those with high school diploma education have the smallest earnings of $17,000.
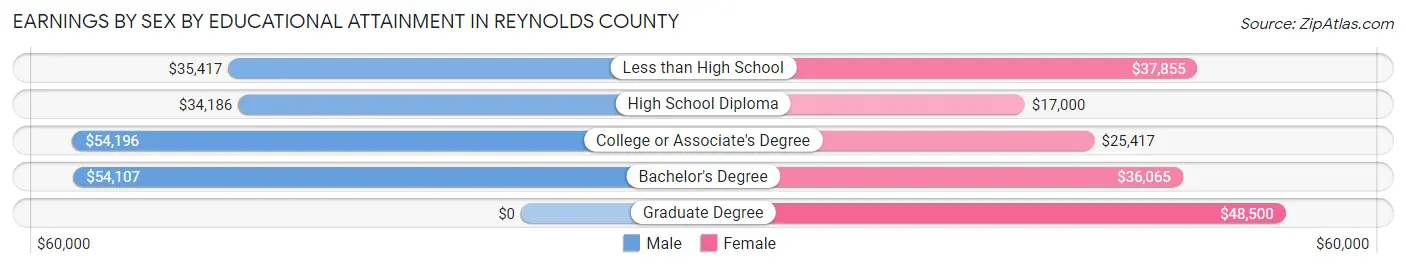
| Educational Attainment | Male Income | Female Income |
| Less than High School | $35,417 | $37,855 |
| High School Diploma | $34,186 | $17,000 |
| College or Associate's Degree | $54,196 | $25,417 |
| Bachelor's Degree | $54,107 | $36,065 |
| Graduate Degree | - | - |
| Total | $37,554 | $24,333 |
Family Income in Reynolds County
Family Income Brackets in Reynolds County
According to the Reynolds County family income data, there are 283 families falling into the $35,000 to $49,999 income range, which is the most common income bracket and makes up 19.5% of all families. Conversely, the $200,000+ income bracket is the least frequent group with only 20 families (1.4%) belonging to this category.
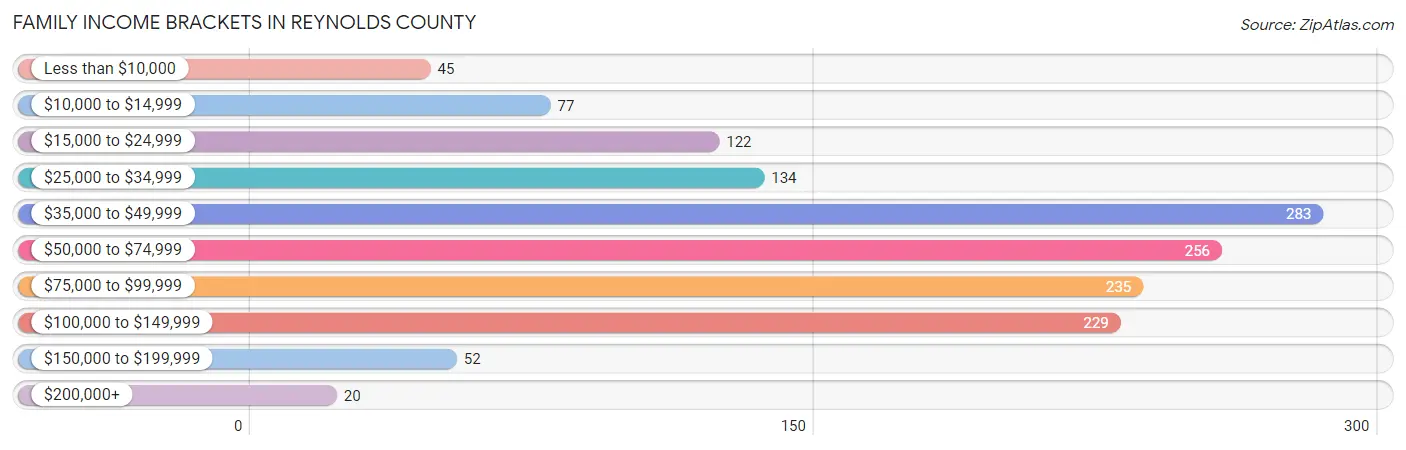
| Income Bracket | # Families | % Families |
| Less than $10,000 | 45 | 3.1% |
| $10,000 to $14,999 | 77 | 5.3% |
| $15,000 to $24,999 | 122 | 8.4% |
| $25,000 to $34,999 | 134 | 9.2% |
| $35,000 to $49,999 | 283 | 19.5% |
| $50,000 to $74,999 | 256 | 17.6% |
| $75,000 to $99,999 | 235 | 16.2% |
| $100,000 to $149,999 | 229 | 15.8% |
| $150,000 to $199,999 | 52 | 3.6% |
| $200,000+ | 20 | 1.4% |
Family Income by Famaliy Size in Reynolds County
4-person families (153 | 10.5%) account for the highest median family income in Reynolds County with $85,179 per family, while 2-person families (887 | 61.1%) have the highest median income of $23,585 per family member.
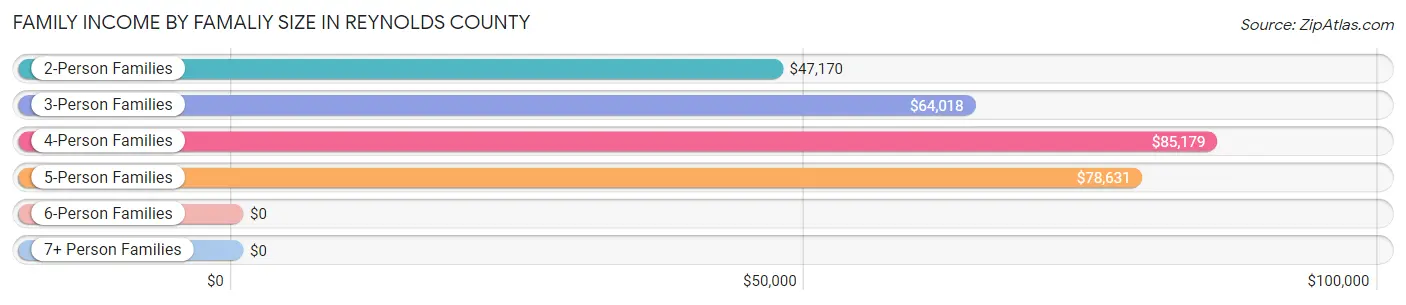
| Income Bracket | # Families | Median Income |
| 2-Person Families | 887 (61.1%) | $47,170 |
| 3-Person Families | 295 (20.3%) | $64,018 |
| 4-Person Families | 153 (10.5%) | $85,179 |
| 5-Person Families | 55 (3.8%) | $78,631 |
| 6-Person Families | 35 (2.4%) | $0 |
| 7+ Person Families | 27 (1.9%) | $0 |
| Total | 1,452 (100.0%) | $54,623 |
Family Income by Number of Earners in Reynolds County
The median family income in Reynolds County is $54,623, with families comprising 3+ earners (70) having the highest median family income of $115,682, while families with no earners (343) have the lowest median family income of $36,078, accounting for 4.8% and 23.6% of families, respectively.
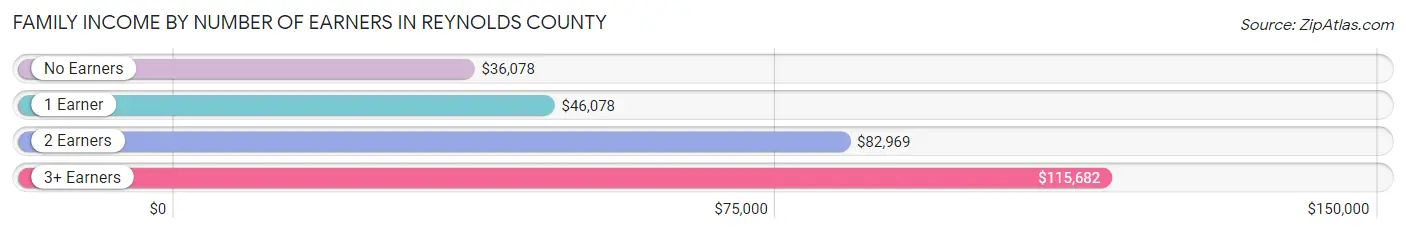
| Number of Earners | # Families | Median Income |
| No Earners | 343 (23.6%) | $36,078 |
| 1 Earner | 469 (32.3%) | $46,078 |
| 2 Earners | 570 (39.3%) | $82,969 |
| 3+ Earners | 70 (4.8%) | $115,682 |
| Total | 1,452 (100.0%) | $54,623 |
Household Income in Reynolds County
Household Income Brackets in Reynolds County
With 386 households falling in the category, the $35,000 to $49,999 income range is the most frequent in Reynolds County, accounting for 16.7% of all households. In contrast, only 30 households (1.3%) fall into the $200,000+ income bracket, making it the least populous group.
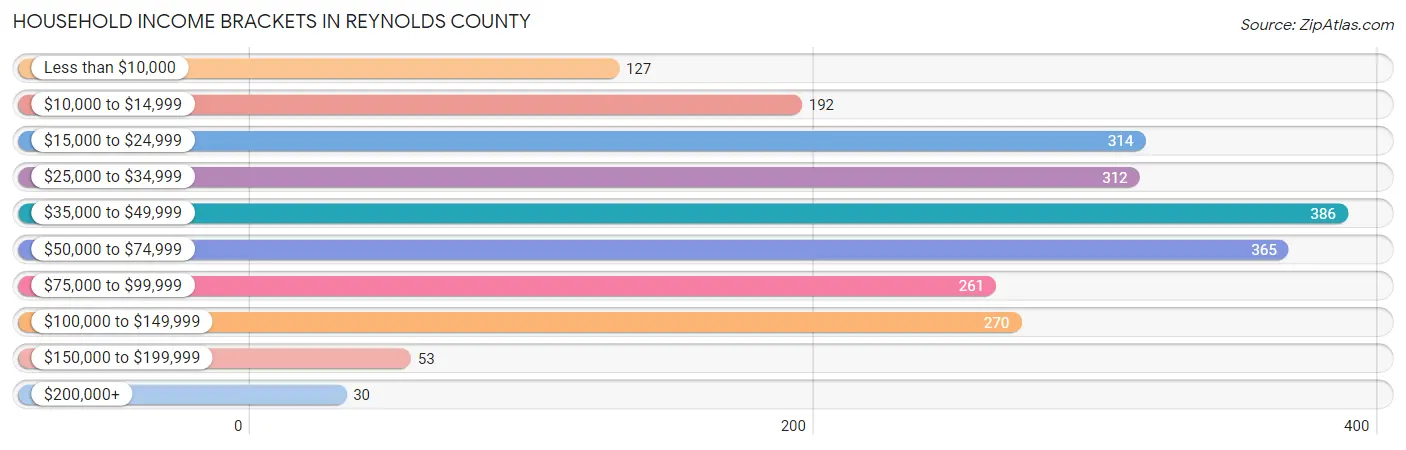
| Income Bracket | # Households | % Households |
| Less than $10,000 | 127 | 5.5% |
| $10,000 to $14,999 | 192 | 8.3% |
| $15,000 to $24,999 | 314 | 13.6% |
| $25,000 to $34,999 | 312 | 13.5% |
| $35,000 to $49,999 | 386 | 16.7% |
| $50,000 to $74,999 | 365 | 15.8% |
| $75,000 to $99,999 | 261 | 11.3% |
| $100,000 to $149,999 | 270 | 11.7% |
| $150,000 to $199,999 | 53 | 2.3% |
| $200,000+ | 30 | 1.3% |
Household Income by Householder Age in Reynolds County
The median household income in Reynolds County is $43,856, with the highest median household income of $58,684 found in the 45 to 64 years age bracket for the primary householder. A total of 882 households (38.2%) fall into this category. Meanwhile, the 15 to 24 years age bracket for the primary householder has the lowest median household income of $27,708, with 69 households (3.0%) in this group.
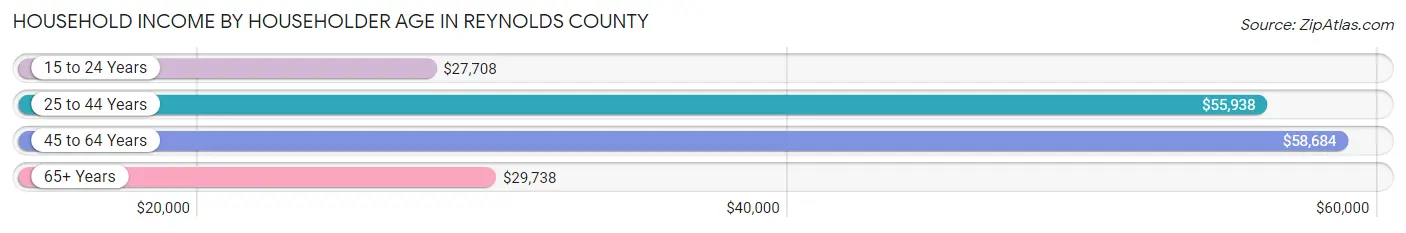
| Income Bracket | # Households | Median Income |
| 15 to 24 Years | 69 (3.0%) | $27,708 |
| 25 to 44 Years | 459 (19.9%) | $55,938 |
| 45 to 64 Years | 882 (38.2%) | $58,684 |
| 65+ Years | 899 (38.9%) | $29,738 |
| Total | 2,309 (100.0%) | $43,856 |
Poverty in Reynolds County
Income Below Poverty by Sex and Age in Reynolds County
With 16.2% poverty level for males and 20.1% for females among the residents of Reynolds County, under 5 year old males and 6 to 11 year old females are the most vulnerable to poverty, with 56 males (42.4%) and 72 females (49.7%) in their respective age groups living below the poverty level.
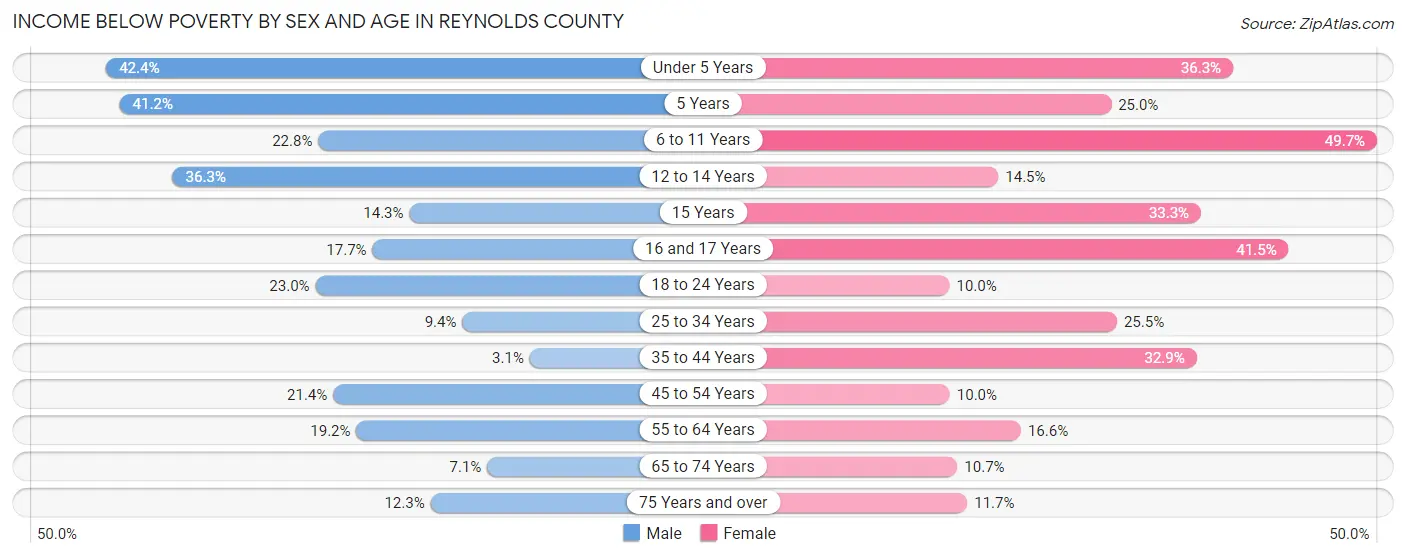
| Age Bracket | Male | Female |
| Under 5 Years | 56 (42.4%) | 49 (36.3%) |
| 5 Years | 7 (41.2%) | 4 (25.0%) |
| 6 to 11 Years | 43 (22.8%) | 72 (49.7%) |
| 12 to 14 Years | 33 (36.3%) | 17 (14.5%) |
| 15 Years | 5 (14.3%) | 3 (33.3%) |
| 16 and 17 Years | 14 (17.7%) | 34 (41.5%) |
| 18 to 24 Years | 55 (23.0%) | 20 (10.0%) |
| 25 to 34 Years | 21 (9.4%) | 83 (25.5%) |
| 35 to 44 Years | 14 (3.1%) | 105 (32.9%) |
| 45 to 54 Years | 84 (21.4%) | 37 (10.0%) |
| 55 to 64 Years | 97 (19.2%) | 78 (16.6%) |
| 65 to 74 Years | 28 (7.1%) | 41 (10.7%) |
| 75 Years and over | 37 (12.3%) | 36 (11.7%) |
| Total | 494 (16.2%) | 579 (20.1%) |
Income Above Poverty by Sex and Age in Reynolds County
According to the poverty statistics in Reynolds County, males aged 35 to 44 years and females aged 18 to 24 years are the age groups that are most secure financially, with 96.9% of males and 90.0% of females in these age groups living above the poverty line.
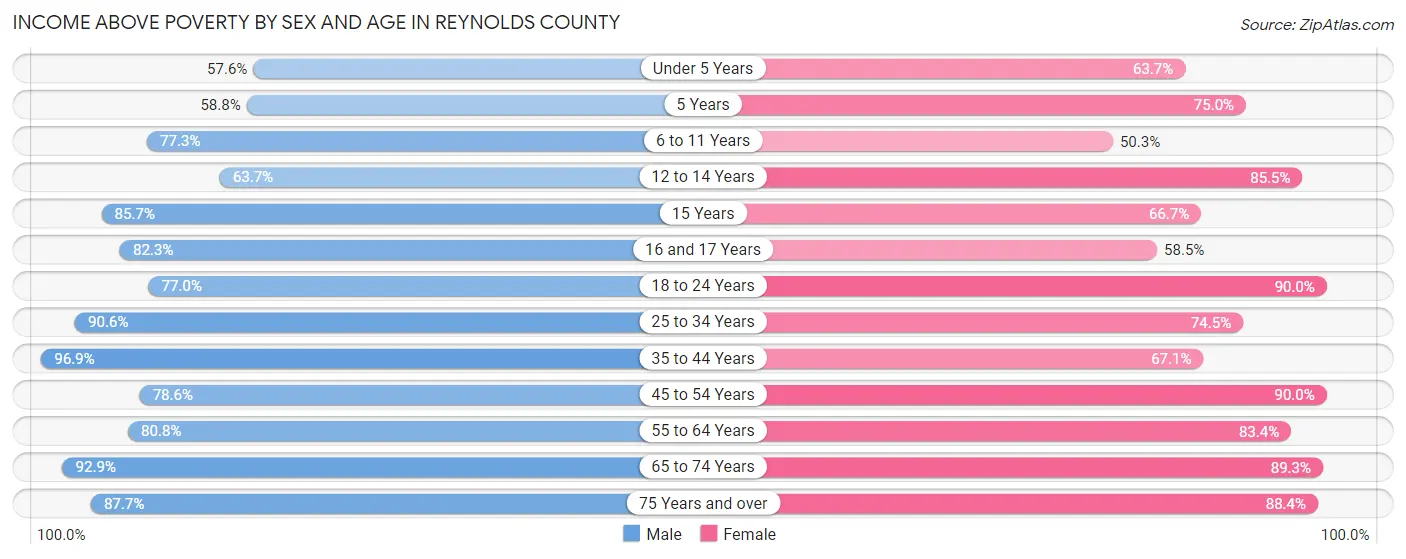
| Age Bracket | Male | Female |
| Under 5 Years | 76 (57.6%) | 86 (63.7%) |
| 5 Years | 10 (58.8%) | 12 (75.0%) |
| 6 to 11 Years | 146 (77.2%) | 73 (50.3%) |
| 12 to 14 Years | 58 (63.7%) | 100 (85.5%) |
| 15 Years | 30 (85.7%) | 6 (66.7%) |
| 16 and 17 Years | 65 (82.3%) | 48 (58.5%) |
| 18 to 24 Years | 184 (77.0%) | 180 (90.0%) |
| 25 to 34 Years | 203 (90.6%) | 242 (74.5%) |
| 35 to 44 Years | 434 (96.9%) | 214 (67.1%) |
| 45 to 54 Years | 309 (78.6%) | 332 (90.0%) |
| 55 to 64 Years | 408 (80.8%) | 391 (83.4%) |
| 65 to 74 Years | 368 (92.9%) | 341 (89.3%) |
| 75 Years and over | 263 (87.7%) | 273 (88.3%) |
| Total | 2,554 (83.8%) | 2,298 (79.9%) |
Income Below Poverty Among Married-Couple Families in Reynolds County
The poverty statistics for married-couple families in Reynolds County show that 5.9% or 68 of the total 1,158 families live below the poverty line. Families with 5 or more children have the highest poverty rate of 37.0%, comprising of 10 families. On the other hand, families with no children have the lowest poverty rate of 4.3%, which includes 38 families.
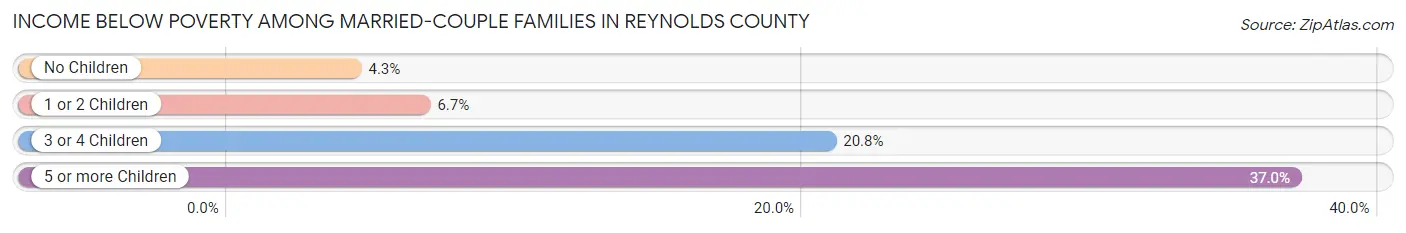
| Children | Above Poverty | Below Poverty |
| No Children | 845 (95.7%) | 38 (4.3%) |
| 1 or 2 Children | 209 (93.3%) | 15 (6.7%) |
| 3 or 4 Children | 19 (79.2%) | 5 (20.8%) |
| 5 or more Children | 17 (63.0%) | 10 (37.0%) |
| Total | 1,090 (94.1%) | 68 (5.9%) |
Income Below Poverty Among Single-Parent Households in Reynolds County
According to the poverty data in Reynolds County, 10.6% or 9 single-father households and 59.8% or 125 single-mother households are living below the poverty line. Among single-father households, those with 1 or 2 children have the highest poverty rate, with 8 households (25.0%) experiencing poverty. Likewise, among single-mother households, those with 5 or more children have the highest poverty rate, with 12 households (100.0%) falling below the poverty line.
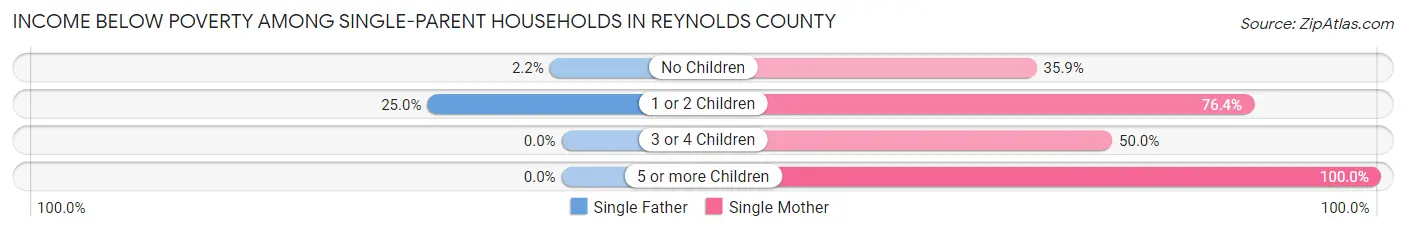
| Children | Single Father | Single Mother |
| No Children | 1 (2.2%) | 23 (35.9%) |
| 1 or 2 Children | 8 (25.0%) | 68 (76.4%) |
| 3 or 4 Children | 0 (0.0%) | 22 (50.0%) |
| 5 or more Children | 0 (0.0%) | 12 (100.0%) |
| Total | 9 (10.6%) | 125 (59.8%) |
Income Below Poverty Among Married-Couple vs Single-Parent Households in Reynolds County
The poverty data for Reynolds County shows that 68 of the married-couple family households (5.9%) and 134 of the single-parent households (45.6%) are living below the poverty level. Within the married-couple family households, those with 5 or more children have the highest poverty rate, with 10 households (37.0%) falling below the poverty line. Among the single-parent households, those with 5 or more children have the highest poverty rate, with 12 household (100.0%) living below poverty.
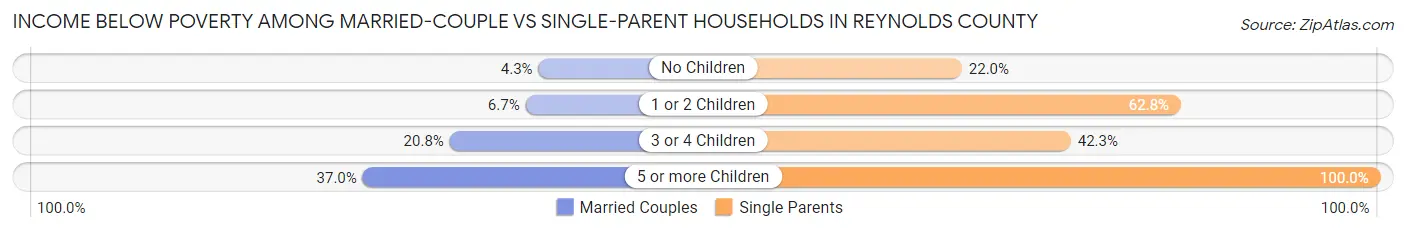
| Children | Married-Couple Families | Single-Parent Households |
| No Children | 38 (4.3%) | 24 (22.0%) |
| 1 or 2 Children | 15 (6.7%) | 76 (62.8%) |
| 3 or 4 Children | 5 (20.8%) | 22 (42.3%) |
| 5 or more Children | 10 (37.0%) | 12 (100.0%) |
| Total | 68 (5.9%) | 134 (45.6%) |
Race in Reynolds County
The most populous races in Reynolds County are White / Caucasian (5,659 | 92.7%), Two or more Races (282 | 4.6%), and Hispanic or Latino (104 | 1.7%).
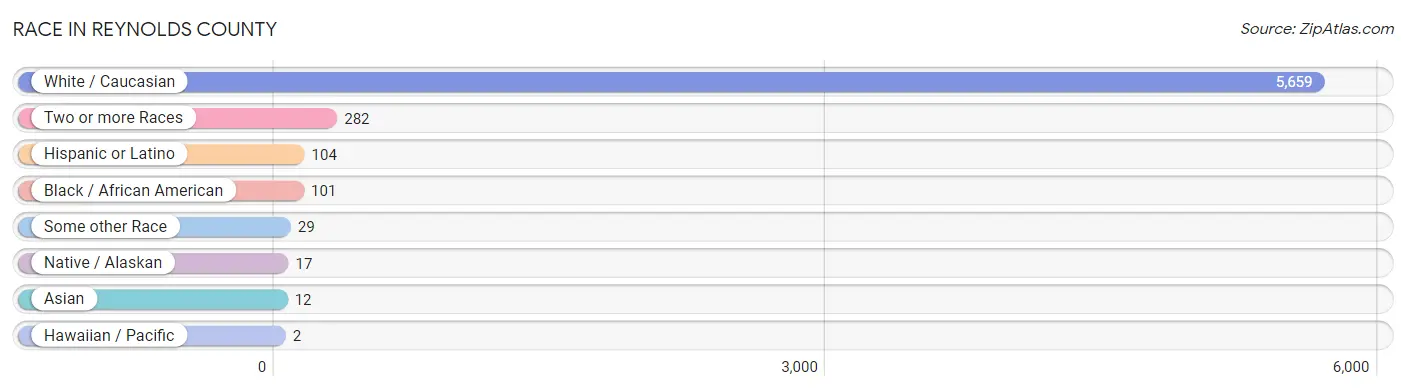
| Race | # Population | % Population |
| Asian | 12 | 0.2% |
| Black / African American | 101 | 1.7% |
| Hawaiian / Pacific | 2 | 0.0% |
| Hispanic or Latino | 104 | 1.7% |
| Native / Alaskan | 17 | 0.3% |
| White / Caucasian | 5,659 | 92.7% |
| Two or more Races | 282 | 4.6% |
| Some other Race | 29 | 0.5% |
| Total | 6,102 | 100.0% |
Ancestry in Reynolds County
The most populous ancestries reported in Reynolds County are German (1,138 | 18.6%), Irish (961 | 15.8%), American (675 | 11.1%), English (456 | 7.5%), and French (152 | 2.5%), together accounting for 55.4% of all Reynolds County residents.
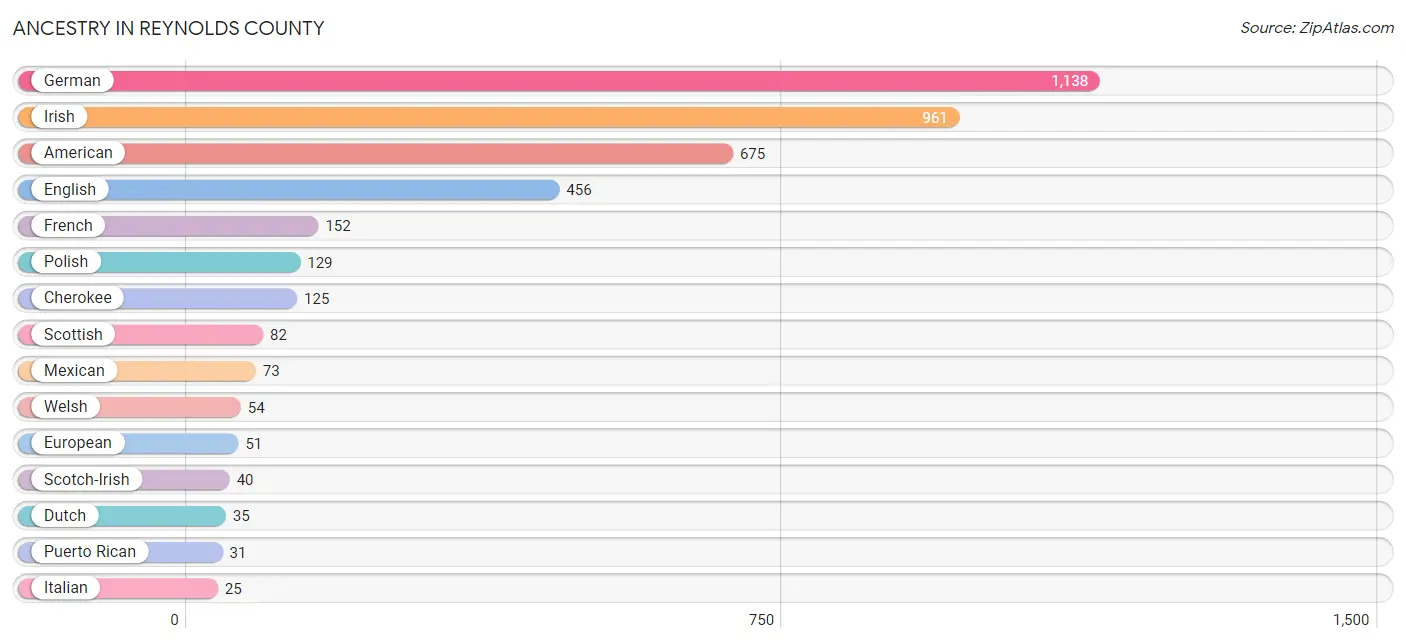
| Ancestry | # Population | % Population |
| American | 675 | 11.1% |
| Bhutanese | 19 | 0.3% |
| Blackfeet | 10 | 0.2% |
| British | 8 | 0.1% |
| Cherokee | 125 | 2.1% |
| Czech | 12 | 0.2% |
| Dutch | 35 | 0.6% |
| English | 456 | 7.5% |
| European | 51 | 0.8% |
| French | 152 | 2.5% |
| French American Indian | 9 | 0.2% |
| French Canadian | 4 | 0.1% |
| German | 1,138 | 18.6% |
| Irish | 961 | 15.8% |
| Italian | 25 | 0.4% |
| Japanese | 1 | 0.0% |
| Korean | 2 | 0.0% |
| Mexican | 73 | 1.2% |
| Mexican American Indian | 3 | 0.1% |
| Norwegian | 1 | 0.0% |
| Polish | 129 | 2.1% |
| Puerto Rican | 31 | 0.5% |
| Samoan | 3 | 0.1% |
| Scotch-Irish | 40 | 0.7% |
| Scottish | 82 | 1.3% |
| Sri Lankan | 7 | 0.1% |
| Swedish | 13 | 0.2% |
| Swiss | 4 | 0.1% |
| Welsh | 54 | 0.9% | View All 29 Rows |
Immigrants in Reynolds County
The most numerous immigrant groups reported in Reynolds County came from Central America (9 | 0.2%), Latin America (9 | 0.2%), Panama (9 | 0.2%), Asia (4 | 0.1%), and South Eastern Asia (2 | 0.0%), together accounting for 0.6% of all Reynolds County residents.
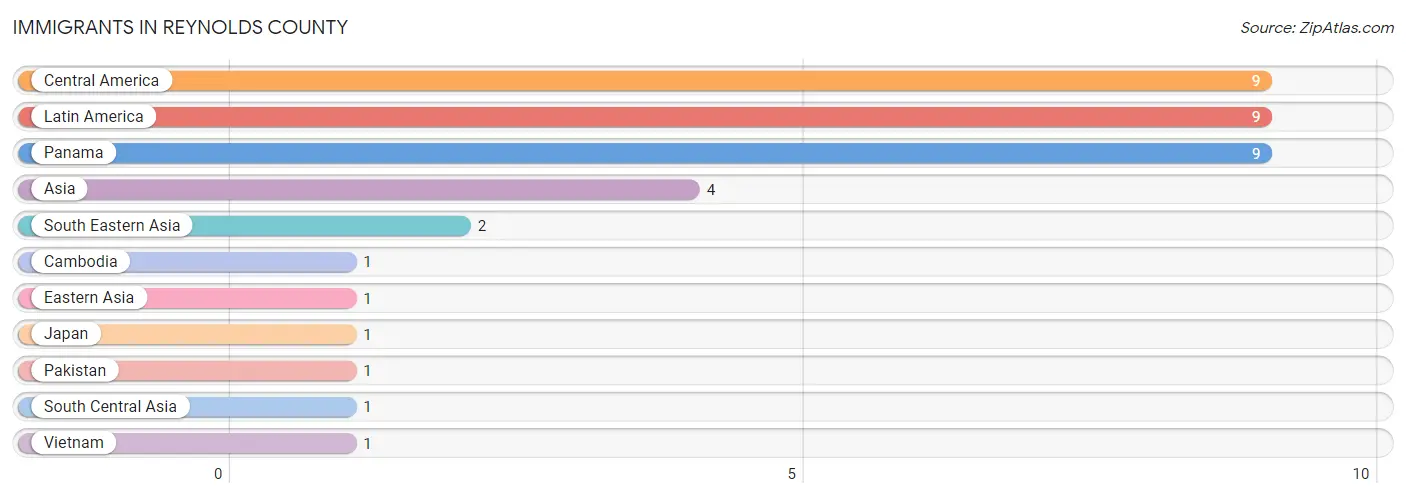
| Immigration Origin | # Population | % Population |
| Asia | 4 | 0.1% |
| Cambodia | 1 | 0.0% |
| Central America | 9 | 0.2% |
| Eastern Asia | 1 | 0.0% |
| Japan | 1 | 0.0% |
| Latin America | 9 | 0.2% |
| Pakistan | 1 | 0.0% |
| Panama | 9 | 0.2% |
| South Central Asia | 1 | 0.0% |
| South Eastern Asia | 2 | 0.0% |
| Vietnam | 1 | 0.0% | View All 11 Rows |
Sex and Age in Reynolds County
Sex and Age in Reynolds County
The most populous age groups in Reynolds County are 60 to 64 Years (271 | 8.5%) for men and 55 to 59 Years (274 | 9.4%) for women.
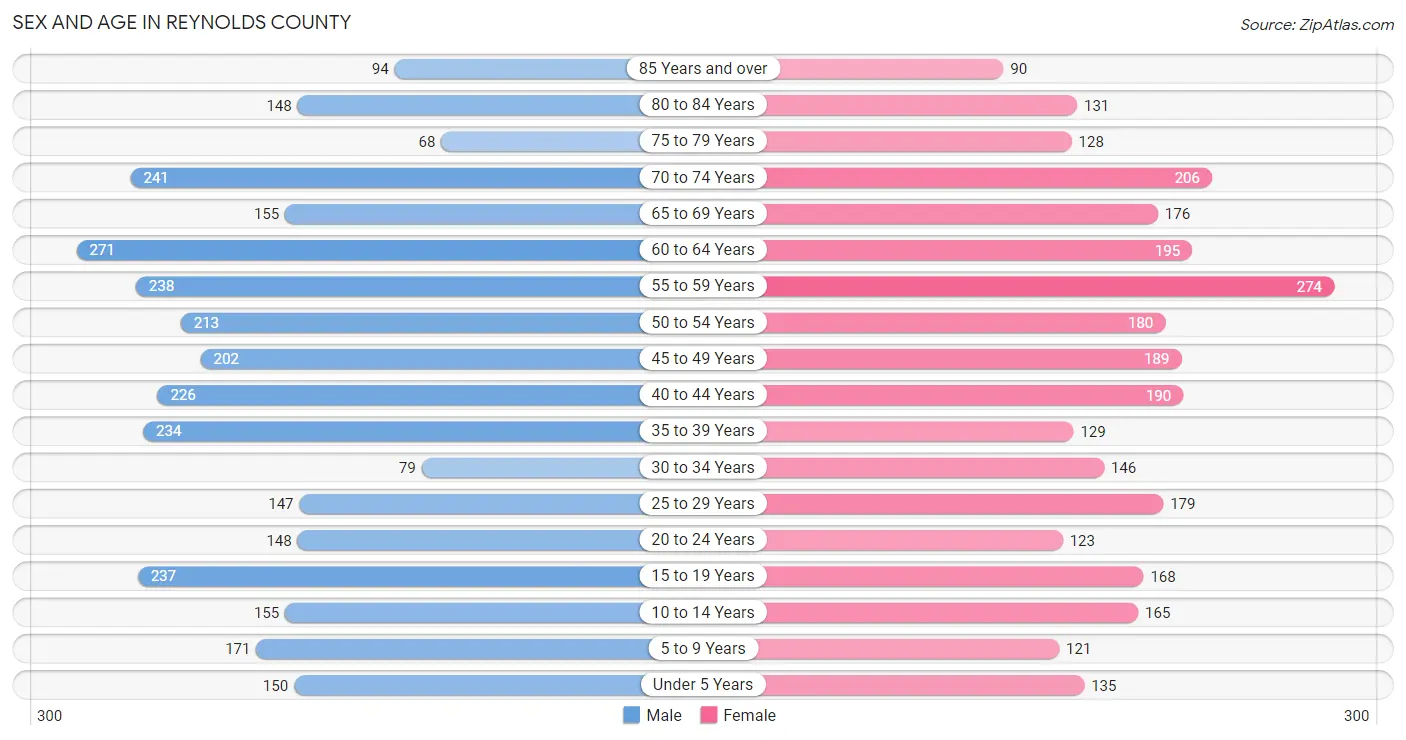
| Age Bracket | Male | Female |
| Under 5 Years | 150 (4.7%) | 135 (4.6%) |
| 5 to 9 Years | 171 (5.4%) | 121 (4.1%) |
| 10 to 14 Years | 155 (4.9%) | 165 (5.6%) |
| 15 to 19 Years | 237 (7.5%) | 168 (5.7%) |
| 20 to 24 Years | 148 (4.7%) | 123 (4.2%) |
| 25 to 29 Years | 147 (4.6%) | 179 (6.1%) |
| 30 to 34 Years | 79 (2.5%) | 146 (5.0%) |
| 35 to 39 Years | 234 (7.4%) | 129 (4.4%) |
| 40 to 44 Years | 226 (7.1%) | 190 (6.5%) |
| 45 to 49 Years | 202 (6.4%) | 189 (6.5%) |
| 50 to 54 Years | 213 (6.7%) | 180 (6.1%) |
| 55 to 59 Years | 238 (7.5%) | 274 (9.4%) |
| 60 to 64 Years | 271 (8.5%) | 195 (6.7%) |
| 65 to 69 Years | 155 (4.9%) | 176 (6.0%) |
| 70 to 74 Years | 241 (7.6%) | 206 (7.0%) |
| 75 to 79 Years | 68 (2.1%) | 128 (4.4%) |
| 80 to 84 Years | 148 (4.7%) | 131 (4.5%) |
| 85 Years and over | 94 (3.0%) | 90 (3.1%) |
| Total | 3,177 (100.0%) | 2,925 (100.0%) |
Families and Households in Reynolds County
Median Family Size in Reynolds County
The median family size in Reynolds County is 3.23 persons per family, with single male/father families (85 | 5.9%) accounting for the largest median family size of 4.56 persons per family. On the other hand, married-couple families (1,158 | 79.7%) represent the smallest median family size with 2.98 persons per family.
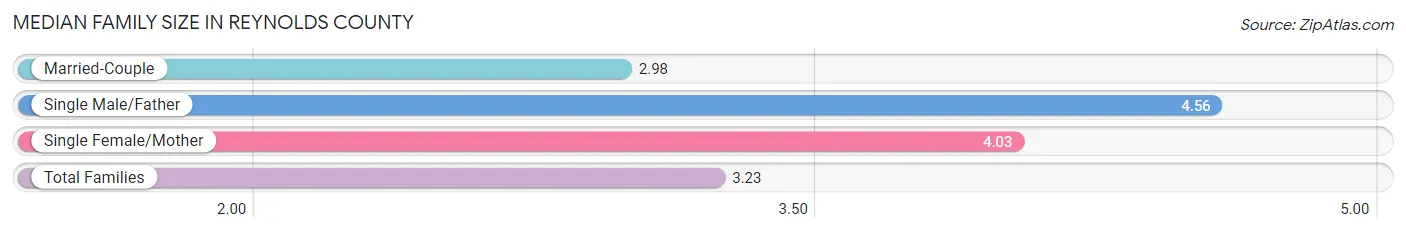
| Family Type | # Families | Family Size |
| Married-Couple | 1,158 (79.7%) | 2.98 |
| Single Male/Father | 85 (5.9%) | 4.56 |
| Single Female/Mother | 209 (14.4%) | 4.03 |
| Total Families | 1,452 (100.0%) | 3.23 |
Median Household Size in Reynolds County
The median household size in Reynolds County is 2.56 persons per household, with single male/father households (85 | 3.7%) accounting for the largest median household size of 4.87 persons per household. non-family households (857 | 37.1%) represent the smallest median household size with 1.24 persons per household.
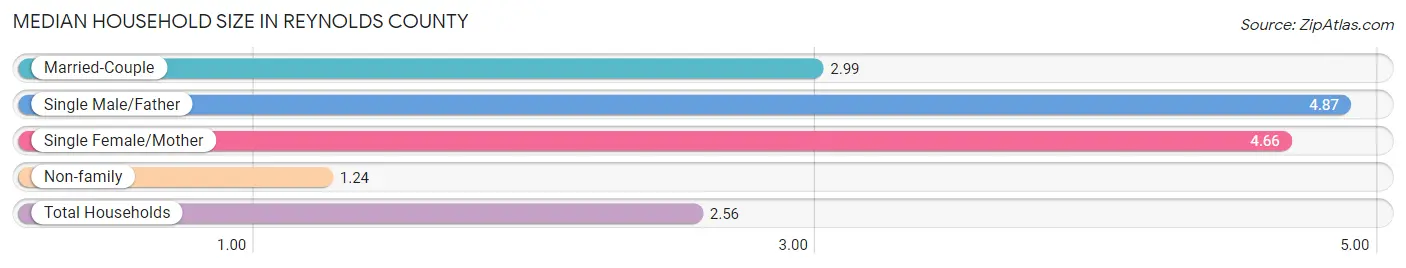
| Household Type | # Households | Household Size |
| Married-Couple | 1,158 (50.1%) | 2.99 |
| Single Male/Father | 85 (3.7%) | 4.87 |
| Single Female/Mother | 209 (9.0%) | 4.66 |
| Non-family | 857 (37.1%) | 1.24 |
| Total Households | 2,309 (100.0%) | 2.56 |
Household Size by Marriage Status in Reynolds County
Out of a total of 2,309 households in Reynolds County, 1,452 (62.9%) are family households, while 857 (37.1%) are nonfamily households. The most numerous type of family households are 2-person households, comprising 831, and the most common type of nonfamily households are 1-person households, comprising 743.
| Household Size | Family Households | Nonfamily Households |
| 1-Person Households | - | 743 (32.2%) |
| 2-Person Households | 831 (36.0%) | 94 (4.1%) |
| 3-Person Households | 294 (12.7%) | 10 (0.4%) |
| 4-Person Households | 179 (7.7%) | 0 (0.0%) |
| 5-Person Households | 78 (3.4%) | 10 (0.4%) |
| 6-Person Households | 43 (1.9%) | 0 (0.0%) |
| 7+ Person Households | 27 (1.2%) | 0 (0.0%) |
| Total | 1,452 (62.9%) | 857 (37.1%) |
Female Fertility in Reynolds County
Fertility by Age in Reynolds County
Average fertility rate in Reynolds County is 42.0 births per 1,000 women. Women in the age bracket of 35 to 50 years have the highest fertility rate with 51.0 births per 1,000 women. Women in the age bracket of 35 to 50 years acount for 56.2% of all women with births.
| Age Bracket | Women with Births | Births / 1,000 Women |
| 15 to 19 years | 0 (0.0%) | 0.0 |
| 20 to 34 years | 21 (43.8%) | 47.0 |
| 35 to 50 years | 27 (56.2%) | 51.0 |
| Total | 48 (100.0%) | 42.0 |
Fertility by Age by Marriage Status in Reynolds County
79.2% of women with births (48) in Reynolds County are married. The highest percentage of unmarried women with births falls into 20 to 34 years age bracket with 47.6% of them unmarried at the time of birth, while the lowest percentage of unmarried women with births belong to 35 to 50 years age bracket with 0.0% of them unmarried.
| Age Bracket | Married | Unmarried |
| 15 to 19 years | 0 (0.0%) | 0 (0.0%) |
| 20 to 34 years | 11 (52.4%) | 10 (47.6%) |
| 35 to 50 years | 27 (100.0%) | 0 (0.0%) |
| Total | 38 (79.2%) | 10 (20.8%) |
Fertility by Education in Reynolds County
| Educational Attainment | Women with Births | Births / 1,000 Women |
| Less than High School | 0 (0.0%) | 0.0 |
| High School Diploma | 10 (20.8%) | 33.0 |
| College or Associate's Degree | 35 (72.9%) | 105.0 |
| Bachelor's Degree | 3 (6.2%) | 16.0 |
| Graduate Degree | 0 (0.0%) | 0.0 |
| Total | 48 (100.0%) | 42.0 |
Fertility by Education by Marriage Status in Reynolds County
20.8% of women with births in Reynolds County are unmarried. Women with the educational attainment of college or associate's degree are most likely to be married with 100.0% of them married at childbirth, while women with the educational attainment of high school diploma are least likely to be married with 100.0% of them unmarried at childbirth.
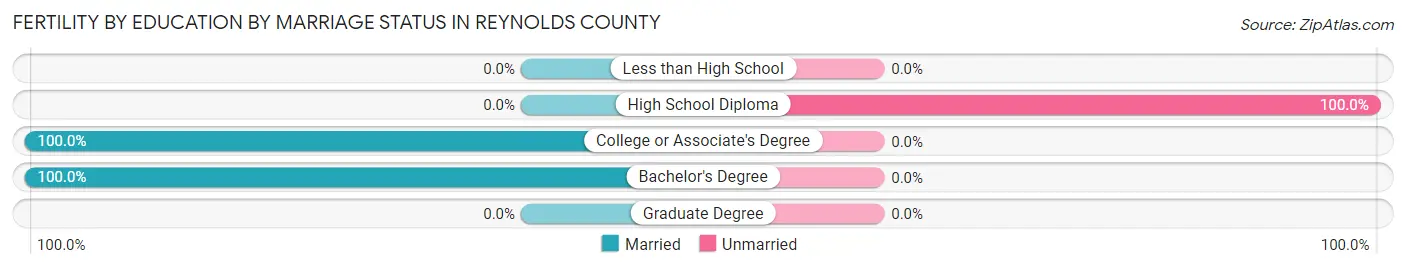
| Educational Attainment | Married | Unmarried |
| Less than High School | 0 (0.0%) | 0 (0.0%) |
| High School Diploma | 0 (0.0%) | 10 (100.0%) |
| College or Associate's Degree | 35 (100.0%) | 0 (0.0%) |
| Bachelor's Degree | 3 (100.0%) | 0 (0.0%) |
| Graduate Degree | 0 (0.0%) | 0 (0.0%) |
| Total | 38 (79.2%) | 10 (20.8%) |
Employment Characteristics in Reynolds County
Employment by Class of Employer in Reynolds County
Among the 2,365 employed individuals in Reynolds County, private company employees (1,505 | 63.6%), self-employed (not incorporated) (242 | 10.2%), and not-for-profit organizations (203 | 8.6%) make up the most common classes of employment.
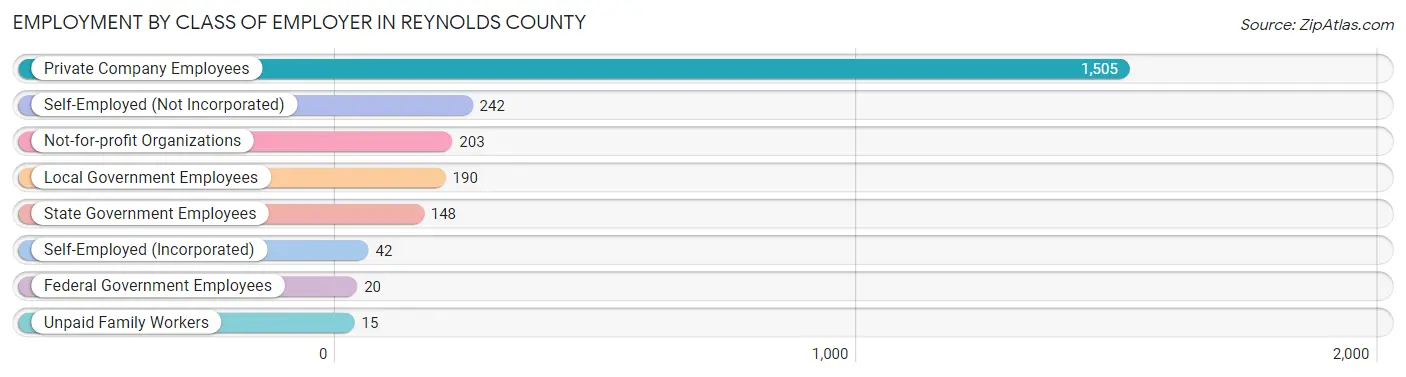
| Employer Class | # Employees | % Employees |
| Private Company Employees | 1,505 | 63.6% |
| Self-Employed (Incorporated) | 42 | 1.8% |
| Self-Employed (Not Incorporated) | 242 | 10.2% |
| Not-for-profit Organizations | 203 | 8.6% |
| Local Government Employees | 190 | 8.0% |
| State Government Employees | 148 | 6.3% |
| Federal Government Employees | 20 | 0.9% |
| Unpaid Family Workers | 15 | 0.6% |
| Total | 2,365 | 100.0% |
Employment Status by Age in Reynolds County
According to the labor force statistics for Reynolds County, out of the total population over 16 years of age (5,151), 52.9% or 2,725 individuals are in the labor force, with 10.0% or 272 of them unemployed. The age group with the highest labor force participation rate is 25 to 29 years, with 90.2% or 294 individuals in the labor force. Within the labor force, the 45 to 54 years age range has the highest percentage of unemployed individuals, with 18.4% or 113 of them being unemployed.
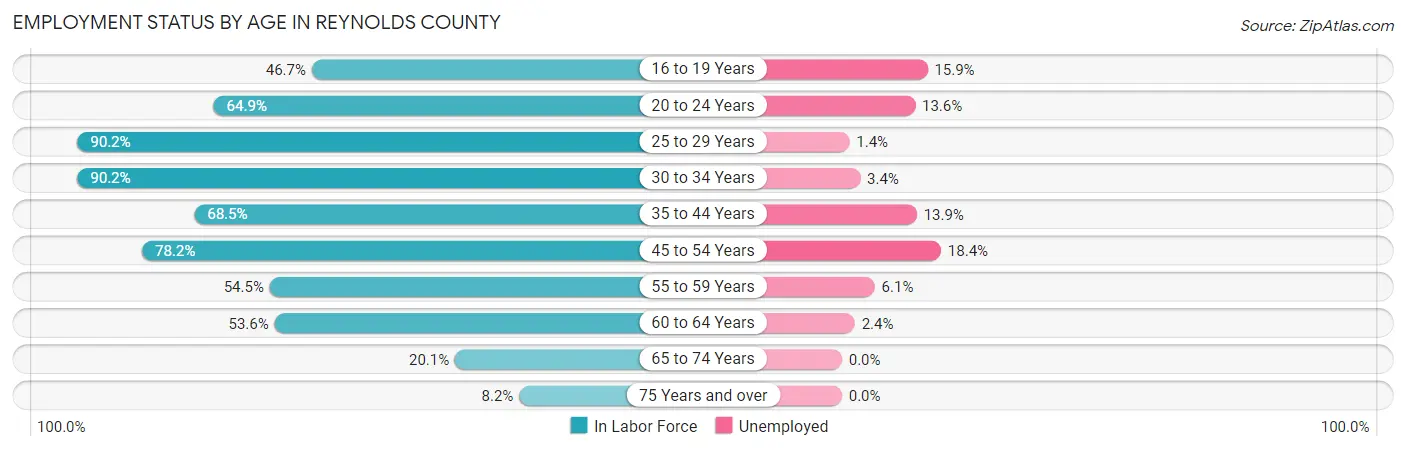
| Age Bracket | In Labor Force | Unemployed |
| 16 to 19 Years | 164 (46.7%) | 26 (15.9%) |
| 20 to 24 Years | 176 (64.9%) | 24 (13.6%) |
| 25 to 29 Years | 294 (90.2%) | 4 (1.4%) |
| 30 to 34 Years | 203 (90.2%) | 7 (3.4%) |
| 35 to 44 Years | 534 (68.5%) | 74 (13.9%) |
| 45 to 54 Years | 613 (78.2%) | 113 (18.4%) |
| 55 to 59 Years | 279 (54.5%) | 17 (6.1%) |
| 60 to 64 Years | 250 (53.6%) | 6 (2.4%) |
| 65 to 74 Years | 156 (20.1%) | 0 (0.0%) |
| 75 Years and over | 54 (8.2%) | 0 (0.0%) |
| Total | 2,725 (52.9%) | 272 (10.0%) |
Employment Status by Educational Attainment in Reynolds County
According to labor force statistics for Reynolds County, 70.3% of individuals (2,174) out of the total population between 25 and 64 years of age (3,092) are in the labor force, with 10.2% or 222 of them being unemployed. The group with the highest labor force participation rate are those with the educational attainment of bachelor's degree or higher, with 76.4% or 379 individuals in the labor force. Within the labor force, individuals with less than high school education have the highest percentage of unemployment, with 39.4% or 141 of them being unemployed.
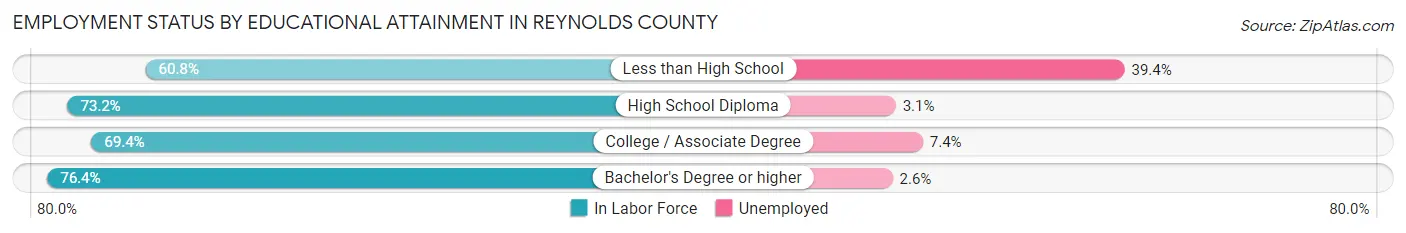
| Educational Attainment | In Labor Force | Unemployed |
| Less than High School | 358 (60.8%) | 232 (39.4%) |
| High School Diploma | 838 (73.2%) | 35 (3.1%) |
| College / Associate Degree | 598 (69.4%) | 64 (7.4%) |
| Bachelor's Degree or higher | 379 (76.4%) | 13 (2.6%) |
| Total | 2,174 (70.3%) | 315 (10.2%) |
Employment Occupations by Sex in Reynolds County
Management, Business, Science and Arts Occupations
The most common Management, Business, Science and Arts occupations in Reynolds County are Community & Social Service (268 | 10.9%), Management (244 | 10.0%), Education Instruction & Library (162 | 6.6%), Health Diagnosing & Treating (65 | 2.6%), and Education, Arts & Media (54 | 2.2%).
Management, Business, Science and Arts Occupations by Sex
Within the Management, Business, Science and Arts occupations in Reynolds County, the most male-oriented occupations are Life, Physical & Social Science (90.9%), Architecture & Engineering (60.0%), and Computers, Engineering & Science (58.5%), while the most female-oriented occupations are Health Technologists (100.0%), Education Instruction & Library (96.9%), and Computers & Mathematics (92.9%).
| Occupation | Male | Female |
| Management | 133 (54.5%) | 111 (45.5%) |
| Business & Financial | 10 (20.8%) | 38 (79.2%) |
| Computers, Engineering & Science | 24 (58.5%) | 17 (41.5%) |
| Computers & Mathematics | 1 (7.1%) | 13 (92.9%) |
| Architecture & Engineering | 3 (60.0%) | 2 (40.0%) |
| Life, Physical & Social Science | 20 (90.9%) | 2 (9.1%) |
| Community & Social Service | 50 (18.7%) | 218 (81.3%) |
| Education, Arts & Media | 21 (38.9%) | 33 (61.1%) |
| Legal Services & Support | 5 (27.8%) | 13 (72.2%) |
| Education Instruction & Library | 5 (3.1%) | 157 (96.9%) |
| Arts, Media & Entertainment | 19 (55.9%) | 15 (44.1%) |
| Health Diagnosing & Treating | 12 (18.5%) | 53 (81.5%) |
| Health Technologists | 0 (0.0%) | 5 (100.0%) |
| Total (Category) | 229 (34.4%) | 437 (65.6%) |
| Total (Overall) | 1,355 (55.3%) | 1,096 (44.7%) |
Services Occupations
The most common Services occupations in Reynolds County are Cleaning & Maintenance (152 | 6.2%), Food Preparation & Serving (113 | 4.6%), Healthcare Support (96 | 3.9%), Personal Care & Service (63 | 2.6%), and Security & Protection (42 | 1.7%).
Services Occupations by Sex
Within the Services occupations in Reynolds County, the most male-oriented occupations are Law Enforcement (77.3%), Cleaning & Maintenance (73.0%), and Security & Protection (42.9%), while the most female-oriented occupations are Firefighting & Prevention (95.0%), Food Preparation & Serving (85.0%), and Personal Care & Service (82.5%).
| Occupation | Male | Female |
| Healthcare Support | 22 (22.9%) | 74 (77.1%) |
| Security & Protection | 18 (42.9%) | 24 (57.1%) |
| Firefighting & Prevention | 1 (5.0%) | 19 (95.0%) |
| Law Enforcement | 17 (77.3%) | 5 (22.7%) |
| Food Preparation & Serving | 17 (15.0%) | 96 (85.0%) |
| Cleaning & Maintenance | 111 (73.0%) | 41 (27.0%) |
| Personal Care & Service | 11 (17.5%) | 52 (82.5%) |
| Total (Category) | 179 (38.4%) | 287 (61.6%) |
| Total (Overall) | 1,355 (55.3%) | 1,096 (44.7%) |
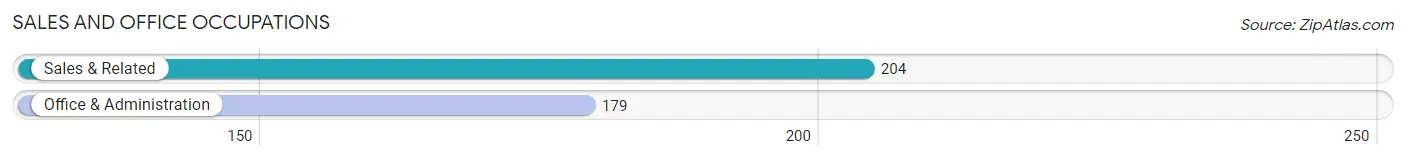
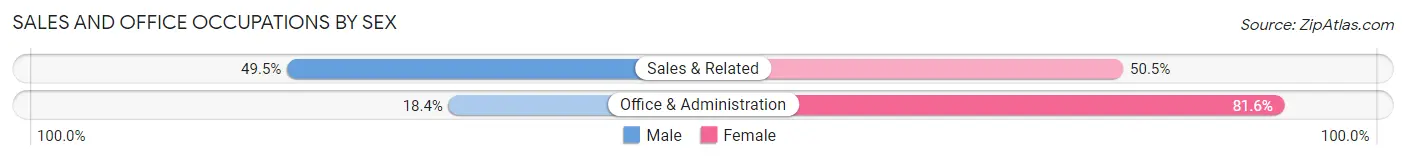
Sales and Office Occupations
The most common Sales and Office occupations in Reynolds County are Sales & Related (204 | 8.3%), and Office & Administration (179 | 7.3%).
Sales and Office Occupations by Sex
| Occupation | Male | Female |
| Sales & Related | 101 (49.5%) | 103 (50.5%) |
| Office & Administration | 33 (18.4%) | 146 (81.6%) |
| Total (Category) | 134 (35.0%) | 249 (65.0%) |
| Total (Overall) | 1,355 (55.3%) | 1,096 (44.7%) |
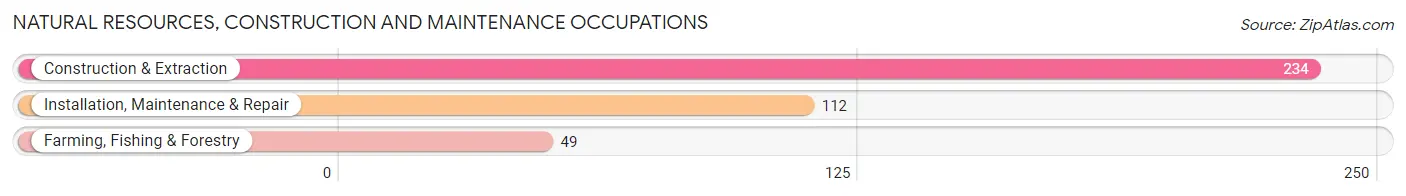
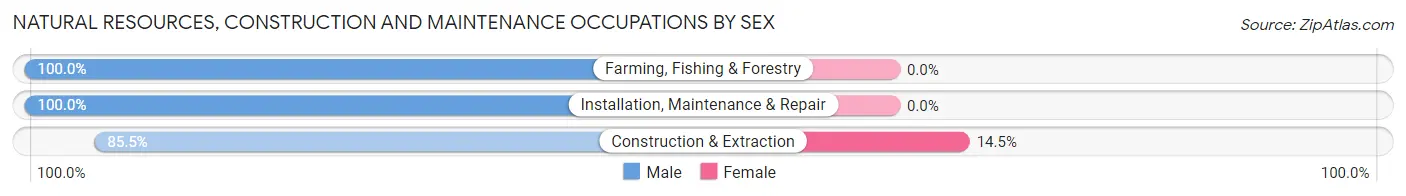
Natural Resources, Construction and Maintenance Occupations
The most common Natural Resources, Construction and Maintenance occupations in Reynolds County are Construction & Extraction (234 | 9.6%), Installation, Maintenance & Repair (112 | 4.6%), and Farming, Fishing & Forestry (49 | 2.0%).
Natural Resources, Construction and Maintenance Occupations by Sex
| Occupation | Male | Female |
| Farming, Fishing & Forestry | 49 (100.0%) | 0 (0.0%) |
| Construction & Extraction | 200 (85.5%) | 34 (14.5%) |
| Installation, Maintenance & Repair | 112 (100.0%) | 0 (0.0%) |
| Total (Category) | 361 (91.4%) | 34 (8.6%) |
| Total (Overall) | 1,355 (55.3%) | 1,096 (44.7%) |
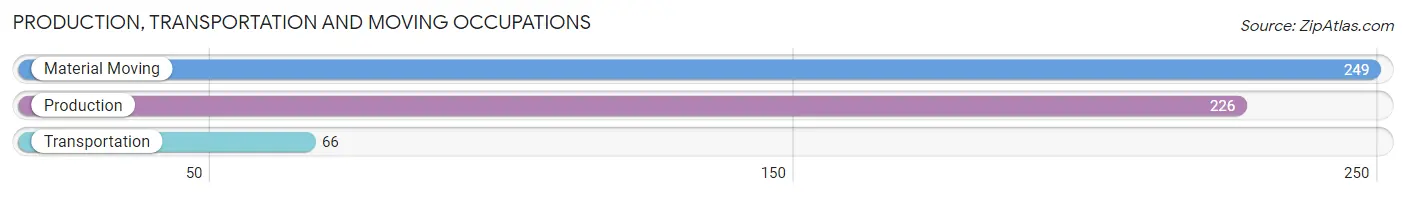
Production, Transportation and Moving Occupations
The most common Production, Transportation and Moving occupations in Reynolds County are Material Moving (249 | 10.2%), Production (226 | 9.2%), and Transportation (66 | 2.7%).
Production, Transportation and Moving Occupations by Sex
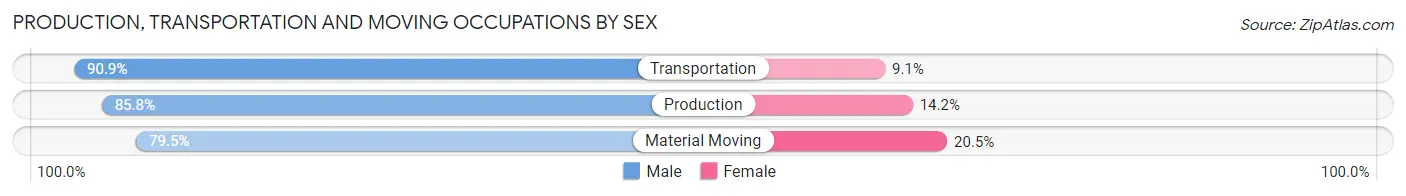
| Occupation | Male | Female |
| Production | 194 (85.8%) | 32 (14.2%) |
| Transportation | 60 (90.9%) | 6 (9.1%) |
| Material Moving | 198 (79.5%) | 51 (20.5%) |
| Total (Category) | 452 (83.6%) | 89 (16.5%) |
| Total (Overall) | 1,355 (55.3%) | 1,096 (44.7%) |
Employment Industries by Sex in Reynolds County
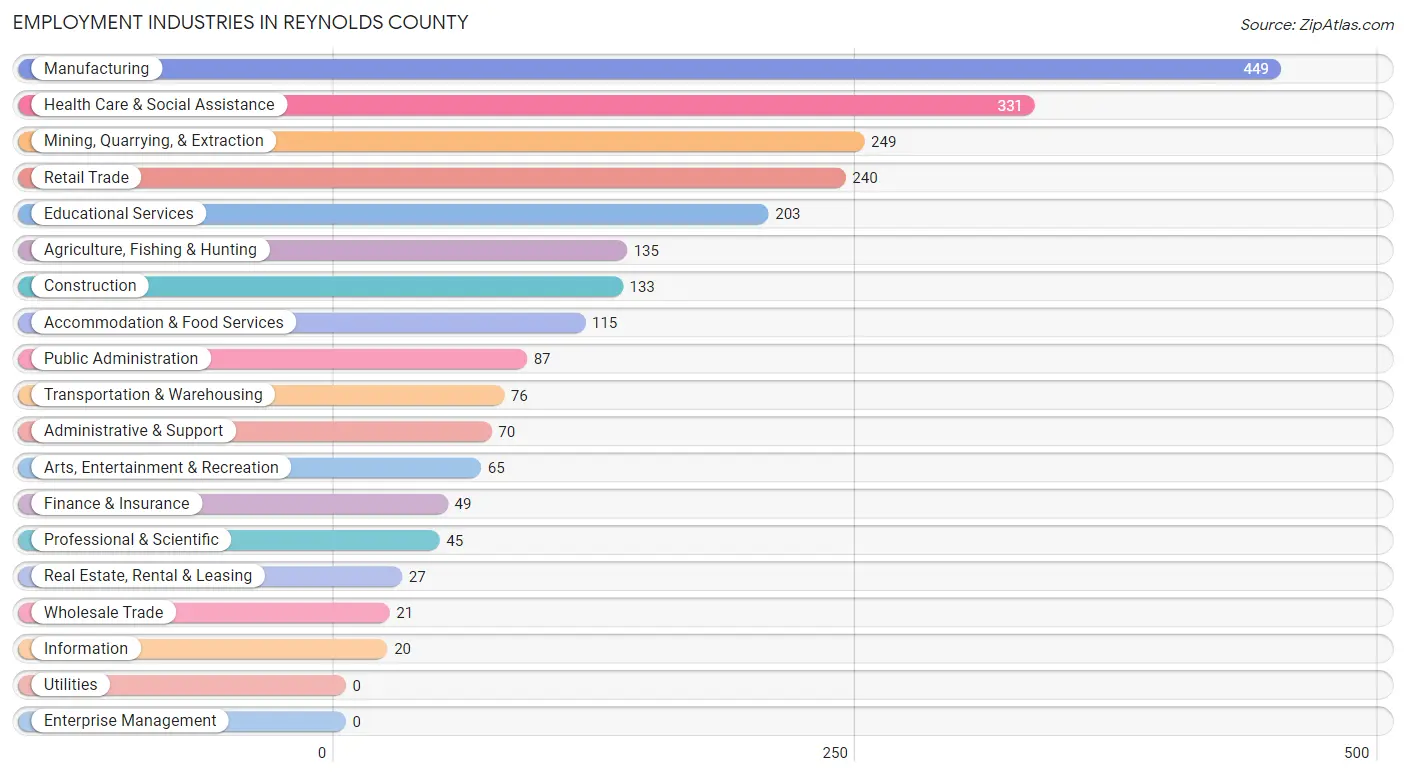
Employment Industries in Reynolds County
The major employment industries in Reynolds County include Manufacturing (449 | 18.3%), Health Care & Social Assistance (331 | 13.5%), Mining, Quarrying, & Extraction (249 | 10.2%), Retail Trade (240 | 9.8%), and Educational Services (203 | 8.3%).
Employment Industries by Sex in Reynolds County
The Reynolds County industries that see more men than women are Real Estate, Rental & Leasing (100.0%), Arts, Entertainment & Recreation (100.0%), and Agriculture, Fishing & Hunting (96.3%), whereas the industries that tend to have a higher number of women are Educational Services (90.1%), Finance & Insurance (87.8%), and Health Care & Social Assistance (75.8%).
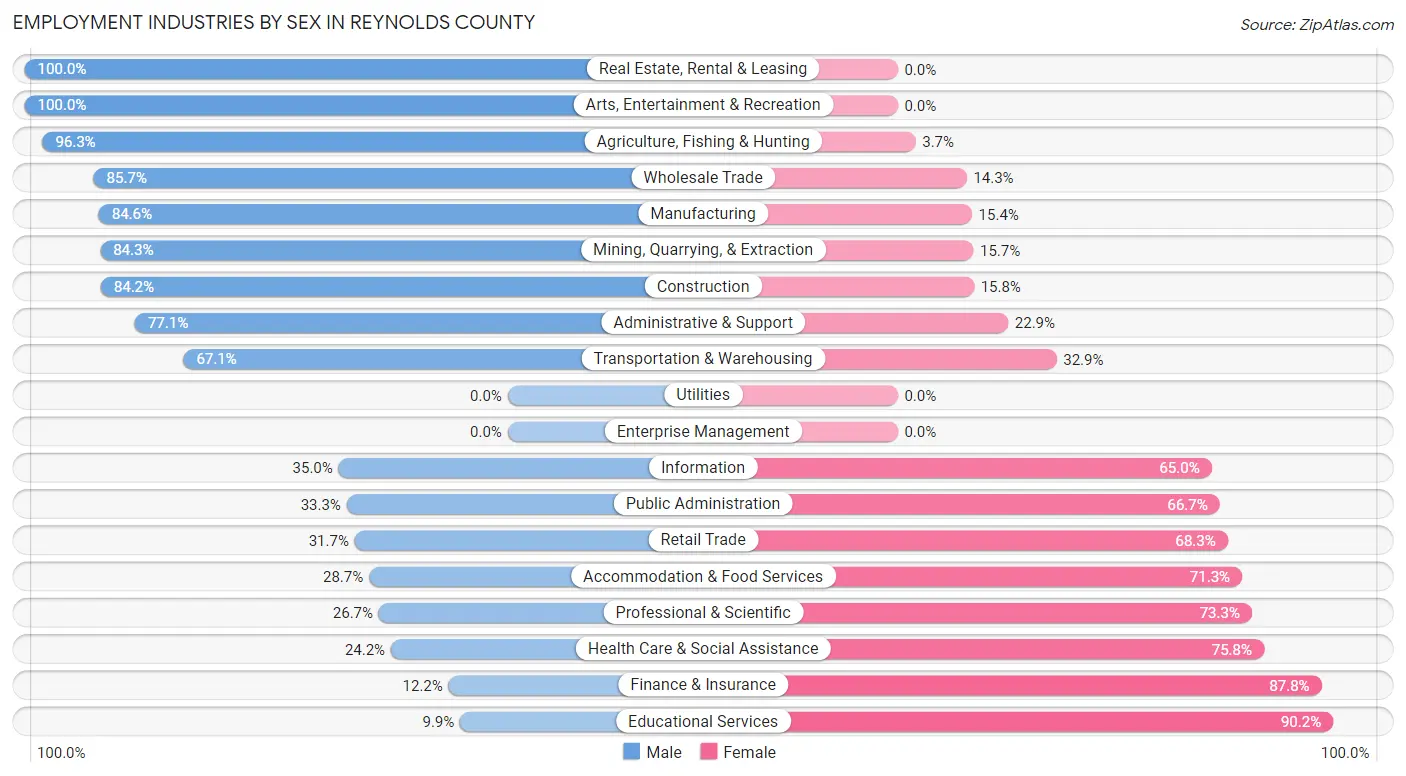
| Industry | Male | Female |
| Agriculture, Fishing & Hunting | 130 (96.3%) | 5 (3.7%) |
| Mining, Quarrying, & Extraction | 210 (84.3%) | 39 (15.7%) |
| Construction | 112 (84.2%) | 21 (15.8%) |
| Manufacturing | 380 (84.6%) | 69 (15.4%) |
| Wholesale Trade | 18 (85.7%) | 3 (14.3%) |
| Retail Trade | 76 (31.7%) | 164 (68.3%) |
| Transportation & Warehousing | 51 (67.1%) | 25 (32.9%) |
| Utilities | 0 (0.0%) | 0 (0.0%) |
| Information | 7 (35.0%) | 13 (65.0%) |
| Finance & Insurance | 6 (12.2%) | 43 (87.8%) |
| Real Estate, Rental & Leasing | 27 (100.0%) | 0 (0.0%) |
| Professional & Scientific | 12 (26.7%) | 33 (73.3%) |
| Enterprise Management | 0 (0.0%) | 0 (0.0%) |
| Administrative & Support | 54 (77.1%) | 16 (22.9%) |
| Educational Services | 20 (9.9%) | 183 (90.1%) |
| Health Care & Social Assistance | 80 (24.2%) | 251 (75.8%) |
| Arts, Entertainment & Recreation | 65 (100.0%) | 0 (0.0%) |
| Accommodation & Food Services | 33 (28.7%) | 82 (71.3%) |
| Public Administration | 29 (33.3%) | 58 (66.7%) |
| Total | 1,355 (55.3%) | 1,096 (44.7%) |
Education in Reynolds County
School Enrollment in Reynolds County
The most common levels of schooling among the 1,151 students in Reynolds County are high school (356 | 30.9%), middle school (247 | 21.5%), and elementary school (191 | 16.6%).
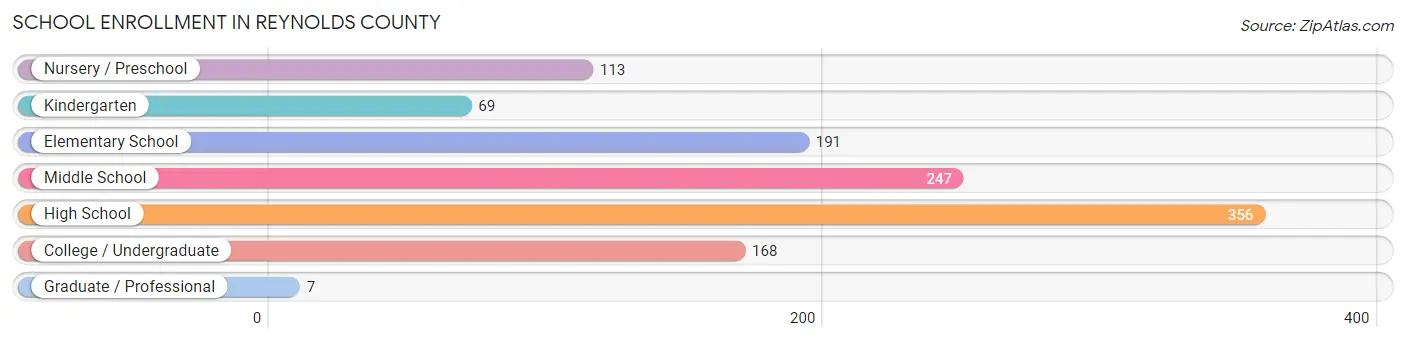
| School Level | # Students | % Students |
| Nursery / Preschool | 113 | 9.8% |
| Kindergarten | 69 | 6.0% |
| Elementary School | 191 | 16.6% |
| Middle School | 247 | 21.5% |
| High School | 356 | 30.9% |
| College / Undergraduate | 168 | 14.6% |
| Graduate / Professional | 7 | 0.6% |
| Total | 1,151 | 100.0% |
School Enrollment by Age by Funding Source in Reynolds County
Out of a total of 1,151 students who are enrolled in schools in Reynolds County, 113 (9.8%) attend a private institution, while the remaining 1,038 (90.2%) are enrolled in public schools. The age group of 25 to 34 year olds has the highest likelihood of being enrolled in private schools, with 9 (50.0% in the age bracket) enrolled. Conversely, the age group of 3 to 4 year olds has the lowest likelihood of being enrolled in a private school, with 94 (100.0% in the age bracket) attending a public institution.
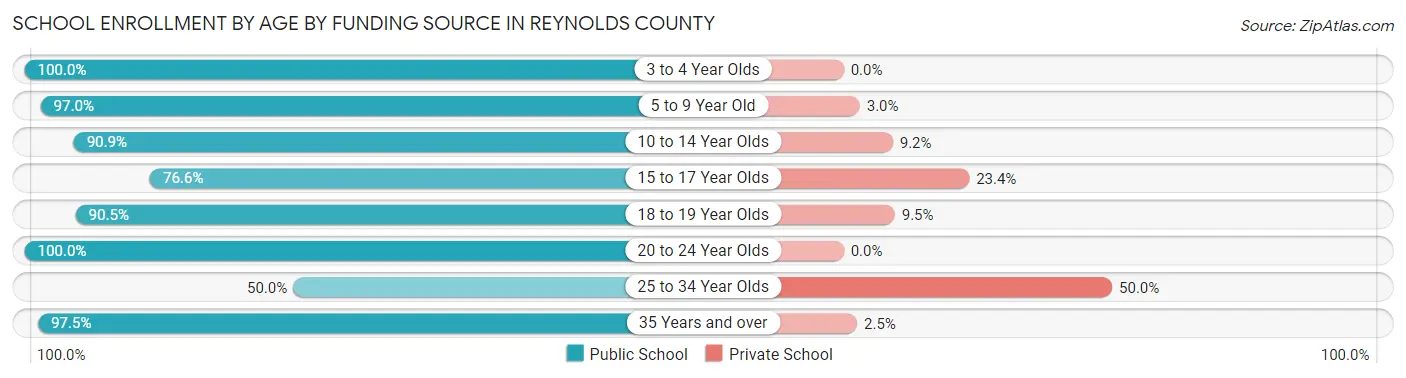
| Age Bracket | Public School | Private School |
| 3 to 4 Year Olds | 94 (100.0%) | 0 (0.0%) |
| 5 to 9 Year Old | 259 (97.0%) | 8 (3.0%) |
| 10 to 14 Year Olds | 268 (90.8%) | 27 (9.1%) |
| 15 to 17 Year Olds | 177 (76.6%) | 54 (23.4%) |
| 18 to 19 Year Olds | 133 (90.5%) | 14 (9.5%) |
| 20 to 24 Year Olds | 59 (100.0%) | 0 (0.0%) |
| 25 to 34 Year Olds | 9 (50.0%) | 9 (50.0%) |
| 35 Years and over | 39 (97.5%) | 1 (2.5%) |
| Total | 1,038 (90.2%) | 113 (9.8%) |
Educational Attainment by Field of Study in Reynolds County
Education (221 | 32.7%), business (113 | 16.7%), bio, nature & agricultural (66 | 9.8%), arts & humanities (63 | 9.3%), and science & technology (57 | 8.4%) are the most common fields of study among 676 individuals in Reynolds County who have obtained a bachelor's degree or higher.
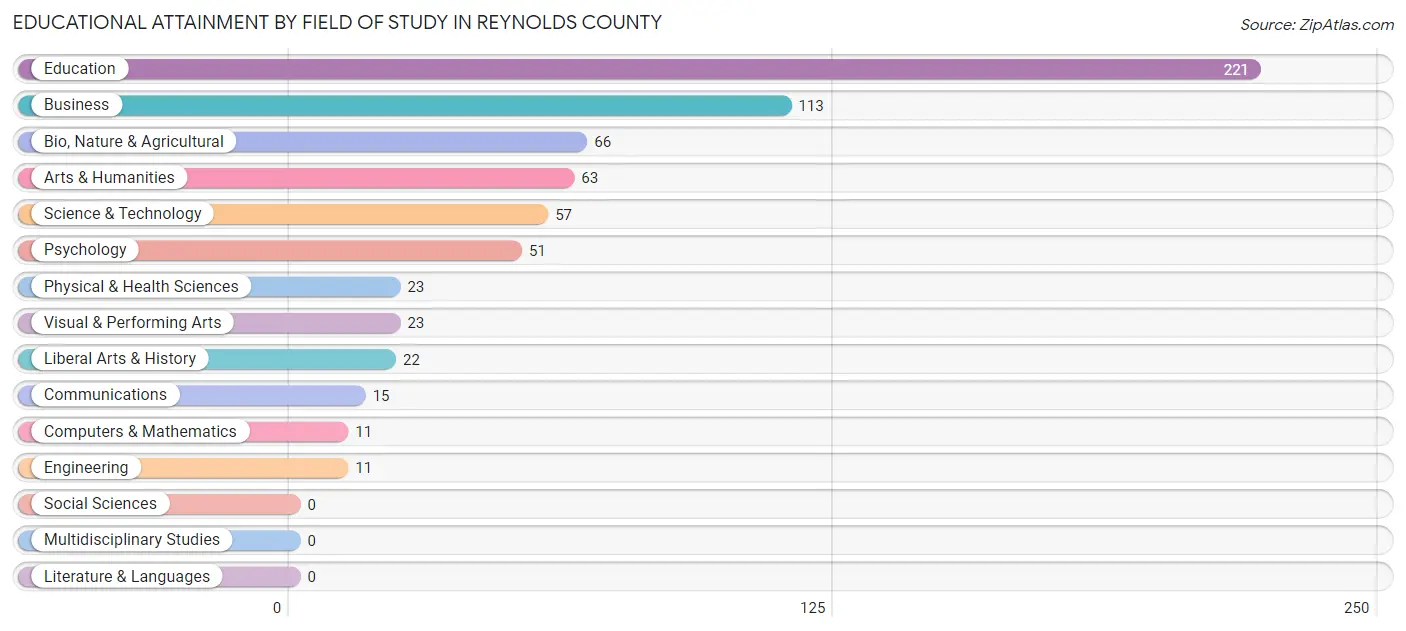
| Field of Study | # Graduates | % Graduates |
| Computers & Mathematics | 11 | 1.6% |
| Bio, Nature & Agricultural | 66 | 9.8% |
| Physical & Health Sciences | 23 | 3.4% |
| Psychology | 51 | 7.5% |
| Social Sciences | 0 | 0.0% |
| Engineering | 11 | 1.6% |
| Multidisciplinary Studies | 0 | 0.0% |
| Science & Technology | 57 | 8.4% |
| Business | 113 | 16.7% |
| Education | 221 | 32.7% |
| Literature & Languages | 0 | 0.0% |
| Liberal Arts & History | 22 | 3.3% |
| Visual & Performing Arts | 23 | 3.4% |
| Communications | 15 | 2.2% |
| Arts & Humanities | 63 | 9.3% |
| Total | 676 | 100.0% |
Transportation & Commute in Reynolds County
Vehicle Availability by Sex in Reynolds County
The most prevalent vehicle ownership categories in Reynolds County are males with 3 vehicles (371, accounting for 29.0%) and females with 3 vehicles (256, making up 34.8%).
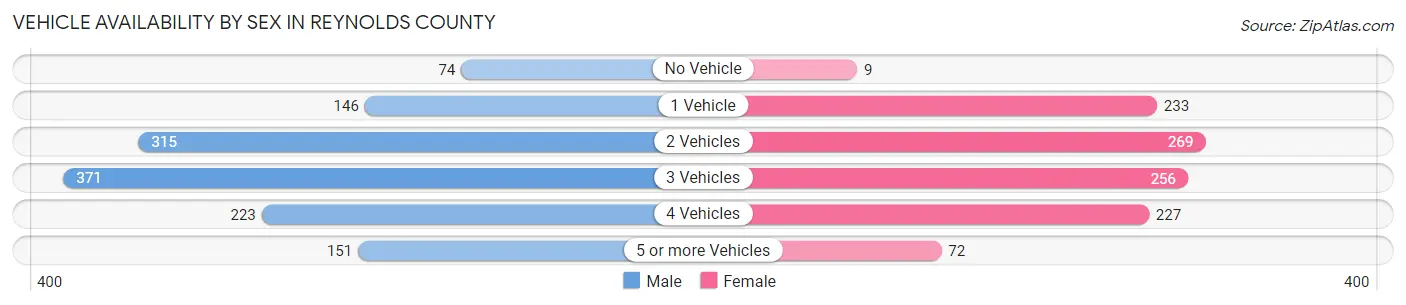
| Vehicles Available | Male | Female |
| No Vehicle | 74 (5.8%) | 9 (0.8%) |
| 1 Vehicle | 146 (11.4%) | 233 (21.9%) |
| 2 Vehicles | 315 (24.6%) | 269 (25.2%) |
| 3 Vehicles | 371 (29.0%) | 256 (24.0%) |
| 4 Vehicles | 223 (17.4%) | 227 (21.3%) |
| 5 or more Vehicles | 151 (11.8%) | 72 (6.8%) |
| Total | 1,280 (100.0%) | 1,066 (100.0%) |
Commute Time in Reynolds County
The most frequently occuring commute durations in Reynolds County are 10 to 14 minutes (327 commuters, 14.3%), 5 to 9 minutes (325 commuters, 14.2%), and 30 to 34 minutes (294 commuters, 12.9%).
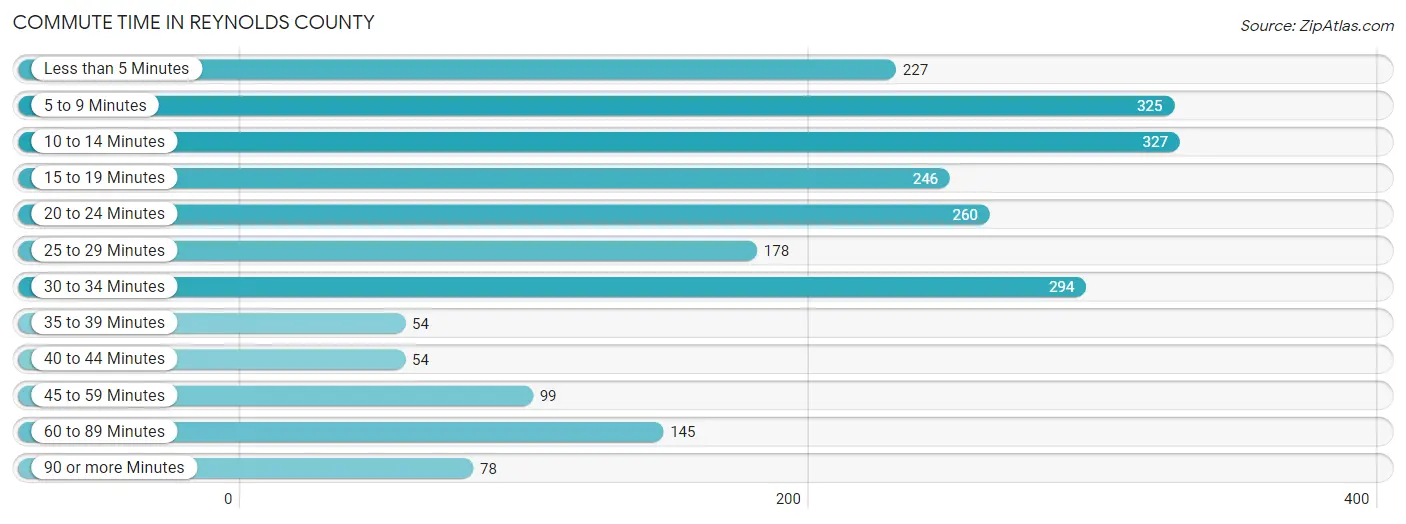
| Commute Time | # Commuters | % Commuters |
| Less than 5 Minutes | 227 | 9.9% |
| 5 to 9 Minutes | 325 | 14.2% |
| 10 to 14 Minutes | 327 | 14.3% |
| 15 to 19 Minutes | 246 | 10.8% |
| 20 to 24 Minutes | 260 | 11.4% |
| 25 to 29 Minutes | 178 | 7.8% |
| 30 to 34 Minutes | 294 | 12.9% |
| 35 to 39 Minutes | 54 | 2.4% |
| 40 to 44 Minutes | 54 | 2.4% |
| 45 to 59 Minutes | 99 | 4.3% |
| 60 to 89 Minutes | 145 | 6.3% |
| 90 or more Minutes | 78 | 3.4% |
Commute Time by Sex in Reynolds County
The most common commute times in Reynolds County are 30 to 34 minutes (210 commuters, 16.4%) for males and 5 to 9 minutes (181 commuters, 18.0%) for females.
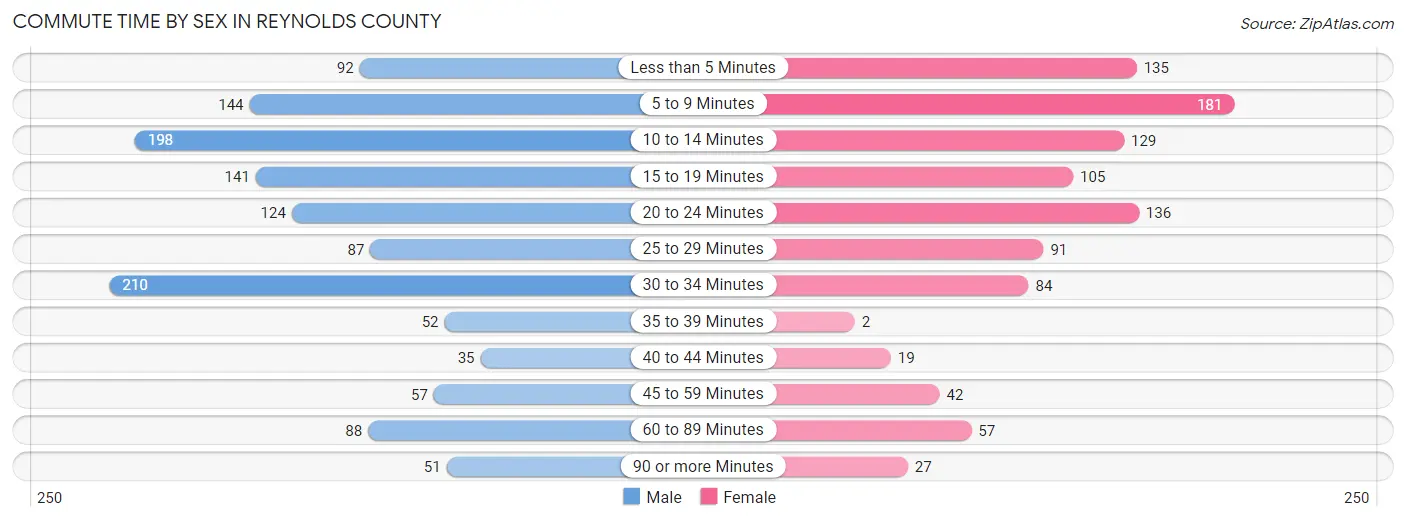
| Commute Time | Male | Female |
| Less than 5 Minutes | 92 (7.2%) | 135 (13.4%) |
| 5 to 9 Minutes | 144 (11.3%) | 181 (18.0%) |
| 10 to 14 Minutes | 198 (15.5%) | 129 (12.8%) |
| 15 to 19 Minutes | 141 (11.0%) | 105 (10.4%) |
| 20 to 24 Minutes | 124 (9.7%) | 136 (13.5%) |
| 25 to 29 Minutes | 87 (6.8%) | 91 (9.0%) |
| 30 to 34 Minutes | 210 (16.4%) | 84 (8.3%) |
| 35 to 39 Minutes | 52 (4.1%) | 2 (0.2%) |
| 40 to 44 Minutes | 35 (2.7%) | 19 (1.9%) |
| 45 to 59 Minutes | 57 (4.5%) | 42 (4.2%) |
| 60 to 89 Minutes | 88 (6.9%) | 57 (5.7%) |
| 90 or more Minutes | 51 (4.0%) | 27 (2.7%) |
Time of Departure to Work by Sex in Reynolds County
The most frequent times of departure to work in Reynolds County are 6:00 AM to 6:29 AM (254, 19.9%) for males and 7:00 AM to 7:29 AM (225, 22.3%) for females.
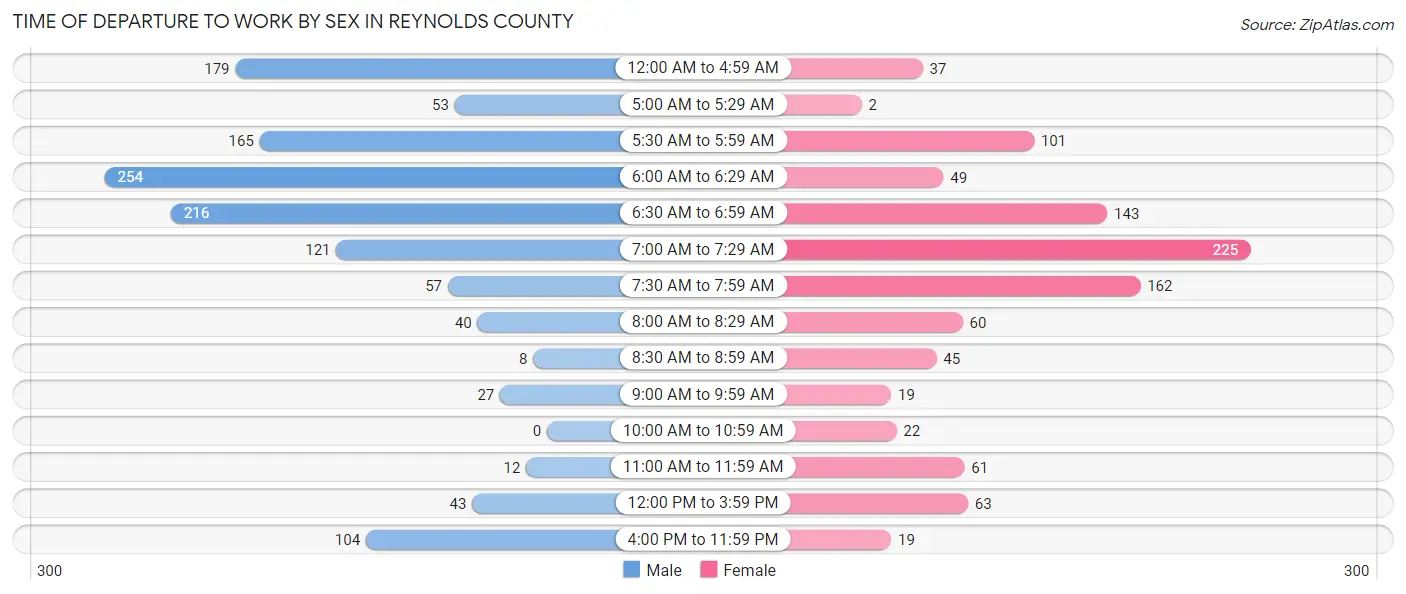
| Time of Departure | Male | Female |
| 12:00 AM to 4:59 AM | 179 (14.0%) | 37 (3.7%) |
| 5:00 AM to 5:29 AM | 53 (4.1%) | 2 (0.2%) |
| 5:30 AM to 5:59 AM | 165 (12.9%) | 101 (10.0%) |
| 6:00 AM to 6:29 AM | 254 (19.9%) | 49 (4.9%) |
| 6:30 AM to 6:59 AM | 216 (16.9%) | 143 (14.2%) |
| 7:00 AM to 7:29 AM | 121 (9.5%) | 225 (22.3%) |
| 7:30 AM to 7:59 AM | 57 (4.5%) | 162 (16.1%) |
| 8:00 AM to 8:29 AM | 40 (3.1%) | 60 (5.9%) |
| 8:30 AM to 8:59 AM | 8 (0.6%) | 45 (4.5%) |
| 9:00 AM to 9:59 AM | 27 (2.1%) | 19 (1.9%) |
| 10:00 AM to 10:59 AM | 0 (0.0%) | 22 (2.2%) |
| 11:00 AM to 11:59 AM | 12 (0.9%) | 61 (6.0%) |
| 12:00 PM to 3:59 PM | 43 (3.4%) | 63 (6.2%) |
| 4:00 PM to 11:59 PM | 104 (8.1%) | 19 (1.9%) |
| Total | 1,279 (100.0%) | 1,008 (100.0%) |
Housing Occupancy in Reynolds County
Occupancy by Ownership in Reynolds County
Of the total 2,309 dwellings in Reynolds County, owner-occupied units account for 1,856 (80.4%), while renter-occupied units make up 453 (19.6%).
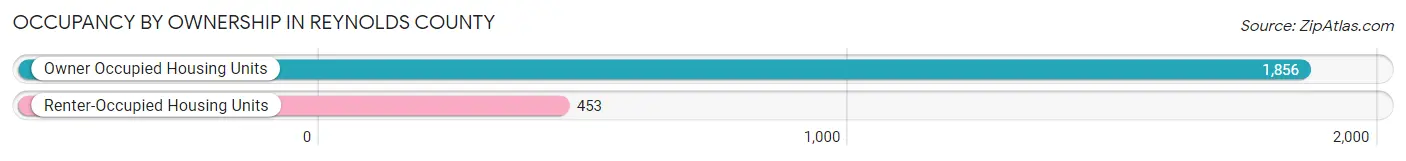
| Occupancy | # Housing Units | % Housing Units |
| Owner Occupied Housing Units | 1,856 | 80.4% |
| Renter-Occupied Housing Units | 453 | 19.6% |
| Total Occupied Housing Units | 2,309 | 100.0% |
Occupancy by Household Size in Reynolds County
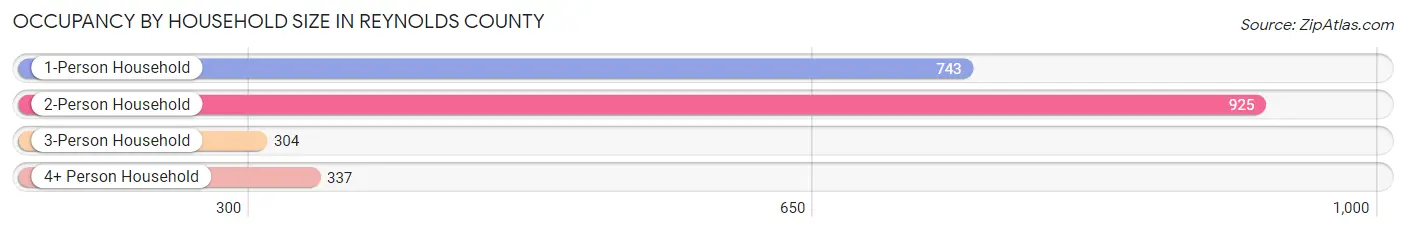
| Household Size | # Housing Units | % Housing Units |
| 1-Person Household | 743 | 32.2% |
| 2-Person Household | 925 | 40.1% |
| 3-Person Household | 304 | 13.2% |
| 4+ Person Household | 337 | 14.6% |
| Total Housing Units | 2,309 | 100.0% |
Occupancy by Ownership by Household Size in Reynolds County
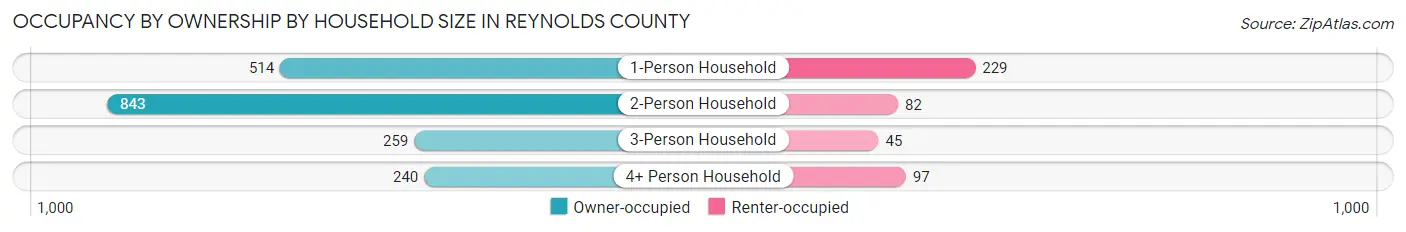
| Household Size | Owner-occupied | Renter-occupied |
| 1-Person Household | 514 (69.2%) | 229 (30.8%) |
| 2-Person Household | 843 (91.1%) | 82 (8.9%) |
| 3-Person Household | 259 (85.2%) | 45 (14.8%) |
| 4+ Person Household | 240 (71.2%) | 97 (28.8%) |
| Total Housing Units | 1,856 (80.4%) | 453 (19.6%) |
Occupancy by Educational Attainment in Reynolds County
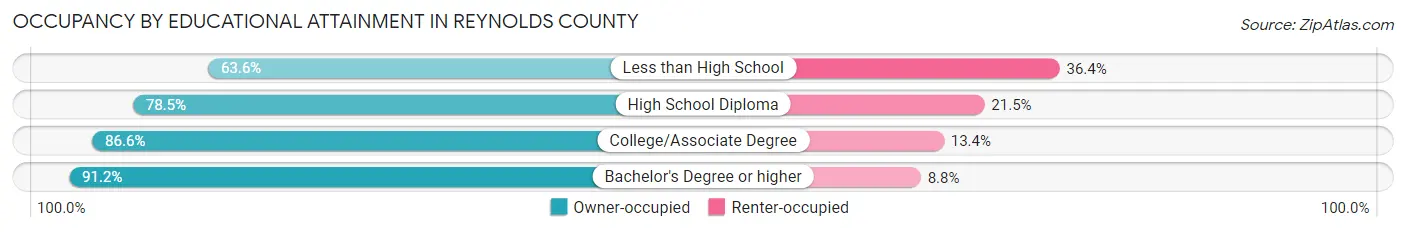
| Household Size | Owner-occupied | Renter-occupied |
| Less than High School | 210 (63.6%) | 120 (36.4%) |
| High School Diploma | 787 (78.5%) | 215 (21.5%) |
| College/Associate Degree | 601 (86.6%) | 93 (13.4%) |
| Bachelor's Degree or higher | 258 (91.2%) | 25 (8.8%) |
Occupancy by Age of Householder in Reynolds County
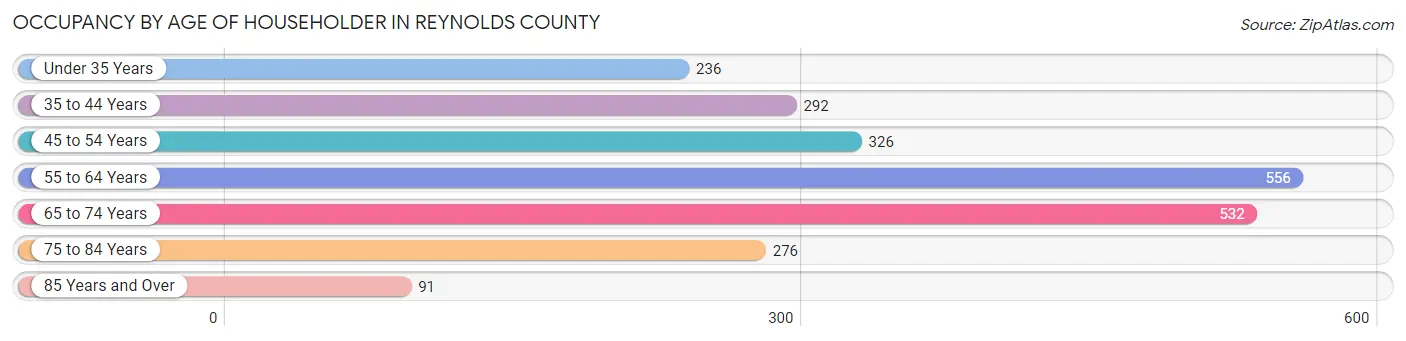
| Age Bracket | # Households | % Households |
| Under 35 Years | 236 | 10.2% |
| 35 to 44 Years | 292 | 12.7% |
| 45 to 54 Years | 326 | 14.1% |
| 55 to 64 Years | 556 | 24.1% |
| 65 to 74 Years | 532 | 23.0% |
| 75 to 84 Years | 276 | 11.9% |
| 85 Years and Over | 91 | 3.9% |
| Total | 2,309 | 100.0% |
Housing Finances in Reynolds County
Median Income by Occupancy in Reynolds County
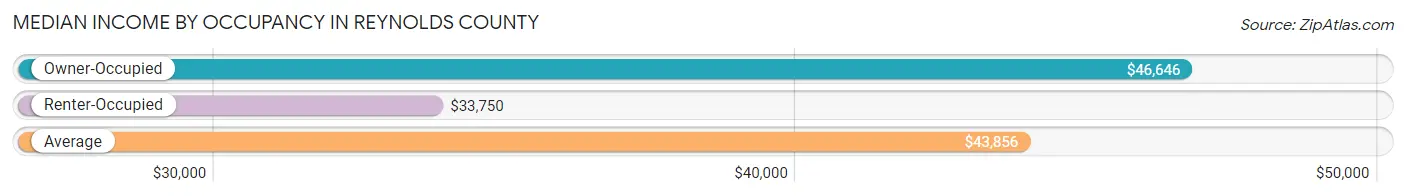
| Occupancy Type | # Households | Median Income |
| Owner-Occupied | 1,856 (80.4%) | $46,646 |
| Renter-Occupied | 453 (19.6%) | $33,750 |
| Average | 2,309 (100.0%) | $43,856 |
Occupancy by Householder Income Bracket in Reynolds County
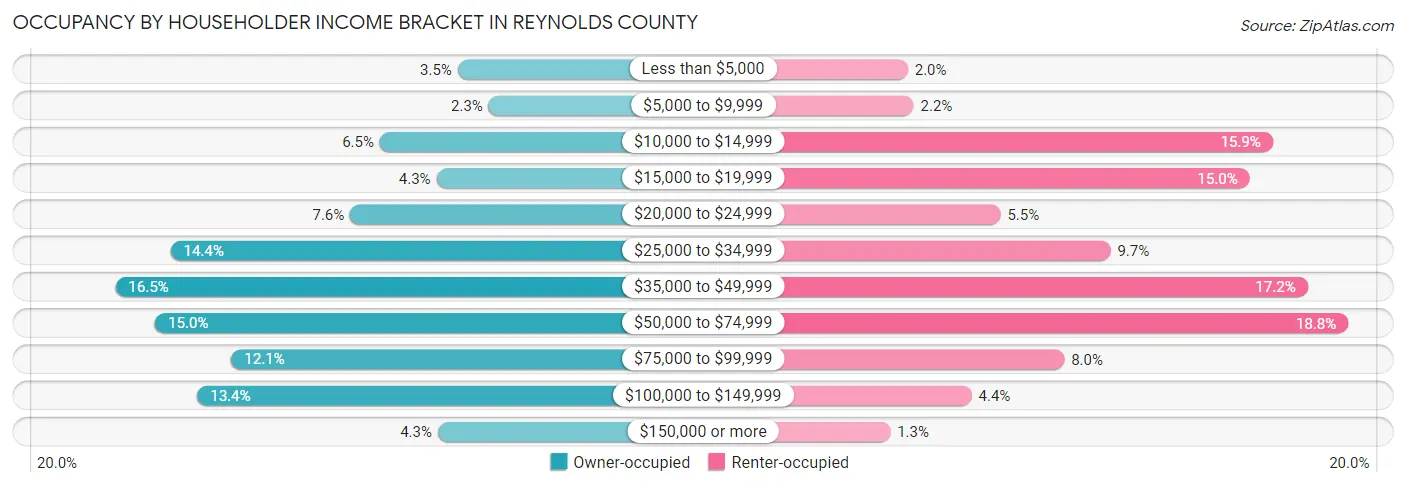
| Income Bracket | Owner-occupied | Renter-occupied |
| Less than $5,000 | 65 (3.5%) | 9 (2.0%) |
| $5,000 to $9,999 | 43 (2.3%) | 10 (2.2%) |
| $10,000 to $14,999 | 120 (6.5%) | 72 (15.9%) |
| $15,000 to $19,999 | 80 (4.3%) | 68 (15.0%) |
| $20,000 to $24,999 | 141 (7.6%) | 25 (5.5%) |
| $25,000 to $34,999 | 268 (14.4%) | 44 (9.7%) |
| $35,000 to $49,999 | 307 (16.5%) | 78 (17.2%) |
| $50,000 to $74,999 | 279 (15.0%) | 85 (18.8%) |
| $75,000 to $99,999 | 225 (12.1%) | 36 (8.0%) |
| $100,000 to $149,999 | 249 (13.4%) | 20 (4.4%) |
| $150,000 or more | 79 (4.3%) | 6 (1.3%) |
| Total | 1,856 (100.0%) | 453 (100.0%) |
Monthly Housing Cost Tiers in Reynolds County
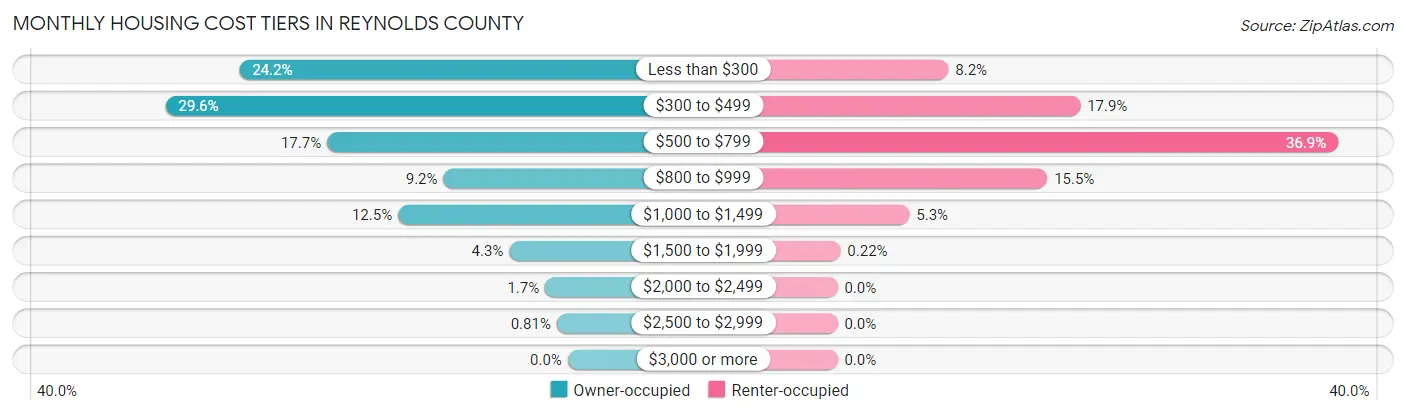
| Monthly Cost | Owner-occupied | Renter-occupied |
| Less than $300 | 449 (24.2%) | 37 (8.2%) |
| $300 to $499 | 550 (29.6%) | 81 (17.9%) |
| $500 to $799 | 329 (17.7%) | 167 (36.9%) |
| $800 to $999 | 170 (9.2%) | 70 (15.4%) |
| $1,000 to $1,499 | 232 (12.5%) | 24 (5.3%) |
| $1,500 to $1,999 | 80 (4.3%) | 1 (0.2%) |
| $2,000 to $2,499 | 31 (1.7%) | 0 (0.0%) |
| $2,500 to $2,999 | 15 (0.8%) | 0 (0.0%) |
| $3,000 or more | 0 (0.0%) | 0 (0.0%) |
| Total | 1,856 (100.0%) | 453 (100.0%) |
Physical Housing Characteristics in Reynolds County
Housing Structures in Reynolds County
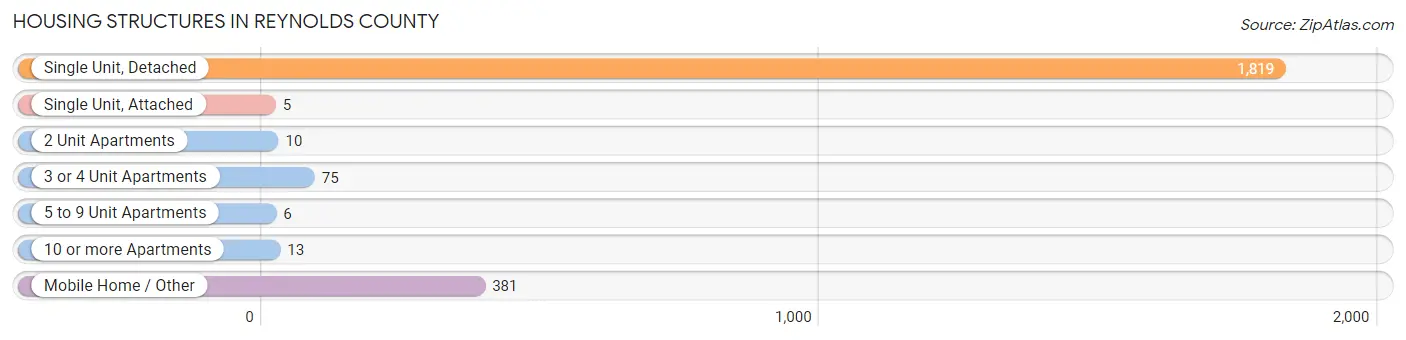
| Structure Type | # Housing Units | % Housing Units |
| Single Unit, Detached | 1,819 | 78.8% |
| Single Unit, Attached | 5 | 0.2% |
| 2 Unit Apartments | 10 | 0.4% |
| 3 or 4 Unit Apartments | 75 | 3.3% |
| 5 to 9 Unit Apartments | 6 | 0.3% |
| 10 or more Apartments | 13 | 0.6% |
| Mobile Home / Other | 381 | 16.5% |
| Total | 2,309 | 100.0% |
Housing Structures by Occupancy in Reynolds County
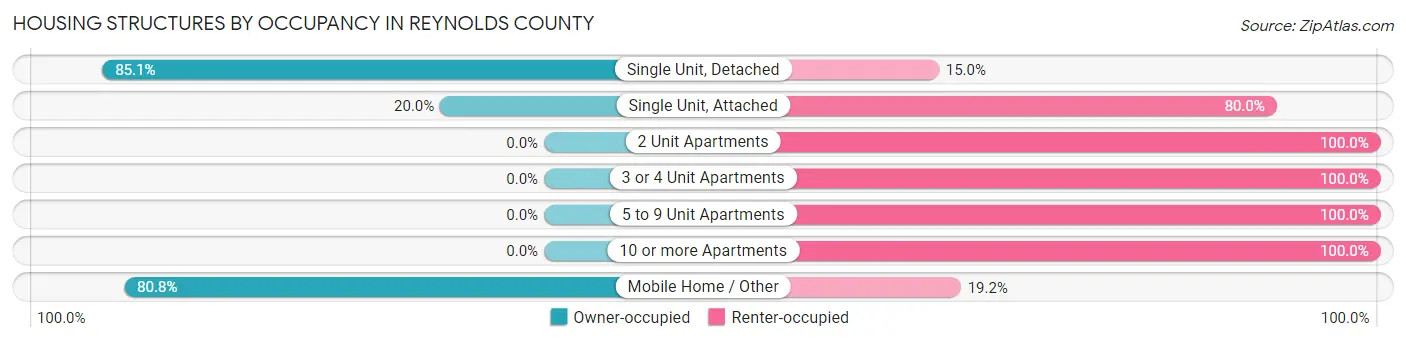
| Structure Type | Owner-occupied | Renter-occupied |
| Single Unit, Detached | 1,547 (85.1%) | 272 (14.9%) |
| Single Unit, Attached | 1 (20.0%) | 4 (80.0%) |
| 2 Unit Apartments | 0 (0.0%) | 10 (100.0%) |
| 3 or 4 Unit Apartments | 0 (0.0%) | 75 (100.0%) |
| 5 to 9 Unit Apartments | 0 (0.0%) | 6 (100.0%) |
| 10 or more Apartments | 0 (0.0%) | 13 (100.0%) |
| Mobile Home / Other | 308 (80.8%) | 73 (19.2%) |
| Total | 1,856 (80.4%) | 453 (19.6%) |
Housing Structures by Number of Rooms in Reynolds County
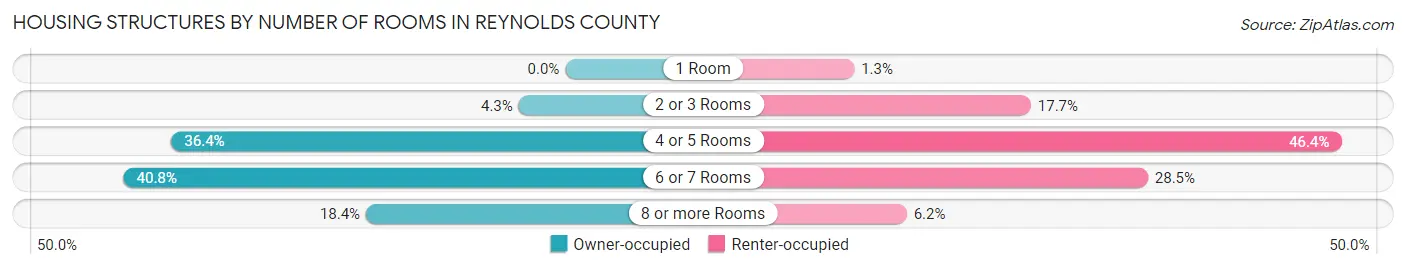
| Number of Rooms | Owner-occupied | Renter-occupied |
| 1 Room | 0 (0.0%) | 6 (1.3%) |
| 2 or 3 Rooms | 80 (4.3%) | 80 (17.7%) |
| 4 or 5 Rooms | 676 (36.4%) | 210 (46.4%) |
| 6 or 7 Rooms | 758 (40.8%) | 129 (28.5%) |
| 8 or more Rooms | 342 (18.4%) | 28 (6.2%) |
| Total | 1,856 (100.0%) | 453 (100.0%) |
Housing Structure by Heating Type in Reynolds County
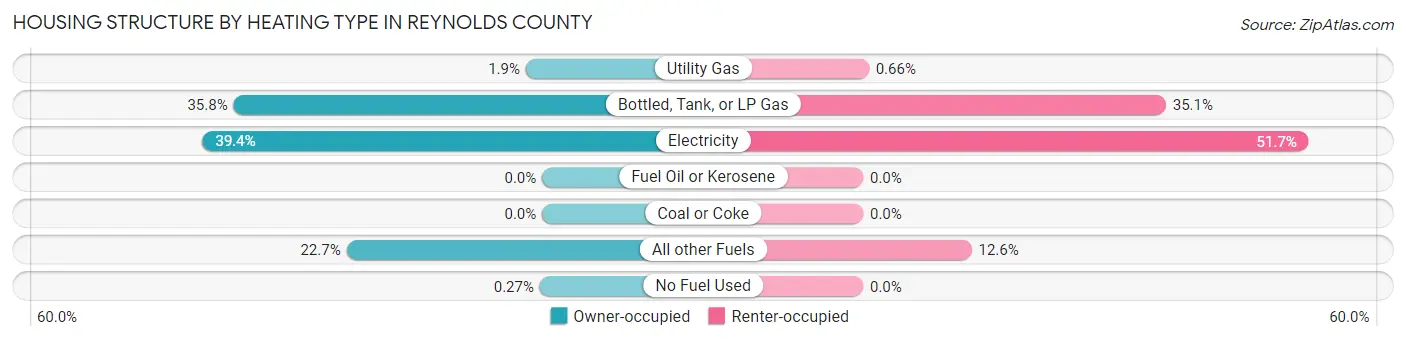
| Heating Type | Owner-occupied | Renter-occupied |
| Utility Gas | 35 (1.9%) | 3 (0.7%) |
| Bottled, Tank, or LP Gas | 664 (35.8%) | 159 (35.1%) |
| Electricity | 731 (39.4%) | 234 (51.7%) |
| Fuel Oil or Kerosene | 0 (0.0%) | 0 (0.0%) |
| Coal or Coke | 0 (0.0%) | 0 (0.0%) |
| All other Fuels | 421 (22.7%) | 57 (12.6%) |
| No Fuel Used | 5 (0.3%) | 0 (0.0%) |
| Total | 1,856 (100.0%) | 453 (100.0%) |
Household Vehicle Usage in Reynolds County
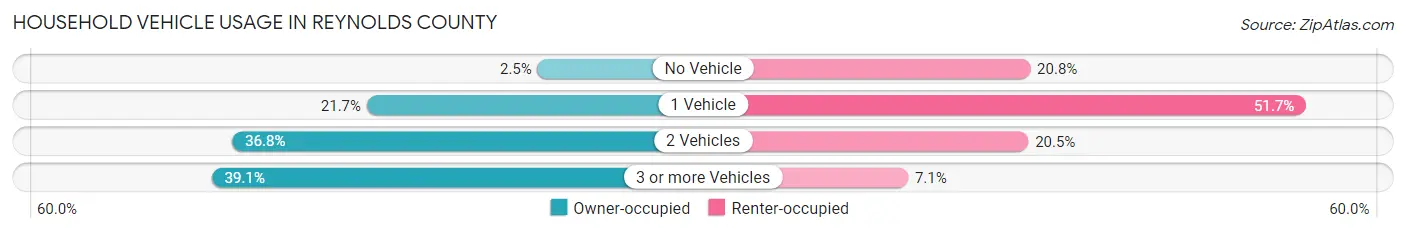
| Vehicles per Household | Owner-occupied | Renter-occupied |
| No Vehicle | 47 (2.5%) | 94 (20.7%) |
| 1 Vehicle | 402 (21.7%) | 234 (51.7%) |
| 2 Vehicles | 682 (36.7%) | 93 (20.5%) |
| 3 or more Vehicles | 725 (39.1%) | 32 (7.1%) |
| Total | 1,856 (100.0%) | 453 (100.0%) |
Real Estate & Mortgages in Reynolds County
Real Estate and Mortgage Overview in Reynolds County
| Characteristic | Without Mortgage | With Mortgage |
| Housing Units | 1,111 | 745 |
| Median Property Value | $102,900 | $113,100 |
| Median Household Income | $33,367 | $58 |
| Monthly Housing Costs | $341 | $0 |
| Real Estate Taxes | $516 | $19 |
Property Value by Mortgage Status in Reynolds County
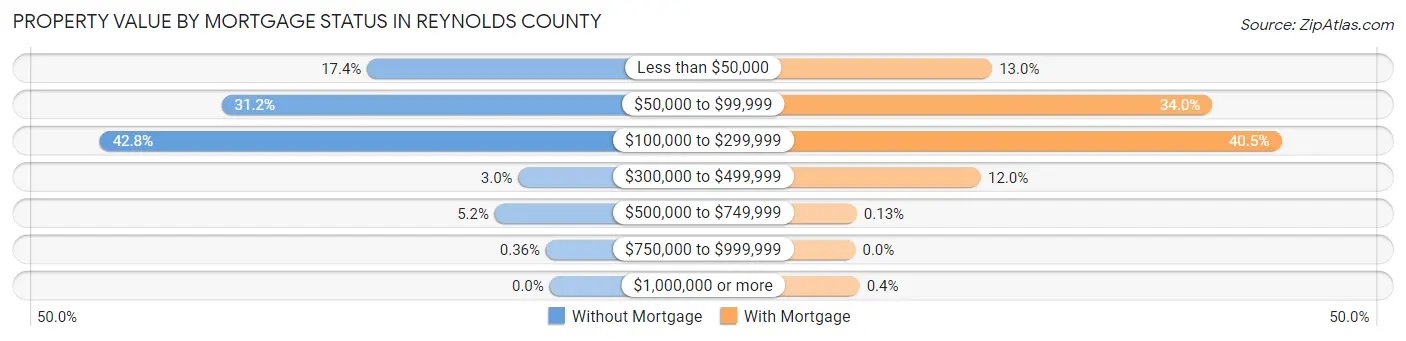
| Property Value | Without Mortgage | With Mortgage |
| Less than $50,000 | 193 (17.4%) | 97 (13.0%) |
| $50,000 to $99,999 | 347 (31.2%) | 253 (34.0%) |
| $100,000 to $299,999 | 476 (42.8%) | 302 (40.5%) |
| $300,000 to $499,999 | 33 (3.0%) | 89 (11.9%) |
| $500,000 to $749,999 | 58 (5.2%) | 1 (0.1%) |
| $750,000 to $999,999 | 4 (0.4%) | 0 (0.0%) |
| $1,000,000 or more | 0 (0.0%) | 3 (0.4%) |
| Total | 1,111 (100.0%) | 745 (100.0%) |
Household Income by Mortgage Status in Reynolds County
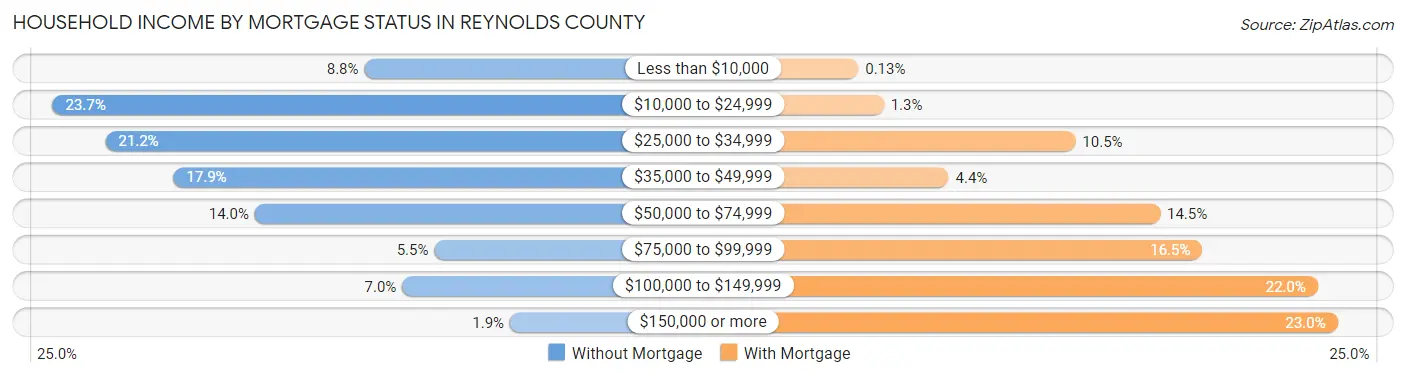
| Household Income | Without Mortgage | With Mortgage |
| Less than $10,000 | 98 (8.8%) | 1 (0.1%) |
| $10,000 to $24,999 | 263 (23.7%) | 10 (1.3%) |
| $25,000 to $34,999 | 235 (21.1%) | 78 (10.5%) |
| $35,000 to $49,999 | 199 (17.9%) | 33 (4.4%) |
| $50,000 to $74,999 | 156 (14.0%) | 108 (14.5%) |
| $75,000 to $99,999 | 61 (5.5%) | 123 (16.5%) |
| $100,000 to $149,999 | 78 (7.0%) | 164 (22.0%) |
| $150,000 or more | 21 (1.9%) | 171 (23.0%) |
| Total | 1,111 (100.0%) | 745 (100.0%) |
Property Value to Household Income Ratio in Reynolds County
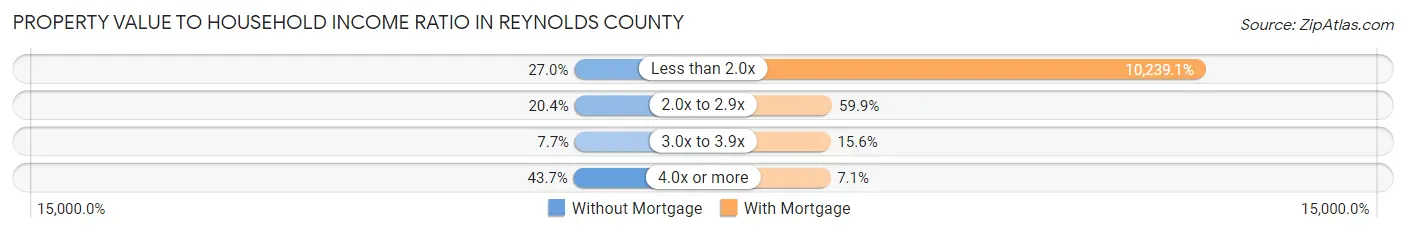
| Value-to-Income Ratio | Without Mortgage | With Mortgage |
| Less than 2.0x | 300 (27.0%) | 76,281 (10,239.1%) |
| 2.0x to 2.9x | 227 (20.4%) | 446 (59.9%) |
| 3.0x to 3.9x | 85 (7.6%) | 116 (15.6%) |
| 4.0x or more | 485 (43.6%) | 53 (7.1%) |
| Total | 1,111 (100.0%) | 745 (100.0%) |
Real Estate Taxes by Mortgage Status in Reynolds County
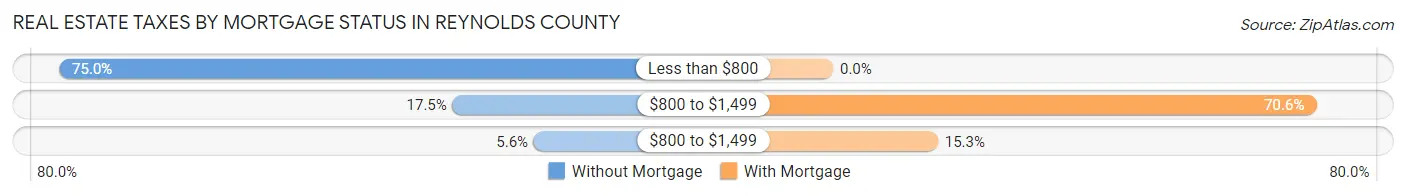
| Property Taxes | Without Mortgage | With Mortgage |
| Less than $800 | 833 (75.0%) | 0 (0.0%) |
| $800 to $1,499 | 194 (17.5%) | 526 (70.6%) |
| $800 to $1,499 | 62 (5.6%) | 114 (15.3%) |
| Total | 1,111 (100.0%) | 745 (100.0%) |
Health & Disability in Reynolds County
Health Insurance Coverage by Age in Reynolds County
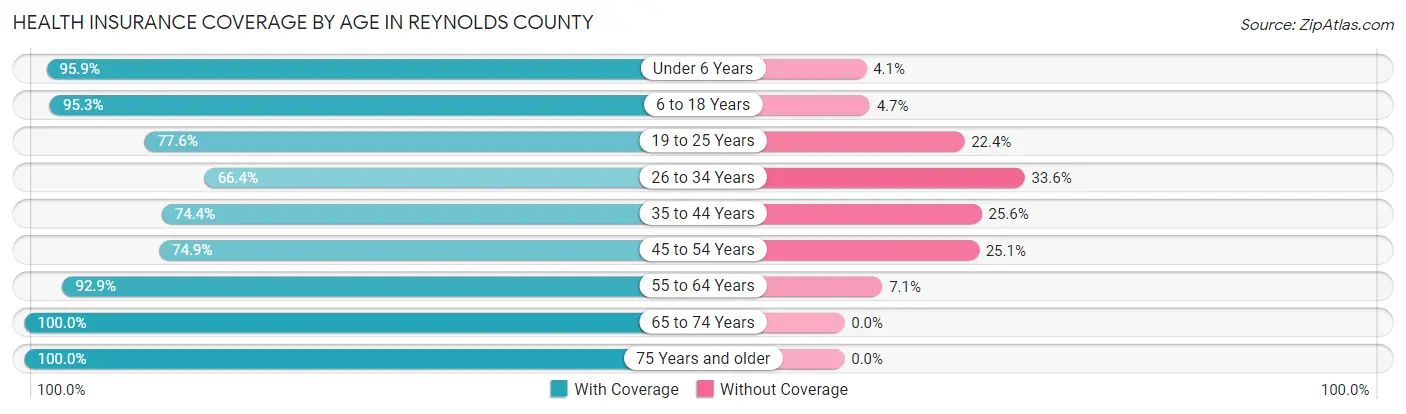
| Age Bracket | With Coverage | Without Coverage |
| Under 6 Years | 305 (95.9%) | 13 (4.1%) |
| 6 to 18 Years | 803 (95.3%) | 40 (4.7%) |
| 19 to 25 Years | 309 (77.6%) | 89 (22.4%) |
| 26 to 34 Years | 336 (66.4%) | 170 (33.6%) |
| 35 to 44 Years | 570 (74.4%) | 196 (25.6%) |
| 45 to 54 Years | 571 (74.9%) | 191 (25.1%) |
| 55 to 64 Years | 905 (92.9%) | 69 (7.1%) |
| 65 to 74 Years | 778 (100.0%) | 0 (0.0%) |
| 75 Years and older | 609 (100.0%) | 0 (0.0%) |
| Total | 5,186 (87.1%) | 768 (12.9%) |
Health Insurance Coverage by Citizenship Status in Reynolds County
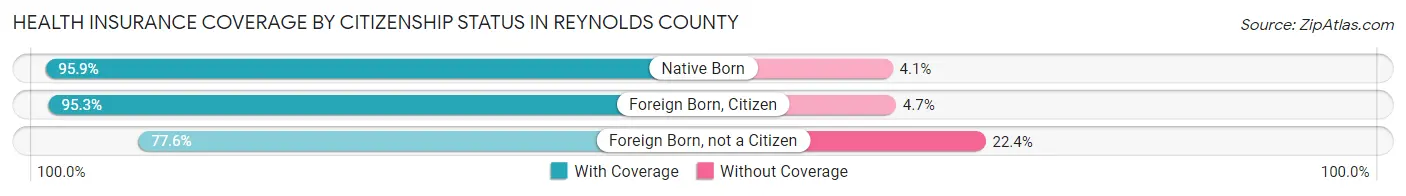
| Citizenship Status | With Coverage | Without Coverage |
| Native Born | 305 (95.9%) | 13 (4.1%) |
| Foreign Born, Citizen | 803 (95.3%) | 40 (4.7%) |
| Foreign Born, not a Citizen | 309 (77.6%) | 89 (22.4%) |
Health Insurance Coverage by Household Income in Reynolds County
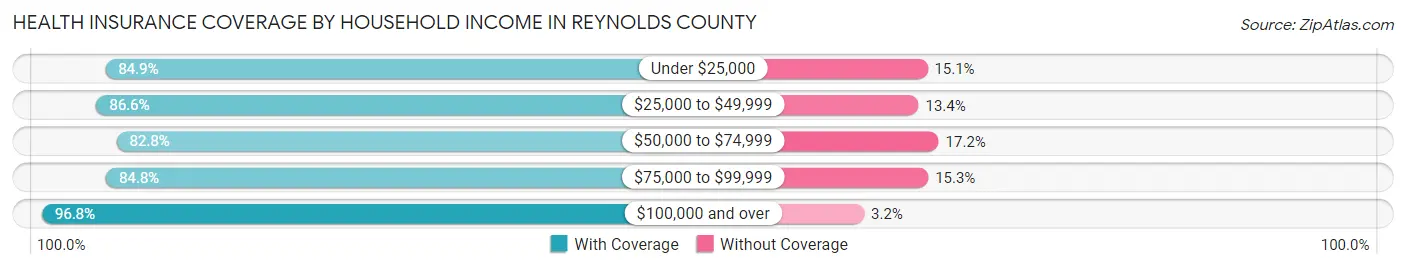
| Household Income | With Coverage | Without Coverage |
| Under $25,000 | 843 (84.9%) | 150 (15.1%) |
| $25,000 to $49,999 | 1,295 (86.6%) | 201 (13.4%) |
| $50,000 to $74,999 | 986 (82.8%) | 205 (17.2%) |
| $75,000 to $99,999 | 895 (84.8%) | 161 (15.2%) |
| $100,000 and over | 1,135 (96.8%) | 38 (3.2%) |
Public vs Private Health Insurance Coverage by Age in Reynolds County
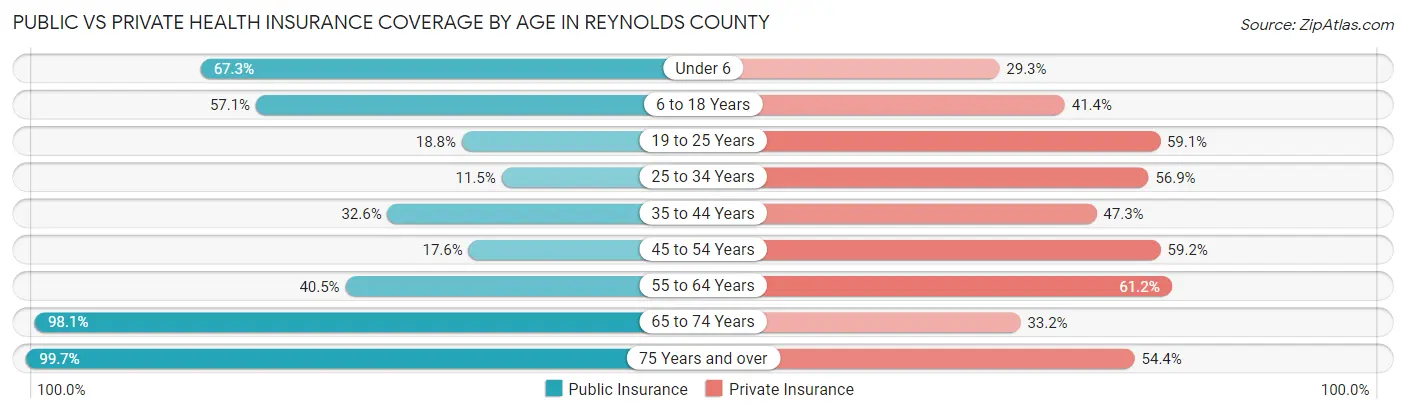
| Age Bracket | Public Insurance | Private Insurance |
| Under 6 | 214 (67.3%) | 93 (29.2%) |
| 6 to 18 Years | 481 (57.1%) | 349 (41.4%) |
| 19 to 25 Years | 75 (18.8%) | 235 (59.1%) |
| 25 to 34 Years | 58 (11.5%) | 288 (56.9%) |
| 35 to 44 Years | 250 (32.6%) | 362 (47.3%) |
| 45 to 54 Years | 134 (17.6%) | 451 (59.2%) |
| 55 to 64 Years | 394 (40.5%) | 596 (61.2%) |
| 65 to 74 Years | 763 (98.1%) | 258 (33.2%) |
| 75 Years and over | 607 (99.7%) | 331 (54.3%) |
| Total | 2,976 (50.0%) | 2,963 (49.8%) |
Disability Status by Sex by Age in Reynolds County
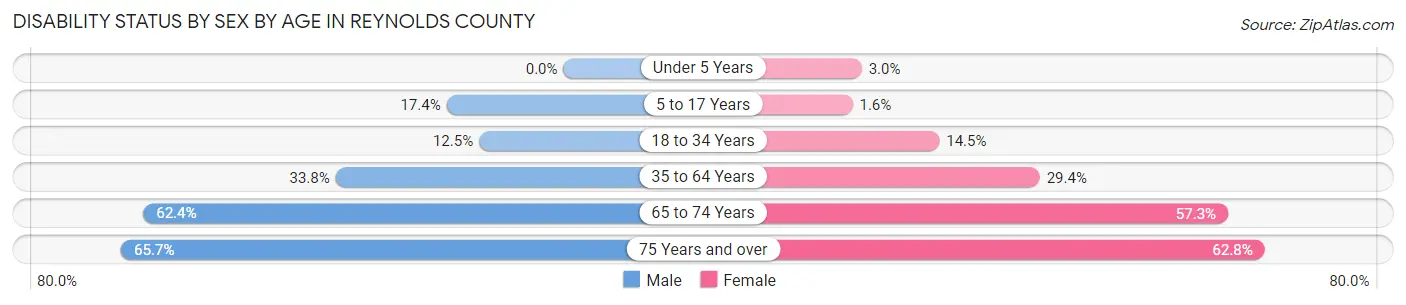
| Age Bracket | Male | Female |
| Under 5 Years | 0 (0.0%) | 4 (3.0%) |
| 5 to 17 Years | 72 (17.3%) | 6 (1.6%) |
| 18 to 34 Years | 58 (12.5%) | 76 (14.5%) |
| 35 to 64 Years | 455 (33.8%) | 340 (29.4%) |
| 65 to 74 Years | 247 (62.4%) | 219 (57.3%) |
| 75 Years and over | 197 (65.7%) | 194 (62.8%) |
Disability Class by Sex by Age in Reynolds County
Disability Class: Hearing Difficulty
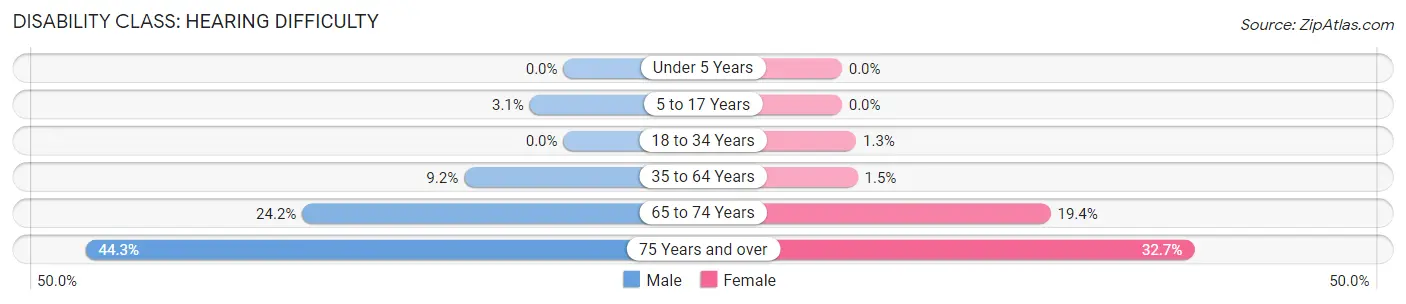
| Age Bracket | Male | Female |
| Under 5 Years | 0 (0.0%) | 0 (0.0%) |
| 5 to 17 Years | 13 (3.1%) | 0 (0.0%) |
| 18 to 34 Years | 0 (0.0%) | 7 (1.3%) |
| 35 to 64 Years | 124 (9.2%) | 17 (1.5%) |
| 65 to 74 Years | 96 (24.2%) | 74 (19.4%) |
| 75 Years and over | 133 (44.3%) | 101 (32.7%) |
Disability Class: Vision Difficulty
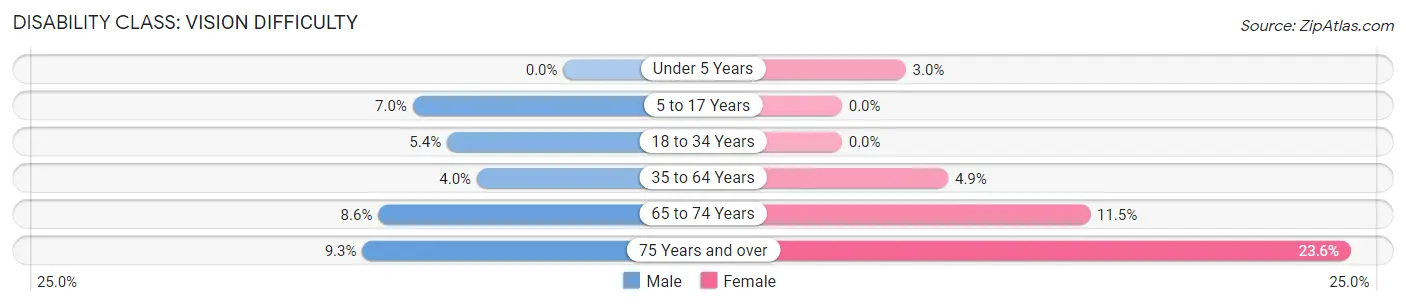
| Age Bracket | Male | Female |
| Under 5 Years | 0 (0.0%) | 4 (3.0%) |
| 5 to 17 Years | 29 (7.0%) | 0 (0.0%) |
| 18 to 34 Years | 25 (5.4%) | 0 (0.0%) |
| 35 to 64 Years | 54 (4.0%) | 57 (4.9%) |
| 65 to 74 Years | 34 (8.6%) | 44 (11.5%) |
| 75 Years and over | 28 (9.3%) | 73 (23.6%) |
Disability Class: Cognitive Difficulty
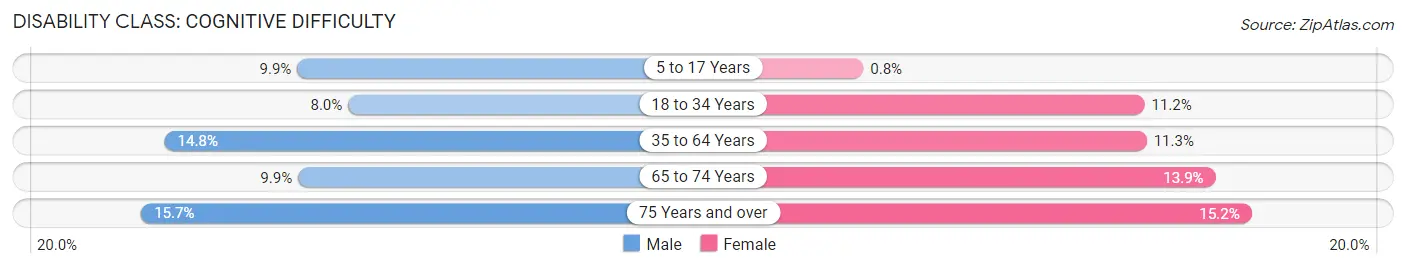
| Age Bracket | Male | Female |
| 5 to 17 Years | 41 (9.9%) | 3 (0.8%) |
| 18 to 34 Years | 37 (8.0%) | 59 (11.2%) |
| 35 to 64 Years | 199 (14.8%) | 131 (11.3%) |
| 65 to 74 Years | 39 (9.9%) | 53 (13.9%) |
| 75 Years and over | 47 (15.7%) | 47 (15.2%) |
Disability Class: Ambulatory Difficulty
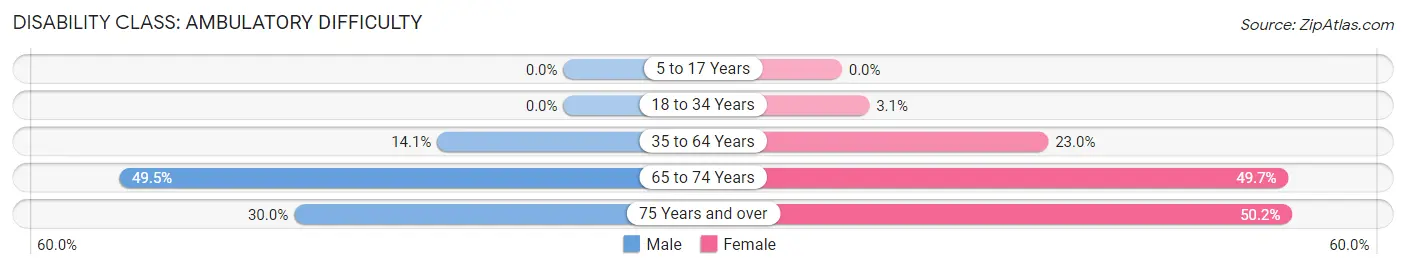
| Age Bracket | Male | Female |
| 5 to 17 Years | 0 (0.0%) | 0 (0.0%) |
| 18 to 34 Years | 0 (0.0%) | 16 (3.0%) |
| 35 to 64 Years | 189 (14.1%) | 266 (23.0%) |
| 65 to 74 Years | 196 (49.5%) | 190 (49.7%) |
| 75 Years and over | 90 (30.0%) | 155 (50.2%) |
Disability Class: Self-Care Difficulty
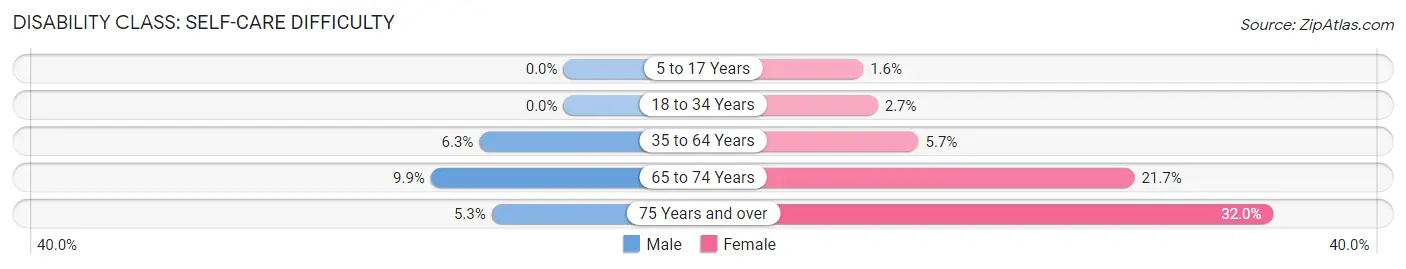
| Age Bracket | Male | Female |
| 5 to 17 Years | 0 (0.0%) | 6 (1.6%) |
| 18 to 34 Years | 0 (0.0%) | 14 (2.7%) |
| 35 to 64 Years | 84 (6.2%) | 66 (5.7%) |
| 65 to 74 Years | 39 (9.9%) | 83 (21.7%) |
| 75 Years and over | 16 (5.3%) | 99 (32.0%) |
Technology Access in Reynolds County
Computing Device Access in Reynolds County
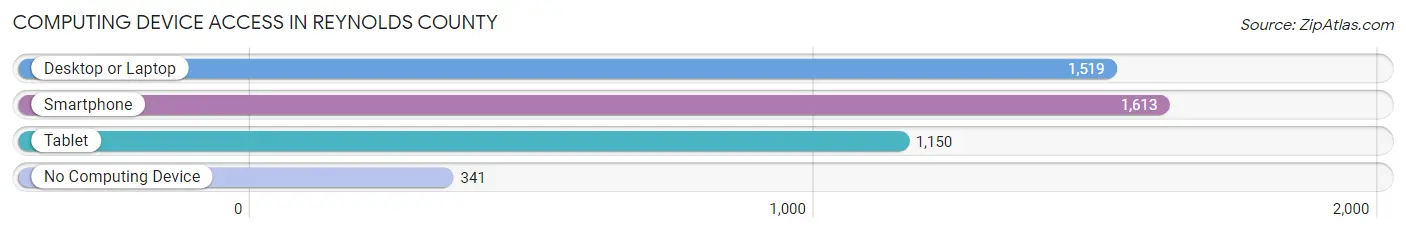
| Device Type | # Households | % Households |
| Desktop or Laptop | 1,519 | 65.8% |
| Smartphone | 1,613 | 69.9% |
| Tablet | 1,150 | 49.8% |
| No Computing Device | 341 | 14.8% |
| Total | 2,309 | 100.0% |
Internet Access in Reynolds County
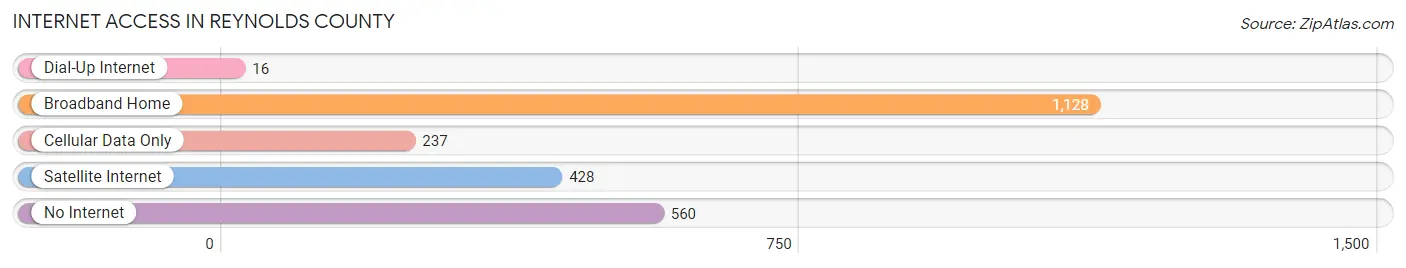
| Internet Type | # Households | % Households |
| Dial-Up Internet | 16 | 0.7% |
| Broadband Home | 1,128 | 48.8% |
| Cellular Data Only | 237 | 10.3% |
| Satellite Internet | 428 | 18.5% |
| No Internet | 560 | 24.2% |
| Total | 2,309 | 100.0% |
Reynolds County Summary
Reynolds County is a county located in the southeastern corner of the U.S. state of Missouri. As of the 2010 census, the population was 6,696. The county seat is Centerville. The county was organized in 1845 and named for former Governor of Missouri, Thomas Reynolds.
Geography
Reynolds County is located in the Ozark Plateau region of Missouri. The county is bordered by Iron County to the north, Madison County to the east, Carter County to the south, and Shannon County to the west. The county has a total area of 590 square miles, of which 589 square miles is land and 1.2 square miles (0.2%) is water.
The highest point in Reynolds County is located at the intersection of the county's northern border with Iron County, at an elevation of 1,400 feet. The lowest point in the county is located at the intersection of the county's southern border with Carter County, at an elevation of 590 feet.
The Current River, a tributary of the Mississippi River, flows through the county from east to west. The Eleven Point River, another tributary of the Mississippi, flows through the county from north to south.
Demographics
As of the 2010 census, there were 6,696 people, 2,717 households, and 1,845 families residing in the county. The population density was 11.4 people per square mile. There were 3,093 housing units at an average density of 5.2 per square mile. The racial makeup of the county was 97.2% White, 0.3% Black or African American, 0.5% Native American, 0.2% Asian, 0.1% Pacific Islander, 0.3% from other races, and 1.4% from two or more races. Approximately 1.3% of the population were Hispanic or Latino of any race.
There were 2,717 households, out of which 28.2% had children under the age of 18 living with them, 54.2% were married couples living together, 9.7% had a female householder with no husband present, and 31.3% were non-families. 27.2% of all households were made up of individuals, and 13.2% had someone living alone who was 65 years of age or older. The average household size was 2.41 and the average family size was 2.91.
In the county, the population was spread out, with 23.2% under the age of 18, 7.2% from 18 to 24, 24.2% from 25 to 44, 27.2% from 45 to 64, and 18.2% who were 65 years of age or older. The median age was 41.4 years. For every 100 females there were 97.2 males. For every 100 females age 18 and over, there were 94.2 males.
The median income for a household in the county was $30,945, and the median income for a family was $37,813. Males had a median income of $30,945 versus $20,917 for females. The per capita income for the county was $16,845. About 14.2% of families and 17.7% of the population were below the poverty line, including 24.2% of those under age 18 and 11.7% of those age 65 or over.
Economy
The economy of Reynolds County is largely based on agriculture and forestry. The county is home to several large farms, as well as several small family farms. The county is also home to several timber companies, which harvest timber from the county's forests.
The county also has a small manufacturing sector, which includes several small factories and plants. The county is also home to several small businesses, including restaurants, retail stores, and service providers.
The county is served by two school districts, the Reynolds County R-II School District and the Ellington R-VI School District. The county also has several private schools.
Reynolds County is served by two hospitals, the Reynolds County Memorial Hospital in Centerville and the Ellington Community Hospital in Ellington. The county is also served by several nursing homes and assisted living facilities.
Reynolds County is served by several state highways, including Missouri Route 21, Missouri Route 34, Missouri Route 49, and Missouri Route 142. The county is also served by several county roads. The county is served by the Reynolds County Airport, located in Centerville. The county is also served by several public transportation services, including the Reynolds County Transit System.
Common Questions
What is Per Capita Income in Reynolds County?
Per Capita income in Reynolds County is $25,204.
What is the Median Family Income in Reynolds County?
Median Family Income in Reynolds County is $54,623.
What is the Median Household income in Reynolds County?
Median Household Income in Reynolds County is $43,856.
What is Income or Wage Gap in Reynolds County?
Income or Wage Gap in Reynolds County is 35.8%.
Women in Reynolds County earn 64.2 cents for every dollar earned by a man.
What is Family Income Deficit in Reynolds County?
Family Income Deficit in Reynolds County is $10,243.
Families that are below poverty line in Reynolds County earn $10,243 less on average than the poverty threshold level.
What is Inequality or Gini Index in Reynolds County?
Inequality or Gini Index in Reynolds County is 0.43.
What is the Total Population of Reynolds County?
Total Population of Reynolds County is 6,102.
What is the Total Male Population of Reynolds County?
Total Male Population of Reynolds County is 3,177.
What is the Total Female Population of Reynolds County?
Total Female Population of Reynolds County is 2,925.
What is the Ratio of Males per 100 Females in Reynolds County?
There are 108.62 Males per 100 Females in Reynolds County.
What is the Ratio of Females per 100 Males in Reynolds County?
There are 92.07 Females per 100 Males in Reynolds County.
What is the Median Population Age in Reynolds County?
Median Population Age in Reynolds County is 46.2 Years.
What is the Average Family Size in Reynolds County
Average Family Size in Reynolds County is 3.2 People.
What is the Average Household Size in Reynolds County
Average Household Size in Reynolds County is 2.6 People.
How Large is the Labor Force in Reynolds County?
There are 2,725 People in the Labor Forcein in Reynolds County.
What is the Percentage of People in the Labor Force in Reynolds County?
52.9% of People are in the Labor Force in Reynolds County.
What is the Unemployment Rate in Reynolds County?
Unemployment Rate in Reynolds County is 10.0%.