Ralls County, MO Map & Demographics
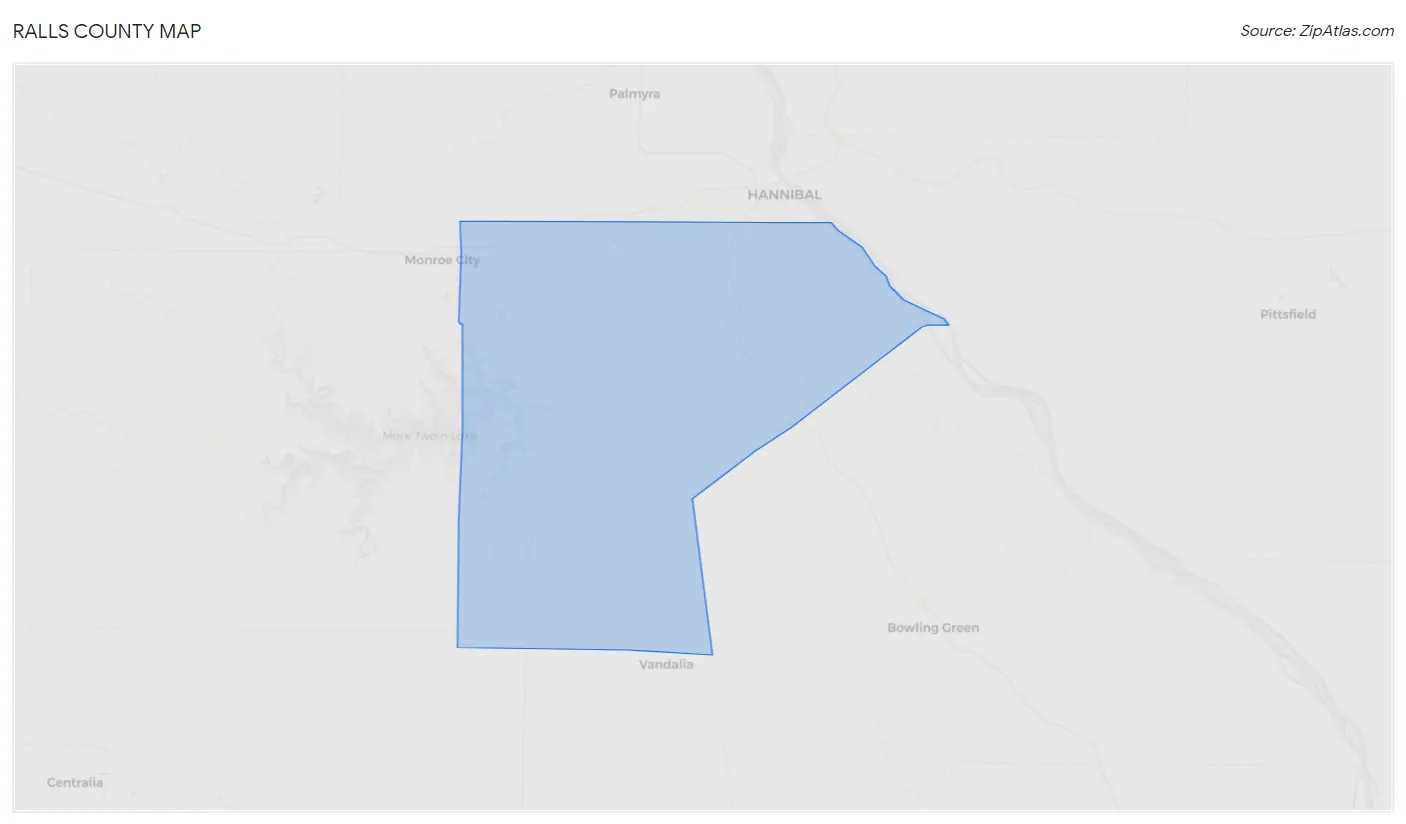
Ralls County Map
Ralls County Overview
$29,625
PER CAPITA INCOME
$78,871
AVG FAMILY INCOME
$62,615
AVG HOUSEHOLD INCOME
31.6%
WAGE / INCOME GAP [ % ]
68.4¢/ $1
WAGE / INCOME GAP [ $ ]
$9,403
FAMILY INCOME DEFICIT
0.43
INEQUALITY / GINI INDEX
10,356
TOTAL POPULATION
5,301
MALE POPULATION
5,055
FEMALE POPULATION
104.87
MALES / 100 FEMALES
95.36
FEMALES / 100 MALES
45.5
MEDIAN AGE
3.0
AVG FAMILY SIZE
2.6
AVG HOUSEHOLD SIZE
4,890
LABOR FORCE [ PEOPLE ]
57.8%
PERCENT IN LABOR FORCE
5.3%
UNEMPLOYMENT RATE
Ralls County Area Codes
Income in Ralls County
Income Overview in Ralls County
Per Capita Income in Ralls County is $29,625, while median incomes of families and households are $78,871 and $62,615 respectively.
| Characteristic | Number | Measure |
| Per Capita Income | 10,356 | $29,625 |
| Median Family Income | 2,874 | $78,871 |
| Mean Family Income | 2,874 | $84,519 |
| Median Household Income | 4,014 | $62,615 |
| Mean Household Income | 4,014 | $75,409 |
| Income Deficit | 2,874 | $9,403 |
| Wage / Income Gap (%) | 10,356 | 31.64% |
| Wage / Income Gap ($) | 10,356 | 68.36¢ per $1 |
| Gini / Inequality Index | 10,356 | 0.43 |
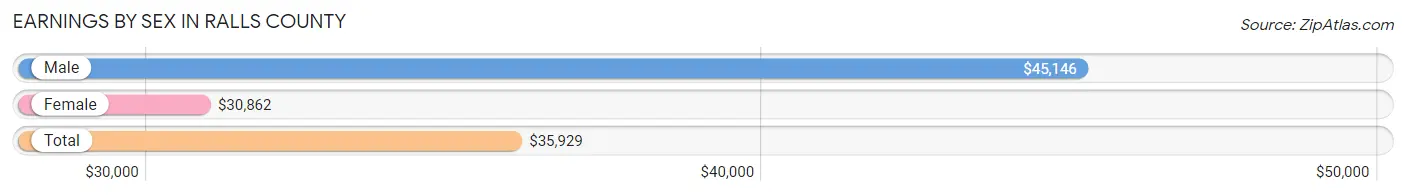
Earnings by Sex in Ralls County
Average Earnings in Ralls County are $35,929, $45,146 for men and $30,862 for women, a difference of 31.6%.
| Sex | Number | Average Earnings |
| Male | 2,585 (51.2%) | $45,146 |
| Female | 2,460 (48.8%) | $30,862 |
| Total | 5,045 (100.0%) | $35,929 |
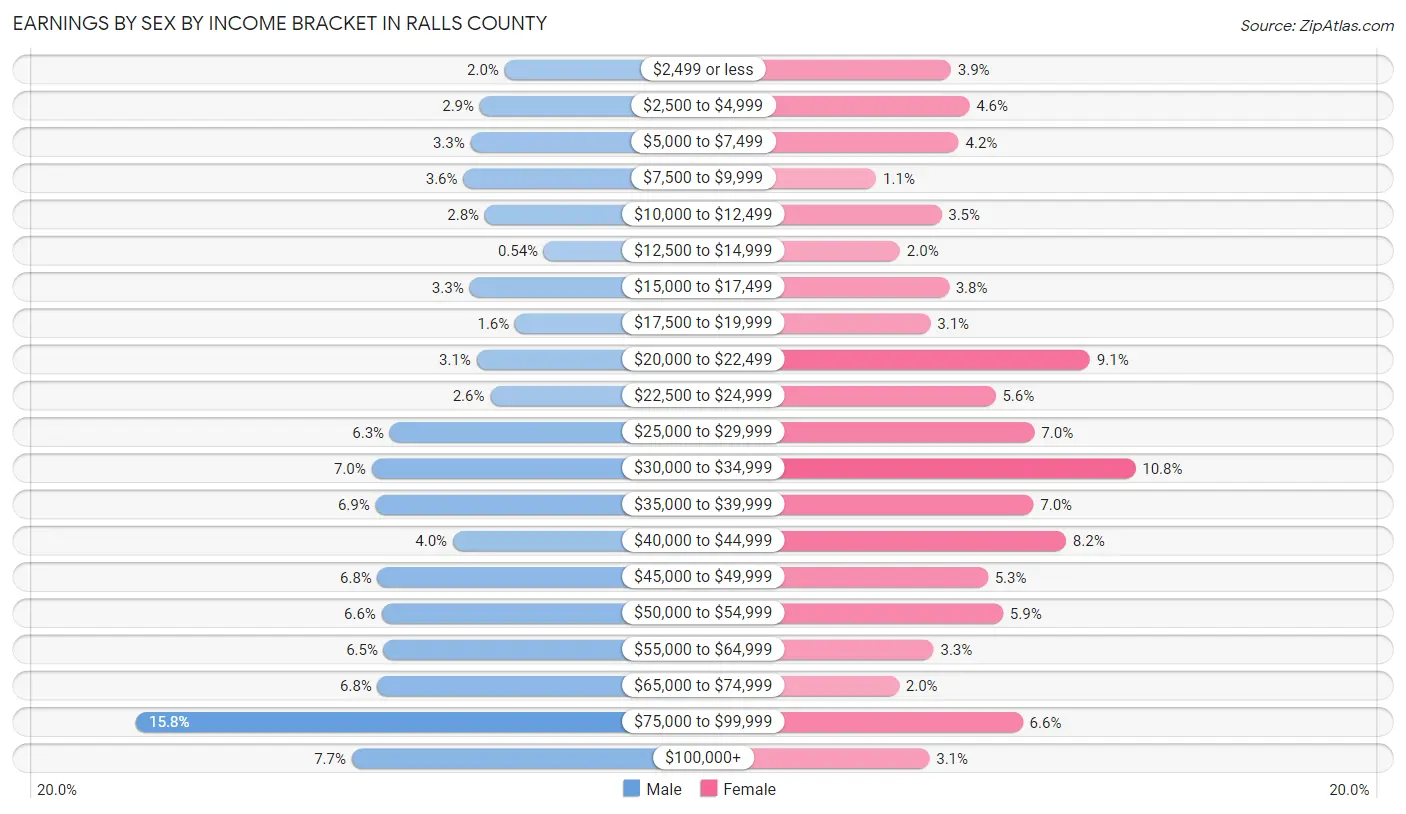
Earnings by Sex by Income Bracket in Ralls County
The most common earnings brackets in Ralls County are $75,000 to $99,999 for men (409 | 15.8%) and $30,000 to $34,999 for women (266 | 10.8%).
| Income | Male | Female |
| $2,499 or less | 52 (2.0%) | 96 (3.9%) |
| $2,500 to $4,999 | 76 (2.9%) | 113 (4.6%) |
| $5,000 to $7,499 | 85 (3.3%) | 103 (4.2%) |
| $7,500 to $9,999 | 92 (3.6%) | 27 (1.1%) |
| $10,000 to $12,499 | 71 (2.8%) | 87 (3.5%) |
| $12,500 to $14,999 | 14 (0.5%) | 49 (2.0%) |
| $15,000 to $17,499 | 86 (3.3%) | 94 (3.8%) |
| $17,500 to $19,999 | 42 (1.6%) | 77 (3.1%) |
| $20,000 to $22,499 | 79 (3.1%) | 224 (9.1%) |
| $22,500 to $24,999 | 66 (2.5%) | 137 (5.6%) |
| $25,000 to $29,999 | 163 (6.3%) | 173 (7.0%) |
| $30,000 to $34,999 | 181 (7.0%) | 266 (10.8%) |
| $35,000 to $39,999 | 177 (6.9%) | 172 (7.0%) |
| $40,000 to $44,999 | 102 (4.0%) | 202 (8.2%) |
| $45,000 to $49,999 | 175 (6.8%) | 130 (5.3%) |
| $50,000 to $54,999 | 171 (6.6%) | 144 (5.9%) |
| $55,000 to $64,999 | 169 (6.5%) | 80 (3.3%) |
| $65,000 to $74,999 | 175 (6.8%) | 48 (1.9%) |
| $75,000 to $99,999 | 409 (15.8%) | 162 (6.6%) |
| $100,000+ | 200 (7.7%) | 76 (3.1%) |
| Total | 2,585 (100.0%) | 2,460 (100.0%) |
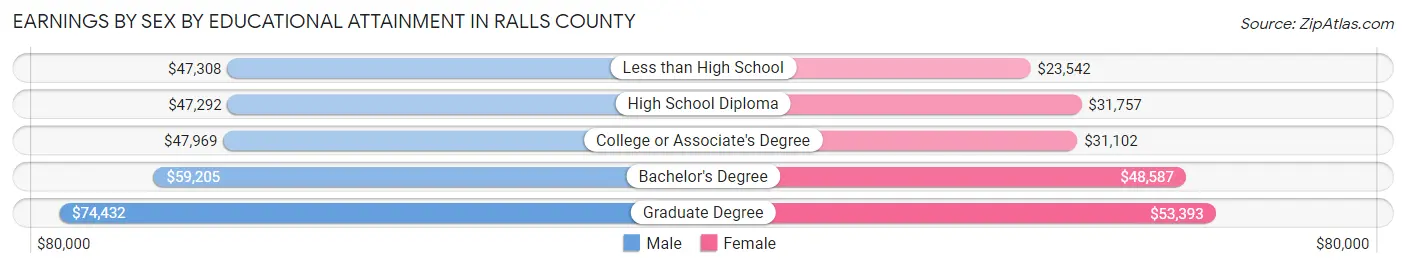
Earnings by Sex by Educational Attainment in Ralls County
Average earnings in Ralls County are $49,637 for men and $32,958 for women, a difference of 33.6%. Men with an educational attainment of graduate degree enjoy the highest average annual earnings of $74,432, while those with high school diploma education earn the least with $47,292. Women with an educational attainment of graduate degree earn the most with the average annual earnings of $53,393, while those with less than high school education have the smallest earnings of $23,542.
| Educational Attainment | Male Income | Female Income |
| Less than High School | $47,308 | $23,542 |
| High School Diploma | $47,292 | $31,757 |
| College or Associate's Degree | $47,969 | $31,102 |
| Bachelor's Degree | $59,205 | $48,587 |
| Graduate Degree | $74,432 | $53,393 |
| Total | $49,637 | $32,958 |
Family Income in Ralls County
Family Income Brackets in Ralls County
According to the Ralls County family income data, there are 621 families falling into the $100,000 to $149,999 income range, which is the most common income bracket and makes up 21.6% of all families. Conversely, the $10,000 to $14,999 income bracket is the least frequent group with only 17 families (0.6%) belonging to this category.
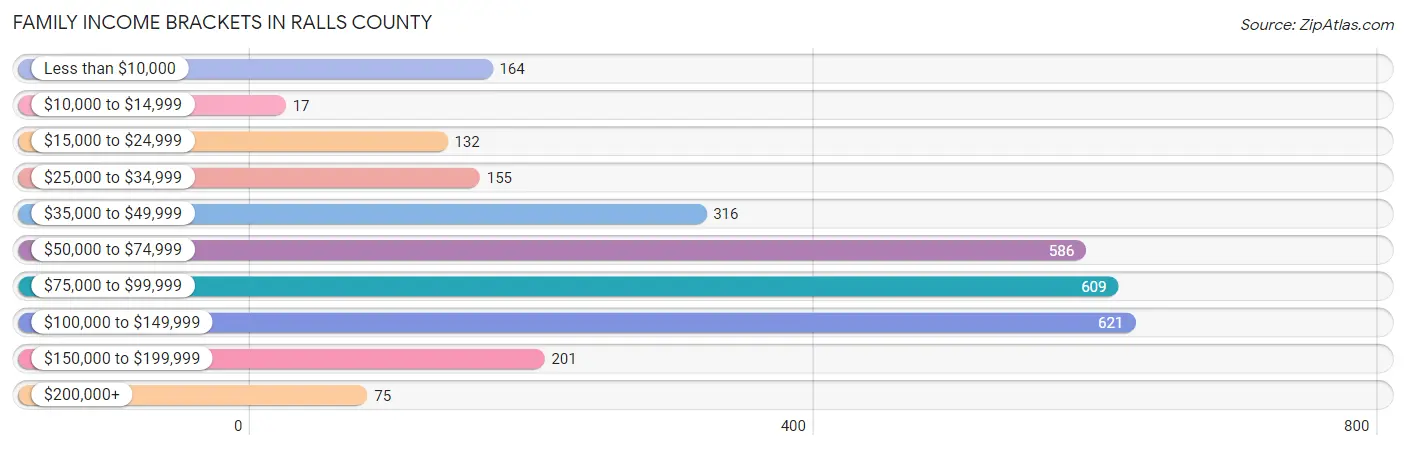
| Income Bracket | # Families | % Families |
| Less than $10,000 | 164 | 5.7% |
| $10,000 to $14,999 | 17 | 0.6% |
| $15,000 to $24,999 | 132 | 4.6% |
| $25,000 to $34,999 | 155 | 5.4% |
| $35,000 to $49,999 | 316 | 11.0% |
| $50,000 to $74,999 | 586 | 20.4% |
| $75,000 to $99,999 | 609 | 21.2% |
| $100,000 to $149,999 | 621 | 21.6% |
| $150,000 to $199,999 | 201 | 7.0% |
| $200,000+ | 75 | 2.6% |
Family Income by Famaliy Size in Ralls County
5-person families (219 | 7.6%) account for the highest median family income in Ralls County with $135,938 per family, while 2-person families (1,556 | 54.1%) have the highest median income of $33,466 per family member.
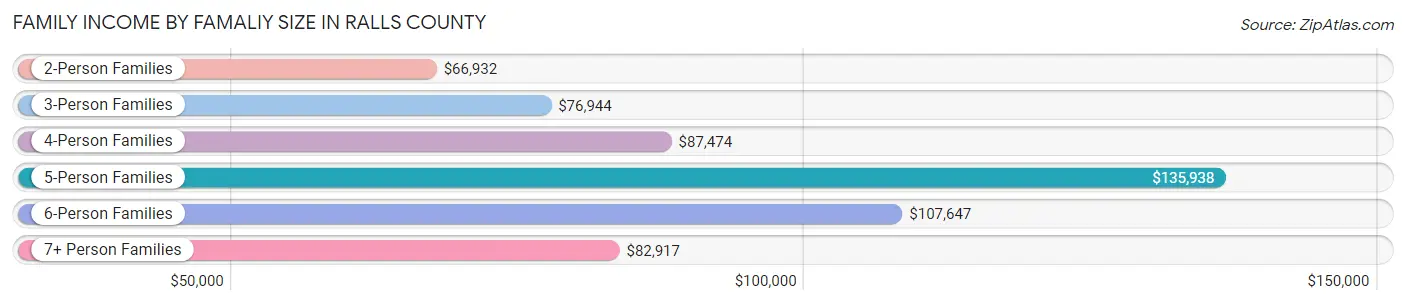
| Income Bracket | # Families | Median Income |
| 2-Person Families | 1,556 (54.1%) | $66,932 |
| 3-Person Families | 588 (20.5%) | $76,944 |
| 4-Person Families | 433 (15.1%) | $87,474 |
| 5-Person Families | 219 (7.6%) | $135,938 |
| 6-Person Families | 52 (1.8%) | $107,647 |
| 7+ Person Families | 26 (0.9%) | $82,917 |
| Total | 2,874 (100.0%) | $78,871 |
Family Income by Number of Earners in Ralls County
The median family income in Ralls County is $78,871, with families comprising 3+ earners (275) having the highest median family income of $124,940, while families with no earners (563) have the lowest median family income of $36,632, accounting for 9.6% and 19.6% of families, respectively.
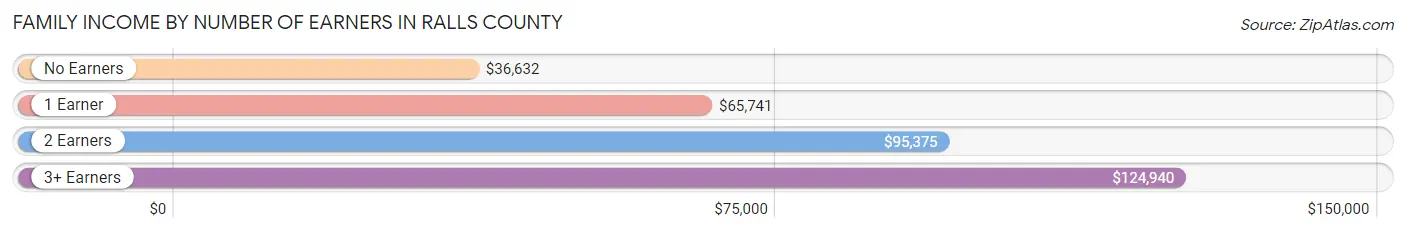
| Number of Earners | # Families | Median Income |
| No Earners | 563 (19.6%) | $36,632 |
| 1 Earner | 852 (29.6%) | $65,741 |
| 2 Earners | 1,184 (41.2%) | $95,375 |
| 3+ Earners | 275 (9.6%) | $124,940 |
| Total | 2,874 (100.0%) | $78,871 |
Household Income in Ralls County
Household Income Brackets in Ralls County
With 739 households falling in the category, the $50,000 to $74,999 income range is the most frequent in Ralls County, accounting for 18.4% of all households. In contrast, only 92 households (2.3%) fall into the $200,000+ income bracket, making it the least populous group.
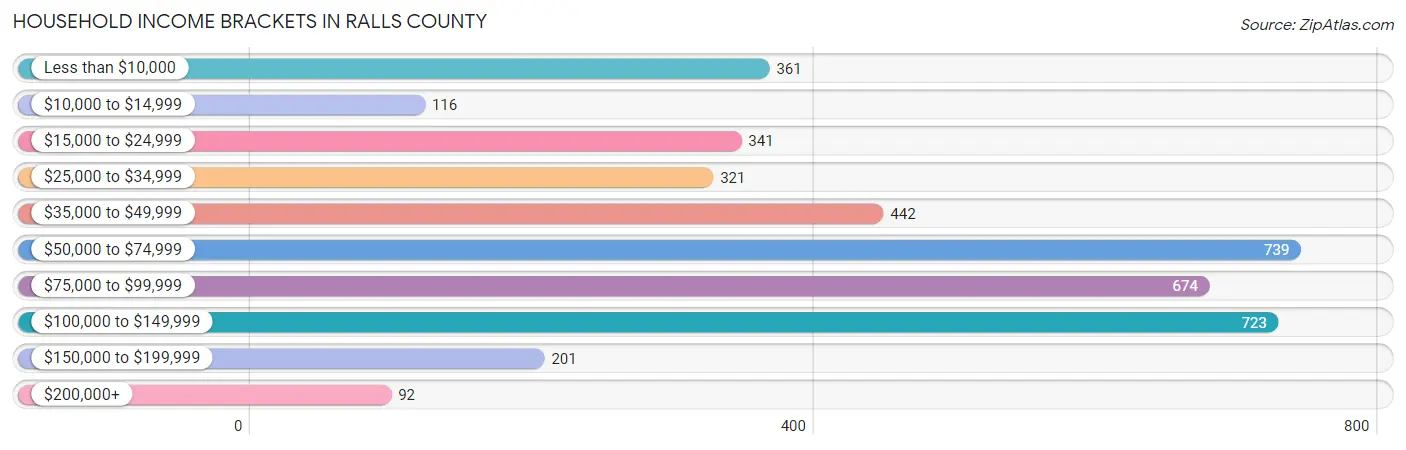
| Income Bracket | # Households | % Households |
| Less than $10,000 | 361 | 9.0% |
| $10,000 to $14,999 | 116 | 2.9% |
| $15,000 to $24,999 | 341 | 8.5% |
| $25,000 to $34,999 | 321 | 8.0% |
| $35,000 to $49,999 | 442 | 11.0% |
| $50,000 to $74,999 | 739 | 18.4% |
| $75,000 to $99,999 | 674 | 16.8% |
| $100,000 to $149,999 | 723 | 18.0% |
| $150,000 to $199,999 | 201 | 5.0% |
| $200,000+ | 92 | 2.3% |
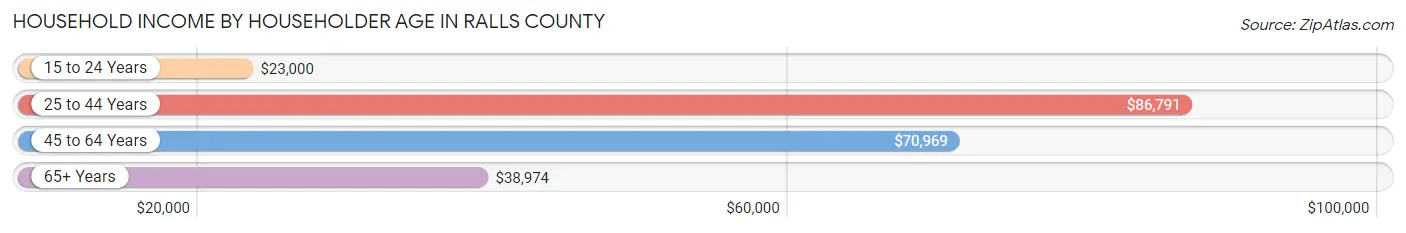
Household Income by Householder Age in Ralls County
The median household income in Ralls County is $62,615, with the highest median household income of $86,791 found in the 25 to 44 years age bracket for the primary householder. A total of 840 households (20.9%) fall into this category. Meanwhile, the 15 to 24 years age bracket for the primary householder has the lowest median household income of $23,000, with 96 households (2.4%) in this group.
| Income Bracket | # Households | Median Income |
| 15 to 24 Years | 96 (2.4%) | $23,000 |
| 25 to 44 Years | 840 (20.9%) | $86,791 |
| 45 to 64 Years | 1,648 (41.1%) | $70,969 |
| 65+ Years | 1,430 (35.6%) | $38,974 |
| Total | 4,014 (100.0%) | $62,615 |
Poverty in Ralls County
Income Below Poverty by Sex and Age in Ralls County
With 12.5% poverty level for males and 12.2% for females among the residents of Ralls County, 75 year old and over males and 75 year old and over females are the most vulnerable to poverty, with 172 males (40.1%) and 148 females (30.0%) in their respective age groups living below the poverty level.
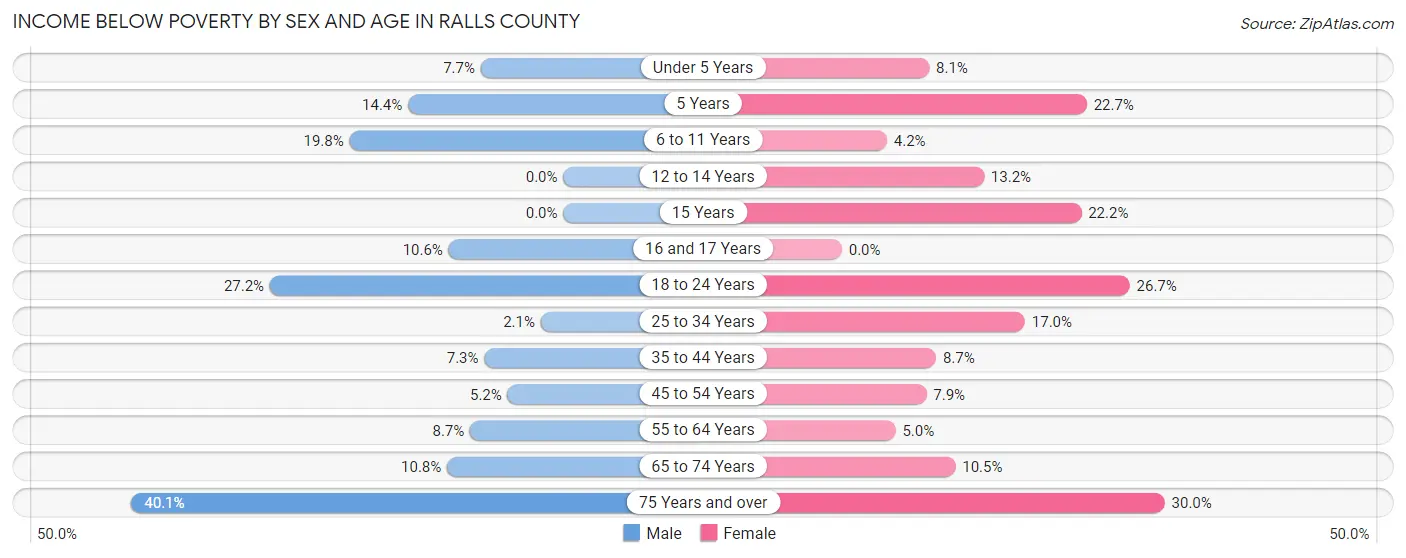
| Age Bracket | Male | Female |
| Under 5 Years | 19 (7.7%) | 23 (8.1%) |
| 5 Years | 16 (14.4%) | 5 (22.7%) |
| 6 to 11 Years | 76 (19.8%) | 13 (4.2%) |
| 12 to 14 Years | 0 (0.0%) | 31 (13.2%) |
| 15 Years | 0 (0.0%) | 12 (22.2%) |
| 16 and 17 Years | 15 (10.6%) | 0 (0.0%) |
| 18 to 24 Years | 125 (27.2%) | 82 (26.7%) |
| 25 to 34 Years | 10 (2.1%) | 88 (17.0%) |
| 35 to 44 Years | 43 (7.3%) | 48 (8.7%) |
| 45 to 54 Years | 34 (5.2%) | 52 (7.9%) |
| 55 to 64 Years | 73 (8.6%) | 39 (5.0%) |
| 65 to 74 Years | 72 (10.8%) | 73 (10.5%) |
| 75 Years and over | 172 (40.1%) | 148 (30.0%) |
| Total | 655 (12.5%) | 614 (12.2%) |
Income Above Poverty by Sex and Age in Ralls County
According to the poverty statistics in Ralls County, males aged 12 to 14 years and females aged 16 and 17 years are the age groups that are most secure financially, with 100.0% of males and 100.0% of females in these age groups living above the poverty line.
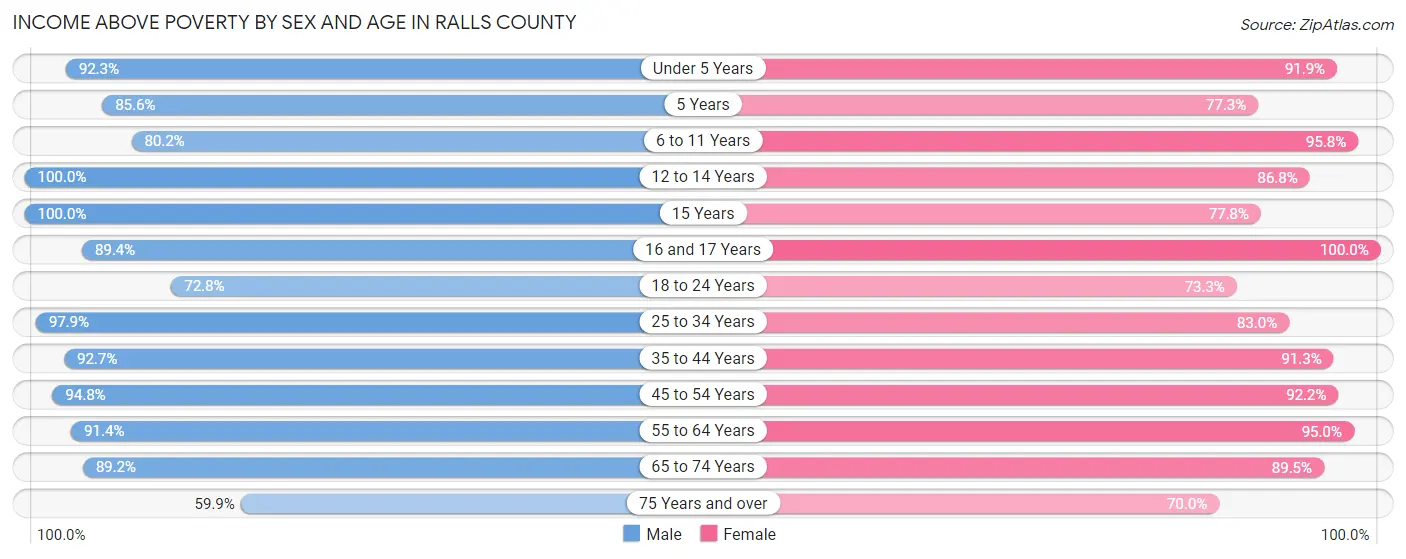
| Age Bracket | Male | Female |
| Under 5 Years | 229 (92.3%) | 261 (91.9%) |
| 5 Years | 95 (85.6%) | 17 (77.3%) |
| 6 to 11 Years | 307 (80.2%) | 298 (95.8%) |
| 12 to 14 Years | 185 (100.0%) | 204 (86.8%) |
| 15 Years | 54 (100.0%) | 42 (77.8%) |
| 16 and 17 Years | 126 (89.4%) | 128 (100.0%) |
| 18 to 24 Years | 334 (72.8%) | 225 (73.3%) |
| 25 to 34 Years | 469 (97.9%) | 430 (83.0%) |
| 35 to 44 Years | 544 (92.7%) | 501 (91.3%) |
| 45 to 54 Years | 624 (94.8%) | 610 (92.1%) |
| 55 to 64 Years | 771 (91.3%) | 744 (95.0%) |
| 65 to 74 Years | 595 (89.2%) | 620 (89.5%) |
| 75 Years and over | 257 (59.9%) | 346 (70.0%) |
| Total | 4,590 (87.5%) | 4,426 (87.8%) |
Income Below Poverty Among Married-Couple Families in Ralls County
The poverty statistics for married-couple families in Ralls County show that 7.8% or 188 of the total 2,404 families live below the poverty line. Families with no children have the highest poverty rate of 10.0%, comprising of 156 families. On the other hand, families with 3 or 4 children have the lowest poverty rate of 0.0%, which includes 0 families.
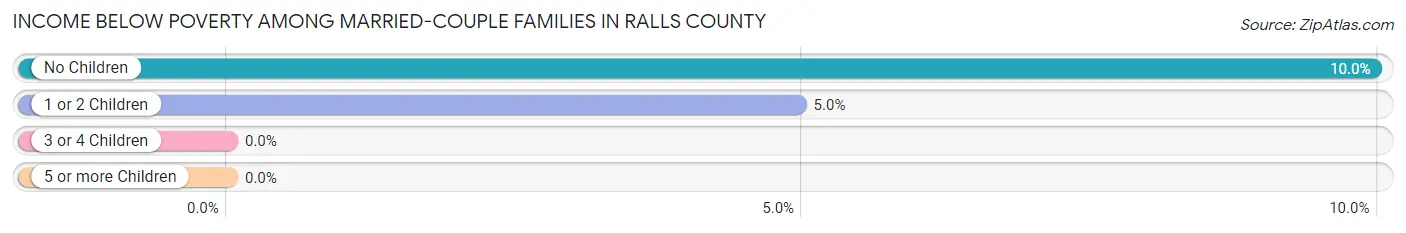
| Children | Above Poverty | Below Poverty |
| No Children | 1,410 (90.0%) | 156 (10.0%) |
| 1 or 2 Children | 615 (95.1%) | 32 (5.0%) |
| 3 or 4 Children | 173 (100.0%) | 0 (0.0%) |
| 5 or more Children | 18 (100.0%) | 0 (0.0%) |
| Total | 2,216 (92.2%) | 188 (7.8%) |
Income Below Poverty Among Single-Parent Households in Ralls County
According to the poverty data in Ralls County, 12.1% or 24 single-father households and 23.5% or 64 single-mother households are living below the poverty line. Among single-father households, those with 1 or 2 children have the highest poverty rate, with 24 households (17.6%) experiencing poverty. Likewise, among single-mother households, those with 1 or 2 children have the highest poverty rate, with 49 households (40.8%) falling below the poverty line.
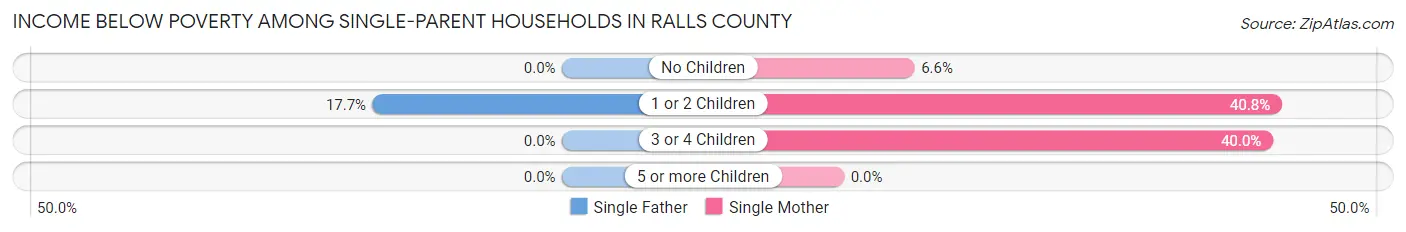
| Children | Single Father | Single Mother |
| No Children | 0 (0.0%) | 9 (6.6%) |
| 1 or 2 Children | 24 (17.6%) | 49 (40.8%) |
| 3 or 4 Children | 0 (0.0%) | 6 (40.0%) |
| 5 or more Children | 0 (0.0%) | 0 (0.0%) |
| Total | 24 (12.1%) | 64 (23.5%) |
Income Below Poverty Among Married-Couple vs Single-Parent Households in Ralls County
The poverty data for Ralls County shows that 188 of the married-couple family households (7.8%) and 88 of the single-parent households (18.7%) are living below the poverty level. Within the married-couple family households, those with no children have the highest poverty rate, with 156 households (10.0%) falling below the poverty line. Among the single-parent households, those with 3 or 4 children have the highest poverty rate, with 6 household (28.6%) living below poverty.
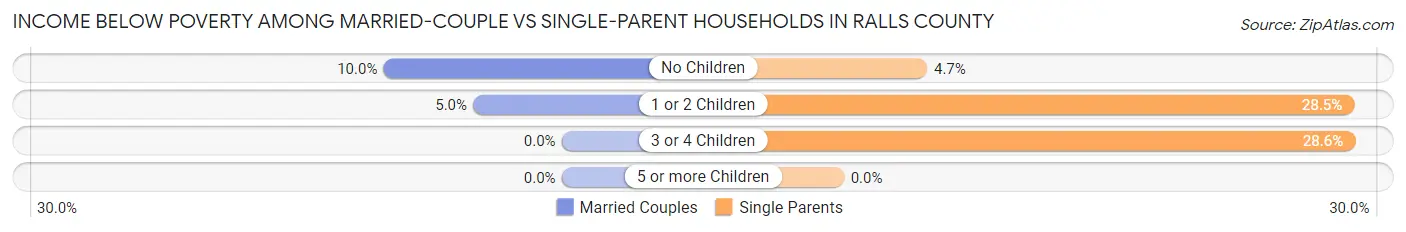
| Children | Married-Couple Families | Single-Parent Households |
| No Children | 156 (10.0%) | 9 (4.7%) |
| 1 or 2 Children | 32 (5.0%) | 73 (28.5%) |
| 3 or 4 Children | 0 (0.0%) | 6 (28.6%) |
| 5 or more Children | 0 (0.0%) | 0 (0.0%) |
| Total | 188 (7.8%) | 88 (18.7%) |
Race in Ralls County
The most populous races in Ralls County are White / Caucasian (9,734 | 94.0%), Two or more Races (324 | 3.1%), and Black / African American (184 | 1.8%).
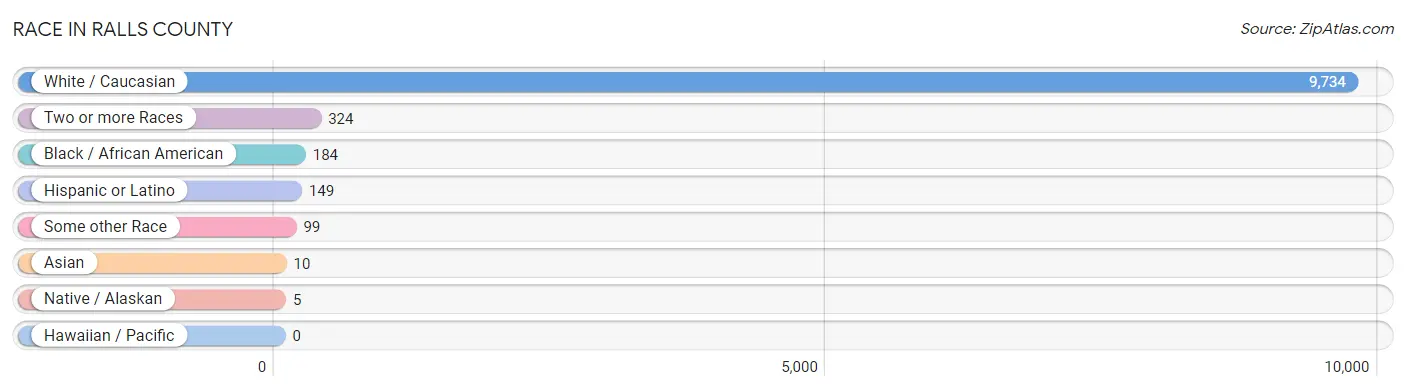
| Race | # Population | % Population |
| Asian | 10 | 0.1% |
| Black / African American | 184 | 1.8% |
| Hawaiian / Pacific | 0 | 0.0% |
| Hispanic or Latino | 149 | 1.4% |
| Native / Alaskan | 5 | 0.1% |
| White / Caucasian | 9,734 | 94.0% |
| Two or more Races | 324 | 3.1% |
| Some other Race | 99 | 1.0% |
| Total | 10,356 | 100.0% |
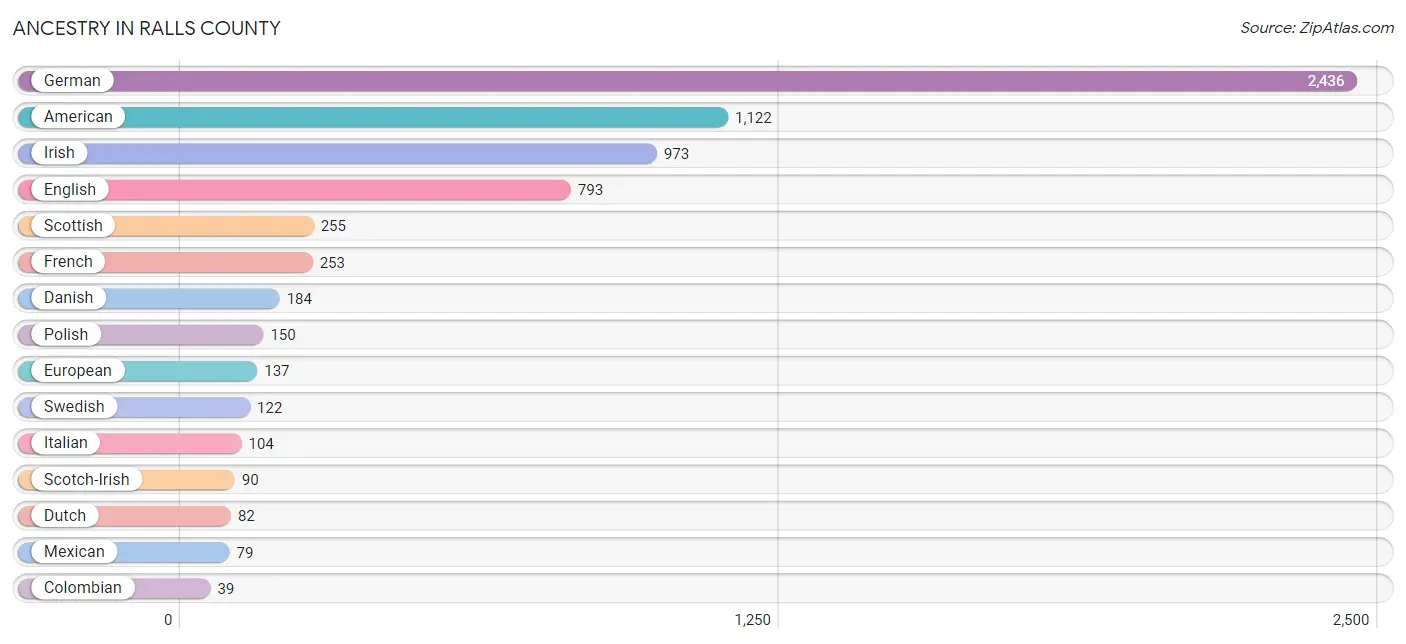
Ancestry in Ralls County
The most populous ancestries reported in Ralls County are German (2,436 | 23.5%), American (1,122 | 10.8%), Irish (973 | 9.4%), English (793 | 7.7%), and Scottish (255 | 2.5%), together accounting for 53.9% of all Ralls County residents.
| Ancestry | # Population | % Population |
| American | 1,122 | 10.8% |
| Apache | 20 | 0.2% |
| Arab | 4 | 0.0% |
| Austrian | 7 | 0.1% |
| Belgian | 4 | 0.0% |
| Blackfeet | 8 | 0.1% |
| British | 4 | 0.0% |
| Cherokee | 13 | 0.1% |
| Colombian | 39 | 0.4% |
| Comanche | 20 | 0.2% |
| Croatian | 12 | 0.1% |
| Cuban | 15 | 0.1% |
| Czech | 28 | 0.3% |
| Czechoslovakian | 3 | 0.0% |
| Danish | 184 | 1.8% |
| Dutch | 82 | 0.8% |
| Eastern European | 9 | 0.1% |
| English | 793 | 7.7% |
| European | 137 | 1.3% |
| French | 253 | 2.4% |
| German | 2,436 | 23.5% |
| Greek | 4 | 0.0% |
| Irish | 973 | 9.4% |
| Italian | 104 | 1.0% |
| Korean | 7 | 0.1% |
| Latvian | 17 | 0.2% |
| Lebanese | 4 | 0.0% |
| Lithuanian | 1 | 0.0% |
| Mexican | 79 | 0.8% |
| Northern European | 4 | 0.0% |
| Norwegian | 17 | 0.2% |
| Polish | 150 | 1.5% |
| Puerto Rican | 16 | 0.2% |
| Scandinavian | 19 | 0.2% |
| Scotch-Irish | 90 | 0.9% |
| Scottish | 255 | 2.5% |
| South American | 39 | 0.4% |
| Swedish | 122 | 1.2% |
| Swiss | 13 | 0.1% |
| Welsh | 25 | 0.2% | View All 40 Rows |
Immigrants in Ralls County
The most numerous immigrant groups reported in Ralls County came from Colombia (39 | 0.4%), Latin America (39 | 0.4%), South America (39 | 0.4%), Europe (17 | 0.2%), and Western Europe (17 | 0.2%), together accounting for 1.5% of all Ralls County residents.
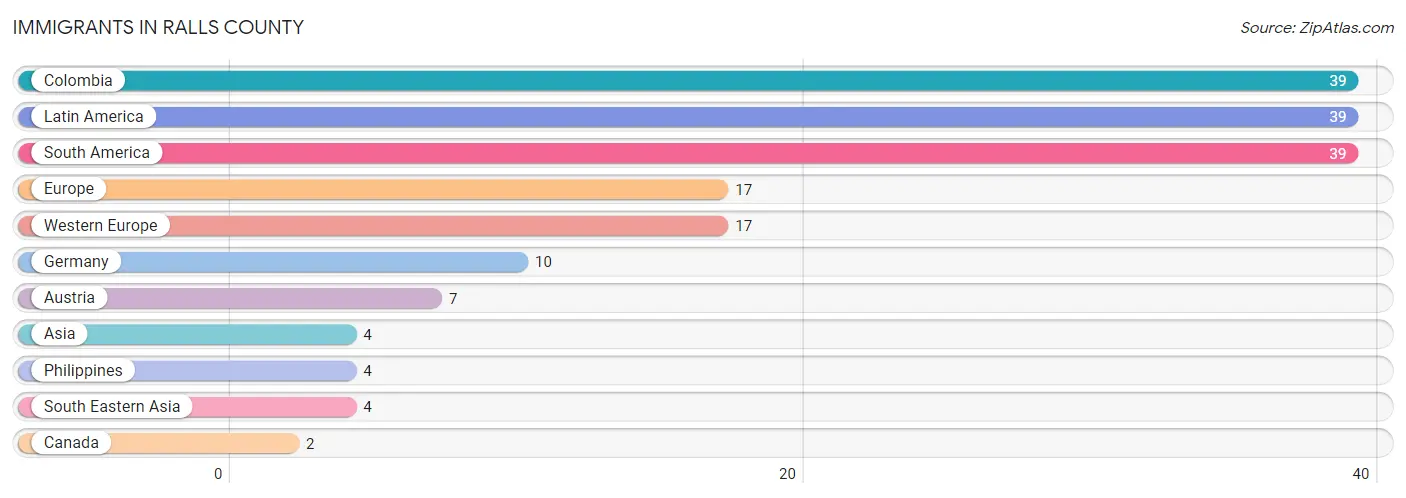
| Immigration Origin | # Population | % Population |
| Asia | 4 | 0.0% |
| Austria | 7 | 0.1% |
| Canada | 2 | 0.0% |
| Colombia | 39 | 0.4% |
| Europe | 17 | 0.2% |
| Germany | 10 | 0.1% |
| Latin America | 39 | 0.4% |
| Philippines | 4 | 0.0% |
| South America | 39 | 0.4% |
| South Eastern Asia | 4 | 0.0% |
| Western Europe | 17 | 0.2% | View All 11 Rows |
Sex and Age in Ralls County
Sex and Age in Ralls County
The most populous age groups in Ralls County are 60 to 64 Years (446 | 8.4%) for men and 65 to 69 Years (418 | 8.3%) for women.
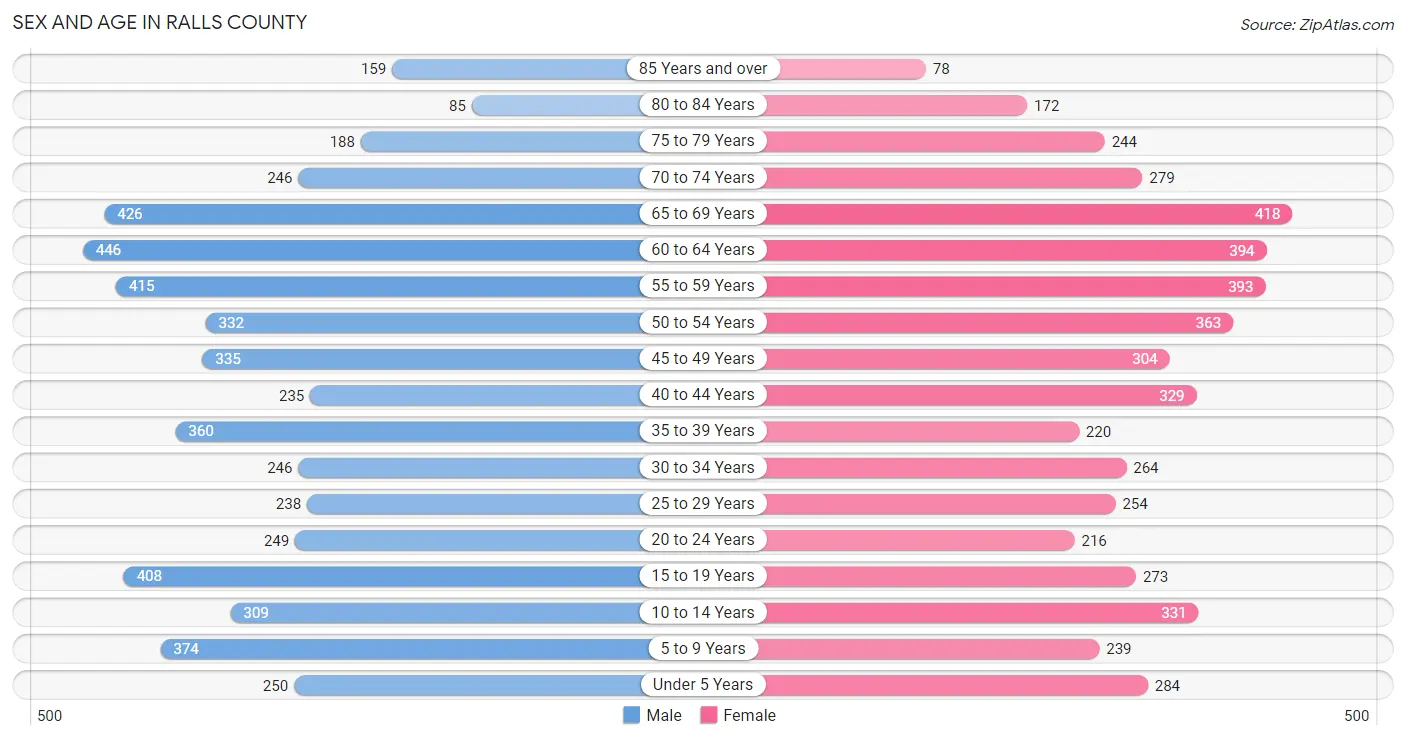
| Age Bracket | Male | Female |
| Under 5 Years | 250 (4.7%) | 284 (5.6%) |
| 5 to 9 Years | 374 (7.1%) | 239 (4.7%) |
| 10 to 14 Years | 309 (5.8%) | 331 (6.6%) |
| 15 to 19 Years | 408 (7.7%) | 273 (5.4%) |
| 20 to 24 Years | 249 (4.7%) | 216 (4.3%) |
| 25 to 29 Years | 238 (4.5%) | 254 (5.0%) |
| 30 to 34 Years | 246 (4.6%) | 264 (5.2%) |
| 35 to 39 Years | 360 (6.8%) | 220 (4.3%) |
| 40 to 44 Years | 235 (4.4%) | 329 (6.5%) |
| 45 to 49 Years | 335 (6.3%) | 304 (6.0%) |
| 50 to 54 Years | 332 (6.3%) | 363 (7.2%) |
| 55 to 59 Years | 415 (7.8%) | 393 (7.8%) |
| 60 to 64 Years | 446 (8.4%) | 394 (7.8%) |
| 65 to 69 Years | 426 (8.0%) | 418 (8.3%) |
| 70 to 74 Years | 246 (4.6%) | 279 (5.5%) |
| 75 to 79 Years | 188 (3.5%) | 244 (4.8%) |
| 80 to 84 Years | 85 (1.6%) | 172 (3.4%) |
| 85 Years and over | 159 (3.0%) | 78 (1.5%) |
| Total | 5,301 (100.0%) | 5,055 (100.0%) |
Families and Households in Ralls County
Median Family Size in Ralls County
The median family size in Ralls County is 3.03 persons per family, with single male/father families (198 | 6.9%) accounting for the largest median family size of 3.39 persons per family. On the other hand, married-couple families (2,404 | 83.7%) represent the smallest median family size with 2.98 persons per family.
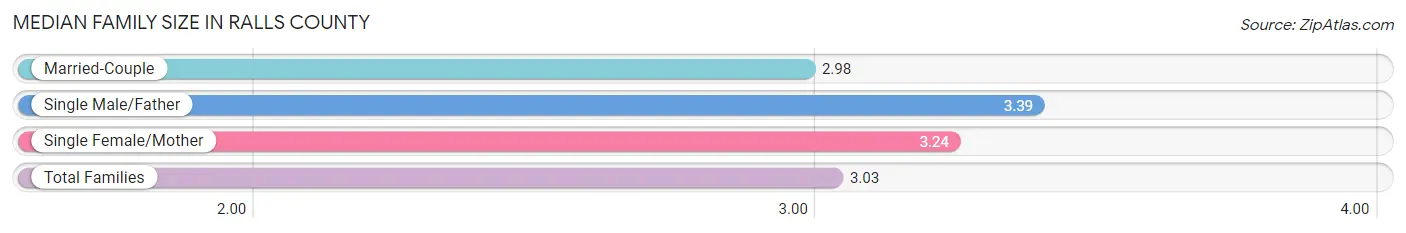
| Family Type | # Families | Family Size |
| Married-Couple | 2,404 (83.7%) | 2.98 |
| Single Male/Father | 198 (6.9%) | 3.39 |
| Single Female/Mother | 272 (9.5%) | 3.24 |
| Total Families | 2,874 (100.0%) | 3.03 |
Median Household Size in Ralls County
The median household size in Ralls County is 2.56 persons per household, with single male/father households (198 | 4.9%) accounting for the largest median household size of 3.78 persons per household. non-family households (1,140 | 28.4%) represent the smallest median household size with 1.14 persons per household.
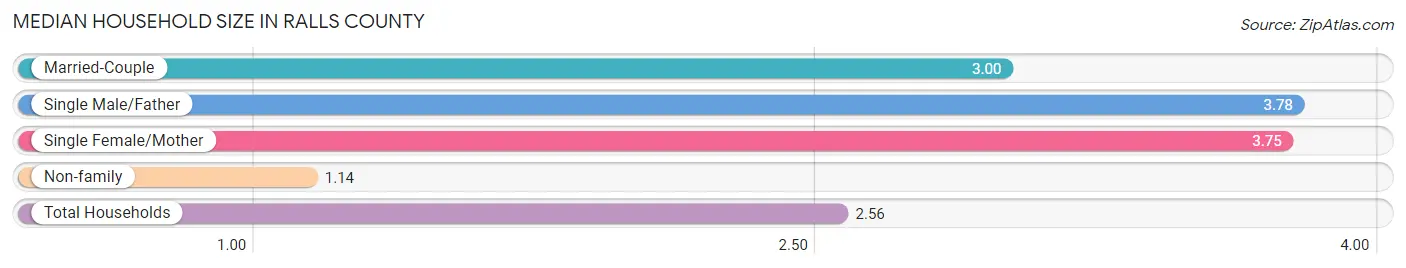
| Household Type | # Households | Household Size |
| Married-Couple | 2,404 (59.9%) | 3.00 |
| Single Male/Father | 198 (4.9%) | 3.78 |
| Single Female/Mother | 272 (6.8%) | 3.75 |
| Non-family | 1,140 (28.4%) | 1.14 |
| Total Households | 4,014 (100.0%) | 2.56 |
Household Size by Marriage Status in Ralls County
Out of a total of 4,014 households in Ralls County, 2,874 (71.6%) are family households, while 1,140 (28.4%) are nonfamily households. The most numerous type of family households are 2-person households, comprising 1,511, and the most common type of nonfamily households are 1-person households, comprising 1,007.
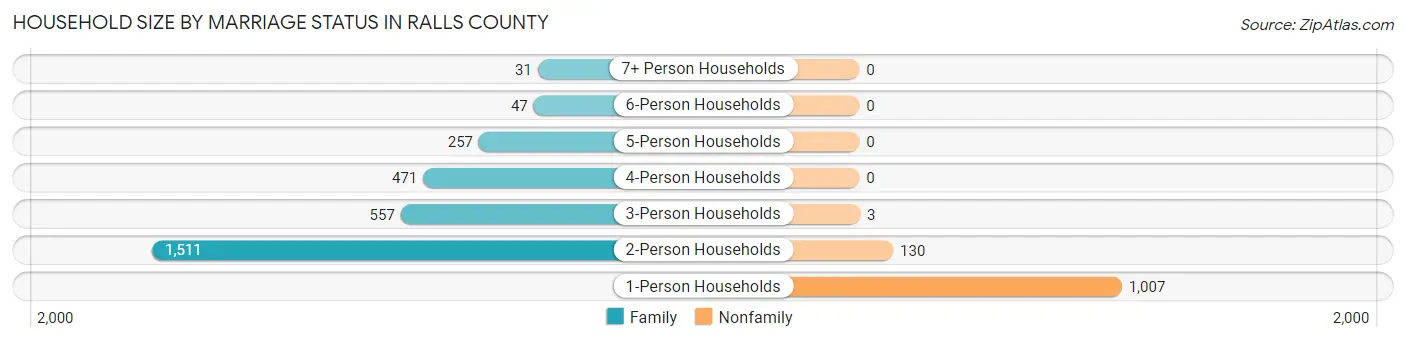
| Household Size | Family Households | Nonfamily Households |
| 1-Person Households | - | 1,007 (25.1%) |
| 2-Person Households | 1,511 (37.6%) | 130 (3.2%) |
| 3-Person Households | 557 (13.9%) | 3 (0.1%) |
| 4-Person Households | 471 (11.7%) | 0 (0.0%) |
| 5-Person Households | 257 (6.4%) | 0 (0.0%) |
| 6-Person Households | 47 (1.2%) | 0 (0.0%) |
| 7+ Person Households | 31 (0.8%) | 0 (0.0%) |
| Total | 2,874 (71.6%) | 1,140 (28.4%) |
Female Fertility in Ralls County
Fertility by Age in Ralls County
Average fertility rate in Ralls County is 58.0 births per 1,000 women. Women in the age bracket of 20 to 34 years have the highest fertility rate with 139.0 births per 1,000 women. Women in the age bracket of 20 to 34 years acount for 90.3% of all women with births.
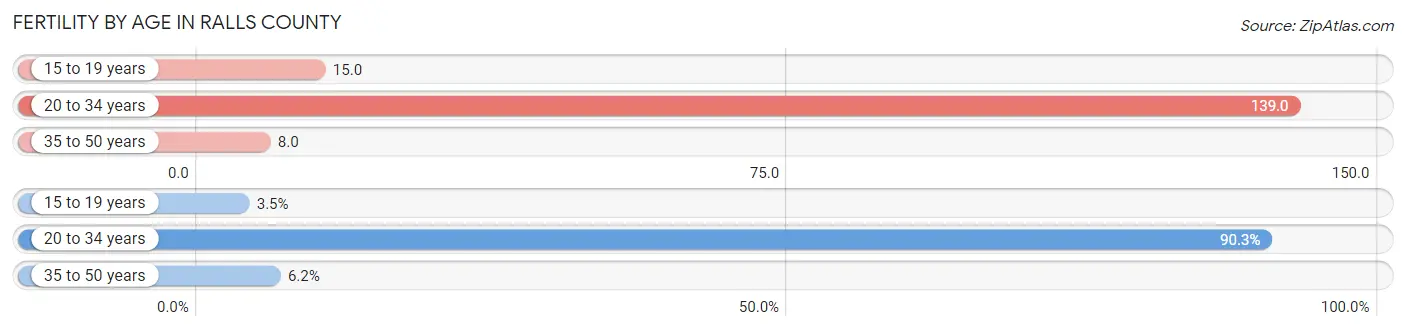
| Age Bracket | Women with Births | Births / 1,000 Women |
| 15 to 19 years | 4 (3.5%) | 15.0 |
| 20 to 34 years | 102 (90.3%) | 139.0 |
| 35 to 50 years | 7 (6.2%) | 8.0 |
| Total | 113 (100.0%) | 58.0 |
Fertility by Age by Marriage Status in Ralls County
60.2% of women with births (113) in Ralls County are married. The highest percentage of unmarried women with births falls into 15 to 19 years age bracket with 100.0% of them unmarried at the time of birth, while the lowest percentage of unmarried women with births belong to 35 to 50 years age bracket with 0.0% of them unmarried.
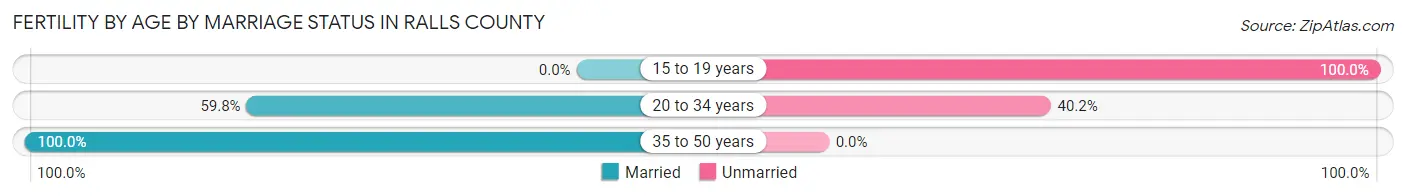
| Age Bracket | Married | Unmarried |
| 15 to 19 years | 0 (0.0%) | 4 (100.0%) |
| 20 to 34 years | 61 (59.8%) | 41 (40.2%) |
| 35 to 50 years | 7 (100.0%) | 0 (0.0%) |
| Total | 68 (60.2%) | 45 (39.8%) |
Fertility by Education in Ralls County
Average fertility rate in Ralls County is 58.0 births per 1,000 women. Women with the education attainment of bachelor's degree have the highest fertility rate of 99.0 births per 1,000 women, while women with the education attainment of graduate degree have the lowest fertility at 29.0 births per 1,000 women. Women with the education attainment of college or associate's degree represent 34.5% of all women with births.
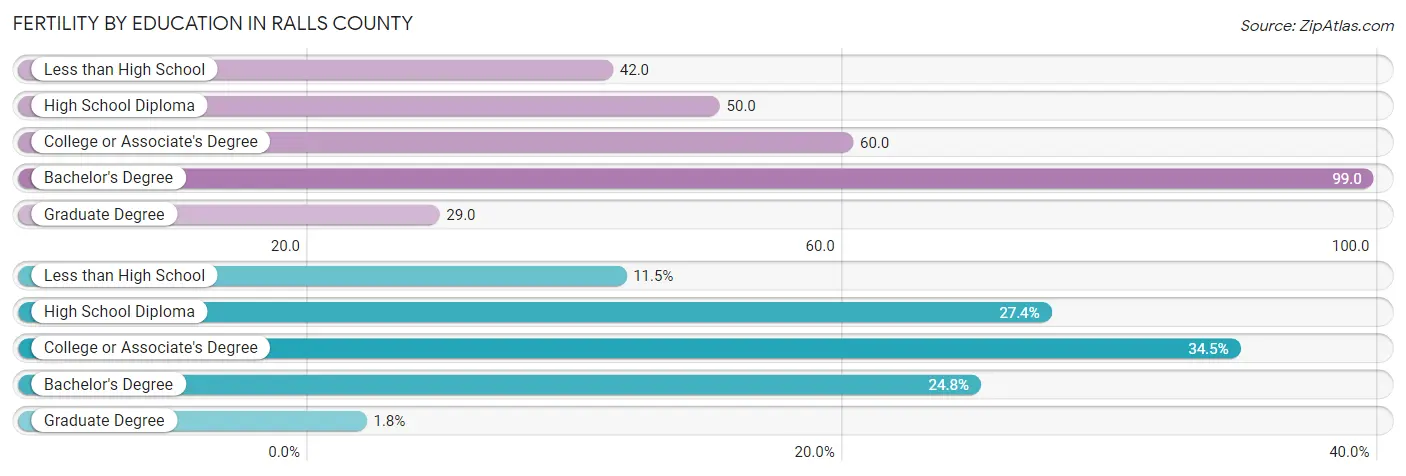
| Educational Attainment | Women with Births | Births / 1,000 Women |
| Less than High School | 13 (11.5%) | 42.0 |
| High School Diploma | 31 (27.4%) | 50.0 |
| College or Associate's Degree | 39 (34.5%) | 60.0 |
| Bachelor's Degree | 28 (24.8%) | 99.0 |
| Graduate Degree | 2 (1.8%) | 29.0 |
| Total | 113 (100.0%) | 58.0 |
Fertility by Education by Marriage Status in Ralls County
39.8% of women with births in Ralls County are unmarried. Women with the educational attainment of less than high school are most likely to be married with 100.0% of them married at childbirth, while women with the educational attainment of high school diploma are least likely to be married with 61.3% of them unmarried at childbirth.
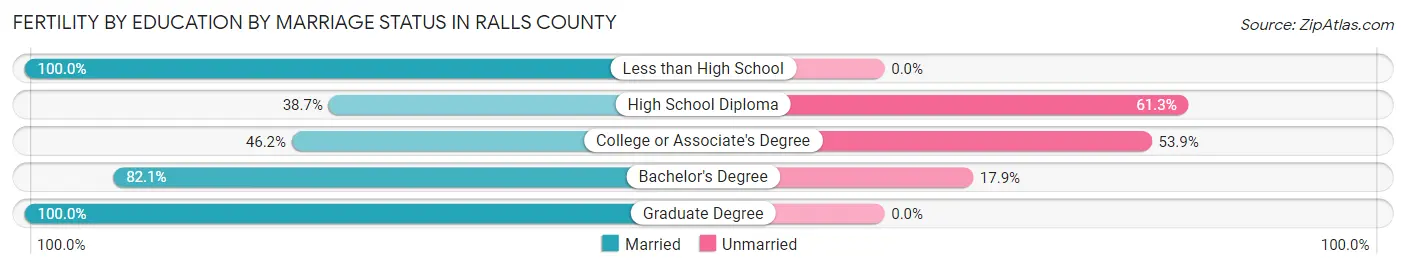
| Educational Attainment | Married | Unmarried |
| Less than High School | 13 (100.0%) | 0 (0.0%) |
| High School Diploma | 12 (38.7%) | 19 (61.3%) |
| College or Associate's Degree | 18 (46.2%) | 21 (53.8%) |
| Bachelor's Degree | 23 (82.1%) | 5 (17.9%) |
| Graduate Degree | 2 (100.0%) | 0 (0.0%) |
| Total | 68 (60.2%) | 45 (39.8%) |
Employment Characteristics in Ralls County
Employment by Class of Employer in Ralls County
Among the 4,518 employed individuals in Ralls County, private company employees (2,930 | 64.8%), self-employed (not incorporated) (497 | 11.0%), and not-for-profit organizations (416 | 9.2%) make up the most common classes of employment.
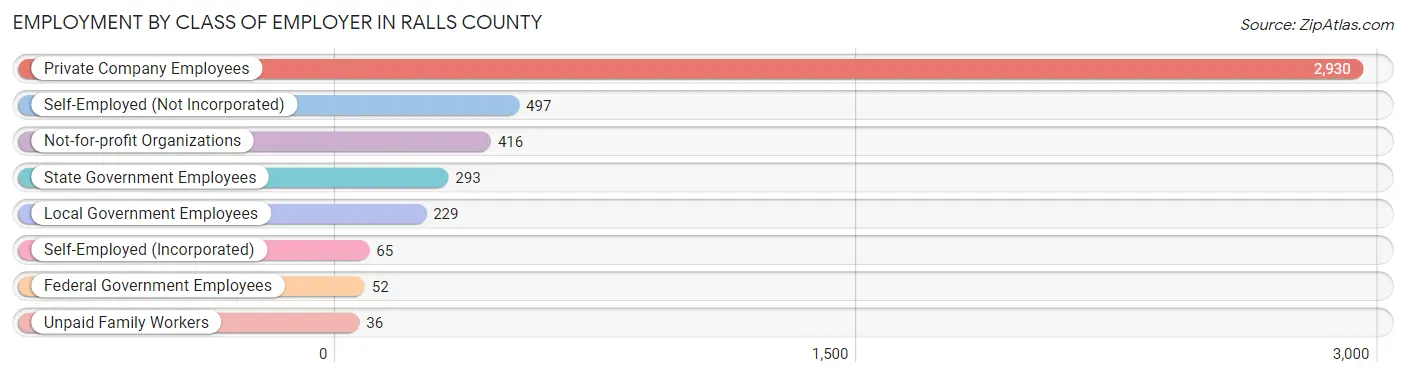
| Employer Class | # Employees | % Employees |
| Private Company Employees | 2,930 | 64.8% |
| Self-Employed (Incorporated) | 65 | 1.4% |
| Self-Employed (Not Incorporated) | 497 | 11.0% |
| Not-for-profit Organizations | 416 | 9.2% |
| Local Government Employees | 229 | 5.1% |
| State Government Employees | 293 | 6.5% |
| Federal Government Employees | 52 | 1.1% |
| Unpaid Family Workers | 36 | 0.8% |
| Total | 4,518 | 100.0% |
Employment Status by Age in Ralls County
According to the labor force statistics for Ralls County, out of the total population over 16 years of age (8,461), 57.8% or 4,890 individuals are in the labor force, with 5.3% or 259 of them unemployed. The age group with the highest labor force participation rate is 45 to 54 years, with 85.0% or 1,134 individuals in the labor force. Within the labor force, the 16 to 19 years age range has the highest percentage of unemployed individuals, with 34.9% or 117 of them being unemployed.
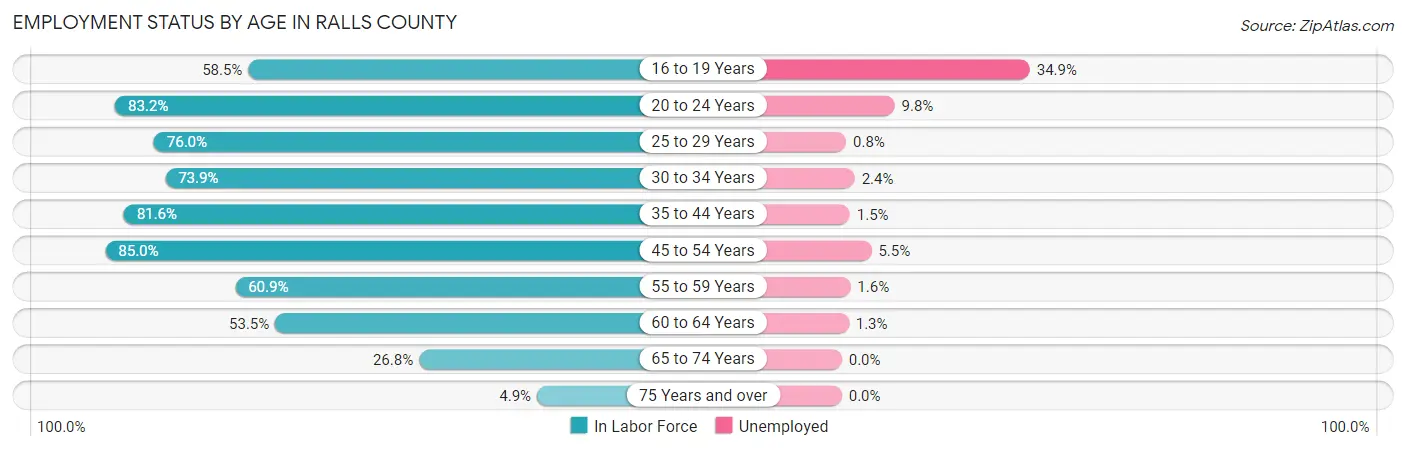
| Age Bracket | In Labor Force | Unemployed |
| 16 to 19 Years | 335 (58.5%) | 117 (34.9%) |
| 20 to 24 Years | 387 (83.2%) | 38 (9.8%) |
| 25 to 29 Years | 374 (76.0%) | 3 (0.8%) |
| 30 to 34 Years | 377 (73.9%) | 9 (2.4%) |
| 35 to 44 Years | 934 (81.6%) | 14 (1.5%) |
| 45 to 54 Years | 1,134 (85.0%) | 62 (5.5%) |
| 55 to 59 Years | 492 (60.9%) | 8 (1.6%) |
| 60 to 64 Years | 449 (53.5%) | 6 (1.3%) |
| 65 to 74 Years | 367 (26.8%) | 0 (0.0%) |
| 75 Years and over | 45 (4.9%) | 0 (0.0%) |
| Total | 4,890 (57.8%) | 259 (5.3%) |
Employment Status by Educational Attainment in Ralls County
According to labor force statistics for Ralls County, 73.3% of individuals (3,759) out of the total population between 25 and 64 years of age (5,128) are in the labor force, with 2.7% or 101 of them being unemployed. The group with the highest labor force participation rate are those with the educational attainment of bachelor's degree or higher, with 82.8% or 705 individuals in the labor force. Within the labor force, individuals with less than high school education have the highest percentage of unemployment, with 7.8% or 18 of them being unemployed.
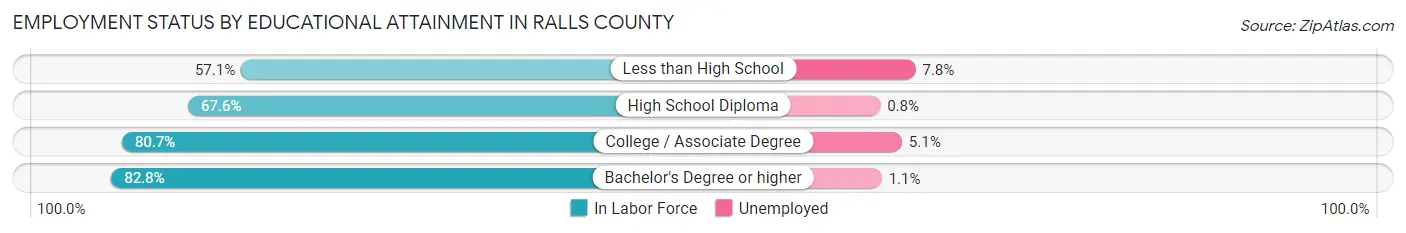
| Educational Attainment | In Labor Force | Unemployed |
| Less than High School | 232 (57.1%) | 32 (7.8%) |
| High School Diploma | 1,560 (67.6%) | 18 (0.8%) |
| College / Associate Degree | 1,261 (80.7%) | 80 (5.1%) |
| Bachelor's Degree or higher | 705 (82.8%) | 9 (1.1%) |
| Total | 3,759 (73.3%) | 138 (2.7%) |
Employment Occupations by Sex in Ralls County
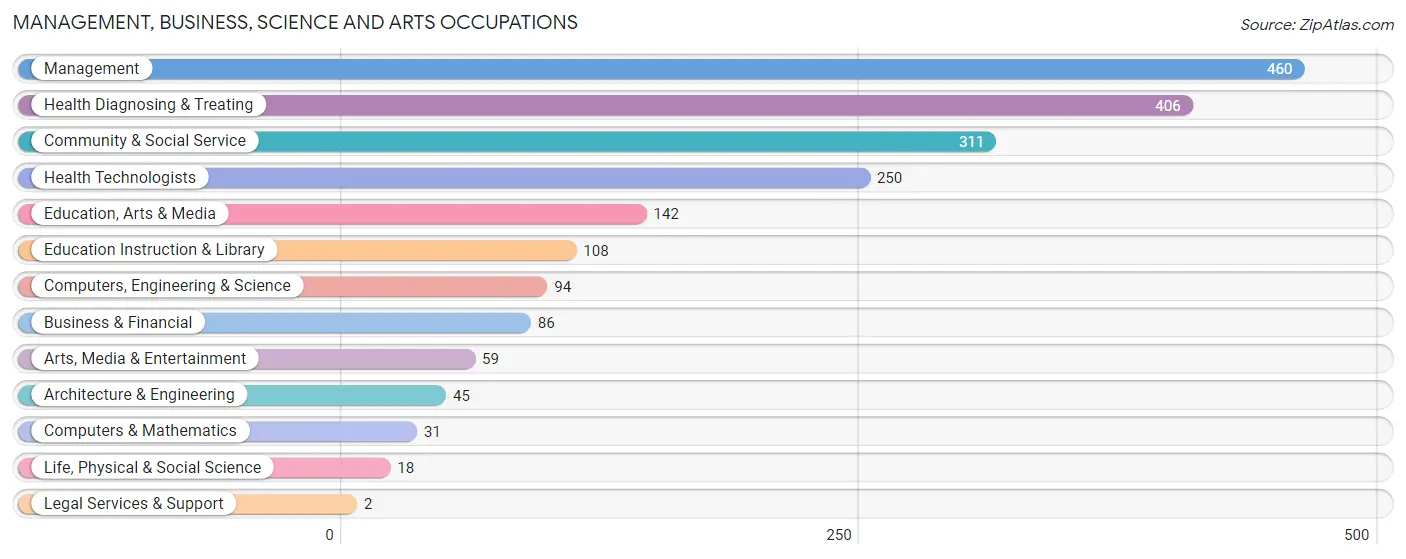
Management, Business, Science and Arts Occupations
The most common Management, Business, Science and Arts occupations in Ralls County are Management (460 | 9.9%), Health Diagnosing & Treating (406 | 8.8%), Community & Social Service (311 | 6.7%), Health Technologists (250 | 5.4%), and Education, Arts & Media (142 | 3.1%).
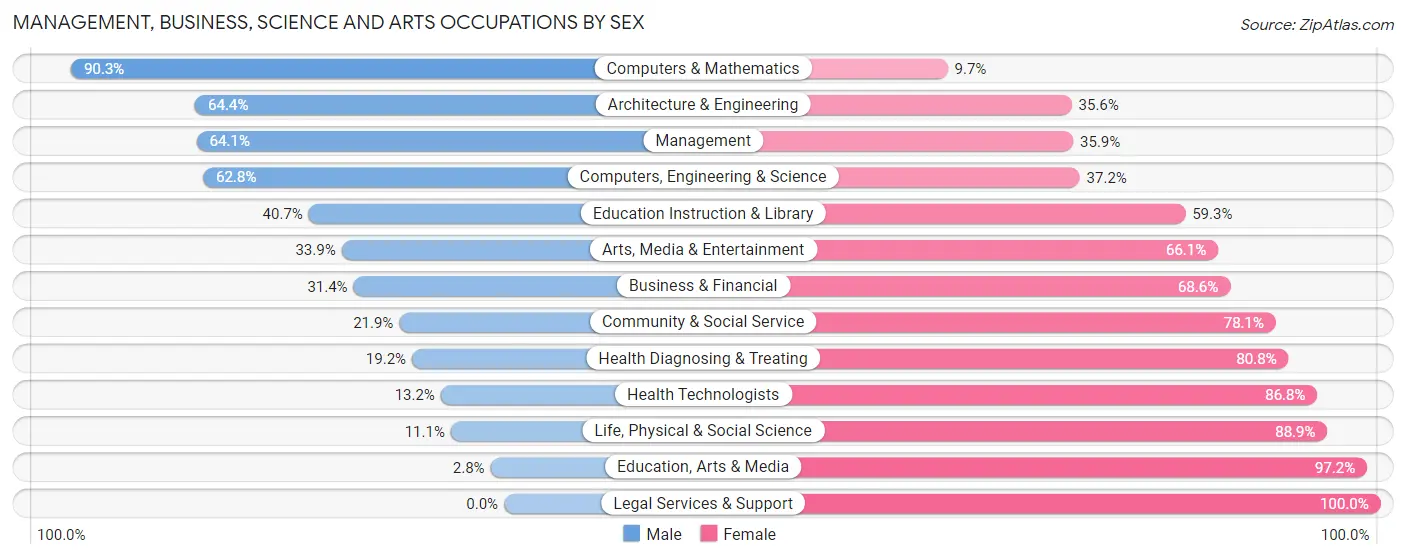
Management, Business, Science and Arts Occupations by Sex
Within the Management, Business, Science and Arts occupations in Ralls County, the most male-oriented occupations are Computers & Mathematics (90.3%), Architecture & Engineering (64.4%), and Management (64.1%), while the most female-oriented occupations are Legal Services & Support (100.0%), Education, Arts & Media (97.2%), and Life, Physical & Social Science (88.9%).
| Occupation | Male | Female |
| Management | 295 (64.1%) | 165 (35.9%) |
| Business & Financial | 27 (31.4%) | 59 (68.6%) |
| Computers, Engineering & Science | 59 (62.8%) | 35 (37.2%) |
| Computers & Mathematics | 28 (90.3%) | 3 (9.7%) |
| Architecture & Engineering | 29 (64.4%) | 16 (35.6%) |
| Life, Physical & Social Science | 2 (11.1%) | 16 (88.9%) |
| Community & Social Service | 68 (21.9%) | 243 (78.1%) |
| Education, Arts & Media | 4 (2.8%) | 138 (97.2%) |
| Legal Services & Support | 0 (0.0%) | 2 (100.0%) |
| Education Instruction & Library | 44 (40.7%) | 64 (59.3%) |
| Arts, Media & Entertainment | 20 (33.9%) | 39 (66.1%) |
| Health Diagnosing & Treating | 78 (19.2%) | 328 (80.8%) |
| Health Technologists | 33 (13.2%) | 217 (86.8%) |
| Total (Category) | 527 (38.8%) | 830 (61.2%) |
| Total (Overall) | 2,326 (50.2%) | 2,311 (49.8%) |
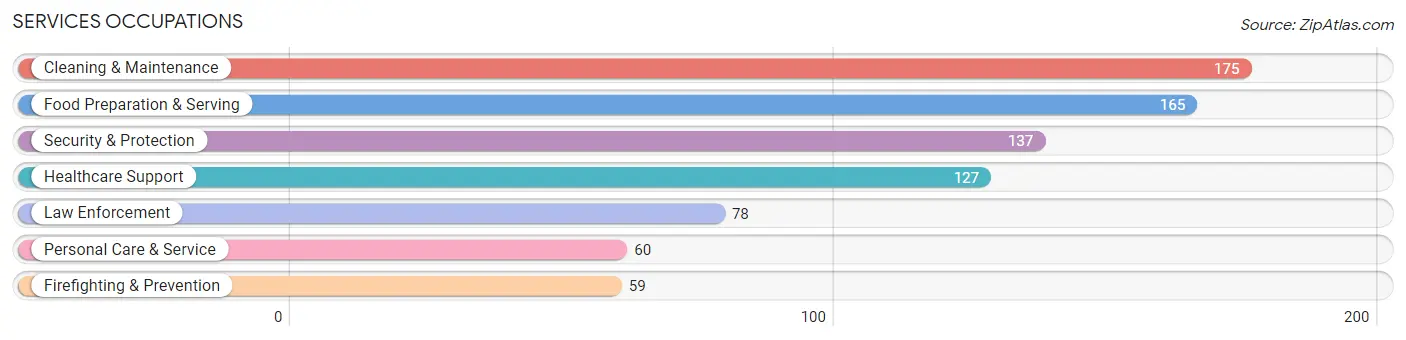
Services Occupations
The most common Services occupations in Ralls County are Cleaning & Maintenance (175 | 3.8%), Food Preparation & Serving (165 | 3.6%), Security & Protection (137 | 2.9%), Healthcare Support (127 | 2.7%), and Law Enforcement (78 | 1.7%).
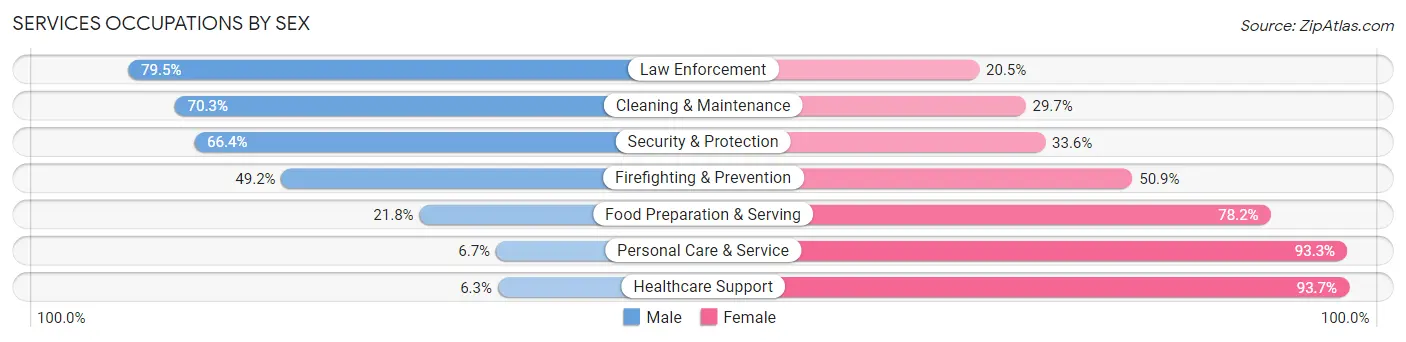
Services Occupations by Sex
Within the Services occupations in Ralls County, the most male-oriented occupations are Law Enforcement (79.5%), Cleaning & Maintenance (70.3%), and Security & Protection (66.4%), while the most female-oriented occupations are Healthcare Support (93.7%), Personal Care & Service (93.3%), and Food Preparation & Serving (78.2%).
| Occupation | Male | Female |
| Healthcare Support | 8 (6.3%) | 119 (93.7%) |
| Security & Protection | 91 (66.4%) | 46 (33.6%) |
| Firefighting & Prevention | 29 (49.1%) | 30 (50.8%) |
| Law Enforcement | 62 (79.5%) | 16 (20.5%) |
| Food Preparation & Serving | 36 (21.8%) | 129 (78.2%) |
| Cleaning & Maintenance | 123 (70.3%) | 52 (29.7%) |
| Personal Care & Service | 4 (6.7%) | 56 (93.3%) |
| Total (Category) | 262 (39.5%) | 402 (60.5%) |
| Total (Overall) | 2,326 (50.2%) | 2,311 (49.8%) |
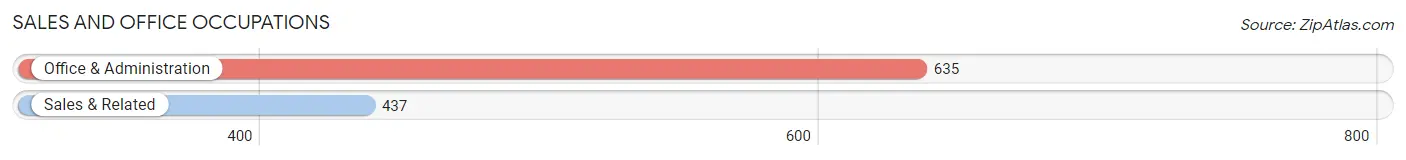
Sales and Office Occupations
The most common Sales and Office occupations in Ralls County are Office & Administration (635 | 13.7%), and Sales & Related (437 | 9.4%).
Sales and Office Occupations by Sex
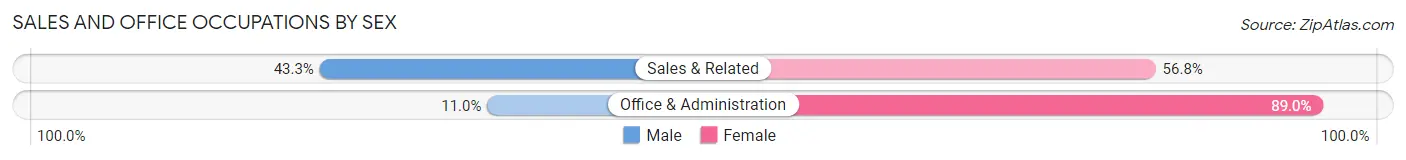
| Occupation | Male | Female |
| Sales & Related | 189 (43.2%) | 248 (56.8%) |
| Office & Administration | 70 (11.0%) | 565 (89.0%) |
| Total (Category) | 259 (24.2%) | 813 (75.8%) |
| Total (Overall) | 2,326 (50.2%) | 2,311 (49.8%) |
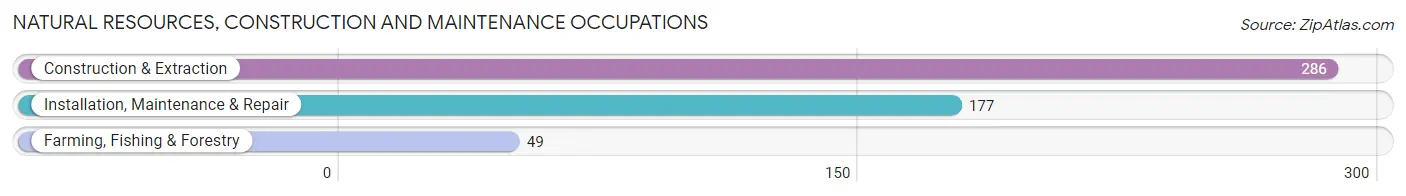
Natural Resources, Construction and Maintenance Occupations
The most common Natural Resources, Construction and Maintenance occupations in Ralls County are Construction & Extraction (286 | 6.2%), Installation, Maintenance & Repair (177 | 3.8%), and Farming, Fishing & Forestry (49 | 1.1%).
Natural Resources, Construction and Maintenance Occupations by Sex
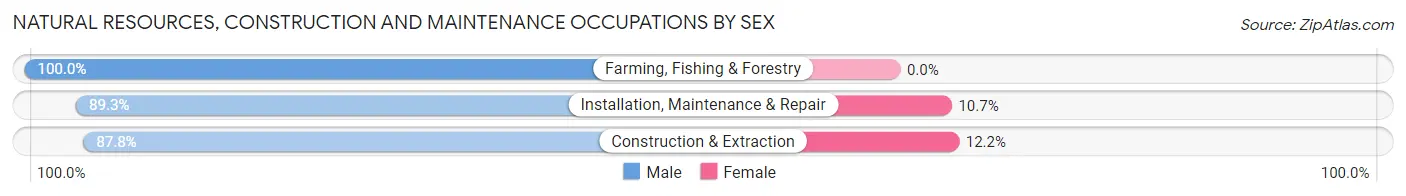
| Occupation | Male | Female |
| Farming, Fishing & Forestry | 49 (100.0%) | 0 (0.0%) |
| Construction & Extraction | 251 (87.8%) | 35 (12.2%) |
| Installation, Maintenance & Repair | 158 (89.3%) | 19 (10.7%) |
| Total (Category) | 458 (89.4%) | 54 (10.5%) |
| Total (Overall) | 2,326 (50.2%) | 2,311 (49.8%) |
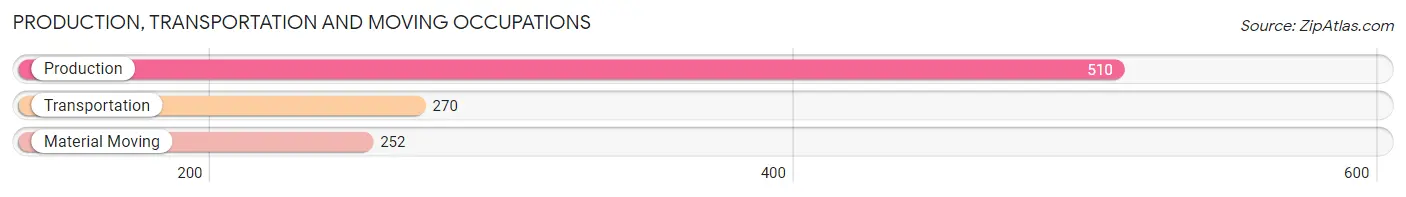
Production, Transportation and Moving Occupations
The most common Production, Transportation and Moving occupations in Ralls County are Production (510 | 11.0%), Transportation (270 | 5.8%), and Material Moving (252 | 5.4%).
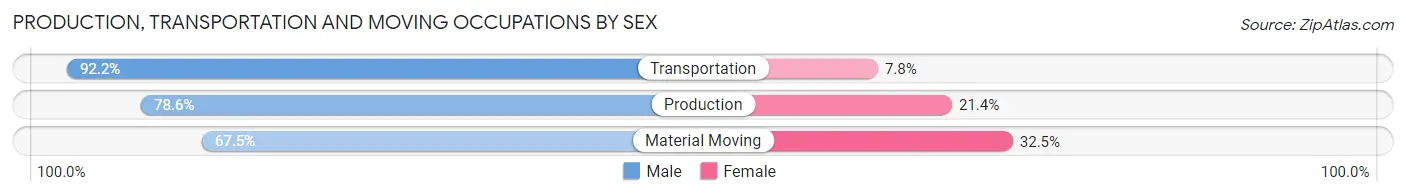
Production, Transportation and Moving Occupations by Sex
| Occupation | Male | Female |
| Production | 401 (78.6%) | 109 (21.4%) |
| Transportation | 249 (92.2%) | 21 (7.8%) |
| Material Moving | 170 (67.5%) | 82 (32.5%) |
| Total (Category) | 820 (79.5%) | 212 (20.5%) |
| Total (Overall) | 2,326 (50.2%) | 2,311 (49.8%) |
Employment Industries by Sex in Ralls County
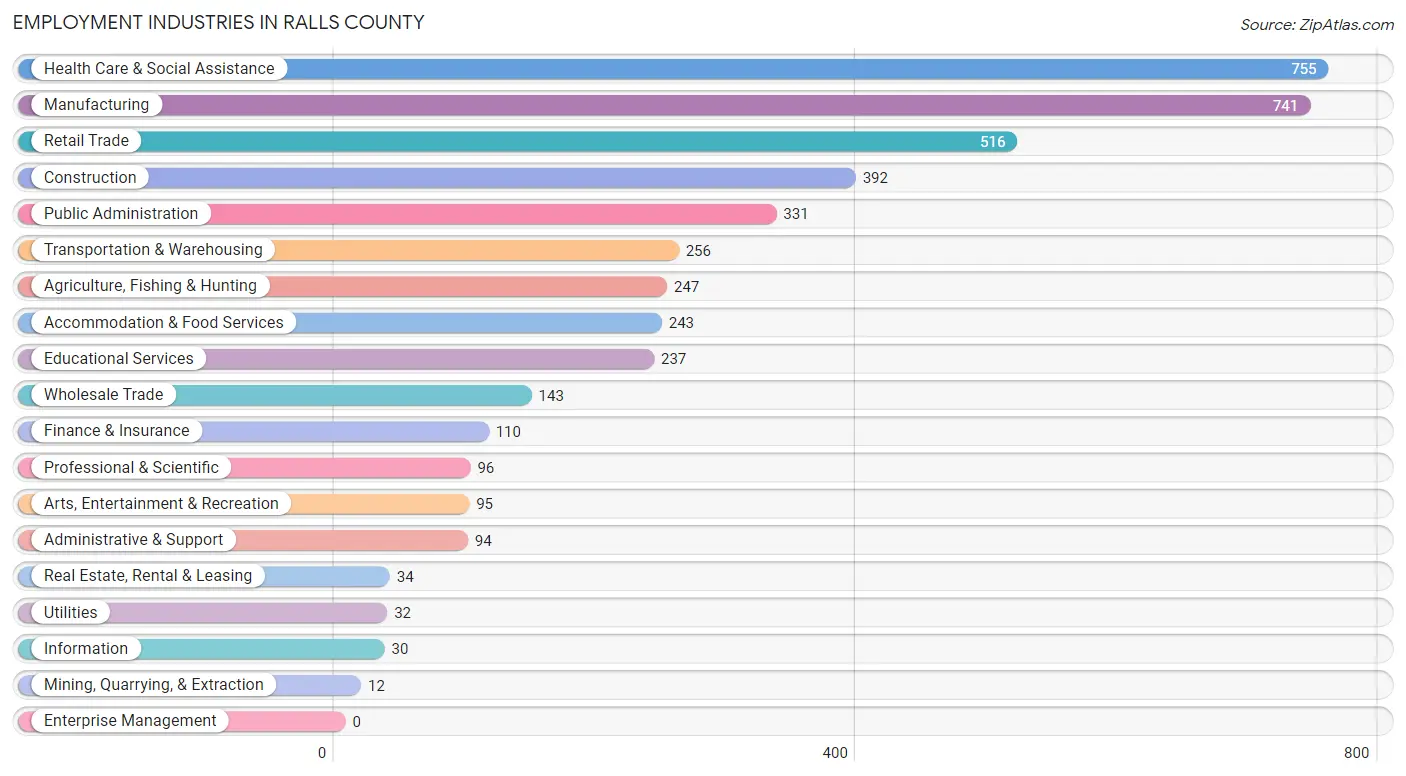
Employment Industries in Ralls County
The major employment industries in Ralls County include Health Care & Social Assistance (755 | 16.3%), Manufacturing (741 | 16.0%), Retail Trade (516 | 11.1%), Construction (392 | 8.5%), and Public Administration (331 | 7.1%).
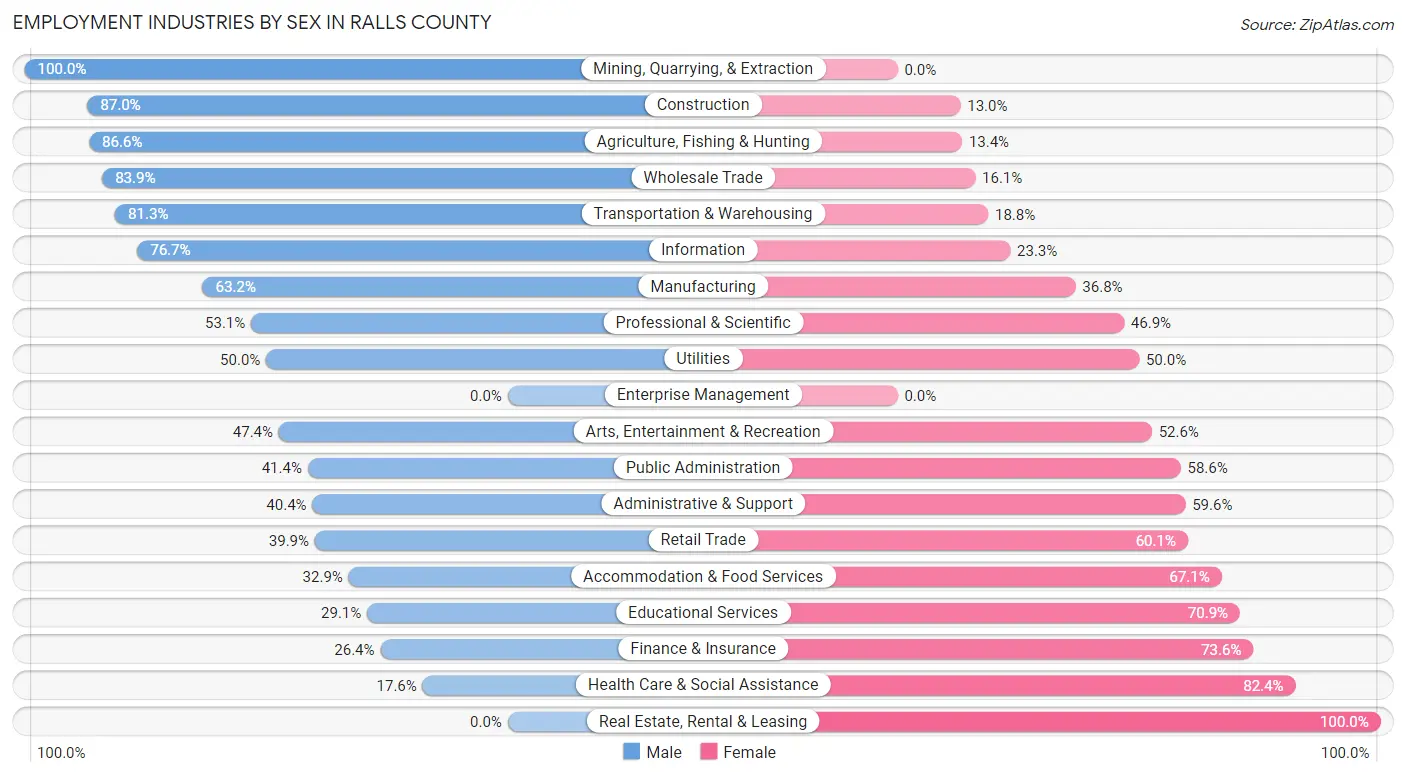
Employment Industries by Sex in Ralls County
The Ralls County industries that see more men than women are Mining, Quarrying, & Extraction (100.0%), Construction (87.0%), and Agriculture, Fishing & Hunting (86.6%), whereas the industries that tend to have a higher number of women are Real Estate, Rental & Leasing (100.0%), Health Care & Social Assistance (82.4%), and Finance & Insurance (73.6%).
| Industry | Male | Female |
| Agriculture, Fishing & Hunting | 214 (86.6%) | 33 (13.4%) |
| Mining, Quarrying, & Extraction | 12 (100.0%) | 0 (0.0%) |
| Construction | 341 (87.0%) | 51 (13.0%) |
| Manufacturing | 468 (63.2%) | 273 (36.8%) |
| Wholesale Trade | 120 (83.9%) | 23 (16.1%) |
| Retail Trade | 206 (39.9%) | 310 (60.1%) |
| Transportation & Warehousing | 208 (81.2%) | 48 (18.8%) |
| Utilities | 16 (50.0%) | 16 (50.0%) |
| Information | 23 (76.7%) | 7 (23.3%) |
| Finance & Insurance | 29 (26.4%) | 81 (73.6%) |
| Real Estate, Rental & Leasing | 0 (0.0%) | 34 (100.0%) |
| Professional & Scientific | 51 (53.1%) | 45 (46.9%) |
| Enterprise Management | 0 (0.0%) | 0 (0.0%) |
| Administrative & Support | 38 (40.4%) | 56 (59.6%) |
| Educational Services | 69 (29.1%) | 168 (70.9%) |
| Health Care & Social Assistance | 133 (17.6%) | 622 (82.4%) |
| Arts, Entertainment & Recreation | 45 (47.4%) | 50 (52.6%) |
| Accommodation & Food Services | 80 (32.9%) | 163 (67.1%) |
| Public Administration | 137 (41.4%) | 194 (58.6%) |
| Total | 2,326 (50.2%) | 2,311 (49.8%) |
Education in Ralls County
School Enrollment in Ralls County
The most common levels of schooling among the 2,002 students in Ralls County are middle school (617 | 30.8%), high school (498 | 24.9%), and elementary school (426 | 21.3%).
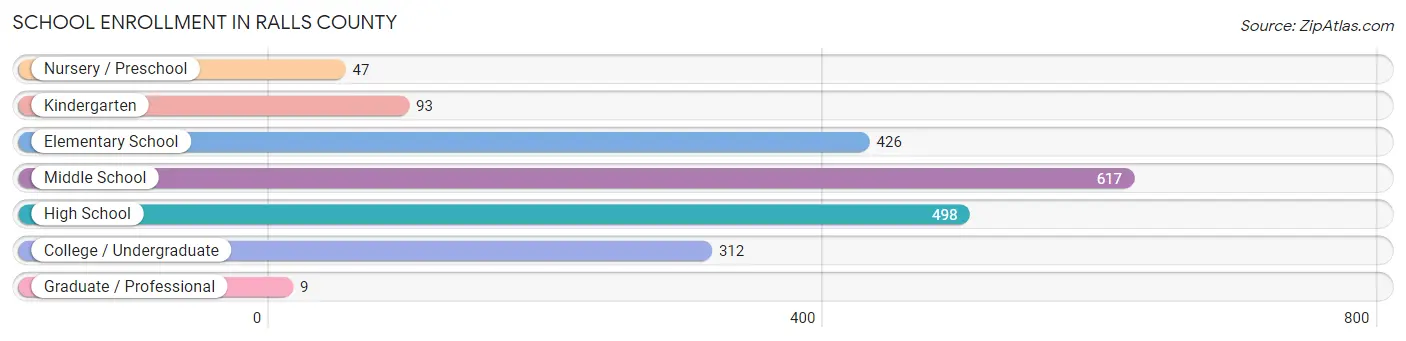
| School Level | # Students | % Students |
| Nursery / Preschool | 47 | 2.4% |
| Kindergarten | 93 | 4.6% |
| Elementary School | 426 | 21.3% |
| Middle School | 617 | 30.8% |
| High School | 498 | 24.9% |
| College / Undergraduate | 312 | 15.6% |
| Graduate / Professional | 9 | 0.4% |
| Total | 2,002 | 100.0% |
School Enrollment by Age by Funding Source in Ralls County
Out of a total of 2,002 students who are enrolled in schools in Ralls County, 376 (18.8%) attend a private institution, while the remaining 1,626 (81.2%) are enrolled in public schools. The age group of 3 to 4 year olds has the highest likelihood of being enrolled in private schools, with 23 (71.9% in the age bracket) enrolled. Conversely, the age group of 18 to 19 year olds has the lowest likelihood of being enrolled in a private school, with 253 (100.0% in the age bracket) attending a public institution.
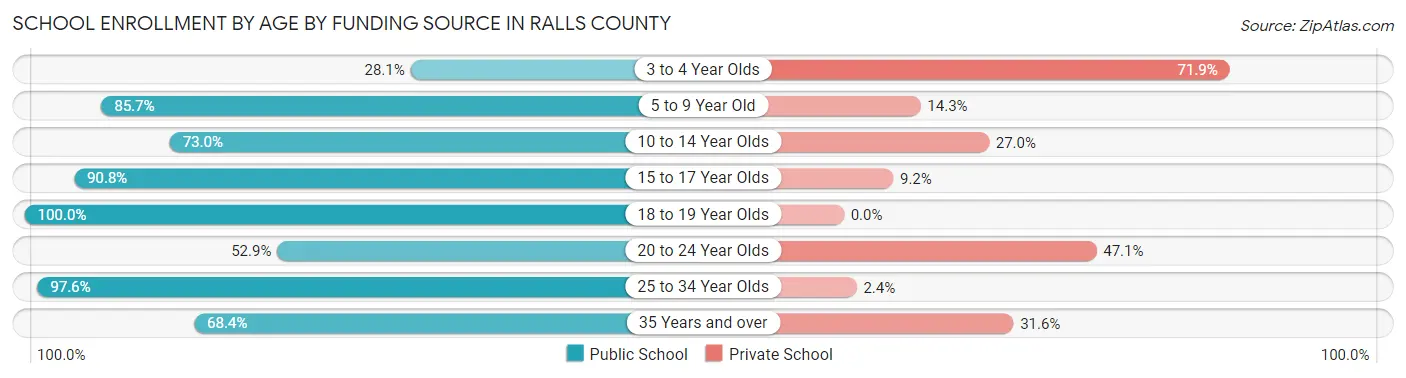
| Age Bracket | Public School | Private School |
| 3 to 4 Year Olds | 9 (28.1%) | 23 (71.9%) |
| 5 to 9 Year Old | 438 (85.7%) | 73 (14.3%) |
| 10 to 14 Year Olds | 467 (73.0%) | 173 (27.0%) |
| 15 to 17 Year Olds | 316 (90.8%) | 32 (9.2%) |
| 18 to 19 Year Olds | 253 (100.0%) | 0 (0.0%) |
| 20 to 24 Year Olds | 63 (52.9%) | 56 (47.1%) |
| 25 to 34 Year Olds | 41 (97.6%) | 1 (2.4%) |
| 35 Years and over | 39 (68.4%) | 18 (31.6%) |
| Total | 1,626 (81.2%) | 376 (18.8%) |
Educational Attainment by Field of Study in Ralls County
Education (352 | 28.9%), science & technology (245 | 20.1%), business (177 | 14.5%), bio, nature & agricultural (147 | 12.1%), and arts & humanities (62 | 5.1%) are the most common fields of study among 1,219 individuals in Ralls County who have obtained a bachelor's degree or higher.
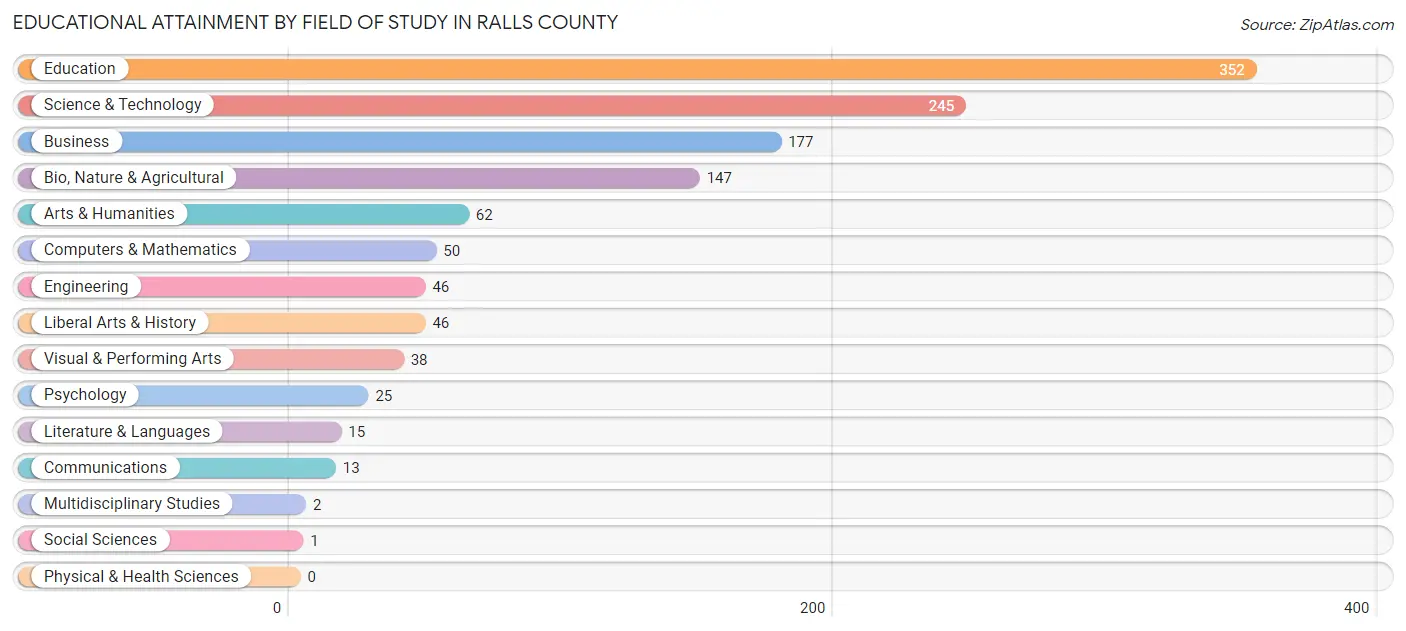
| Field of Study | # Graduates | % Graduates |
| Computers & Mathematics | 50 | 4.1% |
| Bio, Nature & Agricultural | 147 | 12.1% |
| Physical & Health Sciences | 0 | 0.0% |
| Psychology | 25 | 2.1% |
| Social Sciences | 1 | 0.1% |
| Engineering | 46 | 3.8% |
| Multidisciplinary Studies | 2 | 0.2% |
| Science & Technology | 245 | 20.1% |
| Business | 177 | 14.5% |
| Education | 352 | 28.9% |
| Literature & Languages | 15 | 1.2% |
| Liberal Arts & History | 46 | 3.8% |
| Visual & Performing Arts | 38 | 3.1% |
| Communications | 13 | 1.1% |
| Arts & Humanities | 62 | 5.1% |
| Total | 1,219 | 100.0% |
Transportation & Commute in Ralls County
Vehicle Availability by Sex in Ralls County
The most prevalent vehicle ownership categories in Ralls County are males with 2 vehicles (963, accounting for 42.0%) and females with 2 vehicles (894, making up 43.3%).
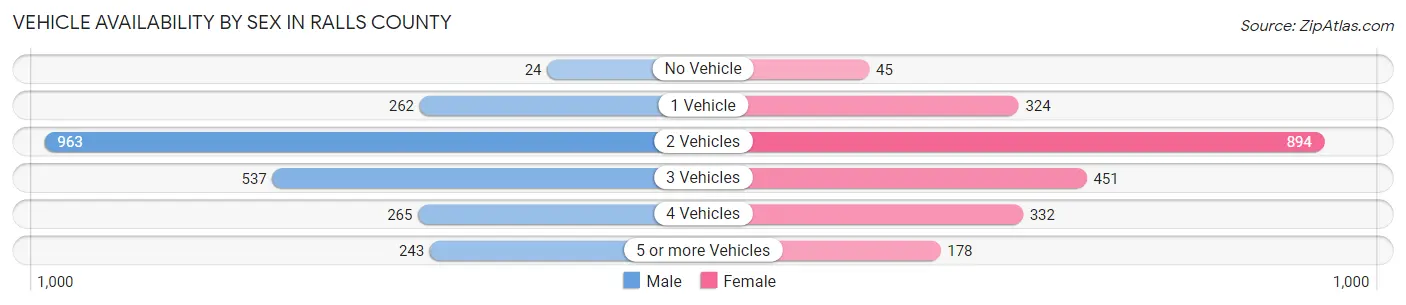
| Vehicles Available | Male | Female |
| No Vehicle | 24 (1.1%) | 45 (2.0%) |
| 1 Vehicle | 262 (11.4%) | 324 (14.6%) |
| 2 Vehicles | 963 (42.0%) | 894 (40.2%) |
| 3 Vehicles | 537 (23.4%) | 451 (20.3%) |
| 4 Vehicles | 265 (11.6%) | 332 (14.9%) |
| 5 or more Vehicles | 243 (10.6%) | 178 (8.0%) |
| Total | 2,294 (100.0%) | 2,224 (100.0%) |
Commute Time in Ralls County
The most frequently occuring commute durations in Ralls County are 10 to 14 minutes (924 commuters, 21.7%), 15 to 19 minutes (829 commuters, 19.4%), and 20 to 24 minutes (745 commuters, 17.5%).
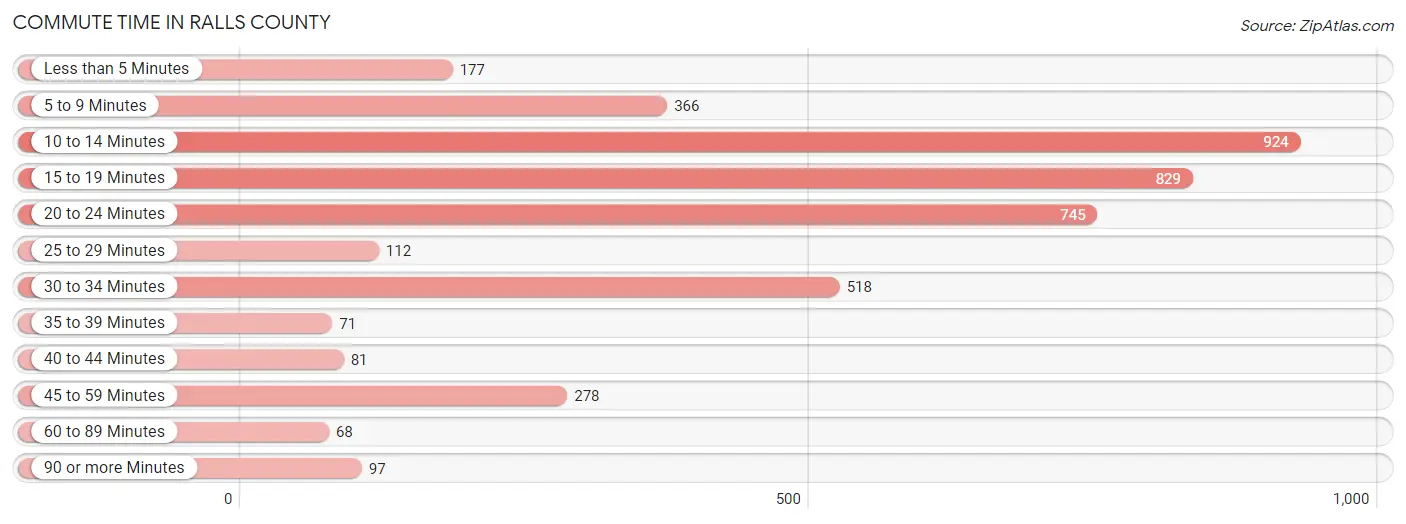
| Commute Time | # Commuters | % Commuters |
| Less than 5 Minutes | 177 | 4.2% |
| 5 to 9 Minutes | 366 | 8.6% |
| 10 to 14 Minutes | 924 | 21.7% |
| 15 to 19 Minutes | 829 | 19.4% |
| 20 to 24 Minutes | 745 | 17.5% |
| 25 to 29 Minutes | 112 | 2.6% |
| 30 to 34 Minutes | 518 | 12.1% |
| 35 to 39 Minutes | 71 | 1.7% |
| 40 to 44 Minutes | 81 | 1.9% |
| 45 to 59 Minutes | 278 | 6.5% |
| 60 to 89 Minutes | 68 | 1.6% |
| 90 or more Minutes | 97 | 2.3% |
Commute Time by Sex in Ralls County
The most common commute times in Ralls County are 10 to 14 minutes (494 commuters, 23.0%) for males and 15 to 19 minutes (548 commuters, 25.9%) for females.
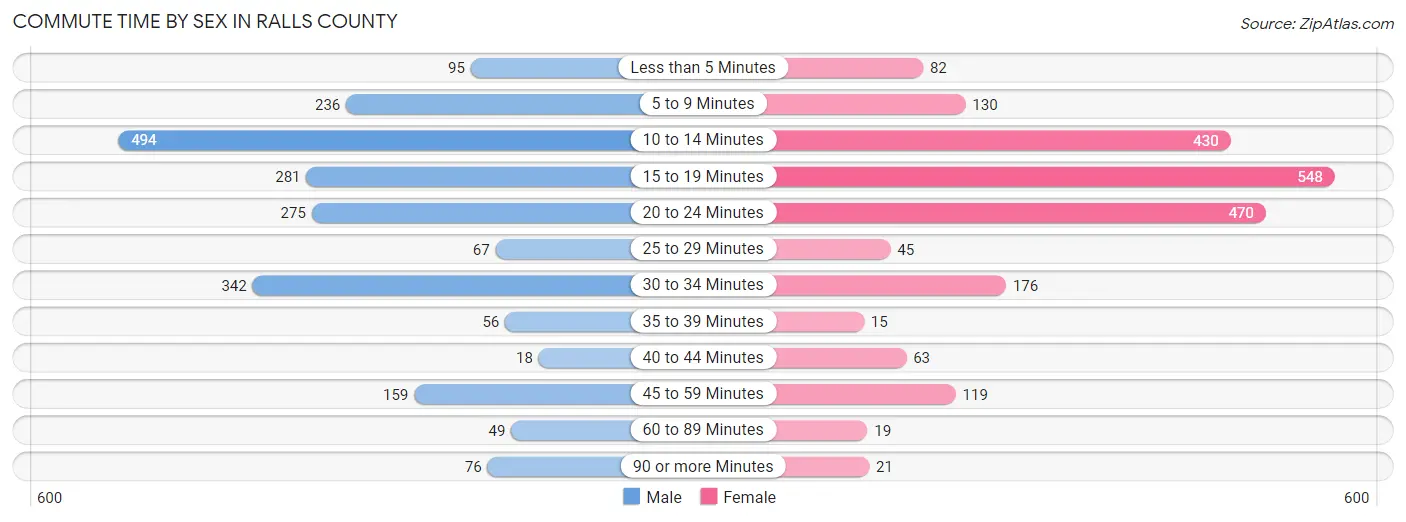
| Commute Time | Male | Female |
| Less than 5 Minutes | 95 (4.4%) | 82 (3.9%) |
| 5 to 9 Minutes | 236 (11.0%) | 130 (6.1%) |
| 10 to 14 Minutes | 494 (23.0%) | 430 (20.3%) |
| 15 to 19 Minutes | 281 (13.1%) | 548 (25.9%) |
| 20 to 24 Minutes | 275 (12.8%) | 470 (22.2%) |
| 25 to 29 Minutes | 67 (3.1%) | 45 (2.1%) |
| 30 to 34 Minutes | 342 (15.9%) | 176 (8.3%) |
| 35 to 39 Minutes | 56 (2.6%) | 15 (0.7%) |
| 40 to 44 Minutes | 18 (0.8%) | 63 (3.0%) |
| 45 to 59 Minutes | 159 (7.4%) | 119 (5.6%) |
| 60 to 89 Minutes | 49 (2.3%) | 19 (0.9%) |
| 90 or more Minutes | 76 (3.5%) | 21 (1.0%) |
Time of Departure to Work by Sex in Ralls County
The most frequent times of departure to work in Ralls County are 7:30 AM to 7:59 AM (343, 16.0%) for males and 7:30 AM to 7:59 AM (531, 25.1%) for females.
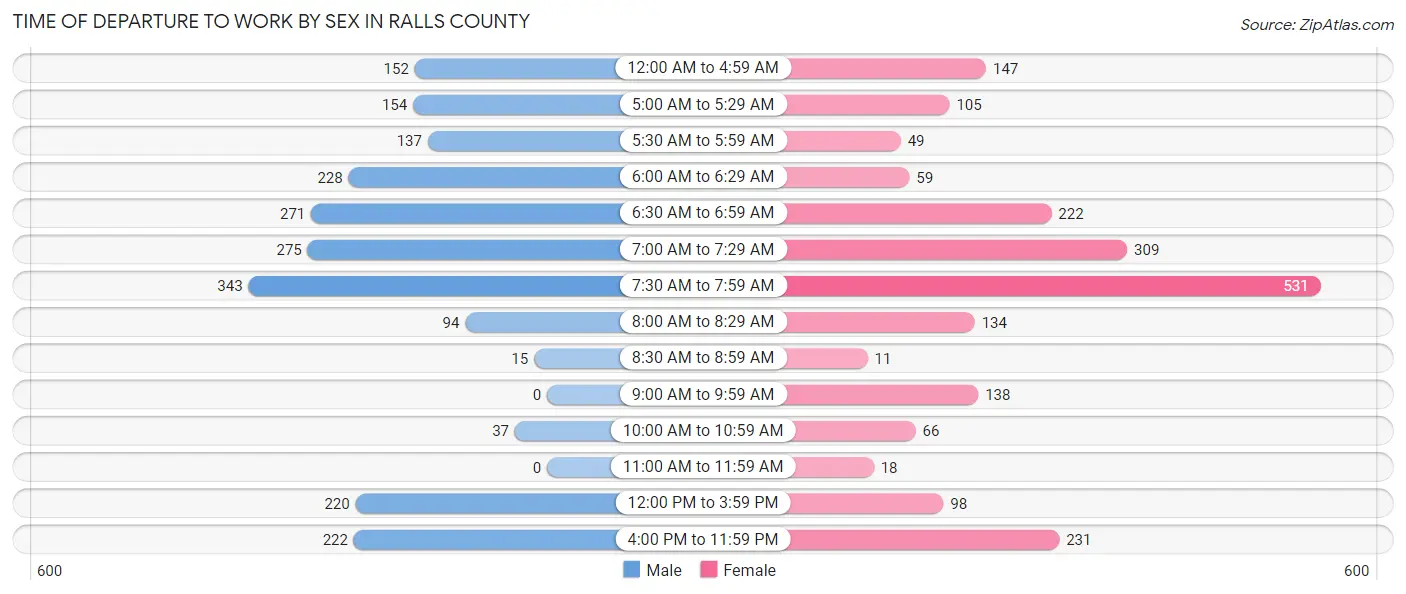
| Time of Departure | Male | Female |
| 12:00 AM to 4:59 AM | 152 (7.1%) | 147 (6.9%) |
| 5:00 AM to 5:29 AM | 154 (7.2%) | 105 (5.0%) |
| 5:30 AM to 5:59 AM | 137 (6.4%) | 49 (2.3%) |
| 6:00 AM to 6:29 AM | 228 (10.6%) | 59 (2.8%) |
| 6:30 AM to 6:59 AM | 271 (12.6%) | 222 (10.5%) |
| 7:00 AM to 7:29 AM | 275 (12.8%) | 309 (14.6%) |
| 7:30 AM to 7:59 AM | 343 (16.0%) | 531 (25.1%) |
| 8:00 AM to 8:29 AM | 94 (4.4%) | 134 (6.3%) |
| 8:30 AM to 8:59 AM | 15 (0.7%) | 11 (0.5%) |
| 9:00 AM to 9:59 AM | 0 (0.0%) | 138 (6.5%) |
| 10:00 AM to 10:59 AM | 37 (1.7%) | 66 (3.1%) |
| 11:00 AM to 11:59 AM | 0 (0.0%) | 18 (0.9%) |
| 12:00 PM to 3:59 PM | 220 (10.2%) | 98 (4.6%) |
| 4:00 PM to 11:59 PM | 222 (10.3%) | 231 (10.9%) |
| Total | 2,148 (100.0%) | 2,118 (100.0%) |
Housing Occupancy in Ralls County
Occupancy by Ownership in Ralls County
Of the total 4,014 dwellings in Ralls County, owner-occupied units account for 3,491 (87.0%), while renter-occupied units make up 523 (13.0%).
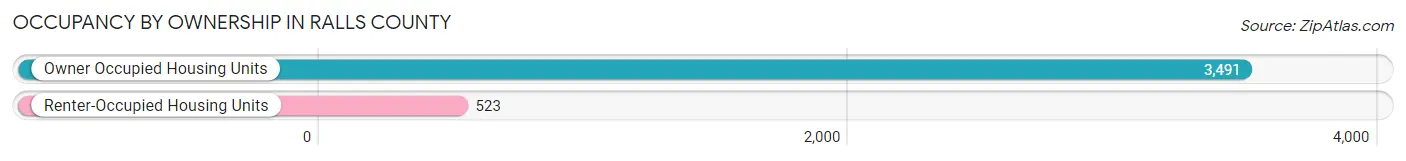
| Occupancy | # Housing Units | % Housing Units |
| Owner Occupied Housing Units | 3,491 | 87.0% |
| Renter-Occupied Housing Units | 523 | 13.0% |
| Total Occupied Housing Units | 4,014 | 100.0% |
Occupancy by Household Size in Ralls County
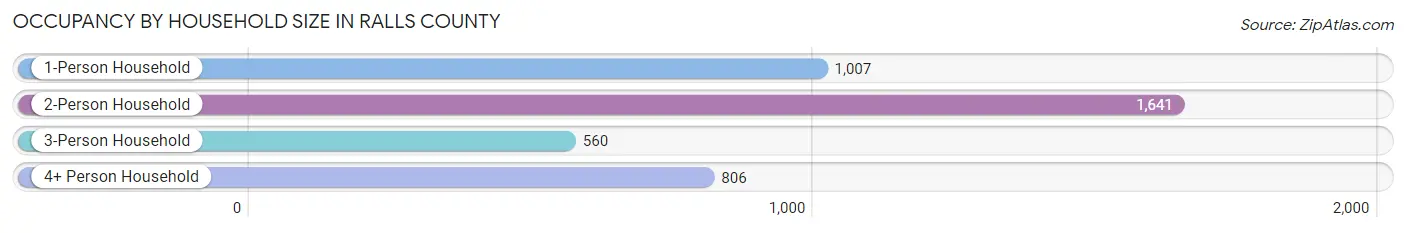
| Household Size | # Housing Units | % Housing Units |
| 1-Person Household | 1,007 | 25.1% |
| 2-Person Household | 1,641 | 40.9% |
| 3-Person Household | 560 | 14.0% |
| 4+ Person Household | 806 | 20.1% |
| Total Housing Units | 4,014 | 100.0% |
Occupancy by Ownership by Household Size in Ralls County
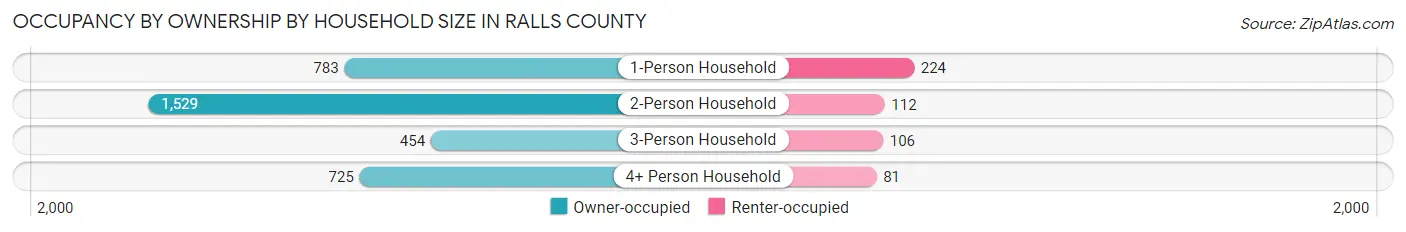
| Household Size | Owner-occupied | Renter-occupied |
| 1-Person Household | 783 (77.8%) | 224 (22.2%) |
| 2-Person Household | 1,529 (93.2%) | 112 (6.8%) |
| 3-Person Household | 454 (81.1%) | 106 (18.9%) |
| 4+ Person Household | 725 (89.9%) | 81 (10.1%) |
| Total Housing Units | 3,491 (87.0%) | 523 (13.0%) |
Occupancy by Educational Attainment in Ralls County
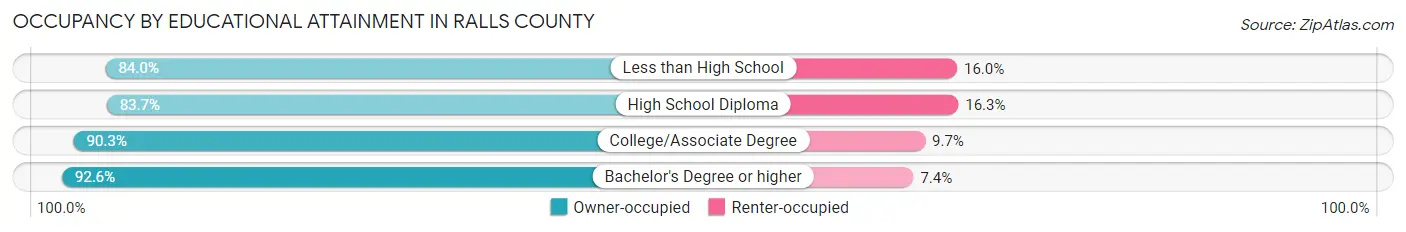
| Household Size | Owner-occupied | Renter-occupied |
| Less than High School | 246 (84.0%) | 47 (16.0%) |
| High School Diploma | 1,671 (83.7%) | 325 (16.3%) |
| College/Associate Degree | 922 (90.3%) | 99 (9.7%) |
| Bachelor's Degree or higher | 652 (92.6%) | 52 (7.4%) |
Occupancy by Age of Householder in Ralls County
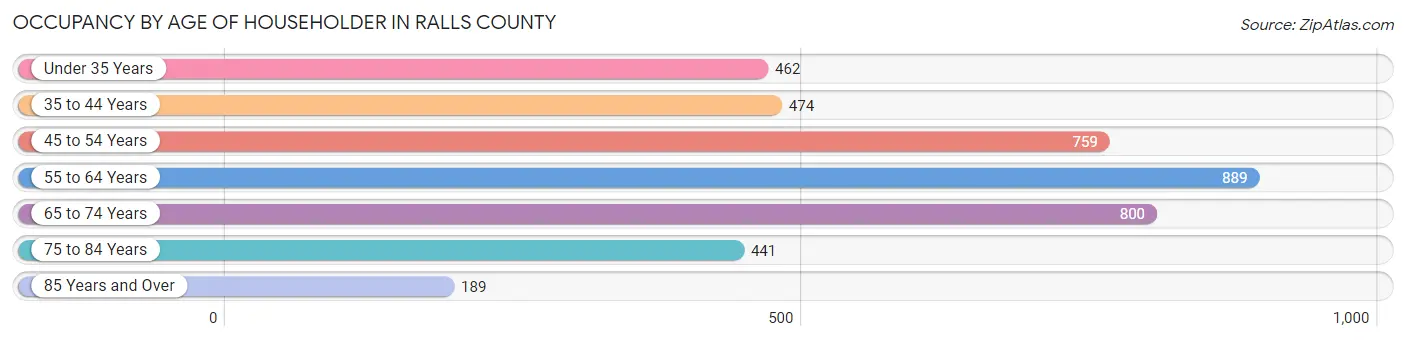
| Age Bracket | # Households | % Households |
| Under 35 Years | 462 | 11.5% |
| 35 to 44 Years | 474 | 11.8% |
| 45 to 54 Years | 759 | 18.9% |
| 55 to 64 Years | 889 | 22.2% |
| 65 to 74 Years | 800 | 19.9% |
| 75 to 84 Years | 441 | 11.0% |
| 85 Years and Over | 189 | 4.7% |
| Total | 4,014 | 100.0% |
Housing Finances in Ralls County
Median Income by Occupancy in Ralls County
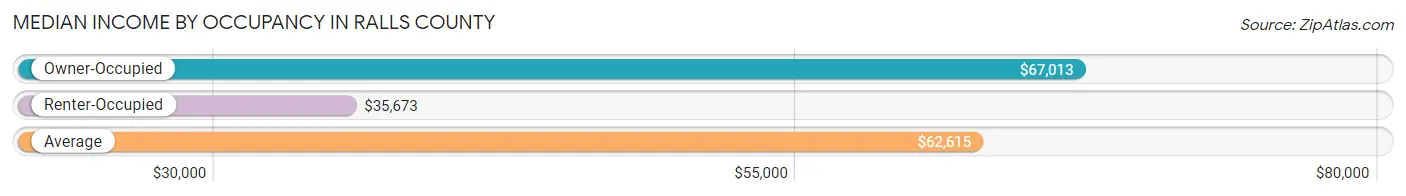
| Occupancy Type | # Households | Median Income |
| Owner-Occupied | 3,491 (87.0%) | $67,013 |
| Renter-Occupied | 523 (13.0%) | $35,673 |
| Average | 4,014 (100.0%) | $62,615 |
Occupancy by Householder Income Bracket in Ralls County
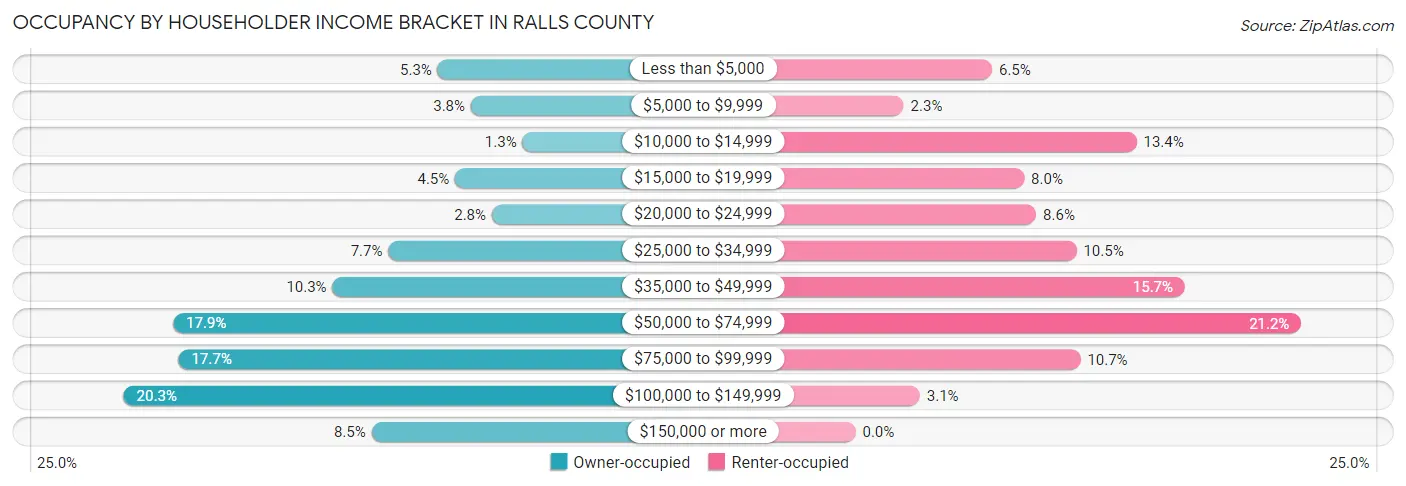
| Income Bracket | Owner-occupied | Renter-occupied |
| Less than $5,000 | 186 (5.3%) | 34 (6.5%) |
| $5,000 to $9,999 | 131 (3.7%) | 12 (2.3%) |
| $10,000 to $14,999 | 45 (1.3%) | 70 (13.4%) |
| $15,000 to $19,999 | 157 (4.5%) | 42 (8.0%) |
| $20,000 to $24,999 | 96 (2.8%) | 45 (8.6%) |
| $25,000 to $34,999 | 268 (7.7%) | 55 (10.5%) |
| $35,000 to $49,999 | 361 (10.3%) | 82 (15.7%) |
| $50,000 to $74,999 | 626 (17.9%) | 111 (21.2%) |
| $75,000 to $99,999 | 617 (17.7%) | 56 (10.7%) |
| $100,000 to $149,999 | 708 (20.3%) | 16 (3.1%) |
| $150,000 or more | 296 (8.5%) | 0 (0.0%) |
| Total | 3,491 (100.0%) | 523 (100.0%) |
Monthly Housing Cost Tiers in Ralls County
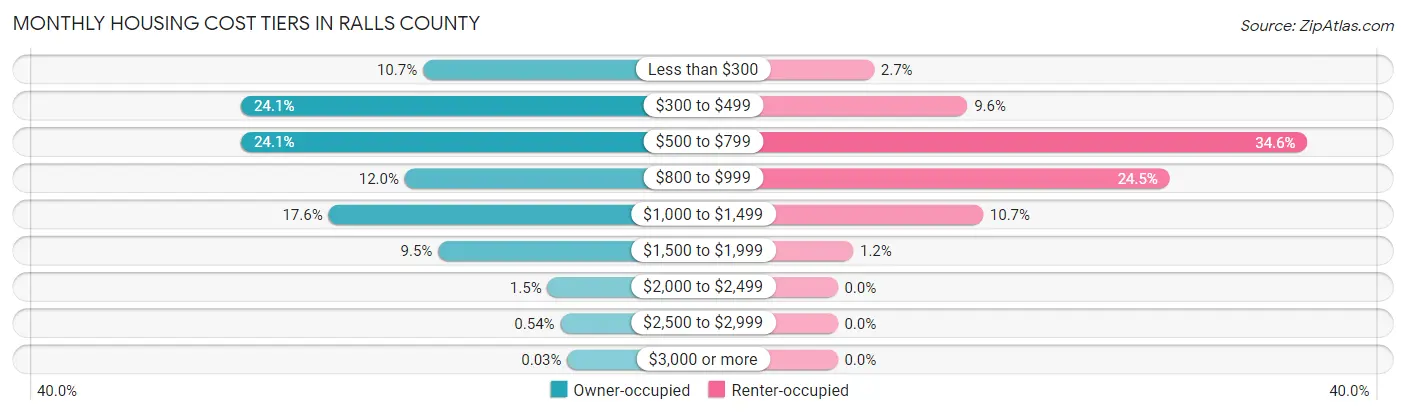
| Monthly Cost | Owner-occupied | Renter-occupied |
| Less than $300 | 372 (10.7%) | 14 (2.7%) |
| $300 to $499 | 840 (24.1%) | 50 (9.6%) |
| $500 to $799 | 840 (24.1%) | 181 (34.6%) |
| $800 to $999 | 419 (12.0%) | 128 (24.5%) |
| $1,000 to $1,499 | 615 (17.6%) | 56 (10.7%) |
| $1,500 to $1,999 | 333 (9.5%) | 6 (1.1%) |
| $2,000 to $2,499 | 52 (1.5%) | 0 (0.0%) |
| $2,500 to $2,999 | 19 (0.5%) | 0 (0.0%) |
| $3,000 or more | 1 (0.0%) | 0 (0.0%) |
| Total | 3,491 (100.0%) | 523 (100.0%) |
Physical Housing Characteristics in Ralls County
Housing Structures in Ralls County
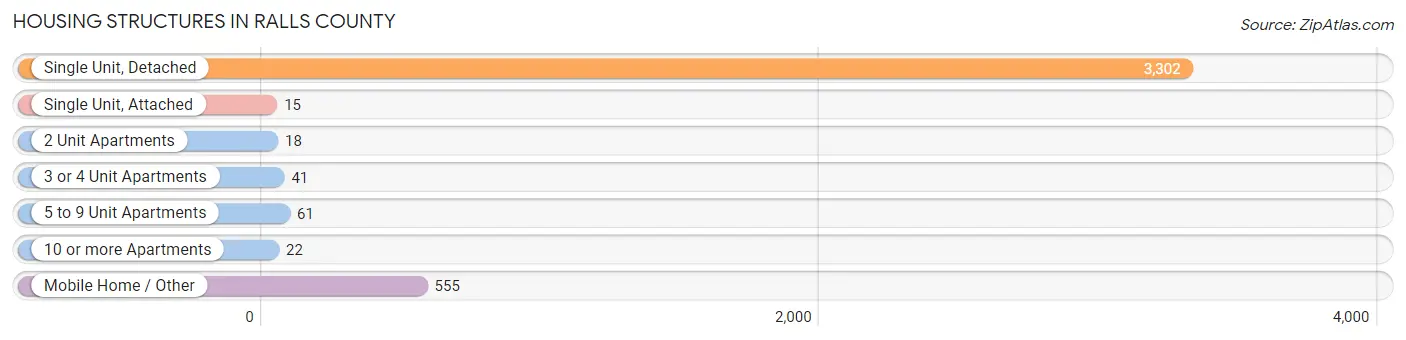
| Structure Type | # Housing Units | % Housing Units |
| Single Unit, Detached | 3,302 | 82.3% |
| Single Unit, Attached | 15 | 0.4% |
| 2 Unit Apartments | 18 | 0.4% |
| 3 or 4 Unit Apartments | 41 | 1.0% |
| 5 to 9 Unit Apartments | 61 | 1.5% |
| 10 or more Apartments | 22 | 0.5% |
| Mobile Home / Other | 555 | 13.8% |
| Total | 4,014 | 100.0% |
Housing Structures by Occupancy in Ralls County
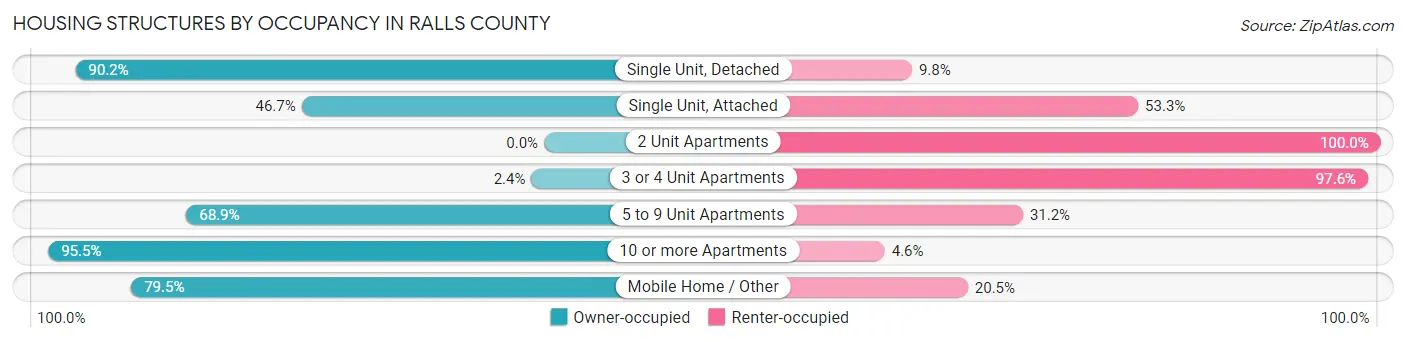
| Structure Type | Owner-occupied | Renter-occupied |
| Single Unit, Detached | 2,979 (90.2%) | 323 (9.8%) |
| Single Unit, Attached | 7 (46.7%) | 8 (53.3%) |
| 2 Unit Apartments | 0 (0.0%) | 18 (100.0%) |
| 3 or 4 Unit Apartments | 1 (2.4%) | 40 (97.6%) |
| 5 to 9 Unit Apartments | 42 (68.9%) | 19 (31.1%) |
| 10 or more Apartments | 21 (95.5%) | 1 (4.5%) |
| Mobile Home / Other | 441 (79.5%) | 114 (20.5%) |
| Total | 3,491 (87.0%) | 523 (13.0%) |
Housing Structures by Number of Rooms in Ralls County
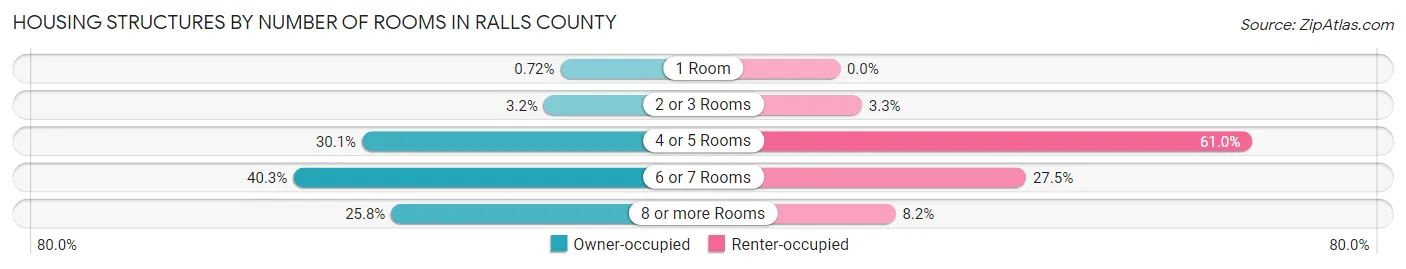
| Number of Rooms | Owner-occupied | Renter-occupied |
| 1 Room | 25 (0.7%) | 0 (0.0%) |
| 2 or 3 Rooms | 111 (3.2%) | 17 (3.3%) |
| 4 or 5 Rooms | 1,050 (30.1%) | 319 (61.0%) |
| 6 or 7 Rooms | 1,406 (40.3%) | 144 (27.5%) |
| 8 or more Rooms | 899 (25.8%) | 43 (8.2%) |
| Total | 3,491 (100.0%) | 523 (100.0%) |
Housing Structure by Heating Type in Ralls County
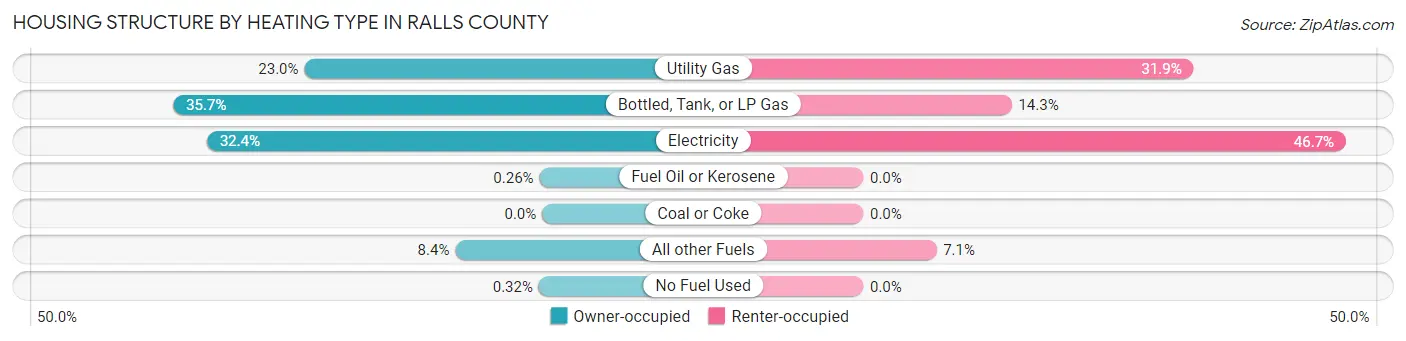
| Heating Type | Owner-occupied | Renter-occupied |
| Utility Gas | 802 (23.0%) | 167 (31.9%) |
| Bottled, Tank, or LP Gas | 1,245 (35.7%) | 75 (14.3%) |
| Electricity | 1,131 (32.4%) | 244 (46.7%) |
| Fuel Oil or Kerosene | 9 (0.3%) | 0 (0.0%) |
| Coal or Coke | 0 (0.0%) | 0 (0.0%) |
| All other Fuels | 293 (8.4%) | 37 (7.1%) |
| No Fuel Used | 11 (0.3%) | 0 (0.0%) |
| Total | 3,491 (100.0%) | 523 (100.0%) |
Household Vehicle Usage in Ralls County
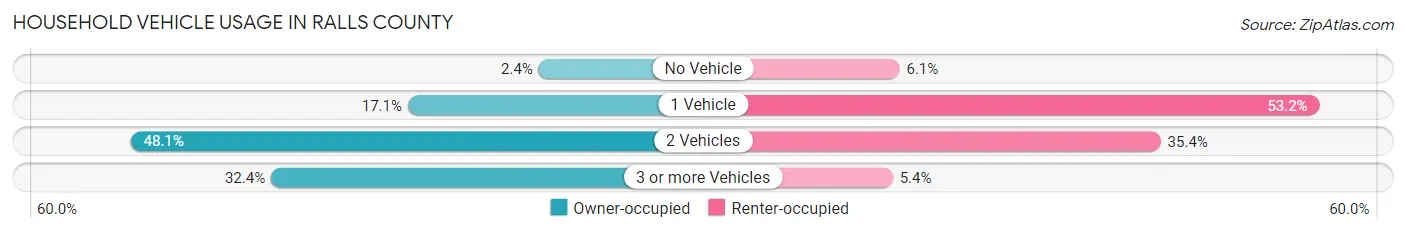
| Vehicles per Household | Owner-occupied | Renter-occupied |
| No Vehicle | 84 (2.4%) | 32 (6.1%) |
| 1 Vehicle | 596 (17.1%) | 278 (53.1%) |
| 2 Vehicles | 1,680 (48.1%) | 185 (35.4%) |
| 3 or more Vehicles | 1,131 (32.4%) | 28 (5.3%) |
| Total | 3,491 (100.0%) | 523 (100.0%) |
Real Estate & Mortgages in Ralls County
Real Estate and Mortgage Overview in Ralls County
| Characteristic | Without Mortgage | With Mortgage |
| Housing Units | 2,055 | 1,436 |
| Median Property Value | $128,800 | $152,100 |
| Median Household Income | $57,605 | $198 |
| Monthly Housing Costs | $448 | $1 |
| Real Estate Taxes | $1,044 | $32 |
Property Value by Mortgage Status in Ralls County
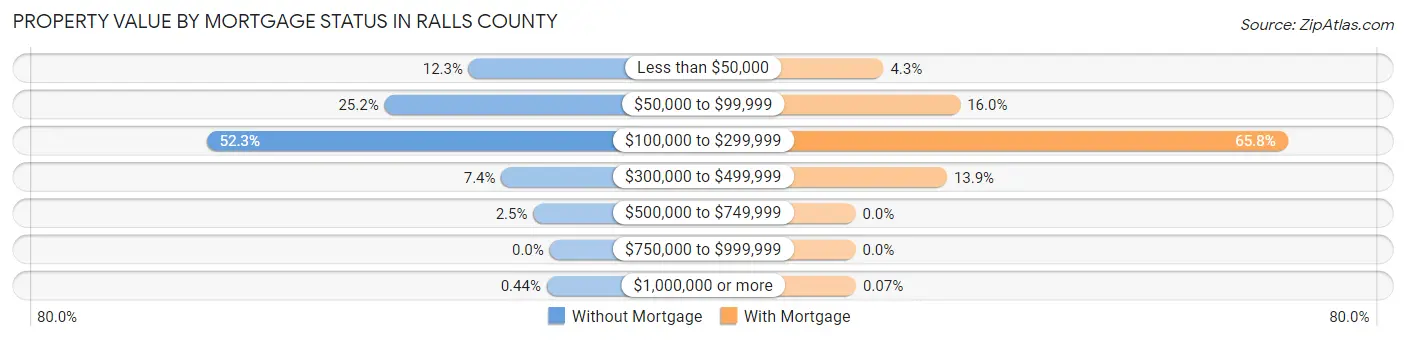
| Property Value | Without Mortgage | With Mortgage |
| Less than $50,000 | 253 (12.3%) | 61 (4.3%) |
| $50,000 to $99,999 | 517 (25.2%) | 229 (16.0%) |
| $100,000 to $299,999 | 1,074 (52.3%) | 945 (65.8%) |
| $300,000 to $499,999 | 151 (7.3%) | 200 (13.9%) |
| $500,000 to $749,999 | 51 (2.5%) | 0 (0.0%) |
| $750,000 to $999,999 | 0 (0.0%) | 0 (0.0%) |
| $1,000,000 or more | 9 (0.4%) | 1 (0.1%) |
| Total | 2,055 (100.0%) | 1,436 (100.0%) |
Household Income by Mortgage Status in Ralls County
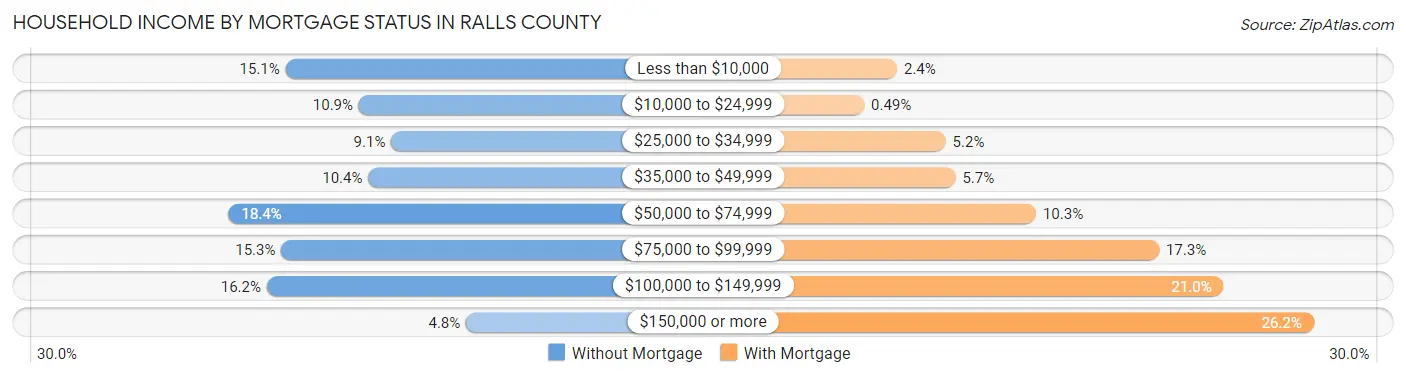
| Household Income | Without Mortgage | With Mortgage |
| Less than $10,000 | 310 (15.1%) | 34 (2.4%) |
| $10,000 to $24,999 | 224 (10.9%) | 7 (0.5%) |
| $25,000 to $34,999 | 186 (9.0%) | 74 (5.1%) |
| $35,000 to $49,999 | 213 (10.4%) | 82 (5.7%) |
| $50,000 to $74,999 | 377 (18.3%) | 148 (10.3%) |
| $75,000 to $99,999 | 315 (15.3%) | 249 (17.3%) |
| $100,000 to $149,999 | 332 (16.2%) | 302 (21.0%) |
| $150,000 or more | 98 (4.8%) | 376 (26.2%) |
| Total | 2,055 (100.0%) | 1,436 (100.0%) |
Property Value to Household Income Ratio in Ralls County
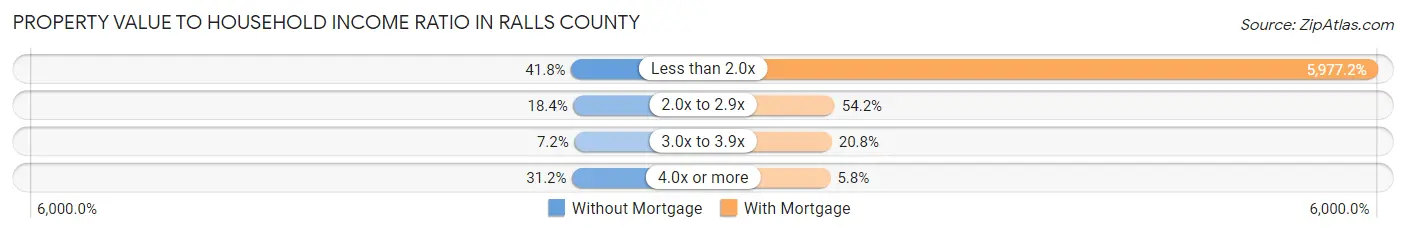
| Value-to-Income Ratio | Without Mortgage | With Mortgage |
| Less than 2.0x | 858 (41.7%) | 85,833 (5,977.2%) |
| 2.0x to 2.9x | 378 (18.4%) | 778 (54.2%) |
| 3.0x to 3.9x | 148 (7.2%) | 299 (20.8%) |
| 4.0x or more | 641 (31.2%) | 83 (5.8%) |
| Total | 2,055 (100.0%) | 1,436 (100.0%) |
Real Estate Taxes by Mortgage Status in Ralls County
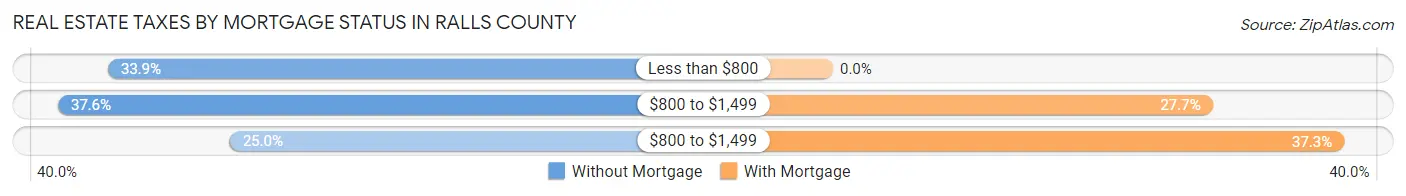
| Property Taxes | Without Mortgage | With Mortgage |
| Less than $800 | 697 (33.9%) | 0 (0.0%) |
| $800 to $1,499 | 772 (37.6%) | 398 (27.7%) |
| $800 to $1,499 | 514 (25.0%) | 536 (37.3%) |
| Total | 2,055 (100.0%) | 1,436 (100.0%) |
Health & Disability in Ralls County
Health Insurance Coverage by Age in Ralls County
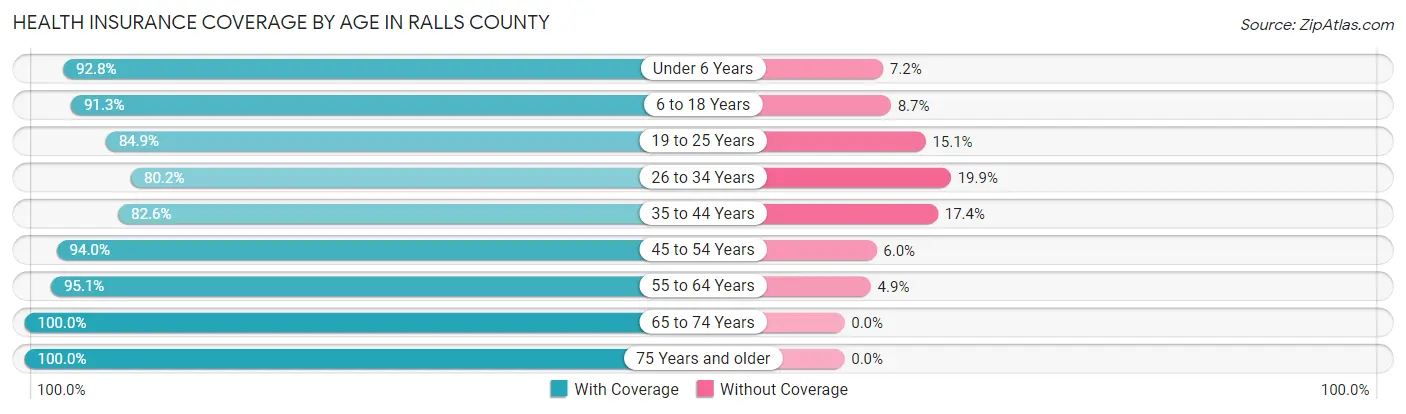
| Age Bracket | With Coverage | Without Coverage |
| Under 6 Years | 619 (92.8%) | 48 (7.2%) |
| 6 to 18 Years | 1,571 (91.3%) | 149 (8.7%) |
| 19 to 25 Years | 516 (84.9%) | 92 (15.1%) |
| 26 to 34 Years | 747 (80.1%) | 185 (19.9%) |
| 35 to 44 Years | 938 (82.6%) | 198 (17.4%) |
| 45 to 54 Years | 1,241 (94.0%) | 79 (6.0%) |
| 55 to 64 Years | 1,547 (95.1%) | 80 (4.9%) |
| 65 to 74 Years | 1,360 (100.0%) | 0 (0.0%) |
| 75 Years and older | 923 (100.0%) | 0 (0.0%) |
| Total | 9,462 (91.9%) | 831 (8.1%) |
Health Insurance Coverage by Citizenship Status in Ralls County
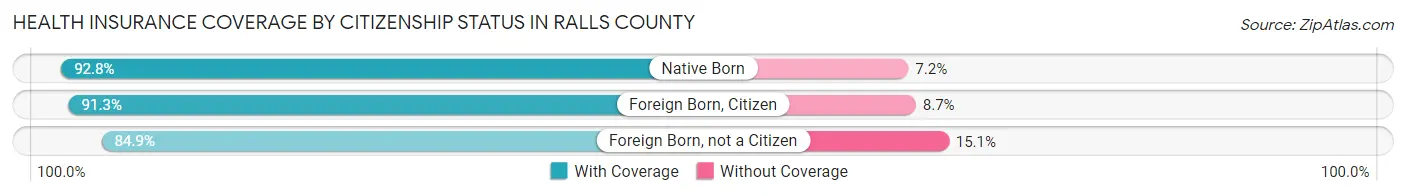
| Citizenship Status | With Coverage | Without Coverage |
| Native Born | 619 (92.8%) | 48 (7.2%) |
| Foreign Born, Citizen | 1,571 (91.3%) | 149 (8.7%) |
| Foreign Born, not a Citizen | 516 (84.9%) | 92 (15.1%) |
Health Insurance Coverage by Household Income in Ralls County
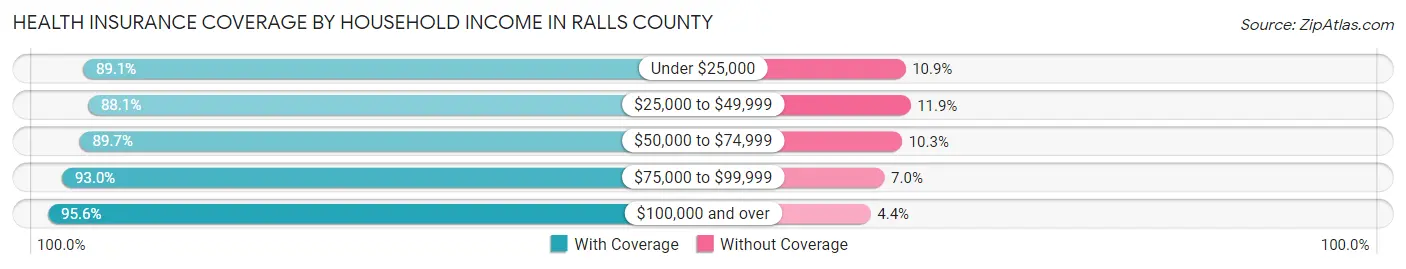
| Household Income | With Coverage | Without Coverage |
| Under $25,000 | 1,189 (89.1%) | 146 (10.9%) |
| $25,000 to $49,999 | 1,431 (88.1%) | 193 (11.9%) |
| $50,000 to $74,999 | 1,856 (89.7%) | 213 (10.3%) |
| $75,000 to $99,999 | 1,715 (93.0%) | 129 (7.0%) |
| $100,000 and over | 3,244 (95.6%) | 150 (4.4%) |
Public vs Private Health Insurance Coverage by Age in Ralls County
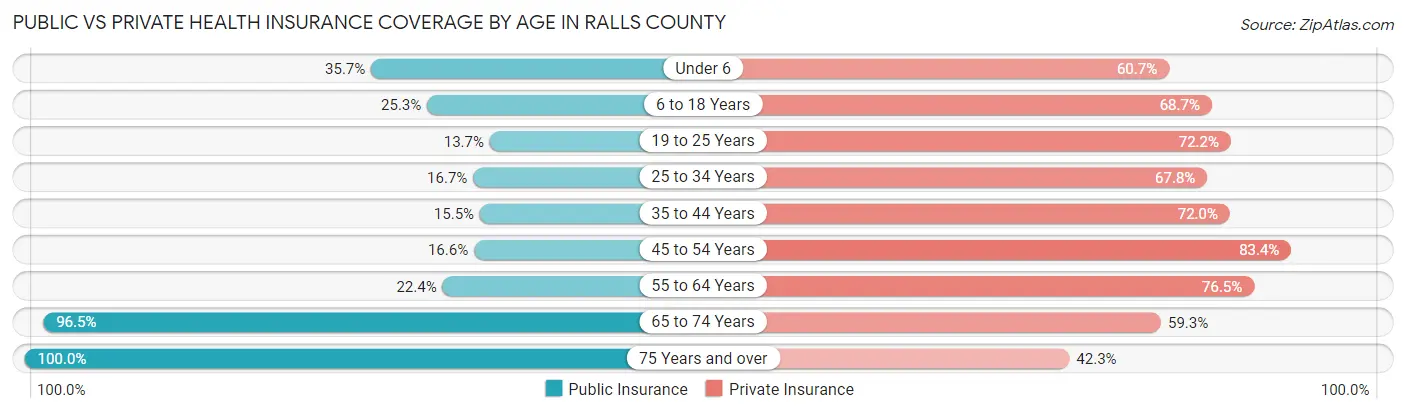
| Age Bracket | Public Insurance | Private Insurance |
| Under 6 | 238 (35.7%) | 405 (60.7%) |
| 6 to 18 Years | 435 (25.3%) | 1,181 (68.7%) |
| 19 to 25 Years | 83 (13.7%) | 439 (72.2%) |
| 25 to 34 Years | 156 (16.7%) | 632 (67.8%) |
| 35 to 44 Years | 176 (15.5%) | 818 (72.0%) |
| 45 to 54 Years | 219 (16.6%) | 1,101 (83.4%) |
| 55 to 64 Years | 365 (22.4%) | 1,245 (76.5%) |
| 65 to 74 Years | 1,313 (96.5%) | 806 (59.3%) |
| 75 Years and over | 923 (100.0%) | 390 (42.2%) |
| Total | 3,908 (38.0%) | 7,017 (68.2%) |
Disability Status by Sex by Age in Ralls County
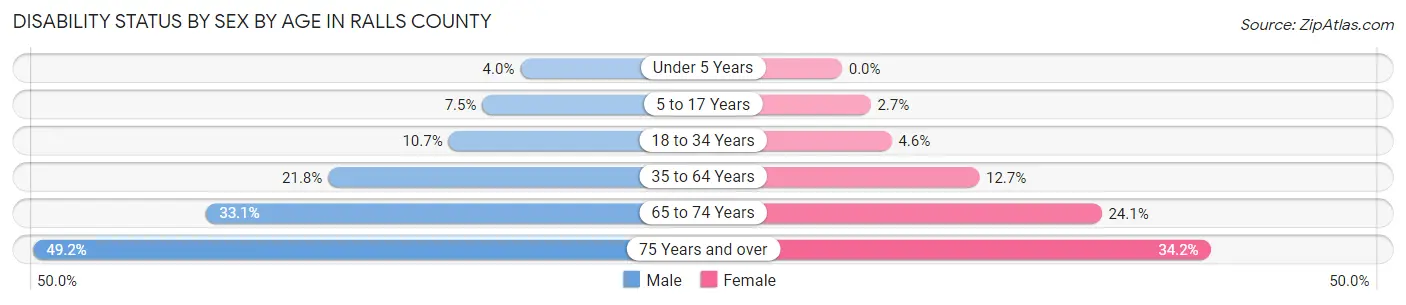
| Age Bracket | Male | Female |
| Under 5 Years | 10 (4.0%) | 0 (0.0%) |
| 5 to 17 Years | 66 (7.5%) | 20 (2.7%) |
| 18 to 34 Years | 100 (10.7%) | 38 (4.6%) |
| 35 to 64 Years | 456 (21.8%) | 254 (12.7%) |
| 65 to 74 Years | 221 (33.1%) | 167 (24.1%) |
| 75 Years and over | 211 (49.2%) | 169 (34.2%) |
Disability Class by Sex by Age in Ralls County
Disability Class: Hearing Difficulty
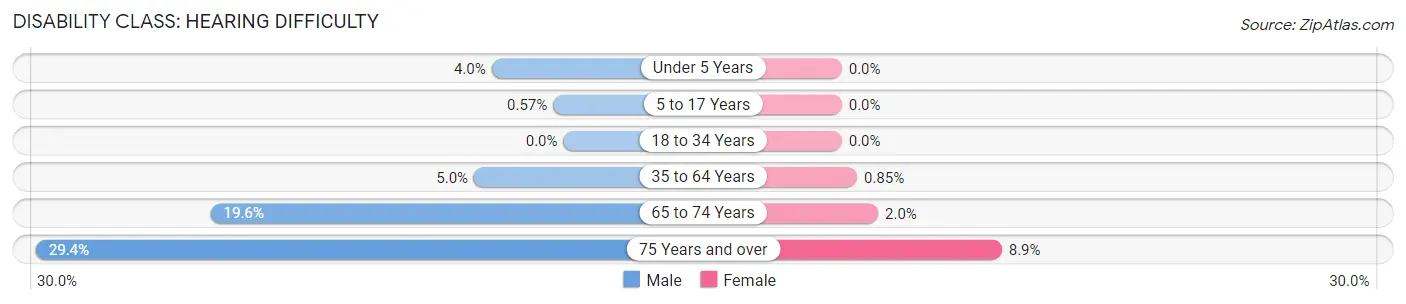
| Age Bracket | Male | Female |
| Under 5 Years | 10 (4.0%) | 0 (0.0%) |
| 5 to 17 Years | 5 (0.6%) | 0 (0.0%) |
| 18 to 34 Years | 0 (0.0%) | 0 (0.0%) |
| 35 to 64 Years | 104 (5.0%) | 17 (0.9%) |
| 65 to 74 Years | 131 (19.6%) | 14 (2.0%) |
| 75 Years and over | 126 (29.4%) | 44 (8.9%) |
Disability Class: Vision Difficulty
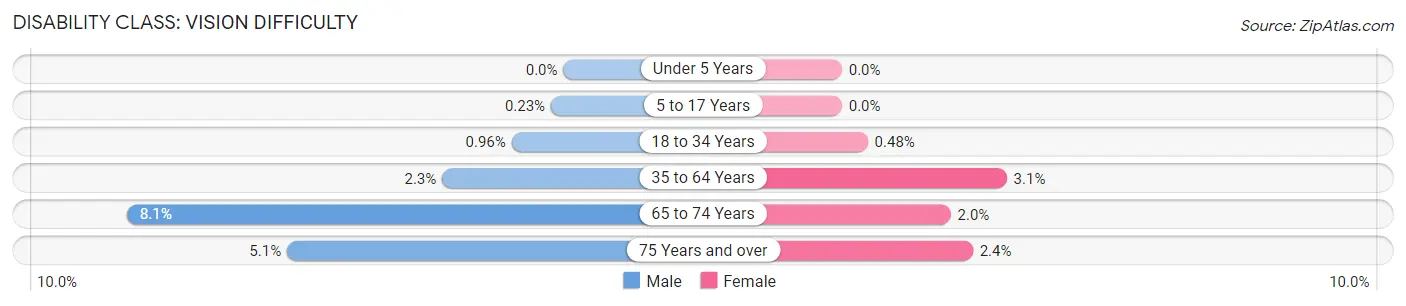
| Age Bracket | Male | Female |
| Under 5 Years | 0 (0.0%) | 0 (0.0%) |
| 5 to 17 Years | 2 (0.2%) | 0 (0.0%) |
| 18 to 34 Years | 9 (1.0%) | 4 (0.5%) |
| 35 to 64 Years | 47 (2.2%) | 61 (3.1%) |
| 65 to 74 Years | 54 (8.1%) | 14 (2.0%) |
| 75 Years and over | 22 (5.1%) | 12 (2.4%) |
Disability Class: Cognitive Difficulty
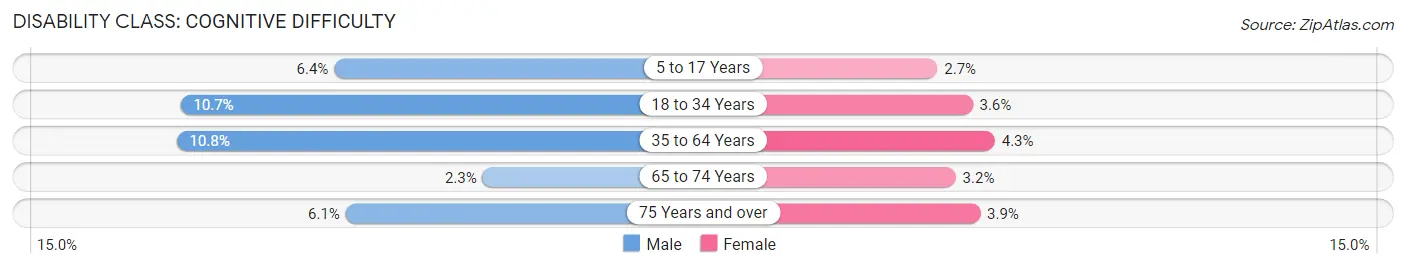
| Age Bracket | Male | Female |
| 5 to 17 Years | 56 (6.4%) | 20 (2.7%) |
| 18 to 34 Years | 100 (10.7%) | 30 (3.6%) |
| 35 to 64 Years | 225 (10.8%) | 85 (4.3%) |
| 65 to 74 Years | 15 (2.2%) | 22 (3.2%) |
| 75 Years and over | 26 (6.1%) | 19 (3.8%) |
Disability Class: Ambulatory Difficulty
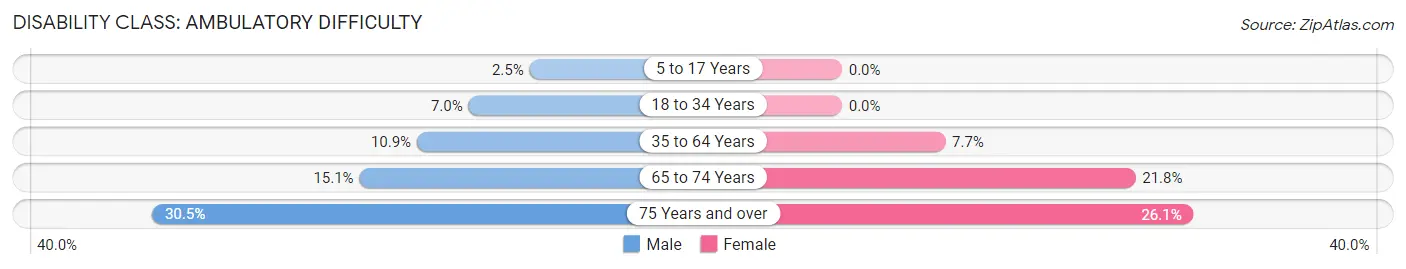
| Age Bracket | Male | Female |
| 5 to 17 Years | 22 (2.5%) | 0 (0.0%) |
| 18 to 34 Years | 66 (7.0%) | 0 (0.0%) |
| 35 to 64 Years | 227 (10.9%) | 153 (7.7%) |
| 65 to 74 Years | 101 (15.1%) | 151 (21.8%) |
| 75 Years and over | 131 (30.5%) | 129 (26.1%) |
Disability Class: Self-Care Difficulty
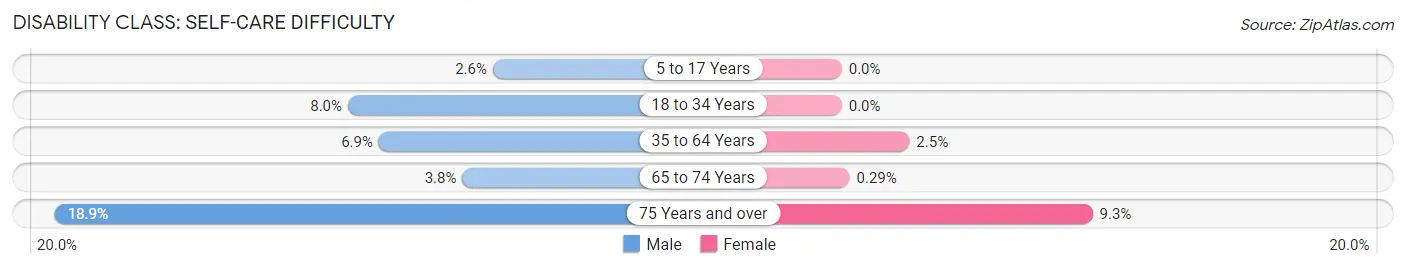
| Age Bracket | Male | Female |
| 5 to 17 Years | 23 (2.6%) | 0 (0.0%) |
| 18 to 34 Years | 75 (8.0%) | 0 (0.0%) |
| 35 to 64 Years | 143 (6.9%) | 50 (2.5%) |
| 65 to 74 Years | 25 (3.7%) | 2 (0.3%) |
| 75 Years and over | 81 (18.9%) | 46 (9.3%) |
Technology Access in Ralls County
Computing Device Access in Ralls County
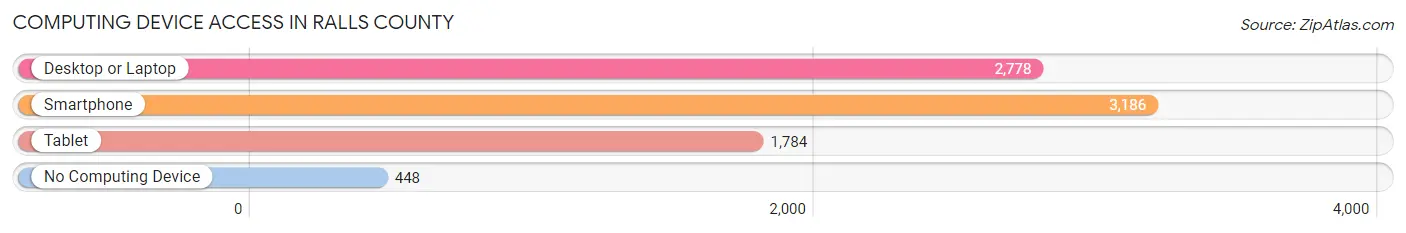
| Device Type | # Households | % Households |
| Desktop or Laptop | 2,778 | 69.2% |
| Smartphone | 3,186 | 79.4% |
| Tablet | 1,784 | 44.4% |
| No Computing Device | 448 | 11.2% |
| Total | 4,014 | 100.0% |
Internet Access in Ralls County
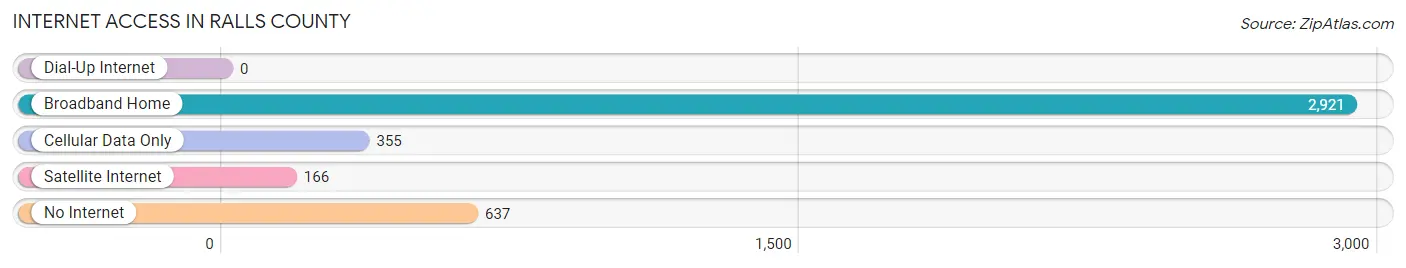
| Internet Type | # Households | % Households |
| Dial-Up Internet | 0 | 0.0% |
| Broadband Home | 2,921 | 72.8% |
| Cellular Data Only | 355 | 8.8% |
| Satellite Internet | 166 | 4.1% |
| No Internet | 637 | 15.9% |
| Total | 4,014 | 100.0% |
Ralls County Summary
Ralls County is located in the northeastern corner of Missouri, and is bordered by Pike County to the north, Audrain County to the east, Monroe County to the south, and Marion County to the west. The county seat is New London, and the county was named after Daniel Ralls, a Missouri state legislator. As of the 2010 census, the population of Ralls County was 10,939.
Geography
Ralls County is located in the northern part of Missouri, and is bordered by Pike County to the north, Audrain County to the east, Monroe County to the south, and Marion County to the west. The county has a total area of 441 square miles, of which 439 square miles is land and 2 square miles is water. The highest point in the county is located in the northwest corner, at an elevation of 1,068 feet. The county is mostly flat, with rolling hills in the northern and western parts. The main waterway in the county is the Salt River, which flows through the center of the county from north to south.
History
Ralls County was established in 1820, and was named after Daniel Ralls, a Missouri state legislator. The county was originally part of Pike County, and was created from parts of Pike, Marion, and Monroe counties. The county seat was originally located in Perry, but was moved to New London in 1836.
The county was largely agricultural in the 19th century, with corn, wheat, and oats being the main crops. The county also had a thriving livestock industry, with cattle, hogs, and sheep being raised in the area. The county was also home to several small manufacturing businesses, including a flour mill, a sawmill, and a brickyard.
In the early 20th century, the county saw an influx of new residents, as many people moved to the area to take advantage of the new jobs created by the railroad and other industries. The county also saw an increase in tourism, as people came to visit the many historic sites in the area.
Economy
Ralls County has a diverse economy, with a mix of agriculture, manufacturing, and services. The county is home to several large employers, including the Ralls County Electric Cooperative, the Ralls County Bank, and the Ralls County Medical Center.
Agriculture is the main industry in the county, with corn, soybeans, wheat, and hay being the main crops. Livestock production is also important, with cattle, hogs, and sheep being raised in the area.
Manufacturing is also an important part of the county's economy, with several companies producing a variety of products, including furniture, clothing, and food products.
The county also has a thriving tourism industry, with several historic sites, museums, and other attractions drawing visitors from around the state and country.
Demographics
As of the 2010 census, the population of Ralls County was 10,939, with a population density of 25 people per square mile. The median age in the county was 41.7 years, and the median household income was $41,945.
The racial makeup of the county was 97.2% White, 0.7% African American, 0.3% Native American, 0.2% Asian, 0.1% Pacific Islander, 0.4% from other races, and 1.1% from two or more races. Hispanic or Latino of any race were 1.3% of the population.
The largest ancestry groups in the county were German (30.2%), English (19.2%), Irish (14.2%), and American (13.2%).
The majority of the population (90.2%) spoke English as their primary language, while 4.2% spoke Spanish, 0.7% spoke French, and 0.5% spoke German.
The religious makeup of the county was predominantly Christian, with the largest denominations being Baptist (25.2%), Methodist (17.2%), and Catholic (14.2%).
Conclusion
Ralls County is a rural county located in the northeastern corner of Missouri. The county has a diverse economy, with a mix of agriculture, manufacturing, and services. The population of the county is predominantly white, with a median age of 41.7 years and a median household income of $41,945. The county is predominantly Christian, with the largest denominations being Baptist, Methodist, and Catholic.
Common Questions
What is Per Capita Income in Ralls County?
Per Capita income in Ralls County is $29,625.
What is the Median Family Income in Ralls County?
Median Family Income in Ralls County is $78,871.
What is the Median Household income in Ralls County?
Median Household Income in Ralls County is $62,615.
What is Income or Wage Gap in Ralls County?
Income or Wage Gap in Ralls County is 31.6%.
Women in Ralls County earn 68.4 cents for every dollar earned by a man.
What is Family Income Deficit in Ralls County?
Family Income Deficit in Ralls County is $9,403.
Families that are below poverty line in Ralls County earn $9,403 less on average than the poverty threshold level.
What is Inequality or Gini Index in Ralls County?
Inequality or Gini Index in Ralls County is 0.43.
What is the Total Population of Ralls County?
Total Population of Ralls County is 10,356.
What is the Total Male Population of Ralls County?
Total Male Population of Ralls County is 5,301.
What is the Total Female Population of Ralls County?
Total Female Population of Ralls County is 5,055.
What is the Ratio of Males per 100 Females in Ralls County?
There are 104.87 Males per 100 Females in Ralls County.
What is the Ratio of Females per 100 Males in Ralls County?
There are 95.36 Females per 100 Males in Ralls County.
What is the Median Population Age in Ralls County?
Median Population Age in Ralls County is 45.5 Years.
What is the Average Family Size in Ralls County
Average Family Size in Ralls County is 3.0 People.
What is the Average Household Size in Ralls County
Average Household Size in Ralls County is 2.6 People.
How Large is the Labor Force in Ralls County?
There are 4,890 People in the Labor Forcein in Ralls County.
What is the Percentage of People in the Labor Force in Ralls County?
57.8% of People are in the Labor Force in Ralls County.
What is the Unemployment Rate in Ralls County?
Unemployment Rate in Ralls County is 5.3%.