Pulaski County, MO Map & Demographics
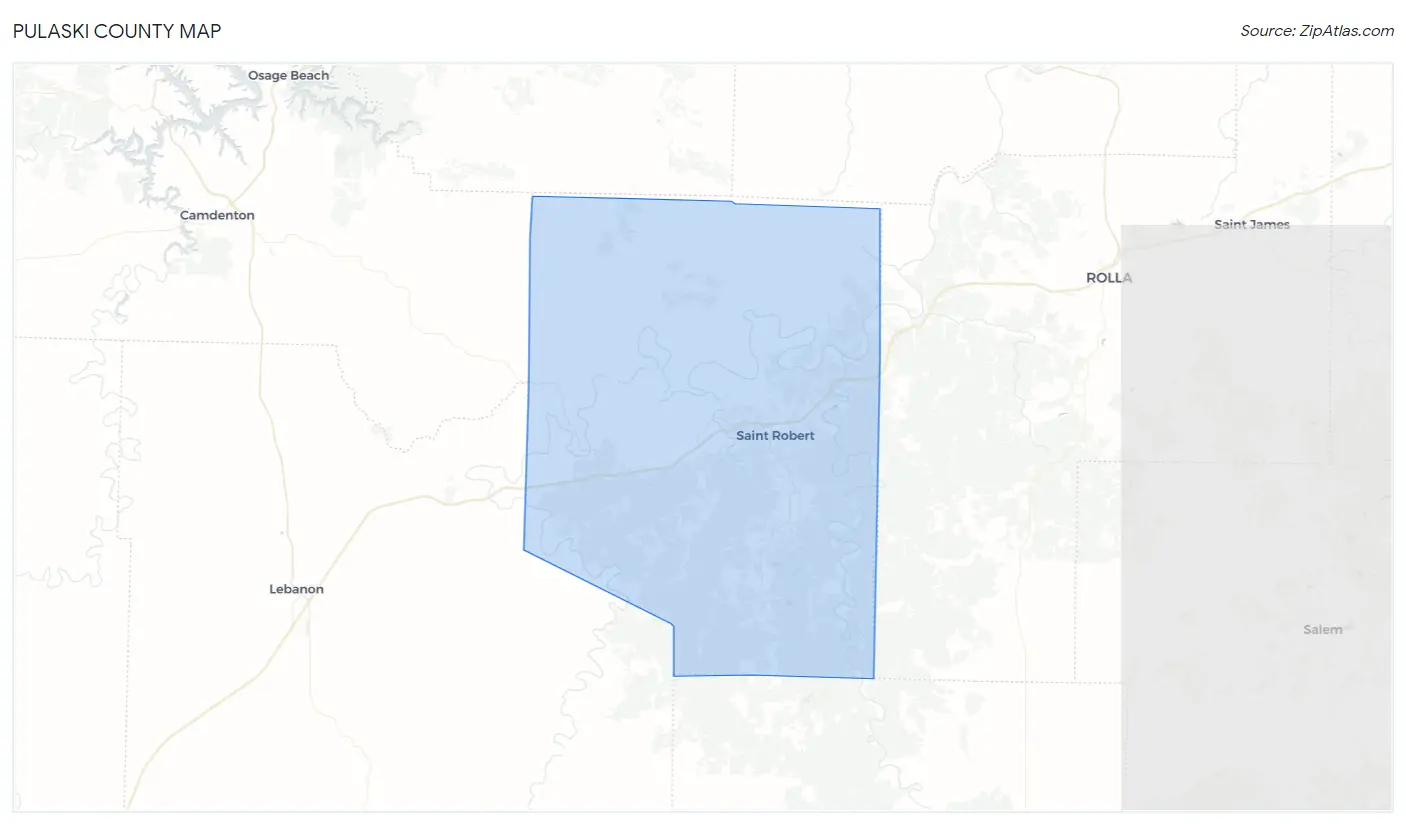
Pulaski County Map
Pulaski County Overview
$27,098
PER CAPITA INCOME
$76,118
AVG FAMILY INCOME
$62,541
AVG HOUSEHOLD INCOME
9.0%
WAGE / INCOME GAP [ % ]
91.0¢/ $1
WAGE / INCOME GAP [ $ ]
$11,279
FAMILY INCOME DEFICIT
0.41
INEQUALITY / GINI INDEX
53,726
TOTAL POPULATION
29,982
MALE POPULATION
23,744
FEMALE POPULATION
126.27
MALES / 100 FEMALES
79.19
FEMALES / 100 MALES
27.7
MEDIAN AGE
3.4
AVG FAMILY SIZE
2.8
AVG HOUSEHOLD SIZE
29,399
LABOR FORCE [ PEOPLE ]
68.3%
PERCENT IN LABOR FORCE
4.7%
UNEMPLOYMENT RATE
Pulaski County Area Codes
Income in Pulaski County
Income Overview in Pulaski County
Per Capita Income in Pulaski County is $27,098, while median incomes of families and households are $76,118 and $62,541 respectively.
| Characteristic | Number | Measure |
| Per Capita Income | 53,726 | $27,098 |
| Median Family Income | 10,591 | $76,118 |
| Mean Family Income | 10,591 | $86,678 |
| Median Household Income | 15,653 | $62,541 |
| Mean Household Income | 15,653 | $75,918 |
| Income Deficit | 10,591 | $11,279 |
| Wage / Income Gap (%) | 53,726 | 8.98% |
| Wage / Income Gap ($) | 53,726 | 91.02¢ per $1 |
| Gini / Inequality Index | 53,726 | 0.41 |
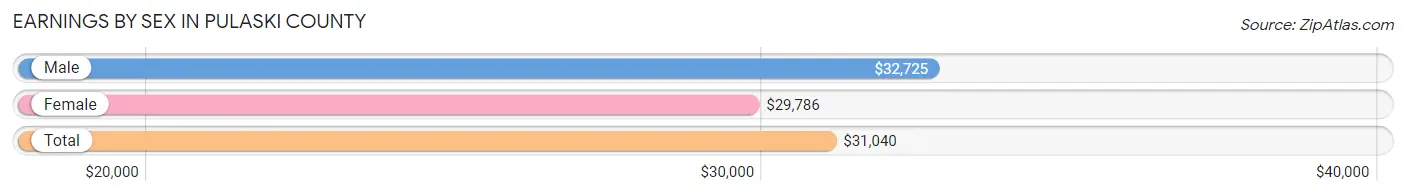
Earnings by Sex in Pulaski County
Average Earnings in Pulaski County are $31,040, $32,725 for men and $29,786 for women, a difference of 9.0%.
| Sex | Number | Average Earnings |
| Male | 18,923 (61.6%) | $32,725 |
| Female | 11,814 (38.4%) | $29,786 |
| Total | 30,737 (100.0%) | $31,040 |
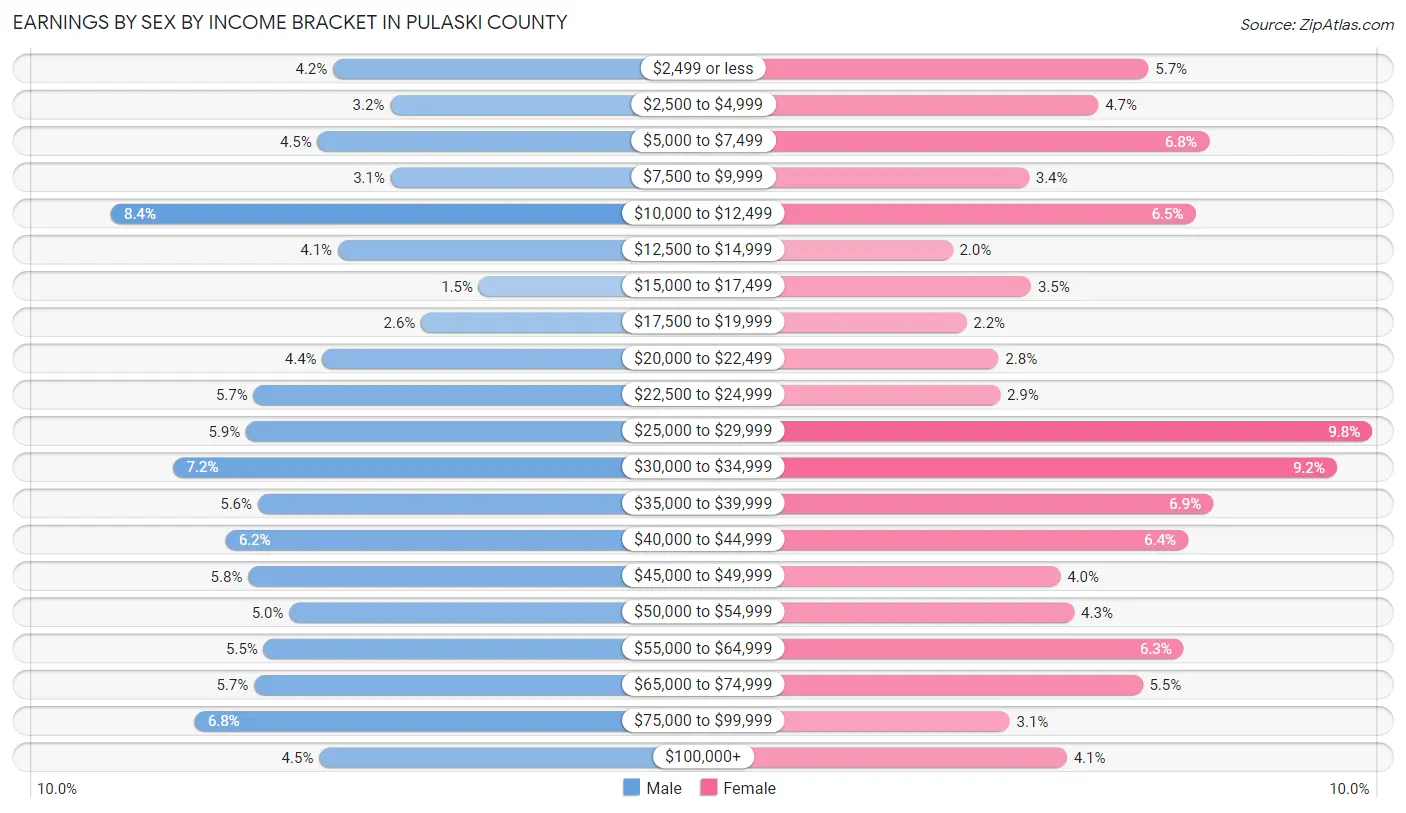
Earnings by Sex by Income Bracket in Pulaski County
The most common earnings brackets in Pulaski County are $10,000 to $12,499 for men (1,586 | 8.4%) and $25,000 to $29,999 for women (1,162 | 9.8%).
| Income | Male | Female |
| $2,499 or less | 798 (4.2%) | 667 (5.7%) |
| $2,500 to $4,999 | 596 (3.2%) | 556 (4.7%) |
| $5,000 to $7,499 | 854 (4.5%) | 801 (6.8%) |
| $7,500 to $9,999 | 595 (3.1%) | 403 (3.4%) |
| $10,000 to $12,499 | 1,586 (8.4%) | 772 (6.5%) |
| $12,500 to $14,999 | 782 (4.1%) | 234 (2.0%) |
| $15,000 to $17,499 | 282 (1.5%) | 407 (3.5%) |
| $17,500 to $19,999 | 487 (2.6%) | 265 (2.2%) |
| $20,000 to $22,499 | 836 (4.4%) | 336 (2.8%) |
| $22,500 to $24,999 | 1,081 (5.7%) | 339 (2.9%) |
| $25,000 to $29,999 | 1,107 (5.9%) | 1,162 (9.8%) |
| $30,000 to $34,999 | 1,364 (7.2%) | 1,085 (9.2%) |
| $35,000 to $39,999 | 1,066 (5.6%) | 810 (6.9%) |
| $40,000 to $44,999 | 1,179 (6.2%) | 755 (6.4%) |
| $45,000 to $49,999 | 1,099 (5.8%) | 473 (4.0%) |
| $50,000 to $54,999 | 953 (5.0%) | 503 (4.3%) |
| $55,000 to $64,999 | 1,044 (5.5%) | 745 (6.3%) |
| $65,000 to $74,999 | 1,078 (5.7%) | 654 (5.5%) |
| $75,000 to $99,999 | 1,289 (6.8%) | 360 (3.0%) |
| $100,000+ | 847 (4.5%) | 487 (4.1%) |
| Total | 18,923 (100.0%) | 11,814 (100.0%) |
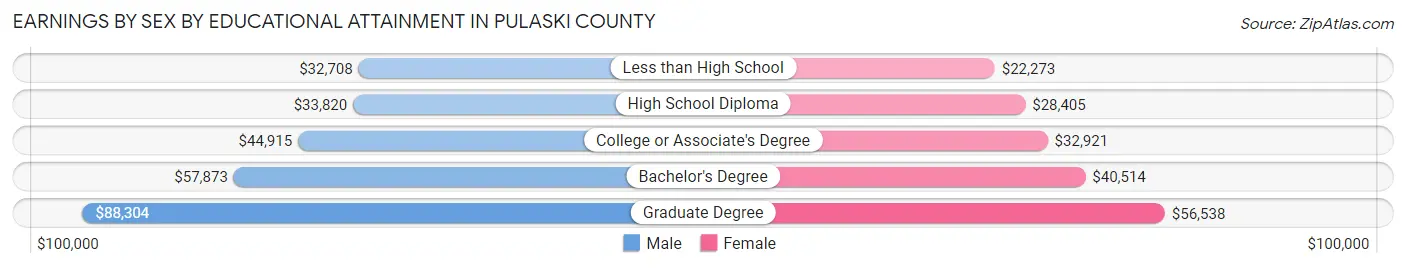
Earnings by Sex by Educational Attainment in Pulaski County
Average earnings in Pulaski County are $45,703 for men and $35,055 for women, a difference of 23.3%. Men with an educational attainment of graduate degree enjoy the highest average annual earnings of $88,304, while those with less than high school education earn the least with $32,708. Women with an educational attainment of graduate degree earn the most with the average annual earnings of $56,538, while those with less than high school education have the smallest earnings of $22,273.
| Educational Attainment | Male Income | Female Income |
| Less than High School | $32,708 | $22,273 |
| High School Diploma | $33,820 | $28,405 |
| College or Associate's Degree | $44,915 | $32,921 |
| Bachelor's Degree | $57,873 | $40,514 |
| Graduate Degree | $88,304 | $56,538 |
| Total | $45,703 | $35,055 |
Family Income in Pulaski County
Family Income Brackets in Pulaski County
According to the Pulaski County family income data, there are 2,266 families falling into the $100,000 to $149,999 income range, which is the most common income bracket and makes up 21.4% of all families. Conversely, the $10,000 to $14,999 income bracket is the least frequent group with only 307 families (2.9%) belonging to this category.
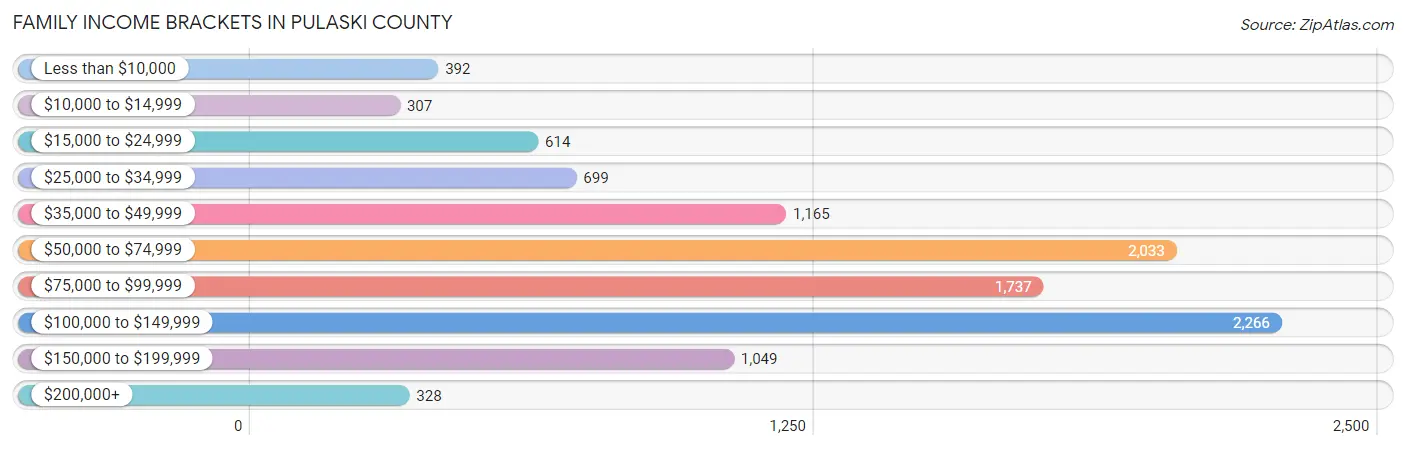
| Income Bracket | # Families | % Families |
| Less than $10,000 | 392 | 3.7% |
| $10,000 to $14,999 | 307 | 2.9% |
| $15,000 to $24,999 | 614 | 5.8% |
| $25,000 to $34,999 | 699 | 6.6% |
| $35,000 to $49,999 | 1,165 | 11.0% |
| $50,000 to $74,999 | 2,033 | 19.2% |
| $75,000 to $99,999 | 1,737 | 16.4% |
| $100,000 to $149,999 | 2,266 | 21.4% |
| $150,000 to $199,999 | 1,049 | 9.9% |
| $200,000+ | 328 | 3.1% |
Family Income by Famaliy Size in Pulaski County
4-person families (2,329 | 22.0%) account for the highest median family income in Pulaski County with $94,916 per family, while 2-person families (4,571 | 43.2%) have the highest median income of $34,808 per family member.
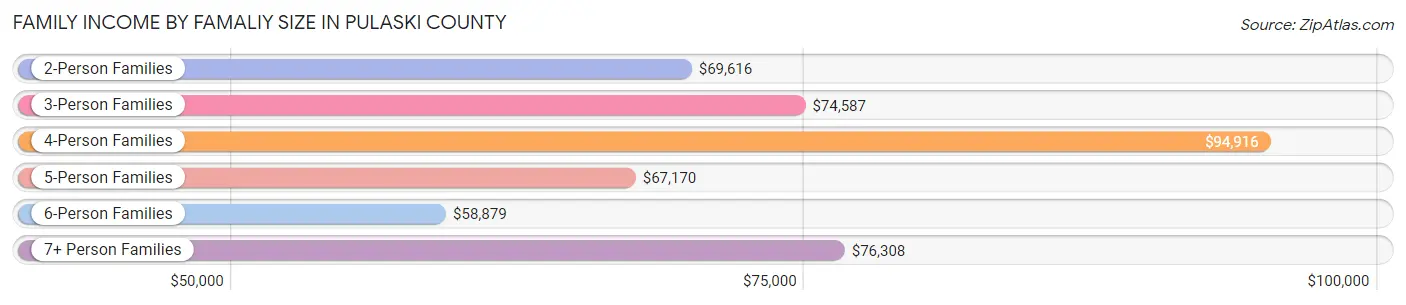
| Income Bracket | # Families | Median Income |
| 2-Person Families | 4,571 (43.2%) | $69,616 |
| 3-Person Families | 2,278 (21.5%) | $74,587 |
| 4-Person Families | 2,329 (22.0%) | $94,916 |
| 5-Person Families | 944 (8.9%) | $67,170 |
| 6-Person Families | 258 (2.4%) | $58,879 |
| 7+ Person Families | 211 (2.0%) | $76,308 |
| Total | 10,591 (100.0%) | $76,118 |
Family Income by Number of Earners in Pulaski County
The median family income in Pulaski County is $76,118, with families comprising 3+ earners (821) having the highest median family income of $111,397, while families with no earners (1,681) have the lowest median family income of $37,024, accounting for 7.7% and 15.9% of families, respectively.
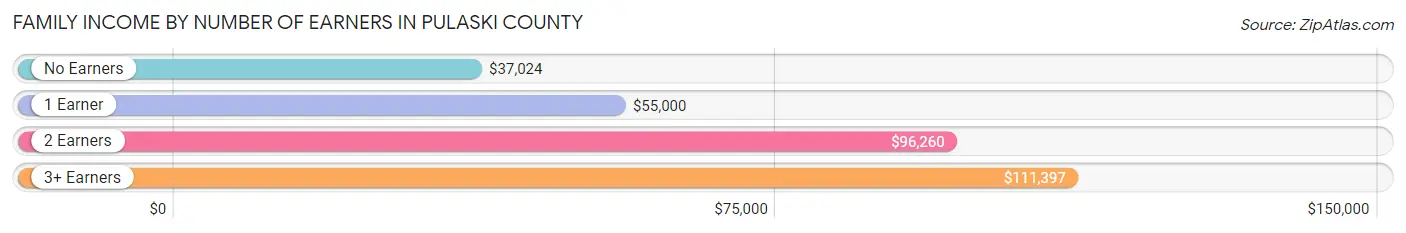
| Number of Earners | # Families | Median Income |
| No Earners | 1,681 (15.9%) | $37,024 |
| 1 Earner | 3,728 (35.2%) | $55,000 |
| 2 Earners | 4,361 (41.2%) | $96,260 |
| 3+ Earners | 821 (7.7%) | $111,397 |
| Total | 10,591 (100.0%) | $76,118 |
Household Income in Pulaski County
Household Income Brackets in Pulaski County
With 2,661 households falling in the category, the $50,000 to $74,999 income range is the most frequent in Pulaski County, accounting for 17.0% of all households. In contrast, only 501 households (3.2%) fall into the $200,000+ income bracket, making it the least populous group.
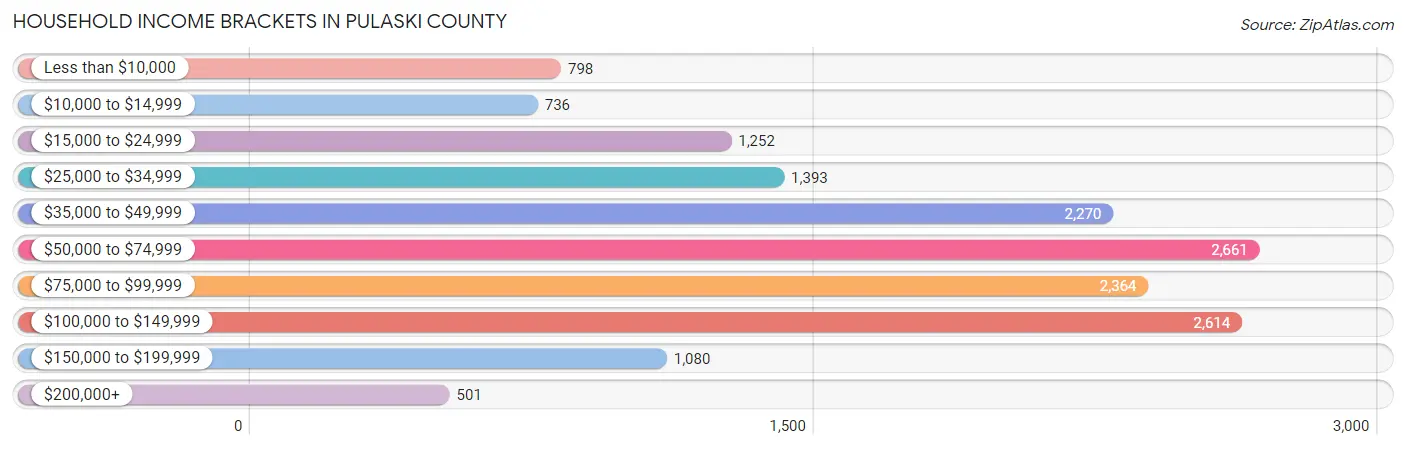
| Income Bracket | # Households | % Households |
| Less than $10,000 | 798 | 5.1% |
| $10,000 to $14,999 | 736 | 4.7% |
| $15,000 to $24,999 | 1,252 | 8.0% |
| $25,000 to $34,999 | 1,393 | 8.9% |
| $35,000 to $49,999 | 2,270 | 14.5% |
| $50,000 to $74,999 | 2,661 | 17.0% |
| $75,000 to $99,999 | 2,364 | 15.1% |
| $100,000 to $149,999 | 2,614 | 16.7% |
| $150,000 to $199,999 | 1,080 | 6.9% |
| $200,000+ | 501 | 3.2% |
Household Income by Householder Age in Pulaski County
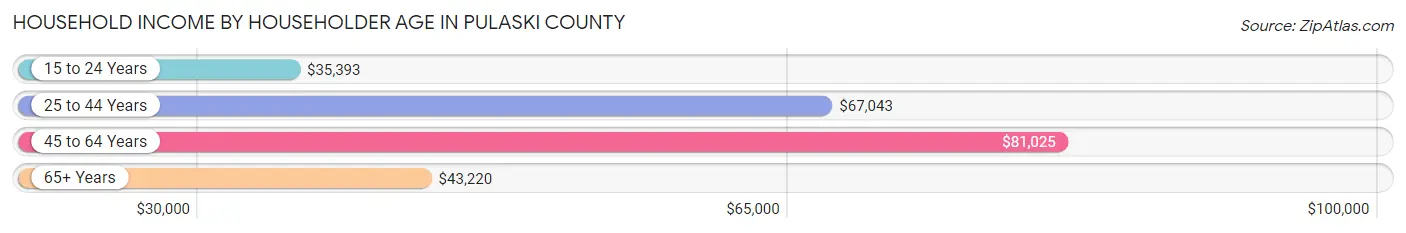
The median household income in Pulaski County is $62,541, with the highest median household income of $81,025 found in the 45 to 64 years age bracket for the primary householder. A total of 4,577 households (29.2%) fall into this category. Meanwhile, the 15 to 24 years age bracket for the primary householder has the lowest median household income of $35,393, with 1,126 households (7.2%) in this group.
| Income Bracket | # Households | Median Income |
| 15 to 24 Years | 1,126 (7.2%) | $35,393 |
| 25 to 44 Years | 6,841 (43.7%) | $67,043 |
| 45 to 64 Years | 4,577 (29.2%) | $81,025 |
| 65+ Years | 3,109 (19.9%) | $43,220 |
| Total | 15,653 (100.0%) | $62,541 |
Poverty in Pulaski County
Income Below Poverty by Sex and Age in Pulaski County
With 14.9% poverty level for males and 14.1% for females among the residents of Pulaski County, under 5 year old males and 75 year old and over females are the most vulnerable to poverty, with 720 males (34.8%) and 317 females (27.7%) in their respective age groups living below the poverty level.
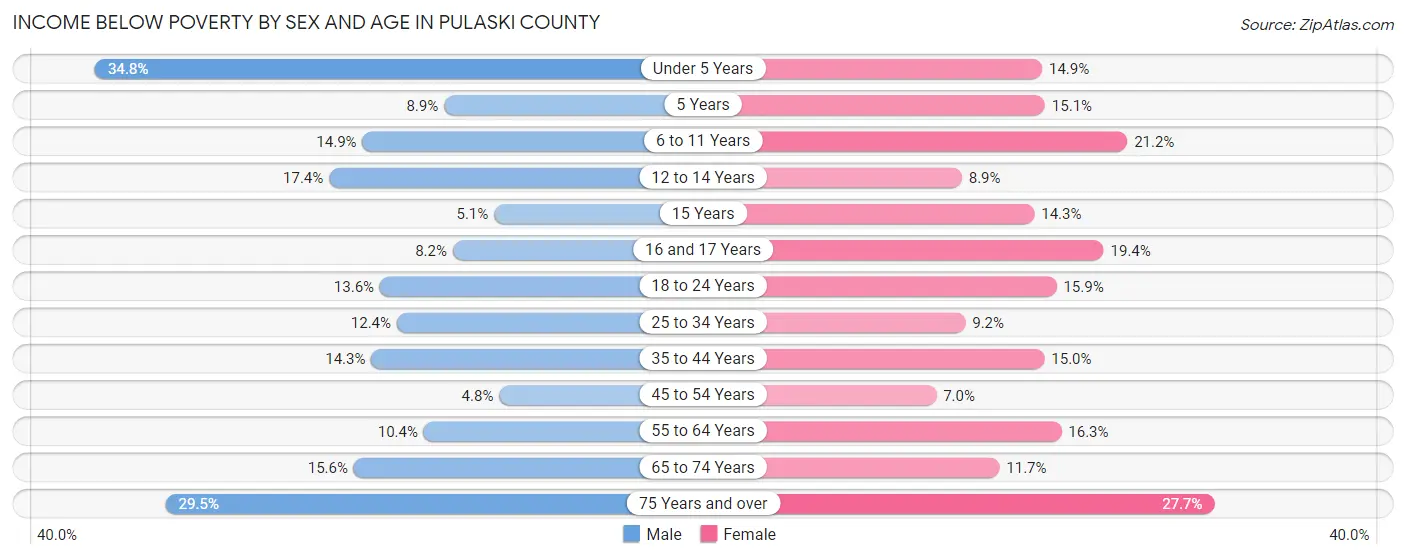
| Age Bracket | Male | Female |
| Under 5 Years | 720 (34.8%) | 226 (14.9%) |
| 5 Years | 24 (8.9%) | 30 (15.1%) |
| 6 to 11 Years | 311 (14.9%) | 417 (21.2%) |
| 12 to 14 Years | 141 (17.4%) | 85 (8.9%) |
| 15 Years | 17 (5.1%) | 27 (14.3%) |
| 16 and 17 Years | 33 (8.2%) | 83 (19.4%) |
| 18 to 24 Years | 538 (13.6%) | 208 (15.9%) |
| 25 to 34 Years | 521 (12.4%) | 328 (9.2%) |
| 35 to 44 Years | 449 (14.3%) | 447 (15.0%) |
| 45 to 54 Years | 101 (4.8%) | 165 (7.0%) |
| 55 to 64 Years | 217 (10.4%) | 351 (16.3%) |
| 65 to 74 Years | 217 (15.6%) | 179 (11.7%) |
| 75 Years and over | 230 (29.5%) | 317 (27.7%) |
| Total | 3,519 (14.9%) | 2,863 (14.1%) |
Income Above Poverty by Sex and Age in Pulaski County
According to the poverty statistics in Pulaski County, males aged 45 to 54 years and females aged 45 to 54 years are the age groups that are most secure financially, with 95.2% of males and 93.0% of females in these age groups living above the poverty line.
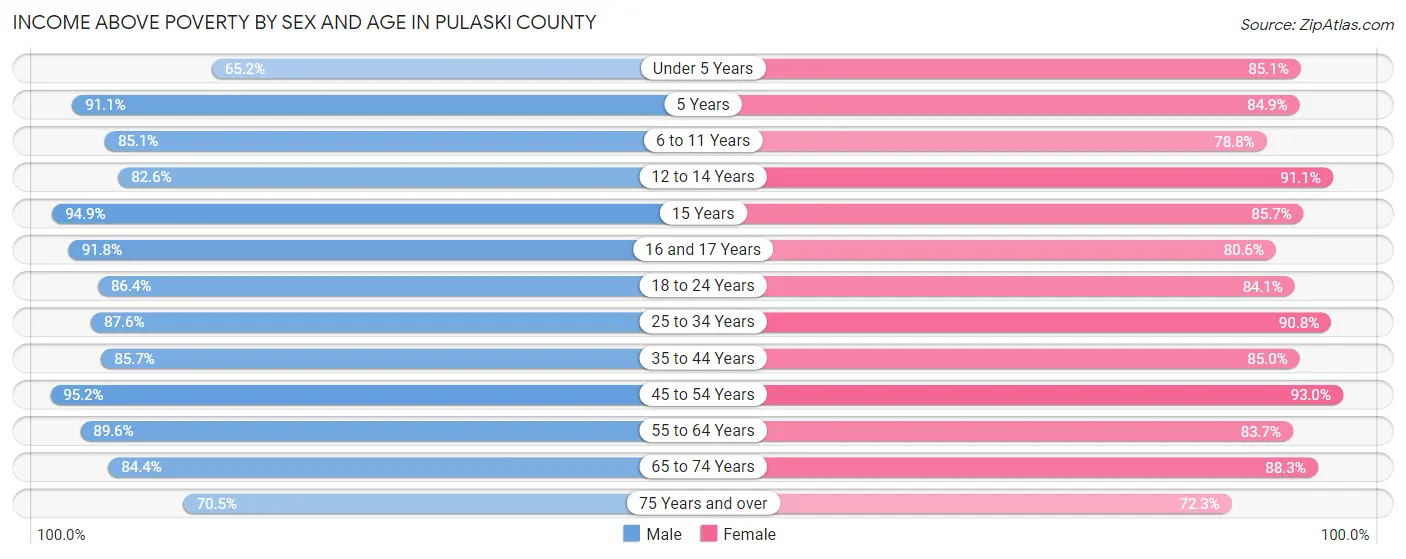
| Age Bracket | Male | Female |
| Under 5 Years | 1,351 (65.2%) | 1,294 (85.1%) |
| 5 Years | 247 (91.1%) | 169 (84.9%) |
| 6 to 11 Years | 1,773 (85.1%) | 1,551 (78.8%) |
| 12 to 14 Years | 670 (82.6%) | 869 (91.1%) |
| 15 Years | 314 (94.9%) | 162 (85.7%) |
| 16 and 17 Years | 369 (91.8%) | 344 (80.6%) |
| 18 to 24 Years | 3,412 (86.4%) | 1,097 (84.1%) |
| 25 to 34 Years | 3,694 (87.6%) | 3,248 (90.8%) |
| 35 to 44 Years | 2,699 (85.7%) | 2,526 (85.0%) |
| 45 to 54 Years | 2,023 (95.2%) | 2,190 (93.0%) |
| 55 to 64 Years | 1,877 (89.6%) | 1,803 (83.7%) |
| 65 to 74 Years | 1,178 (84.4%) | 1,351 (88.3%) |
| 75 Years and over | 549 (70.5%) | 829 (72.3%) |
| Total | 20,156 (85.1%) | 17,433 (85.9%) |
Income Below Poverty Among Married-Couple Families in Pulaski County
The poverty statistics for married-couple families in Pulaski County show that 7.5% or 638 of the total 8,485 families live below the poverty line. Families with 3 or 4 children have the highest poverty rate of 12.0%, comprising of 113 families. On the other hand, families with 5 or more children have the lowest poverty rate of 0.0%, which includes 0 families.
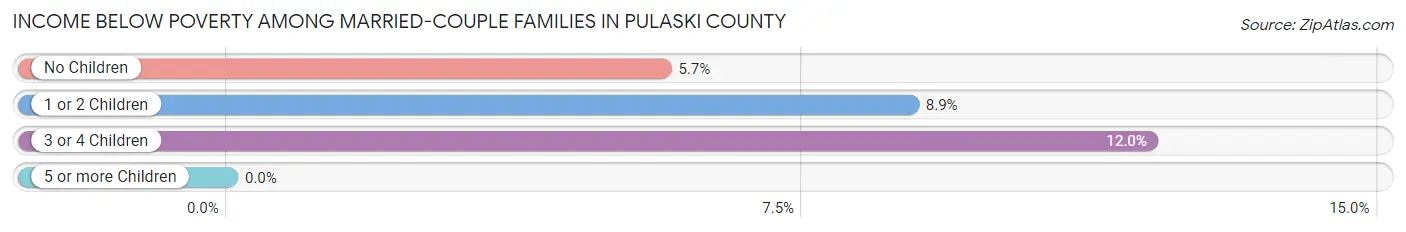
| Children | Above Poverty | Below Poverty |
| No Children | 4,019 (94.3%) | 241 (5.7%) |
| 1 or 2 Children | 2,909 (91.1%) | 284 (8.9%) |
| 3 or 4 Children | 827 (88.0%) | 113 (12.0%) |
| 5 or more Children | 92 (100.0%) | 0 (0.0%) |
| Total | 7,847 (92.5%) | 638 (7.5%) |
Income Below Poverty Among Single-Parent Households in Pulaski County
According to the poverty data in Pulaski County, 33.2% or 176 single-father households and 23.1% or 364 single-mother households are living below the poverty line. Among single-father households, those with 3 or 4 children have the highest poverty rate, with 14 households (82.4%) experiencing poverty. Likewise, among single-mother households, those with 5 or more children have the highest poverty rate, with 6 households (100.0%) falling below the poverty line.
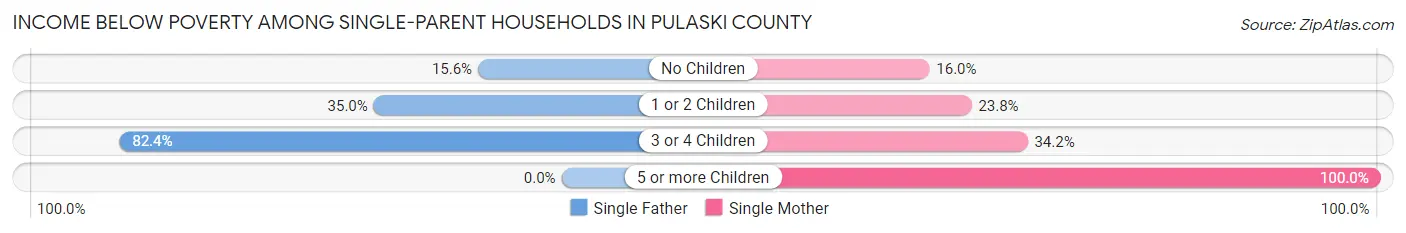
| Children | Single Father | Single Mother |
| No Children | 14 (15.6%) | 71 (16.0%) |
| 1 or 2 Children | 148 (35.0%) | 224 (23.8%) |
| 3 or 4 Children | 14 (82.4%) | 63 (34.2%) |
| 5 or more Children | 0 (0.0%) | 6 (100.0%) |
| Total | 176 (33.2%) | 364 (23.1%) |
Income Below Poverty Among Married-Couple vs Single-Parent Households in Pulaski County
The poverty data for Pulaski County shows that 638 of the married-couple family households (7.5%) and 540 of the single-parent households (25.6%) are living below the poverty level. Within the married-couple family households, those with 3 or 4 children have the highest poverty rate, with 113 households (12.0%) falling below the poverty line. Among the single-parent households, those with 5 or more children have the highest poverty rate, with 6 household (100.0%) living below poverty.
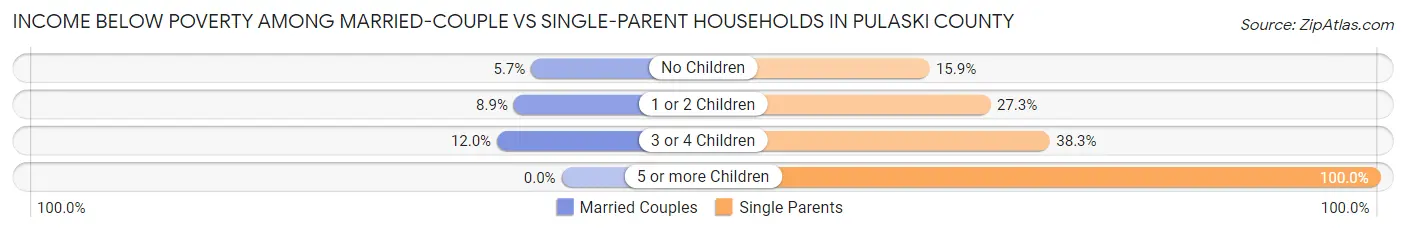
| Children | Married-Couple Families | Single-Parent Households |
| No Children | 241 (5.7%) | 85 (15.9%) |
| 1 or 2 Children | 284 (8.9%) | 372 (27.3%) |
| 3 or 4 Children | 113 (12.0%) | 77 (38.3%) |
| 5 or more Children | 0 (0.0%) | 6 (100.0%) |
| Total | 638 (7.5%) | 540 (25.6%) |
Race in Pulaski County
The most populous races in Pulaski County are White / Caucasian (39,647 | 73.8%), Hispanic or Latino (6,231 | 11.6%), and Two or more Races (5,721 | 10.6%).
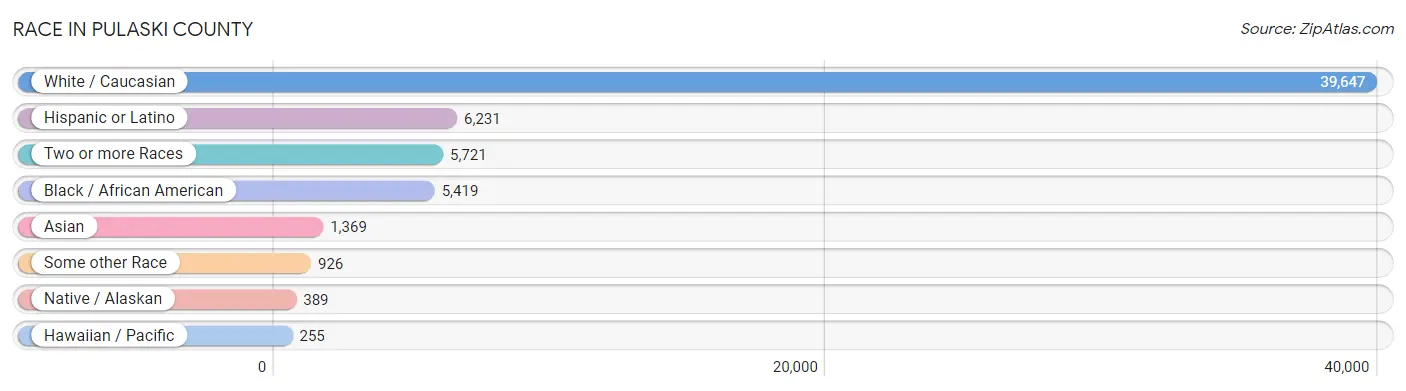
| Race | # Population | % Population |
| Asian | 1,369 | 2.5% |
| Black / African American | 5,419 | 10.1% |
| Hawaiian / Pacific | 255 | 0.5% |
| Hispanic or Latino | 6,231 | 11.6% |
| Native / Alaskan | 389 | 0.7% |
| White / Caucasian | 39,647 | 73.8% |
| Two or more Races | 5,721 | 10.6% |
| Some other Race | 926 | 1.7% |
| Total | 53,726 | 100.0% |
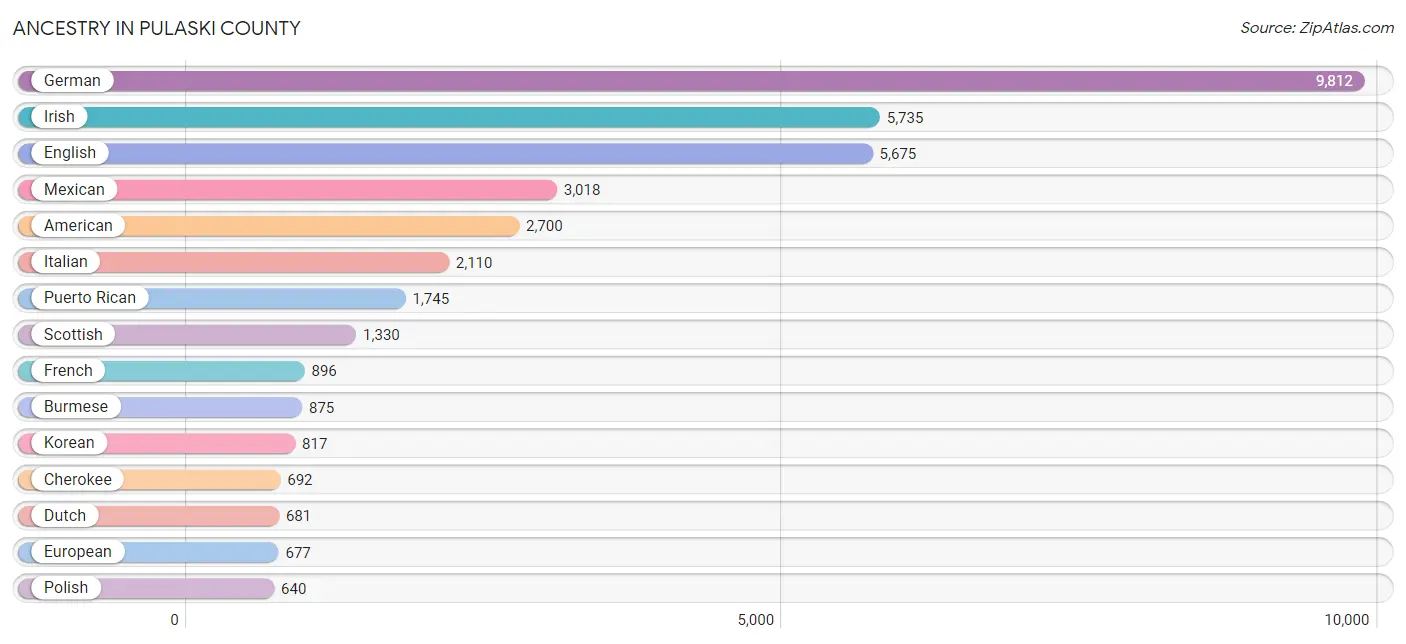
Ancestry in Pulaski County
The most populous ancestries reported in Pulaski County are German (9,812 | 18.3%), Irish (5,735 | 10.7%), English (5,675 | 10.6%), Mexican (3,018 | 5.6%), and American (2,700 | 5.0%), together accounting for 50.1% of all Pulaski County residents.
| Ancestry | # Population | % Population |
| African | 56 | 0.1% |
| American | 2,700 | 5.0% |
| Arab | 40 | 0.1% |
| Armenian | 32 | 0.1% |
| Australian | 25 | 0.1% |
| Belgian | 5 | 0.0% |
| Bhutanese | 289 | 0.5% |
| Blackfeet | 33 | 0.1% |
| Bolivian | 1 | 0.0% |
| Brazilian | 12 | 0.0% |
| British | 264 | 0.5% |
| British West Indian | 27 | 0.1% |
| Burmese | 875 | 1.6% |
| Canadian | 267 | 0.5% |
| Celtic | 3 | 0.0% |
| Central American | 247 | 0.5% |
| Cherokee | 692 | 1.3% |
| Chinese | 30 | 0.1% |
| Choctaw | 132 | 0.3% |
| Colombian | 130 | 0.2% |
| Croatian | 119 | 0.2% |
| Cuban | 85 | 0.2% |
| Czech | 159 | 0.3% |
| Danish | 23 | 0.0% |
| Dominican | 188 | 0.4% |
| Dutch | 681 | 1.3% |
| Eastern European | 45 | 0.1% |
| Ecuadorian | 139 | 0.3% |
| English | 5,675 | 10.6% |
| European | 677 | 1.3% |
| Filipino | 34 | 0.1% |
| Finnish | 13 | 0.0% |
| French | 896 | 1.7% |
| French Canadian | 309 | 0.6% |
| German | 9,812 | 18.3% |
| Ghanaian | 202 | 0.4% |
| Greek | 225 | 0.4% |
| Guamanian / Chamorro | 82 | 0.2% |
| Haitian | 27 | 0.1% |
| Honduran | 25 | 0.1% |
| Hungarian | 43 | 0.1% |
| Indian (Asian) | 108 | 0.2% |
| Irish | 5,735 | 10.7% |
| Iroquois | 52 | 0.1% |
| Israeli | 19 | 0.0% |
| Italian | 2,110 | 3.9% |
| Jamaican | 324 | 0.6% |
| Korean | 817 | 1.5% |
| Laotian | 10 | 0.0% |
| Lebanese | 36 | 0.1% |
| Menominee | 10 | 0.0% |
| Mexican | 3,018 | 5.6% |
| Native Hawaiian | 153 | 0.3% |
| Navajo | 33 | 0.1% |
| Nicaraguan | 94 | 0.2% |
| Nigerian | 11 | 0.0% |
| Northern European | 46 | 0.1% |
| Norwegian | 565 | 1.1% |
| Osage | 25 | 0.1% |
| Pakistani | 231 | 0.4% |
| Panamanian | 69 | 0.1% |
| Pennsylvania German | 5 | 0.0% |
| Peruvian | 19 | 0.0% |
| Polish | 640 | 1.2% |
| Portuguese | 183 | 0.3% |
| Pueblo | 12 | 0.0% |
| Puerto Rican | 1,745 | 3.3% |
| Romanian | 41 | 0.1% |
| Russian | 244 | 0.4% |
| Salvadoran | 59 | 0.1% |
| Samoan | 351 | 0.6% |
| Scandinavian | 111 | 0.2% |
| Scotch-Irish | 610 | 1.1% |
| Scottish | 1,330 | 2.5% |
| Sioux | 52 | 0.1% |
| Slovak | 17 | 0.0% |
| Slovene | 40 | 0.1% |
| South American | 289 | 0.5% |
| Spaniard | 109 | 0.2% |
| Spanish | 91 | 0.2% |
| Spanish American | 2 | 0.0% |
| Sri Lankan | 115 | 0.2% |
| Subsaharan African | 407 | 0.8% |
| Swedish | 484 | 0.9% |
| Swiss | 120 | 0.2% |
| Thai | 18 | 0.0% |
| Tlingit-Haida | 17 | 0.0% |
| Trinidadian and Tobagonian | 63 | 0.1% |
| Welsh | 76 | 0.1% |
| West Indian | 11 | 0.0% | View All 90 Rows |
Immigrants in Pulaski County
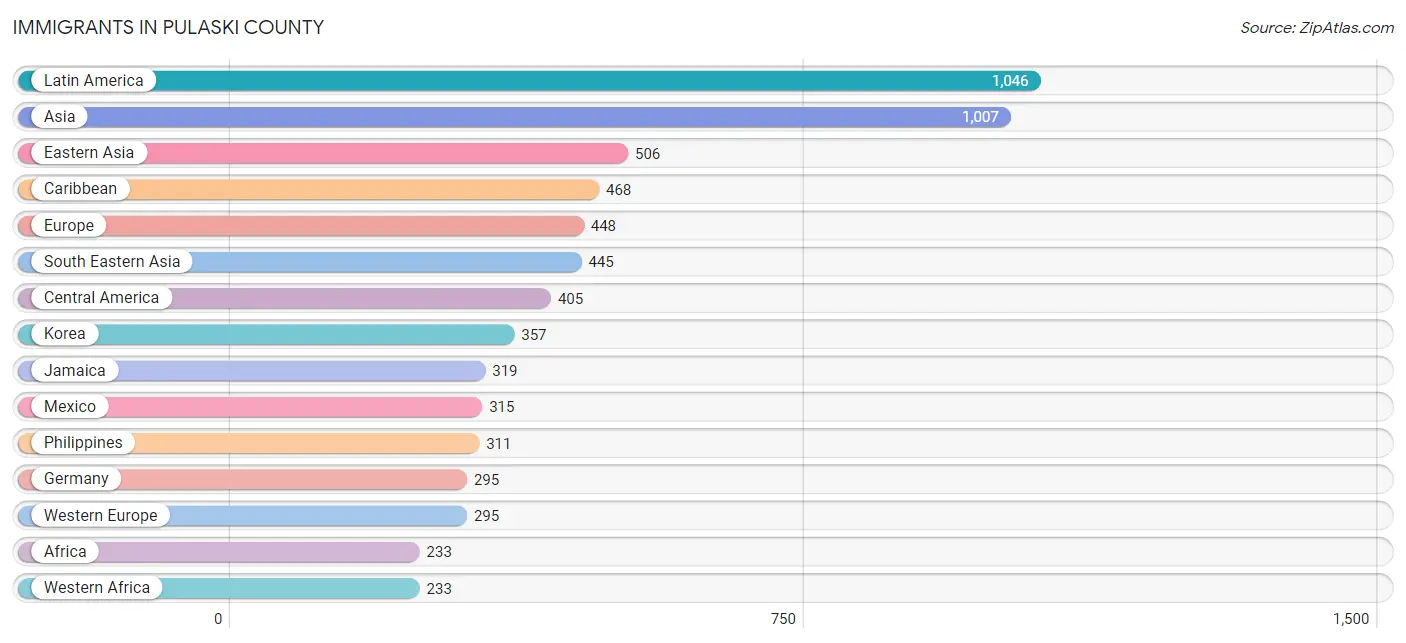
The most numerous immigrant groups reported in Pulaski County came from Latin America (1,046 | 1.9%), Asia (1,007 | 1.9%), Eastern Asia (506 | 0.9%), Caribbean (468 | 0.9%), and Europe (448 | 0.8%), together accounting for 6.5% of all Pulaski County residents.
| Immigration Origin | # Population | % Population |
| Africa | 233 | 0.4% |
| Asia | 1,007 | 1.9% |
| Bolivia | 1 | 0.0% |
| Brazil | 38 | 0.1% |
| Canada | 7 | 0.0% |
| Caribbean | 468 | 0.9% |
| Central America | 405 | 0.7% |
| China | 90 | 0.2% |
| Colombia | 106 | 0.2% |
| Cuba | 20 | 0.0% |
| Dominica | 27 | 0.1% |
| Dominican Republic | 21 | 0.0% |
| Eastern Asia | 506 | 0.9% |
| Eastern Europe | 62 | 0.1% |
| Ecuador | 28 | 0.1% |
| El Salvador | 13 | 0.0% |
| Europe | 448 | 0.8% |
| Germany | 295 | 0.5% |
| Ghana | 120 | 0.2% |
| Greece | 3 | 0.0% |
| Haiti | 18 | 0.0% |
| Honduras | 15 | 0.0% |
| India | 46 | 0.1% |
| Indonesia | 10 | 0.0% |
| Jamaica | 319 | 0.6% |
| Japan | 59 | 0.1% |
| Korea | 357 | 0.7% |
| Latin America | 1,046 | 1.9% |
| Mexico | 315 | 0.6% |
| Micronesia | 10 | 0.0% |
| Northern Europe | 88 | 0.2% |
| Oceania | 93 | 0.2% |
| Panama | 62 | 0.1% |
| Philippines | 311 | 0.6% |
| Poland | 58 | 0.1% |
| Russia | 4 | 0.0% |
| Singapore | 82 | 0.2% |
| South America | 173 | 0.3% |
| South Central Asia | 56 | 0.1% |
| South Eastern Asia | 445 | 0.8% |
| Southern Europe | 3 | 0.0% |
| Taiwan | 34 | 0.1% |
| Thailand | 42 | 0.1% |
| Trinidad and Tobago | 63 | 0.1% |
| Uzbekistan | 10 | 0.0% |
| Western Africa | 233 | 0.4% |
| Western Europe | 295 | 0.5% | View All 47 Rows |
Sex and Age in Pulaski County
Sex and Age in Pulaski County
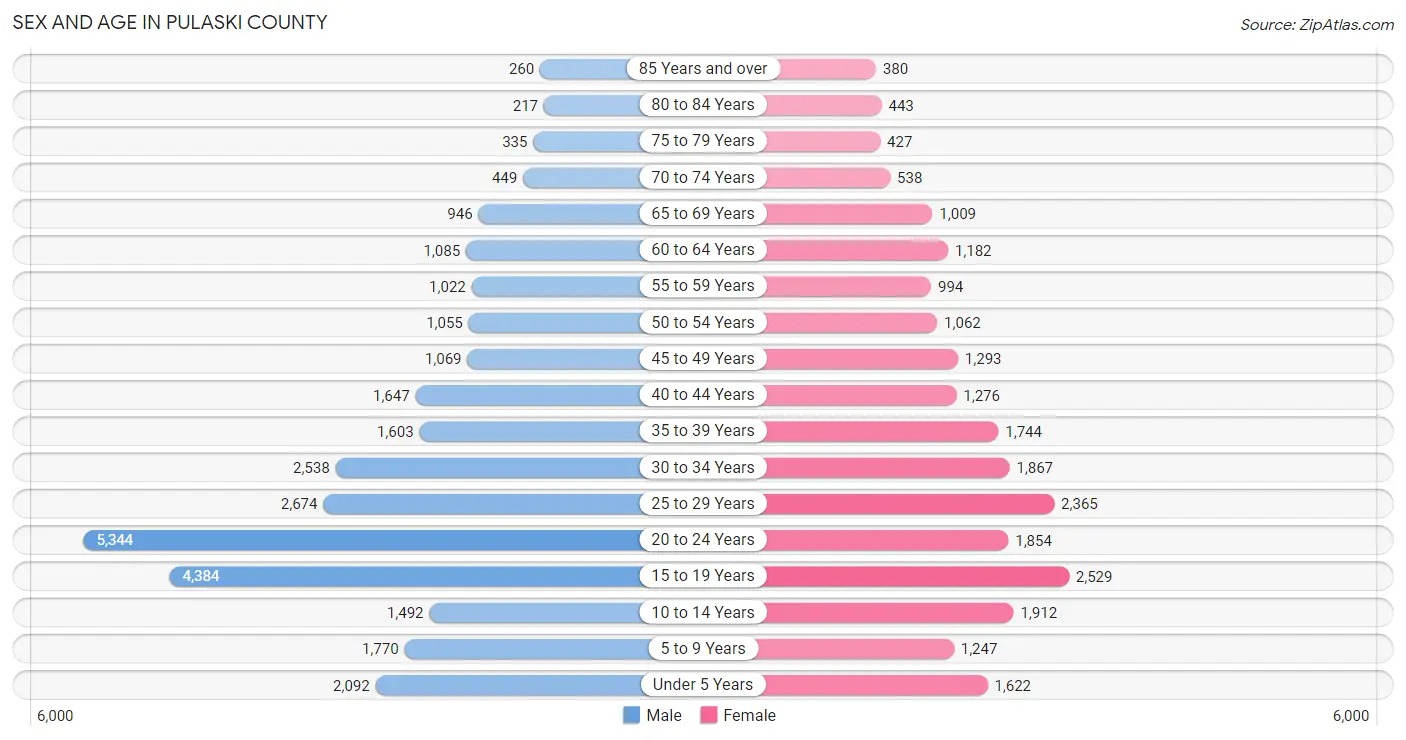
The most populous age groups in Pulaski County are 20 to 24 Years (5,344 | 17.8%) for men and 15 to 19 Years (2,529 | 10.6%) for women.
| Age Bracket | Male | Female |
| Under 5 Years | 2,092 (7.0%) | 1,622 (6.8%) |
| 5 to 9 Years | 1,770 (5.9%) | 1,247 (5.2%) |
| 10 to 14 Years | 1,492 (5.0%) | 1,912 (8.1%) |
| 15 to 19 Years | 4,384 (14.6%) | 2,529 (10.6%) |
| 20 to 24 Years | 5,344 (17.8%) | 1,854 (7.8%) |
| 25 to 29 Years | 2,674 (8.9%) | 2,365 (10.0%) |
| 30 to 34 Years | 2,538 (8.5%) | 1,867 (7.9%) |
| 35 to 39 Years | 1,603 (5.3%) | 1,744 (7.3%) |
| 40 to 44 Years | 1,647 (5.5%) | 1,276 (5.4%) |
| 45 to 49 Years | 1,069 (3.6%) | 1,293 (5.4%) |
| 50 to 54 Years | 1,055 (3.5%) | 1,062 (4.5%) |
| 55 to 59 Years | 1,022 (3.4%) | 994 (4.2%) |
| 60 to 64 Years | 1,085 (3.6%) | 1,182 (5.0%) |
| 65 to 69 Years | 946 (3.2%) | 1,009 (4.3%) |
| 70 to 74 Years | 449 (1.5%) | 538 (2.3%) |
| 75 to 79 Years | 335 (1.1%) | 427 (1.8%) |
| 80 to 84 Years | 217 (0.7%) | 443 (1.9%) |
| 85 Years and over | 260 (0.9%) | 380 (1.6%) |
| Total | 29,982 (100.0%) | 23,744 (100.0%) |
Families and Households in Pulaski County
Median Family Size in Pulaski County
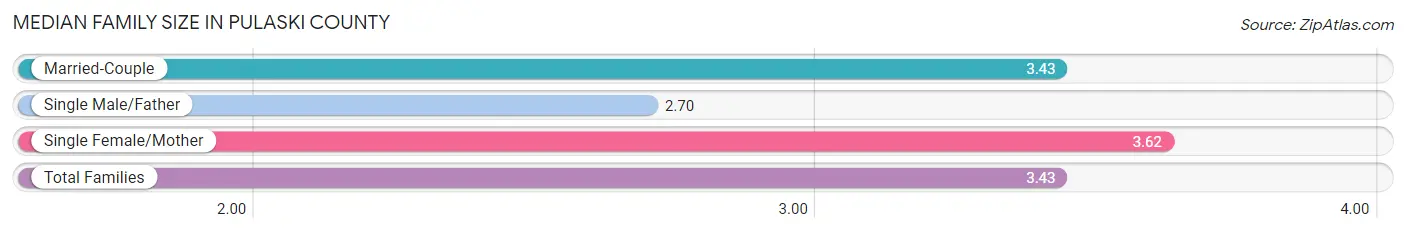
The median family size in Pulaski County is 3.43 persons per family, with single female/mother families (1,576 | 14.9%) accounting for the largest median family size of 3.62 persons per family. On the other hand, single male/father families (530 | 5.0%) represent the smallest median family size with 2.70 persons per family.
| Family Type | # Families | Family Size |
| Married-Couple | 8,485 (80.1%) | 3.43 |
| Single Male/Father | 530 (5.0%) | 2.70 |
| Single Female/Mother | 1,576 (14.9%) | 3.62 |
| Total Families | 10,591 (100.0%) | 3.43 |
Median Household Size in Pulaski County
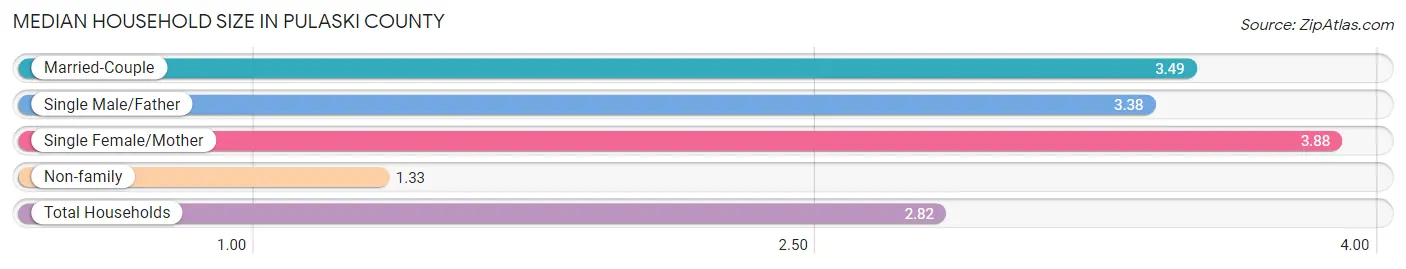
The median household size in Pulaski County is 2.82 persons per household, with single female/mother households (1,576 | 10.1%) accounting for the largest median household size of 3.88 persons per household. non-family households (5,062 | 32.3%) represent the smallest median household size with 1.33 persons per household.
| Household Type | # Households | Household Size |
| Married-Couple | 8,485 (54.2%) | 3.49 |
| Single Male/Father | 530 (3.4%) | 3.38 |
| Single Female/Mother | 1,576 (10.1%) | 3.88 |
| Non-family | 5,062 (32.3%) | 1.33 |
| Total Households | 15,653 (100.0%) | 2.82 |
Household Size by Marriage Status in Pulaski County
Out of a total of 15,653 households in Pulaski County, 10,591 (67.7%) are family households, while 5,062 (32.3%) are nonfamily households. The most numerous type of family households are 2-person households, comprising 4,226, and the most common type of nonfamily households are 1-person households, comprising 4,322.
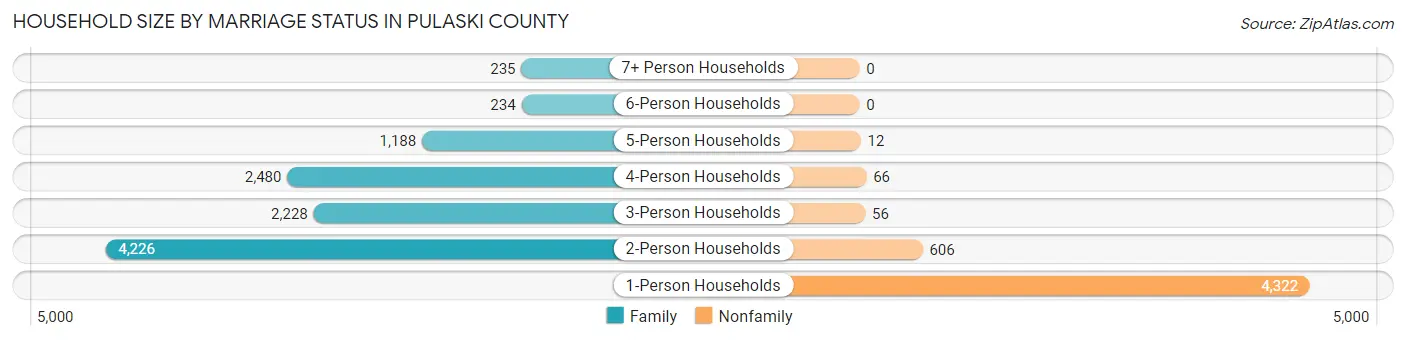
| Household Size | Family Households | Nonfamily Households |
| 1-Person Households | - | 4,322 (27.6%) |
| 2-Person Households | 4,226 (27.0%) | 606 (3.9%) |
| 3-Person Households | 2,228 (14.2%) | 56 (0.4%) |
| 4-Person Households | 2,480 (15.8%) | 66 (0.4%) |
| 5-Person Households | 1,188 (7.6%) | 12 (0.1%) |
| 6-Person Households | 234 (1.5%) | 0 (0.0%) |
| 7+ Person Households | 235 (1.5%) | 0 (0.0%) |
| Total | 10,591 (67.7%) | 5,062 (32.3%) |
Female Fertility in Pulaski County
Fertility by Age in Pulaski County
Average fertility rate in Pulaski County is 49.0 births per 1,000 women. Women in the age bracket of 20 to 34 years have the highest fertility rate with 67.0 births per 1,000 women. Women in the age bracket of 20 to 34 years acount for 63.0% of all women with births.
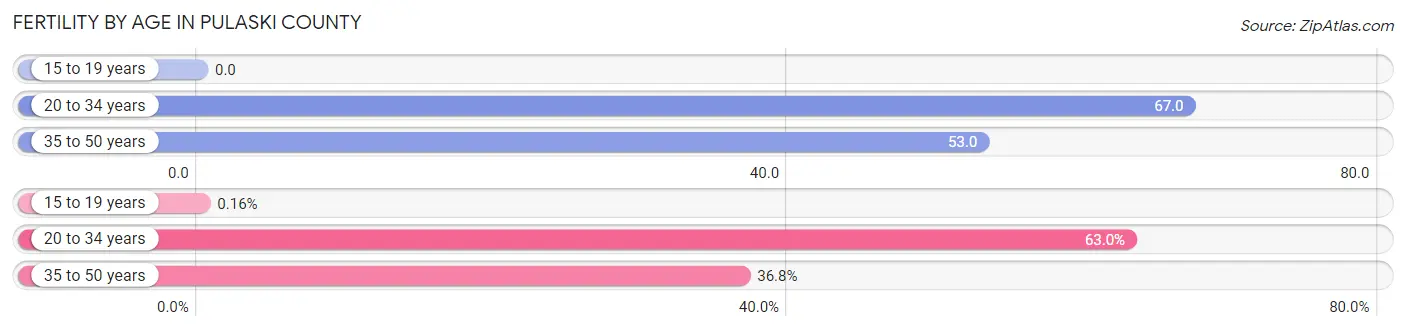
| Age Bracket | Women with Births | Births / 1,000 Women |
| 15 to 19 years | 1 (0.2%) | 0.0 |
| 20 to 34 years | 406 (63.0%) | 67.0 |
| 35 to 50 years | 237 (36.8%) | 53.0 |
| Total | 644 (100.0%) | 49.0 |
Fertility by Age by Marriage Status in Pulaski County
84.9% of women with births (644) in Pulaski County are married. The highest percentage of unmarried women with births falls into 15 to 19 years age bracket with 100.0% of them unmarried at the time of birth, while the lowest percentage of unmarried women with births belong to 20 to 34 years age bracket with 5.2% of them unmarried.
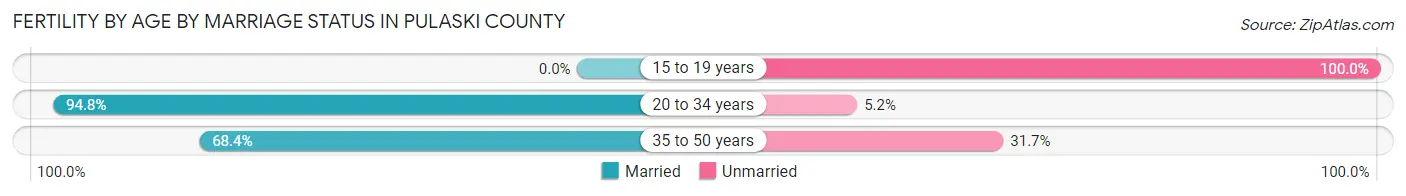
| Age Bracket | Married | Unmarried |
| 15 to 19 years | 0 (0.0%) | 1 (100.0%) |
| 20 to 34 years | 385 (94.8%) | 21 (5.2%) |
| 35 to 50 years | 162 (68.3%) | 75 (31.7%) |
| Total | 547 (84.9%) | 97 (15.1%) |
Fertility by Education in Pulaski County
Average fertility rate in Pulaski County is 49.0 births per 1,000 women. Women with the education attainment of high school diploma have the highest fertility rate of 87.0 births per 1,000 women, while women with the education attainment of less than high school have the lowest fertility at 13.0 births per 1,000 women. Women with the education attainment of high school diploma represent 48.4% of all women with births.
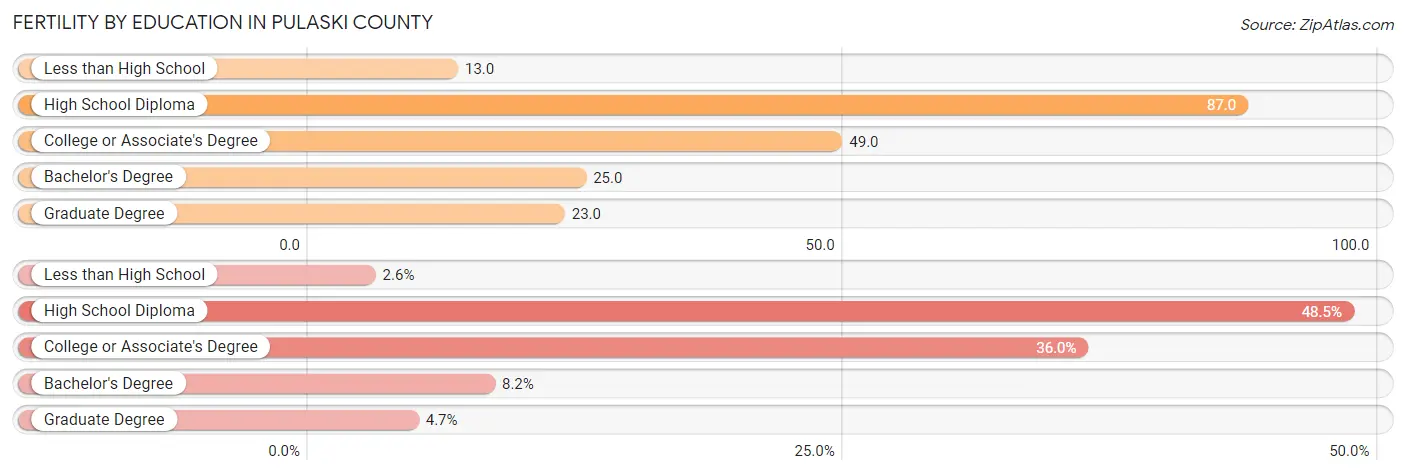
| Educational Attainment | Women with Births | Births / 1,000 Women |
| Less than High School | 17 (2.6%) | 13.0 |
| High School Diploma | 312 (48.4%) | 87.0 |
| College or Associate's Degree | 232 (36.0%) | 49.0 |
| Bachelor's Degree | 53 (8.2%) | 25.0 |
| Graduate Degree | 30 (4.7%) | 23.0 |
| Total | 644 (100.0%) | 49.0 |
Fertility by Education by Marriage Status in Pulaski County
15.1% of women with births in Pulaski County are unmarried. Women with the educational attainment of less than high school are most likely to be married with 100.0% of them married at childbirth, while women with the educational attainment of high school diploma are least likely to be married with 27.2% of them unmarried at childbirth.
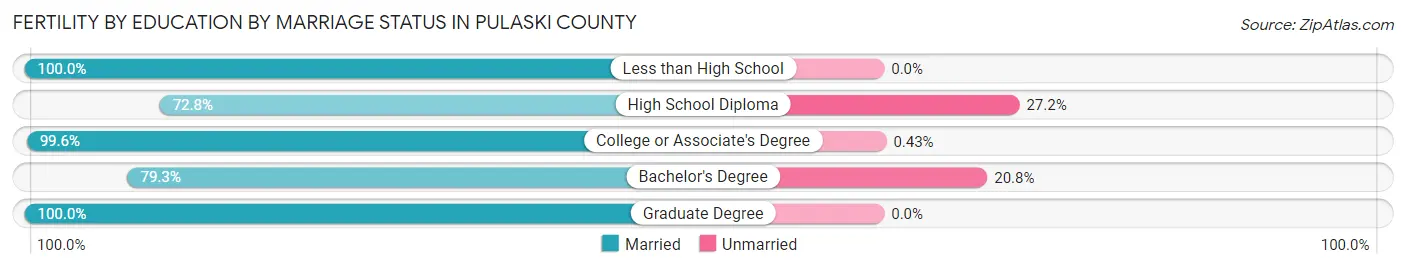
| Educational Attainment | Married | Unmarried |
| Less than High School | 17 (100.0%) | 0 (0.0%) |
| High School Diploma | 227 (72.8%) | 85 (27.2%) |
| College or Associate's Degree | 231 (99.6%) | 1 (0.4%) |
| Bachelor's Degree | 42 (79.2%) | 11 (20.7%) |
| Graduate Degree | 30 (100.0%) | 0 (0.0%) |
| Total | 547 (84.9%) | 97 (15.1%) |
Employment Characteristics in Pulaski County
Employment by Class of Employer in Pulaski County
Among the 26,813 employed individuals in Pulaski County, federal government employees (12,384 | 46.2%), private company employees (10,038 | 37.4%), and local government employees (1,228 | 4.6%) make up the most common classes of employment.
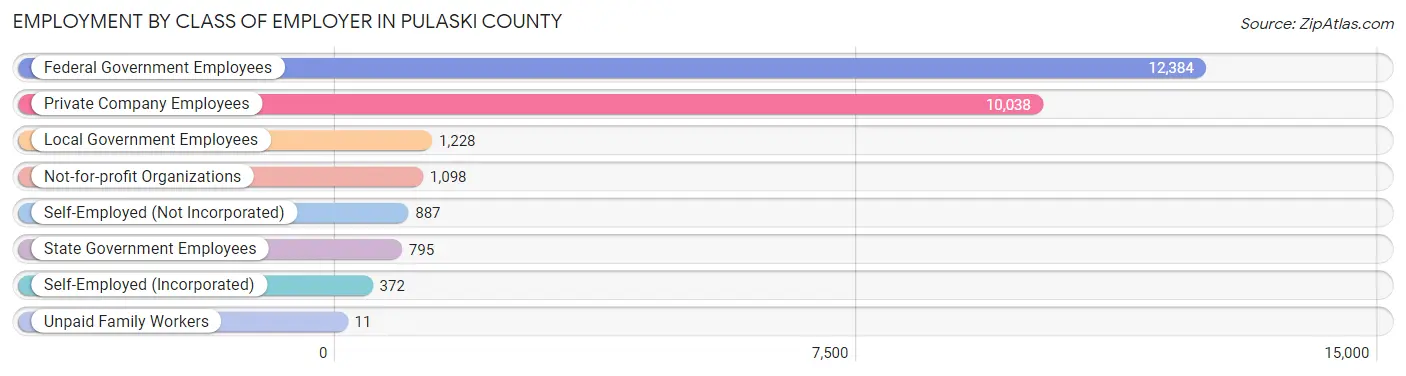
| Employer Class | # Employees | % Employees |
| Private Company Employees | 10,038 | 37.4% |
| Self-Employed (Incorporated) | 372 | 1.4% |
| Self-Employed (Not Incorporated) | 887 | 3.3% |
| Not-for-profit Organizations | 1,098 | 4.1% |
| Local Government Employees | 1,228 | 4.6% |
| State Government Employees | 795 | 3.0% |
| Federal Government Employees | 12,384 | 46.2% |
| Unpaid Family Workers | 11 | 0.0% |
| Total | 26,813 | 100.0% |
Employment Status by Age in Pulaski County
According to the labor force statistics for Pulaski County, out of the total population over 16 years of age (43,044), 68.3% or 29,399 individuals are in the labor force, with 4.7% or 1,382 of them unemployed. The age group with the highest labor force participation rate is 25 to 29 years, with 88.8% or 4,475 individuals in the labor force. Within the labor force, the 65 to 74 years age range has the highest percentage of unemployed individuals, with 9.5% or 30 of them being unemployed.
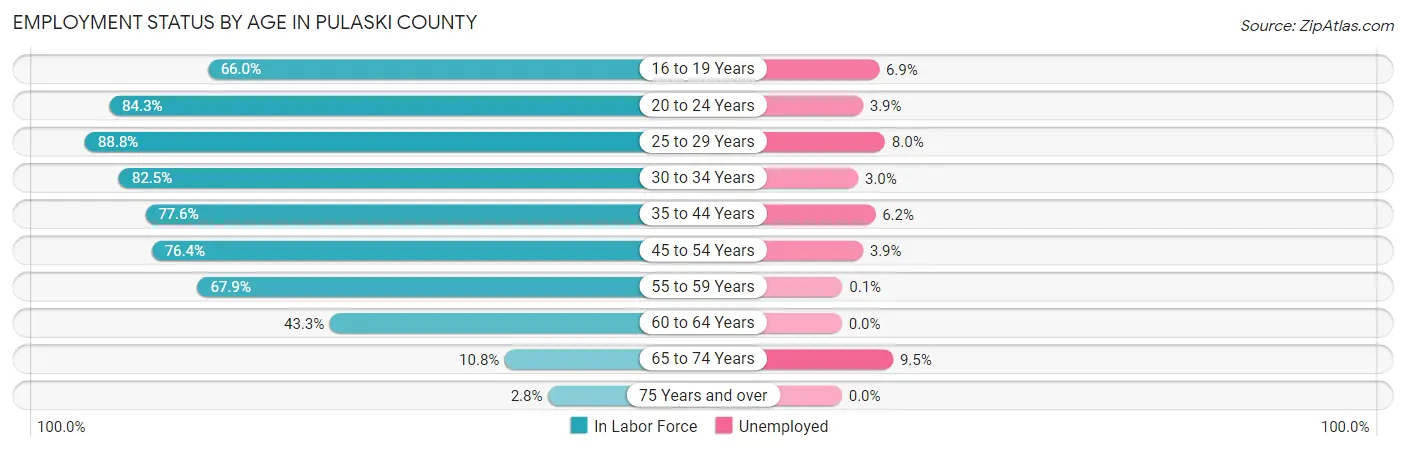
| Age Bracket | In Labor Force | Unemployed |
| 16 to 19 Years | 4,202 (66.0%) | 290 (6.9%) |
| 20 to 24 Years | 6,068 (84.3%) | 237 (3.9%) |
| 25 to 29 Years | 4,475 (88.8%) | 358 (8.0%) |
| 30 to 34 Years | 3,634 (82.5%) | 109 (3.0%) |
| 35 to 44 Years | 4,866 (77.6%) | 302 (6.2%) |
| 45 to 54 Years | 3,422 (76.4%) | 133 (3.9%) |
| 55 to 59 Years | 1,369 (67.9%) | 1 (0.1%) |
| 60 to 64 Years | 982 (43.3%) | 0 (0.0%) |
| 65 to 74 Years | 318 (10.8%) | 30 (9.5%) |
| 75 Years and over | 58 (2.8%) | 0 (0.0%) |
| Total | 29,399 (68.3%) | 1,382 (4.7%) |
Employment Status by Educational Attainment in Pulaski County
According to labor force statistics for Pulaski County, 76.6% of individuals (18,749) out of the total population between 25 and 64 years of age (24,476) are in the labor force, with 4.6% or 862 of them being unemployed. The group with the highest labor force participation rate are those with the educational attainment of bachelor's degree or higher, with 90.1% or 6,220 individuals in the labor force. Within the labor force, individuals with less than high school education have the highest percentage of unemployment, with 10.1% or 38 of them being unemployed.
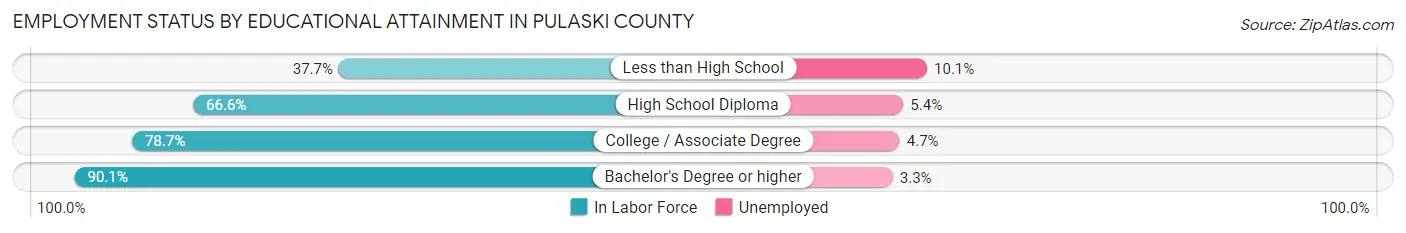
| Educational Attainment | In Labor Force | Unemployed |
| Less than High School | 381 (37.7%) | 102 (10.1%) |
| High School Diploma | 4,891 (66.6%) | 397 (5.4%) |
| College / Associate Degree | 7,255 (78.7%) | 433 (4.7%) |
| Bachelor's Degree or higher | 6,220 (90.1%) | 228 (3.3%) |
| Total | 18,749 (76.6%) | 1,126 (4.6%) |
Employment Occupations by Sex in Pulaski County
Management, Business, Science and Arts Occupations
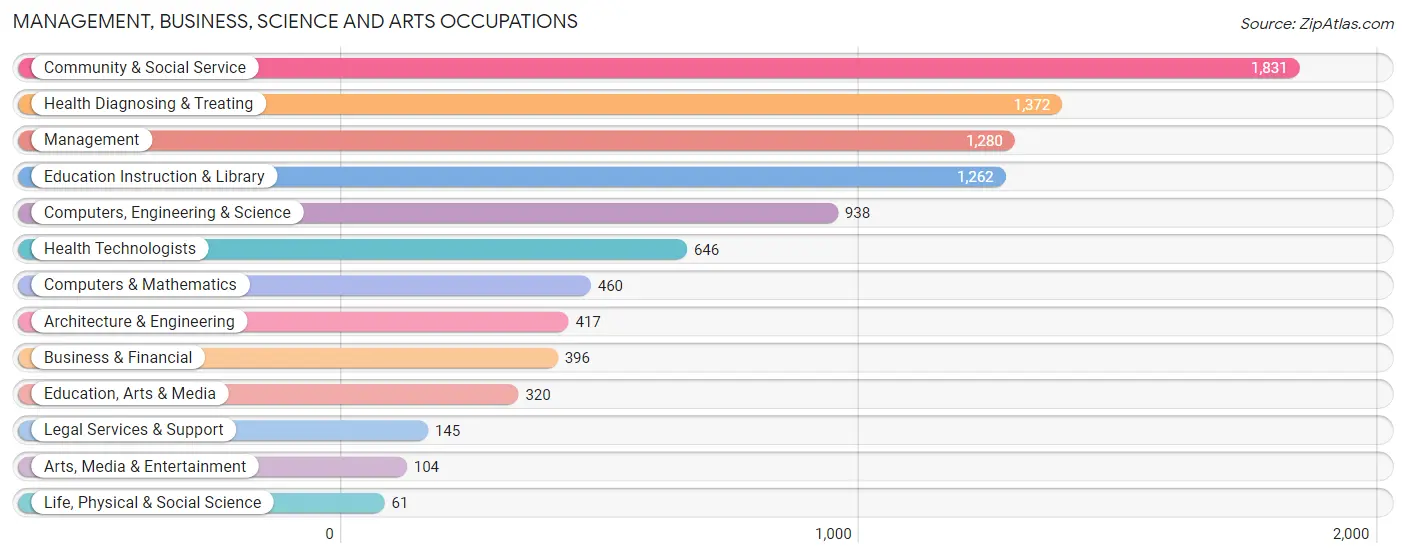
The most common Management, Business, Science and Arts occupations in Pulaski County are Community & Social Service (1,831 | 9.9%), Health Diagnosing & Treating (1,372 | 7.4%), Management (1,280 | 6.9%), Education Instruction & Library (1,262 | 6.8%), and Computers, Engineering & Science (938 | 5.1%).
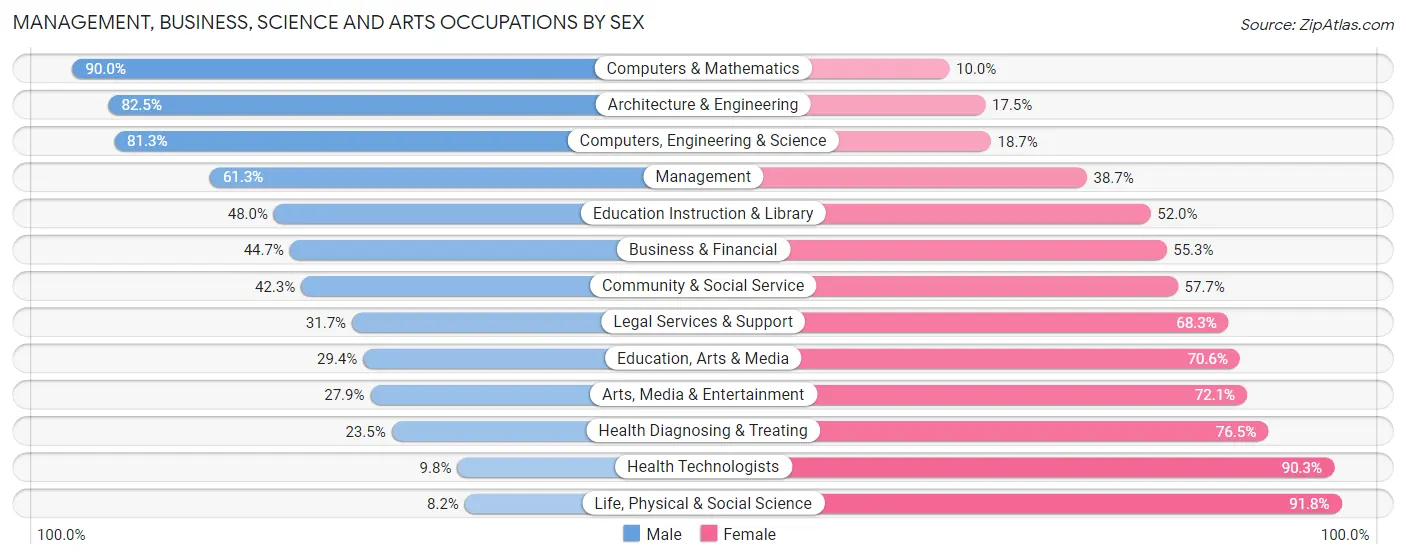
Management, Business, Science and Arts Occupations by Sex
Within the Management, Business, Science and Arts occupations in Pulaski County, the most male-oriented occupations are Computers & Mathematics (90.0%), Architecture & Engineering (82.5%), and Computers, Engineering & Science (81.3%), while the most female-oriented occupations are Life, Physical & Social Science (91.8%), Health Technologists (90.2%), and Health Diagnosing & Treating (76.5%).
| Occupation | Male | Female |
| Management | 785 (61.3%) | 495 (38.7%) |
| Business & Financial | 177 (44.7%) | 219 (55.3%) |
| Computers, Engineering & Science | 763 (81.3%) | 175 (18.7%) |
| Computers & Mathematics | 414 (90.0%) | 46 (10.0%) |
| Architecture & Engineering | 344 (82.5%) | 73 (17.5%) |
| Life, Physical & Social Science | 5 (8.2%) | 56 (91.8%) |
| Community & Social Service | 775 (42.3%) | 1,056 (57.7%) |
| Education, Arts & Media | 94 (29.4%) | 226 (70.6%) |
| Legal Services & Support | 46 (31.7%) | 99 (68.3%) |
| Education Instruction & Library | 606 (48.0%) | 656 (52.0%) |
| Arts, Media & Entertainment | 29 (27.9%) | 75 (72.1%) |
| Health Diagnosing & Treating | 322 (23.5%) | 1,050 (76.5%) |
| Health Technologists | 63 (9.8%) | 583 (90.2%) |
| Total (Category) | 2,822 (48.5%) | 2,995 (51.5%) |
| Total (Overall) | 10,627 (57.5%) | 7,850 (42.5%) |
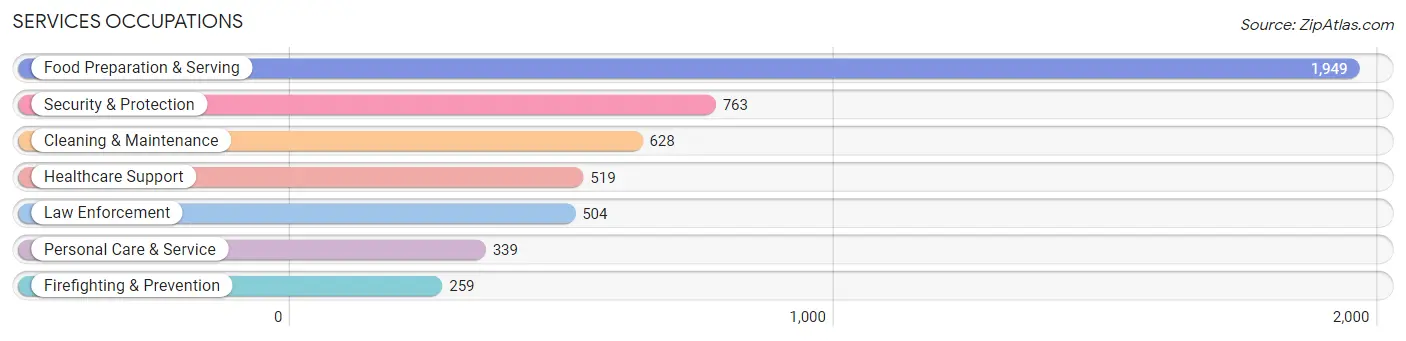
Services Occupations
The most common Services occupations in Pulaski County are Food Preparation & Serving (1,949 | 10.5%), Security & Protection (763 | 4.1%), Cleaning & Maintenance (628 | 3.4%), Healthcare Support (519 | 2.8%), and Law Enforcement (504 | 2.7%).
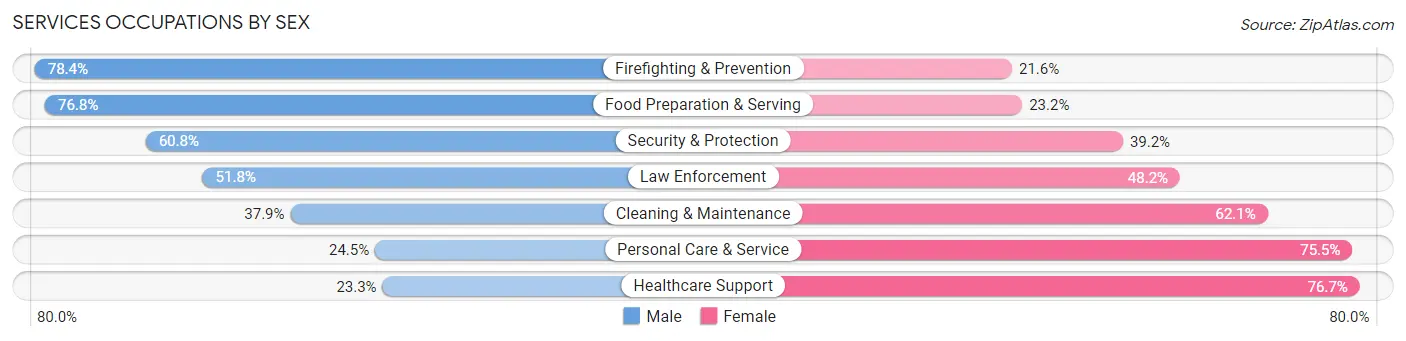
Services Occupations by Sex
Within the Services occupations in Pulaski County, the most male-oriented occupations are Firefighting & Prevention (78.4%), Food Preparation & Serving (76.8%), and Security & Protection (60.8%), while the most female-oriented occupations are Healthcare Support (76.7%), Personal Care & Service (75.5%), and Cleaning & Maintenance (62.1%).
| Occupation | Male | Female |
| Healthcare Support | 121 (23.3%) | 398 (76.7%) |
| Security & Protection | 464 (60.8%) | 299 (39.2%) |
| Firefighting & Prevention | 203 (78.4%) | 56 (21.6%) |
| Law Enforcement | 261 (51.8%) | 243 (48.2%) |
| Food Preparation & Serving | 1,496 (76.8%) | 453 (23.2%) |
| Cleaning & Maintenance | 238 (37.9%) | 390 (62.1%) |
| Personal Care & Service | 83 (24.5%) | 256 (75.5%) |
| Total (Category) | 2,402 (57.2%) | 1,796 (42.8%) |
| Total (Overall) | 10,627 (57.5%) | 7,850 (42.5%) |
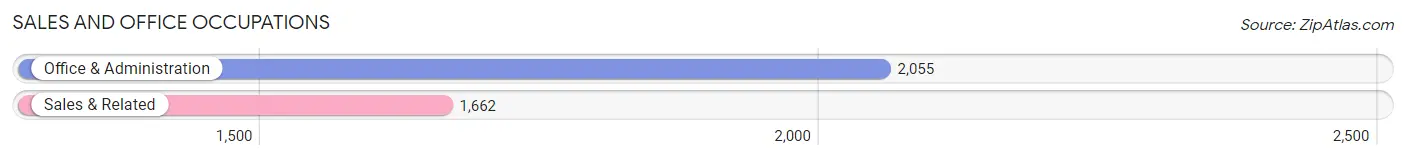
Sales and Office Occupations
The most common Sales and Office occupations in Pulaski County are Office & Administration (2,055 | 11.1%), and Sales & Related (1,662 | 9.0%).
Sales and Office Occupations by Sex
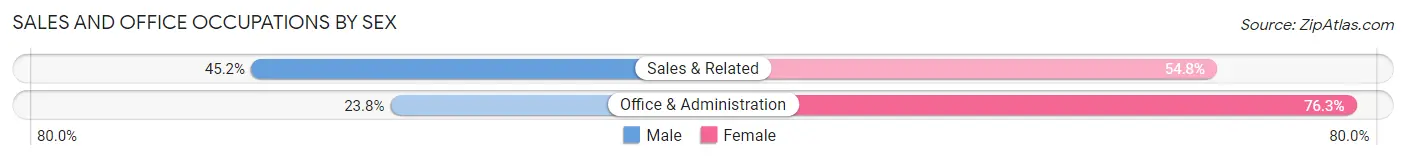
| Occupation | Male | Female |
| Sales & Related | 751 (45.2%) | 911 (54.8%) |
| Office & Administration | 488 (23.7%) | 1,567 (76.2%) |
| Total (Category) | 1,239 (33.3%) | 2,478 (66.7%) |
| Total (Overall) | 10,627 (57.5%) | 7,850 (42.5%) |
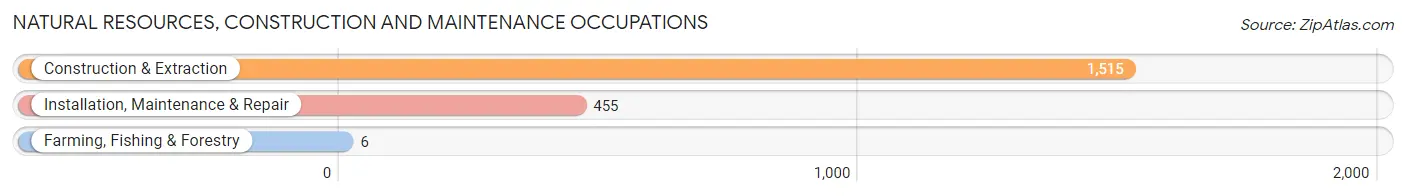
Natural Resources, Construction and Maintenance Occupations
The most common Natural Resources, Construction and Maintenance occupations in Pulaski County are Construction & Extraction (1,515 | 8.2%), Installation, Maintenance & Repair (455 | 2.5%), and Farming, Fishing & Forestry (6 | 0.0%).
Natural Resources, Construction and Maintenance Occupations by Sex
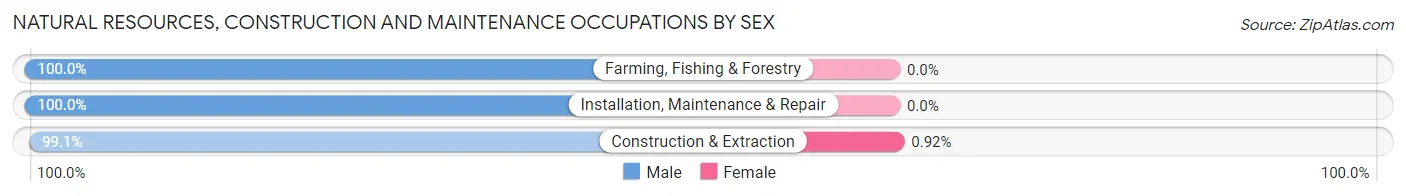
| Occupation | Male | Female |
| Farming, Fishing & Forestry | 6 (100.0%) | 0 (0.0%) |
| Construction & Extraction | 1,501 (99.1%) | 14 (0.9%) |
| Installation, Maintenance & Repair | 455 (100.0%) | 0 (0.0%) |
| Total (Category) | 1,962 (99.3%) | 14 (0.7%) |
| Total (Overall) | 10,627 (57.5%) | 7,850 (42.5%) |
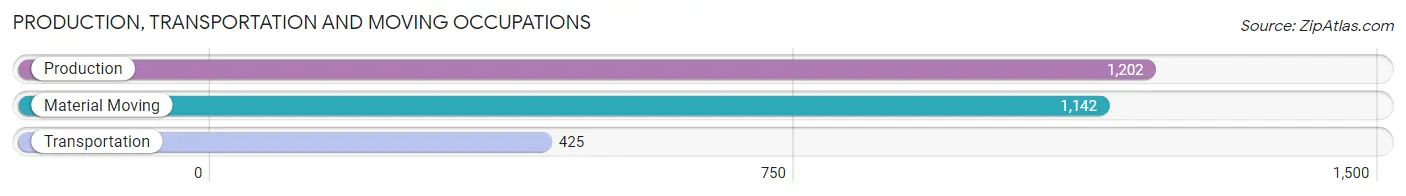
Production, Transportation and Moving Occupations
The most common Production, Transportation and Moving occupations in Pulaski County are Production (1,202 | 6.5%), Material Moving (1,142 | 6.2%), and Transportation (425 | 2.3%).
Production, Transportation and Moving Occupations by Sex
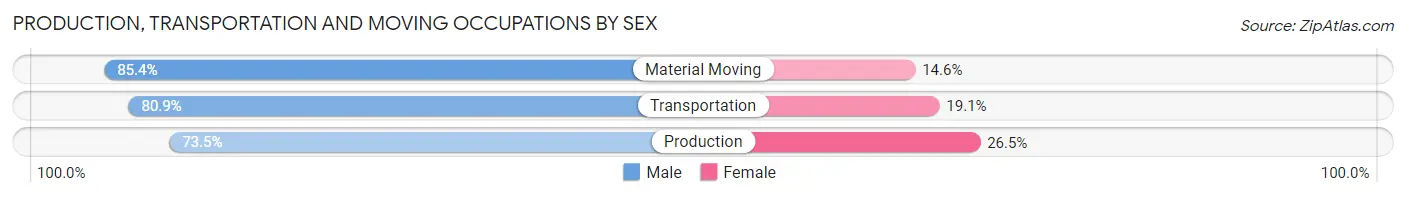
| Occupation | Male | Female |
| Production | 883 (73.5%) | 319 (26.5%) |
| Transportation | 344 (80.9%) | 81 (19.1%) |
| Material Moving | 975 (85.4%) | 167 (14.6%) |
| Total (Category) | 2,202 (79.5%) | 567 (20.5%) |
| Total (Overall) | 10,627 (57.5%) | 7,850 (42.5%) |
Employment Industries by Sex in Pulaski County
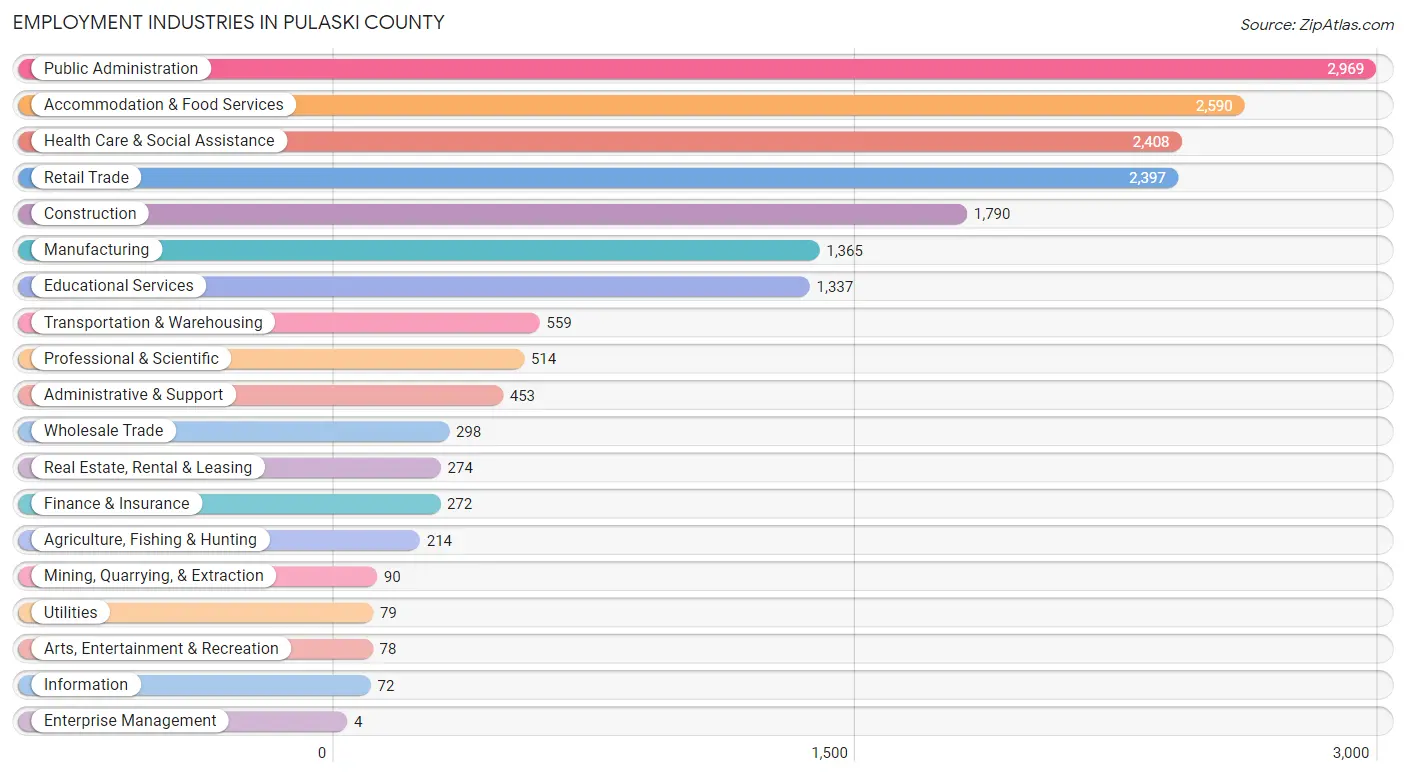
Employment Industries in Pulaski County
The major employment industries in Pulaski County include Public Administration (2,969 | 16.1%), Accommodation & Food Services (2,590 | 14.0%), Health Care & Social Assistance (2,408 | 13.0%), Retail Trade (2,397 | 13.0%), and Construction (1,790 | 9.7%).
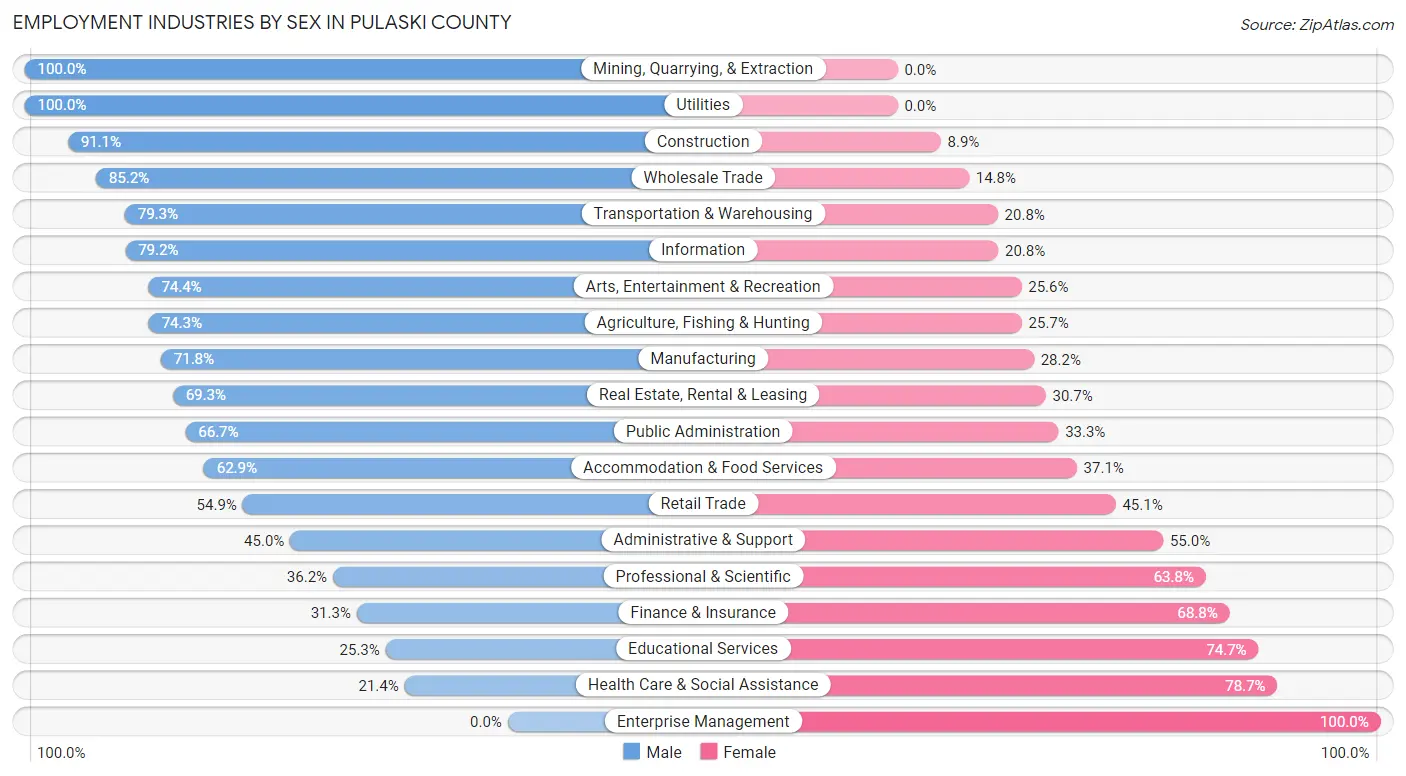
Employment Industries by Sex in Pulaski County
The Pulaski County industries that see more men than women are Mining, Quarrying, & Extraction (100.0%), Utilities (100.0%), and Construction (91.1%), whereas the industries that tend to have a higher number of women are Enterprise Management (100.0%), Health Care & Social Assistance (78.6%), and Educational Services (74.7%).
| Industry | Male | Female |
| Agriculture, Fishing & Hunting | 159 (74.3%) | 55 (25.7%) |
| Mining, Quarrying, & Extraction | 90 (100.0%) | 0 (0.0%) |
| Construction | 1,630 (91.1%) | 160 (8.9%) |
| Manufacturing | 980 (71.8%) | 385 (28.2%) |
| Wholesale Trade | 254 (85.2%) | 44 (14.8%) |
| Retail Trade | 1,315 (54.9%) | 1,082 (45.1%) |
| Transportation & Warehousing | 443 (79.2%) | 116 (20.7%) |
| Utilities | 79 (100.0%) | 0 (0.0%) |
| Information | 57 (79.2%) | 15 (20.8%) |
| Finance & Insurance | 85 (31.2%) | 187 (68.8%) |
| Real Estate, Rental & Leasing | 190 (69.3%) | 84 (30.7%) |
| Professional & Scientific | 186 (36.2%) | 328 (63.8%) |
| Enterprise Management | 0 (0.0%) | 4 (100.0%) |
| Administrative & Support | 204 (45.0%) | 249 (55.0%) |
| Educational Services | 338 (25.3%) | 999 (74.7%) |
| Health Care & Social Assistance | 514 (21.3%) | 1,894 (78.6%) |
| Arts, Entertainment & Recreation | 58 (74.4%) | 20 (25.6%) |
| Accommodation & Food Services | 1,629 (62.9%) | 961 (37.1%) |
| Public Administration | 1,981 (66.7%) | 988 (33.3%) |
| Total | 10,627 (57.5%) | 7,850 (42.5%) |
Education in Pulaski County
School Enrollment in Pulaski County
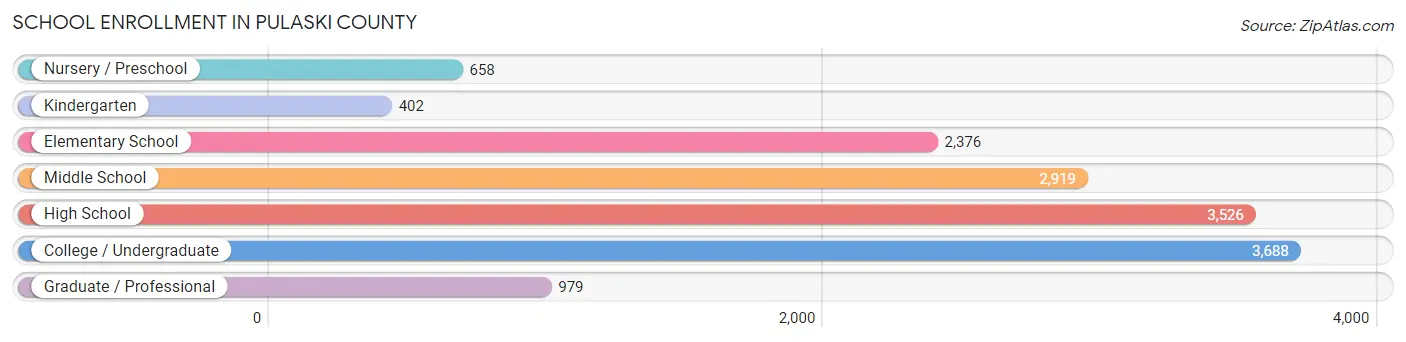
The most common levels of schooling among the 14,548 students in Pulaski County are college / undergraduate (3,688 | 25.4%), high school (3,526 | 24.2%), and middle school (2,919 | 20.1%).
| School Level | # Students | % Students |
| Nursery / Preschool | 658 | 4.5% |
| Kindergarten | 402 | 2.8% |
| Elementary School | 2,376 | 16.3% |
| Middle School | 2,919 | 20.1% |
| High School | 3,526 | 24.2% |
| College / Undergraduate | 3,688 | 25.4% |
| Graduate / Professional | 979 | 6.7% |
| Total | 14,548 | 100.0% |
School Enrollment by Age by Funding Source in Pulaski County
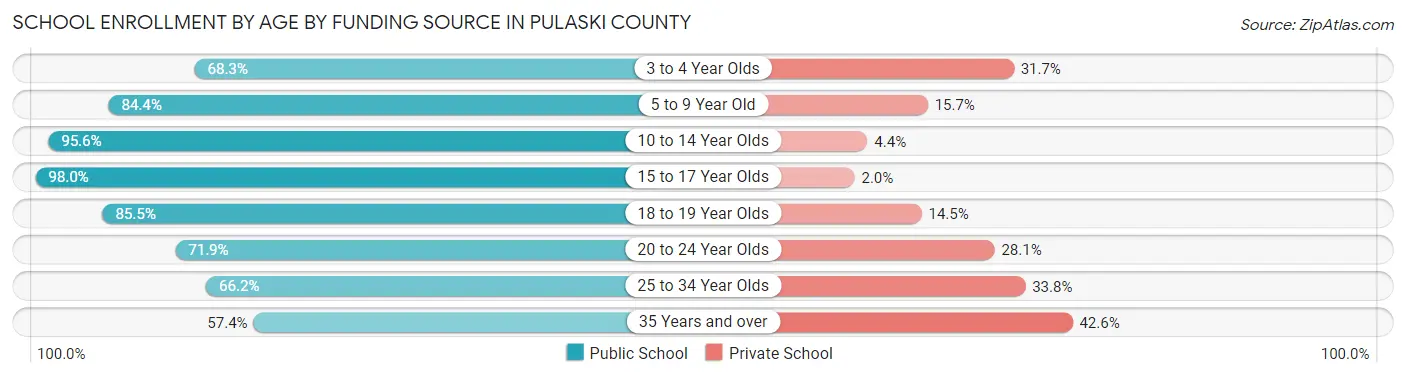
Out of a total of 14,548 students who are enrolled in schools in Pulaski County, 2,430 (16.7%) attend a private institution, while the remaining 12,118 (83.3%) are enrolled in public schools. The age group of 35 years and over has the highest likelihood of being enrolled in private schools, with 453 (42.6% in the age bracket) enrolled. Conversely, the age group of 15 to 17 year olds has the lowest likelihood of being enrolled in a private school, with 1,507 (98.0% in the age bracket) attending a public institution.
| Age Bracket | Public School | Private School |
| 3 to 4 Year Olds | 328 (68.3%) | 152 (31.7%) |
| 5 to 9 Year Old | 2,290 (84.4%) | 425 (15.7%) |
| 10 to 14 Year Olds | 3,220 (95.6%) | 149 (4.4%) |
| 15 to 17 Year Olds | 1,507 (98.0%) | 31 (2.0%) |
| 18 to 19 Year Olds | 2,298 (85.5%) | 390 (14.5%) |
| 20 to 24 Year Olds | 1,047 (71.9%) | 409 (28.1%) |
| 25 to 34 Year Olds | 820 (66.2%) | 419 (33.8%) |
| 35 Years and over | 610 (57.4%) | 453 (42.6%) |
| Total | 12,118 (83.3%) | 2,430 (16.7%) |
Educational Attainment by Field of Study in Pulaski County
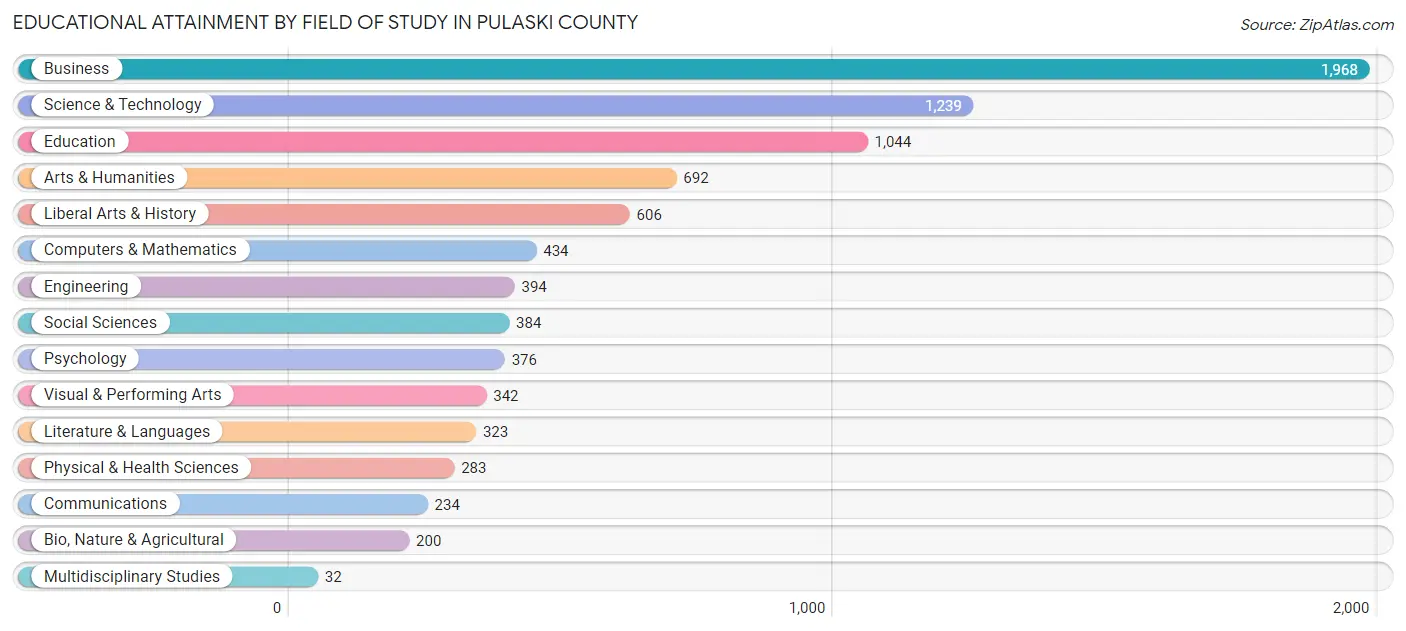
Business (1,968 | 23.0%), science & technology (1,239 | 14.5%), education (1,044 | 12.2%), arts & humanities (692 | 8.1%), and liberal arts & history (606 | 7.1%) are the most common fields of study among 8,551 individuals in Pulaski County who have obtained a bachelor's degree or higher.
| Field of Study | # Graduates | % Graduates |
| Computers & Mathematics | 434 | 5.1% |
| Bio, Nature & Agricultural | 200 | 2.3% |
| Physical & Health Sciences | 283 | 3.3% |
| Psychology | 376 | 4.4% |
| Social Sciences | 384 | 4.5% |
| Engineering | 394 | 4.6% |
| Multidisciplinary Studies | 32 | 0.4% |
| Science & Technology | 1,239 | 14.5% |
| Business | 1,968 | 23.0% |
| Education | 1,044 | 12.2% |
| Literature & Languages | 323 | 3.8% |
| Liberal Arts & History | 606 | 7.1% |
| Visual & Performing Arts | 342 | 4.0% |
| Communications | 234 | 2.7% |
| Arts & Humanities | 692 | 8.1% |
| Total | 8,551 | 100.0% |
Transportation & Commute in Pulaski County
Vehicle Availability by Sex in Pulaski County
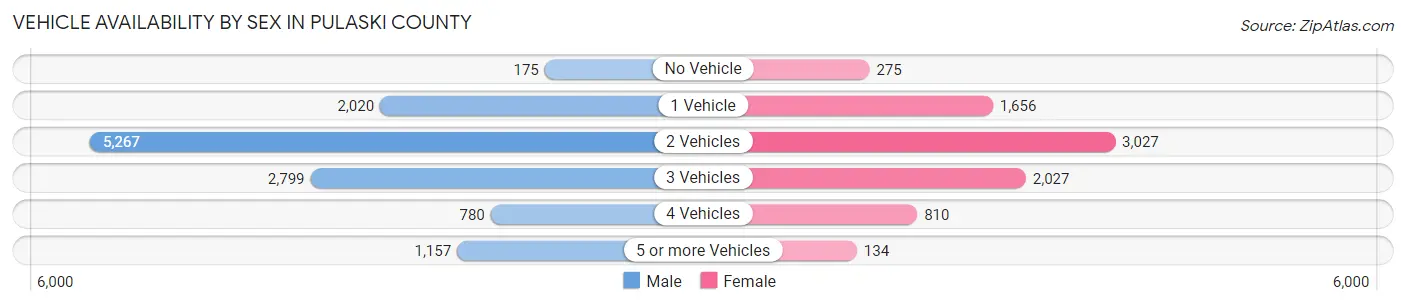
The most prevalent vehicle ownership categories in Pulaski County are males with 2 vehicles (5,267, accounting for 43.2%) and females with 2 vehicles (3,027, making up 66.4%).
| Vehicles Available | Male | Female |
| No Vehicle | 175 (1.4%) | 275 (3.5%) |
| 1 Vehicle | 2,020 (16.6%) | 1,656 (20.9%) |
| 2 Vehicles | 5,267 (43.2%) | 3,027 (38.2%) |
| 3 Vehicles | 2,799 (23.0%) | 2,027 (25.6%) |
| 4 Vehicles | 780 (6.4%) | 810 (10.2%) |
| 5 or more Vehicles | 1,157 (9.5%) | 134 (1.7%) |
| Total | 12,198 (100.0%) | 7,929 (100.0%) |
Commute Time in Pulaski County
The most frequently occuring commute durations in Pulaski County are 5 to 9 minutes (5,426 commuters, 21.2%), 15 to 19 minutes (3,910 commuters, 15.2%), and 20 to 24 minutes (3,254 commuters, 12.7%).
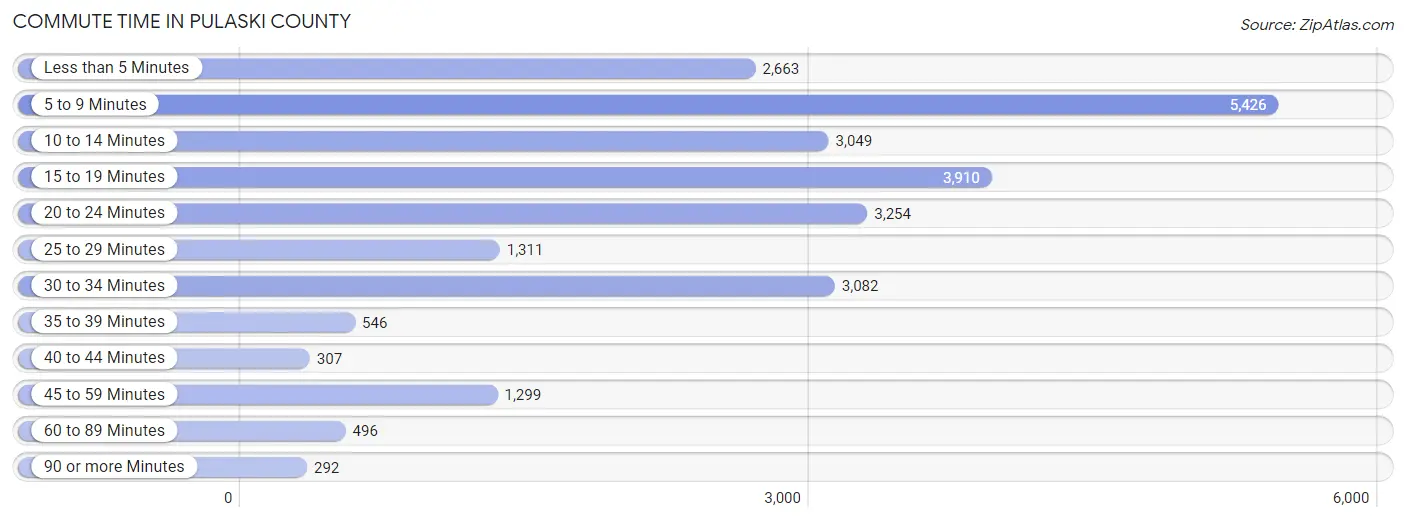
| Commute Time | # Commuters | % Commuters |
| Less than 5 Minutes | 2,663 | 10.4% |
| 5 to 9 Minutes | 5,426 | 21.2% |
| 10 to 14 Minutes | 3,049 | 11.9% |
| 15 to 19 Minutes | 3,910 | 15.2% |
| 20 to 24 Minutes | 3,254 | 12.7% |
| 25 to 29 Minutes | 1,311 | 5.1% |
| 30 to 34 Minutes | 3,082 | 12.0% |
| 35 to 39 Minutes | 546 | 2.1% |
| 40 to 44 Minutes | 307 | 1.2% |
| 45 to 59 Minutes | 1,299 | 5.1% |
| 60 to 89 Minutes | 496 | 1.9% |
| 90 or more Minutes | 292 | 1.1% |
Commute Time by Sex in Pulaski County
The most common commute times in Pulaski County are 5 to 9 minutes (2,743 commuters, 17.9%) for males and 5 to 9 minutes (2,683 commuters, 26.0%) for females.
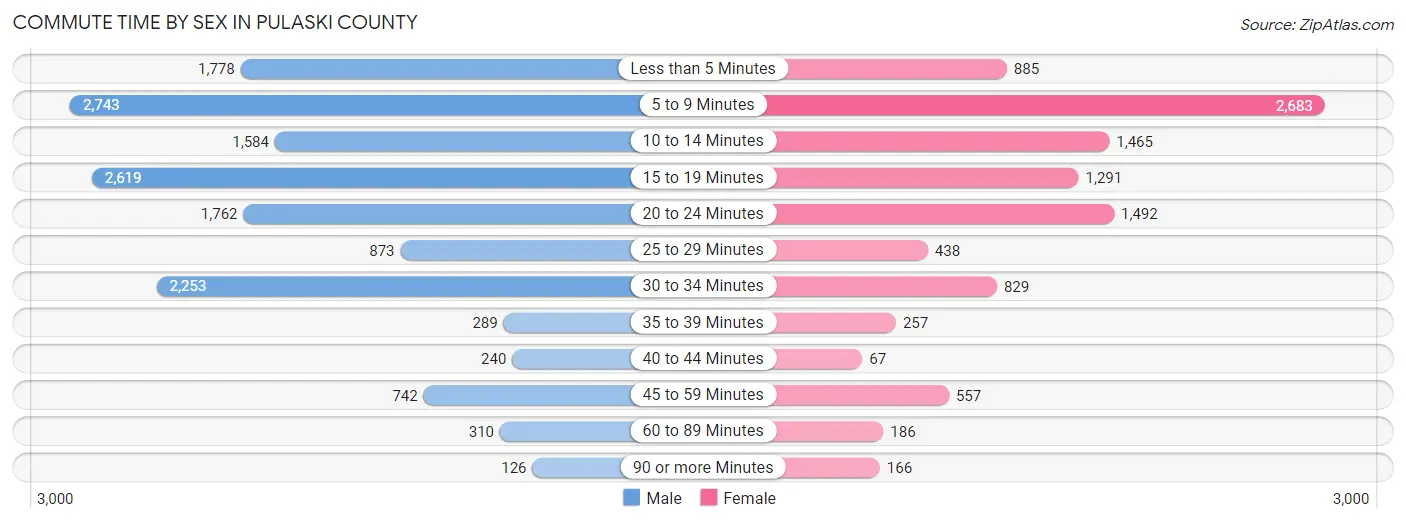
| Commute Time | Male | Female |
| Less than 5 Minutes | 1,778 (11.6%) | 885 (8.6%) |
| 5 to 9 Minutes | 2,743 (17.9%) | 2,683 (26.0%) |
| 10 to 14 Minutes | 1,584 (10.3%) | 1,465 (14.2%) |
| 15 to 19 Minutes | 2,619 (17.1%) | 1,291 (12.5%) |
| 20 to 24 Minutes | 1,762 (11.5%) | 1,492 (14.5%) |
| 25 to 29 Minutes | 873 (5.7%) | 438 (4.3%) |
| 30 to 34 Minutes | 2,253 (14.7%) | 829 (8.0%) |
| 35 to 39 Minutes | 289 (1.9%) | 257 (2.5%) |
| 40 to 44 Minutes | 240 (1.6%) | 67 (0.6%) |
| 45 to 59 Minutes | 742 (4.8%) | 557 (5.4%) |
| 60 to 89 Minutes | 310 (2.0%) | 186 (1.8%) |
| 90 or more Minutes | 126 (0.8%) | 166 (1.6%) |
Time of Departure to Work by Sex in Pulaski County
The most frequent times of departure to work in Pulaski County are 12:00 AM to 4:59 AM (2,733, 17.8%) for males and 12:00 AM to 4:59 AM (2,289, 22.2%) for females.
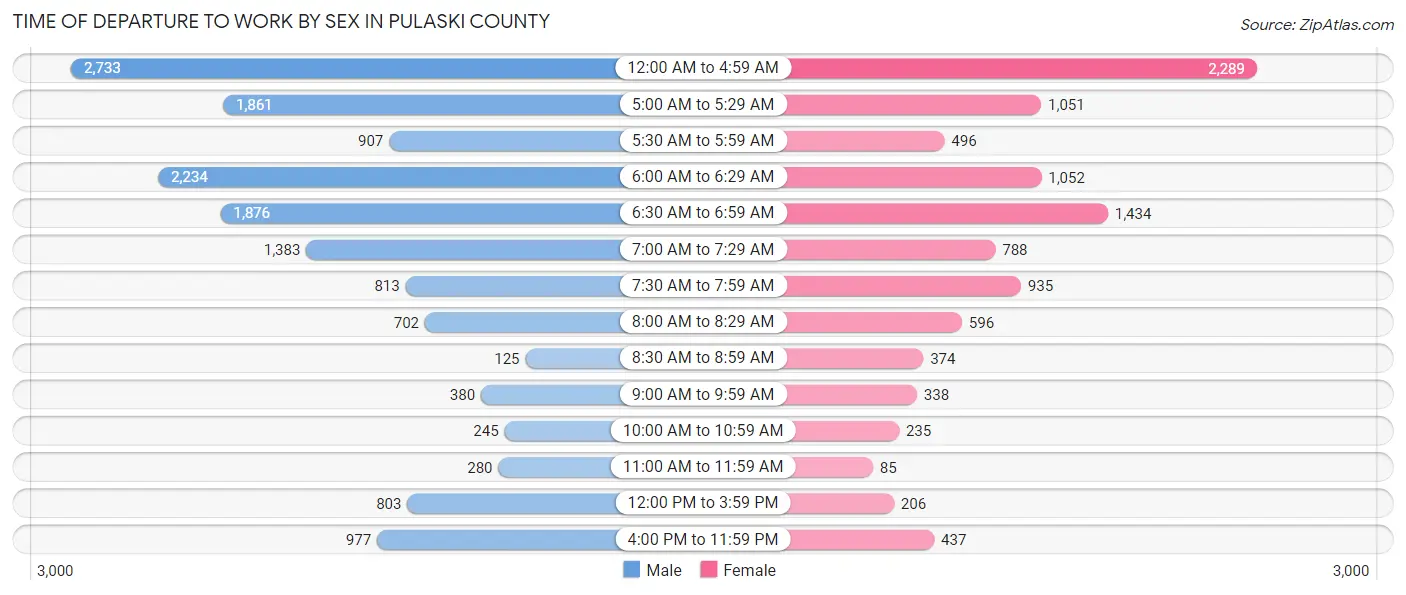
| Time of Departure | Male | Female |
| 12:00 AM to 4:59 AM | 2,733 (17.8%) | 2,289 (22.2%) |
| 5:00 AM to 5:29 AM | 1,861 (12.1%) | 1,051 (10.2%) |
| 5:30 AM to 5:59 AM | 907 (5.9%) | 496 (4.8%) |
| 6:00 AM to 6:29 AM | 2,234 (14.6%) | 1,052 (10.2%) |
| 6:30 AM to 6:59 AM | 1,876 (12.2%) | 1,434 (13.9%) |
| 7:00 AM to 7:29 AM | 1,383 (9.0%) | 788 (7.6%) |
| 7:30 AM to 7:59 AM | 813 (5.3%) | 935 (9.1%) |
| 8:00 AM to 8:29 AM | 702 (4.6%) | 596 (5.8%) |
| 8:30 AM to 8:59 AM | 125 (0.8%) | 374 (3.6%) |
| 9:00 AM to 9:59 AM | 380 (2.5%) | 338 (3.3%) |
| 10:00 AM to 10:59 AM | 245 (1.6%) | 235 (2.3%) |
| 11:00 AM to 11:59 AM | 280 (1.8%) | 85 (0.8%) |
| 12:00 PM to 3:59 PM | 803 (5.2%) | 206 (2.0%) |
| 4:00 PM to 11:59 PM | 977 (6.4%) | 437 (4.2%) |
| Total | 15,319 (100.0%) | 10,316 (100.0%) |
Housing Occupancy in Pulaski County
Occupancy by Ownership in Pulaski County
Of the total 15,653 dwellings in Pulaski County, owner-occupied units account for 8,954 (57.2%), while renter-occupied units make up 6,699 (42.8%).
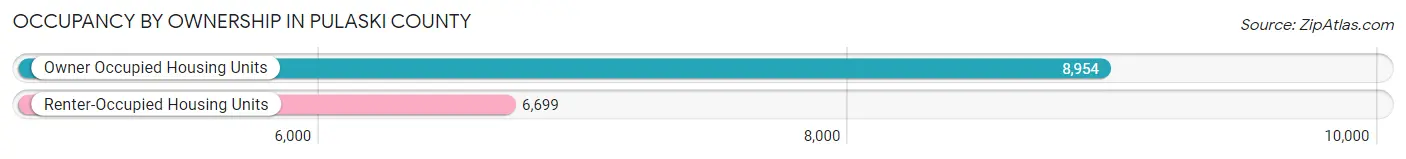
| Occupancy | # Housing Units | % Housing Units |
| Owner Occupied Housing Units | 8,954 | 57.2% |
| Renter-Occupied Housing Units | 6,699 | 42.8% |
| Total Occupied Housing Units | 15,653 | 100.0% |
Occupancy by Household Size in Pulaski County
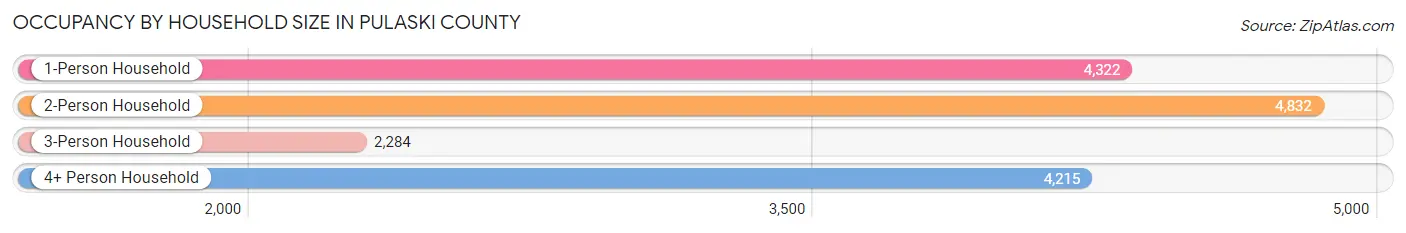
| Household Size | # Housing Units | % Housing Units |
| 1-Person Household | 4,322 | 27.6% |
| 2-Person Household | 4,832 | 30.9% |
| 3-Person Household | 2,284 | 14.6% |
| 4+ Person Household | 4,215 | 26.9% |
| Total Housing Units | 15,653 | 100.0% |
Occupancy by Ownership by Household Size in Pulaski County
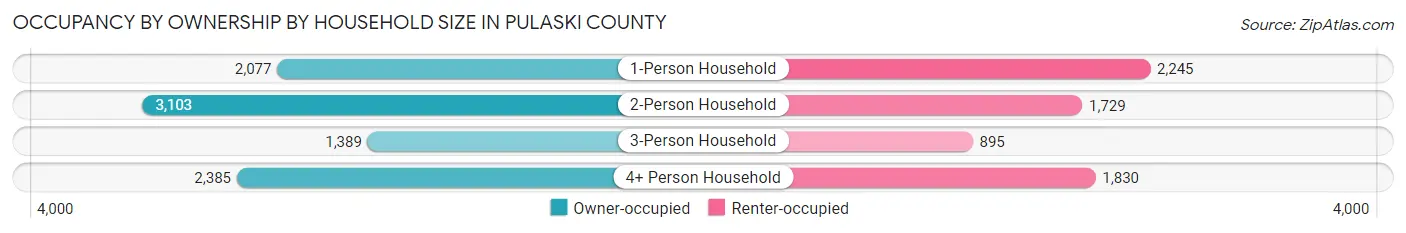
| Household Size | Owner-occupied | Renter-occupied |
| 1-Person Household | 2,077 (48.1%) | 2,245 (51.9%) |
| 2-Person Household | 3,103 (64.2%) | 1,729 (35.8%) |
| 3-Person Household | 1,389 (60.8%) | 895 (39.2%) |
| 4+ Person Household | 2,385 (56.6%) | 1,830 (43.4%) |
| Total Housing Units | 8,954 (57.2%) | 6,699 (42.8%) |
Occupancy by Educational Attainment in Pulaski County
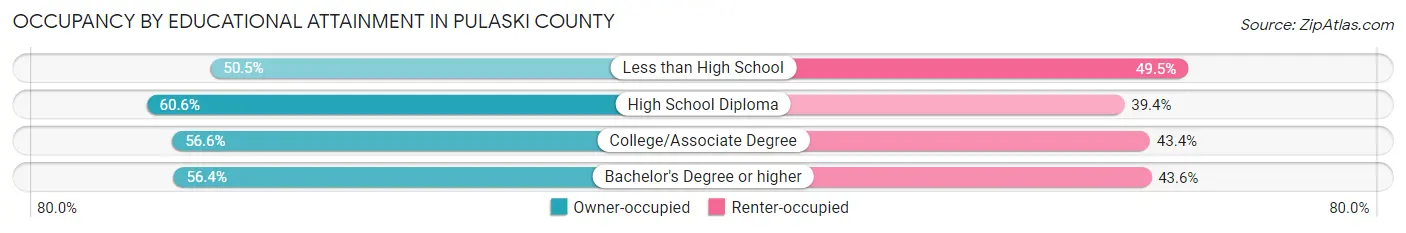
| Household Size | Owner-occupied | Renter-occupied |
| Less than High School | 474 (50.5%) | 464 (49.5%) |
| High School Diploma | 2,457 (60.6%) | 1,595 (39.4%) |
| College/Associate Degree | 3,278 (56.6%) | 2,516 (43.4%) |
| Bachelor's Degree or higher | 2,745 (56.4%) | 2,124 (43.6%) |
Occupancy by Age of Householder in Pulaski County
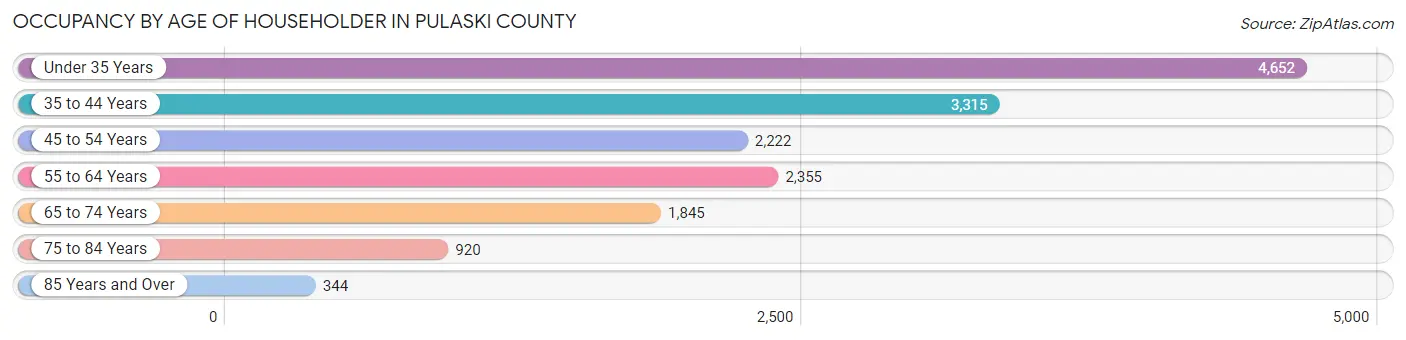
| Age Bracket | # Households | % Households |
| Under 35 Years | 4,652 | 29.7% |
| 35 to 44 Years | 3,315 | 21.2% |
| 45 to 54 Years | 2,222 | 14.2% |
| 55 to 64 Years | 2,355 | 15.0% |
| 65 to 74 Years | 1,845 | 11.8% |
| 75 to 84 Years | 920 | 5.9% |
| 85 Years and Over | 344 | 2.2% |
| Total | 15,653 | 100.0% |
Housing Finances in Pulaski County
Median Income by Occupancy in Pulaski County
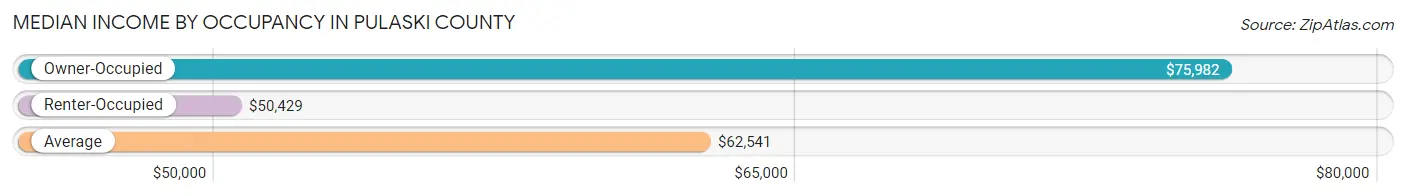
| Occupancy Type | # Households | Median Income |
| Owner-Occupied | 8,954 (57.2%) | $75,982 |
| Renter-Occupied | 6,699 (42.8%) | $50,429 |
| Average | 15,653 (100.0%) | $62,541 |
Occupancy by Householder Income Bracket in Pulaski County
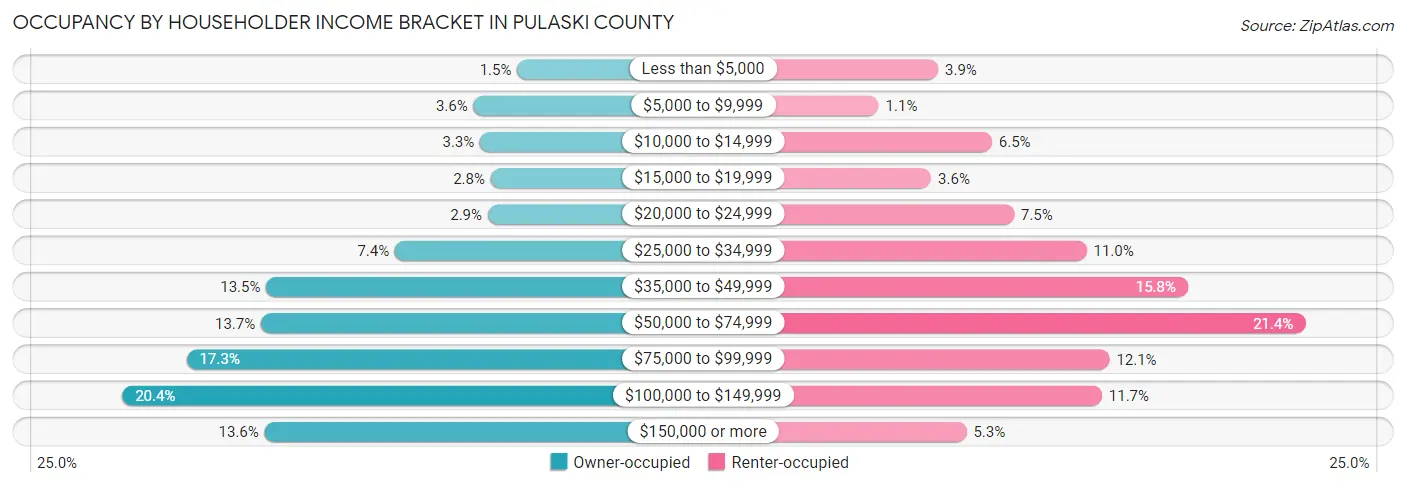
| Income Bracket | Owner-occupied | Renter-occupied |
| Less than $5,000 | 138 (1.5%) | 263 (3.9%) |
| $5,000 to $9,999 | 324 (3.6%) | 74 (1.1%) |
| $10,000 to $14,999 | 296 (3.3%) | 435 (6.5%) |
| $15,000 to $19,999 | 251 (2.8%) | 241 (3.6%) |
| $20,000 to $24,999 | 263 (2.9%) | 505 (7.5%) |
| $25,000 to $34,999 | 659 (7.4%) | 737 (11.0%) |
| $35,000 to $49,999 | 1,208 (13.5%) | 1,060 (15.8%) |
| $50,000 to $74,999 | 1,230 (13.7%) | 1,434 (21.4%) |
| $75,000 to $99,999 | 1,548 (17.3%) | 810 (12.1%) |
| $100,000 to $149,999 | 1,822 (20.3%) | 786 (11.7%) |
| $150,000 or more | 1,215 (13.6%) | 354 (5.3%) |
| Total | 8,954 (100.0%) | 6,699 (100.0%) |
Monthly Housing Cost Tiers in Pulaski County
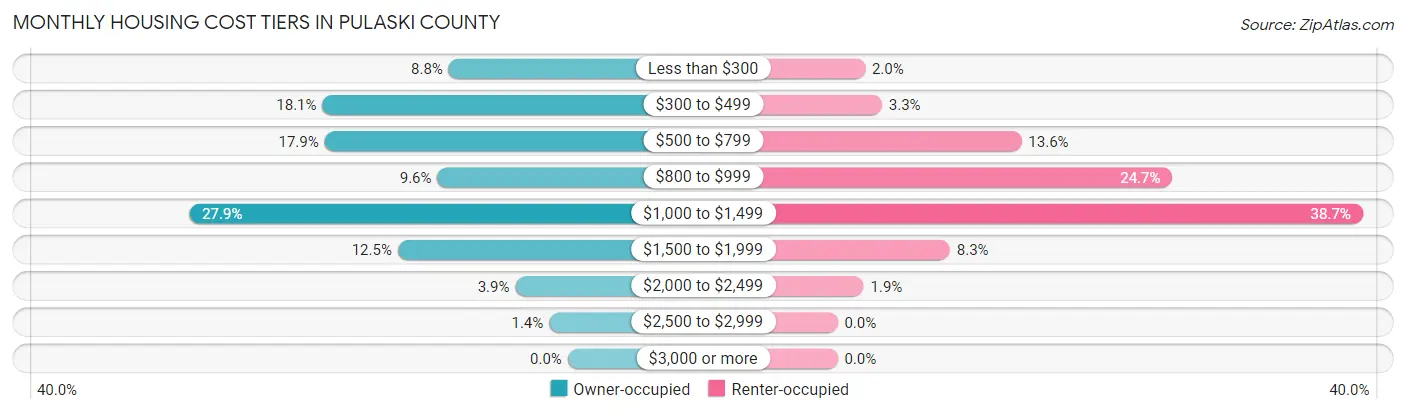
| Monthly Cost | Owner-occupied | Renter-occupied |
| Less than $300 | 785 (8.8%) | 136 (2.0%) |
| $300 to $499 | 1,618 (18.1%) | 219 (3.3%) |
| $500 to $799 | 1,604 (17.9%) | 908 (13.6%) |
| $800 to $999 | 860 (9.6%) | 1,652 (24.7%) |
| $1,000 to $1,499 | 2,497 (27.9%) | 2,591 (38.7%) |
| $1,500 to $1,999 | 1,121 (12.5%) | 555 (8.3%) |
| $2,000 to $2,499 | 346 (3.9%) | 129 (1.9%) |
| $2,500 to $2,999 | 123 (1.4%) | 0 (0.0%) |
| $3,000 or more | 0 (0.0%) | 0 (0.0%) |
| Total | 8,954 (100.0%) | 6,699 (100.0%) |
Physical Housing Characteristics in Pulaski County
Housing Structures in Pulaski County
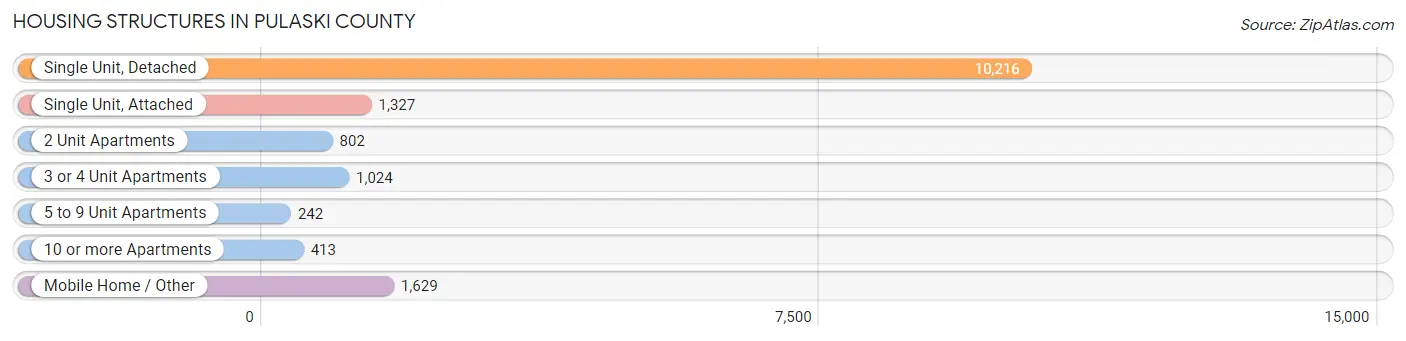
| Structure Type | # Housing Units | % Housing Units |
| Single Unit, Detached | 10,216 | 65.3% |
| Single Unit, Attached | 1,327 | 8.5% |
| 2 Unit Apartments | 802 | 5.1% |
| 3 or 4 Unit Apartments | 1,024 | 6.5% |
| 5 to 9 Unit Apartments | 242 | 1.5% |
| 10 or more Apartments | 413 | 2.6% |
| Mobile Home / Other | 1,629 | 10.4% |
| Total | 15,653 | 100.0% |
Housing Structures by Occupancy in Pulaski County
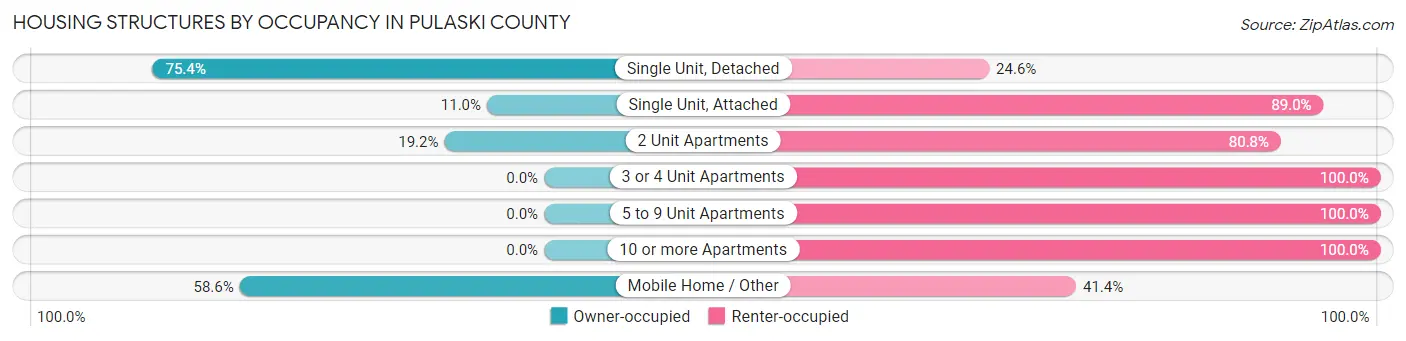
| Structure Type | Owner-occupied | Renter-occupied |
| Single Unit, Detached | 7,699 (75.4%) | 2,517 (24.6%) |
| Single Unit, Attached | 146 (11.0%) | 1,181 (89.0%) |
| 2 Unit Apartments | 154 (19.2%) | 648 (80.8%) |
| 3 or 4 Unit Apartments | 0 (0.0%) | 1,024 (100.0%) |
| 5 to 9 Unit Apartments | 0 (0.0%) | 242 (100.0%) |
| 10 or more Apartments | 0 (0.0%) | 413 (100.0%) |
| Mobile Home / Other | 955 (58.6%) | 674 (41.4%) |
| Total | 8,954 (57.2%) | 6,699 (42.8%) |
Housing Structures by Number of Rooms in Pulaski County
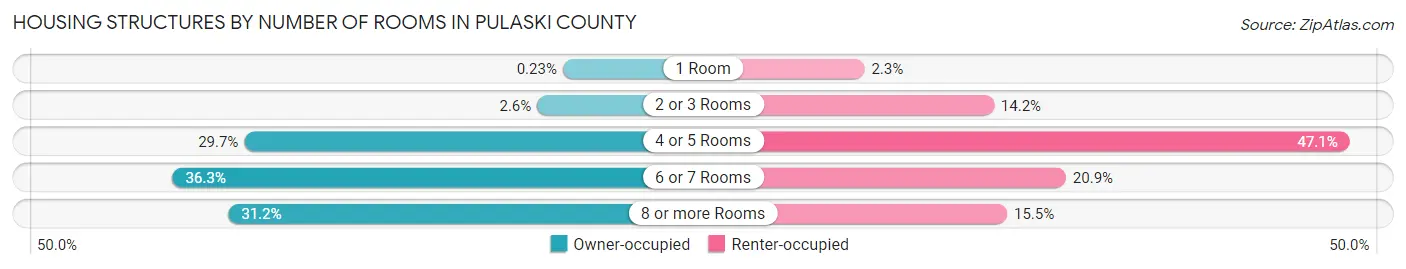
| Number of Rooms | Owner-occupied | Renter-occupied |
| 1 Room | 21 (0.2%) | 152 (2.3%) |
| 2 or 3 Rooms | 233 (2.6%) | 954 (14.2%) |
| 4 or 5 Rooms | 2,658 (29.7%) | 3,157 (47.1%) |
| 6 or 7 Rooms | 3,252 (36.3%) | 1,400 (20.9%) |
| 8 or more Rooms | 2,790 (31.2%) | 1,036 (15.5%) |
| Total | 8,954 (100.0%) | 6,699 (100.0%) |
Housing Structure by Heating Type in Pulaski County
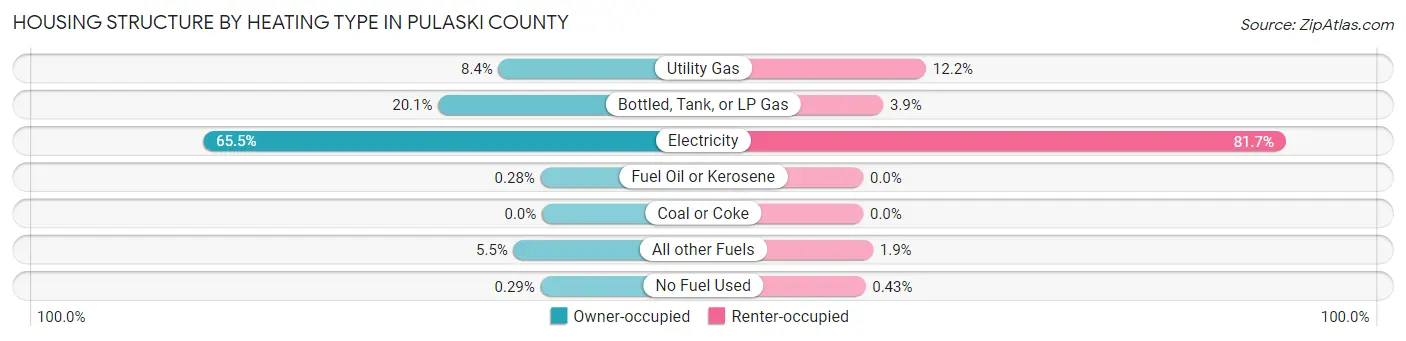
| Heating Type | Owner-occupied | Renter-occupied |
| Utility Gas | 751 (8.4%) | 814 (12.1%) |
| Bottled, Tank, or LP Gas | 1,796 (20.1%) | 258 (3.8%) |
| Electricity | 5,864 (65.5%) | 5,471 (81.7%) |
| Fuel Oil or Kerosene | 25 (0.3%) | 0 (0.0%) |
| Coal or Coke | 0 (0.0%) | 0 (0.0%) |
| All other Fuels | 492 (5.5%) | 127 (1.9%) |
| No Fuel Used | 26 (0.3%) | 29 (0.4%) |
| Total | 8,954 (100.0%) | 6,699 (100.0%) |
Household Vehicle Usage in Pulaski County
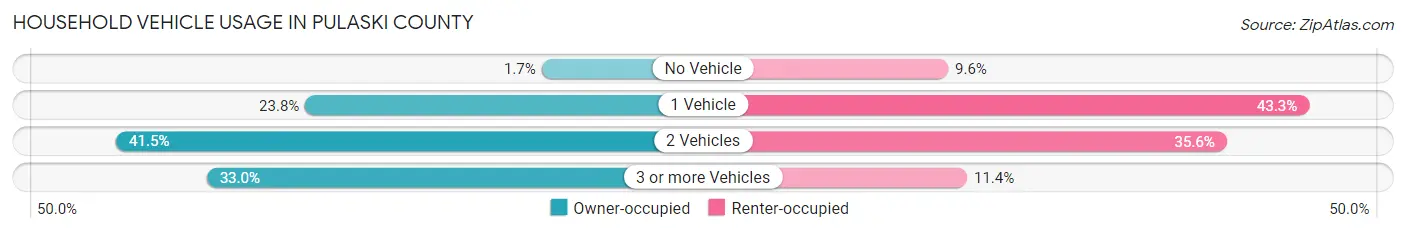
| Vehicles per Household | Owner-occupied | Renter-occupied |
| No Vehicle | 156 (1.7%) | 645 (9.6%) |
| 1 Vehicle | 2,132 (23.8%) | 2,903 (43.3%) |
| 2 Vehicles | 3,711 (41.4%) | 2,387 (35.6%) |
| 3 or more Vehicles | 2,955 (33.0%) | 764 (11.4%) |
| Total | 8,954 (100.0%) | 6,699 (100.0%) |
Real Estate & Mortgages in Pulaski County
Real Estate and Mortgage Overview in Pulaski County
| Characteristic | Without Mortgage | With Mortgage |
| Housing Units | 3,622 | 5,332 |
| Median Property Value | $126,700 | $189,000 |
| Median Household Income | $52,850 | $893 |
| Monthly Housing Costs | $444 | $0 |
| Real Estate Taxes | $838 | $206 |
Property Value by Mortgage Status in Pulaski County
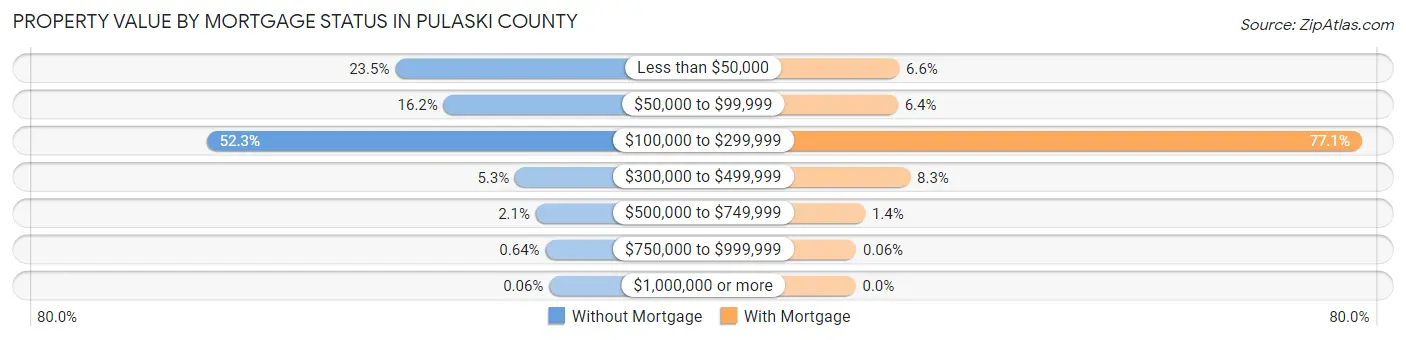
| Property Value | Without Mortgage | With Mortgage |
| Less than $50,000 | 852 (23.5%) | 354 (6.6%) |
| $50,000 to $99,999 | 585 (16.2%) | 343 (6.4%) |
| $100,000 to $299,999 | 1,893 (52.3%) | 4,113 (77.1%) |
| $300,000 to $499,999 | 191 (5.3%) | 443 (8.3%) |
| $500,000 to $749,999 | 76 (2.1%) | 76 (1.4%) |
| $750,000 to $999,999 | 23 (0.6%) | 3 (0.1%) |
| $1,000,000 or more | 2 (0.1%) | 0 (0.0%) |
| Total | 3,622 (100.0%) | 5,332 (100.0%) |
Household Income by Mortgage Status in Pulaski County
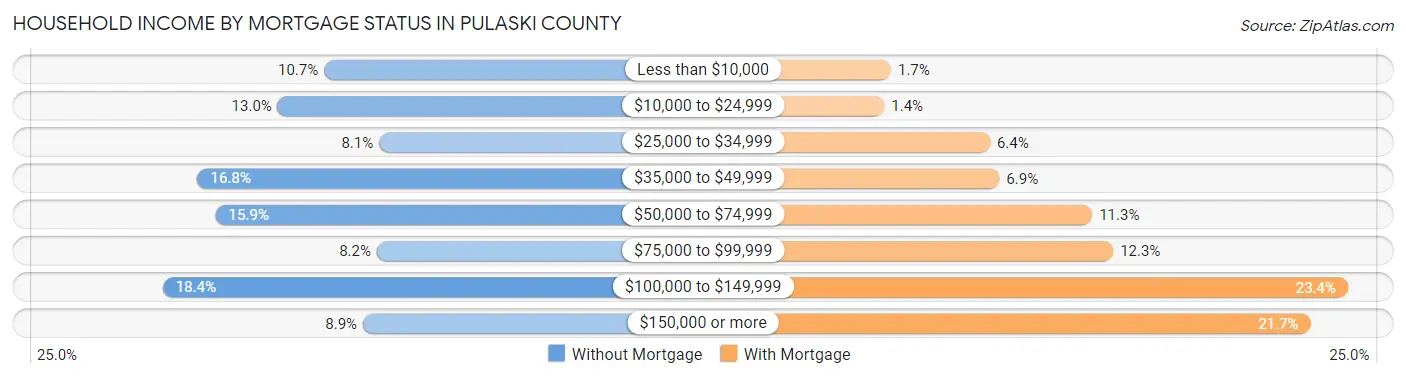
| Household Income | Without Mortgage | With Mortgage |
| Less than $10,000 | 389 (10.7%) | 90 (1.7%) |
| $10,000 to $24,999 | 469 (13.0%) | 73 (1.4%) |
| $25,000 to $34,999 | 294 (8.1%) | 341 (6.4%) |
| $35,000 to $49,999 | 607 (16.8%) | 365 (6.9%) |
| $50,000 to $74,999 | 576 (15.9%) | 601 (11.3%) |
| $75,000 to $99,999 | 298 (8.2%) | 654 (12.3%) |
| $100,000 to $149,999 | 667 (18.4%) | 1,250 (23.4%) |
| $150,000 or more | 322 (8.9%) | 1,155 (21.7%) |
| Total | 3,622 (100.0%) | 5,332 (100.0%) |
Property Value to Household Income Ratio in Pulaski County
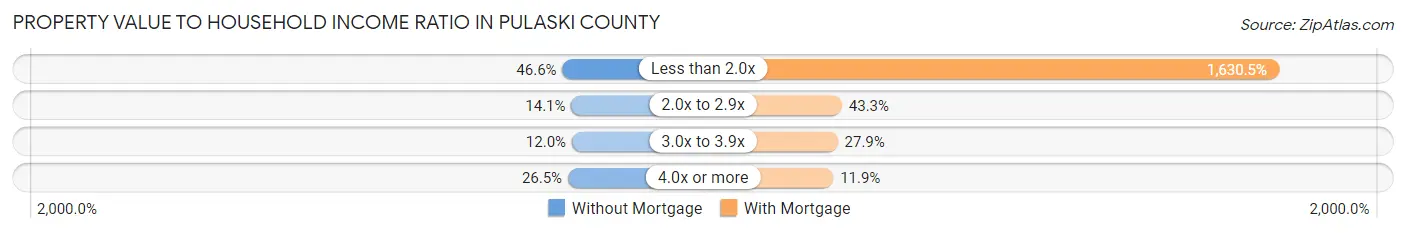
| Value-to-Income Ratio | Without Mortgage | With Mortgage |
| Less than 2.0x | 1,687 (46.6%) | 86,940 (1,630.5%) |
| 2.0x to 2.9x | 509 (14.1%) | 2,310 (43.3%) |
| 3.0x to 3.9x | 435 (12.0%) | 1,488 (27.9%) |
| 4.0x or more | 961 (26.5%) | 633 (11.9%) |
| Total | 3,622 (100.0%) | 5,332 (100.0%) |
Real Estate Taxes by Mortgage Status in Pulaski County
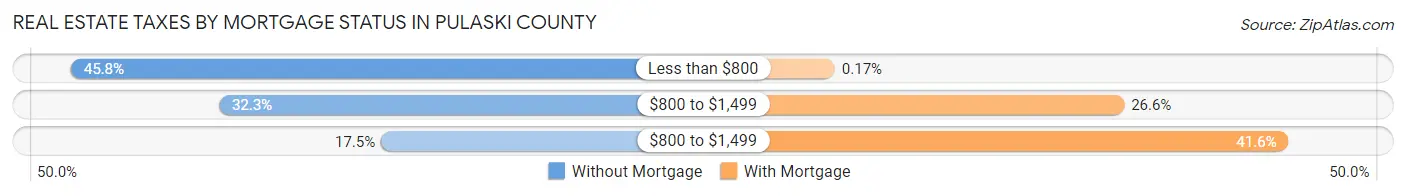
| Property Taxes | Without Mortgage | With Mortgage |
| Less than $800 | 1,658 (45.8%) | 9 (0.2%) |
| $800 to $1,499 | 1,168 (32.3%) | 1,418 (26.6%) |
| $800 to $1,499 | 632 (17.4%) | 2,218 (41.6%) |
| Total | 3,622 (100.0%) | 5,332 (100.0%) |
Health & Disability in Pulaski County
Health Insurance Coverage by Age in Pulaski County
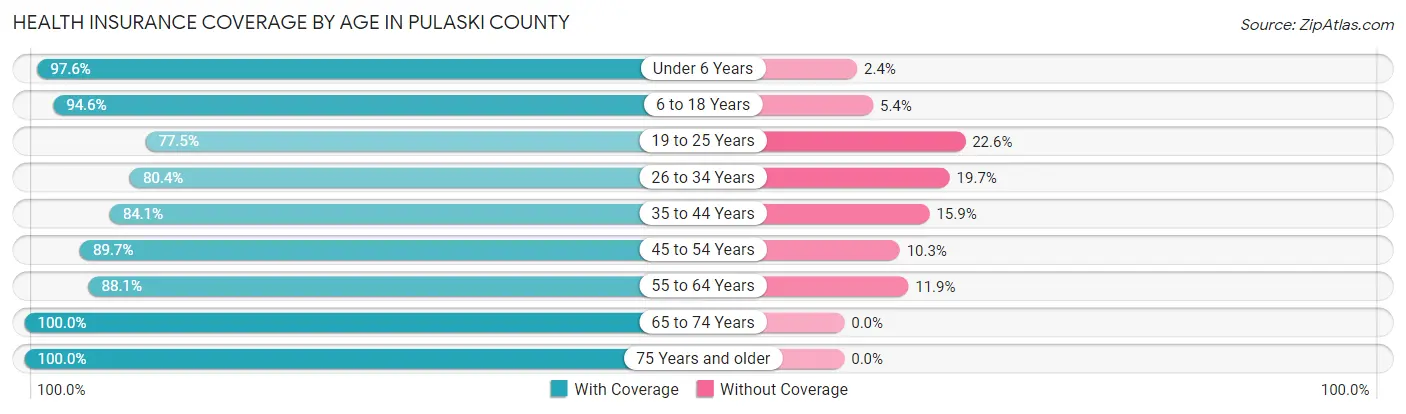
| Age Bracket | With Coverage | Without Coverage |
| Under 6 Years | 4,092 (97.6%) | 100 (2.4%) |
| 6 to 18 Years | 7,595 (94.6%) | 430 (5.4%) |
| 19 to 25 Years | 3,671 (77.4%) | 1,069 (22.6%) |
| 26 to 34 Years | 4,208 (80.3%) | 1,029 (19.7%) |
| 35 to 44 Years | 4,520 (84.1%) | 854 (15.9%) |
| 45 to 54 Years | 3,758 (89.7%) | 433 (10.3%) |
| 55 to 64 Years | 3,723 (88.1%) | 505 (11.9%) |
| 65 to 74 Years | 2,925 (100.0%) | 0 (0.0%) |
| 75 Years and older | 1,925 (100.0%) | 0 (0.0%) |
| Total | 36,417 (89.2%) | 4,420 (10.8%) |
Health Insurance Coverage by Citizenship Status in Pulaski County
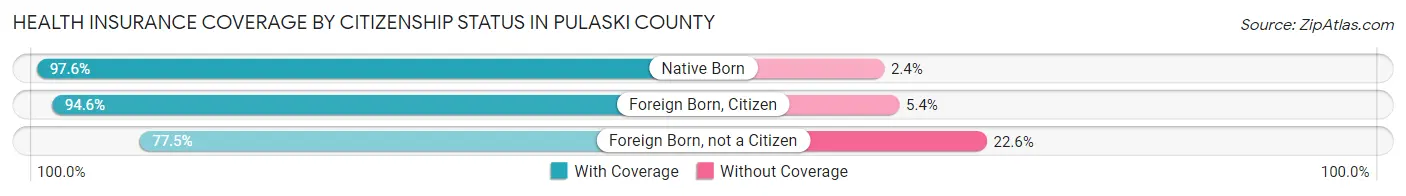
| Citizenship Status | With Coverage | Without Coverage |
| Native Born | 4,092 (97.6%) | 100 (2.4%) |
| Foreign Born, Citizen | 7,595 (94.6%) | 430 (5.4%) |
| Foreign Born, not a Citizen | 3,671 (77.4%) | 1,069 (22.6%) |
Health Insurance Coverage by Household Income in Pulaski County
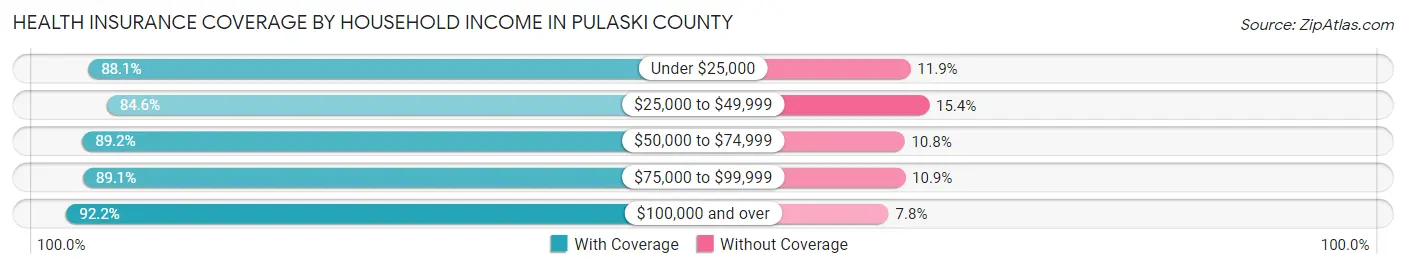
| Household Income | With Coverage | Without Coverage |
| Under $25,000 | 4,928 (88.1%) | 667 (11.9%) |
| $25,000 to $49,999 | 6,220 (84.6%) | 1,133 (15.4%) |
| $50,000 to $74,999 | 6,591 (89.2%) | 799 (10.8%) |
| $75,000 to $99,999 | 6,125 (89.1%) | 751 (10.9%) |
| $100,000 and over | 12,529 (92.2%) | 1,066 (7.8%) |
Public vs Private Health Insurance Coverage by Age in Pulaski County
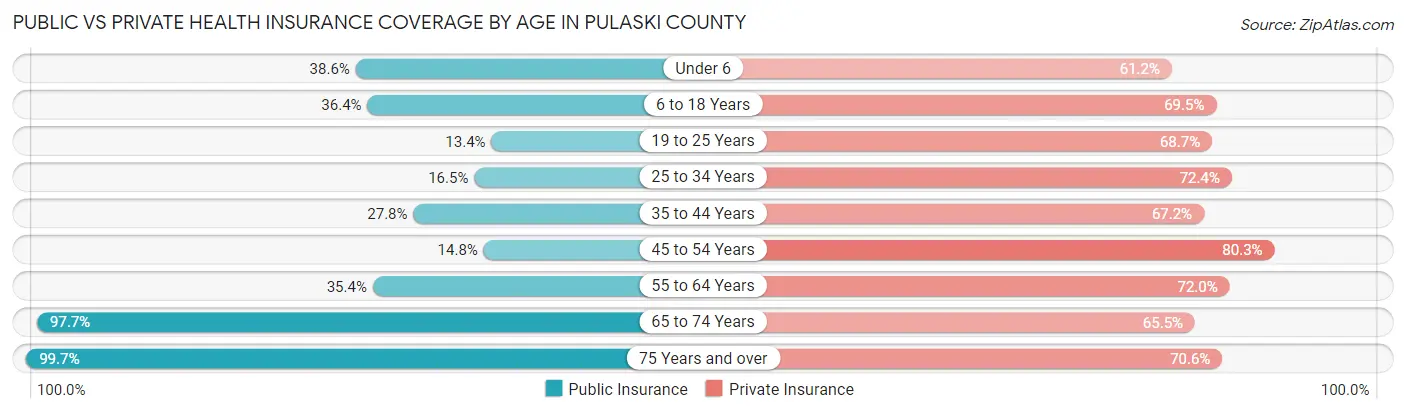
| Age Bracket | Public Insurance | Private Insurance |
| Under 6 | 1,616 (38.6%) | 2,567 (61.2%) |
| 6 to 18 Years | 2,919 (36.4%) | 5,577 (69.5%) |
| 19 to 25 Years | 633 (13.4%) | 3,257 (68.7%) |
| 25 to 34 Years | 866 (16.5%) | 3,790 (72.4%) |
| 35 to 44 Years | 1,496 (27.8%) | 3,612 (67.2%) |
| 45 to 54 Years | 620 (14.8%) | 3,365 (80.3%) |
| 55 to 64 Years | 1,496 (35.4%) | 3,043 (72.0%) |
| 65 to 74 Years | 2,858 (97.7%) | 1,917 (65.5%) |
| 75 Years and over | 1,919 (99.7%) | 1,359 (70.6%) |
| Total | 14,423 (35.3%) | 28,487 (69.8%) |
Disability Status by Sex by Age in Pulaski County
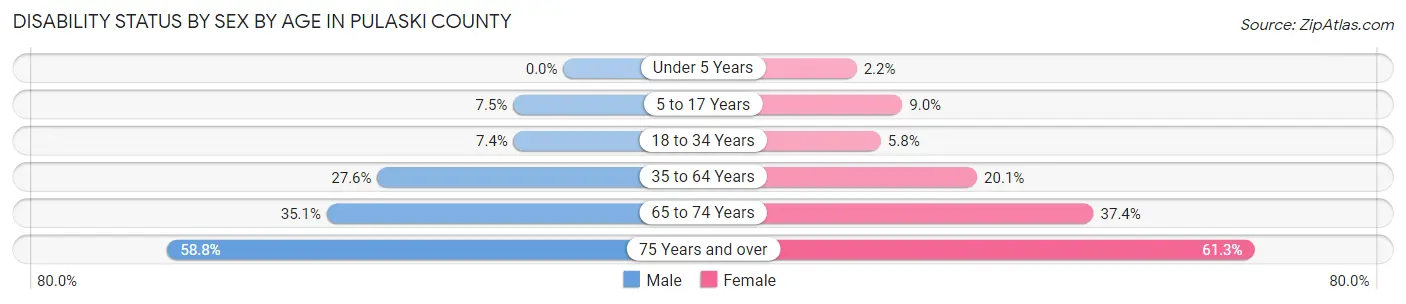
| Age Bracket | Male | Female |
| Under 5 Years | 0 (0.0%) | 36 (2.2%) |
| 5 to 17 Years | 297 (7.4%) | 339 (9.0%) |
| 18 to 34 Years | 468 (7.4%) | 254 (5.8%) |
| 35 to 64 Years | 1,799 (27.6%) | 1,463 (20.1%) |
| 65 to 74 Years | 490 (35.1%) | 572 (37.4%) |
| 75 Years and over | 458 (58.8%) | 702 (61.3%) |
Disability Class by Sex by Age in Pulaski County
Disability Class: Hearing Difficulty
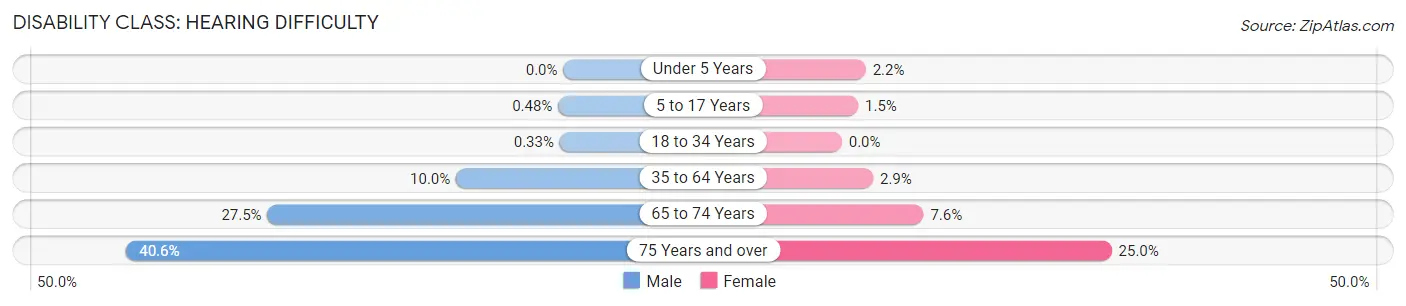
| Age Bracket | Male | Female |
| Under 5 Years | 0 (0.0%) | 36 (2.2%) |
| 5 to 17 Years | 19 (0.5%) | 57 (1.5%) |
| 18 to 34 Years | 21 (0.3%) | 0 (0.0%) |
| 35 to 64 Years | 648 (10.0%) | 211 (2.9%) |
| 65 to 74 Years | 383 (27.5%) | 116 (7.6%) |
| 75 Years and over | 316 (40.6%) | 287 (25.0%) |
Disability Class: Vision Difficulty
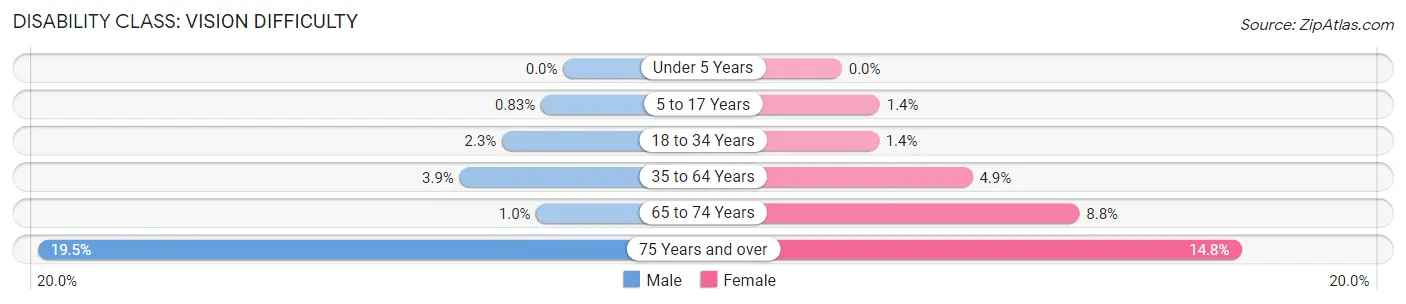
| Age Bracket | Male | Female |
| Under 5 Years | 0 (0.0%) | 0 (0.0%) |
| 5 to 17 Years | 33 (0.8%) | 53 (1.4%) |
| 18 to 34 Years | 144 (2.3%) | 60 (1.4%) |
| 35 to 64 Years | 251 (3.8%) | 353 (4.9%) |
| 65 to 74 Years | 14 (1.0%) | 135 (8.8%) |
| 75 Years and over | 152 (19.5%) | 170 (14.8%) |
Disability Class: Cognitive Difficulty
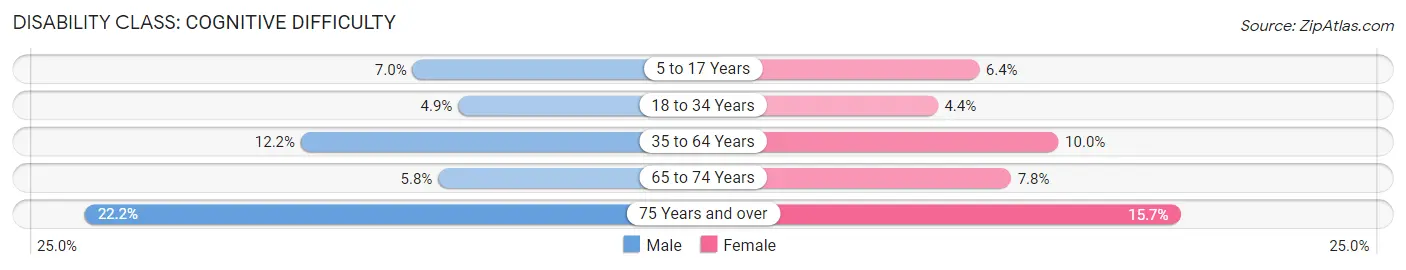
| Age Bracket | Male | Female |
| 5 to 17 Years | 279 (7.0%) | 240 (6.4%) |
| 18 to 34 Years | 310 (4.9%) | 194 (4.4%) |
| 35 to 64 Years | 793 (12.2%) | 731 (10.0%) |
| 65 to 74 Years | 81 (5.8%) | 120 (7.8%) |
| 75 Years and over | 173 (22.2%) | 180 (15.7%) |
Disability Class: Ambulatory Difficulty
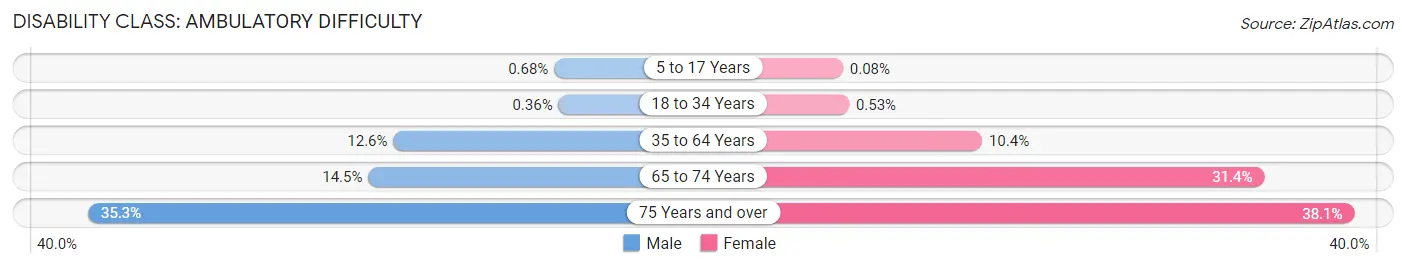
| Age Bracket | Male | Female |
| 5 to 17 Years | 27 (0.7%) | 3 (0.1%) |
| 18 to 34 Years | 23 (0.4%) | 23 (0.5%) |
| 35 to 64 Years | 822 (12.6%) | 758 (10.4%) |
| 65 to 74 Years | 202 (14.5%) | 480 (31.4%) |
| 75 Years and over | 275 (35.3%) | 436 (38.1%) |
Disability Class: Self-Care Difficulty
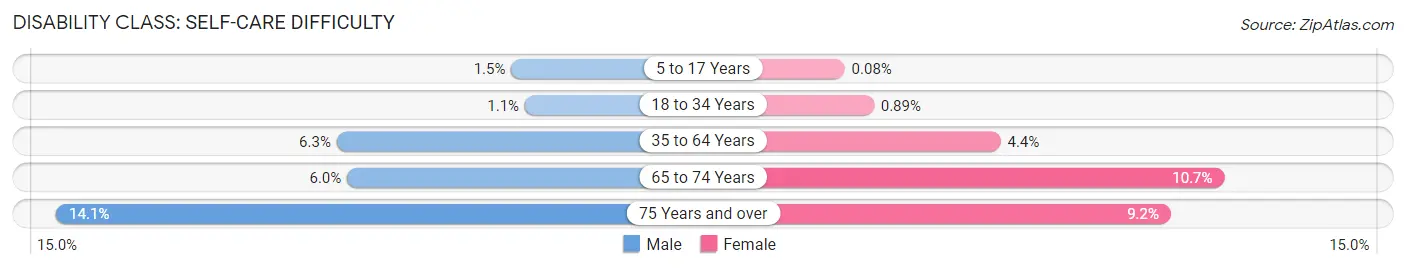
| Age Bracket | Male | Female |
| 5 to 17 Years | 58 (1.5%) | 3 (0.1%) |
| 18 to 34 Years | 68 (1.1%) | 39 (0.9%) |
| 35 to 64 Years | 411 (6.3%) | 322 (4.4%) |
| 65 to 74 Years | 84 (6.0%) | 163 (10.6%) |
| 75 Years and over | 110 (14.1%) | 105 (9.2%) |
Technology Access in Pulaski County
Computing Device Access in Pulaski County
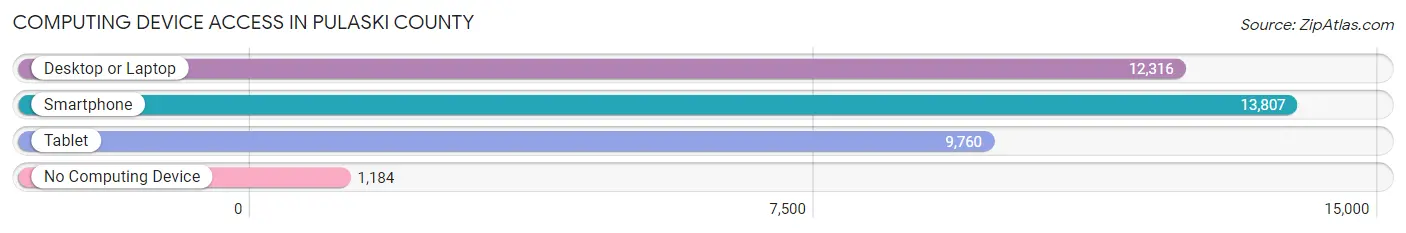
| Device Type | # Households | % Households |
| Desktop or Laptop | 12,316 | 78.7% |
| Smartphone | 13,807 | 88.2% |
| Tablet | 9,760 | 62.4% |
| No Computing Device | 1,184 | 7.6% |
| Total | 15,653 | 100.0% |
Internet Access in Pulaski County
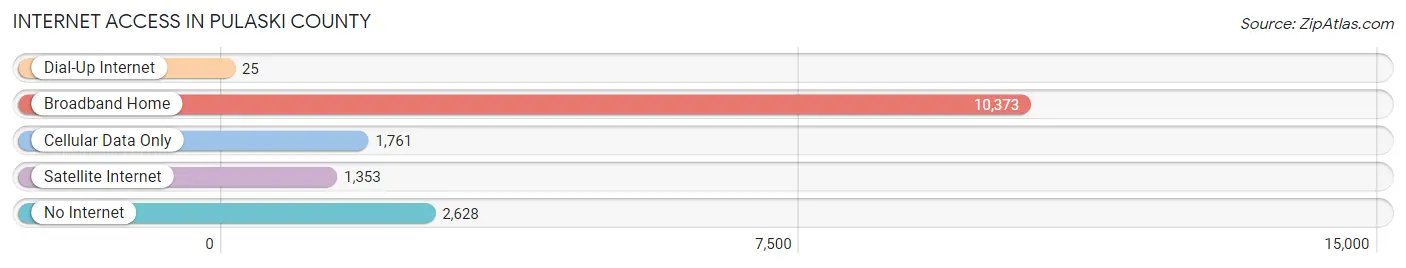
| Internet Type | # Households | % Households |
| Dial-Up Internet | 25 | 0.2% |
| Broadband Home | 10,373 | 66.3% |
| Cellular Data Only | 1,761 | 11.3% |
| Satellite Internet | 1,353 | 8.6% |
| No Internet | 2,628 | 16.8% |
| Total | 15,653 | 100.0% |
Pulaski County Summary
Pulaski County, Missouri is located in the south-central part of the state and is part of the Ozark Plateau. It is bordered by Phelps County to the north, Texas County to the east, Laclede County to the south, and Phelps and Texas Counties to the west. The county seat is Waynesville, and the largest city is St. Robert. The county was established in 1833 and named after Kazimierz Pułaski, a Polish patriot who fought in the American Revolutionary War.
Geography
Pulaski County is located in the Ozark Plateau region of Missouri. The county is mostly hilly and forested, with some areas of prairie. The highest point in the county is located in the Mark Twain National Forest, at an elevation of 1,717 feet. The county is drained by the Gasconade River, which flows through the county from north to south. Other major waterways include the Big Piney River, the Little Piney River, and the Roubidoux Creek.
The county has a total area of 590 square miles, of which 586 square miles is land and 4.2 square miles is water. The county is home to several state parks, including the Big Piney River Conservation Area, the Fort Leonard Wood Military Reservation, and the Mark Twain National Forest.
Demographics
As of the 2010 census, Pulaski County had a population of 52,274. The racial makeup of the county was 87.2% White, 8.2% Black or African American, 0.7% Native American, 0.6% Asian, 0.1% Pacific Islander, 1.2% from other races, and 2.0% from two or more races. Hispanic or Latino of any race were 3.2% of the population.
The median income for a household in the county was $37,945, and the median income for a family was $45,945. The per capita income for the county was $19,845. About 11.2% of families and 14.2% of the population were below the poverty line, including 19.2% of those under age 18 and 8.7% of those age 65 or over.
Economy
Pulaski County is home to several major employers, including Fort Leonard Wood, the largest employer in the county. Other major employers include the Pulaski County R-III School District, the Pulaski County Memorial Hospital, and the St. Robert Municipal Airport.
Agriculture is also an important part of the county's economy. The county is home to several large farms, and the main crops grown in the county are corn, soybeans, wheat, hay, and oats. Livestock production is also important, with cattle, hogs, and poultry being the main animals raised.
The county is also home to several tourist attractions, including the Fort Leonard Wood Military Museum, the Pulaski County Historical Museum, and the St. Robert Municipal Airport.
History
Pulaski County was established in 1833 and named after Kazimierz Pułaski, a Polish patriot who fought in the American Revolutionary War. The county was originally part of the Osage Nation, and the first settlers arrived in the area in the early 1800s.
The county was home to several Civil War battles, including the Battle of Crooked Creek and the Battle of Waynesville. The county was also home to several Native American tribes, including the Osage, Shawnee, and Delaware.
In the late 1800s, the county began to develop as a tourist destination, with several resorts and hotels being built in the area. The county also became a popular destination for hunters and fishermen.
Today, Pulaski County is a popular destination for outdoor recreation, with several state parks and forests located in the area. The county is also home to several military installations, including Fort Leonard Wood.
Common Questions
What is Per Capita Income in Pulaski County?
Per Capita income in Pulaski County is $27,098.
What is the Median Family Income in Pulaski County?
Median Family Income in Pulaski County is $76,118.
What is the Median Household income in Pulaski County?
Median Household Income in Pulaski County is $62,541.
What is Income or Wage Gap in Pulaski County?
Income or Wage Gap in Pulaski County is 9.0%.
Women in Pulaski County earn 91.0 cents for every dollar earned by a man.
What is Family Income Deficit in Pulaski County?
Family Income Deficit in Pulaski County is $11,279.
Families that are below poverty line in Pulaski County earn $11,279 less on average than the poverty threshold level.
What is Inequality or Gini Index in Pulaski County?
Inequality or Gini Index in Pulaski County is 0.41.
What is the Total Population of Pulaski County?
Total Population of Pulaski County is 53,726.
What is the Total Male Population of Pulaski County?
Total Male Population of Pulaski County is 29,982.
What is the Total Female Population of Pulaski County?
Total Female Population of Pulaski County is 23,744.
What is the Ratio of Males per 100 Females in Pulaski County?
There are 126.27 Males per 100 Females in Pulaski County.
What is the Ratio of Females per 100 Males in Pulaski County?
There are 79.19 Females per 100 Males in Pulaski County.
What is the Median Population Age in Pulaski County?
Median Population Age in Pulaski County is 27.7 Years.
What is the Average Family Size in Pulaski County
Average Family Size in Pulaski County is 3.4 People.
What is the Average Household Size in Pulaski County
Average Household Size in Pulaski County is 2.8 People.
How Large is the Labor Force in Pulaski County?
There are 29,399 People in the Labor Forcein in Pulaski County.
What is the Percentage of People in the Labor Force in Pulaski County?
68.3% of People are in the Labor Force in Pulaski County.
What is the Unemployment Rate in Pulaski County?
Unemployment Rate in Pulaski County is 4.7%.