Phelps County, MO Map & Demographics
Phelps County Map
Phelps County Overview
$28,335
PER CAPITA INCOME
$69,375
AVG FAMILY INCOME
$53,242
AVG HOUSEHOLD INCOME
15.2%
WAGE / INCOME GAP [ % ]
84.8¢/ $1
WAGE / INCOME GAP [ $ ]
$10,822
FAMILY INCOME DEFICIT
0.47
INEQUALITY / GINI INDEX
44,843
TOTAL POPULATION
23,629
MALE POPULATION
21,214
FEMALE POPULATION
111.38
MALES / 100 FEMALES
89.78
FEMALES / 100 MALES
36.0
MEDIAN AGE
2.9
AVG FAMILY SIZE
2.4
AVG HOUSEHOLD SIZE
19,956
LABOR FORCE [ PEOPLE ]
54.7%
PERCENT IN LABOR FORCE
4.2%
UNEMPLOYMENT RATE
Phelps County Area Codes
Income in Phelps County
Income Overview in Phelps County
Per Capita Income in Phelps County is $28,335, while median incomes of families and households are $69,375 and $53,242 respectively.
| Characteristic | Number | Measure |
| Per Capita Income | 44,843 | $28,335 |
| Median Family Income | 10,900 | $69,375 |
| Mean Family Income | 10,900 | $90,088 |
| Median Household Income | 17,730 | $53,242 |
| Mean Household Income | 17,730 | $70,451 |
| Income Deficit | 10,900 | $10,822 |
| Wage / Income Gap (%) | 44,843 | 15.21% |
| Wage / Income Gap ($) | 44,843 | 84.79¢ per $1 |
| Gini / Inequality Index | 44,843 | 0.47 |
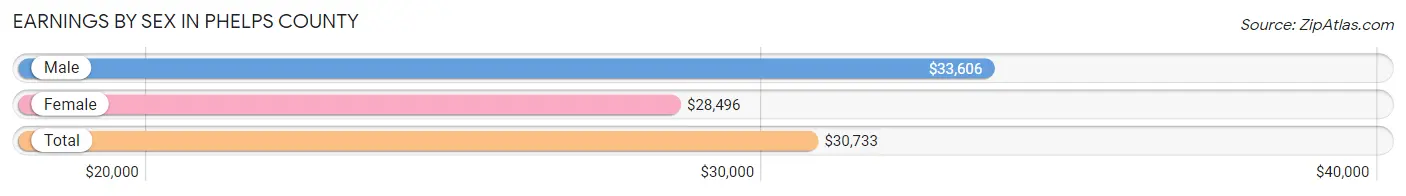
Earnings by Sex in Phelps County
Average Earnings in Phelps County are $30,733, $33,606 for men and $28,496 for women, a difference of 15.2%.
| Sex | Number | Average Earnings |
| Male | 12,179 (55.8%) | $33,606 |
| Female | 9,632 (44.2%) | $28,496 |
| Total | 21,811 (100.0%) | $30,733 |
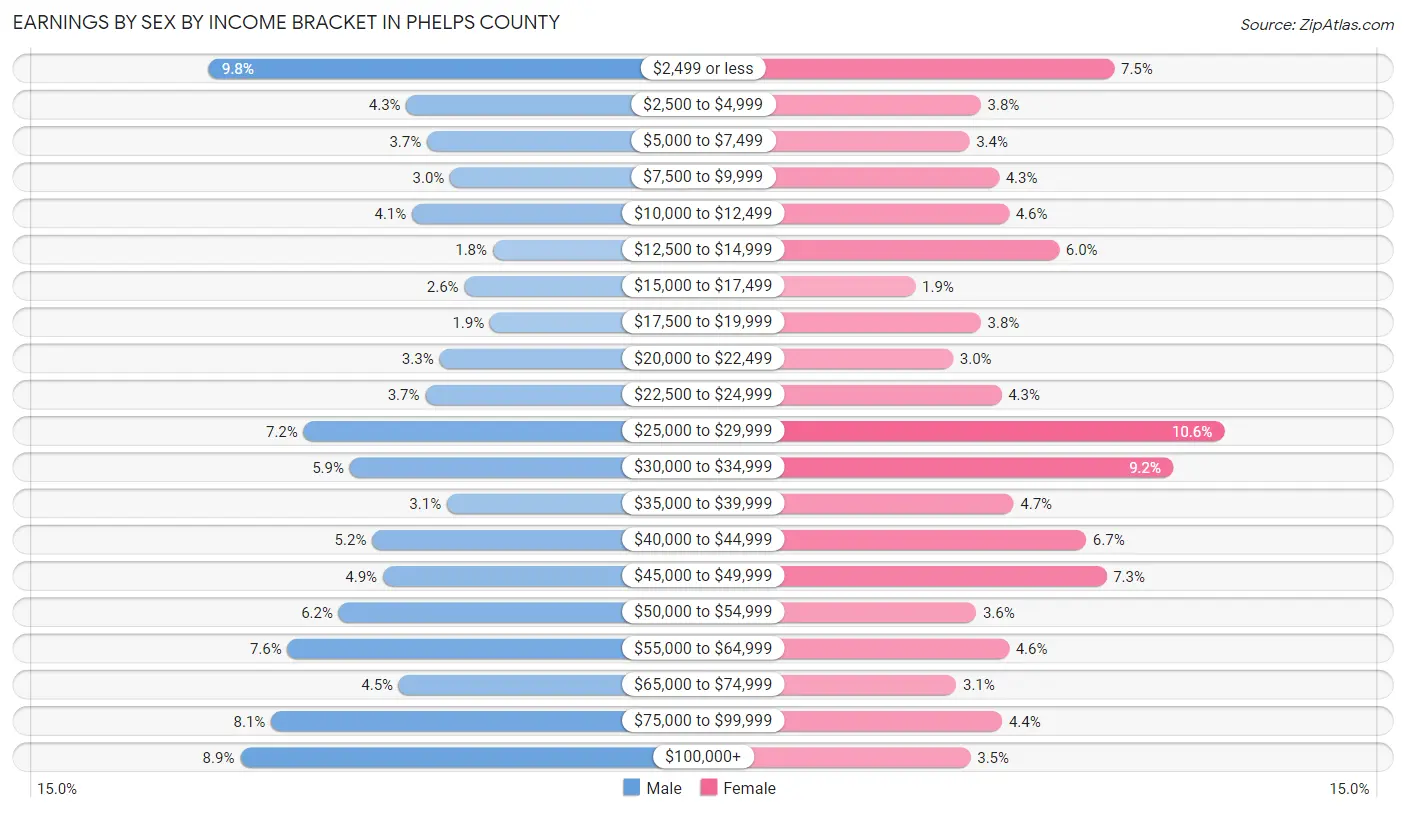
Earnings by Sex by Income Bracket in Phelps County
The most common earnings brackets in Phelps County are $2,499 or less for men (1,196 | 9.8%) and $25,000 to $29,999 for women (1,021 | 10.6%).
| Income | Male | Female |
| $2,499 or less | 1,196 (9.8%) | 723 (7.5%) |
| $2,500 to $4,999 | 520 (4.3%) | 362 (3.8%) |
| $5,000 to $7,499 | 449 (3.7%) | 331 (3.4%) |
| $7,500 to $9,999 | 370 (3.0%) | 411 (4.3%) |
| $10,000 to $12,499 | 500 (4.1%) | 438 (4.5%) |
| $12,500 to $14,999 | 224 (1.8%) | 574 (6.0%) |
| $15,000 to $17,499 | 322 (2.6%) | 185 (1.9%) |
| $17,500 to $19,999 | 234 (1.9%) | 362 (3.8%) |
| $20,000 to $22,499 | 407 (3.3%) | 287 (3.0%) |
| $22,500 to $24,999 | 456 (3.7%) | 418 (4.3%) |
| $25,000 to $29,999 | 872 (7.2%) | 1,021 (10.6%) |
| $30,000 to $34,999 | 714 (5.9%) | 882 (9.2%) |
| $35,000 to $39,999 | 381 (3.1%) | 451 (4.7%) |
| $40,000 to $44,999 | 637 (5.2%) | 647 (6.7%) |
| $45,000 to $49,999 | 600 (4.9%) | 702 (7.3%) |
| $50,000 to $54,999 | 752 (6.2%) | 350 (3.6%) |
| $55,000 to $64,999 | 927 (7.6%) | 438 (4.5%) |
| $65,000 to $74,999 | 546 (4.5%) | 296 (3.1%) |
| $75,000 to $99,999 | 983 (8.1%) | 420 (4.4%) |
| $100,000+ | 1,089 (8.9%) | 334 (3.5%) |
| Total | 12,179 (100.0%) | 9,632 (100.0%) |
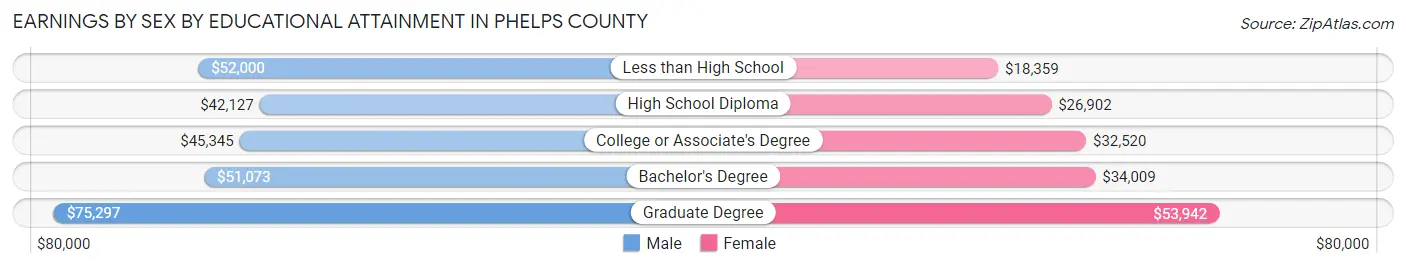
Earnings by Sex by Educational Attainment in Phelps County
Average earnings in Phelps County are $46,642 for men and $32,654 for women, a difference of 30.0%. Men with an educational attainment of graduate degree enjoy the highest average annual earnings of $75,297, while those with high school diploma education earn the least with $42,127. Women with an educational attainment of graduate degree earn the most with the average annual earnings of $53,942, while those with less than high school education have the smallest earnings of $18,359.
| Educational Attainment | Male Income | Female Income |
| Less than High School | $52,000 | $18,359 |
| High School Diploma | $42,127 | $26,902 |
| College or Associate's Degree | $45,345 | $32,520 |
| Bachelor's Degree | $51,073 | $34,009 |
| Graduate Degree | $75,297 | $53,942 |
| Total | $46,642 | $32,654 |
Family Income in Phelps County
Family Income Brackets in Phelps County
According to the Phelps County family income data, there are 2,485 families falling into the $50,000 to $74,999 income range, which is the most common income bracket and makes up 22.8% of all families. Conversely, the $10,000 to $14,999 income bracket is the least frequent group with only 185 families (1.7%) belonging to this category.
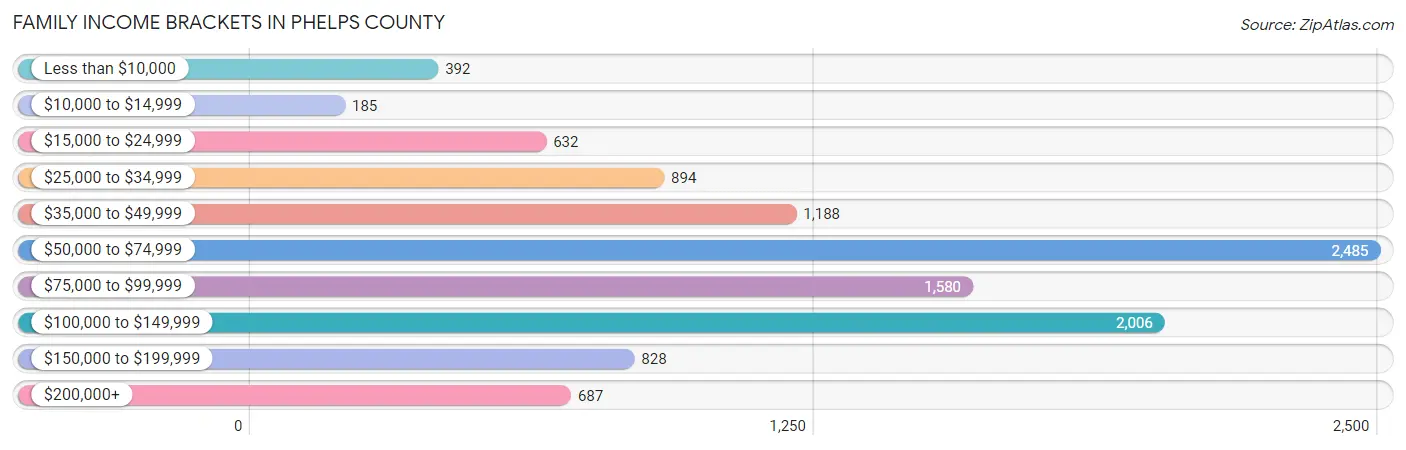
| Income Bracket | # Families | % Families |
| Less than $10,000 | 392 | 3.6% |
| $10,000 to $14,999 | 185 | 1.7% |
| $15,000 to $24,999 | 632 | 5.8% |
| $25,000 to $34,999 | 894 | 8.2% |
| $35,000 to $49,999 | 1,188 | 10.9% |
| $50,000 to $74,999 | 2,485 | 22.8% |
| $75,000 to $99,999 | 1,580 | 14.5% |
| $100,000 to $149,999 | 2,006 | 18.4% |
| $150,000 to $199,999 | 828 | 7.6% |
| $200,000+ | 687 | 6.3% |
Family Income by Famaliy Size in Phelps County
7+ person families (229 | 2.1%) account for the highest median family income in Phelps County with $150,360 per family, while 2-person families (5,766 | 52.9%) have the highest median income of $31,649 per family member.
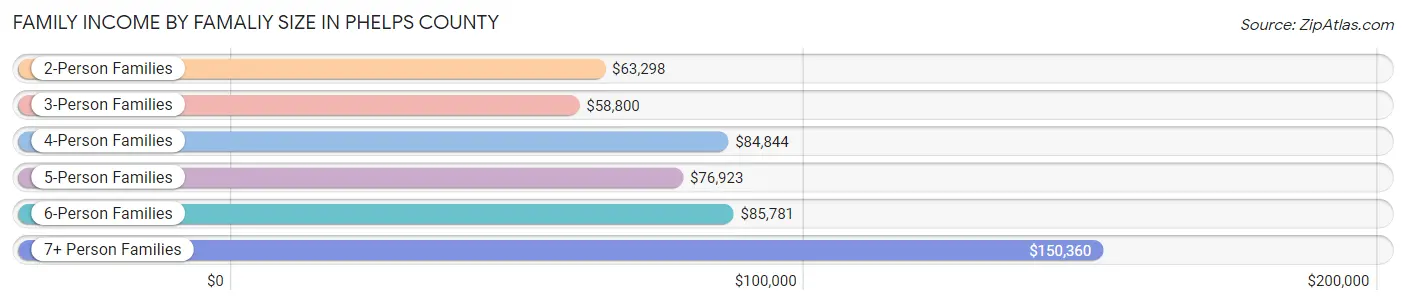
| Income Bracket | # Families | Median Income |
| 2-Person Families | 5,766 (52.9%) | $63,298 |
| 3-Person Families | 2,203 (20.2%) | $58,800 |
| 4-Person Families | 1,698 (15.6%) | $84,844 |
| 5-Person Families | 728 (6.7%) | $76,923 |
| 6-Person Families | 276 (2.5%) | $85,781 |
| 7+ Person Families | 229 (2.1%) | $150,360 |
| Total | 10,900 (100.0%) | $69,375 |
Family Income by Number of Earners in Phelps County
The median family income in Phelps County is $69,375, with families comprising 3+ earners (891) having the highest median family income of $129,127, while families with 1 earner (4,060) have the lowest median family income of $52,175, accounting for 8.2% and 37.2% of families, respectively.
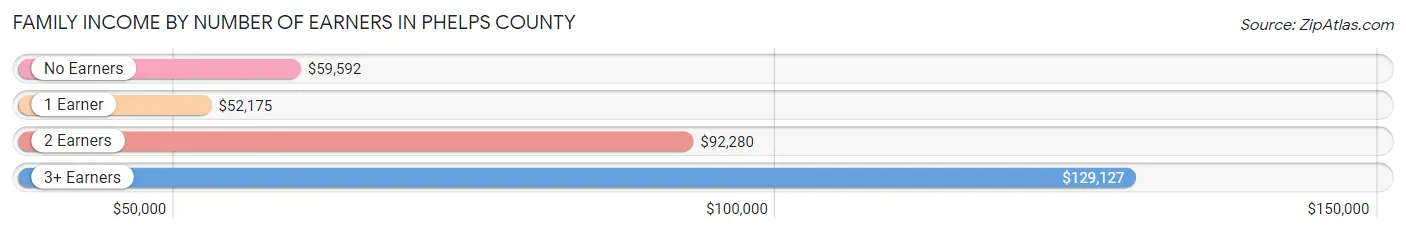
| Number of Earners | # Families | Median Income |
| No Earners | 1,896 (17.4%) | $59,592 |
| 1 Earner | 4,060 (37.2%) | $52,175 |
| 2 Earners | 4,053 (37.2%) | $92,280 |
| 3+ Earners | 891 (8.2%) | $129,127 |
| Total | 10,900 (100.0%) | $69,375 |
Household Income in Phelps County
Household Income Brackets in Phelps County
With 3,245 households falling in the category, the $50,000 to $74,999 income range is the most frequent in Phelps County, accounting for 18.3% of all households. In contrast, only 762 households (4.3%) fall into the $200,000+ income bracket, making it the least populous group.
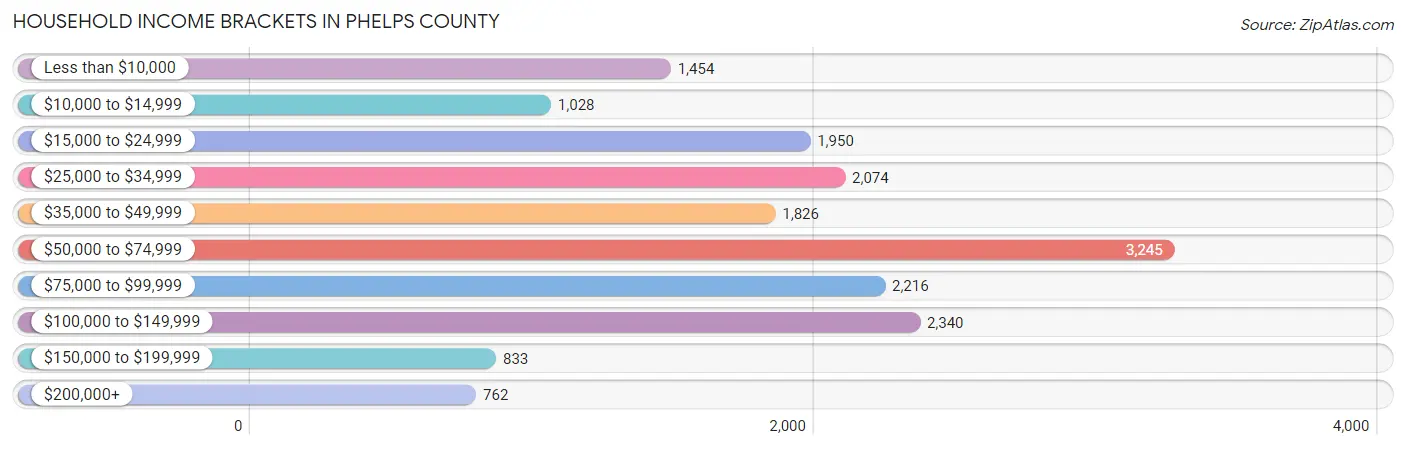
| Income Bracket | # Households | % Households |
| Less than $10,000 | 1,454 | 8.2% |
| $10,000 to $14,999 | 1,028 | 5.8% |
| $15,000 to $24,999 | 1,950 | 11.0% |
| $25,000 to $34,999 | 2,074 | 11.7% |
| $35,000 to $49,999 | 1,826 | 10.3% |
| $50,000 to $74,999 | 3,245 | 18.3% |
| $75,000 to $99,999 | 2,216 | 12.5% |
| $100,000 to $149,999 | 2,340 | 13.2% |
| $150,000 to $199,999 | 833 | 4.7% |
| $200,000+ | 762 | 4.3% |
Household Income by Householder Age in Phelps County
The median household income in Phelps County is $53,242, with the highest median household income of $72,240 found in the 45 to 64 years age bracket for the primary householder. A total of 5,808 households (32.8%) fall into this category. Meanwhile, the 15 to 24 years age bracket for the primary householder has the lowest median household income of $25,573, with 1,671 households (9.4%) in this group.
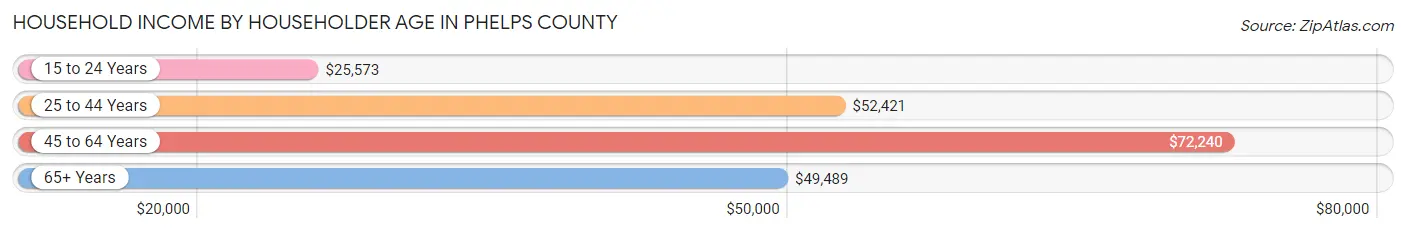
| Income Bracket | # Households | Median Income |
| 15 to 24 Years | 1,671 (9.4%) | $25,573 |
| 25 to 44 Years | 5,619 (31.7%) | $52,421 |
| 45 to 64 Years | 5,808 (32.8%) | $72,240 |
| 65+ Years | 4,632 (26.1%) | $49,489 |
| Total | 17,730 (100.0%) | $53,242 |
Poverty in Phelps County
Income Below Poverty by Sex and Age in Phelps County
With 18.0% poverty level for males and 17.3% for females among the residents of Phelps County, 18 to 24 year old males and 18 to 24 year old females are the most vulnerable to poverty, with 1,459 males (50.8%) and 729 females (35.0%) in their respective age groups living below the poverty level.
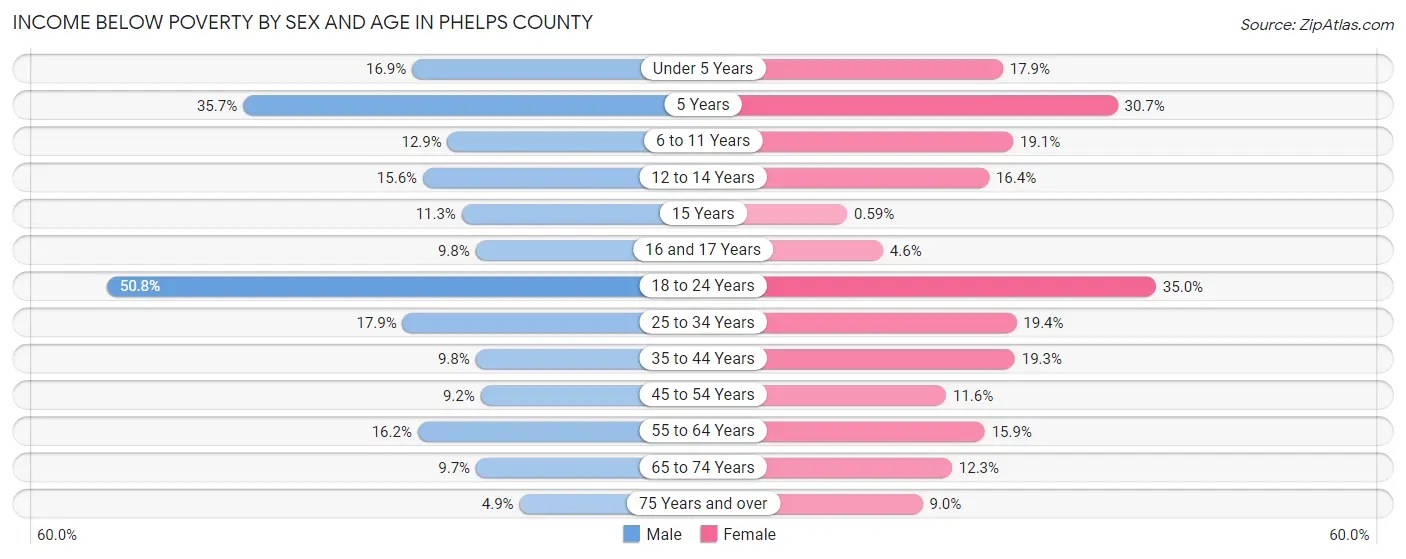
| Age Bracket | Male | Female |
| Under 5 Years | 201 (16.9%) | 204 (17.9%) |
| 5 Years | 86 (35.7%) | 74 (30.7%) |
| 6 to 11 Years | 190 (12.9%) | 301 (19.1%) |
| 12 to 14 Years | 157 (15.6%) | 130 (16.4%) |
| 15 Years | 24 (11.3%) | 2 (0.6%) |
| 16 and 17 Years | 63 (9.8%) | 17 (4.6%) |
| 18 to 24 Years | 1,459 (50.8%) | 729 (35.0%) |
| 25 to 34 Years | 479 (17.9%) | 472 (19.4%) |
| 35 to 44 Years | 255 (9.8%) | 457 (19.3%) |
| 45 to 54 Years | 214 (9.2%) | 278 (11.6%) |
| 55 to 64 Years | 437 (16.2%) | 465 (15.9%) |
| 65 to 74 Years | 194 (9.7%) | 252 (12.3%) |
| 75 Years and over | 64 (4.9%) | 153 (9.0%) |
| Total | 3,823 (18.0%) | 3,534 (17.3%) |
Income Above Poverty by Sex and Age in Phelps County
According to the poverty statistics in Phelps County, males aged 75 years and over and females aged 15 years are the age groups that are most secure financially, with 95.1% of males and 99.4% of females in these age groups living above the poverty line.
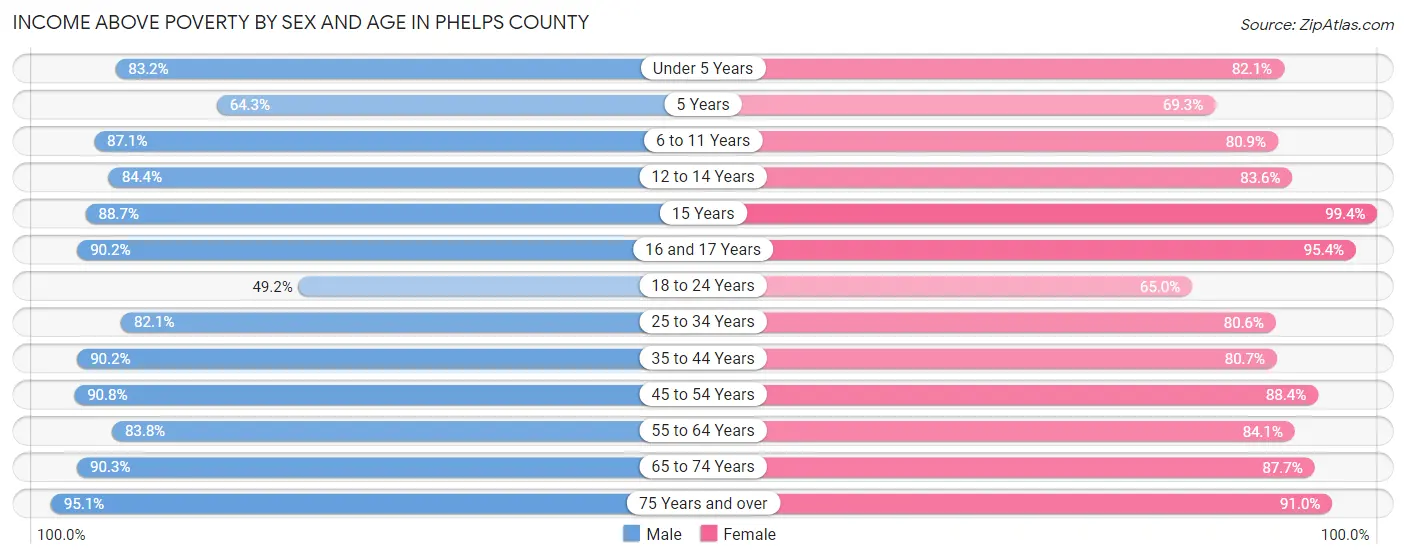
| Age Bracket | Male | Female |
| Under 5 Years | 992 (83.2%) | 933 (82.1%) |
| 5 Years | 155 (64.3%) | 167 (69.3%) |
| 6 to 11 Years | 1,283 (87.1%) | 1,277 (80.9%) |
| 12 to 14 Years | 847 (84.4%) | 663 (83.6%) |
| 15 Years | 188 (88.7%) | 336 (99.4%) |
| 16 and 17 Years | 581 (90.2%) | 354 (95.4%) |
| 18 to 24 Years | 1,411 (49.2%) | 1,355 (65.0%) |
| 25 to 34 Years | 2,196 (82.1%) | 1,956 (80.6%) |
| 35 to 44 Years | 2,353 (90.2%) | 1,914 (80.7%) |
| 45 to 54 Years | 2,107 (90.8%) | 2,117 (88.4%) |
| 55 to 64 Years | 2,258 (83.8%) | 2,456 (84.1%) |
| 65 to 74 Years | 1,797 (90.3%) | 1,804 (87.7%) |
| 75 Years and over | 1,245 (95.1%) | 1,548 (91.0%) |
| Total | 17,413 (82.0%) | 16,880 (82.7%) |
Income Below Poverty Among Married-Couple Families in Phelps County
The poverty statistics for married-couple families in Phelps County show that 4.5% or 365 of the total 8,162 families live below the poverty line. Families with 3 or 4 children have the highest poverty rate of 13.4%, comprising of 95 families. On the other hand, families with no children have the lowest poverty rate of 3.3%, which includes 163 families.
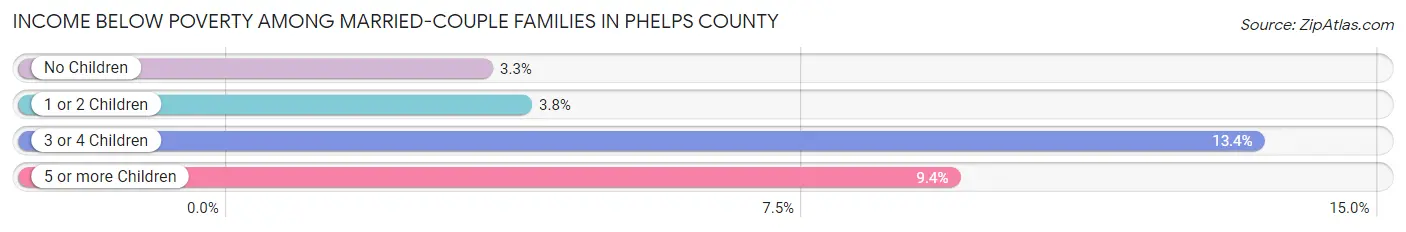
| Children | Above Poverty | Below Poverty |
| No Children | 4,737 (96.7%) | 163 (3.3%) |
| 1 or 2 Children | 2,302 (96.2%) | 92 (3.8%) |
| 3 or 4 Children | 614 (86.6%) | 95 (13.4%) |
| 5 or more Children | 144 (90.6%) | 15 (9.4%) |
| Total | 7,797 (95.5%) | 365 (4.5%) |
Income Below Poverty Among Single-Parent Households in Phelps County
According to the poverty data in Phelps County, 12.8% or 125 single-father households and 29.4% or 519 single-mother households are living below the poverty line. Among single-father households, those with no children have the highest poverty rate, with 84 households (24.1%) experiencing poverty. Likewise, among single-mother households, those with 5 or more children have the highest poverty rate, with 11 households (100.0%) falling below the poverty line.
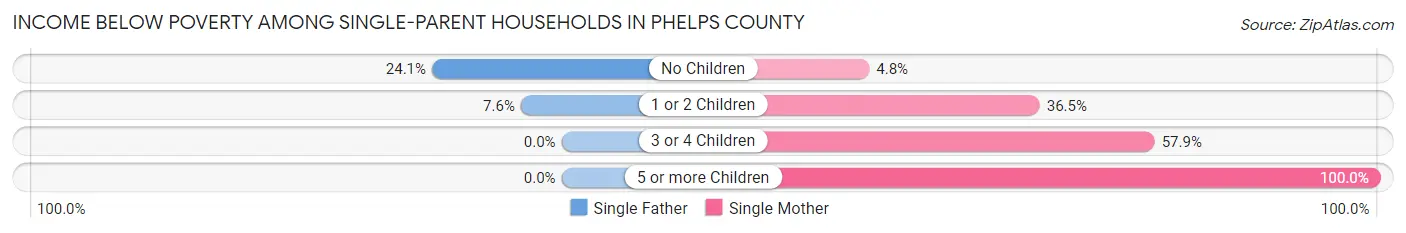
| Children | Single Father | Single Mother |
| No Children | 84 (24.1%) | 24 (4.8%) |
| 1 or 2 Children | 41 (7.6%) | 411 (36.5%) |
| 3 or 4 Children | 0 (0.0%) | 73 (57.9%) |
| 5 or more Children | 0 (0.0%) | 11 (100.0%) |
| Total | 125 (12.8%) | 519 (29.4%) |
Income Below Poverty Among Married-Couple vs Single-Parent Households in Phelps County
The poverty data for Phelps County shows that 365 of the married-couple family households (4.5%) and 644 of the single-parent households (23.5%) are living below the poverty level. Within the married-couple family households, those with 3 or 4 children have the highest poverty rate, with 95 households (13.4%) falling below the poverty line. Among the single-parent households, those with 5 or more children have the highest poverty rate, with 11 household (100.0%) living below poverty.
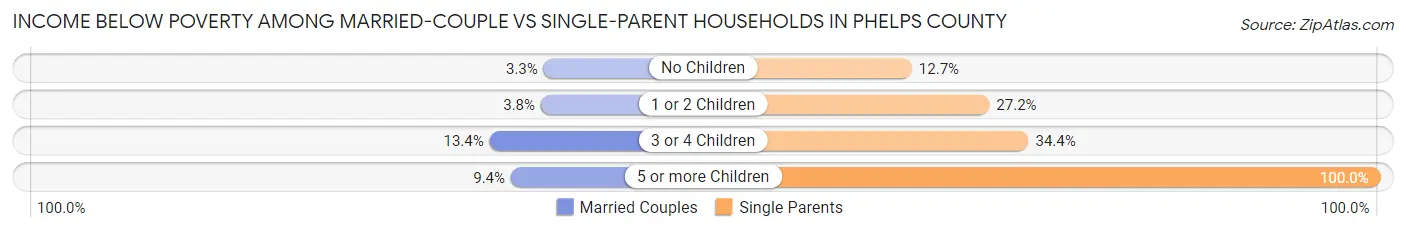
| Children | Married-Couple Families | Single-Parent Households |
| No Children | 163 (3.3%) | 108 (12.7%) |
| 1 or 2 Children | 92 (3.8%) | 452 (27.2%) |
| 3 or 4 Children | 95 (13.4%) | 73 (34.4%) |
| 5 or more Children | 15 (9.4%) | 11 (100.0%) |
| Total | 365 (4.5%) | 644 (23.5%) |
Race in Phelps County
The most populous races in Phelps County are White / Caucasian (39,335 | 87.7%), Two or more Races (2,480 | 5.5%), and Asian (1,508 | 3.4%).
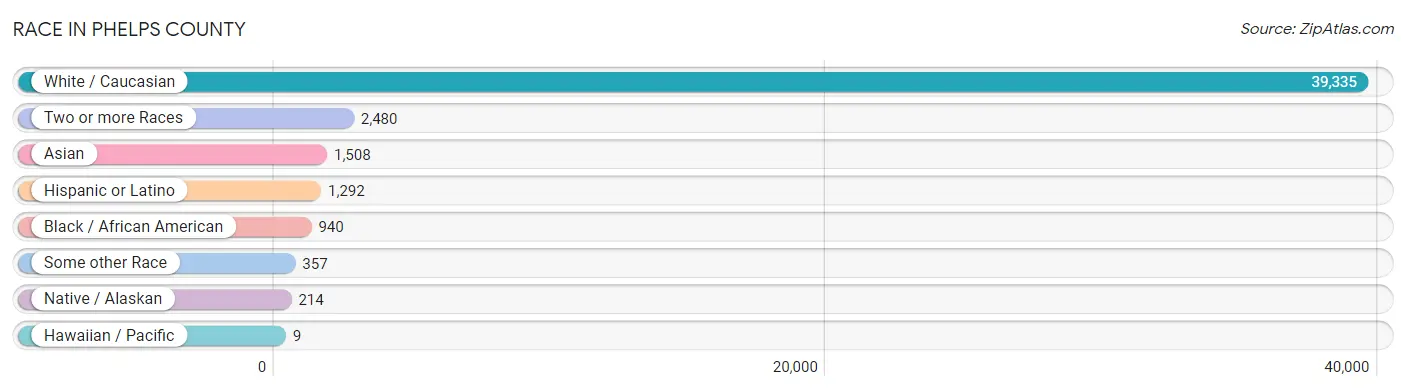
| Race | # Population | % Population |
| Asian | 1,508 | 3.4% |
| Black / African American | 940 | 2.1% |
| Hawaiian / Pacific | 9 | 0.0% |
| Hispanic or Latino | 1,292 | 2.9% |
| Native / Alaskan | 214 | 0.5% |
| White / Caucasian | 39,335 | 87.7% |
| Two or more Races | 2,480 | 5.5% |
| Some other Race | 357 | 0.8% |
| Total | 44,843 | 100.0% |
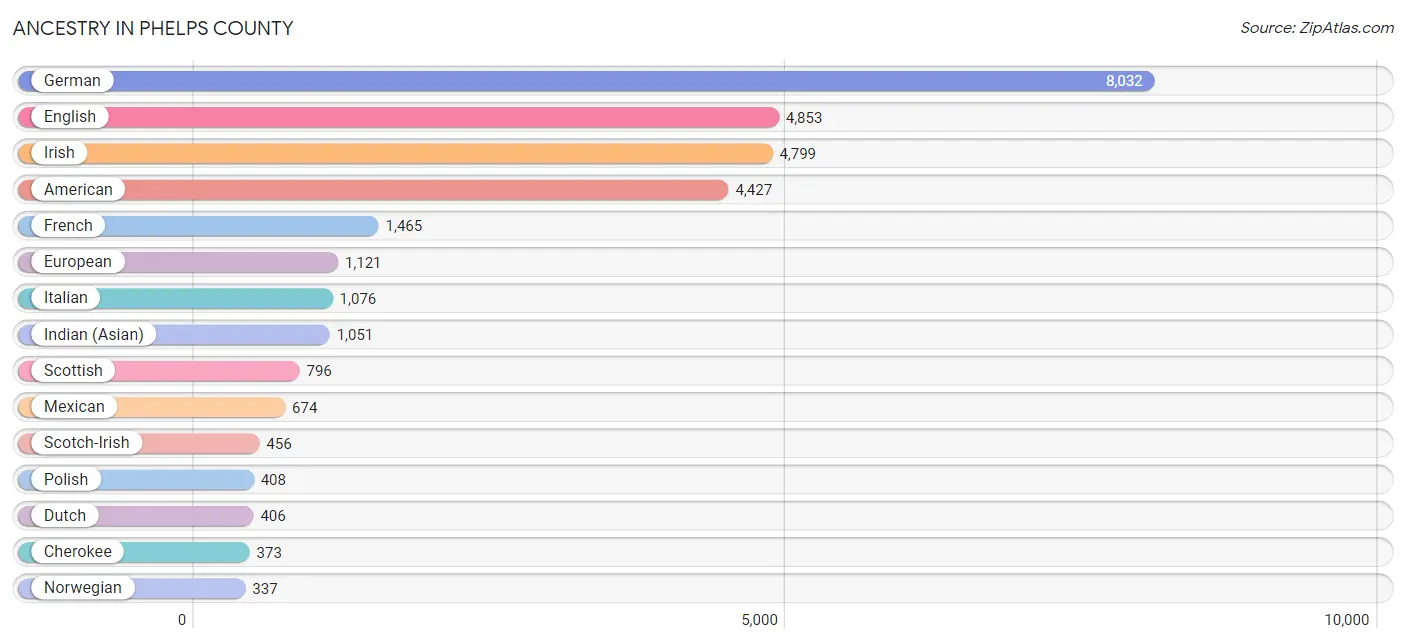
Ancestry in Phelps County
The most populous ancestries reported in Phelps County are German (8,032 | 17.9%), English (4,853 | 10.8%), Irish (4,799 | 10.7%), American (4,427 | 9.9%), and French (1,465 | 3.3%), together accounting for 52.6% of all Phelps County residents.
| Ancestry | # Population | % Population |
| African | 153 | 0.3% |
| Alaska Native | 14 | 0.0% |
| Albanian | 14 | 0.0% |
| American | 4,427 | 9.9% |
| Apache | 56 | 0.1% |
| Arab | 183 | 0.4% |
| Argentinean | 5 | 0.0% |
| Austrian | 93 | 0.2% |
| Belgian | 34 | 0.1% |
| Bhutanese | 42 | 0.1% |
| Blackfeet | 36 | 0.1% |
| Brazilian | 23 | 0.1% |
| British | 239 | 0.5% |
| Burmese | 163 | 0.4% |
| Cajun | 15 | 0.0% |
| Canadian | 75 | 0.2% |
| Central American | 64 | 0.1% |
| Cherokee | 373 | 0.8% |
| Chickasaw | 2 | 0.0% |
| Chippewa | 2 | 0.0% |
| Choctaw | 46 | 0.1% |
| Colombian | 147 | 0.3% |
| Creek | 7 | 0.0% |
| Croatian | 8 | 0.0% |
| Cuban | 85 | 0.2% |
| Czech | 188 | 0.4% |
| Czechoslovakian | 68 | 0.2% |
| Danish | 63 | 0.1% |
| Dutch | 406 | 0.9% |
| Dutch West Indian | 8 | 0.0% |
| Eastern European | 10 | 0.0% |
| Egyptian | 72 | 0.2% |
| English | 4,853 | 10.8% |
| Ethiopian | 5 | 0.0% |
| European | 1,121 | 2.5% |
| Filipino | 5 | 0.0% |
| Finnish | 176 | 0.4% |
| French | 1,465 | 3.3% |
| French Canadian | 84 | 0.2% |
| German | 8,032 | 17.9% |
| Greek | 91 | 0.2% |
| Guatemalan | 64 | 0.1% |
| Hungarian | 38 | 0.1% |
| Indian (Asian) | 1,051 | 2.3% |
| Indonesian | 18 | 0.0% |
| Inupiat | 7 | 0.0% |
| Irish | 4,799 | 10.7% |
| Italian | 1,076 | 2.4% |
| Korean | 100 | 0.2% |
| Lebanese | 31 | 0.1% |
| Lithuanian | 101 | 0.2% |
| Lumbee | 12 | 0.0% |
| Malaysian | 2 | 0.0% |
| Mexican | 674 | 1.5% |
| Native Hawaiian | 1 | 0.0% |
| New Zealander | 19 | 0.0% |
| Nigerian | 89 | 0.2% |
| Northern European | 34 | 0.1% |
| Norwegian | 337 | 0.7% |
| Osage | 36 | 0.1% |
| Pakistani | 74 | 0.2% |
| Palestinian | 3 | 0.0% |
| Peruvian | 11 | 0.0% |
| Polish | 408 | 0.9% |
| Portuguese | 16 | 0.0% |
| Puerto Rican | 94 | 0.2% |
| Romanian | 76 | 0.2% |
| Russian | 103 | 0.2% |
| Samoan | 9 | 0.0% |
| Scandinavian | 149 | 0.3% |
| Scotch-Irish | 456 | 1.0% |
| Scottish | 796 | 1.8% |
| Serbian | 9 | 0.0% |
| Sioux | 11 | 0.0% |
| Slavic | 25 | 0.1% |
| Slovak | 8 | 0.0% |
| Slovene | 36 | 0.1% |
| South American | 163 | 0.4% |
| South American Indian | 52 | 0.1% |
| Spaniard | 43 | 0.1% |
| Spanish | 34 | 0.1% |
| Sri Lankan | 162 | 0.4% |
| Subsaharan African | 287 | 0.6% |
| Swedish | 327 | 0.7% |
| Swiss | 171 | 0.4% |
| Syrian | 10 | 0.0% |
| Thai | 266 | 0.6% |
| Trinidadian and Tobagonian | 11 | 0.0% |
| Turkish | 65 | 0.1% |
| Ukrainian | 32 | 0.1% |
| Welsh | 172 | 0.4% |
| West Indian | 13 | 0.0% |
| Zimbabwean | 40 | 0.1% | View All 93 Rows |
Immigrants in Phelps County
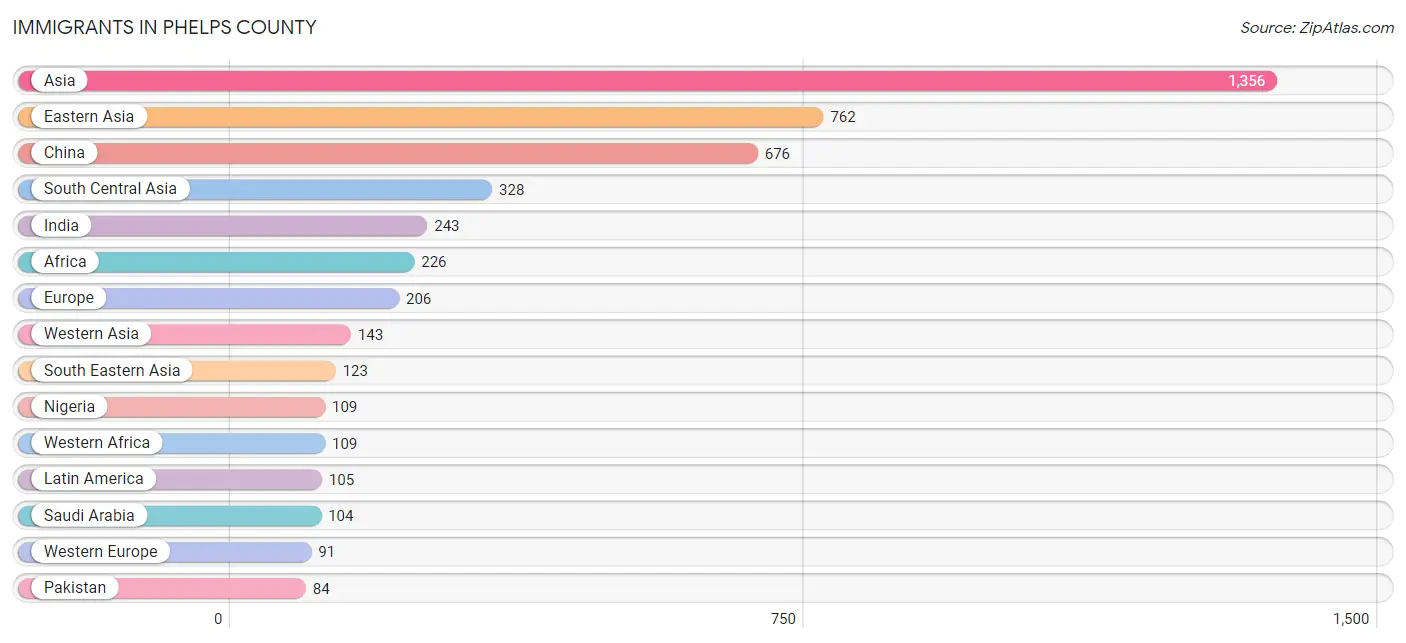
The most numerous immigrant groups reported in Phelps County came from Asia (1,356 | 3.0%), Eastern Asia (762 | 1.7%), China (676 | 1.5%), South Central Asia (328 | 0.7%), and India (243 | 0.5%), together accounting for 7.5% of all Phelps County residents.
| Immigration Origin | # Population | % Population |
| Africa | 226 | 0.5% |
| Asia | 1,356 | 3.0% |
| Austria | 21 | 0.1% |
| Canada | 11 | 0.0% |
| Caribbean | 13 | 0.0% |
| Central America | 72 | 0.2% |
| China | 676 | 1.5% |
| Colombia | 20 | 0.0% |
| Eastern Africa | 45 | 0.1% |
| Eastern Asia | 762 | 1.7% |
| Eastern Europe | 53 | 0.1% |
| Egypt | 72 | 0.2% |
| England | 3 | 0.0% |
| Ethiopia | 5 | 0.0% |
| Europe | 206 | 0.5% |
| France | 30 | 0.1% |
| Germany | 40 | 0.1% |
| Greece | 13 | 0.0% |
| India | 243 | 0.5% |
| Japan | 7 | 0.0% |
| Korea | 79 | 0.2% |
| Laos | 2 | 0.0% |
| Latin America | 105 | 0.2% |
| Mexico | 49 | 0.1% |
| Nigeria | 109 | 0.2% |
| Northern Africa | 72 | 0.2% |
| Northern Europe | 23 | 0.1% |
| Pakistan | 84 | 0.2% |
| Panama | 23 | 0.1% |
| Philippines | 39 | 0.1% |
| Poland | 22 | 0.1% |
| Saudi Arabia | 104 | 0.2% |
| Serbia | 9 | 0.0% |
| South America | 20 | 0.0% |
| South Central Asia | 328 | 0.7% |
| South Eastern Asia | 123 | 0.3% |
| Southern Europe | 29 | 0.1% |
| Spain | 16 | 0.0% |
| Sri Lanka | 1 | 0.0% |
| Sweden | 12 | 0.0% |
| Taiwan | 5 | 0.0% |
| Thailand | 15 | 0.0% |
| Trinidad and Tobago | 13 | 0.0% |
| Turkey | 39 | 0.1% |
| Ukraine | 22 | 0.1% |
| Vietnam | 67 | 0.2% |
| Western Africa | 109 | 0.2% |
| Western Asia | 143 | 0.3% |
| Western Europe | 91 | 0.2% |
| Zimbabwe | 40 | 0.1% | View All 50 Rows |
Sex and Age in Phelps County
Sex and Age in Phelps County
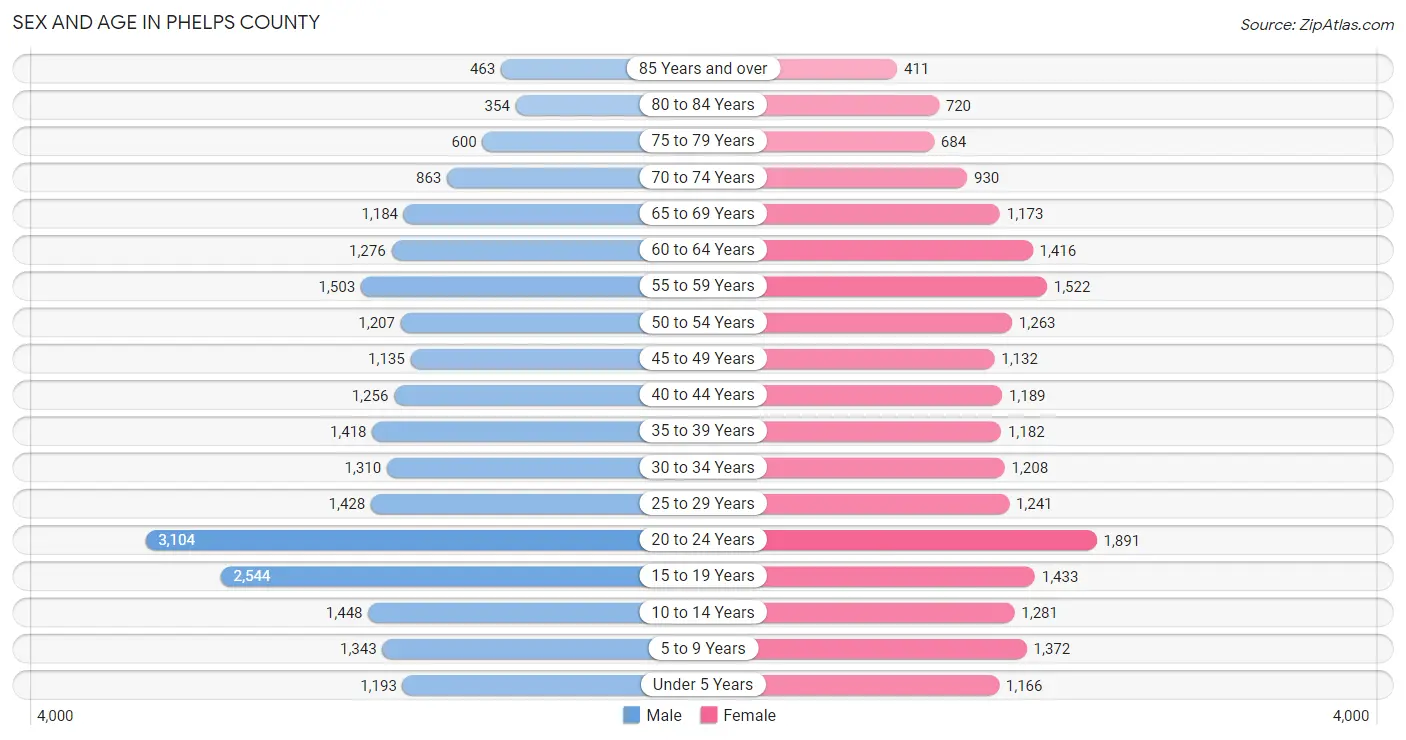
The most populous age groups in Phelps County are 20 to 24 Years (3,104 | 13.1%) for men and 20 to 24 Years (1,891 | 8.9%) for women.
| Age Bracket | Male | Female |
| Under 5 Years | 1,193 (5.1%) | 1,166 (5.5%) |
| 5 to 9 Years | 1,343 (5.7%) | 1,372 (6.5%) |
| 10 to 14 Years | 1,448 (6.1%) | 1,281 (6.0%) |
| 15 to 19 Years | 2,544 (10.8%) | 1,433 (6.8%) |
| 20 to 24 Years | 3,104 (13.1%) | 1,891 (8.9%) |
| 25 to 29 Years | 1,428 (6.0%) | 1,241 (5.9%) |
| 30 to 34 Years | 1,310 (5.5%) | 1,208 (5.7%) |
| 35 to 39 Years | 1,418 (6.0%) | 1,182 (5.6%) |
| 40 to 44 Years | 1,256 (5.3%) | 1,189 (5.6%) |
| 45 to 49 Years | 1,135 (4.8%) | 1,132 (5.3%) |
| 50 to 54 Years | 1,207 (5.1%) | 1,263 (5.9%) |
| 55 to 59 Years | 1,503 (6.4%) | 1,522 (7.2%) |
| 60 to 64 Years | 1,276 (5.4%) | 1,416 (6.7%) |
| 65 to 69 Years | 1,184 (5.0%) | 1,173 (5.5%) |
| 70 to 74 Years | 863 (3.6%) | 930 (4.4%) |
| 75 to 79 Years | 600 (2.5%) | 684 (3.2%) |
| 80 to 84 Years | 354 (1.5%) | 720 (3.4%) |
| 85 Years and over | 463 (2.0%) | 411 (1.9%) |
| Total | 23,629 (100.0%) | 21,214 (100.0%) |
Families and Households in Phelps County
Median Family Size in Phelps County
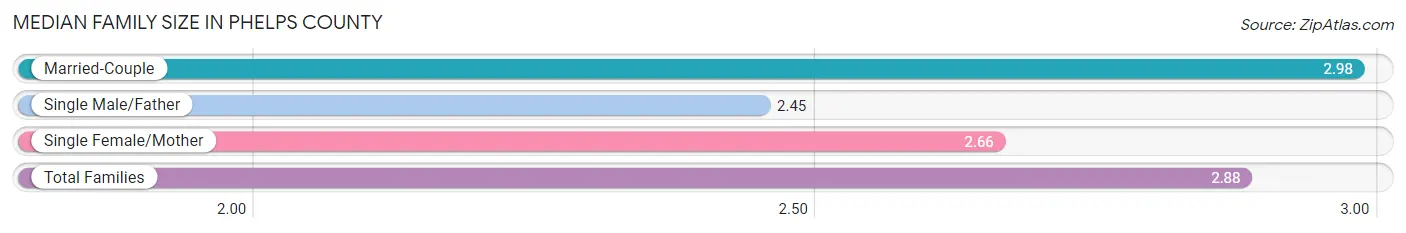
The median family size in Phelps County is 2.88 persons per family, with married-couple families (8,162 | 74.9%) accounting for the largest median family size of 2.98 persons per family. On the other hand, single male/father families (974 | 8.9%) represent the smallest median family size with 2.45 persons per family.
| Family Type | # Families | Family Size |
| Married-Couple | 8,162 (74.9%) | 2.98 |
| Single Male/Father | 974 (8.9%) | 2.45 |
| Single Female/Mother | 1,764 (16.2%) | 2.66 |
| Total Families | 10,900 (100.0%) | 2.88 |
Median Household Size in Phelps County
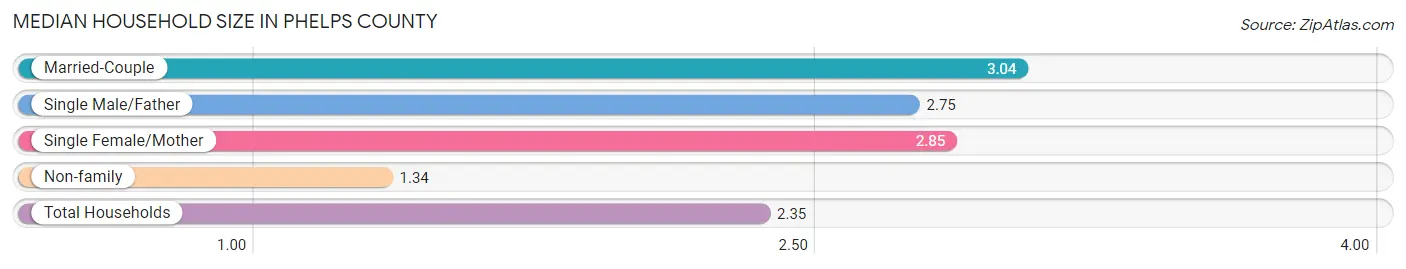
The median household size in Phelps County is 2.35 persons per household, with married-couple households (8,162 | 46.0%) accounting for the largest median household size of 3.04 persons per household. non-family households (6,830 | 38.5%) represent the smallest median household size with 1.34 persons per household.
| Household Type | # Households | Household Size |
| Married-Couple | 8,162 (46.0%) | 3.04 |
| Single Male/Father | 974 (5.5%) | 2.75 |
| Single Female/Mother | 1,764 (10.0%) | 2.85 |
| Non-family | 6,830 (38.5%) | 1.34 |
| Total Households | 17,730 (100.0%) | 2.35 |
Household Size by Marriage Status in Phelps County
Out of a total of 17,730 households in Phelps County, 10,900 (61.5%) are family households, while 6,830 (38.5%) are nonfamily households. The most numerous type of family households are 2-person households, comprising 5,517, and the most common type of nonfamily households are 1-person households, comprising 5,299.
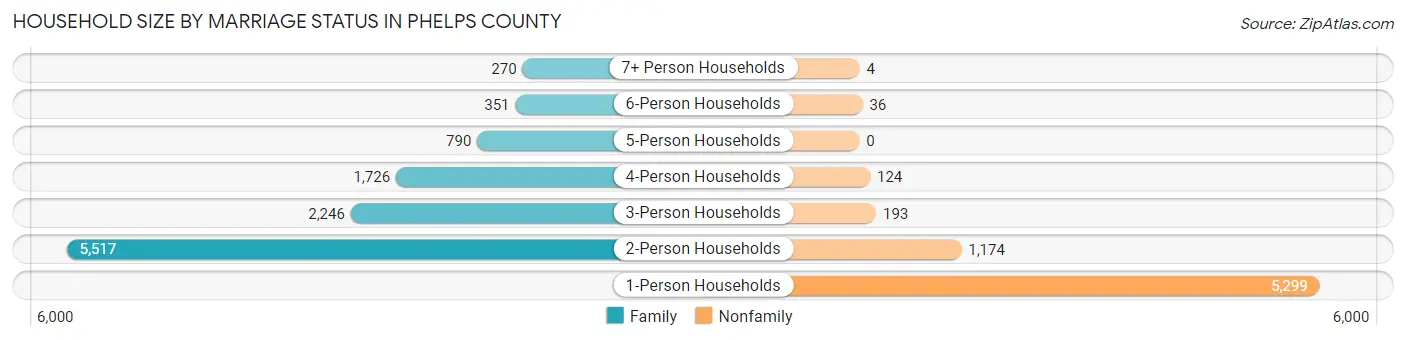
| Household Size | Family Households | Nonfamily Households |
| 1-Person Households | - | 5,299 (29.9%) |
| 2-Person Households | 5,517 (31.1%) | 1,174 (6.6%) |
| 3-Person Households | 2,246 (12.7%) | 193 (1.1%) |
| 4-Person Households | 1,726 (9.7%) | 124 (0.7%) |
| 5-Person Households | 790 (4.5%) | 0 (0.0%) |
| 6-Person Households | 351 (2.0%) | 36 (0.2%) |
| 7+ Person Households | 270 (1.5%) | 4 (0.0%) |
| Total | 10,900 (61.5%) | 6,830 (38.5%) |
Female Fertility in Phelps County
Fertility by Age in Phelps County
Average fertility rate in Phelps County is 42.0 births per 1,000 women. Women in the age bracket of 20 to 34 years have the highest fertility rate with 61.0 births per 1,000 women. Women in the age bracket of 20 to 34 years acount for 65.4% of all women with births.
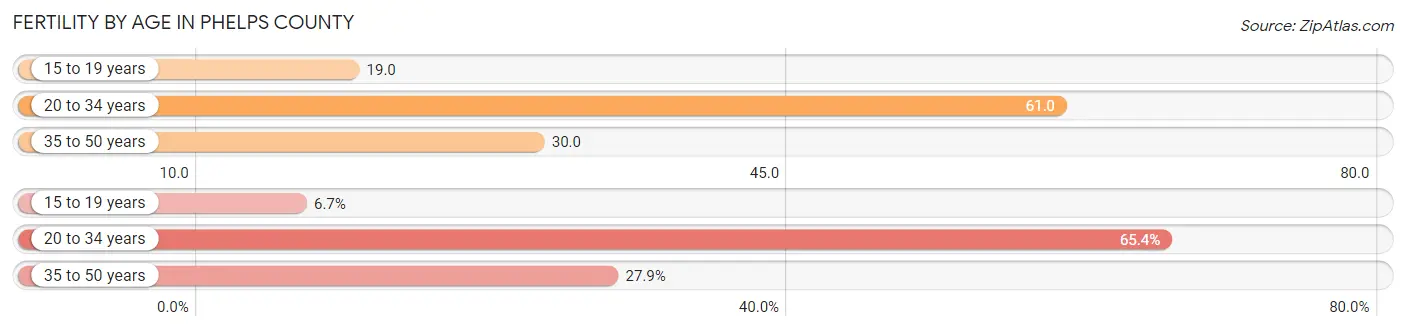
| Age Bracket | Women with Births | Births / 1,000 Women |
| 15 to 19 years | 27 (6.7%) | 19.0 |
| 20 to 34 years | 263 (65.4%) | 61.0 |
| 35 to 50 years | 112 (27.9%) | 30.0 |
| Total | 402 (100.0%) | 42.0 |
Fertility by Age by Marriage Status in Phelps County
83.8% of women with births (402) in Phelps County are married. The highest percentage of unmarried women with births falls into 15 to 19 years age bracket with 100.0% of them unmarried at the time of birth, while the lowest percentage of unmarried women with births belong to 35 to 50 years age bracket with 0.0% of them unmarried.
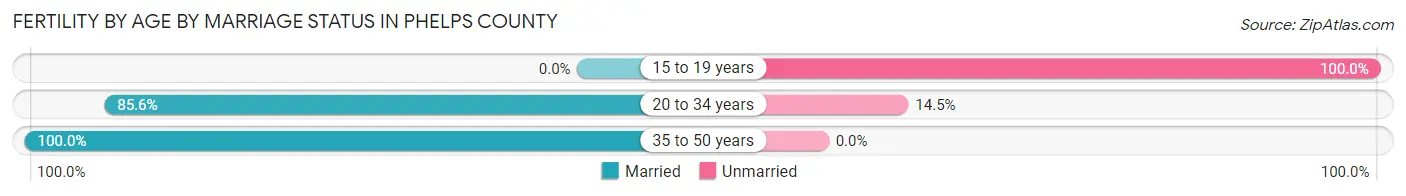
| Age Bracket | Married | Unmarried |
| 15 to 19 years | 0 (0.0%) | 27 (100.0%) |
| 20 to 34 years | 225 (85.6%) | 38 (14.4%) |
| 35 to 50 years | 112 (100.0%) | 0 (0.0%) |
| Total | 337 (83.8%) | 65 (16.2%) |
Fertility by Education in Phelps County
Average fertility rate in Phelps County is 42.0 births per 1,000 women. Women with the education attainment of high school diploma have the highest fertility rate of 84.0 births per 1,000 women, while women with the education attainment of college or associate's degree have the lowest fertility at 18.0 births per 1,000 women. Women with the education attainment of high school diploma represent 51.2% of all women with births.
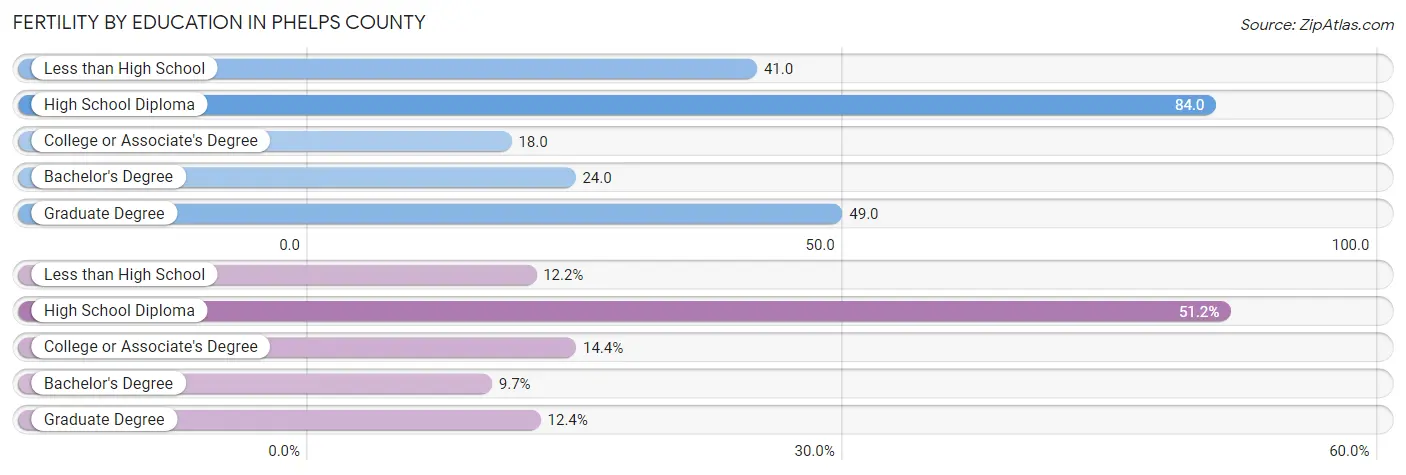
| Educational Attainment | Women with Births | Births / 1,000 Women |
| Less than High School | 49 (12.2%) | 41.0 |
| High School Diploma | 206 (51.2%) | 84.0 |
| College or Associate's Degree | 58 (14.4%) | 18.0 |
| Bachelor's Degree | 39 (9.7%) | 24.0 |
| Graduate Degree | 50 (12.4%) | 49.0 |
| Total | 402 (100.0%) | 42.0 |
Fertility by Education by Marriage Status in Phelps County
16.2% of women with births in Phelps County are unmarried. Women with the educational attainment of graduate degree are most likely to be married with 100.0% of them married at childbirth, while women with the educational attainment of less than high school are least likely to be married with 55.1% of them unmarried at childbirth.
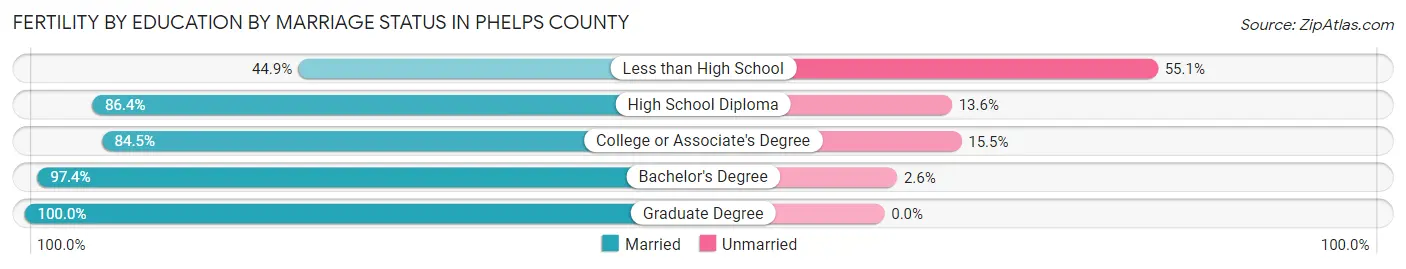
| Educational Attainment | Married | Unmarried |
| Less than High School | 22 (44.9%) | 27 (55.1%) |
| High School Diploma | 178 (86.4%) | 28 (13.6%) |
| College or Associate's Degree | 49 (84.5%) | 9 (15.5%) |
| Bachelor's Degree | 38 (97.4%) | 1 (2.6%) |
| Graduate Degree | 50 (100.0%) | 0 (0.0%) |
| Total | 337 (83.8%) | 65 (16.2%) |
Employment Characteristics in Phelps County
Employment by Class of Employer in Phelps County
Among the 18,728 employed individuals in Phelps County, private company employees (10,490 | 56.0%), state government employees (2,101 | 11.2%), and not-for-profit organizations (1,974 | 10.5%) make up the most common classes of employment.
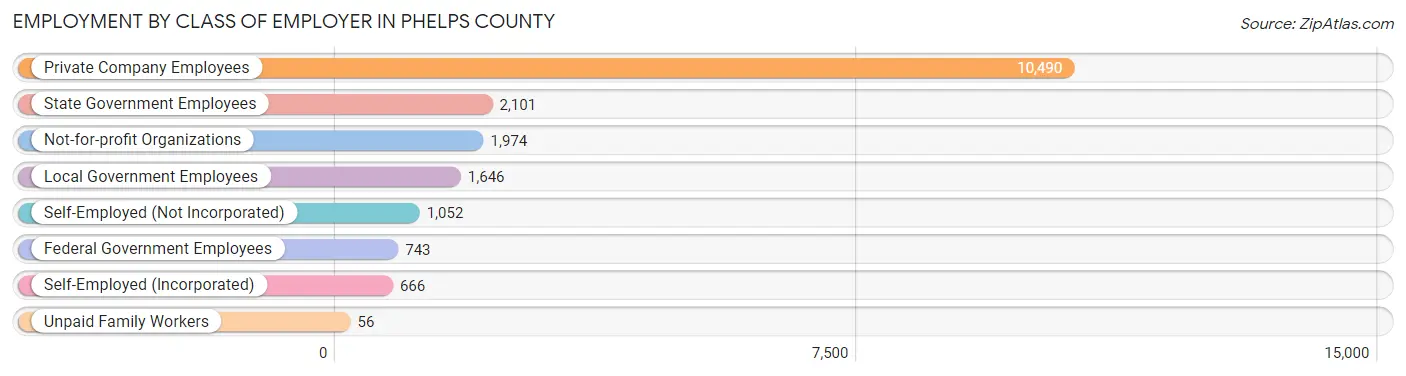
| Employer Class | # Employees | % Employees |
| Private Company Employees | 10,490 | 56.0% |
| Self-Employed (Incorporated) | 666 | 3.6% |
| Self-Employed (Not Incorporated) | 1,052 | 5.6% |
| Not-for-profit Organizations | 1,974 | 10.5% |
| Local Government Employees | 1,646 | 8.8% |
| State Government Employees | 2,101 | 11.2% |
| Federal Government Employees | 743 | 4.0% |
| Unpaid Family Workers | 56 | 0.3% |
| Total | 18,728 | 100.0% |
Employment Status by Age in Phelps County
According to the labor force statistics for Phelps County, out of the total population over 16 years of age (36,482), 54.7% or 19,956 individuals are in the labor force, with 4.2% or 838 of them unemployed. The age group with the highest labor force participation rate is 35 to 44 years, with 83.5% or 4,213 individuals in the labor force. Within the labor force, the 16 to 19 years age range has the highest percentage of unemployed individuals, with 13.2% or 132 of them being unemployed.
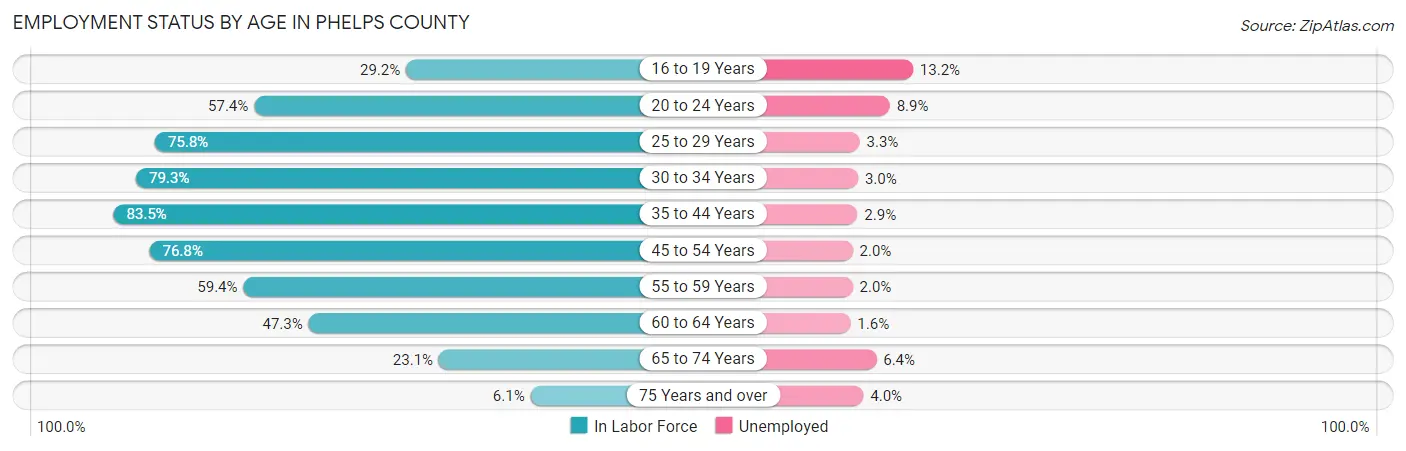
| Age Bracket | In Labor Force | Unemployed |
| 16 to 19 Years | 998 (29.2%) | 132 (13.2%) |
| 20 to 24 Years | 2,867 (57.4%) | 255 (8.9%) |
| 25 to 29 Years | 2,023 (75.8%) | 67 (3.3%) |
| 30 to 34 Years | 1,997 (79.3%) | 60 (3.0%) |
| 35 to 44 Years | 4,213 (83.5%) | 122 (2.9%) |
| 45 to 54 Years | 3,638 (76.8%) | 73 (2.0%) |
| 55 to 59 Years | 1,797 (59.4%) | 36 (2.0%) |
| 60 to 64 Years | 1,273 (47.3%) | 20 (1.6%) |
| 65 to 74 Years | 959 (23.1%) | 61 (6.4%) |
| 75 Years and over | 197 (6.1%) | 8 (4.0%) |
| Total | 19,956 (54.7%) | 838 (4.2%) |
Employment Status by Educational Attainment in Phelps County
According to labor force statistics for Phelps County, 72.2% of individuals (14,935) out of the total population between 25 and 64 years of age (20,686) are in the labor force, with 2.5% or 373 of them being unemployed. The group with the highest labor force participation rate are those with the educational attainment of bachelor's degree or higher, with 80.9% or 5,442 individuals in the labor force. Within the labor force, individuals with less than high school education have the highest percentage of unemployment, with 12.9% or 95 of them being unemployed.
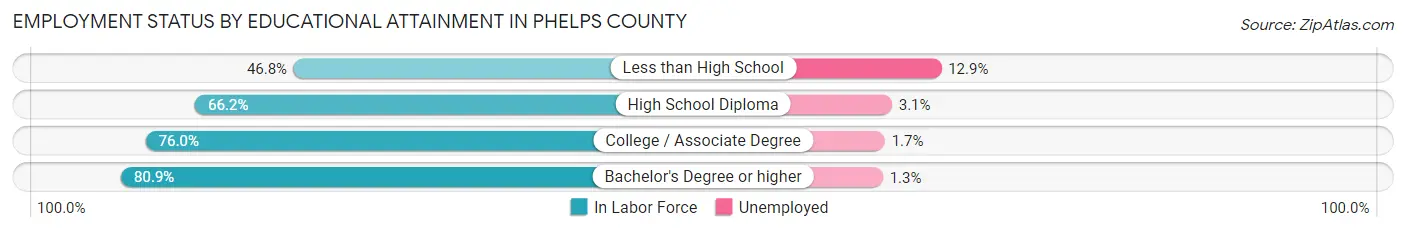
| Educational Attainment | In Labor Force | Unemployed |
| Less than High School | 736 (46.8%) | 203 (12.9%) |
| High School Diploma | 4,396 (66.2%) | 206 (3.1%) |
| College / Associate Degree | 4,368 (76.0%) | 98 (1.7%) |
| Bachelor's Degree or higher | 5,442 (80.9%) | 87 (1.3%) |
| Total | 14,935 (72.2%) | 517 (2.5%) |
Employment Occupations by Sex in Phelps County
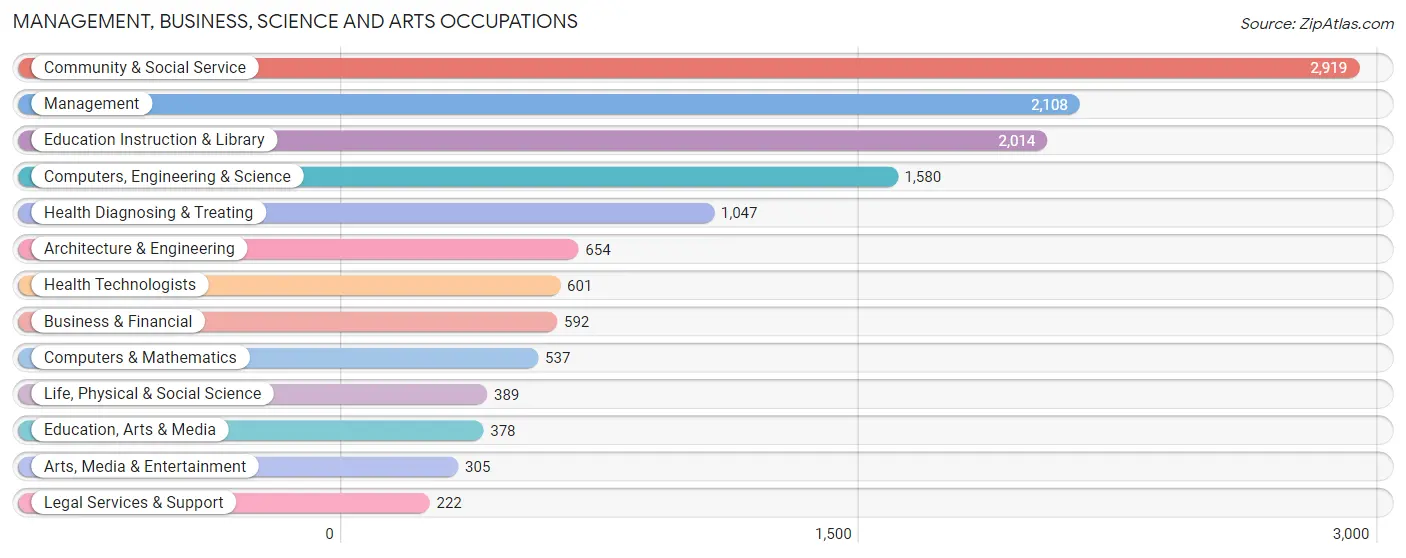
Management, Business, Science and Arts Occupations
The most common Management, Business, Science and Arts occupations in Phelps County are Community & Social Service (2,919 | 15.3%), Management (2,108 | 11.0%), Education Instruction & Library (2,014 | 10.5%), Computers, Engineering & Science (1,580 | 8.3%), and Health Diagnosing & Treating (1,047 | 5.5%).
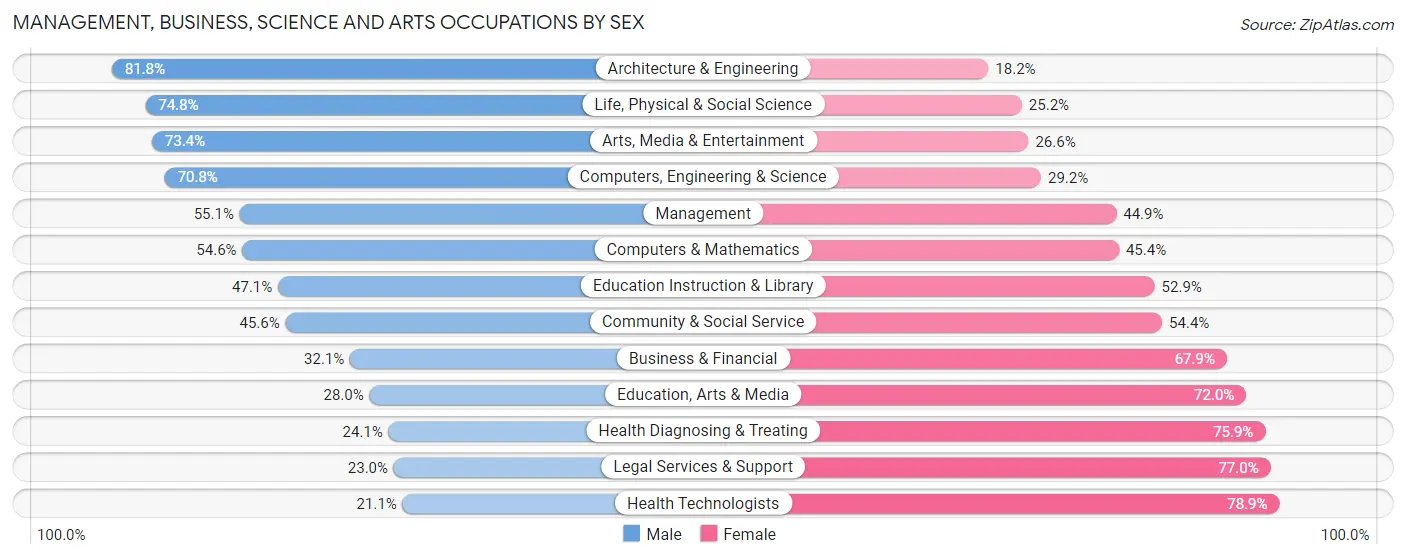
Management, Business, Science and Arts Occupations by Sex
Within the Management, Business, Science and Arts occupations in Phelps County, the most male-oriented occupations are Architecture & Engineering (81.8%), Life, Physical & Social Science (74.8%), and Arts, Media & Entertainment (73.4%), while the most female-oriented occupations are Health Technologists (78.9%), Legal Services & Support (77.0%), and Health Diagnosing & Treating (75.9%).
| Occupation | Male | Female |
| Management | 1,162 (55.1%) | 946 (44.9%) |
| Business & Financial | 190 (32.1%) | 402 (67.9%) |
| Computers, Engineering & Science | 1,119 (70.8%) | 461 (29.2%) |
| Computers & Mathematics | 293 (54.6%) | 244 (45.4%) |
| Architecture & Engineering | 535 (81.8%) | 119 (18.2%) |
| Life, Physical & Social Science | 291 (74.8%) | 98 (25.2%) |
| Community & Social Service | 1,330 (45.6%) | 1,589 (54.4%) |
| Education, Arts & Media | 106 (28.0%) | 272 (72.0%) |
| Legal Services & Support | 51 (23.0%) | 171 (77.0%) |
| Education Instruction & Library | 949 (47.1%) | 1,065 (52.9%) |
| Arts, Media & Entertainment | 224 (73.4%) | 81 (26.6%) |
| Health Diagnosing & Treating | 252 (24.1%) | 795 (75.9%) |
| Health Technologists | 127 (21.1%) | 474 (78.9%) |
| Total (Category) | 4,053 (49.1%) | 4,193 (50.8%) |
| Total (Overall) | 10,368 (54.3%) | 8,735 (45.7%) |
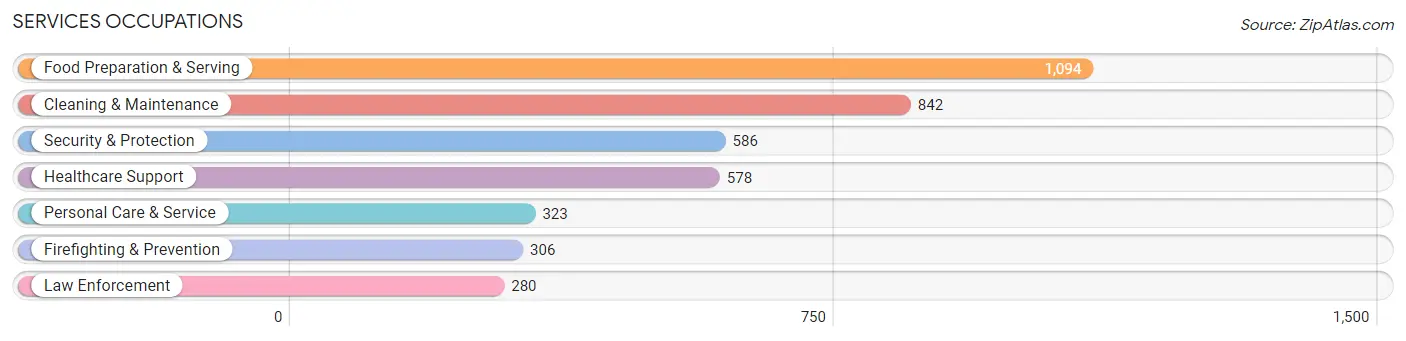
Services Occupations
The most common Services occupations in Phelps County are Food Preparation & Serving (1,094 | 5.7%), Cleaning & Maintenance (842 | 4.4%), Security & Protection (586 | 3.1%), Healthcare Support (578 | 3.0%), and Personal Care & Service (323 | 1.7%).
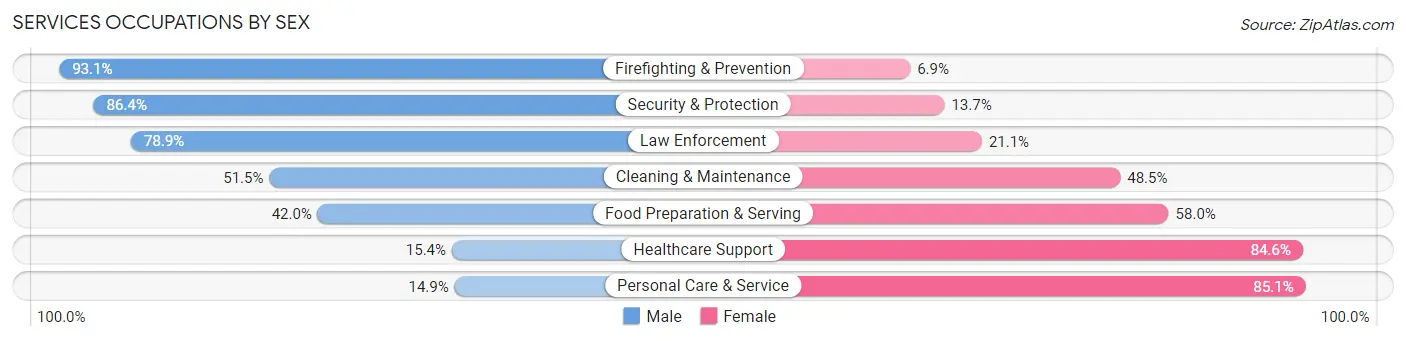
Services Occupations by Sex
Within the Services occupations in Phelps County, the most male-oriented occupations are Firefighting & Prevention (93.1%), Security & Protection (86.4%), and Law Enforcement (78.9%), while the most female-oriented occupations are Personal Care & Service (85.1%), Healthcare Support (84.6%), and Food Preparation & Serving (58.0%).
| Occupation | Male | Female |
| Healthcare Support | 89 (15.4%) | 489 (84.6%) |
| Security & Protection | 506 (86.4%) | 80 (13.7%) |
| Firefighting & Prevention | 285 (93.1%) | 21 (6.9%) |
| Law Enforcement | 221 (78.9%) | 59 (21.1%) |
| Food Preparation & Serving | 459 (42.0%) | 635 (58.0%) |
| Cleaning & Maintenance | 434 (51.5%) | 408 (48.5%) |
| Personal Care & Service | 48 (14.9%) | 275 (85.1%) |
| Total (Category) | 1,536 (44.9%) | 1,887 (55.1%) |
| Total (Overall) | 10,368 (54.3%) | 8,735 (45.7%) |
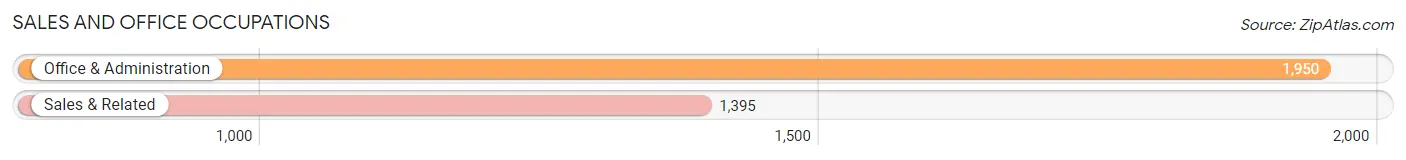
Sales and Office Occupations
The most common Sales and Office occupations in Phelps County are Office & Administration (1,950 | 10.2%), and Sales & Related (1,395 | 7.3%).
Sales and Office Occupations by Sex
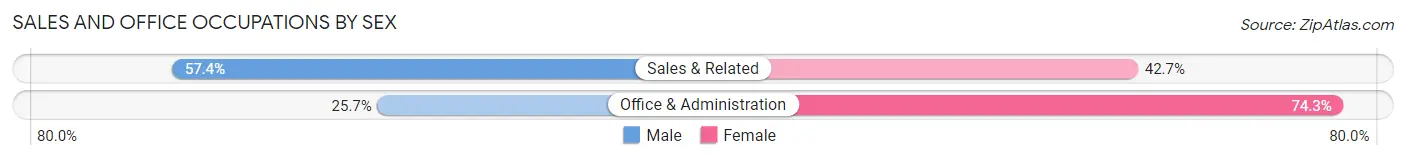
| Occupation | Male | Female |
| Sales & Related | 800 (57.4%) | 595 (42.6%) |
| Office & Administration | 501 (25.7%) | 1,449 (74.3%) |
| Total (Category) | 1,301 (38.9%) | 2,044 (61.1%) |
| Total (Overall) | 10,368 (54.3%) | 8,735 (45.7%) |
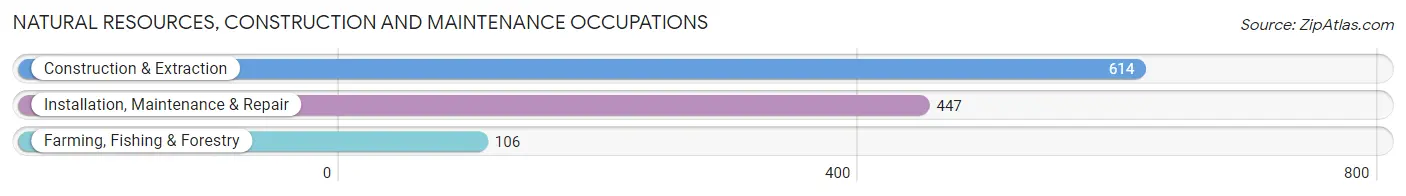
Natural Resources, Construction and Maintenance Occupations
The most common Natural Resources, Construction and Maintenance occupations in Phelps County are Construction & Extraction (614 | 3.2%), Installation, Maintenance & Repair (447 | 2.3%), and Farming, Fishing & Forestry (106 | 0.5%).
Natural Resources, Construction and Maintenance Occupations by Sex
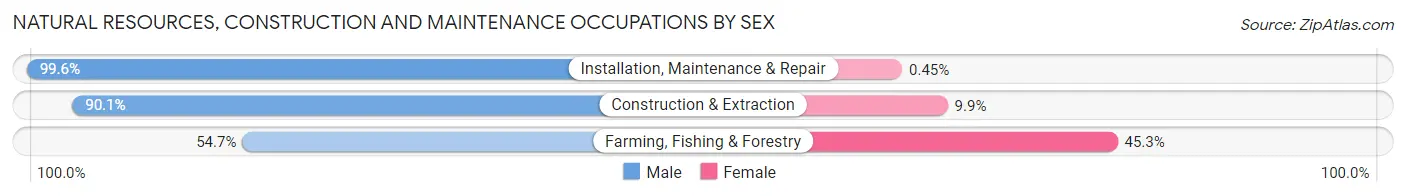
| Occupation | Male | Female |
| Farming, Fishing & Forestry | 58 (54.7%) | 48 (45.3%) |
| Construction & Extraction | 553 (90.1%) | 61 (9.9%) |
| Installation, Maintenance & Repair | 445 (99.6%) | 2 (0.4%) |
| Total (Category) | 1,056 (90.5%) | 111 (9.5%) |
| Total (Overall) | 10,368 (54.3%) | 8,735 (45.7%) |
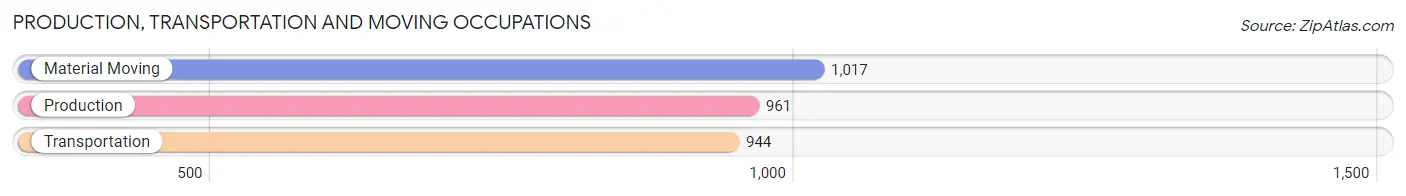
Production, Transportation and Moving Occupations
The most common Production, Transportation and Moving occupations in Phelps County are Material Moving (1,017 | 5.3%), Production (961 | 5.0%), and Transportation (944 | 4.9%).
Production, Transportation and Moving Occupations by Sex
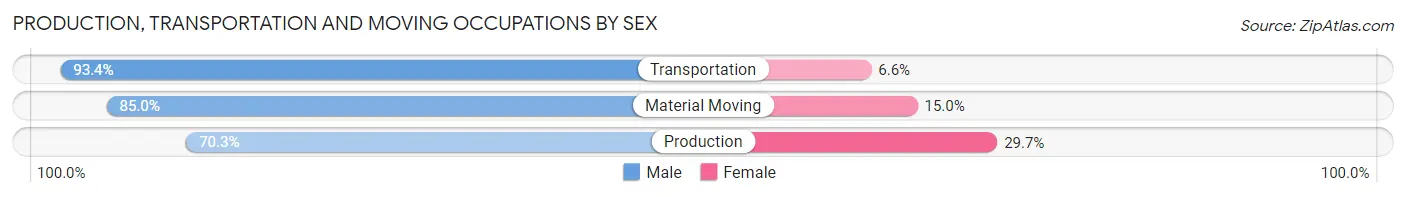
| Occupation | Male | Female |
| Production | 676 (70.3%) | 285 (29.7%) |
| Transportation | 882 (93.4%) | 62 (6.6%) |
| Material Moving | 864 (85.0%) | 153 (15.0%) |
| Total (Category) | 2,422 (82.9%) | 500 (17.1%) |
| Total (Overall) | 10,368 (54.3%) | 8,735 (45.7%) |
Employment Industries by Sex in Phelps County
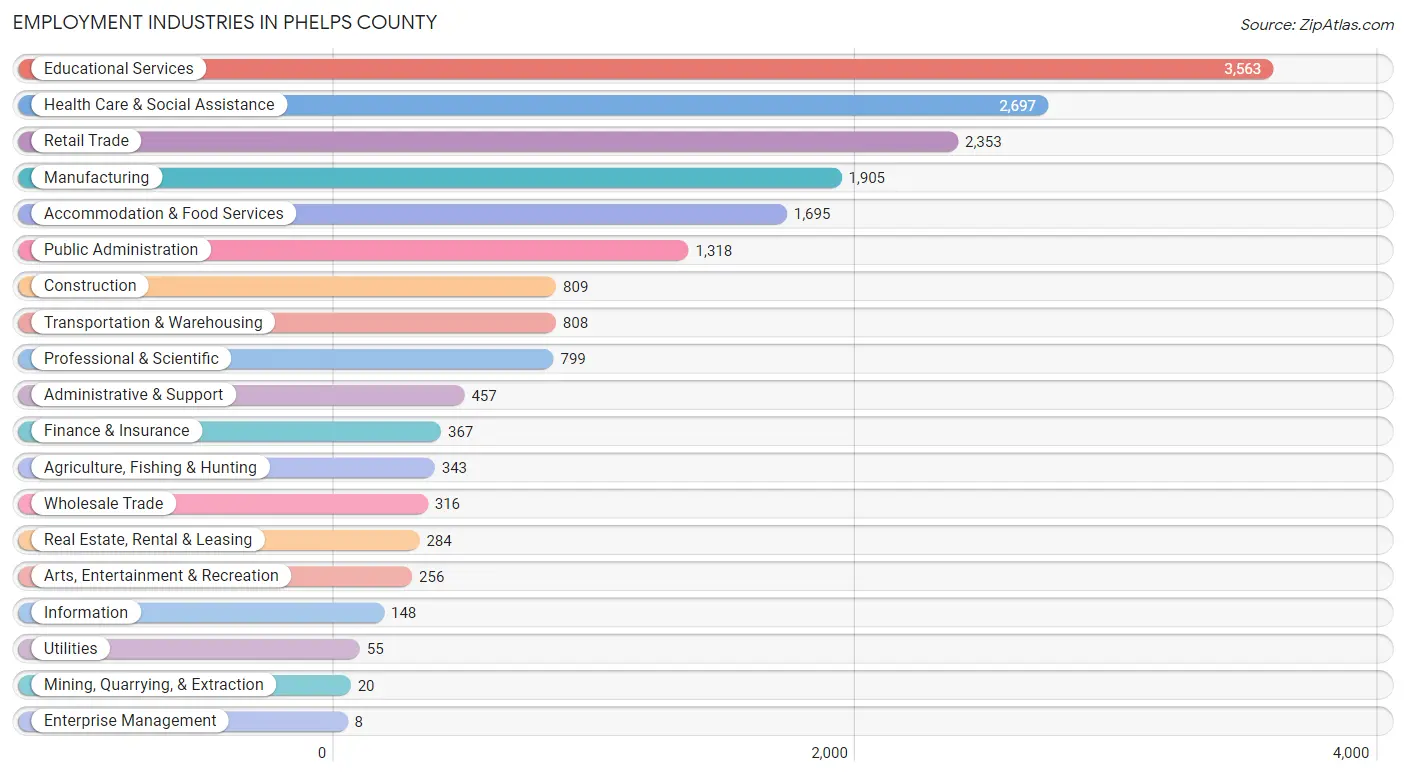
Employment Industries in Phelps County
The major employment industries in Phelps County include Educational Services (3,563 | 18.6%), Health Care & Social Assistance (2,697 | 14.1%), Retail Trade (2,353 | 12.3%), Manufacturing (1,905 | 10.0%), and Accommodation & Food Services (1,695 | 8.9%).
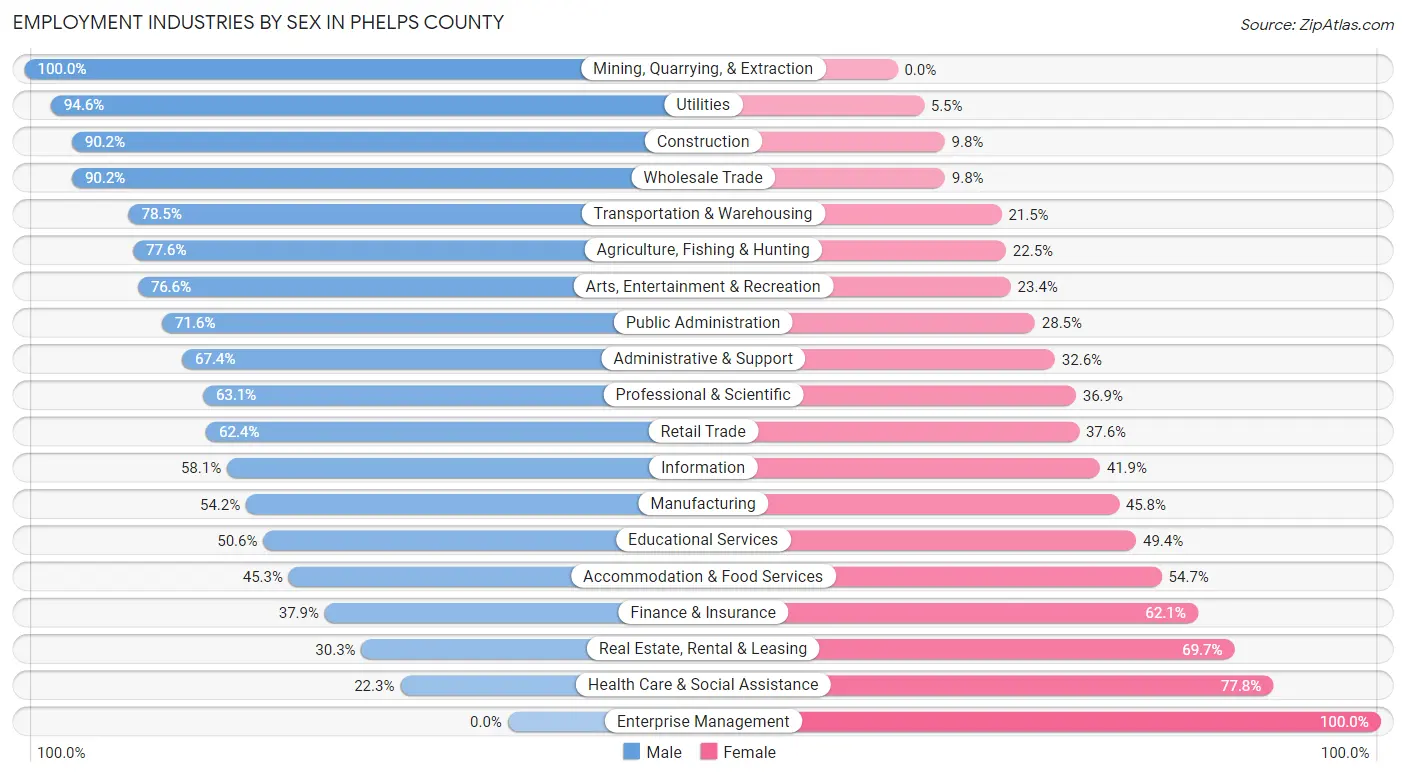
Employment Industries by Sex in Phelps County
The Phelps County industries that see more men than women are Mining, Quarrying, & Extraction (100.0%), Utilities (94.6%), and Construction (90.2%), whereas the industries that tend to have a higher number of women are Enterprise Management (100.0%), Health Care & Social Assistance (77.7%), and Real Estate, Rental & Leasing (69.7%).
| Industry | Male | Female |
| Agriculture, Fishing & Hunting | 266 (77.5%) | 77 (22.5%) |
| Mining, Quarrying, & Extraction | 20 (100.0%) | 0 (0.0%) |
| Construction | 730 (90.2%) | 79 (9.8%) |
| Manufacturing | 1,032 (54.2%) | 873 (45.8%) |
| Wholesale Trade | 285 (90.2%) | 31 (9.8%) |
| Retail Trade | 1,469 (62.4%) | 884 (37.6%) |
| Transportation & Warehousing | 634 (78.5%) | 174 (21.5%) |
| Utilities | 52 (94.6%) | 3 (5.4%) |
| Information | 86 (58.1%) | 62 (41.9%) |
| Finance & Insurance | 139 (37.9%) | 228 (62.1%) |
| Real Estate, Rental & Leasing | 86 (30.3%) | 198 (69.7%) |
| Professional & Scientific | 504 (63.1%) | 295 (36.9%) |
| Enterprise Management | 0 (0.0%) | 8 (100.0%) |
| Administrative & Support | 308 (67.4%) | 149 (32.6%) |
| Educational Services | 1,803 (50.6%) | 1,760 (49.4%) |
| Health Care & Social Assistance | 600 (22.3%) | 2,097 (77.7%) |
| Arts, Entertainment & Recreation | 196 (76.6%) | 60 (23.4%) |
| Accommodation & Food Services | 768 (45.3%) | 927 (54.7%) |
| Public Administration | 943 (71.6%) | 375 (28.4%) |
| Total | 10,368 (54.3%) | 8,735 (45.7%) |
Education in Phelps County
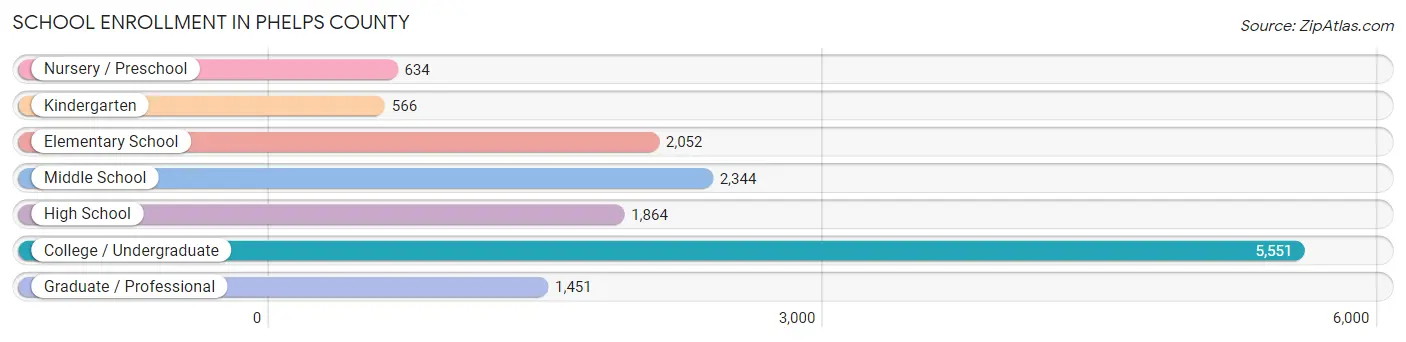
School Enrollment in Phelps County
The most common levels of schooling among the 14,462 students in Phelps County are college / undergraduate (5,551 | 38.4%), middle school (2,344 | 16.2%), and elementary school (2,052 | 14.2%).
| School Level | # Students | % Students |
| Nursery / Preschool | 634 | 4.4% |
| Kindergarten | 566 | 3.9% |
| Elementary School | 2,052 | 14.2% |
| Middle School | 2,344 | 16.2% |
| High School | 1,864 | 12.9% |
| College / Undergraduate | 5,551 | 38.4% |
| Graduate / Professional | 1,451 | 10.0% |
| Total | 14,462 | 100.0% |
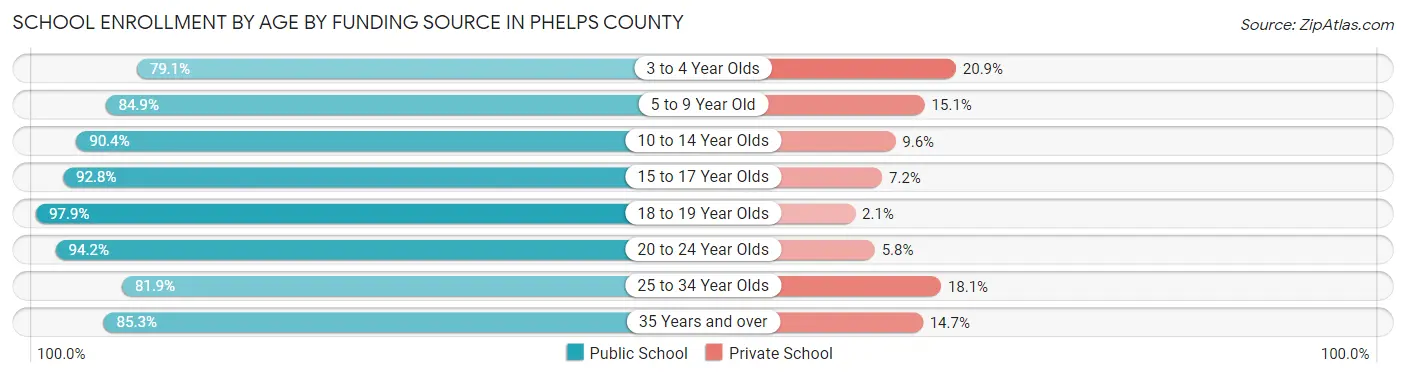
School Enrollment by Age by Funding Source in Phelps County
Out of a total of 14,462 students who are enrolled in schools in Phelps County, 1,403 (9.7%) attend a private institution, while the remaining 13,059 (90.3%) are enrolled in public schools. The age group of 3 to 4 year olds has the highest likelihood of being enrolled in private schools, with 107 (20.9% in the age bracket) enrolled. Conversely, the age group of 18 to 19 year olds has the lowest likelihood of being enrolled in a private school, with 2,026 (97.9% in the age bracket) attending a public institution.
| Age Bracket | Public School | Private School |
| 3 to 4 Year Olds | 405 (79.1%) | 107 (20.9%) |
| 5 to 9 Year Old | 2,156 (84.9%) | 383 (15.1%) |
| 10 to 14 Year Olds | 2,431 (90.4%) | 259 (9.6%) |
| 15 to 17 Year Olds | 1,452 (92.8%) | 112 (7.2%) |
| 18 to 19 Year Olds | 2,026 (97.9%) | 44 (2.1%) |
| 20 to 24 Year Olds | 3,127 (94.2%) | 192 (5.8%) |
| 25 to 34 Year Olds | 1,003 (81.9%) | 222 (18.1%) |
| 35 Years and over | 463 (85.3%) | 80 (14.7%) |
| Total | 13,059 (90.3%) | 1,403 (9.7%) |
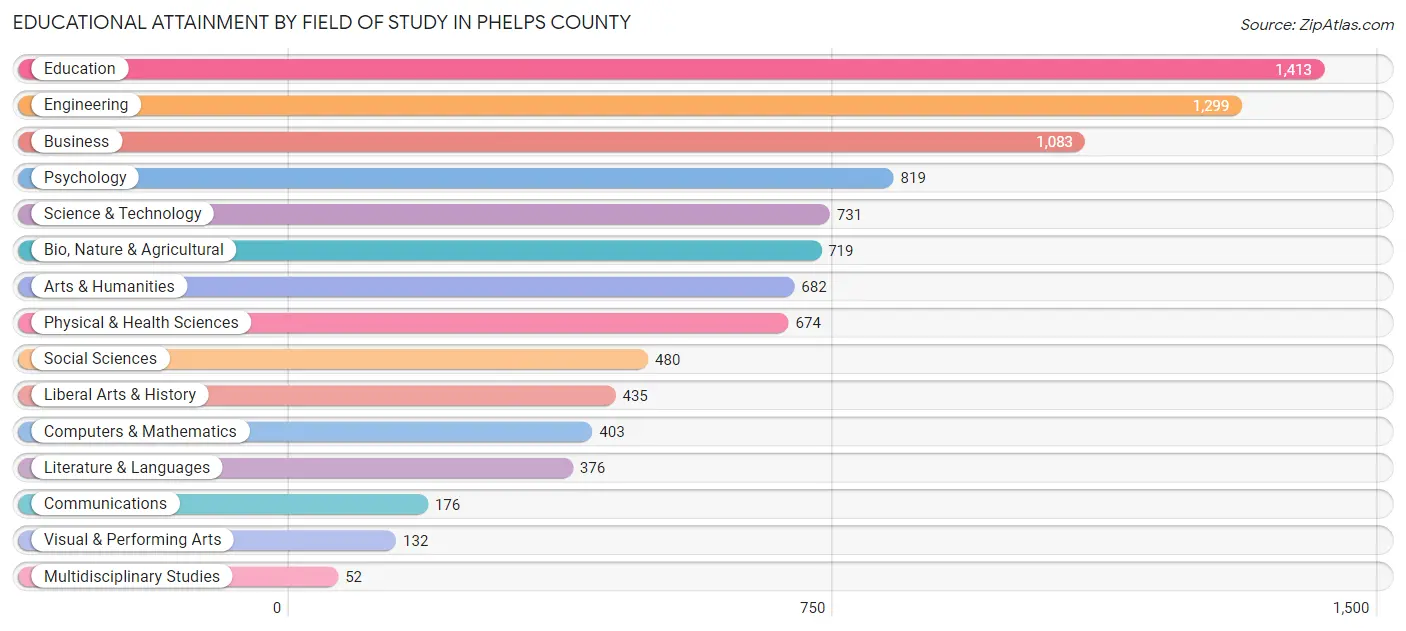
Educational Attainment by Field of Study in Phelps County
Education (1,413 | 14.9%), engineering (1,299 | 13.7%), business (1,083 | 11.4%), psychology (819 | 8.6%), and science & technology (731 | 7.7%) are the most common fields of study among 9,474 individuals in Phelps County who have obtained a bachelor's degree or higher.
| Field of Study | # Graduates | % Graduates |
| Computers & Mathematics | 403 | 4.3% |
| Bio, Nature & Agricultural | 719 | 7.6% |
| Physical & Health Sciences | 674 | 7.1% |
| Psychology | 819 | 8.6% |
| Social Sciences | 480 | 5.1% |
| Engineering | 1,299 | 13.7% |
| Multidisciplinary Studies | 52 | 0.5% |
| Science & Technology | 731 | 7.7% |
| Business | 1,083 | 11.4% |
| Education | 1,413 | 14.9% |
| Literature & Languages | 376 | 4.0% |
| Liberal Arts & History | 435 | 4.6% |
| Visual & Performing Arts | 132 | 1.4% |
| Communications | 176 | 1.9% |
| Arts & Humanities | 682 | 7.2% |
| Total | 9,474 | 100.0% |
Transportation & Commute in Phelps County
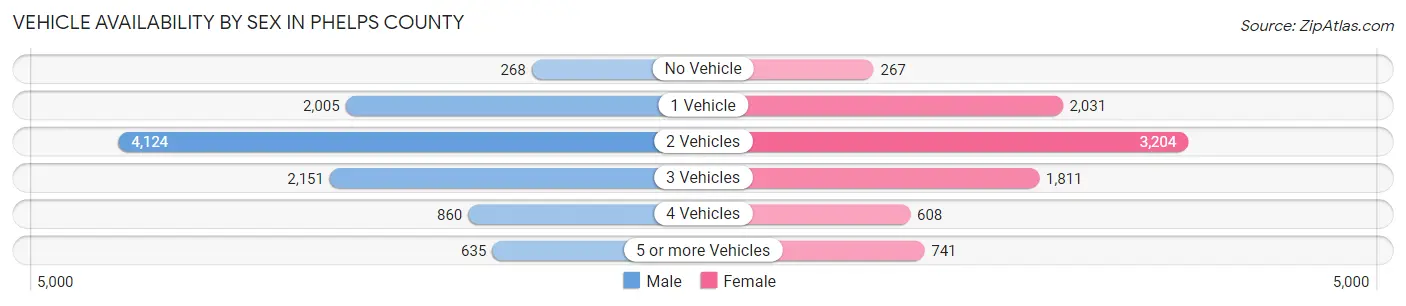
Vehicle Availability by Sex in Phelps County
The most prevalent vehicle ownership categories in Phelps County are males with 2 vehicles (4,124, accounting for 41.1%) and females with 2 vehicles (3,204, making up 47.6%).
| Vehicles Available | Male | Female |
| No Vehicle | 268 (2.7%) | 267 (3.1%) |
| 1 Vehicle | 2,005 (20.0%) | 2,031 (23.4%) |
| 2 Vehicles | 4,124 (41.1%) | 3,204 (37.0%) |
| 3 Vehicles | 2,151 (21.4%) | 1,811 (20.9%) |
| 4 Vehicles | 860 (8.6%) | 608 (7.0%) |
| 5 or more Vehicles | 635 (6.3%) | 741 (8.6%) |
| Total | 10,043 (100.0%) | 8,662 (100.0%) |
Commute Time in Phelps County
The most frequently occuring commute durations in Phelps County are 10 to 14 minutes (4,156 commuters, 23.6%), 5 to 9 minutes (3,574 commuters, 20.3%), and 15 to 19 minutes (3,445 commuters, 19.6%).
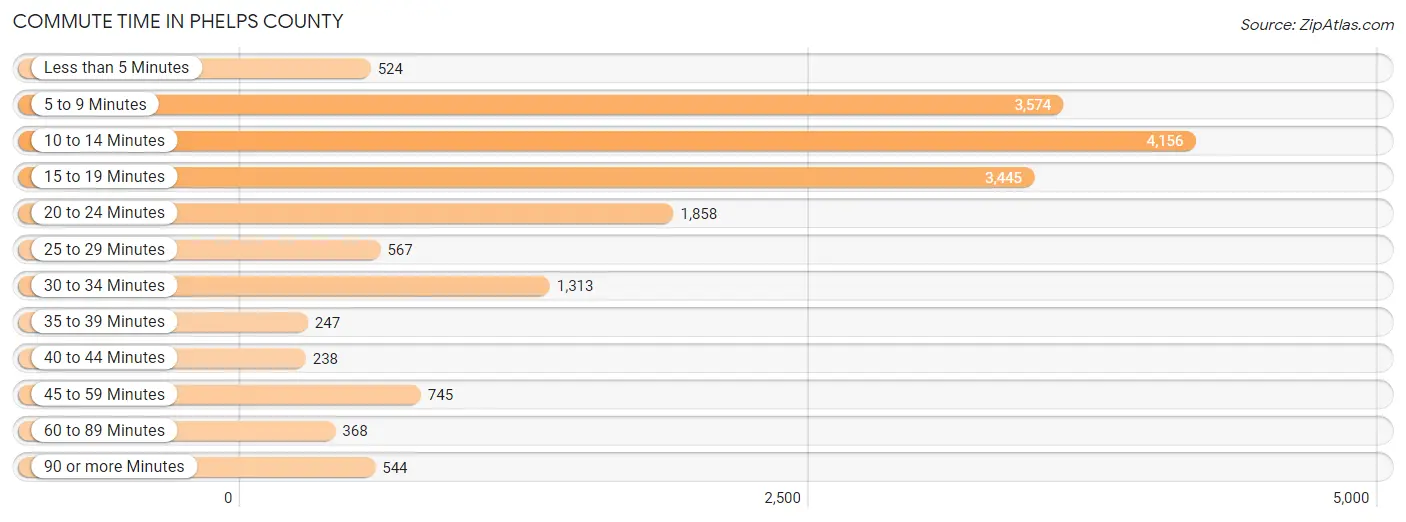
| Commute Time | # Commuters | % Commuters |
| Less than 5 Minutes | 524 | 3.0% |
| 5 to 9 Minutes | 3,574 | 20.3% |
| 10 to 14 Minutes | 4,156 | 23.6% |
| 15 to 19 Minutes | 3,445 | 19.6% |
| 20 to 24 Minutes | 1,858 | 10.6% |
| 25 to 29 Minutes | 567 | 3.2% |
| 30 to 34 Minutes | 1,313 | 7.5% |
| 35 to 39 Minutes | 247 | 1.4% |
| 40 to 44 Minutes | 238 | 1.3% |
| 45 to 59 Minutes | 745 | 4.2% |
| 60 to 89 Minutes | 368 | 2.1% |
| 90 or more Minutes | 544 | 3.1% |
Commute Time by Sex in Phelps County
The most common commute times in Phelps County are 10 to 14 minutes (2,197 commuters, 23.5%) for males and 10 to 14 minutes (1,959 commuters, 23.8%) for females.
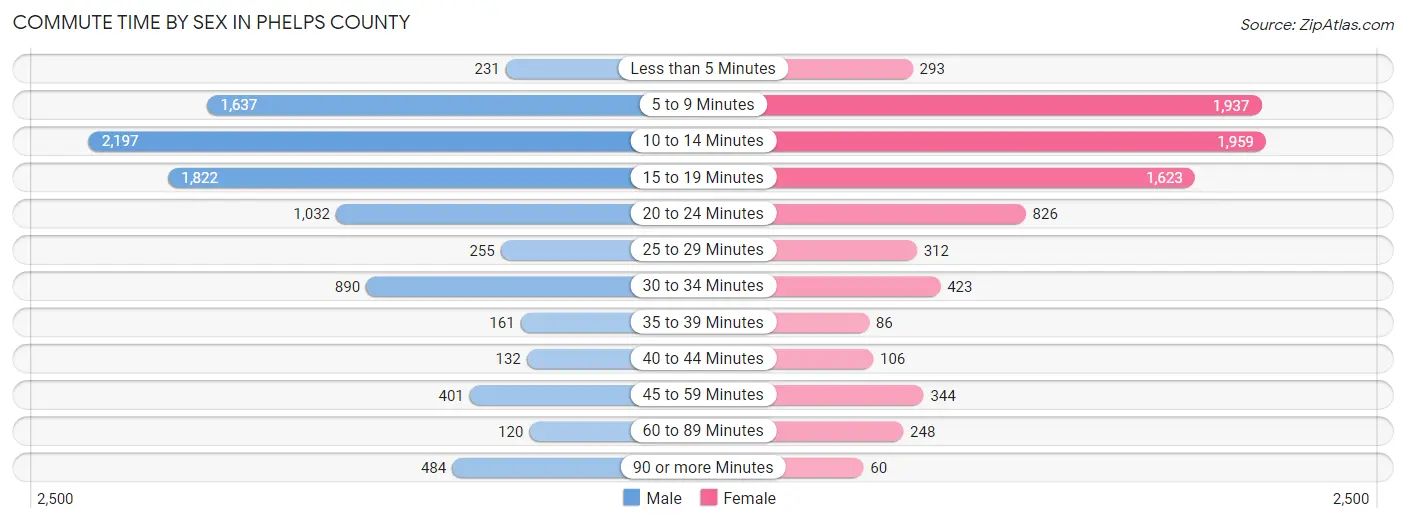
| Commute Time | Male | Female |
| Less than 5 Minutes | 231 (2.5%) | 293 (3.6%) |
| 5 to 9 Minutes | 1,637 (17.5%) | 1,937 (23.6%) |
| 10 to 14 Minutes | 2,197 (23.5%) | 1,959 (23.8%) |
| 15 to 19 Minutes | 1,822 (19.5%) | 1,623 (19.8%) |
| 20 to 24 Minutes | 1,032 (11.0%) | 826 (10.1%) |
| 25 to 29 Minutes | 255 (2.7%) | 312 (3.8%) |
| 30 to 34 Minutes | 890 (9.5%) | 423 (5.1%) |
| 35 to 39 Minutes | 161 (1.7%) | 86 (1.1%) |
| 40 to 44 Minutes | 132 (1.4%) | 106 (1.3%) |
| 45 to 59 Minutes | 401 (4.3%) | 344 (4.2%) |
| 60 to 89 Minutes | 120 (1.3%) | 248 (3.0%) |
| 90 or more Minutes | 484 (5.2%) | 60 (0.7%) |
Time of Departure to Work by Sex in Phelps County
The most frequent times of departure to work in Phelps County are 7:30 AM to 7:59 AM (1,498, 16.0%) for males and 7:30 AM to 7:59 AM (2,064, 25.1%) for females.
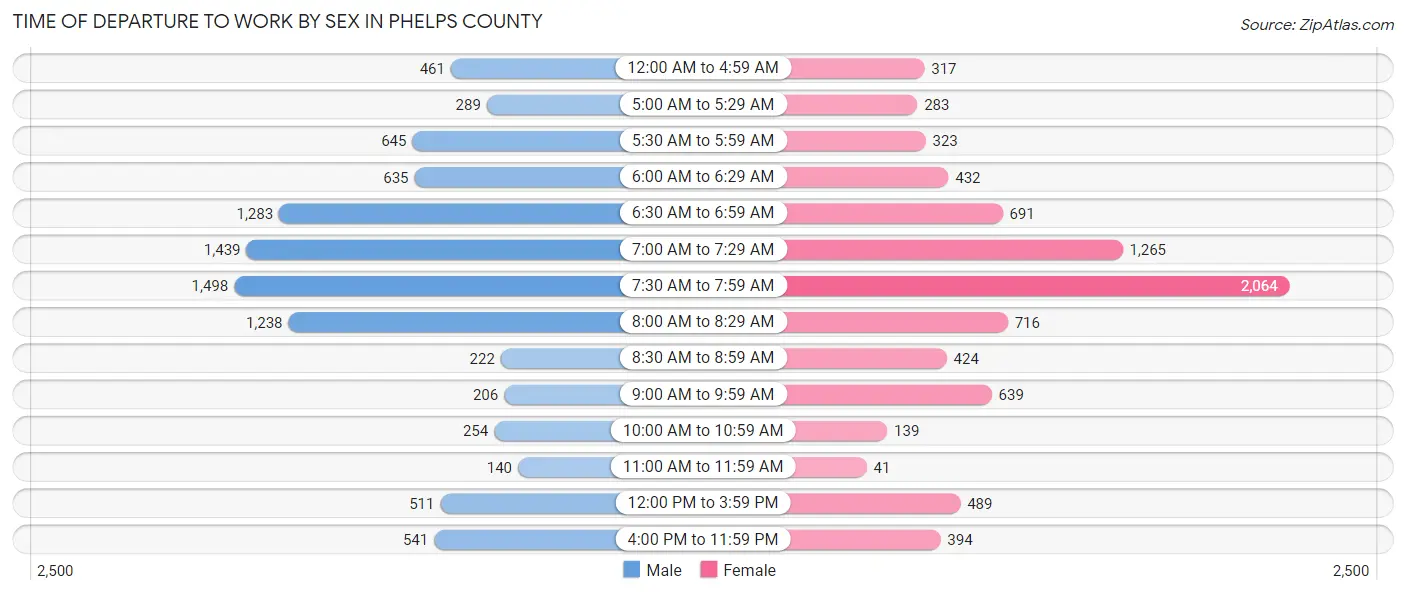
| Time of Departure | Male | Female |
| 12:00 AM to 4:59 AM | 461 (4.9%) | 317 (3.9%) |
| 5:00 AM to 5:29 AM | 289 (3.1%) | 283 (3.4%) |
| 5:30 AM to 5:59 AM | 645 (6.9%) | 323 (3.9%) |
| 6:00 AM to 6:29 AM | 635 (6.8%) | 432 (5.3%) |
| 6:30 AM to 6:59 AM | 1,283 (13.7%) | 691 (8.4%) |
| 7:00 AM to 7:29 AM | 1,439 (15.4%) | 1,265 (15.4%) |
| 7:30 AM to 7:59 AM | 1,498 (16.0%) | 2,064 (25.1%) |
| 8:00 AM to 8:29 AM | 1,238 (13.2%) | 716 (8.7%) |
| 8:30 AM to 8:59 AM | 222 (2.4%) | 424 (5.2%) |
| 9:00 AM to 9:59 AM | 206 (2.2%) | 639 (7.8%) |
| 10:00 AM to 10:59 AM | 254 (2.7%) | 139 (1.7%) |
| 11:00 AM to 11:59 AM | 140 (1.5%) | 41 (0.5%) |
| 12:00 PM to 3:59 PM | 511 (5.5%) | 489 (5.9%) |
| 4:00 PM to 11:59 PM | 541 (5.8%) | 394 (4.8%) |
| Total | 9,362 (100.0%) | 8,217 (100.0%) |
Housing Occupancy in Phelps County
Occupancy by Ownership in Phelps County
Of the total 17,730 dwellings in Phelps County, owner-occupied units account for 10,657 (60.1%), while renter-occupied units make up 7,073 (39.9%).
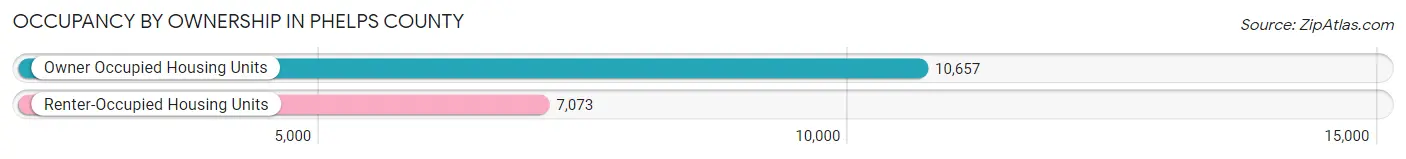
| Occupancy | # Housing Units | % Housing Units |
| Owner Occupied Housing Units | 10,657 | 60.1% |
| Renter-Occupied Housing Units | 7,073 | 39.9% |
| Total Occupied Housing Units | 17,730 | 100.0% |
Occupancy by Household Size in Phelps County
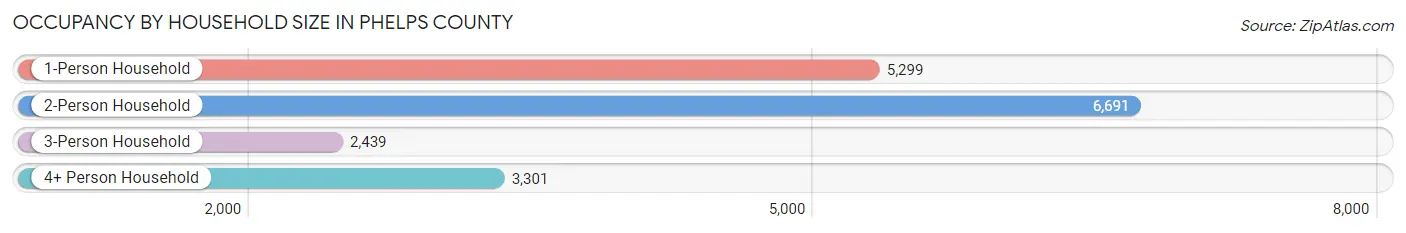
| Household Size | # Housing Units | % Housing Units |
| 1-Person Household | 5,299 | 29.9% |
| 2-Person Household | 6,691 | 37.7% |
| 3-Person Household | 2,439 | 13.8% |
| 4+ Person Household | 3,301 | 18.6% |
| Total Housing Units | 17,730 | 100.0% |
Occupancy by Ownership by Household Size in Phelps County
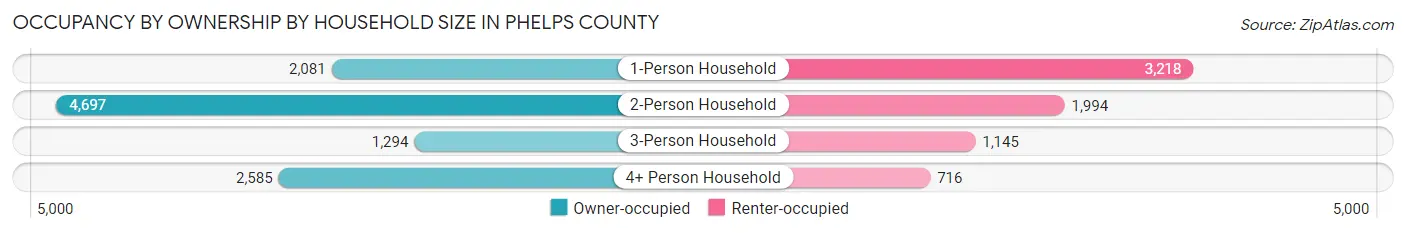
| Household Size | Owner-occupied | Renter-occupied |
| 1-Person Household | 2,081 (39.3%) | 3,218 (60.7%) |
| 2-Person Household | 4,697 (70.2%) | 1,994 (29.8%) |
| 3-Person Household | 1,294 (53.0%) | 1,145 (46.9%) |
| 4+ Person Household | 2,585 (78.3%) | 716 (21.7%) |
| Total Housing Units | 10,657 (60.1%) | 7,073 (39.9%) |
Occupancy by Educational Attainment in Phelps County
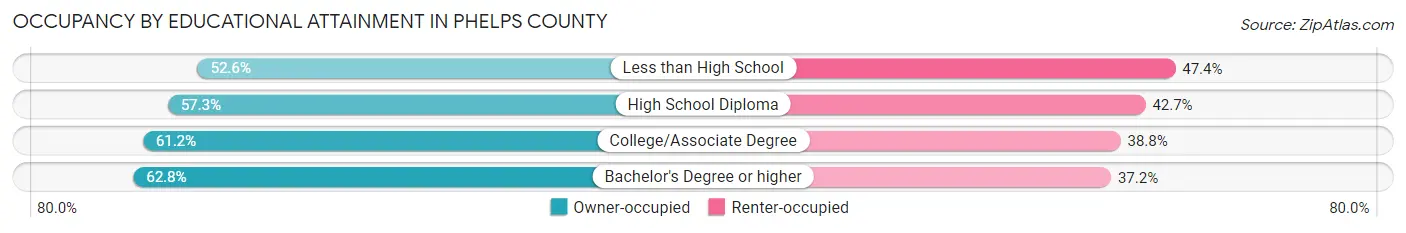
| Household Size | Owner-occupied | Renter-occupied |
| Less than High School | 677 (52.6%) | 611 (47.4%) |
| High School Diploma | 2,638 (57.3%) | 1,967 (42.7%) |
| College/Associate Degree | 3,500 (61.2%) | 2,215 (38.8%) |
| Bachelor's Degree or higher | 3,842 (62.8%) | 2,280 (37.2%) |
Occupancy by Age of Householder in Phelps County
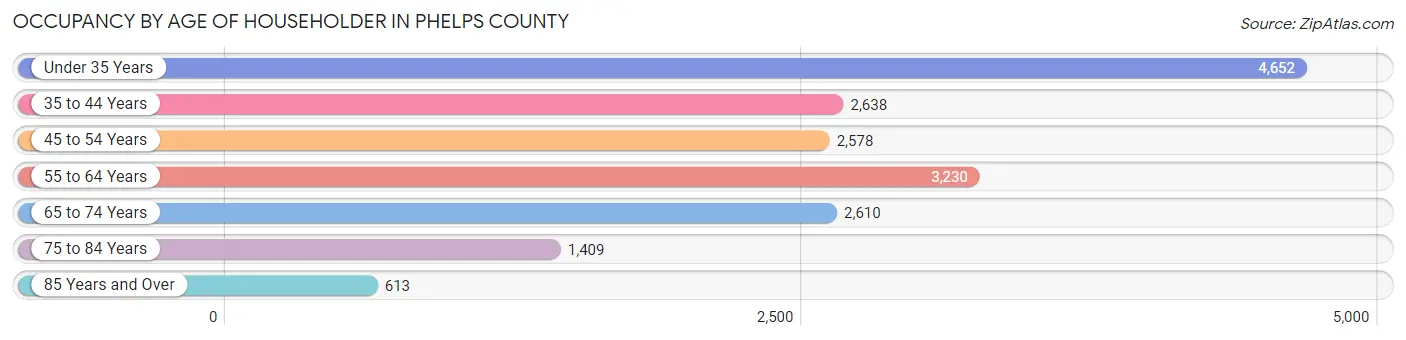
| Age Bracket | # Households | % Households |
| Under 35 Years | 4,652 | 26.2% |
| 35 to 44 Years | 2,638 | 14.9% |
| 45 to 54 Years | 2,578 | 14.5% |
| 55 to 64 Years | 3,230 | 18.2% |
| 65 to 74 Years | 2,610 | 14.7% |
| 75 to 84 Years | 1,409 | 8.0% |
| 85 Years and Over | 613 | 3.5% |
| Total | 17,730 | 100.0% |
Housing Finances in Phelps County
Median Income by Occupancy in Phelps County
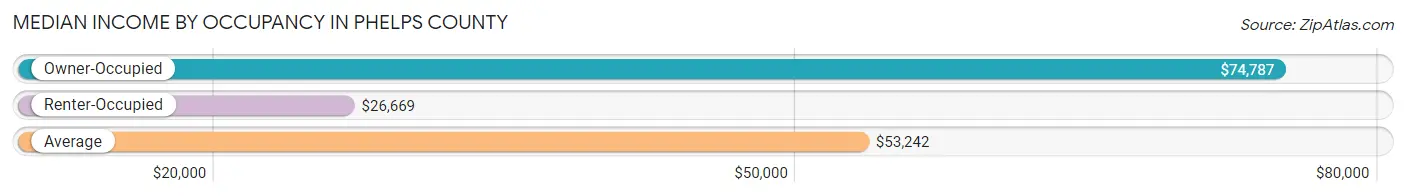
| Occupancy Type | # Households | Median Income |
| Owner-Occupied | 10,657 (60.1%) | $74,787 |
| Renter-Occupied | 7,073 (39.9%) | $26,669 |
| Average | 17,730 (100.0%) | $53,242 |
Occupancy by Householder Income Bracket in Phelps County
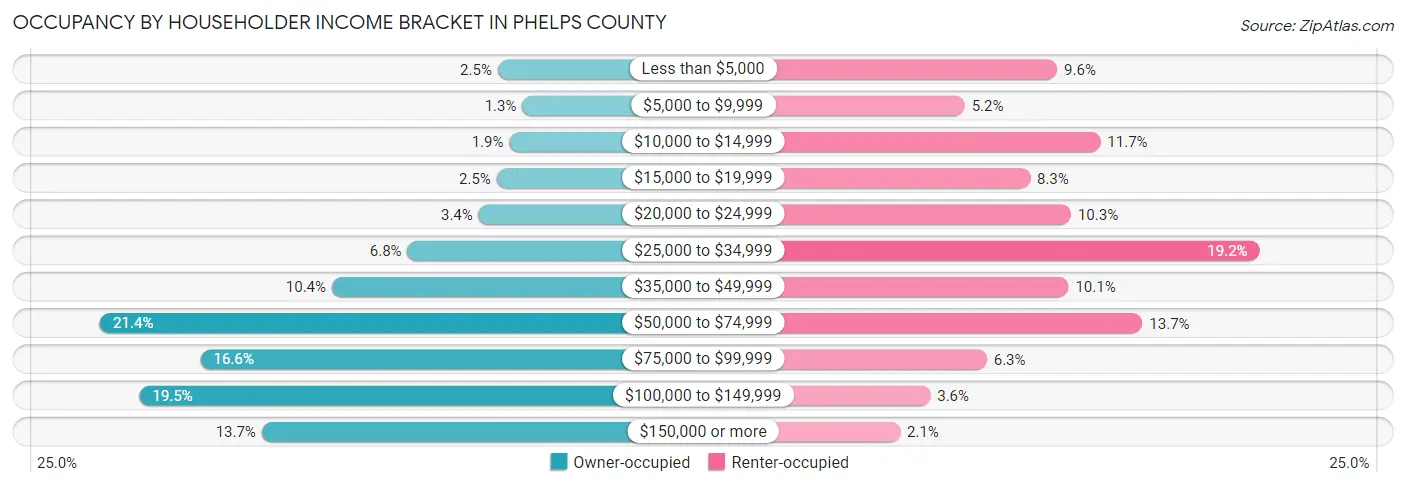
| Income Bracket | Owner-occupied | Renter-occupied |
| Less than $5,000 | 263 (2.5%) | 679 (9.6%) |
| $5,000 to $9,999 | 139 (1.3%) | 368 (5.2%) |
| $10,000 to $14,999 | 205 (1.9%) | 825 (11.7%) |
| $15,000 to $19,999 | 269 (2.5%) | 588 (8.3%) |
| $20,000 to $24,999 | 360 (3.4%) | 726 (10.3%) |
| $25,000 to $34,999 | 722 (6.8%) | 1,360 (19.2%) |
| $35,000 to $49,999 | 1,105 (10.4%) | 717 (10.1%) |
| $50,000 to $74,999 | 2,281 (21.4%) | 966 (13.7%) |
| $75,000 to $99,999 | 1,771 (16.6%) | 442 (6.2%) |
| $100,000 to $149,999 | 2,081 (19.5%) | 252 (3.6%) |
| $150,000 or more | 1,461 (13.7%) | 150 (2.1%) |
| Total | 10,657 (100.0%) | 7,073 (100.0%) |
Monthly Housing Cost Tiers in Phelps County
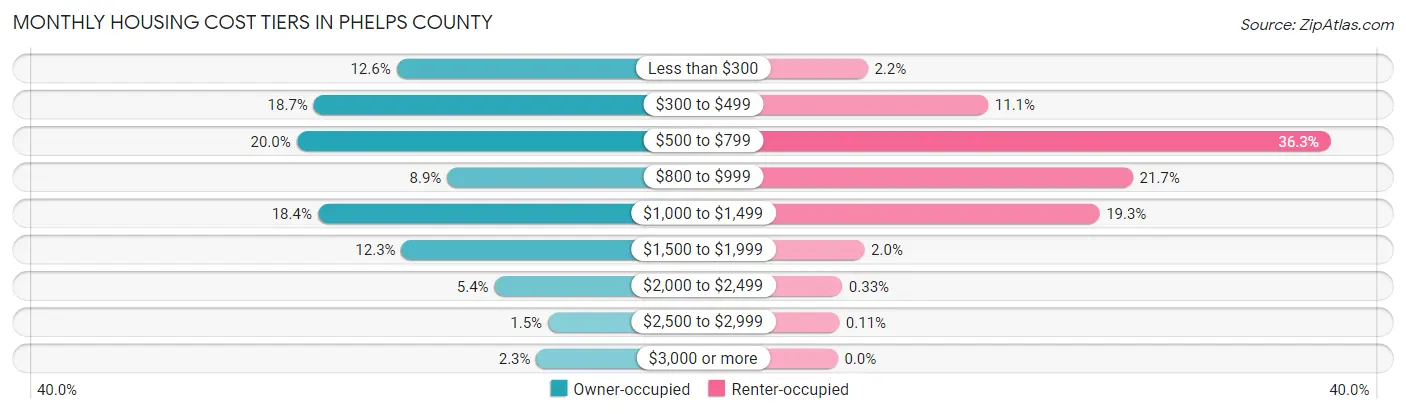
| Monthly Cost | Owner-occupied | Renter-occupied |
| Less than $300 | 1,344 (12.6%) | 156 (2.2%) |
| $300 to $499 | 1,994 (18.7%) | 784 (11.1%) |
| $500 to $799 | 2,128 (20.0%) | 2,569 (36.3%) |
| $800 to $999 | 946 (8.9%) | 1,538 (21.7%) |
| $1,000 to $1,499 | 1,962 (18.4%) | 1,364 (19.3%) |
| $1,500 to $1,999 | 1,306 (12.2%) | 139 (2.0%) |
| $2,000 to $2,499 | 575 (5.4%) | 23 (0.3%) |
| $2,500 to $2,999 | 156 (1.5%) | 8 (0.1%) |
| $3,000 or more | 246 (2.3%) | 0 (0.0%) |
| Total | 10,657 (100.0%) | 7,073 (100.0%) |
Physical Housing Characteristics in Phelps County
Housing Structures in Phelps County
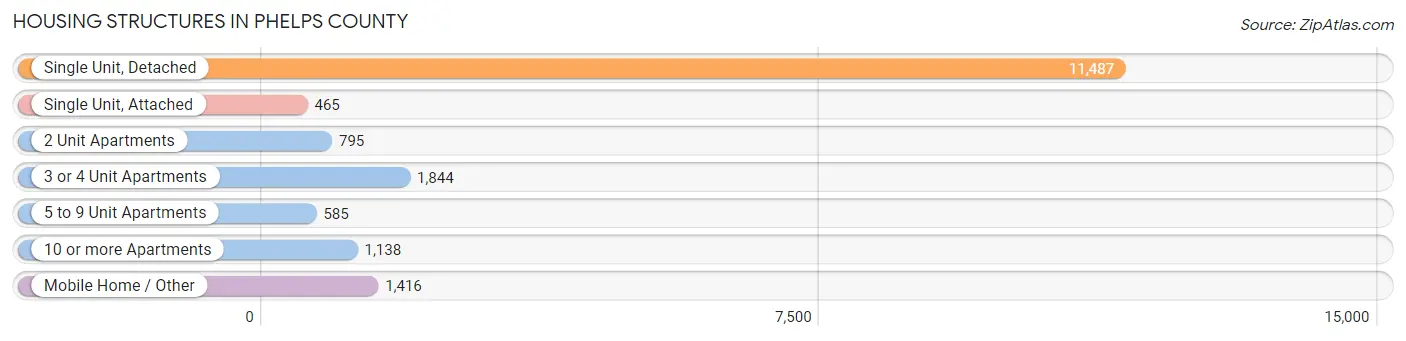
| Structure Type | # Housing Units | % Housing Units |
| Single Unit, Detached | 11,487 | 64.8% |
| Single Unit, Attached | 465 | 2.6% |
| 2 Unit Apartments | 795 | 4.5% |
| 3 or 4 Unit Apartments | 1,844 | 10.4% |
| 5 to 9 Unit Apartments | 585 | 3.3% |
| 10 or more Apartments | 1,138 | 6.4% |
| Mobile Home / Other | 1,416 | 8.0% |
| Total | 17,730 | 100.0% |
Housing Structures by Occupancy in Phelps County
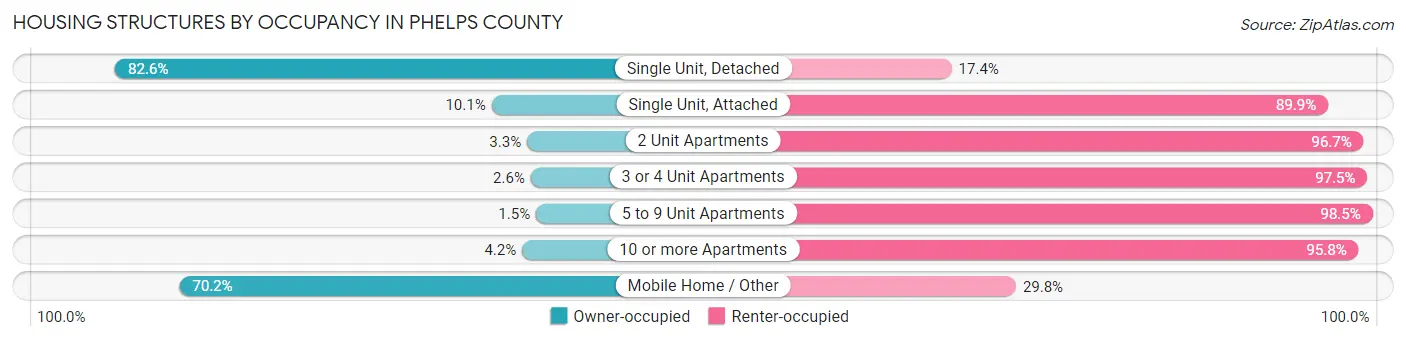
| Structure Type | Owner-occupied | Renter-occupied |
| Single Unit, Detached | 9,486 (82.6%) | 2,001 (17.4%) |
| Single Unit, Attached | 47 (10.1%) | 418 (89.9%) |
| 2 Unit Apartments | 26 (3.3%) | 769 (96.7%) |
| 3 or 4 Unit Apartments | 47 (2.5%) | 1,797 (97.5%) |
| 5 to 9 Unit Apartments | 9 (1.5%) | 576 (98.5%) |
| 10 or more Apartments | 48 (4.2%) | 1,090 (95.8%) |
| Mobile Home / Other | 994 (70.2%) | 422 (29.8%) |
| Total | 10,657 (60.1%) | 7,073 (39.9%) |
Housing Structures by Number of Rooms in Phelps County
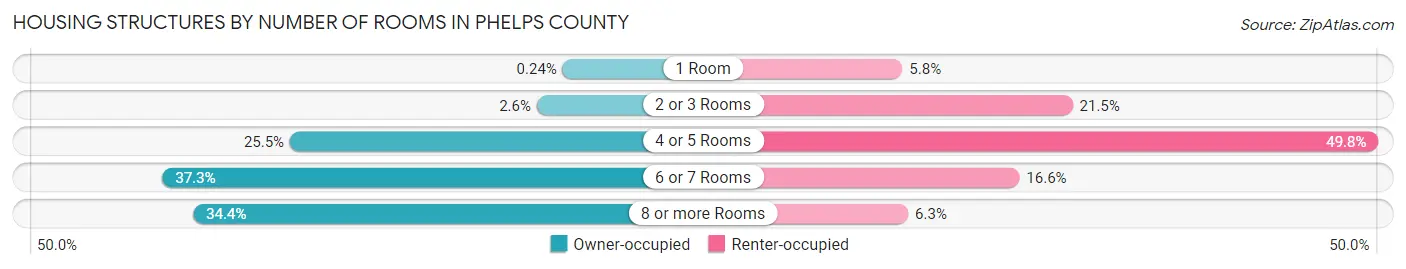
| Number of Rooms | Owner-occupied | Renter-occupied |
| 1 Room | 26 (0.2%) | 409 (5.8%) |
| 2 or 3 Rooms | 280 (2.6%) | 1,522 (21.5%) |
| 4 or 5 Rooms | 2,713 (25.5%) | 3,522 (49.8%) |
| 6 or 7 Rooms | 3,971 (37.3%) | 1,174 (16.6%) |
| 8 or more Rooms | 3,667 (34.4%) | 446 (6.3%) |
| Total | 10,657 (100.0%) | 7,073 (100.0%) |
Housing Structure by Heating Type in Phelps County
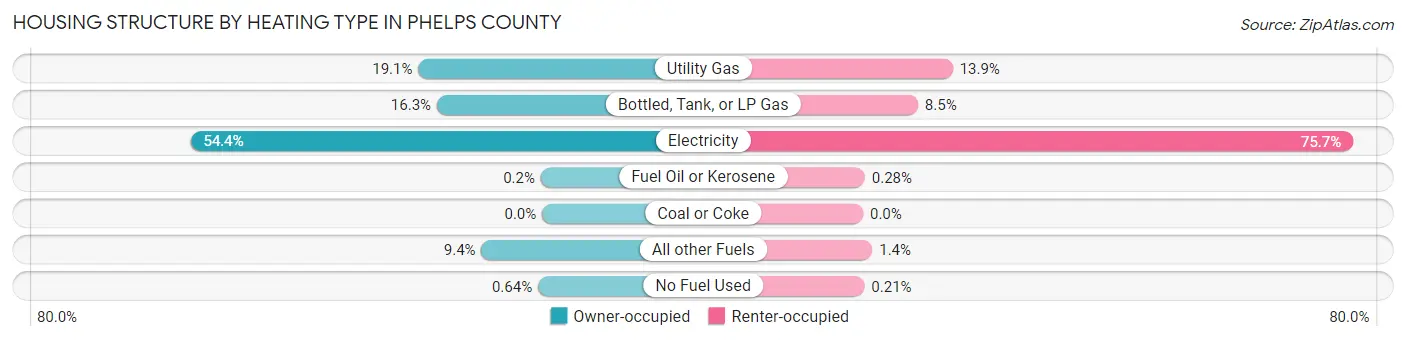
| Heating Type | Owner-occupied | Renter-occupied |
| Utility Gas | 2,040 (19.1%) | 980 (13.9%) |
| Bottled, Tank, or LP Gas | 1,733 (16.3%) | 600 (8.5%) |
| Electricity | 5,795 (54.4%) | 5,357 (75.7%) |
| Fuel Oil or Kerosene | 21 (0.2%) | 20 (0.3%) |
| Coal or Coke | 0 (0.0%) | 0 (0.0%) |
| All other Fuels | 1,000 (9.4%) | 101 (1.4%) |
| No Fuel Used | 68 (0.6%) | 15 (0.2%) |
| Total | 10,657 (100.0%) | 7,073 (100.0%) |
Household Vehicle Usage in Phelps County
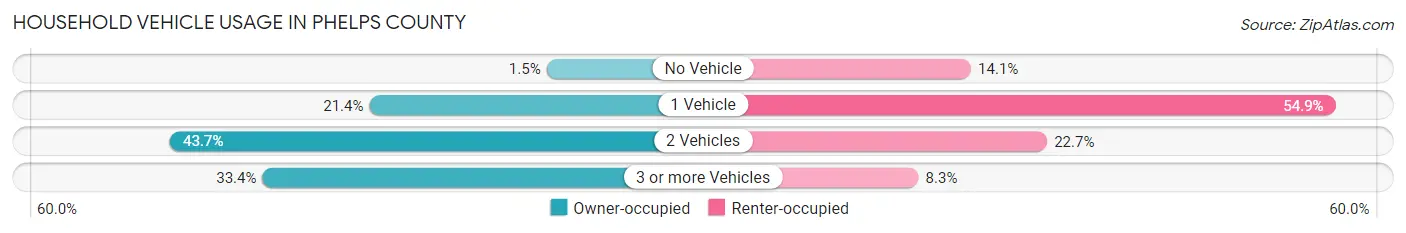
| Vehicles per Household | Owner-occupied | Renter-occupied |
| No Vehicle | 164 (1.5%) | 1,000 (14.1%) |
| 1 Vehicle | 2,280 (21.4%) | 3,886 (54.9%) |
| 2 Vehicles | 4,657 (43.7%) | 1,603 (22.7%) |
| 3 or more Vehicles | 3,556 (33.4%) | 584 (8.3%) |
| Total | 10,657 (100.0%) | 7,073 (100.0%) |
Real Estate & Mortgages in Phelps County
Real Estate and Mortgage Overview in Phelps County
| Characteristic | Without Mortgage | With Mortgage |
| Housing Units | 5,121 | 5,536 |
| Median Property Value | $145,000 | $197,700 |
| Median Household Income | $60,028 | $942 |
| Monthly Housing Costs | $418 | $235 |
| Real Estate Taxes | $1,035 | $103 |
Property Value by Mortgage Status in Phelps County
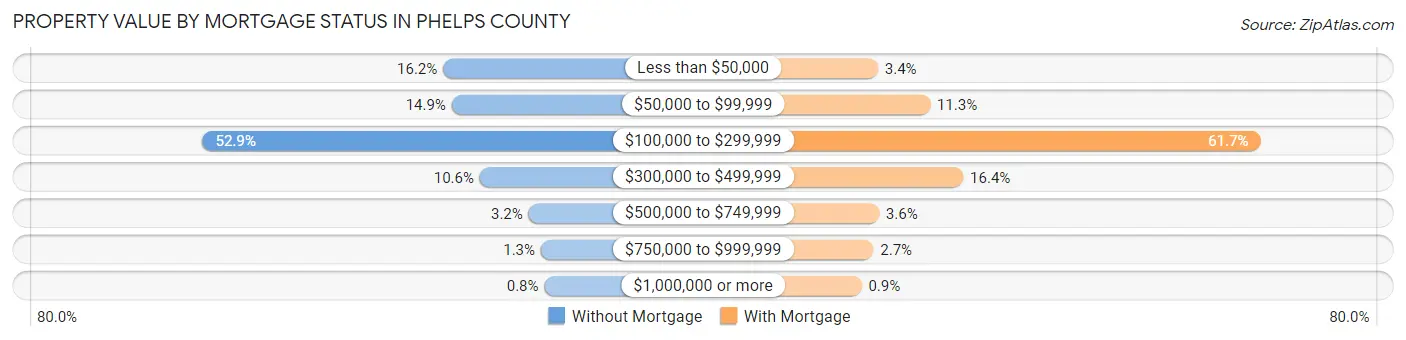
| Property Value | Without Mortgage | With Mortgage |
| Less than $50,000 | 831 (16.2%) | 188 (3.4%) |
| $50,000 to $99,999 | 764 (14.9%) | 628 (11.3%) |
| $100,000 to $299,999 | 2,708 (52.9%) | 3,415 (61.7%) |
| $300,000 to $499,999 | 545 (10.6%) | 908 (16.4%) |
| $500,000 to $749,999 | 164 (3.2%) | 197 (3.6%) |
| $750,000 to $999,999 | 68 (1.3%) | 150 (2.7%) |
| $1,000,000 or more | 41 (0.8%) | 50 (0.9%) |
| Total | 5,121 (100.0%) | 5,536 (100.0%) |
Household Income by Mortgage Status in Phelps County
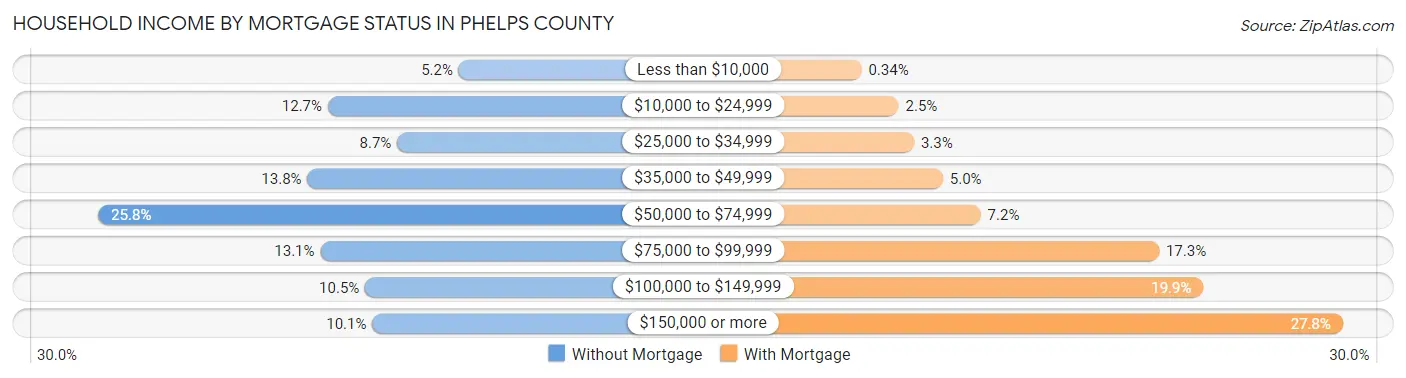
| Household Income | Without Mortgage | With Mortgage |
| Less than $10,000 | 266 (5.2%) | 19 (0.3%) |
| $10,000 to $24,999 | 649 (12.7%) | 136 (2.5%) |
| $25,000 to $34,999 | 446 (8.7%) | 185 (3.3%) |
| $35,000 to $49,999 | 709 (13.8%) | 276 (5.0%) |
| $50,000 to $74,999 | 1,321 (25.8%) | 396 (7.1%) |
| $75,000 to $99,999 | 671 (13.1%) | 960 (17.3%) |
| $100,000 to $149,999 | 540 (10.5%) | 1,100 (19.9%) |
| $150,000 or more | 519 (10.1%) | 1,541 (27.8%) |
| Total | 5,121 (100.0%) | 5,536 (100.0%) |
Property Value to Household Income Ratio in Phelps County
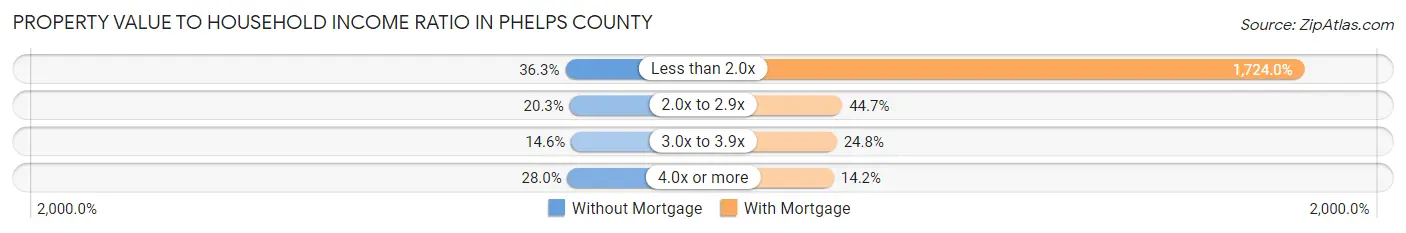
| Value-to-Income Ratio | Without Mortgage | With Mortgage |
| Less than 2.0x | 1,858 (36.3%) | 95,441 (1,724.0%) |
| 2.0x to 2.9x | 1,041 (20.3%) | 2,473 (44.7%) |
| 3.0x to 3.9x | 745 (14.5%) | 1,370 (24.7%) |
| 4.0x or more | 1,432 (28.0%) | 787 (14.2%) |
| Total | 5,121 (100.0%) | 5,536 (100.0%) |
Real Estate Taxes by Mortgage Status in Phelps County
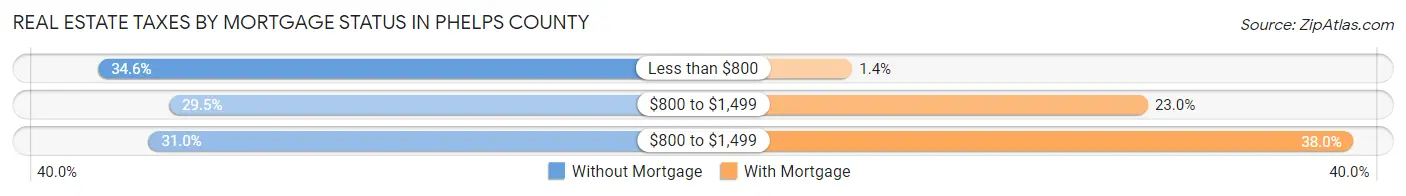
| Property Taxes | Without Mortgage | With Mortgage |
| Less than $800 | 1,773 (34.6%) | 78 (1.4%) |
| $800 to $1,499 | 1,508 (29.4%) | 1,274 (23.0%) |
| $800 to $1,499 | 1,585 (30.9%) | 2,105 (38.0%) |
| Total | 5,121 (100.0%) | 5,536 (100.0%) |
Health & Disability in Phelps County
Health Insurance Coverage by Age in Phelps County
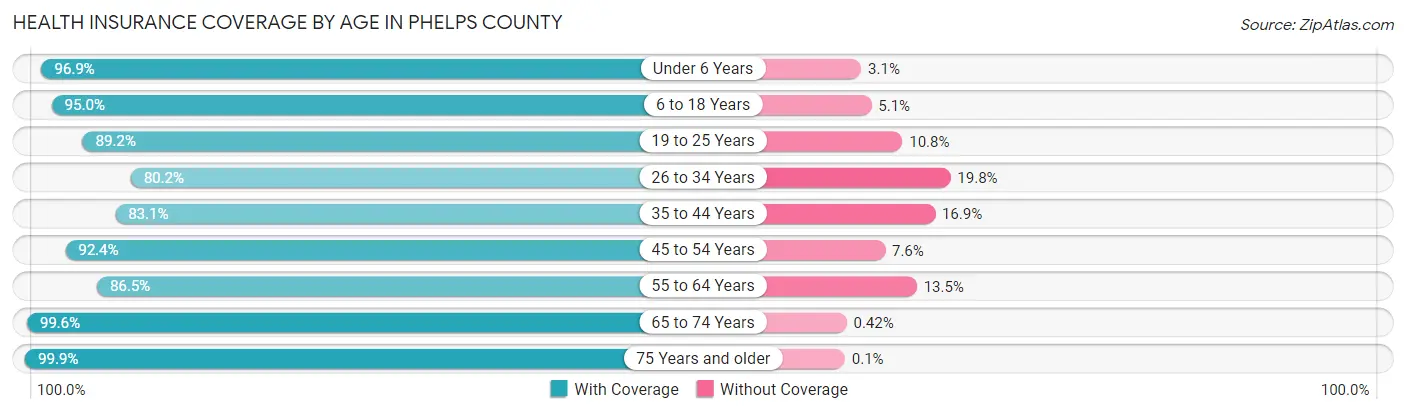
| Age Bracket | With Coverage | Without Coverage |
| Under 6 Years | 2,773 (96.9%) | 90 (3.1%) |
| 6 to 18 Years | 7,237 (95.0%) | 385 (5.1%) |
| 19 to 25 Years | 5,866 (89.2%) | 712 (10.8%) |
| 26 to 34 Years | 3,794 (80.2%) | 936 (19.8%) |
| 35 to 44 Years | 4,137 (83.1%) | 842 (16.9%) |
| 45 to 54 Years | 4,351 (92.4%) | 358 (7.6%) |
| 55 to 64 Years | 4,858 (86.5%) | 758 (13.5%) |
| 65 to 74 Years | 4,030 (99.6%) | 17 (0.4%) |
| 75 Years and older | 3,007 (99.9%) | 3 (0.1%) |
| Total | 40,053 (90.7%) | 4,101 (9.3%) |
Health Insurance Coverage by Citizenship Status in Phelps County
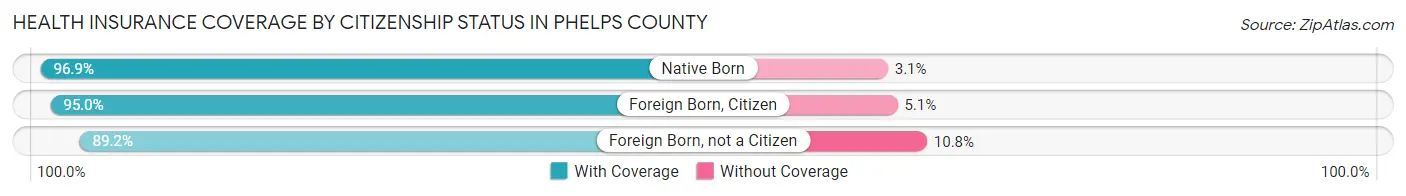
| Citizenship Status | With Coverage | Without Coverage |
| Native Born | 2,773 (96.9%) | 90 (3.1%) |
| Foreign Born, Citizen | 7,237 (95.0%) | 385 (5.1%) |
| Foreign Born, not a Citizen | 5,866 (89.2%) | 712 (10.8%) |
Health Insurance Coverage by Household Income in Phelps County
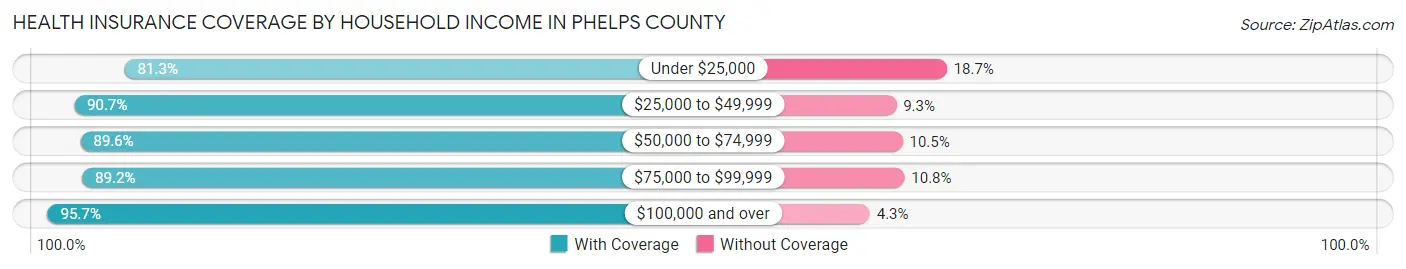
| Household Income | With Coverage | Without Coverage |
| Under $25,000 | 5,787 (81.3%) | 1,333 (18.7%) |
| $25,000 to $49,999 | 7,093 (90.7%) | 724 (9.3%) |
| $50,000 to $74,999 | 6,925 (89.5%) | 808 (10.4%) |
| $75,000 to $99,999 | 5,616 (89.2%) | 679 (10.8%) |
| $100,000 and over | 12,131 (95.7%) | 547 (4.3%) |
Public vs Private Health Insurance Coverage by Age in Phelps County
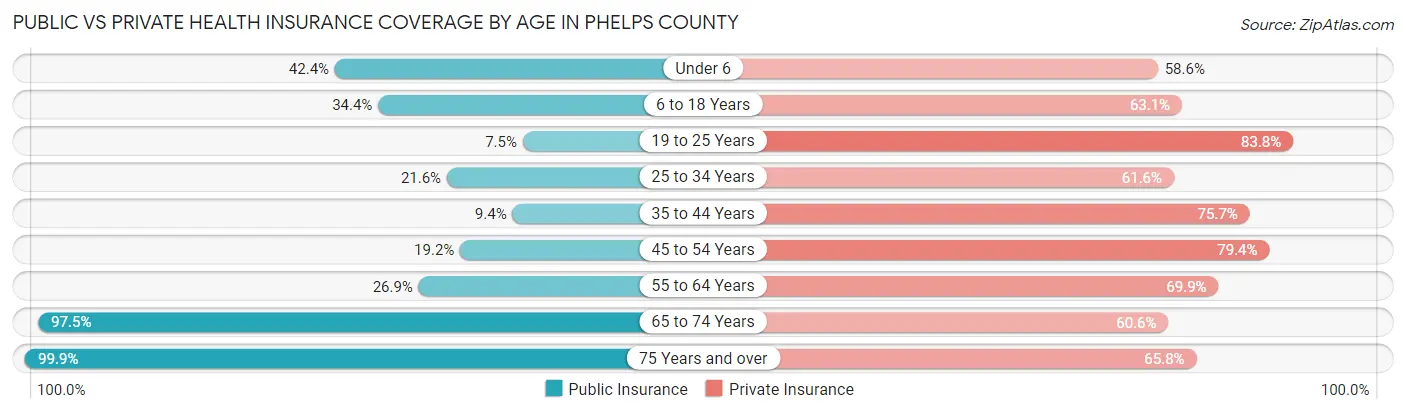
| Age Bracket | Public Insurance | Private Insurance |
| Under 6 | 1,214 (42.4%) | 1,679 (58.6%) |
| 6 to 18 Years | 2,620 (34.4%) | 4,812 (63.1%) |
| 19 to 25 Years | 495 (7.5%) | 5,510 (83.8%) |
| 25 to 34 Years | 1,022 (21.6%) | 2,915 (61.6%) |
| 35 to 44 Years | 470 (9.4%) | 3,769 (75.7%) |
| 45 to 54 Years | 902 (19.2%) | 3,737 (79.4%) |
| 55 to 64 Years | 1,508 (26.9%) | 3,926 (69.9%) |
| 65 to 74 Years | 3,946 (97.5%) | 2,452 (60.6%) |
| 75 Years and over | 3,007 (99.9%) | 1,981 (65.8%) |
| Total | 15,184 (34.4%) | 30,781 (69.7%) |
Disability Status by Sex by Age in Phelps County
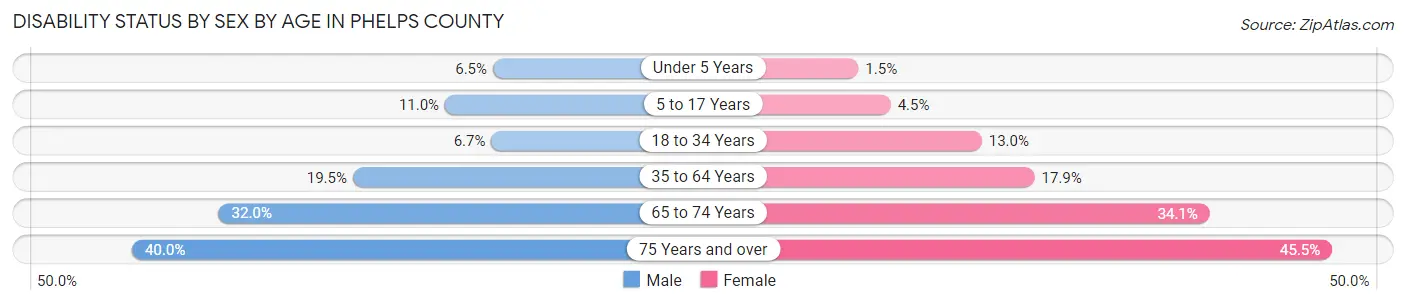
| Age Bracket | Male | Female |
| Under 5 Years | 78 (6.5%) | 18 (1.5%) |
| 5 to 17 Years | 398 (11.0%) | 153 (4.5%) |
| 18 to 34 Years | 497 (6.7%) | 651 (13.0%) |
| 35 to 64 Years | 1,488 (19.5%) | 1,375 (17.9%) |
| 65 to 74 Years | 637 (32.0%) | 702 (34.1%) |
| 75 Years and over | 524 (40.0%) | 774 (45.5%) |
Disability Class by Sex by Age in Phelps County
Disability Class: Hearing Difficulty
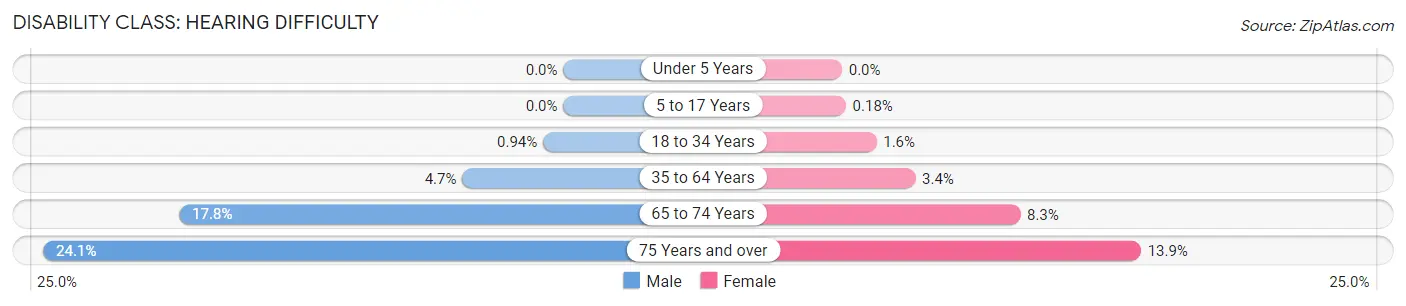
| Age Bracket | Male | Female |
| Under 5 Years | 0 (0.0%) | 0 (0.0%) |
| 5 to 17 Years | 0 (0.0%) | 6 (0.2%) |
| 18 to 34 Years | 70 (0.9%) | 80 (1.6%) |
| 35 to 64 Years | 357 (4.7%) | 261 (3.4%) |
| 65 to 74 Years | 355 (17.8%) | 170 (8.3%) |
| 75 Years and over | 316 (24.1%) | 236 (13.9%) |
Disability Class: Vision Difficulty
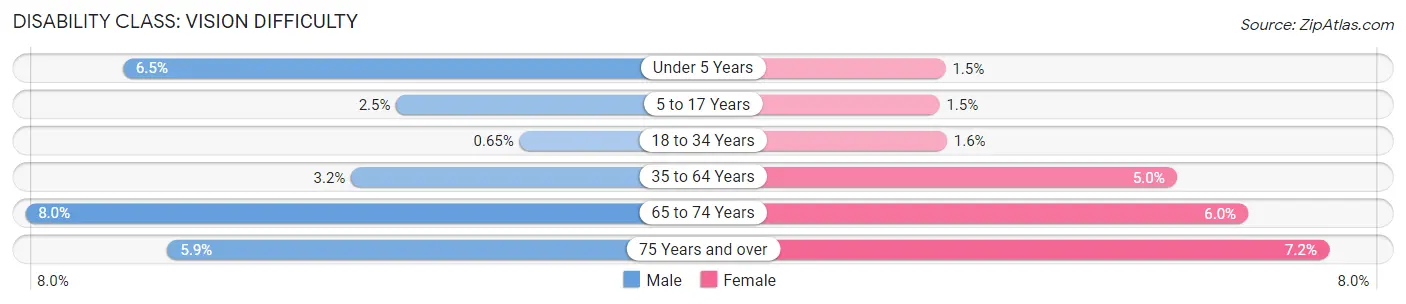
| Age Bracket | Male | Female |
| Under 5 Years | 78 (6.5%) | 18 (1.5%) |
| 5 to 17 Years | 90 (2.5%) | 49 (1.5%) |
| 18 to 34 Years | 48 (0.6%) | 78 (1.6%) |
| 35 to 64 Years | 240 (3.2%) | 382 (5.0%) |
| 65 to 74 Years | 159 (8.0%) | 124 (6.0%) |
| 75 Years and over | 77 (5.9%) | 123 (7.2%) |
Disability Class: Cognitive Difficulty
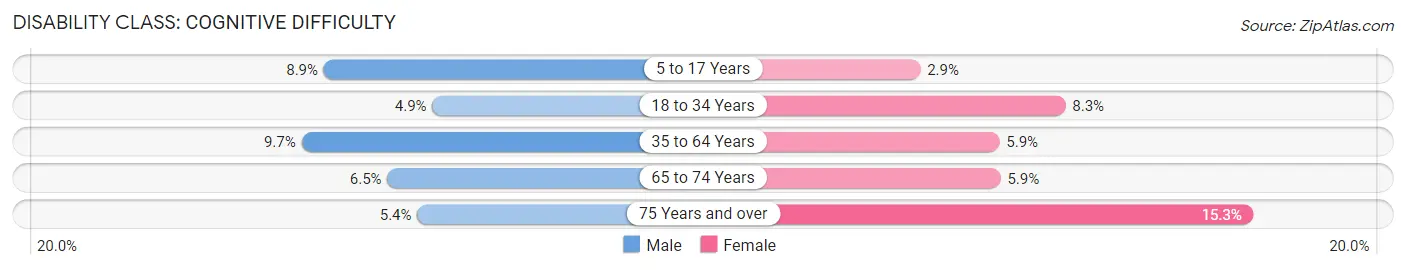
| Age Bracket | Male | Female |
| 5 to 17 Years | 322 (8.9%) | 98 (2.9%) |
| 18 to 34 Years | 361 (4.9%) | 416 (8.3%) |
| 35 to 64 Years | 740 (9.7%) | 450 (5.9%) |
| 65 to 74 Years | 130 (6.5%) | 121 (5.9%) |
| 75 Years and over | 71 (5.4%) | 260 (15.3%) |
Disability Class: Ambulatory Difficulty
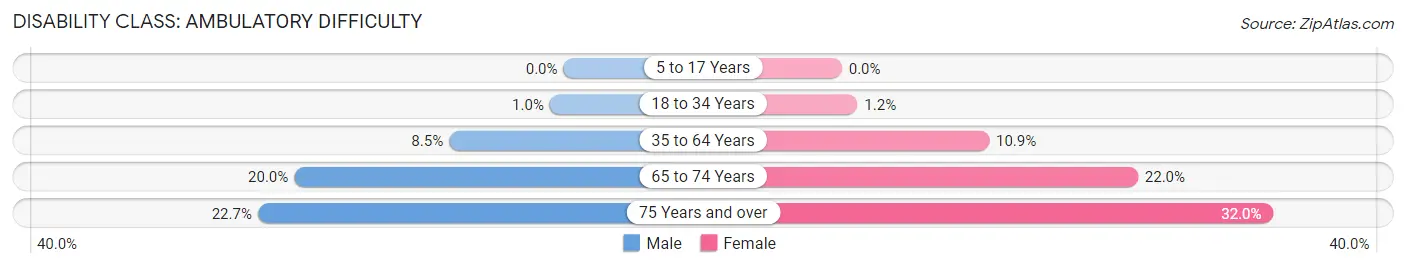
| Age Bracket | Male | Female |
| 5 to 17 Years | 0 (0.0%) | 0 (0.0%) |
| 18 to 34 Years | 75 (1.0%) | 58 (1.2%) |
| 35 to 64 Years | 647 (8.5%) | 840 (10.9%) |
| 65 to 74 Years | 398 (20.0%) | 452 (22.0%) |
| 75 Years and over | 297 (22.7%) | 545 (32.0%) |
Disability Class: Self-Care Difficulty
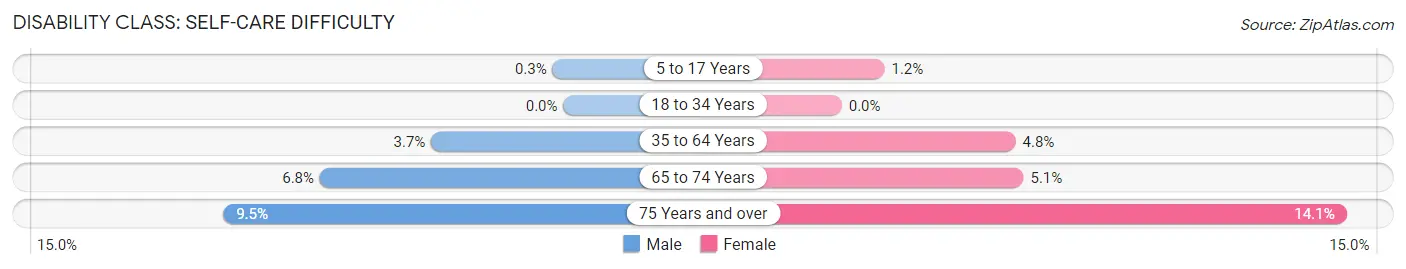
| Age Bracket | Male | Female |
| 5 to 17 Years | 11 (0.3%) | 40 (1.2%) |
| 18 to 34 Years | 0 (0.0%) | 0 (0.0%) |
| 35 to 64 Years | 280 (3.7%) | 372 (4.8%) |
| 65 to 74 Years | 135 (6.8%) | 104 (5.1%) |
| 75 Years and over | 124 (9.5%) | 239 (14.1%) |
Technology Access in Phelps County
Computing Device Access in Phelps County
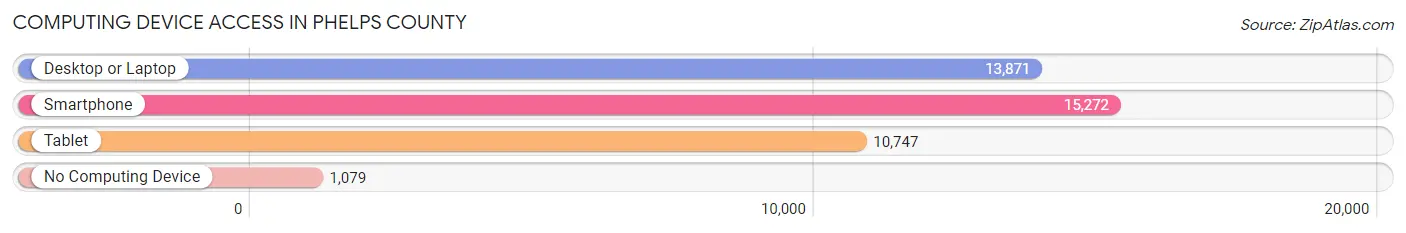
| Device Type | # Households | % Households |
| Desktop or Laptop | 13,871 | 78.2% |
| Smartphone | 15,272 | 86.1% |
| Tablet | 10,747 | 60.6% |
| No Computing Device | 1,079 | 6.1% |
| Total | 17,730 | 100.0% |
Internet Access in Phelps County
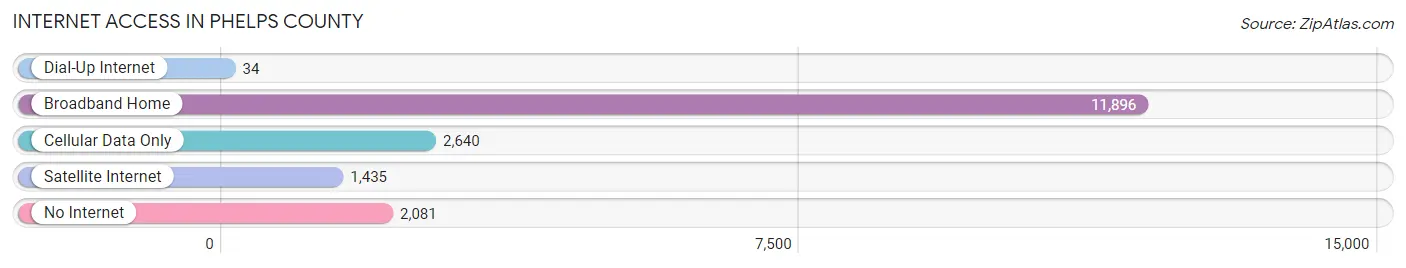
| Internet Type | # Households | % Households |
| Dial-Up Internet | 34 | 0.2% |
| Broadband Home | 11,896 | 67.1% |
| Cellular Data Only | 2,640 | 14.9% |
| Satellite Internet | 1,435 | 8.1% |
| No Internet | 2,081 | 11.7% |
| Total | 17,730 | 100.0% |
Phelps County Summary
Phelps County, Missouri is located in the south-central part of the state, and is bordered by Maries County to the north, Pulaski County to the east, Texas County to the south, and Dent County to the west. The county seat is Rolla, which is also the largest city in the county. The county was established in 1857 and is named after John S. Phelps, the 14th Governor of Missouri.
History
The area that is now Phelps County was originally inhabited by the Osage Native American tribe. The first European settlers arrived in the area in the early 1800s, and the county was officially established in 1857. The county was named after John S. Phelps, the 14th Governor of Missouri.
During the Civil War, Phelps County was a major battleground. The Battle of Fort Davidson, also known as the Battle of Pilot Knob, was fought in the county in 1864. The Union forces were victorious, and the fort was destroyed.
In the late 1800s, Phelps County experienced a period of rapid growth and development. The St. Louis and San Francisco Railway, also known as the Frisco, was built through the county in 1881, connecting Rolla to St. Louis. This allowed for the development of the county’s coal and timber industries, as well as the growth of the county’s population.
Geography
Phelps County is located in the south-central part of Missouri, and is bordered by Maries County to the north, Pulaski County to the east, Texas County to the south, and Dent County to the west. The county covers an area of 576 square miles, and is home to numerous rivers, creeks, and lakes. The Big Piney River, the Little Piney River, and the Gasconade River all flow through the county.
The county is mostly rural, with the majority of the land being used for agricultural purposes. The county is home to several state parks, including the Mark Twain National Forest, the Ozark National Scenic Riverways, and the Meramec State Park.
Economy
The economy of Phelps County is largely based on agriculture and manufacturing. The county is home to numerous farms, which produce a variety of crops, including corn, soybeans, wheat, and hay. The county is also home to several manufacturing companies, which produce a variety of products, including furniture, clothing, and automotive parts.
The county is also home to several universities and colleges, including Missouri University of Science and Technology, Rolla Technical Institute, and Ozarks Technical Community College. These institutions provide a variety of educational opportunities for students, as well as employment opportunities for faculty and staff.
Demographics
As of the 2010 census, Phelps County had a population of 45,156. The population is spread out, with the largest city being Rolla, which has a population of 19,559. The racial makeup of the county is 92.3% White, 4.2% African American, 0.7% Native American, 0.7% Asian, 0.2% Pacific Islander, and 1.1% from other races.
The median household income in Phelps County is $41,945, and the median family income is $50,945. The per capita income is $21,945. The unemployment rate in the county is 4.2%.
Phelps County is a rural county with a rich history and a diverse economy. The county is home to numerous farms, manufacturing companies, and educational institutions, which provide employment opportunities for its residents. The county is also home to several state parks, which provide recreational opportunities for visitors and residents alike.
Common Questions
What is Per Capita Income in Phelps County?
Per Capita income in Phelps County is $28,335.
What is the Median Family Income in Phelps County?
Median Family Income in Phelps County is $69,375.
What is the Median Household income in Phelps County?
Median Household Income in Phelps County is $53,242.
What is Income or Wage Gap in Phelps County?
Income or Wage Gap in Phelps County is 15.2%.
Women in Phelps County earn 84.8 cents for every dollar earned by a man.
What is Family Income Deficit in Phelps County?
Family Income Deficit in Phelps County is $10,822.
Families that are below poverty line in Phelps County earn $10,822 less on average than the poverty threshold level.
What is Inequality or Gini Index in Phelps County?
Inequality or Gini Index in Phelps County is 0.47.
What is the Total Population of Phelps County?
Total Population of Phelps County is 44,843.
What is the Total Male Population of Phelps County?
Total Male Population of Phelps County is 23,629.
What is the Total Female Population of Phelps County?
Total Female Population of Phelps County is 21,214.
What is the Ratio of Males per 100 Females in Phelps County?
There are 111.38 Males per 100 Females in Phelps County.
What is the Ratio of Females per 100 Males in Phelps County?
There are 89.78 Females per 100 Males in Phelps County.
What is the Median Population Age in Phelps County?
Median Population Age in Phelps County is 36.0 Years.
What is the Average Family Size in Phelps County
Average Family Size in Phelps County is 2.9 People.
What is the Average Household Size in Phelps County
Average Household Size in Phelps County is 2.4 People.
How Large is the Labor Force in Phelps County?
There are 19,956 People in the Labor Forcein in Phelps County.
What is the Percentage of People in the Labor Force in Phelps County?
54.7% of People are in the Labor Force in Phelps County.
What is the Unemployment Rate in Phelps County?
Unemployment Rate in Phelps County is 4.2%.