Perry County, MO Map & Demographics
Perry County Map
Perry County Overview
$30,731
PER CAPITA INCOME
$78,134
AVG FAMILY INCOME
$61,486
AVG HOUSEHOLD INCOME
22.7%
WAGE / INCOME GAP [ % ]
77.3¢/ $1
WAGE / INCOME GAP [ $ ]
$10,983
FAMILY INCOME DEFICIT
0.42
INEQUALITY / GINI INDEX
18,970
TOTAL POPULATION
9,415
MALE POPULATION
9,555
FEMALE POPULATION
98.53
MALES / 100 FEMALES
101.49
FEMALES / 100 MALES
41.4
MEDIAN AGE
3.1
AVG FAMILY SIZE
2.5
AVG HOUSEHOLD SIZE
9,608
LABOR FORCE [ PEOPLE ]
63.2%
PERCENT IN LABOR FORCE
5.1%
UNEMPLOYMENT RATE
Perry County Area Codes
Income in Perry County
Income Overview in Perry County
Per Capita Income in Perry County is $30,731, while median incomes of families and households are $78,134 and $61,486 respectively.
| Characteristic | Number | Measure |
| Per Capita Income | 18,970 | $30,731 |
| Median Family Income | 4,875 | $78,134 |
| Mean Family Income | 4,875 | $90,746 |
| Median Household Income | 7,329 | $61,486 |
| Mean Household Income | 7,329 | $77,309 |
| Income Deficit | 4,875 | $10,983 |
| Wage / Income Gap (%) | 18,970 | 22.71% |
| Wage / Income Gap ($) | 18,970 | 77.29¢ per $1 |
| Gini / Inequality Index | 18,970 | 0.42 |
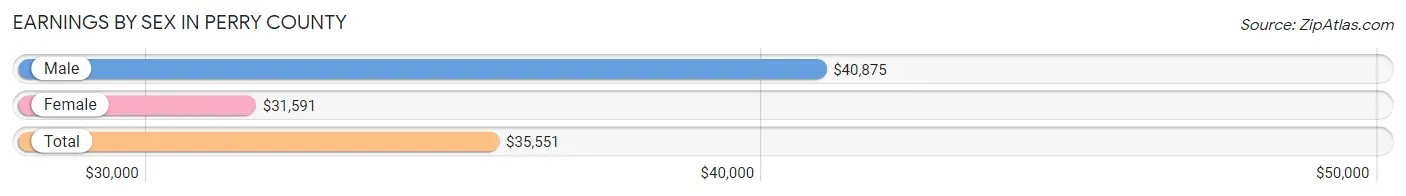
Earnings by Sex in Perry County
Average Earnings in Perry County are $35,551, $40,875 for men and $31,591 for women, a difference of 22.7%.
| Sex | Number | Average Earnings |
| Male | 5,217 (52.5%) | $40,875 |
| Female | 4,716 (47.5%) | $31,591 |
| Total | 9,933 (100.0%) | $35,551 |
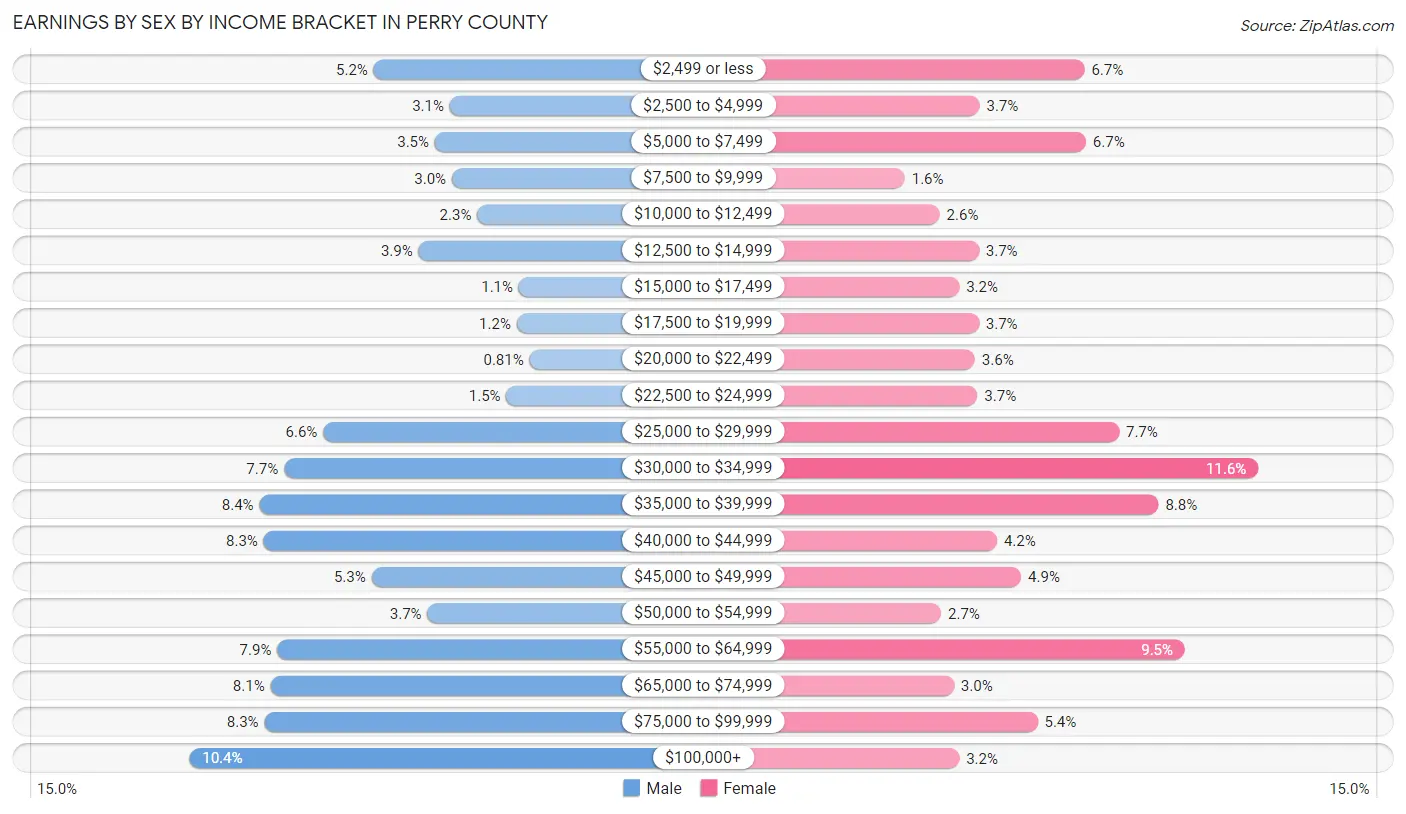
Earnings by Sex by Income Bracket in Perry County
The most common earnings brackets in Perry County are $100,000+ for men (541 | 10.4%) and $30,000 to $34,999 for women (545 | 11.6%).
| Income | Male | Female |
| $2,499 or less | 271 (5.2%) | 315 (6.7%) |
| $2,500 to $4,999 | 159 (3.0%) | 176 (3.7%) |
| $5,000 to $7,499 | 181 (3.5%) | 317 (6.7%) |
| $7,500 to $9,999 | 156 (3.0%) | 77 (1.6%) |
| $10,000 to $12,499 | 119 (2.3%) | 123 (2.6%) |
| $12,500 to $14,999 | 205 (3.9%) | 175 (3.7%) |
| $15,000 to $17,499 | 58 (1.1%) | 149 (3.2%) |
| $17,500 to $19,999 | 61 (1.2%) | 175 (3.7%) |
| $20,000 to $22,499 | 42 (0.8%) | 170 (3.6%) |
| $22,500 to $24,999 | 76 (1.5%) | 173 (3.7%) |
| $25,000 to $29,999 | 345 (6.6%) | 361 (7.6%) |
| $30,000 to $34,999 | 402 (7.7%) | 545 (11.6%) |
| $35,000 to $39,999 | 438 (8.4%) | 413 (8.8%) |
| $40,000 to $44,999 | 432 (8.3%) | 199 (4.2%) |
| $45,000 to $49,999 | 274 (5.2%) | 231 (4.9%) |
| $50,000 to $54,999 | 192 (3.7%) | 125 (2.6%) |
| $55,000 to $64,999 | 412 (7.9%) | 448 (9.5%) |
| $65,000 to $74,999 | 422 (8.1%) | 142 (3.0%) |
| $75,000 to $99,999 | 431 (8.3%) | 253 (5.4%) |
| $100,000+ | 541 (10.4%) | 149 (3.2%) |
| Total | 5,217 (100.0%) | 4,716 (100.0%) |
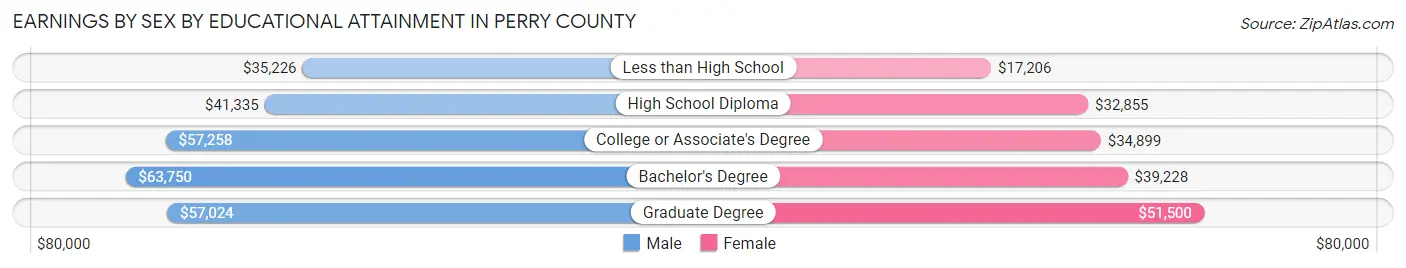
Earnings by Sex by Educational Attainment in Perry County
Average earnings in Perry County are $44,464 for men and $34,600 for women, a difference of 22.2%. Men with an educational attainment of bachelor's degree enjoy the highest average annual earnings of $63,750, while those with less than high school education earn the least with $35,226. Women with an educational attainment of graduate degree earn the most with the average annual earnings of $51,500, while those with less than high school education have the smallest earnings of $17,206.
| Educational Attainment | Male Income | Female Income |
| Less than High School | $35,226 | $17,206 |
| High School Diploma | $41,335 | $32,855 |
| College or Associate's Degree | $57,258 | $34,899 |
| Bachelor's Degree | $63,750 | $39,228 |
| Graduate Degree | $57,024 | $51,500 |
| Total | $44,464 | $34,600 |
Family Income in Perry County
Family Income Brackets in Perry County
According to the Perry County family income data, there are 1,019 families falling into the $100,000 to $149,999 income range, which is the most common income bracket and makes up 20.9% of all families. Conversely, the $10,000 to $14,999 income bracket is the least frequent group with only 44 families (0.9%) belonging to this category.
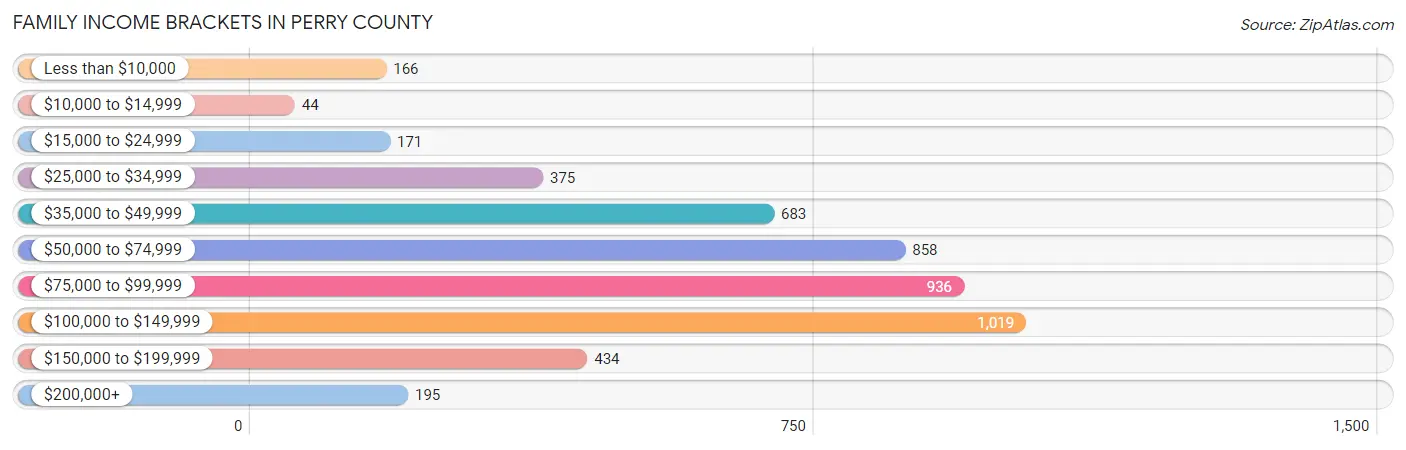
| Income Bracket | # Families | % Families |
| Less than $10,000 | 166 | 3.4% |
| $10,000 to $14,999 | 44 | 0.9% |
| $15,000 to $24,999 | 171 | 3.5% |
| $25,000 to $34,999 | 375 | 7.7% |
| $35,000 to $49,999 | 683 | 14.0% |
| $50,000 to $74,999 | 858 | 17.6% |
| $75,000 to $99,999 | 936 | 19.2% |
| $100,000 to $149,999 | 1,019 | 20.9% |
| $150,000 to $199,999 | 434 | 8.9% |
| $200,000+ | 195 | 4.0% |
Family Income by Famaliy Size in Perry County
5-person families (419 | 8.6%) account for the highest median family income in Perry County with $101,250 per family, while 3-person families (1,085 | 22.3%) have the highest median income of $32,366 per family member.
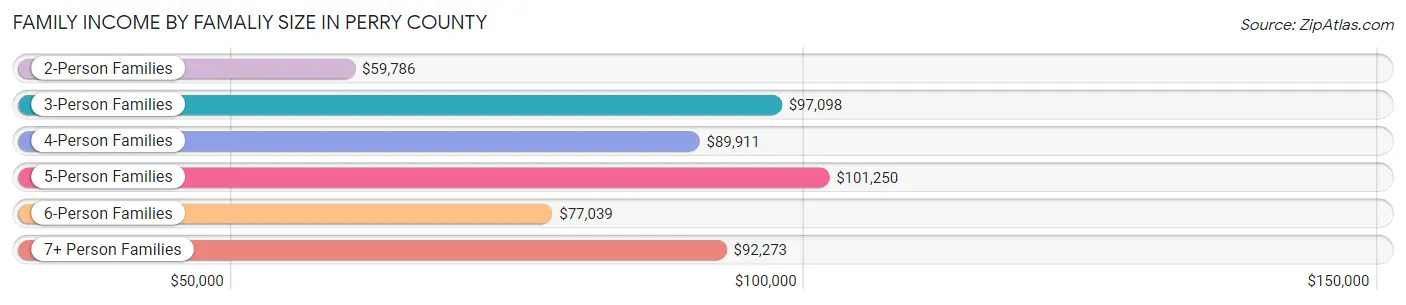
| Income Bracket | # Families | Median Income |
| 2-Person Families | 2,437 (50.0%) | $59,786 |
| 3-Person Families | 1,085 (22.3%) | $97,098 |
| 4-Person Families | 779 (16.0%) | $89,911 |
| 5-Person Families | 419 (8.6%) | $101,250 |
| 6-Person Families | 101 (2.1%) | $77,039 |
| 7+ Person Families | 54 (1.1%) | $92,273 |
| Total | 4,875 (100.0%) | $78,134 |
Family Income by Number of Earners in Perry County
The median family income in Perry County is $78,134, with families comprising 3+ earners (564) having the highest median family income of $115,000, while families with 1 earner (1,214) have the lowest median family income of $48,168, accounting for 11.6% and 24.9% of families, respectively.
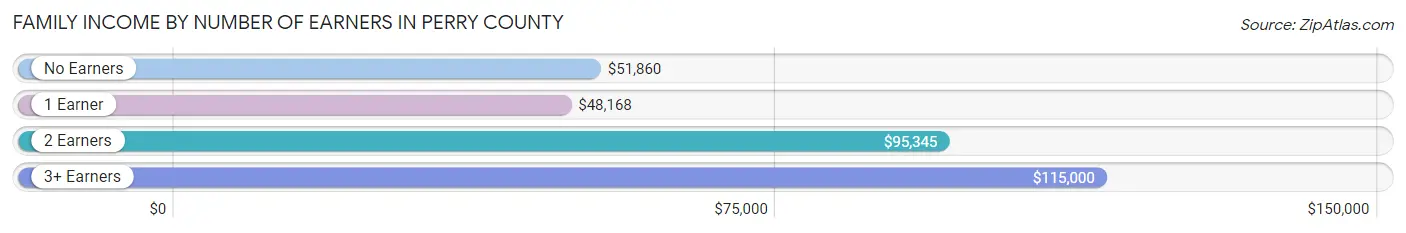
| Number of Earners | # Families | Median Income |
| No Earners | 831 (17.1%) | $51,860 |
| 1 Earner | 1,214 (24.9%) | $48,168 |
| 2 Earners | 2,266 (46.5%) | $95,345 |
| 3+ Earners | 564 (11.6%) | $115,000 |
| Total | 4,875 (100.0%) | $78,134 |
Household Income in Perry County
Household Income Brackets in Perry County
With 1,444 households falling in the category, the $50,000 to $74,999 income range is the most frequent in Perry County, accounting for 19.7% of all households. In contrast, only 264 households (3.6%) fall into the $200,000+ income bracket, making it the least populous group.
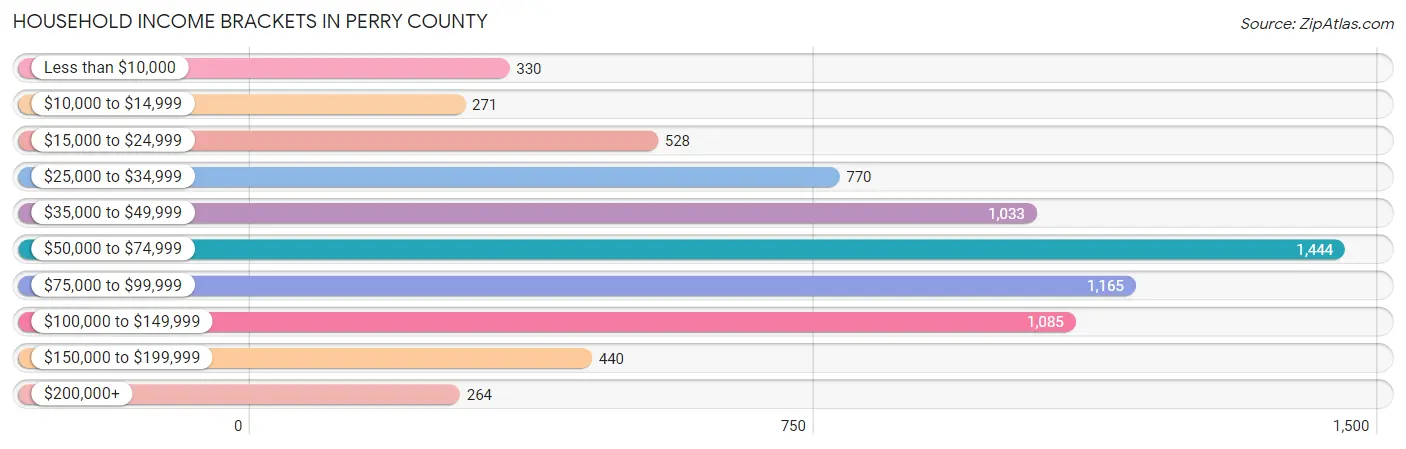
| Income Bracket | # Households | % Households |
| Less than $10,000 | 330 | 4.5% |
| $10,000 to $14,999 | 271 | 3.7% |
| $15,000 to $24,999 | 528 | 7.2% |
| $25,000 to $34,999 | 770 | 10.5% |
| $35,000 to $49,999 | 1,033 | 14.1% |
| $50,000 to $74,999 | 1,444 | 19.7% |
| $75,000 to $99,999 | 1,165 | 15.9% |
| $100,000 to $149,999 | 1,085 | 14.8% |
| $150,000 to $199,999 | 440 | 6.0% |
| $200,000+ | 264 | 3.6% |
Household Income by Householder Age in Perry County
The median household income in Perry County is $61,486, with the highest median household income of $74,448 found in the 25 to 44 years age bracket for the primary householder. A total of 1,985 households (27.1%) fall into this category. Meanwhile, the 15 to 24 years age bracket for the primary householder has the lowest median household income of $43,750, with 232 households (3.2%) in this group.
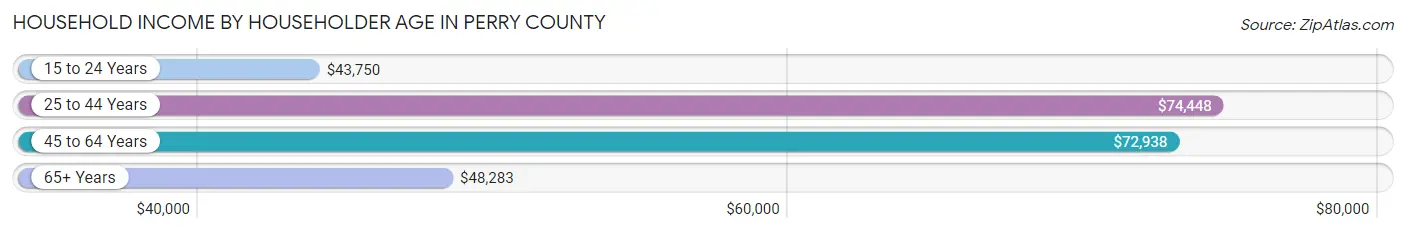
| Income Bracket | # Households | Median Income |
| 15 to 24 Years | 232 (3.2%) | $43,750 |
| 25 to 44 Years | 1,985 (27.1%) | $74,448 |
| 45 to 64 Years | 2,879 (39.3%) | $72,938 |
| 65+ Years | 2,233 (30.5%) | $48,283 |
| Total | 7,329 (100.0%) | $61,486 |
Poverty in Perry County
Income Below Poverty by Sex and Age in Perry County
With 10.5% poverty level for males and 12.2% for females among the residents of Perry County, 15 year old males and 5 year old females are the most vulnerable to poverty, with 55 males (34.2%) and 50 females (35.5%) in their respective age groups living below the poverty level.
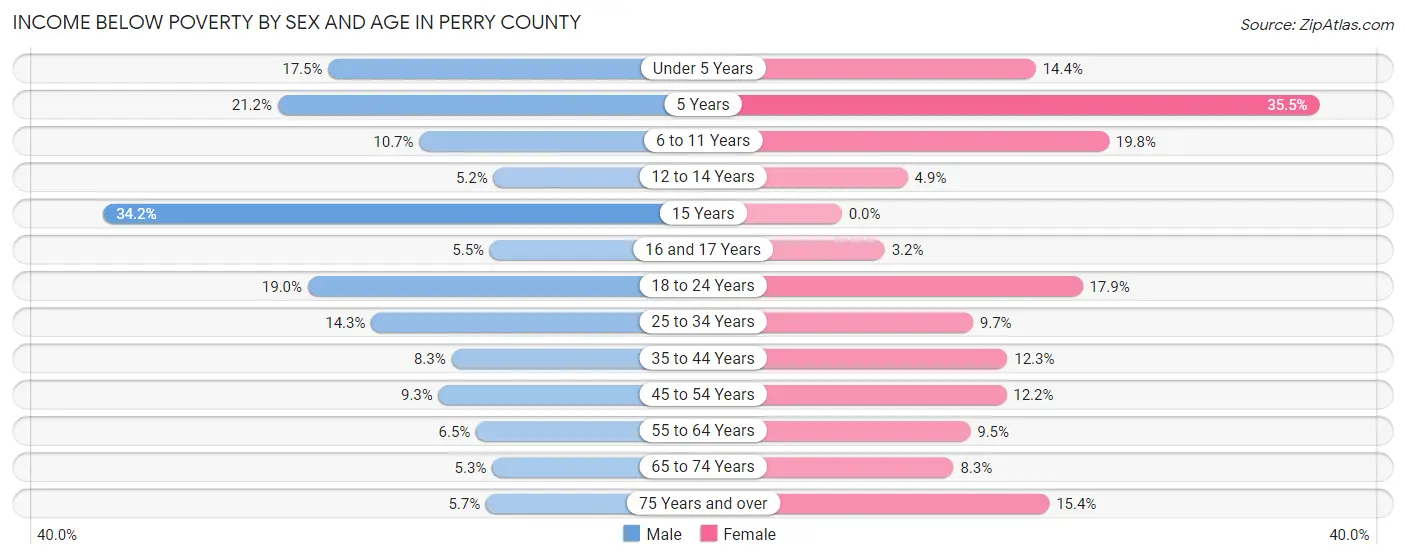
| Age Bracket | Male | Female |
| Under 5 Years | 93 (17.4%) | 70 (14.4%) |
| 5 Years | 39 (21.2%) | 50 (35.5%) |
| 6 to 11 Years | 77 (10.7%) | 137 (19.8%) |
| 12 to 14 Years | 16 (5.2%) | 18 (4.9%) |
| 15 Years | 55 (34.2%) | 0 (0.0%) |
| 16 and 17 Years | 15 (5.4%) | 10 (3.2%) |
| 18 to 24 Years | 140 (19.0%) | 139 (17.9%) |
| 25 to 34 Years | 157 (14.3%) | 101 (9.7%) |
| 35 to 44 Years | 95 (8.3%) | 138 (12.3%) |
| 45 to 54 Years | 112 (9.3%) | 147 (12.2%) |
| 55 to 64 Years | 85 (6.5%) | 125 (9.5%) |
| 65 to 74 Years | 52 (5.3%) | 85 (8.3%) |
| 75 Years and over | 35 (5.7%) | 118 (15.4%) |
| Total | 971 (10.5%) | 1,138 (12.2%) |
Income Above Poverty by Sex and Age in Perry County
According to the poverty statistics in Perry County, males aged 12 to 14 years and females aged 15 years are the age groups that are most secure financially, with 94.8% of males and 100.0% of females in these age groups living above the poverty line.
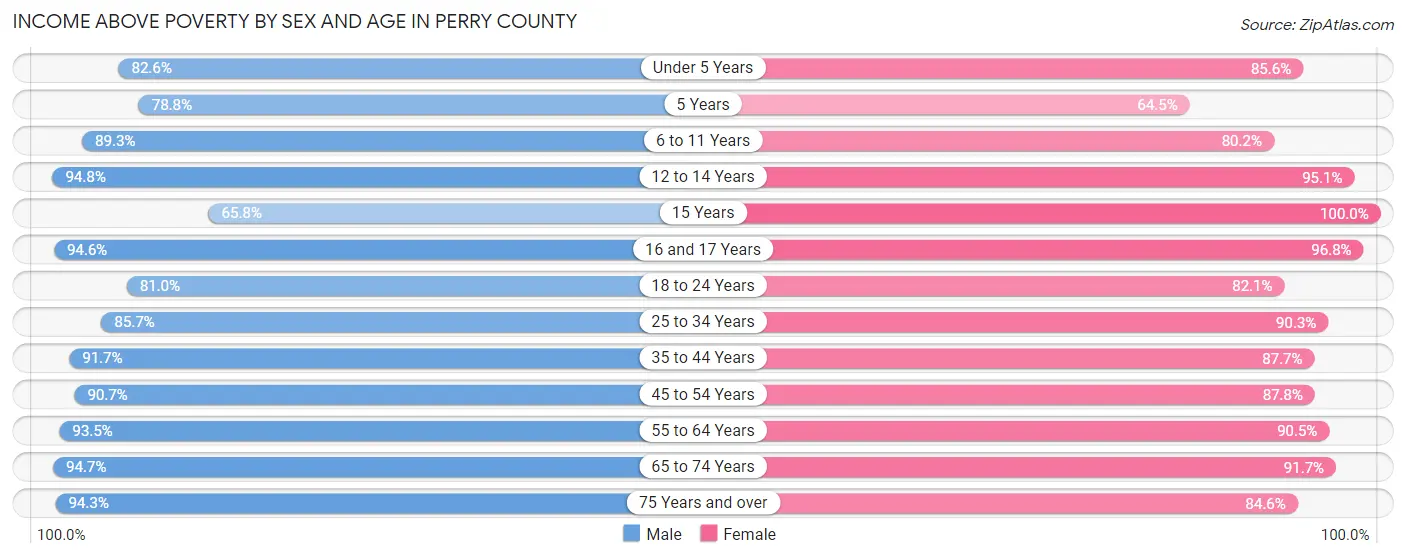
| Age Bracket | Male | Female |
| Under 5 Years | 440 (82.6%) | 416 (85.6%) |
| 5 Years | 145 (78.8%) | 91 (64.5%) |
| 6 to 11 Years | 643 (89.3%) | 554 (80.2%) |
| 12 to 14 Years | 293 (94.8%) | 350 (95.1%) |
| 15 Years | 106 (65.8%) | 79 (100.0%) |
| 16 and 17 Years | 260 (94.6%) | 303 (96.8%) |
| 18 to 24 Years | 598 (81.0%) | 639 (82.1%) |
| 25 to 34 Years | 944 (85.7%) | 937 (90.3%) |
| 35 to 44 Years | 1,050 (91.7%) | 985 (87.7%) |
| 45 to 54 Years | 1,098 (90.7%) | 1,057 (87.8%) |
| 55 to 64 Years | 1,229 (93.5%) | 1,185 (90.5%) |
| 65 to 74 Years | 932 (94.7%) | 940 (91.7%) |
| 75 Years and over | 575 (94.3%) | 648 (84.6%) |
| Total | 8,313 (89.5%) | 8,184 (87.8%) |
Income Below Poverty Among Married-Couple Families in Perry County
The poverty statistics for married-couple families in Perry County show that 2.9% or 116 of the total 4,034 families live below the poverty line. Families with 3 or 4 children have the highest poverty rate of 16.0%, comprising of 54 families. On the other hand, families with 5 or more children have the lowest poverty rate of 0.0%, which includes 0 families.
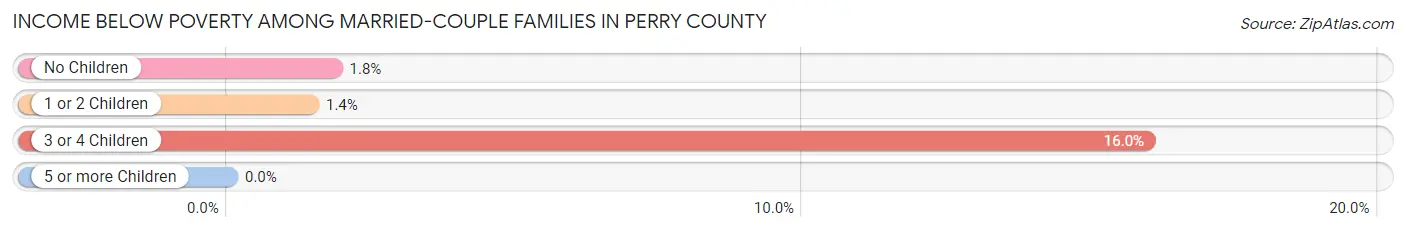
| Children | Above Poverty | Below Poverty |
| No Children | 2,371 (98.2%) | 44 (1.8%) |
| 1 or 2 Children | 1,256 (98.6%) | 18 (1.4%) |
| 3 or 4 Children | 284 (84.0%) | 54 (16.0%) |
| 5 or more Children | 7 (100.0%) | 0 (0.0%) |
| Total | 3,918 (97.1%) | 116 (2.9%) |
Income Below Poverty Among Single-Parent Households in Perry County
According to the poverty data in Perry County, 14.2% or 34 single-father households and 35.5% or 214 single-mother households are living below the poverty line. Among single-father households, those with 3 or 4 children have the highest poverty rate, with 14 households (100.0%) experiencing poverty. Likewise, among single-mother households, those with 5 or more children have the highest poverty rate, with 19 households (100.0%) falling below the poverty line.
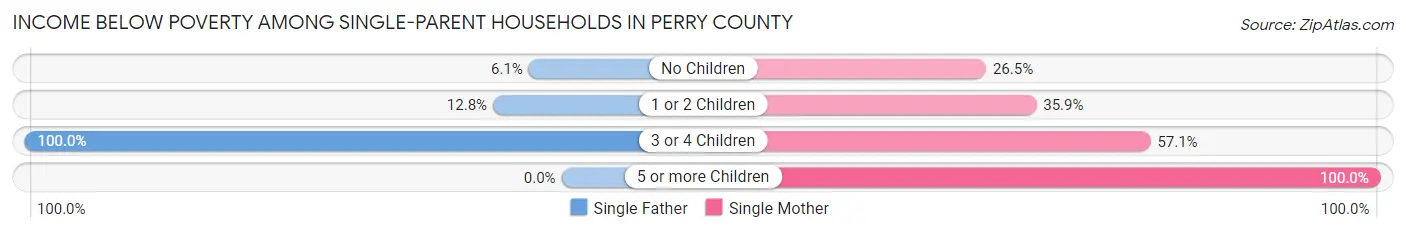
| Children | Single Father | Single Mother |
| No Children | 8 (6.1%) | 57 (26.5%) |
| 1 or 2 Children | 12 (12.8%) | 122 (35.9%) |
| 3 or 4 Children | 14 (100.0%) | 16 (57.1%) |
| 5 or more Children | 0 (0.0%) | 19 (100.0%) |
| Total | 34 (14.2%) | 214 (35.5%) |
Income Below Poverty Among Married-Couple vs Single-Parent Households in Perry County
The poverty data for Perry County shows that 116 of the married-couple family households (2.9%) and 248 of the single-parent households (29.5%) are living below the poverty level. Within the married-couple family households, those with 3 or 4 children have the highest poverty rate, with 54 households (16.0%) falling below the poverty line. Among the single-parent households, those with 5 or more children have the highest poverty rate, with 19 household (100.0%) living below poverty.
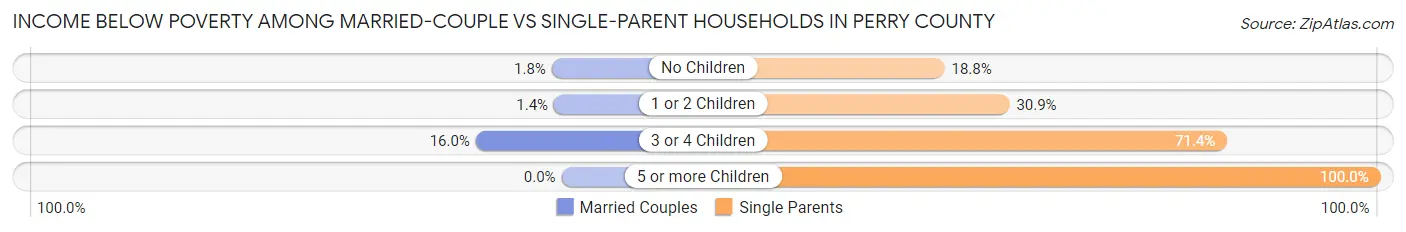
| Children | Married-Couple Families | Single-Parent Households |
| No Children | 44 (1.8%) | 65 (18.8%) |
| 1 or 2 Children | 18 (1.4%) | 134 (30.9%) |
| 3 or 4 Children | 54 (16.0%) | 30 (71.4%) |
| 5 or more Children | 0 (0.0%) | 19 (100.0%) |
| Total | 116 (2.9%) | 248 (29.5%) |
Race in Perry County
The most populous races in Perry County are White / Caucasian (18,066 | 95.2%), Two or more Races (552 | 2.9%), and Hispanic or Latino (460 | 2.4%).
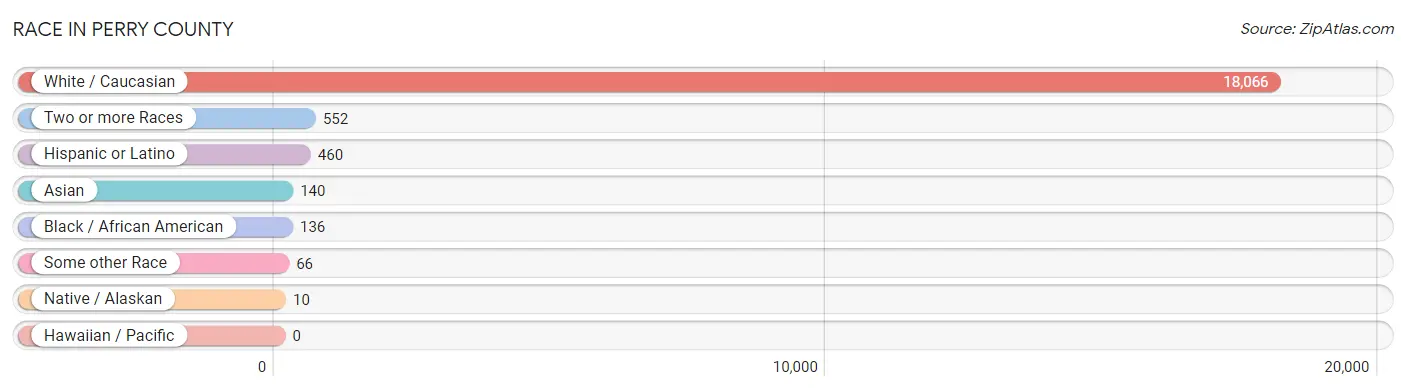
| Race | # Population | % Population |
| Asian | 140 | 0.7% |
| Black / African American | 136 | 0.7% |
| Hawaiian / Pacific | 0 | 0.0% |
| Hispanic or Latino | 460 | 2.4% |
| Native / Alaskan | 10 | 0.1% |
| White / Caucasian | 18,066 | 95.2% |
| Two or more Races | 552 | 2.9% |
| Some other Race | 66 | 0.4% |
| Total | 18,970 | 100.0% |
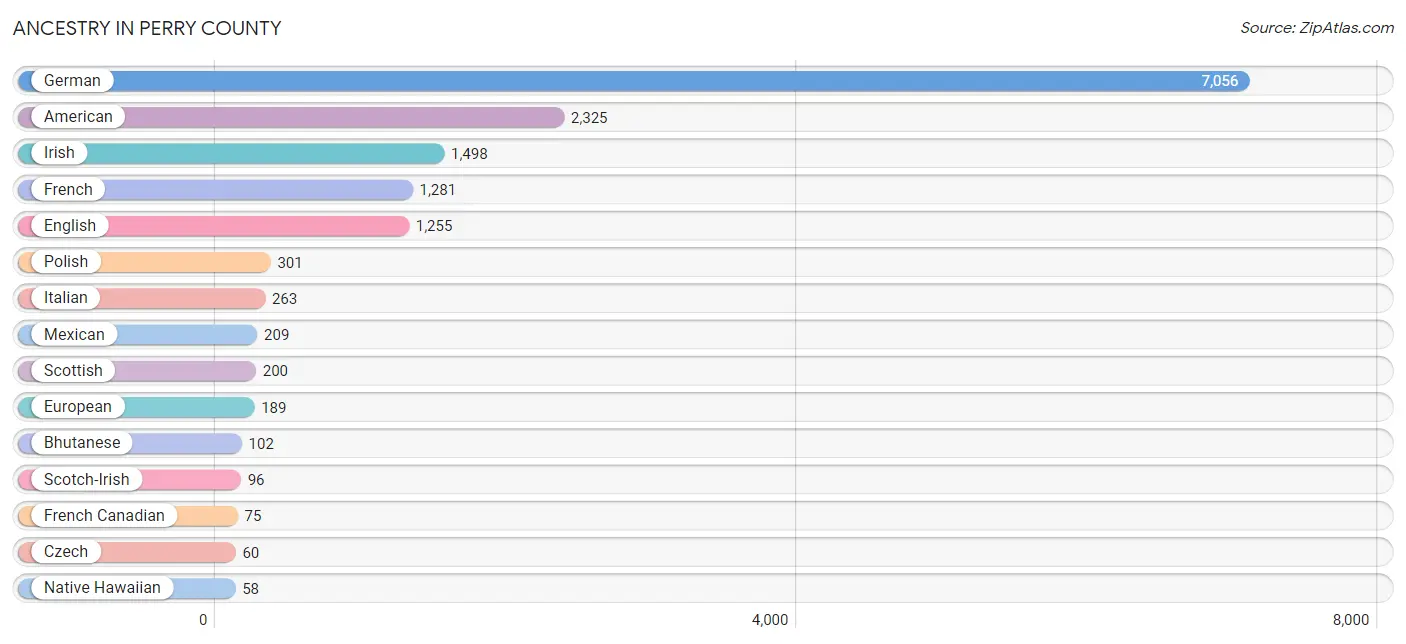
Ancestry in Perry County
The most populous ancestries reported in Perry County are German (7,056 | 37.2%), American (2,325 | 12.3%), Irish (1,498 | 7.9%), French (1,281 | 6.8%), and English (1,255 | 6.6%), together accounting for 70.7% of all Perry County residents.
| Ancestry | # Population | % Population |
| American | 2,325 | 12.3% |
| Austrian | 12 | 0.1% |
| Belgian | 33 | 0.2% |
| Bhutanese | 102 | 0.5% |
| Blackfeet | 3 | 0.0% |
| British | 49 | 0.3% |
| Burmese | 21 | 0.1% |
| Canadian | 6 | 0.0% |
| Central American | 38 | 0.2% |
| Cherokee | 57 | 0.3% |
| Croatian | 22 | 0.1% |
| Cuban | 36 | 0.2% |
| Czech | 60 | 0.3% |
| Dutch | 38 | 0.2% |
| English | 1,255 | 6.6% |
| European | 189 | 1.0% |
| Finnish | 19 | 0.1% |
| French | 1,281 | 6.8% |
| French Canadian | 75 | 0.4% |
| German | 7,056 | 37.2% |
| Greek | 4 | 0.0% |
| Guatemalan | 38 | 0.2% |
| Hungarian | 13 | 0.1% |
| Indian (Asian) | 43 | 0.2% |
| Irish | 1,498 | 7.9% |
| Italian | 263 | 1.4% |
| Korean | 51 | 0.3% |
| Lithuanian | 5 | 0.0% |
| Mexican | 209 | 1.1% |
| Native Hawaiian | 58 | 0.3% |
| Northern European | 17 | 0.1% |
| Norwegian | 55 | 0.3% |
| Polish | 301 | 1.6% |
| Romanian | 41 | 0.2% |
| Scandinavian | 36 | 0.2% |
| Scotch-Irish | 96 | 0.5% |
| Scottish | 200 | 1.1% |
| Slovene | 4 | 0.0% |
| Spaniard | 5 | 0.0% |
| Sri Lankan | 14 | 0.1% |
| Swedish | 29 | 0.2% |
| Swiss | 9 | 0.1% |
| Welsh | 30 | 0.2% | View All 43 Rows |
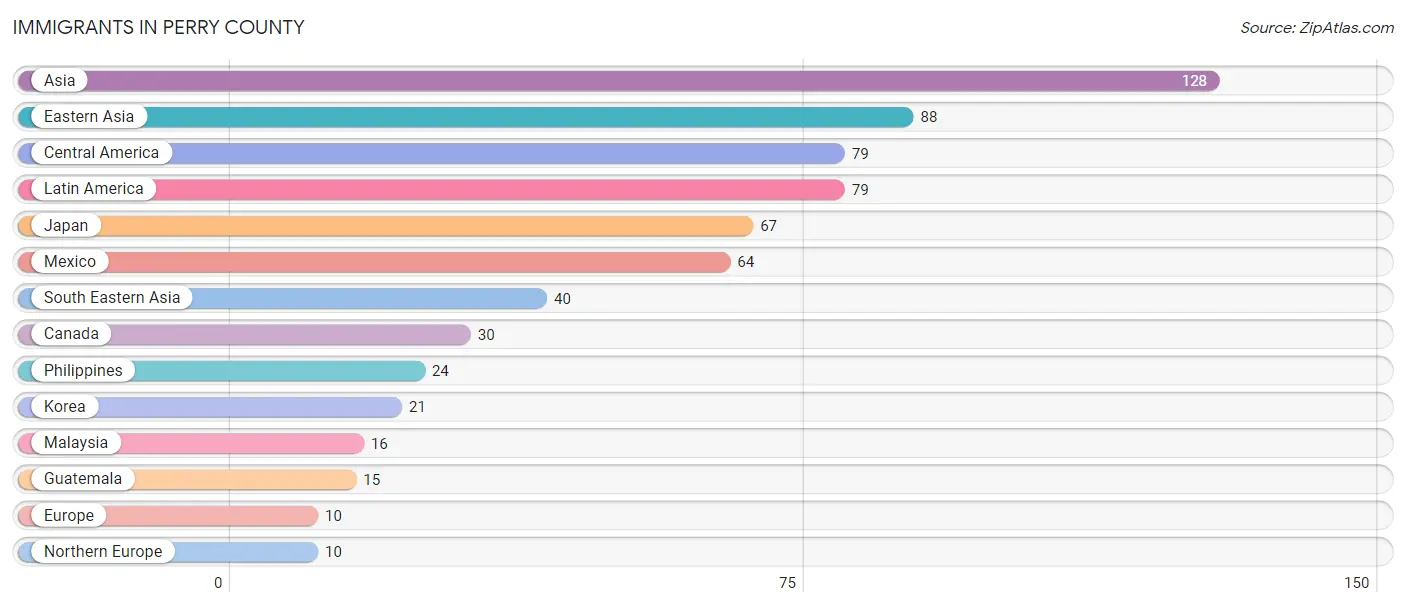
Immigrants in Perry County
The most numerous immigrant groups reported in Perry County came from Asia (128 | 0.7%), Eastern Asia (88 | 0.5%), Central America (79 | 0.4%), Latin America (79 | 0.4%), and Japan (67 | 0.4%), together accounting for 2.3% of all Perry County residents.
| Immigration Origin | # Population | % Population |
| Asia | 128 | 0.7% |
| Canada | 30 | 0.2% |
| Central America | 79 | 0.4% |
| Eastern Asia | 88 | 0.5% |
| Europe | 10 | 0.1% |
| Guatemala | 15 | 0.1% |
| Japan | 67 | 0.4% |
| Korea | 21 | 0.1% |
| Latin America | 79 | 0.4% |
| Malaysia | 16 | 0.1% |
| Mexico | 64 | 0.3% |
| Northern Europe | 10 | 0.1% |
| Philippines | 24 | 0.1% |
| South Eastern Asia | 40 | 0.2% | View All 14 Rows |
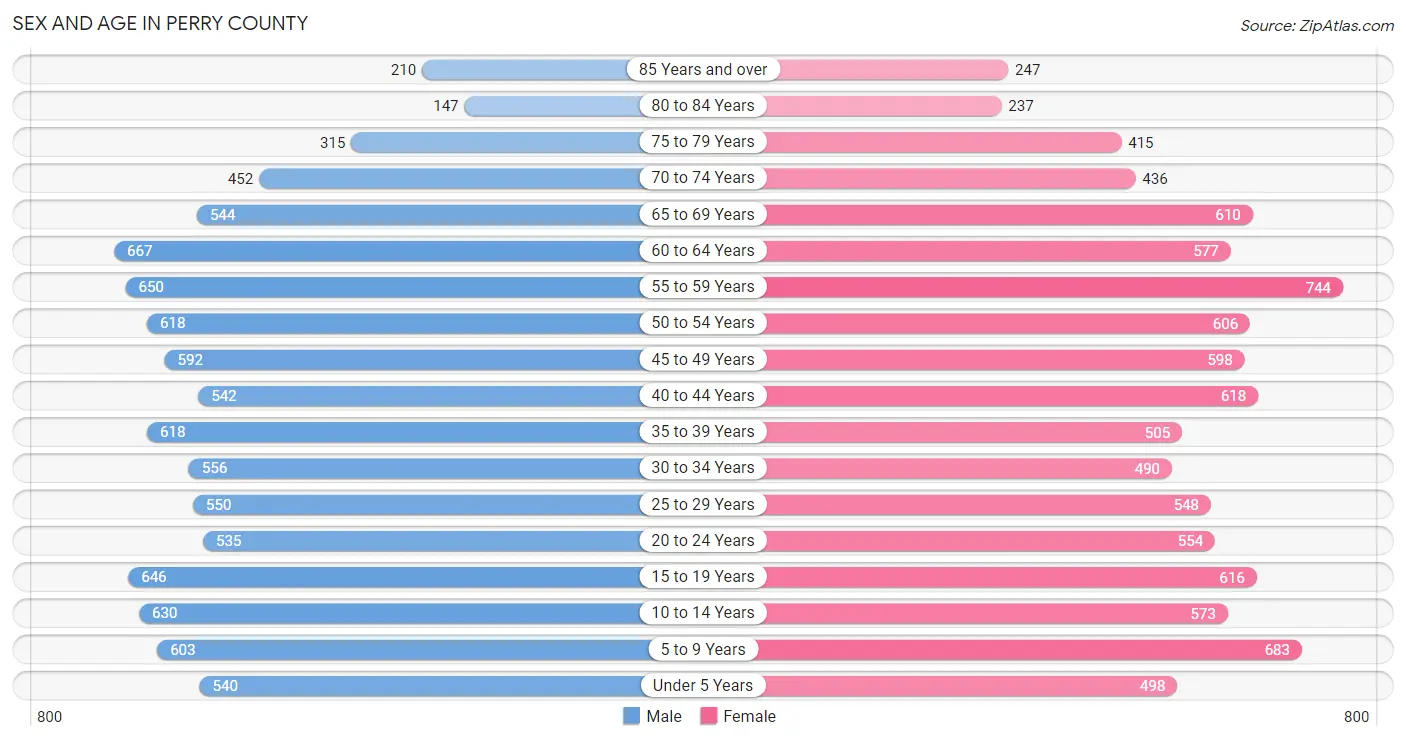
Sex and Age in Perry County
Sex and Age in Perry County
The most populous age groups in Perry County are 60 to 64 Years (667 | 7.1%) for men and 55 to 59 Years (744 | 7.8%) for women.
| Age Bracket | Male | Female |
| Under 5 Years | 540 (5.7%) | 498 (5.2%) |
| 5 to 9 Years | 603 (6.4%) | 683 (7.1%) |
| 10 to 14 Years | 630 (6.7%) | 573 (6.0%) |
| 15 to 19 Years | 646 (6.9%) | 616 (6.5%) |
| 20 to 24 Years | 535 (5.7%) | 554 (5.8%) |
| 25 to 29 Years | 550 (5.8%) | 548 (5.7%) |
| 30 to 34 Years | 556 (5.9%) | 490 (5.1%) |
| 35 to 39 Years | 618 (6.6%) | 505 (5.3%) |
| 40 to 44 Years | 542 (5.8%) | 618 (6.5%) |
| 45 to 49 Years | 592 (6.3%) | 598 (6.3%) |
| 50 to 54 Years | 618 (6.6%) | 606 (6.3%) |
| 55 to 59 Years | 650 (6.9%) | 744 (7.8%) |
| 60 to 64 Years | 667 (7.1%) | 577 (6.0%) |
| 65 to 69 Years | 544 (5.8%) | 610 (6.4%) |
| 70 to 74 Years | 452 (4.8%) | 436 (4.6%) |
| 75 to 79 Years | 315 (3.4%) | 415 (4.3%) |
| 80 to 84 Years | 147 (1.6%) | 237 (2.5%) |
| 85 Years and over | 210 (2.2%) | 247 (2.6%) |
| Total | 9,415 (100.0%) | 9,555 (100.0%) |
Families and Households in Perry County
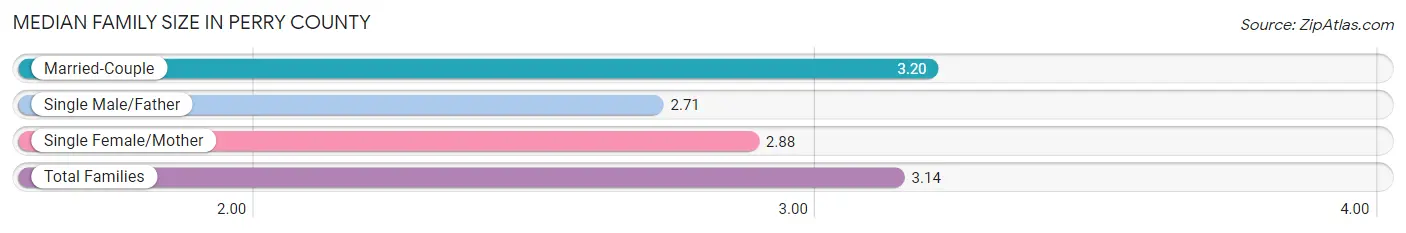
Median Family Size in Perry County
The median family size in Perry County is 3.14 persons per family, with married-couple families (4,034 | 82.8%) accounting for the largest median family size of 3.2 persons per family. On the other hand, single male/father families (239 | 4.9%) represent the smallest median family size with 2.71 persons per family.
| Family Type | # Families | Family Size |
| Married-Couple | 4,034 (82.8%) | 3.20 |
| Single Male/Father | 239 (4.9%) | 2.71 |
| Single Female/Mother | 602 (12.3%) | 2.88 |
| Total Families | 4,875 (100.0%) | 3.14 |
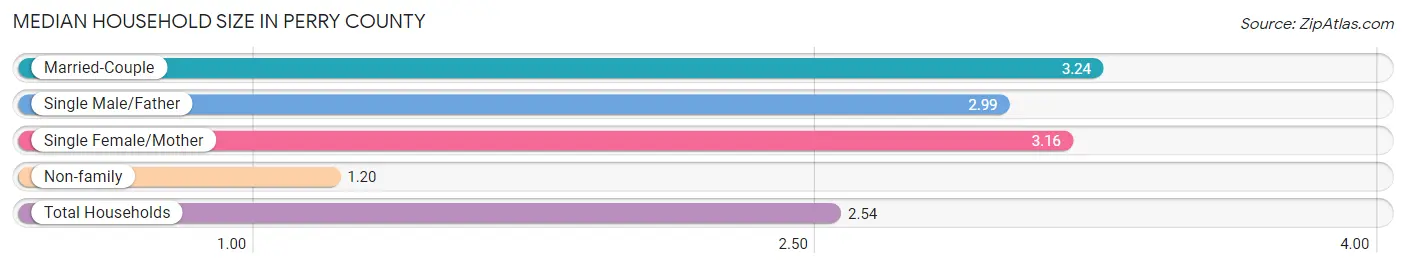
Median Household Size in Perry County
The median household size in Perry County is 2.54 persons per household, with married-couple households (4,034 | 55.0%) accounting for the largest median household size of 3.24 persons per household. non-family households (2,454 | 33.5%) represent the smallest median household size with 1.20 persons per household.
| Household Type | # Households | Household Size |
| Married-Couple | 4,034 (55.0%) | 3.24 |
| Single Male/Father | 239 (3.3%) | 2.99 |
| Single Female/Mother | 602 (8.2%) | 3.16 |
| Non-family | 2,454 (33.5%) | 1.20 |
| Total Households | 7,329 (100.0%) | 2.54 |
Household Size by Marriage Status in Perry County
Out of a total of 7,329 households in Perry County, 4,875 (66.5%) are family households, while 2,454 (33.5%) are nonfamily households. The most numerous type of family households are 2-person households, comprising 2,297, and the most common type of nonfamily households are 1-person households, comprising 2,084.
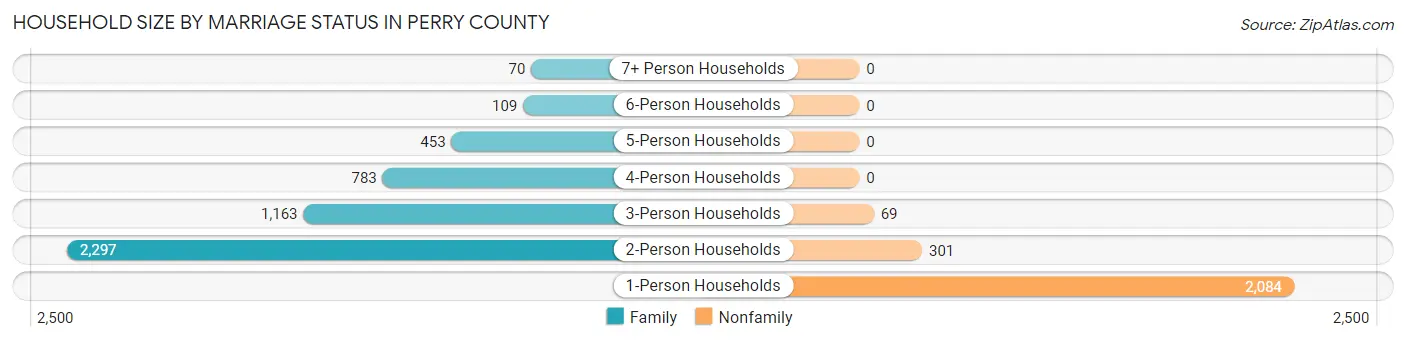
| Household Size | Family Households | Nonfamily Households |
| 1-Person Households | - | 2,084 (28.4%) |
| 2-Person Households | 2,297 (31.3%) | 301 (4.1%) |
| 3-Person Households | 1,163 (15.9%) | 69 (0.9%) |
| 4-Person Households | 783 (10.7%) | 0 (0.0%) |
| 5-Person Households | 453 (6.2%) | 0 (0.0%) |
| 6-Person Households | 109 (1.5%) | 0 (0.0%) |
| 7+ Person Households | 70 (1.0%) | 0 (0.0%) |
| Total | 4,875 (66.5%) | 2,454 (33.5%) |
Female Fertility in Perry County
Fertility by Age in Perry County
Average fertility rate in Perry County is 50.0 births per 1,000 women. Women in the age bracket of 20 to 34 years have the highest fertility rate with 118.0 births per 1,000 women. Women in the age bracket of 20 to 34 years acount for 93.5% of all women with births.
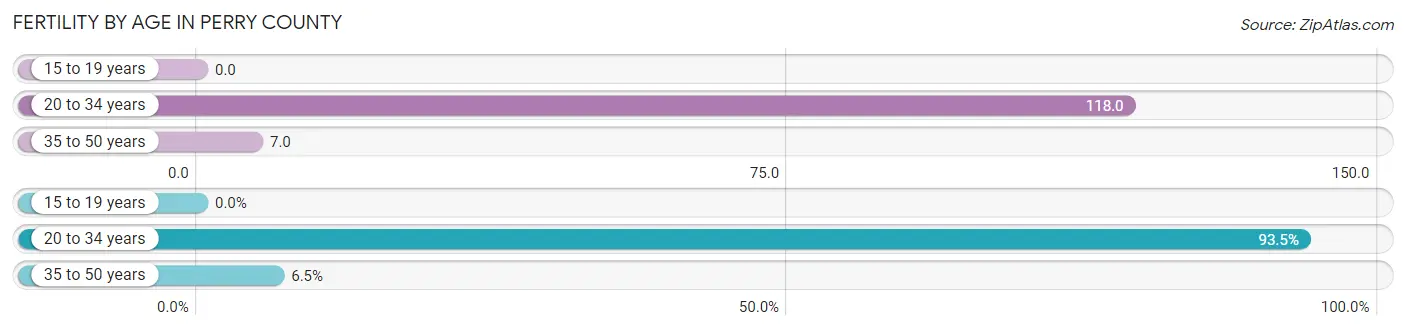
| Age Bracket | Women with Births | Births / 1,000 Women |
| 15 to 19 years | 0 (0.0%) | 0.0 |
| 20 to 34 years | 188 (93.5%) | 118.0 |
| 35 to 50 years | 13 (6.5%) | 7.0 |
| Total | 201 (100.0%) | 50.0 |
Fertility by Age by Marriage Status in Perry County
91.5% of women with births (201) in Perry County are married. The highest percentage of unmarried women with births falls into 20 to 34 years age bracket with 9.0% of them unmarried at the time of birth, while the lowest percentage of unmarried women with births belong to 35 to 50 years age bracket with 0.0% of them unmarried.
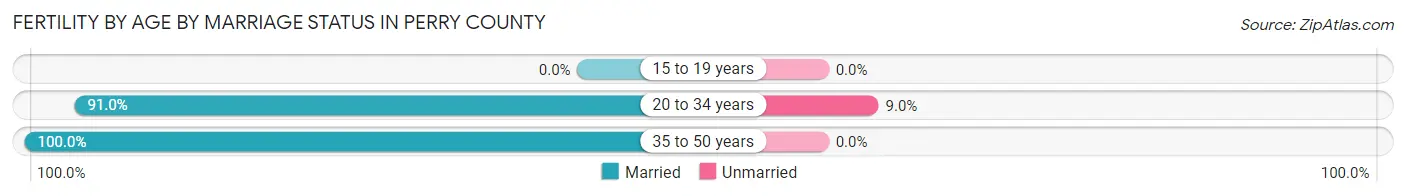
| Age Bracket | Married | Unmarried |
| 15 to 19 years | 0 (0.0%) | 0 (0.0%) |
| 20 to 34 years | 171 (91.0%) | 17 (9.0%) |
| 35 to 50 years | 13 (100.0%) | 0 (0.0%) |
| Total | 184 (91.5%) | 17 (8.5%) |
Fertility by Education in Perry County
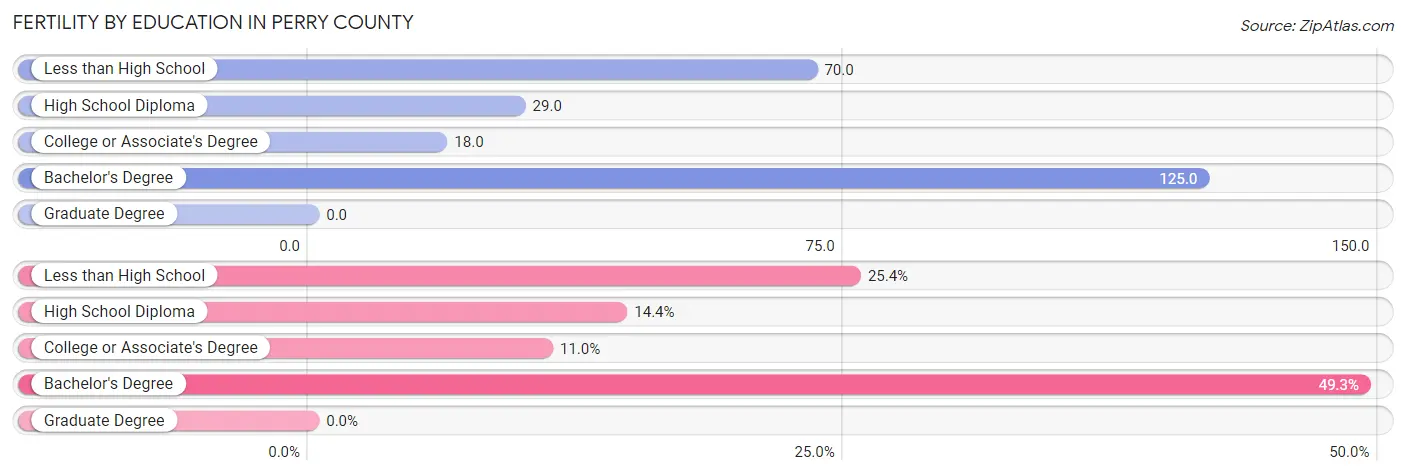
| Educational Attainment | Women with Births | Births / 1,000 Women |
| Less than High School | 51 (25.4%) | 70.0 |
| High School Diploma | 29 (14.4%) | 29.0 |
| College or Associate's Degree | 22 (11.0%) | 18.0 |
| Bachelor's Degree | 99 (49.2%) | 125.0 |
| Graduate Degree | 0 (0.0%) | 0.0 |
| Total | 201 (100.0%) | 50.0 |
Fertility by Education by Marriage Status in Perry County
8.5% of women with births in Perry County are unmarried. Women with the educational attainment of less than high school are most likely to be married with 100.0% of them married at childbirth, while women with the educational attainment of bachelor's degree are least likely to be married with 17.2% of them unmarried at childbirth.
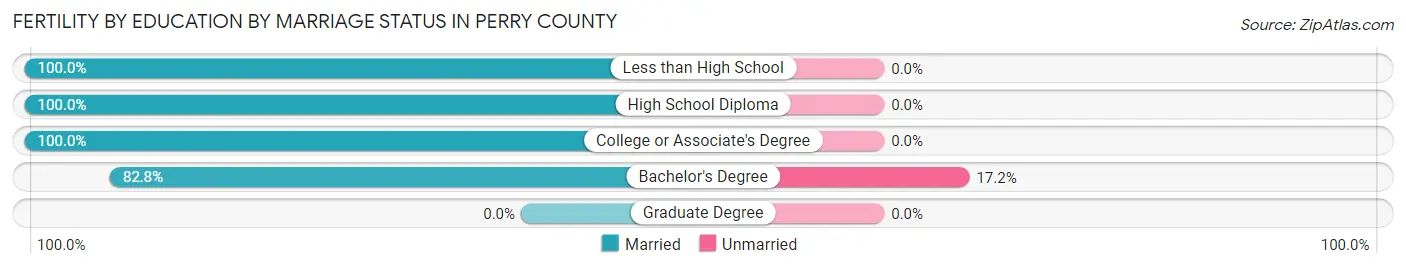
| Educational Attainment | Married | Unmarried |
| Less than High School | 51 (100.0%) | 0 (0.0%) |
| High School Diploma | 29 (100.0%) | 0 (0.0%) |
| College or Associate's Degree | 22 (100.0%) | 0 (0.0%) |
| Bachelor's Degree | 82 (82.8%) | 17 (17.2%) |
| Graduate Degree | 0 (0.0%) | 0 (0.0%) |
| Total | 184 (91.5%) | 17 (8.5%) |
Employment Characteristics in Perry County
Employment by Class of Employer in Perry County
Among the 8,936 employed individuals in Perry County, private company employees (6,238 | 69.8%), not-for-profit organizations (834 | 9.3%), and self-employed (not incorporated) (601 | 6.7%) make up the most common classes of employment.
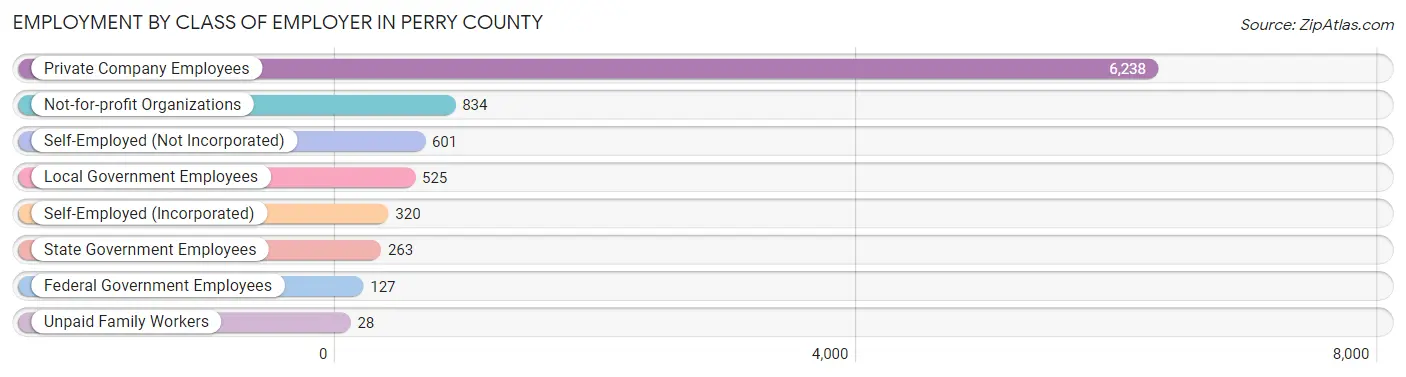
| Employer Class | # Employees | % Employees |
| Private Company Employees | 6,238 | 69.8% |
| Self-Employed (Incorporated) | 320 | 3.6% |
| Self-Employed (Not Incorporated) | 601 | 6.7% |
| Not-for-profit Organizations | 834 | 9.3% |
| Local Government Employees | 525 | 5.9% |
| State Government Employees | 263 | 2.9% |
| Federal Government Employees | 127 | 1.4% |
| Unpaid Family Workers | 28 | 0.3% |
| Total | 8,936 | 100.0% |
Employment Status by Age in Perry County
According to the labor force statistics for Perry County, out of the total population over 16 years of age (15,203), 63.2% or 9,608 individuals are in the labor force, with 5.1% or 490 of them unemployed. The age group with the highest labor force participation rate is 25 to 29 years, with 89.1% or 978 individuals in the labor force. Within the labor force, the 16 to 19 years age range has the highest percentage of unemployed individuals, with 22.6% or 109 of them being unemployed.
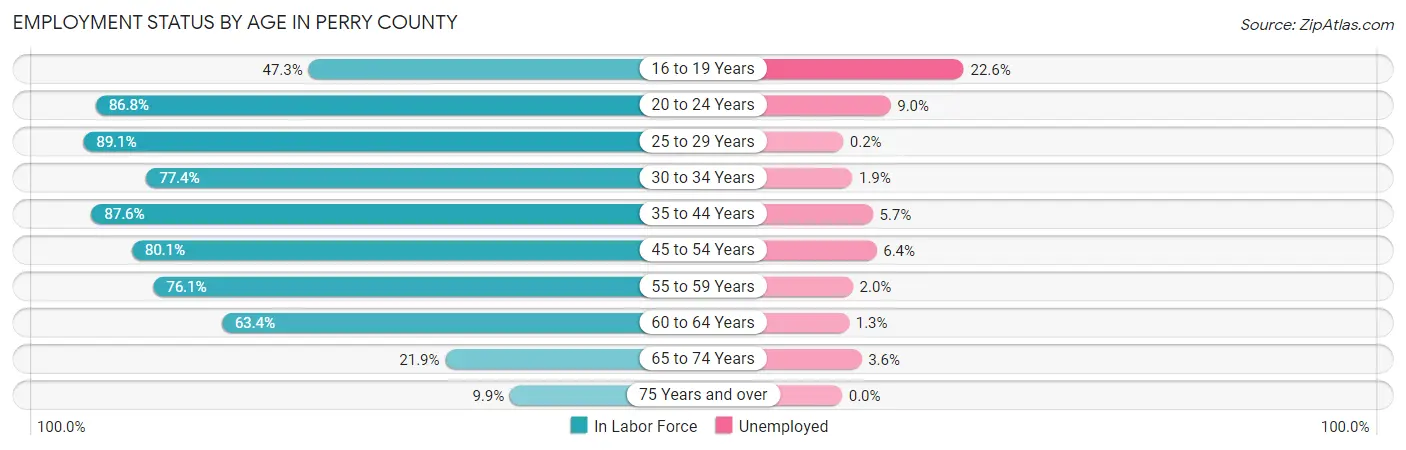
| Age Bracket | In Labor Force | Unemployed |
| 16 to 19 Years | 483 (47.3%) | 109 (22.6%) |
| 20 to 24 Years | 945 (86.8%) | 85 (9.0%) |
| 25 to 29 Years | 978 (89.1%) | 2 (0.2%) |
| 30 to 34 Years | 810 (77.4%) | 15 (1.9%) |
| 35 to 44 Years | 2,000 (87.6%) | 114 (5.7%) |
| 45 to 54 Years | 1,934 (80.1%) | 124 (6.4%) |
| 55 to 59 Years | 1,061 (76.1%) | 21 (2.0%) |
| 60 to 64 Years | 789 (63.4%) | 10 (1.3%) |
| 65 to 74 Years | 447 (21.9%) | 16 (3.6%) |
| 75 Years and over | 156 (9.9%) | 0 (0.0%) |
| Total | 9,608 (63.2%) | 490 (5.1%) |
Employment Status by Educational Attainment in Perry County
According to labor force statistics for Perry County, 79.9% of individuals (7,574) out of the total population between 25 and 64 years of age (9,479) are in the labor force, with 3.7% or 280 of them being unemployed. The group with the highest labor force participation rate are those with the educational attainment of bachelor's degree or higher, with 87.9% or 1,867 individuals in the labor force. Within the labor force, individuals with less than high school education have the highest percentage of unemployment, with 14.0% or 94 of them being unemployed.
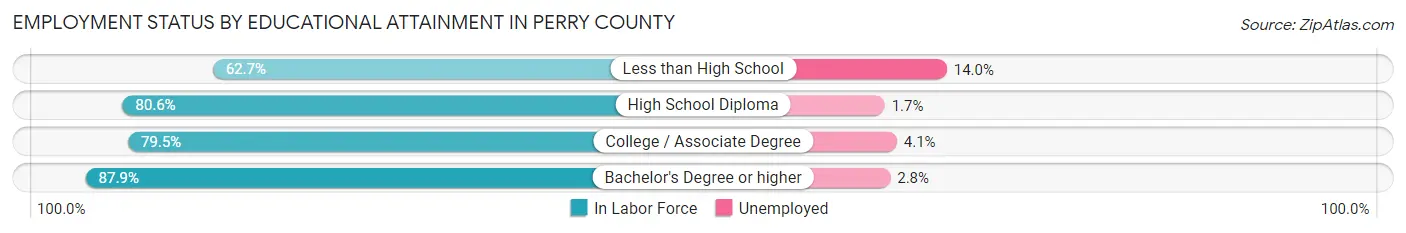
| Educational Attainment | In Labor Force | Unemployed |
| Less than High School | 671 (62.7%) | 150 (14.0%) |
| High School Diploma | 2,945 (80.6%) | 62 (1.7%) |
| College / Associate Degree | 2,092 (79.5%) | 108 (4.1%) |
| Bachelor's Degree or higher | 1,867 (87.9%) | 59 (2.8%) |
| Total | 7,574 (79.9%) | 351 (3.7%) |
Employment Occupations by Sex in Perry County
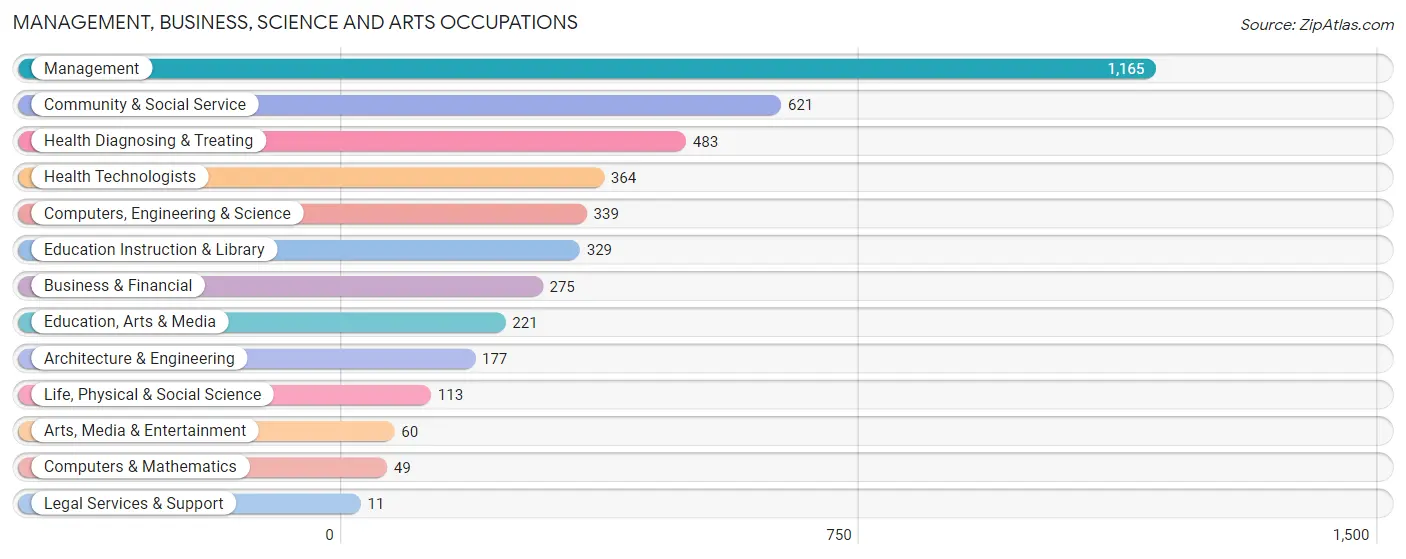
Management, Business, Science and Arts Occupations
The most common Management, Business, Science and Arts occupations in Perry County are Management (1,165 | 12.9%), Community & Social Service (621 | 6.9%), Health Diagnosing & Treating (483 | 5.3%), Health Technologists (364 | 4.0%), and Computers, Engineering & Science (339 | 3.7%).
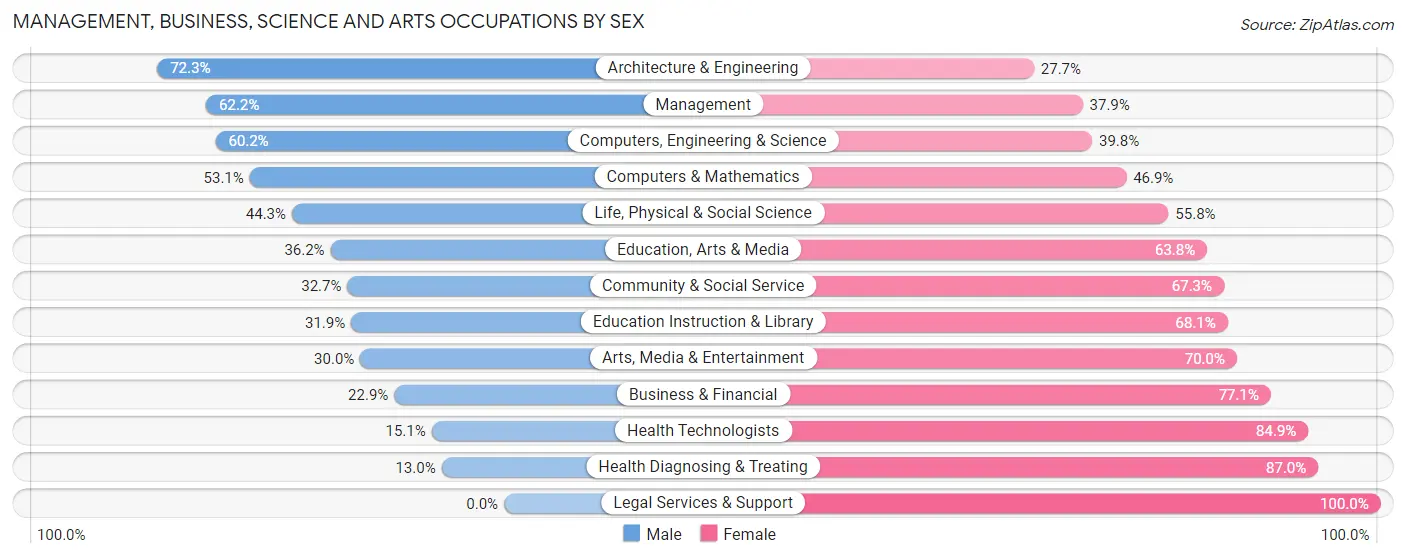
Management, Business, Science and Arts Occupations by Sex
Within the Management, Business, Science and Arts occupations in Perry County, the most male-oriented occupations are Architecture & Engineering (72.3%), Management (62.2%), and Computers, Engineering & Science (60.2%), while the most female-oriented occupations are Legal Services & Support (100.0%), Health Diagnosing & Treating (87.0%), and Health Technologists (84.9%).
| Occupation | Male | Female |
| Management | 724 (62.2%) | 441 (37.9%) |
| Business & Financial | 63 (22.9%) | 212 (77.1%) |
| Computers, Engineering & Science | 204 (60.2%) | 135 (39.8%) |
| Computers & Mathematics | 26 (53.1%) | 23 (46.9%) |
| Architecture & Engineering | 128 (72.3%) | 49 (27.7%) |
| Life, Physical & Social Science | 50 (44.3%) | 63 (55.7%) |
| Community & Social Service | 203 (32.7%) | 418 (67.3%) |
| Education, Arts & Media | 80 (36.2%) | 141 (63.8%) |
| Legal Services & Support | 0 (0.0%) | 11 (100.0%) |
| Education Instruction & Library | 105 (31.9%) | 224 (68.1%) |
| Arts, Media & Entertainment | 18 (30.0%) | 42 (70.0%) |
| Health Diagnosing & Treating | 63 (13.0%) | 420 (87.0%) |
| Health Technologists | 55 (15.1%) | 309 (84.9%) |
| Total (Category) | 1,257 (43.6%) | 1,626 (56.4%) |
| Total (Overall) | 4,792 (52.9%) | 4,271 (47.1%) |
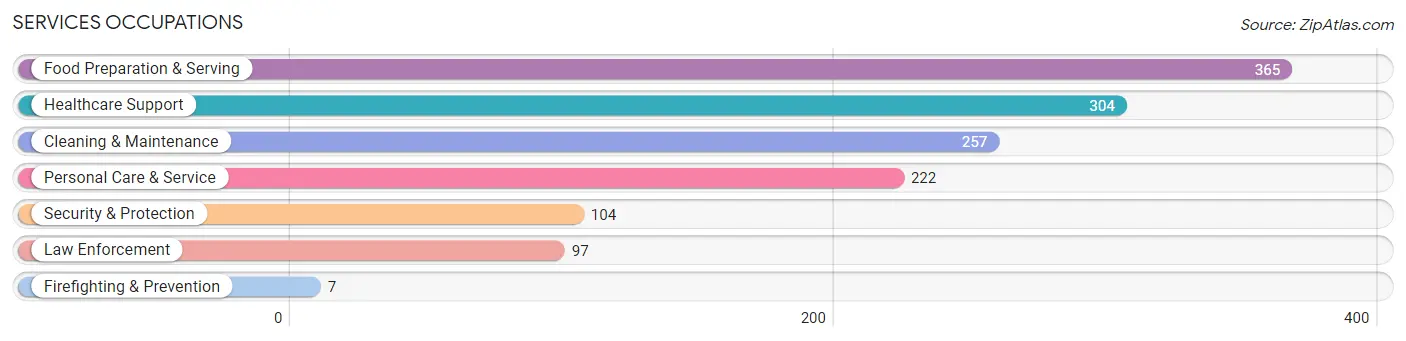
Services Occupations
The most common Services occupations in Perry County are Food Preparation & Serving (365 | 4.0%), Healthcare Support (304 | 3.4%), Cleaning & Maintenance (257 | 2.8%), Personal Care & Service (222 | 2.5%), and Security & Protection (104 | 1.1%).
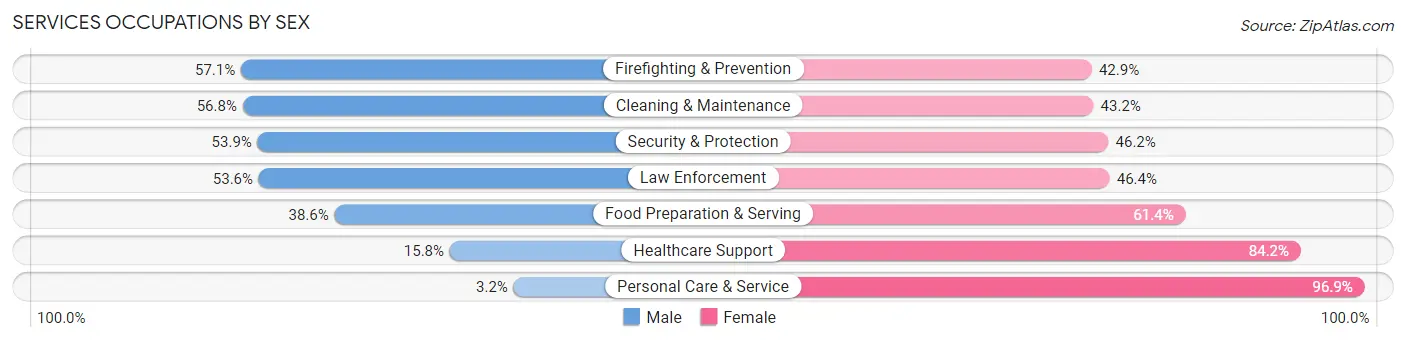
Services Occupations by Sex
Within the Services occupations in Perry County, the most male-oriented occupations are Firefighting & Prevention (57.1%), Cleaning & Maintenance (56.8%), and Security & Protection (53.8%), while the most female-oriented occupations are Personal Care & Service (96.9%), Healthcare Support (84.2%), and Food Preparation & Serving (61.4%).
| Occupation | Male | Female |
| Healthcare Support | 48 (15.8%) | 256 (84.2%) |
| Security & Protection | 56 (53.8%) | 48 (46.2%) |
| Firefighting & Prevention | 4 (57.1%) | 3 (42.9%) |
| Law Enforcement | 52 (53.6%) | 45 (46.4%) |
| Food Preparation & Serving | 141 (38.6%) | 224 (61.4%) |
| Cleaning & Maintenance | 146 (56.8%) | 111 (43.2%) |
| Personal Care & Service | 7 (3.2%) | 215 (96.9%) |
| Total (Category) | 398 (31.8%) | 854 (68.2%) |
| Total (Overall) | 4,792 (52.9%) | 4,271 (47.1%) |
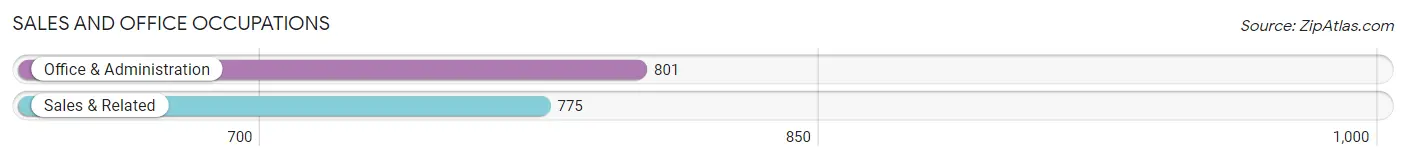
Sales and Office Occupations
The most common Sales and Office occupations in Perry County are Office & Administration (801 | 8.8%), and Sales & Related (775 | 8.6%).
Sales and Office Occupations by Sex
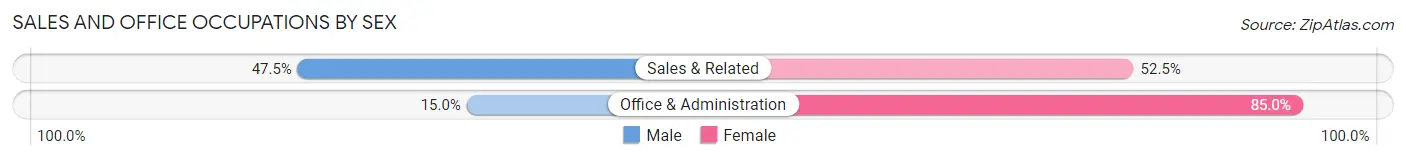
| Occupation | Male | Female |
| Sales & Related | 368 (47.5%) | 407 (52.5%) |
| Office & Administration | 120 (15.0%) | 681 (85.0%) |
| Total (Category) | 488 (31.0%) | 1,088 (69.0%) |
| Total (Overall) | 4,792 (52.9%) | 4,271 (47.1%) |
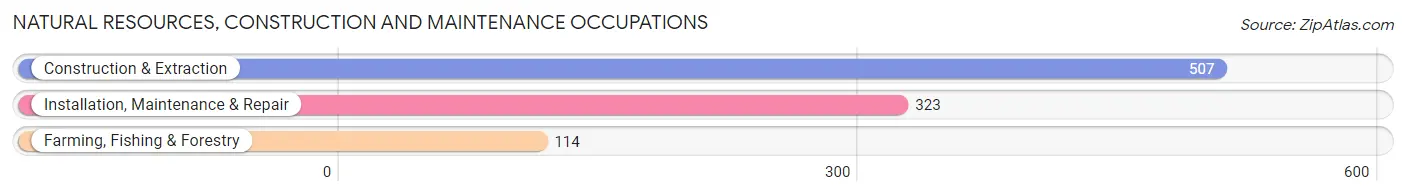
Natural Resources, Construction and Maintenance Occupations
The most common Natural Resources, Construction and Maintenance occupations in Perry County are Construction & Extraction (507 | 5.6%), Installation, Maintenance & Repair (323 | 3.6%), and Farming, Fishing & Forestry (114 | 1.3%).
Natural Resources, Construction and Maintenance Occupations by Sex
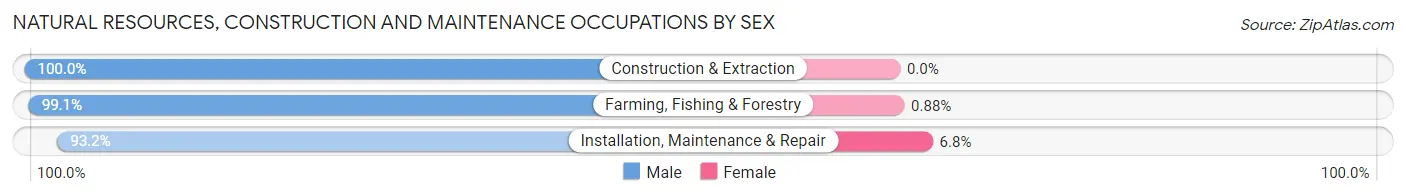
| Occupation | Male | Female |
| Farming, Fishing & Forestry | 113 (99.1%) | 1 (0.9%) |
| Construction & Extraction | 507 (100.0%) | 0 (0.0%) |
| Installation, Maintenance & Repair | 301 (93.2%) | 22 (6.8%) |
| Total (Category) | 921 (97.6%) | 23 (2.4%) |
| Total (Overall) | 4,792 (52.9%) | 4,271 (47.1%) |
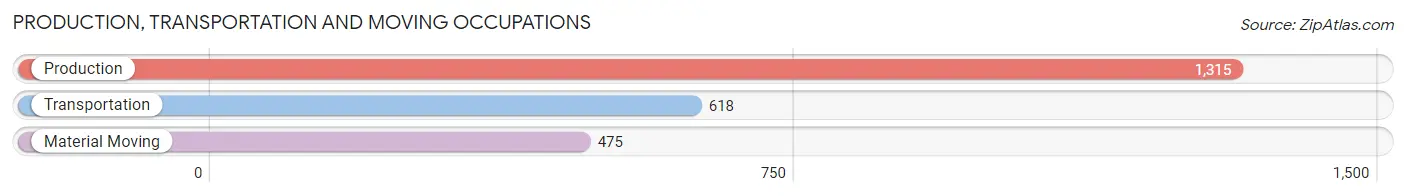
Production, Transportation and Moving Occupations
The most common Production, Transportation and Moving occupations in Perry County are Production (1,315 | 14.5%), Transportation (618 | 6.8%), and Material Moving (475 | 5.2%).
Production, Transportation and Moving Occupations by Sex
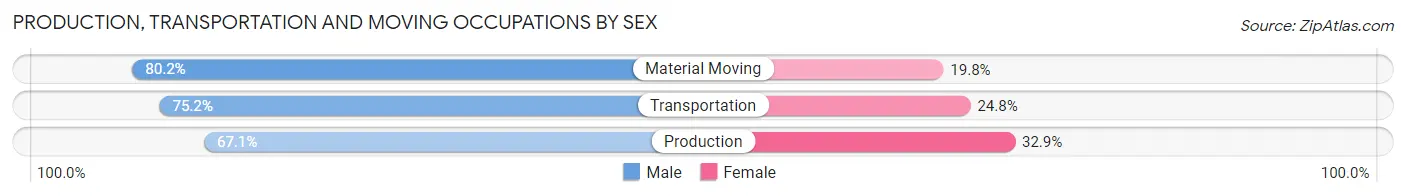
| Occupation | Male | Female |
| Production | 882 (67.1%) | 433 (32.9%) |
| Transportation | 465 (75.2%) | 153 (24.8%) |
| Material Moving | 381 (80.2%) | 94 (19.8%) |
| Total (Category) | 1,728 (71.8%) | 680 (28.2%) |
| Total (Overall) | 4,792 (52.9%) | 4,271 (47.1%) |
Employment Industries by Sex in Perry County
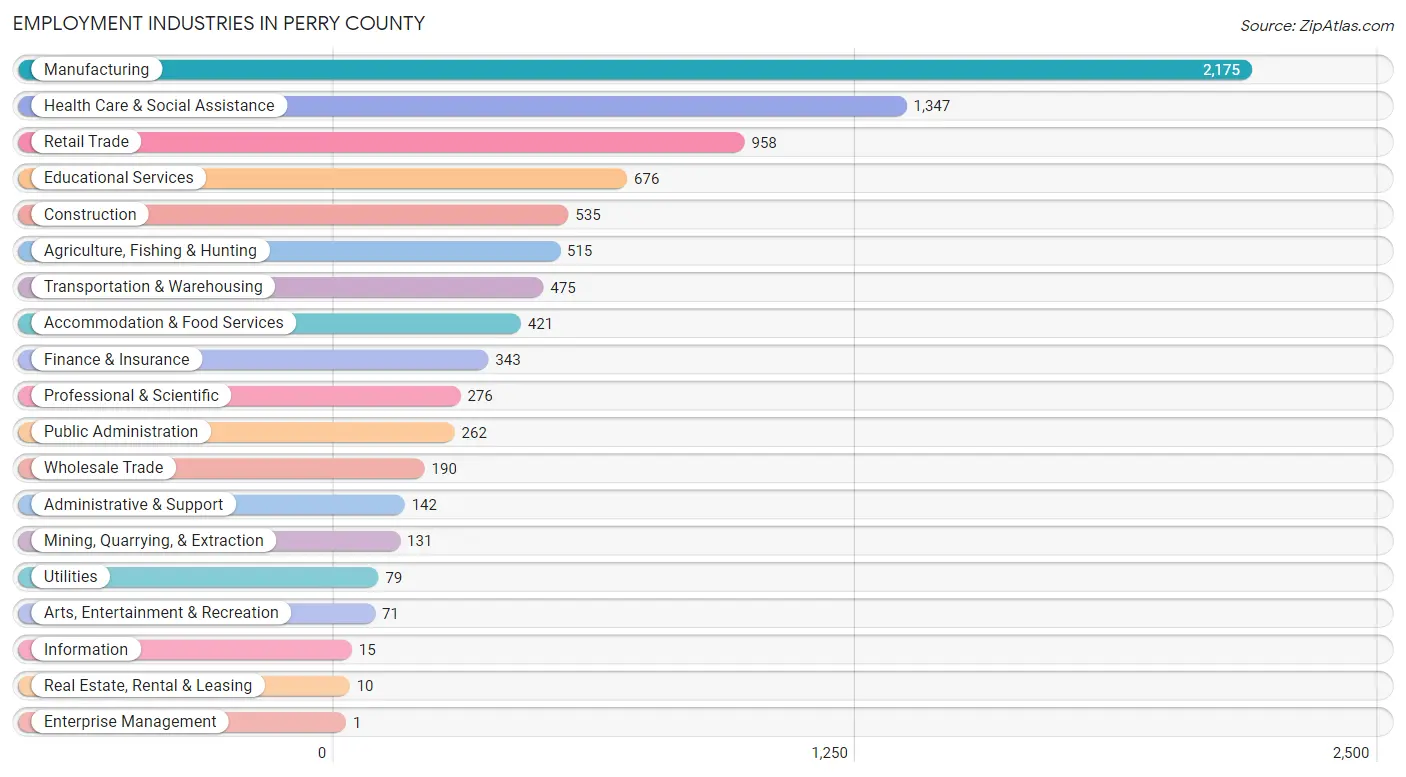
Employment Industries in Perry County
The major employment industries in Perry County include Manufacturing (2,175 | 24.0%), Health Care & Social Assistance (1,347 | 14.9%), Retail Trade (958 | 10.6%), Educational Services (676 | 7.5%), and Construction (535 | 5.9%).
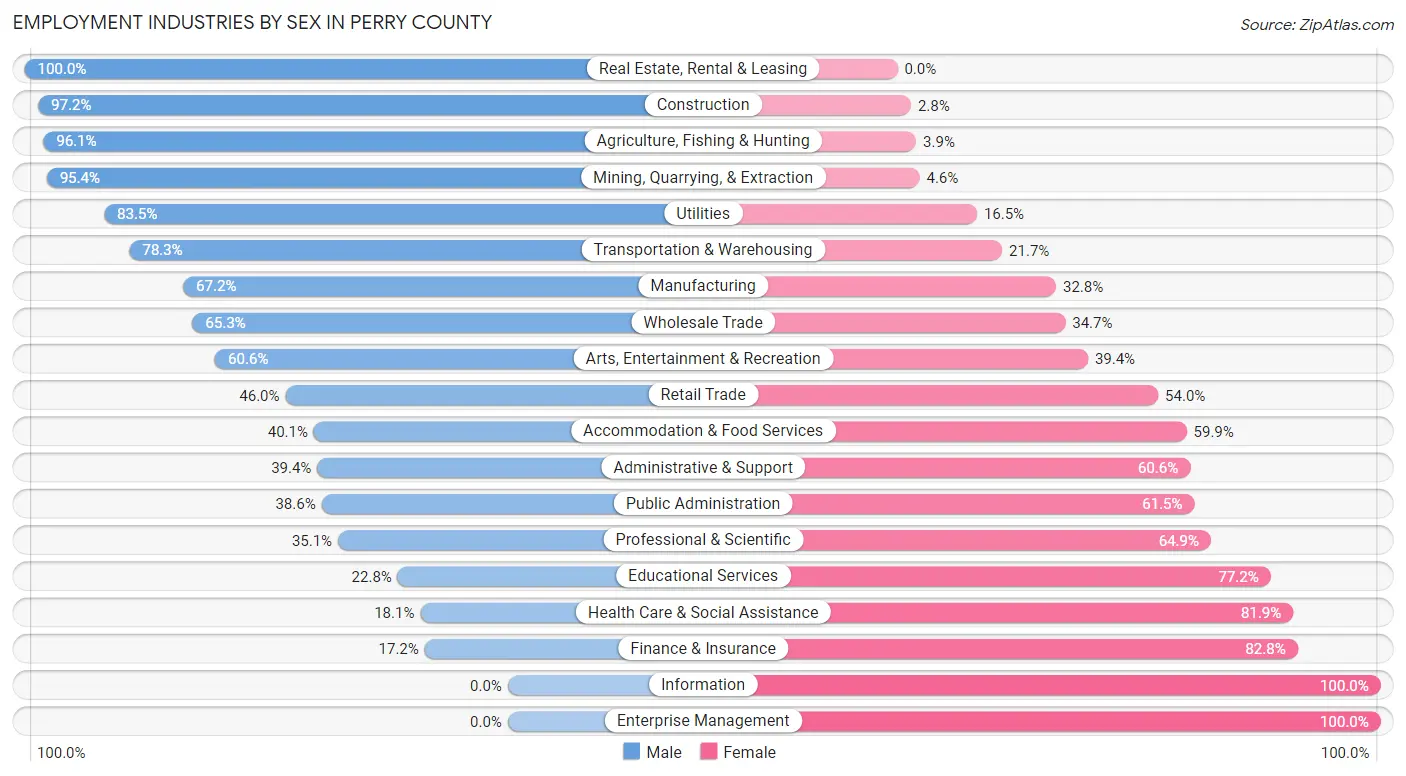
Employment Industries by Sex in Perry County
The Perry County industries that see more men than women are Real Estate, Rental & Leasing (100.0%), Construction (97.2%), and Agriculture, Fishing & Hunting (96.1%), whereas the industries that tend to have a higher number of women are Information (100.0%), Enterprise Management (100.0%), and Finance & Insurance (82.8%).
| Industry | Male | Female |
| Agriculture, Fishing & Hunting | 495 (96.1%) | 20 (3.9%) |
| Mining, Quarrying, & Extraction | 125 (95.4%) | 6 (4.6%) |
| Construction | 520 (97.2%) | 15 (2.8%) |
| Manufacturing | 1,461 (67.2%) | 714 (32.8%) |
| Wholesale Trade | 124 (65.3%) | 66 (34.7%) |
| Retail Trade | 441 (46.0%) | 517 (54.0%) |
| Transportation & Warehousing | 372 (78.3%) | 103 (21.7%) |
| Utilities | 66 (83.5%) | 13 (16.5%) |
| Information | 0 (0.0%) | 15 (100.0%) |
| Finance & Insurance | 59 (17.2%) | 284 (82.8%) |
| Real Estate, Rental & Leasing | 10 (100.0%) | 0 (0.0%) |
| Professional & Scientific | 97 (35.1%) | 179 (64.9%) |
| Enterprise Management | 0 (0.0%) | 1 (100.0%) |
| Administrative & Support | 56 (39.4%) | 86 (60.6%) |
| Educational Services | 154 (22.8%) | 522 (77.2%) |
| Health Care & Social Assistance | 244 (18.1%) | 1,103 (81.9%) |
| Arts, Entertainment & Recreation | 43 (60.6%) | 28 (39.4%) |
| Accommodation & Food Services | 169 (40.1%) | 252 (59.9%) |
| Public Administration | 101 (38.6%) | 161 (61.5%) |
| Total | 4,792 (52.9%) | 4,271 (47.1%) |
Education in Perry County
School Enrollment in Perry County
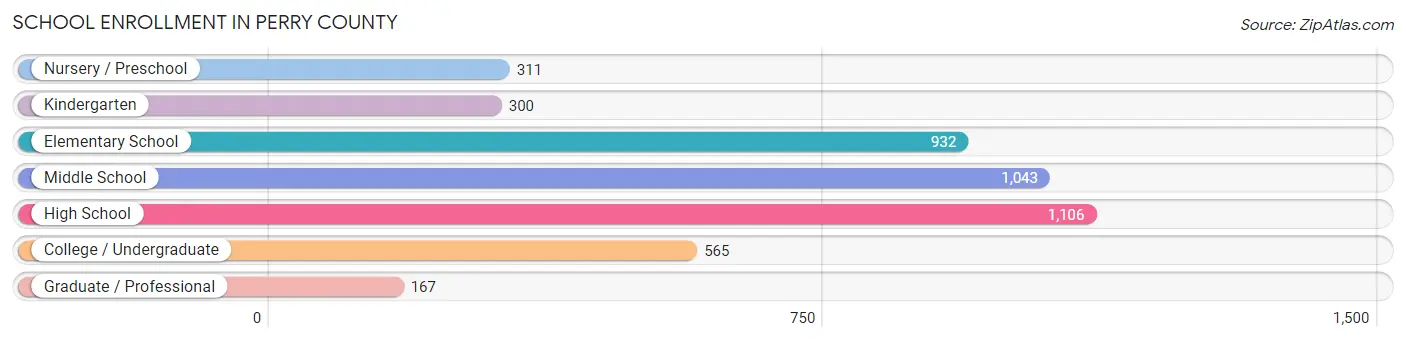
The most common levels of schooling among the 4,424 students in Perry County are high school (1,106 | 25.0%), middle school (1,043 | 23.6%), and elementary school (932 | 21.1%).
| School Level | # Students | % Students |
| Nursery / Preschool | 311 | 7.0% |
| Kindergarten | 300 | 6.8% |
| Elementary School | 932 | 21.1% |
| Middle School | 1,043 | 23.6% |
| High School | 1,106 | 25.0% |
| College / Undergraduate | 565 | 12.8% |
| Graduate / Professional | 167 | 3.8% |
| Total | 4,424 | 100.0% |
School Enrollment by Age by Funding Source in Perry County
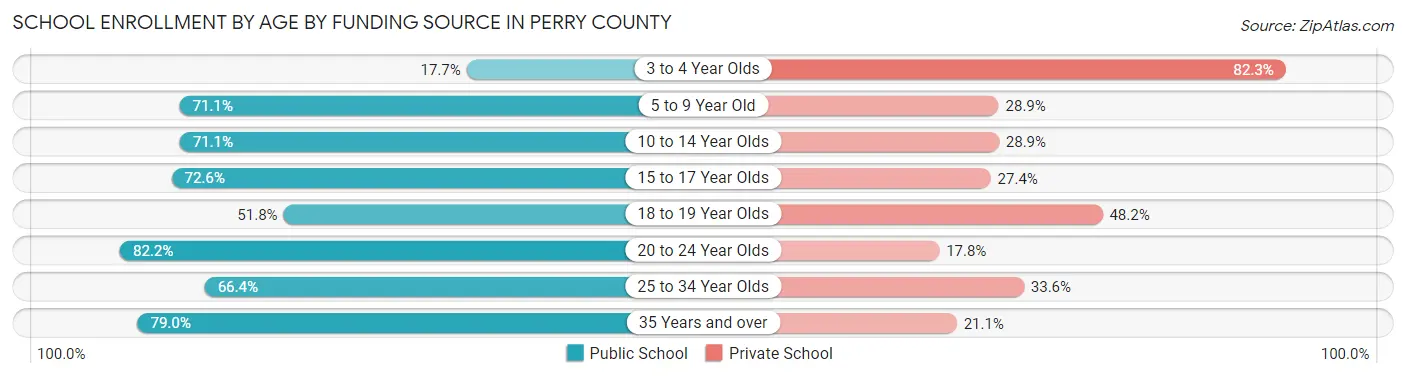
Out of a total of 4,424 students who are enrolled in schools in Perry County, 1,389 (31.4%) attend a private institution, while the remaining 3,035 (68.6%) are enrolled in public schools. The age group of 3 to 4 year olds has the highest likelihood of being enrolled in private schools, with 149 (82.3% in the age bracket) enrolled. Conversely, the age group of 20 to 24 year olds has the lowest likelihood of being enrolled in a private school, with 328 (82.2% in the age bracket) attending a public institution.
| Age Bracket | Public School | Private School |
| 3 to 4 Year Olds | 32 (17.7%) | 149 (82.3%) |
| 5 to 9 Year Old | 890 (71.1%) | 361 (28.9%) |
| 10 to 14 Year Olds | 846 (71.1%) | 344 (28.9%) |
| 15 to 17 Year Olds | 594 (72.6%) | 224 (27.4%) |
| 18 to 19 Year Olds | 188 (51.8%) | 175 (48.2%) |
| 20 to 24 Year Olds | 328 (82.2%) | 71 (17.8%) |
| 25 to 34 Year Olds | 97 (66.4%) | 49 (33.6%) |
| 35 Years and over | 60 (78.9%) | 16 (21.0%) |
| Total | 3,035 (68.6%) | 1,389 (31.4%) |
Educational Attainment by Field of Study in Perry County
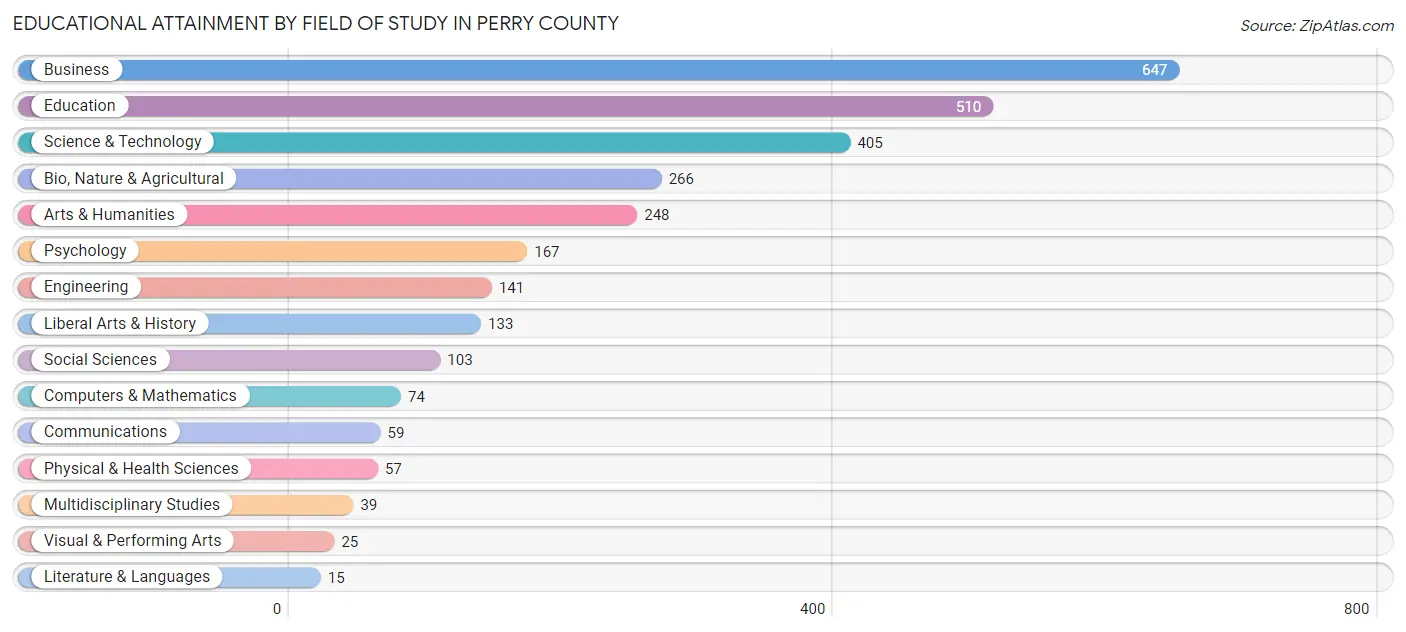
Business (647 | 22.4%), education (510 | 17.6%), science & technology (405 | 14.0%), bio, nature & agricultural (266 | 9.2%), and arts & humanities (248 | 8.6%) are the most common fields of study among 2,889 individuals in Perry County who have obtained a bachelor's degree or higher.
| Field of Study | # Graduates | % Graduates |
| Computers & Mathematics | 74 | 2.6% |
| Bio, Nature & Agricultural | 266 | 9.2% |
| Physical & Health Sciences | 57 | 2.0% |
| Psychology | 167 | 5.8% |
| Social Sciences | 103 | 3.6% |
| Engineering | 141 | 4.9% |
| Multidisciplinary Studies | 39 | 1.3% |
| Science & Technology | 405 | 14.0% |
| Business | 647 | 22.4% |
| Education | 510 | 17.6% |
| Literature & Languages | 15 | 0.5% |
| Liberal Arts & History | 133 | 4.6% |
| Visual & Performing Arts | 25 | 0.9% |
| Communications | 59 | 2.0% |
| Arts & Humanities | 248 | 8.6% |
| Total | 2,889 | 100.0% |
Transportation & Commute in Perry County
Vehicle Availability by Sex in Perry County
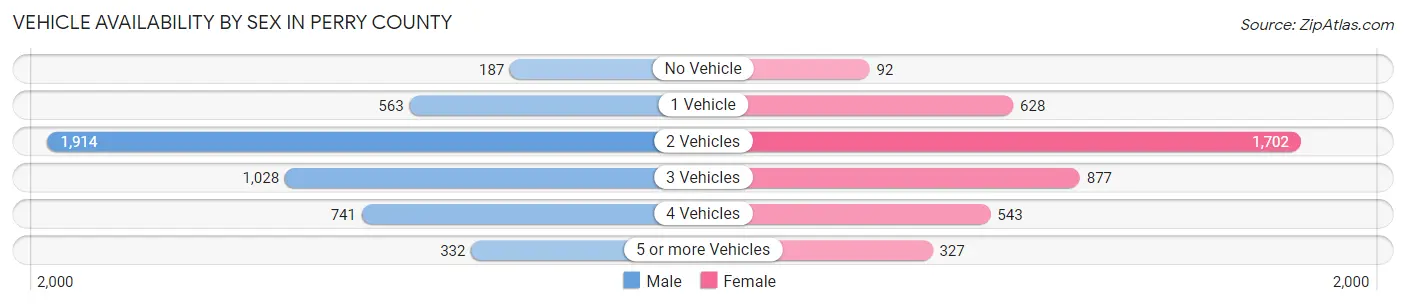
The most prevalent vehicle ownership categories in Perry County are males with 2 vehicles (1,914, accounting for 40.2%) and females with 2 vehicles (1,702, making up 45.9%).
| Vehicles Available | Male | Female |
| No Vehicle | 187 (3.9%) | 92 (2.2%) |
| 1 Vehicle | 563 (11.8%) | 628 (15.1%) |
| 2 Vehicles | 1,914 (40.2%) | 1,702 (40.8%) |
| 3 Vehicles | 1,028 (21.6%) | 877 (21.0%) |
| 4 Vehicles | 741 (15.5%) | 543 (13.0%) |
| 5 or more Vehicles | 332 (7.0%) | 327 (7.8%) |
| Total | 4,765 (100.0%) | 4,169 (100.0%) |
Commute Time in Perry County
The most frequently occuring commute durations in Perry County are 5 to 9 minutes (2,260 commuters, 26.0%), 10 to 14 minutes (1,415 commuters, 16.3%), and 15 to 19 minutes (1,227 commuters, 14.1%).
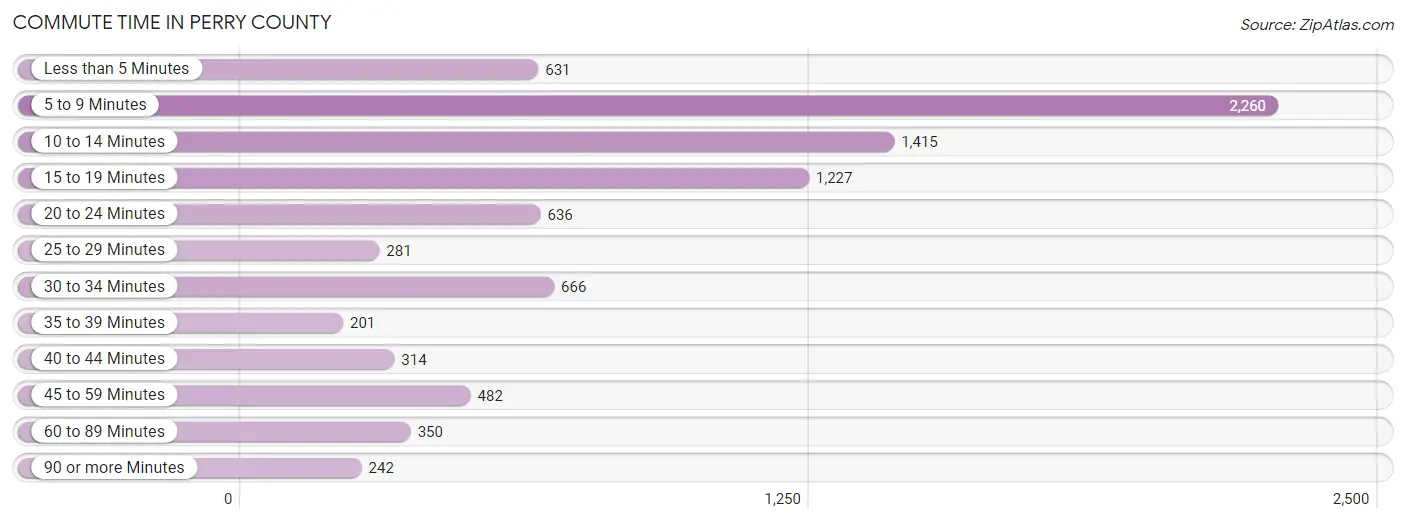
| Commute Time | # Commuters | % Commuters |
| Less than 5 Minutes | 631 | 7.2% |
| 5 to 9 Minutes | 2,260 | 26.0% |
| 10 to 14 Minutes | 1,415 | 16.3% |
| 15 to 19 Minutes | 1,227 | 14.1% |
| 20 to 24 Minutes | 636 | 7.3% |
| 25 to 29 Minutes | 281 | 3.2% |
| 30 to 34 Minutes | 666 | 7.6% |
| 35 to 39 Minutes | 201 | 2.3% |
| 40 to 44 Minutes | 314 | 3.6% |
| 45 to 59 Minutes | 482 | 5.5% |
| 60 to 89 Minutes | 350 | 4.0% |
| 90 or more Minutes | 242 | 2.8% |
Commute Time by Sex in Perry County
The most common commute times in Perry County are 5 to 9 minutes (1,298 commuters, 28.0%) for males and 5 to 9 minutes (962 commuters, 23.6%) for females.
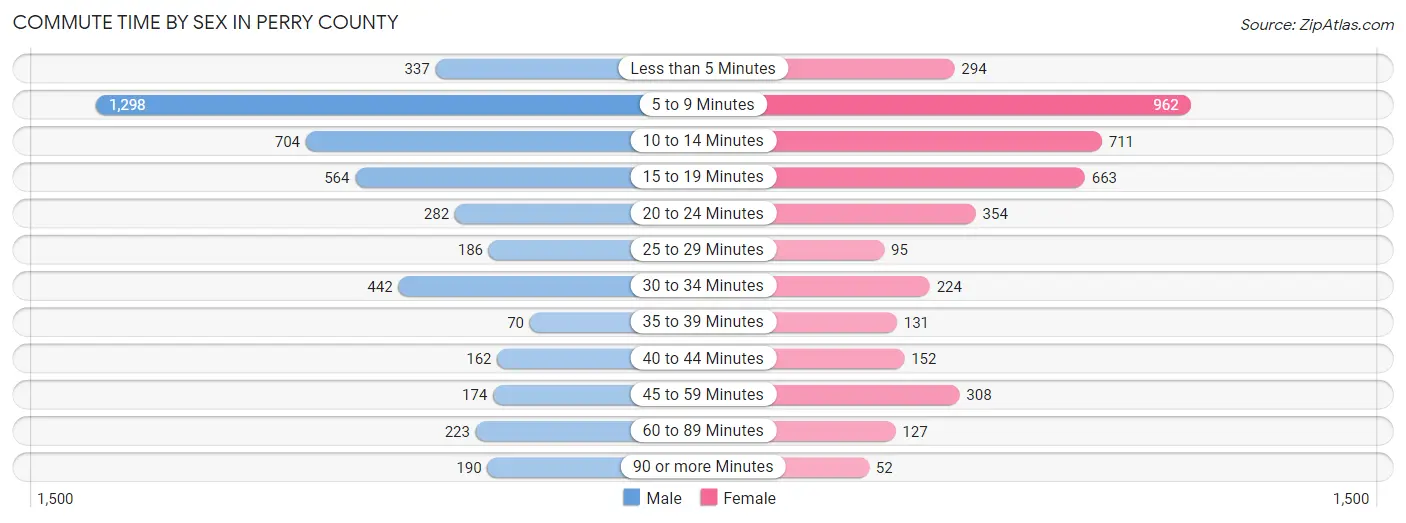
| Commute Time | Male | Female |
| Less than 5 Minutes | 337 (7.3%) | 294 (7.2%) |
| 5 to 9 Minutes | 1,298 (28.0%) | 962 (23.6%) |
| 10 to 14 Minutes | 704 (15.2%) | 711 (17.5%) |
| 15 to 19 Minutes | 564 (12.2%) | 663 (16.3%) |
| 20 to 24 Minutes | 282 (6.1%) | 354 (8.7%) |
| 25 to 29 Minutes | 186 (4.0%) | 95 (2.3%) |
| 30 to 34 Minutes | 442 (9.5%) | 224 (5.5%) |
| 35 to 39 Minutes | 70 (1.5%) | 131 (3.2%) |
| 40 to 44 Minutes | 162 (3.5%) | 152 (3.7%) |
| 45 to 59 Minutes | 174 (3.8%) | 308 (7.6%) |
| 60 to 89 Minutes | 223 (4.8%) | 127 (3.1%) |
| 90 or more Minutes | 190 (4.1%) | 52 (1.3%) |
Time of Departure to Work by Sex in Perry County
The most frequent times of departure to work in Perry County are 6:30 AM to 6:59 AM (736, 15.9%) for males and 7:00 AM to 7:29 AM (996, 24.4%) for females.
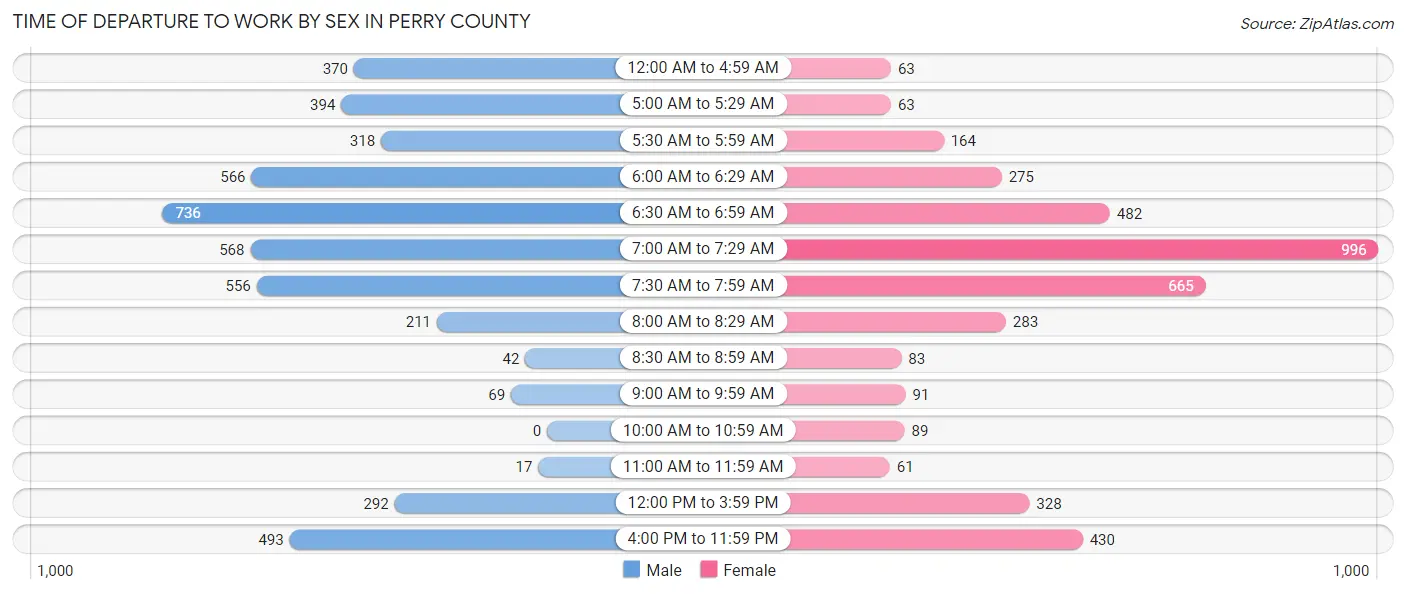
| Time of Departure | Male | Female |
| 12:00 AM to 4:59 AM | 370 (8.0%) | 63 (1.5%) |
| 5:00 AM to 5:29 AM | 394 (8.5%) | 63 (1.5%) |
| 5:30 AM to 5:59 AM | 318 (6.9%) | 164 (4.0%) |
| 6:00 AM to 6:29 AM | 566 (12.2%) | 275 (6.8%) |
| 6:30 AM to 6:59 AM | 736 (15.9%) | 482 (11.8%) |
| 7:00 AM to 7:29 AM | 568 (12.3%) | 996 (24.4%) |
| 7:30 AM to 7:59 AM | 556 (12.0%) | 665 (16.3%) |
| 8:00 AM to 8:29 AM | 211 (4.6%) | 283 (7.0%) |
| 8:30 AM to 8:59 AM | 42 (0.9%) | 83 (2.0%) |
| 9:00 AM to 9:59 AM | 69 (1.5%) | 91 (2.2%) |
| 10:00 AM to 10:59 AM | 0 (0.0%) | 89 (2.2%) |
| 11:00 AM to 11:59 AM | 17 (0.4%) | 61 (1.5%) |
| 12:00 PM to 3:59 PM | 292 (6.3%) | 328 (8.1%) |
| 4:00 PM to 11:59 PM | 493 (10.6%) | 430 (10.6%) |
| Total | 4,632 (100.0%) | 4,073 (100.0%) |
Housing Occupancy in Perry County
Occupancy by Ownership in Perry County
Of the total 7,329 dwellings in Perry County, owner-occupied units account for 5,693 (77.7%), while renter-occupied units make up 1,636 (22.3%).
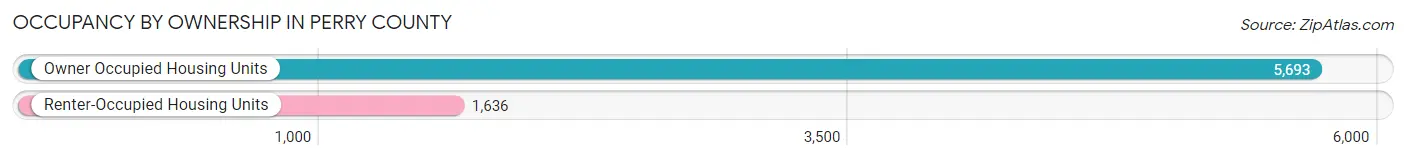
| Occupancy | # Housing Units | % Housing Units |
| Owner Occupied Housing Units | 5,693 | 77.7% |
| Renter-Occupied Housing Units | 1,636 | 22.3% |
| Total Occupied Housing Units | 7,329 | 100.0% |
Occupancy by Household Size in Perry County
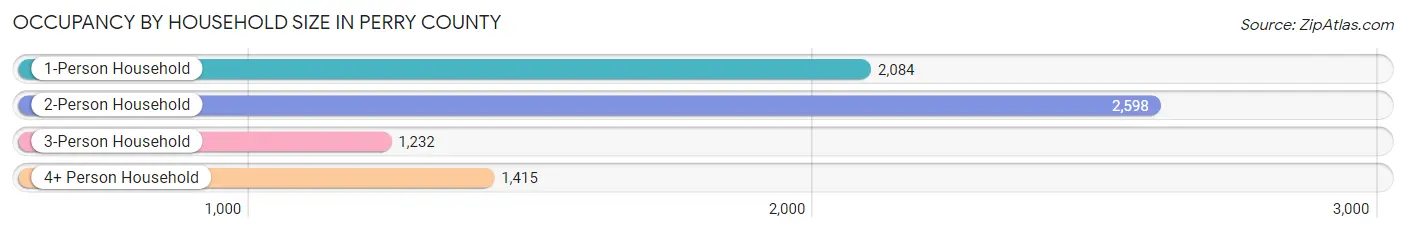
| Household Size | # Housing Units | % Housing Units |
| 1-Person Household | 2,084 | 28.4% |
| 2-Person Household | 2,598 | 35.4% |
| 3-Person Household | 1,232 | 16.8% |
| 4+ Person Household | 1,415 | 19.3% |
| Total Housing Units | 7,329 | 100.0% |
Occupancy by Ownership by Household Size in Perry County
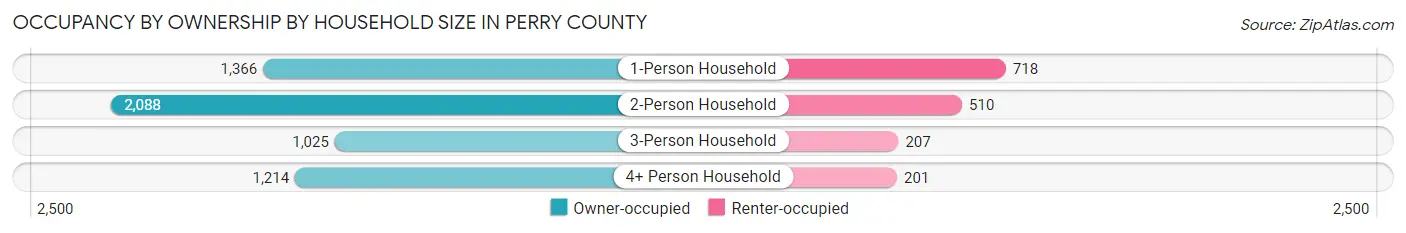
| Household Size | Owner-occupied | Renter-occupied |
| 1-Person Household | 1,366 (65.5%) | 718 (34.4%) |
| 2-Person Household | 2,088 (80.4%) | 510 (19.6%) |
| 3-Person Household | 1,025 (83.2%) | 207 (16.8%) |
| 4+ Person Household | 1,214 (85.8%) | 201 (14.2%) |
| Total Housing Units | 5,693 (77.7%) | 1,636 (22.3%) |
Occupancy by Educational Attainment in Perry County
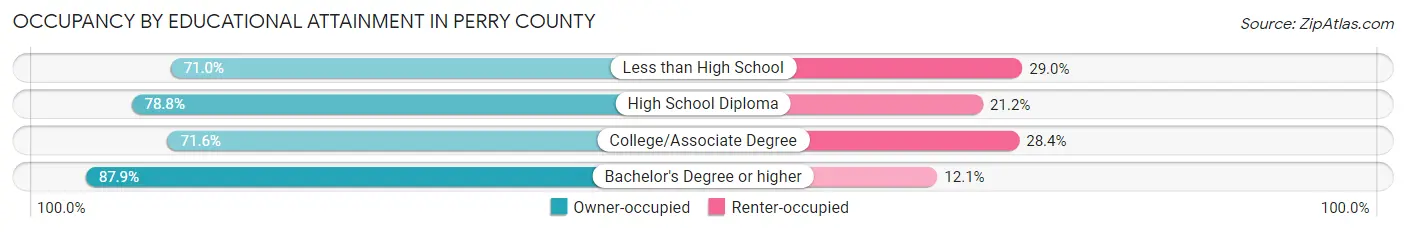
| Household Size | Owner-occupied | Renter-occupied |
| Less than High School | 738 (71.0%) | 301 (29.0%) |
| High School Diploma | 2,284 (78.8%) | 615 (21.2%) |
| College/Associate Degree | 1,361 (71.6%) | 539 (28.4%) |
| Bachelor's Degree or higher | 1,310 (87.9%) | 181 (12.1%) |
Occupancy by Age of Householder in Perry County
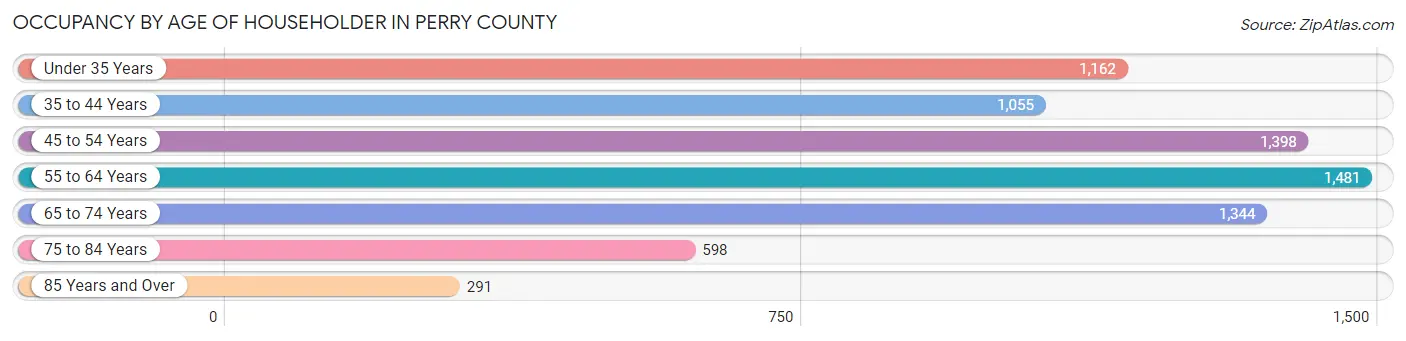
| Age Bracket | # Households | % Households |
| Under 35 Years | 1,162 | 15.9% |
| 35 to 44 Years | 1,055 | 14.4% |
| 45 to 54 Years | 1,398 | 19.1% |
| 55 to 64 Years | 1,481 | 20.2% |
| 65 to 74 Years | 1,344 | 18.3% |
| 75 to 84 Years | 598 | 8.2% |
| 85 Years and Over | 291 | 4.0% |
| Total | 7,329 | 100.0% |
Housing Finances in Perry County
Median Income by Occupancy in Perry County
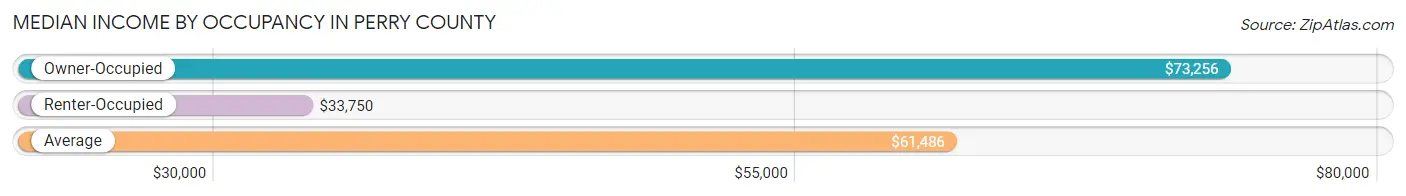
| Occupancy Type | # Households | Median Income |
| Owner-Occupied | 5,693 (77.7%) | $73,256 |
| Renter-Occupied | 1,636 (22.3%) | $33,750 |
| Average | 7,329 (100.0%) | $61,486 |
Occupancy by Householder Income Bracket in Perry County
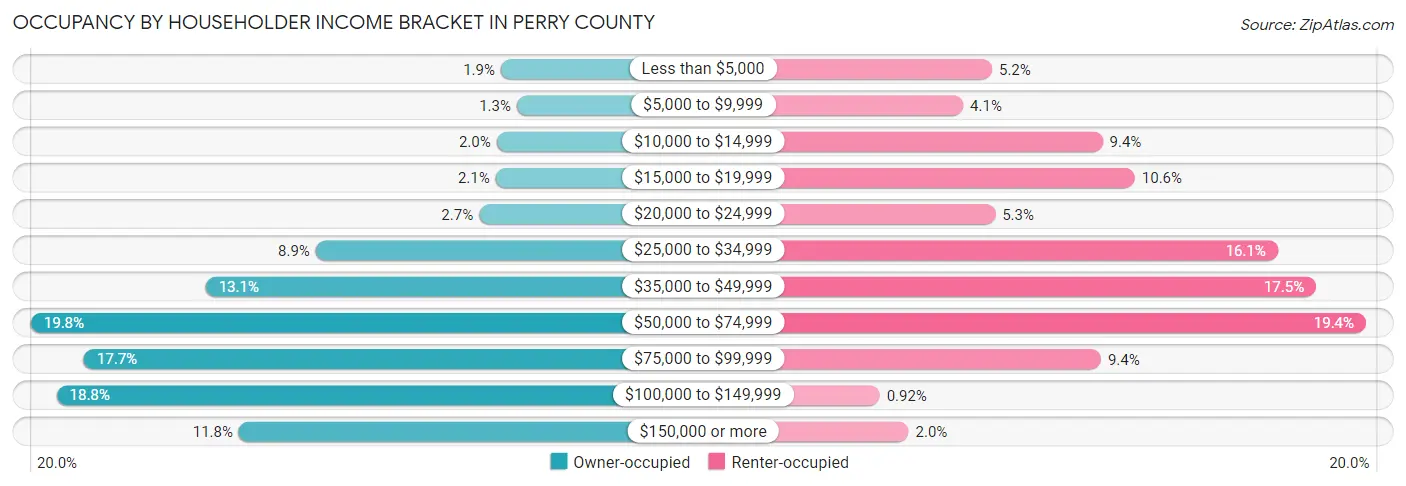
| Income Bracket | Owner-occupied | Renter-occupied |
| Less than $5,000 | 106 (1.9%) | 85 (5.2%) |
| $5,000 to $9,999 | 71 (1.3%) | 67 (4.1%) |
| $10,000 to $14,999 | 115 (2.0%) | 154 (9.4%) |
| $15,000 to $19,999 | 117 (2.1%) | 174 (10.6%) |
| $20,000 to $24,999 | 153 (2.7%) | 87 (5.3%) |
| $25,000 to $34,999 | 507 (8.9%) | 263 (16.1%) |
| $35,000 to $49,999 | 746 (13.1%) | 287 (17.5%) |
| $50,000 to $74,999 | 1,125 (19.8%) | 318 (19.4%) |
| $75,000 to $99,999 | 1,010 (17.7%) | 153 (9.3%) |
| $100,000 to $149,999 | 1,069 (18.8%) | 15 (0.9%) |
| $150,000 or more | 674 (11.8%) | 33 (2.0%) |
| Total | 5,693 (100.0%) | 1,636 (100.0%) |
Monthly Housing Cost Tiers in Perry County
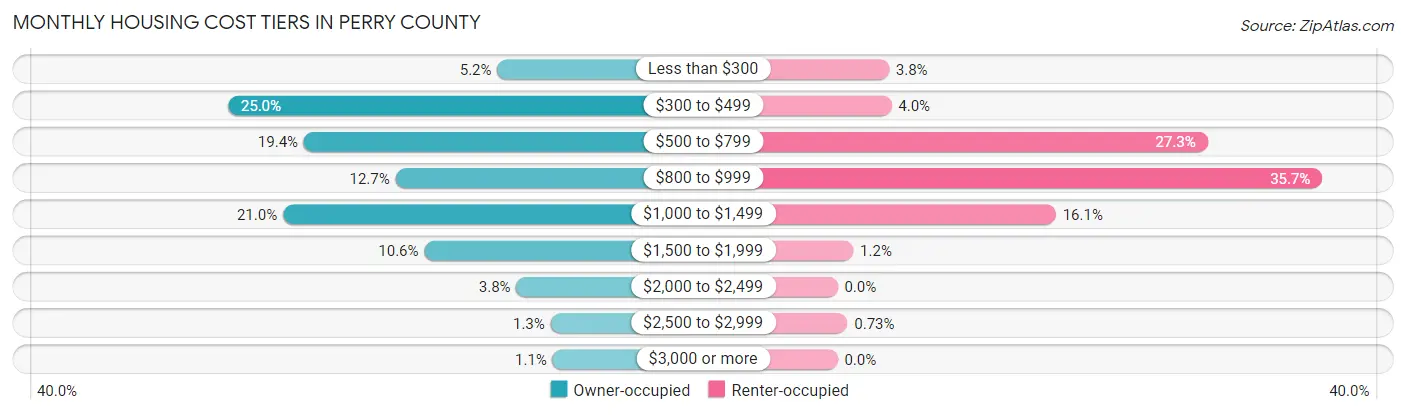
| Monthly Cost | Owner-occupied | Renter-occupied |
| Less than $300 | 295 (5.2%) | 62 (3.8%) |
| $300 to $499 | 1,425 (25.0%) | 65 (4.0%) |
| $500 to $799 | 1,106 (19.4%) | 446 (27.3%) |
| $800 to $999 | 722 (12.7%) | 584 (35.7%) |
| $1,000 to $1,499 | 1,194 (21.0%) | 263 (16.1%) |
| $1,500 to $1,999 | 601 (10.6%) | 19 (1.2%) |
| $2,000 to $2,499 | 215 (3.8%) | 0 (0.0%) |
| $2,500 to $2,999 | 72 (1.3%) | 12 (0.7%) |
| $3,000 or more | 63 (1.1%) | 0 (0.0%) |
| Total | 5,693 (100.0%) | 1,636 (100.0%) |
Physical Housing Characteristics in Perry County
Housing Structures in Perry County
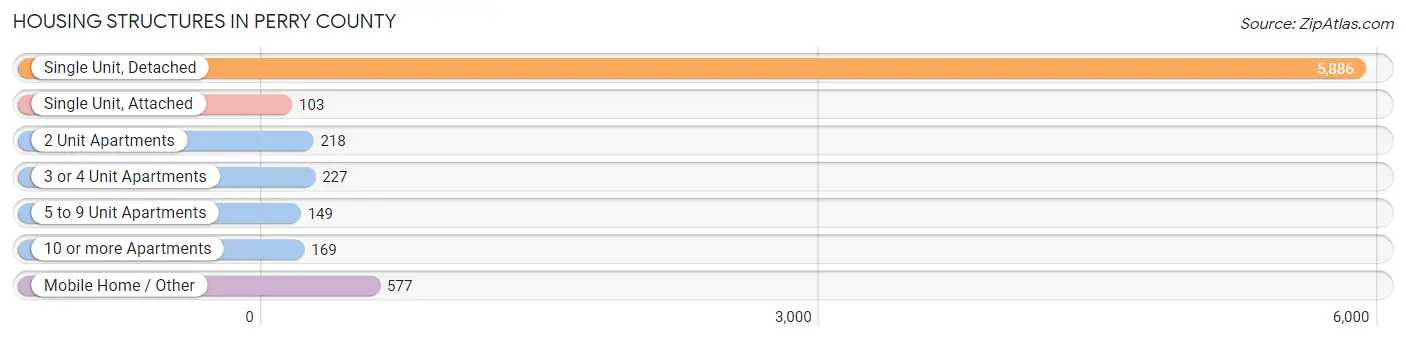
| Structure Type | # Housing Units | % Housing Units |
| Single Unit, Detached | 5,886 | 80.3% |
| Single Unit, Attached | 103 | 1.4% |
| 2 Unit Apartments | 218 | 3.0% |
| 3 or 4 Unit Apartments | 227 | 3.1% |
| 5 to 9 Unit Apartments | 149 | 2.0% |
| 10 or more Apartments | 169 | 2.3% |
| Mobile Home / Other | 577 | 7.9% |
| Total | 7,329 | 100.0% |
Housing Structures by Occupancy in Perry County
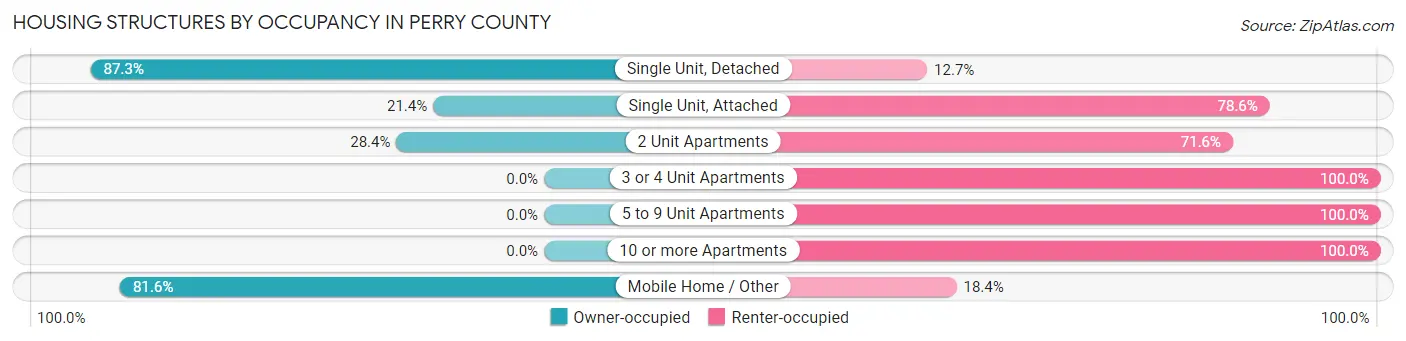
| Structure Type | Owner-occupied | Renter-occupied |
| Single Unit, Detached | 5,138 (87.3%) | 748 (12.7%) |
| Single Unit, Attached | 22 (21.4%) | 81 (78.6%) |
| 2 Unit Apartments | 62 (28.4%) | 156 (71.6%) |
| 3 or 4 Unit Apartments | 0 (0.0%) | 227 (100.0%) |
| 5 to 9 Unit Apartments | 0 (0.0%) | 149 (100.0%) |
| 10 or more Apartments | 0 (0.0%) | 169 (100.0%) |
| Mobile Home / Other | 471 (81.6%) | 106 (18.4%) |
| Total | 5,693 (77.7%) | 1,636 (22.3%) |
Housing Structures by Number of Rooms in Perry County
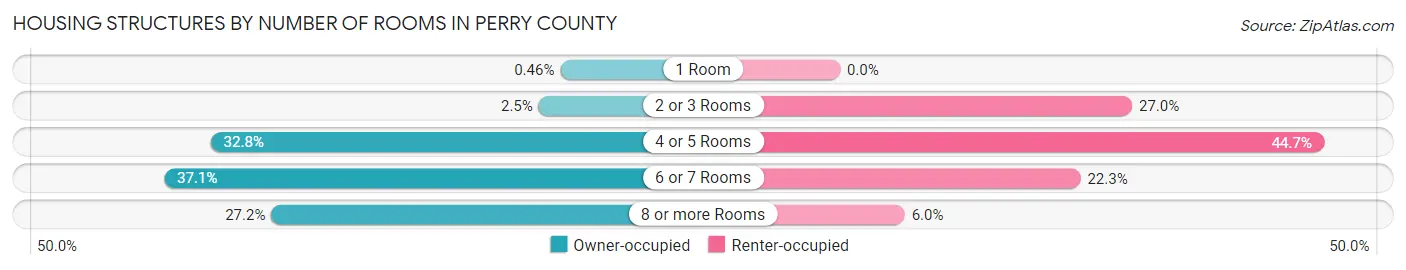
| Number of Rooms | Owner-occupied | Renter-occupied |
| 1 Room | 26 (0.5%) | 0 (0.0%) |
| 2 or 3 Rooms | 140 (2.5%) | 442 (27.0%) |
| 4 or 5 Rooms | 1,867 (32.8%) | 732 (44.7%) |
| 6 or 7 Rooms | 2,112 (37.1%) | 364 (22.3%) |
| 8 or more Rooms | 1,548 (27.2%) | 98 (6.0%) |
| Total | 5,693 (100.0%) | 1,636 (100.0%) |
Housing Structure by Heating Type in Perry County
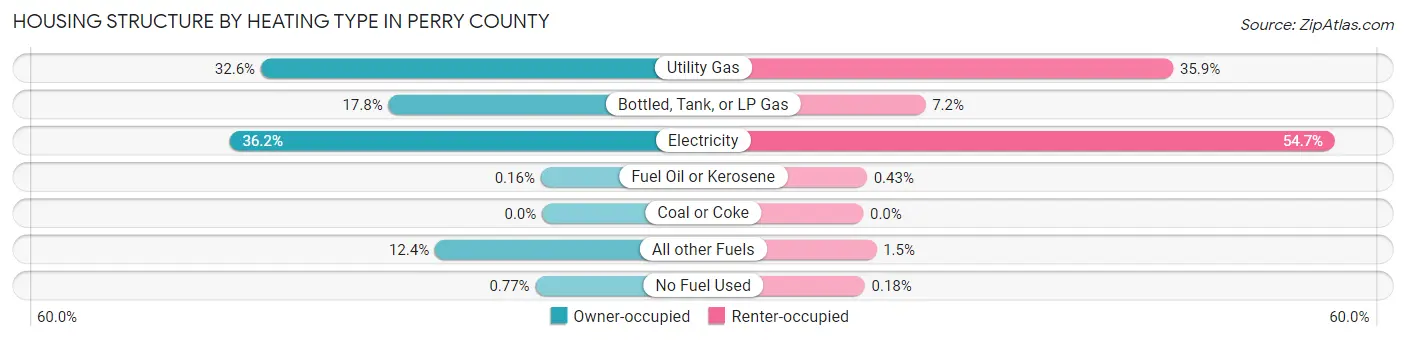
| Heating Type | Owner-occupied | Renter-occupied |
| Utility Gas | 1,856 (32.6%) | 588 (35.9%) |
| Bottled, Tank, or LP Gas | 1,014 (17.8%) | 118 (7.2%) |
| Electricity | 2,063 (36.2%) | 895 (54.7%) |
| Fuel Oil or Kerosene | 9 (0.2%) | 7 (0.4%) |
| Coal or Coke | 0 (0.0%) | 0 (0.0%) |
| All other Fuels | 707 (12.4%) | 25 (1.5%) |
| No Fuel Used | 44 (0.8%) | 3 (0.2%) |
| Total | 5,693 (100.0%) | 1,636 (100.0%) |
Household Vehicle Usage in Perry County
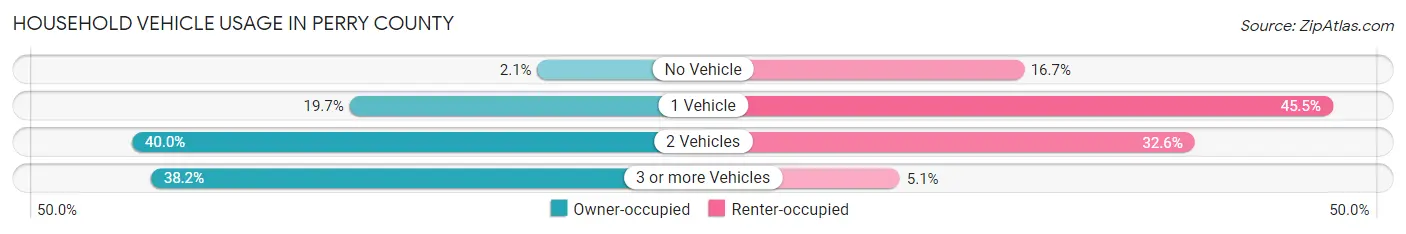
| Vehicles per Household | Owner-occupied | Renter-occupied |
| No Vehicle | 121 (2.1%) | 273 (16.7%) |
| 1 Vehicle | 1,120 (19.7%) | 745 (45.5%) |
| 2 Vehicles | 2,276 (40.0%) | 534 (32.6%) |
| 3 or more Vehicles | 2,176 (38.2%) | 84 (5.1%) |
| Total | 5,693 (100.0%) | 1,636 (100.0%) |
Real Estate & Mortgages in Perry County
Real Estate and Mortgage Overview in Perry County
| Characteristic | Without Mortgage | With Mortgage |
| Housing Units | 2,712 | 2,981 |
| Median Property Value | $176,500 | $182,600 |
| Median Household Income | $57,293 | $414 |
| Monthly Housing Costs | $466 | $55 |
| Real Estate Taxes | $1,389 | $42 |
Property Value by Mortgage Status in Perry County
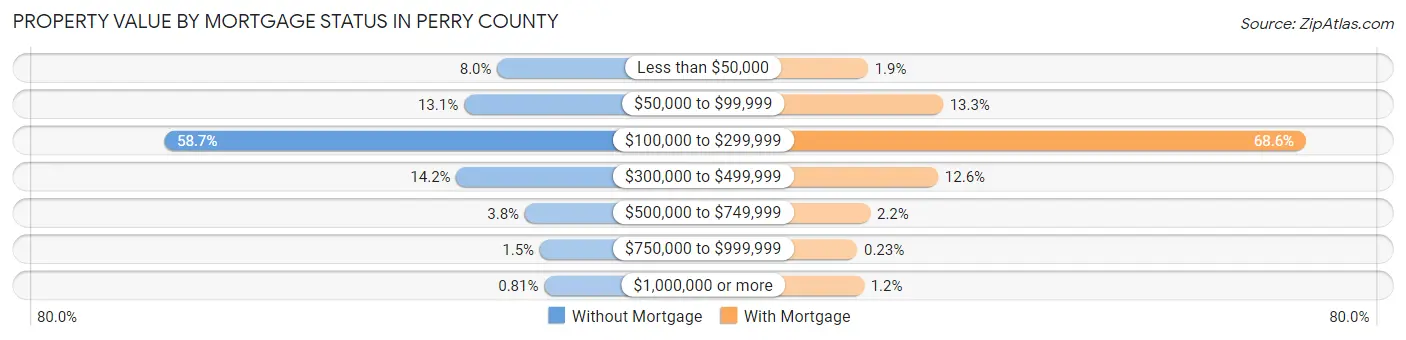
| Property Value | Without Mortgage | With Mortgage |
| Less than $50,000 | 216 (8.0%) | 55 (1.8%) |
| $50,000 to $99,999 | 354 (13.1%) | 396 (13.3%) |
| $100,000 to $299,999 | 1,593 (58.7%) | 2,046 (68.6%) |
| $300,000 to $499,999 | 385 (14.2%) | 374 (12.6%) |
| $500,000 to $749,999 | 102 (3.8%) | 66 (2.2%) |
| $750,000 to $999,999 | 40 (1.5%) | 7 (0.2%) |
| $1,000,000 or more | 22 (0.8%) | 37 (1.2%) |
| Total | 2,712 (100.0%) | 2,981 (100.0%) |
Household Income by Mortgage Status in Perry County
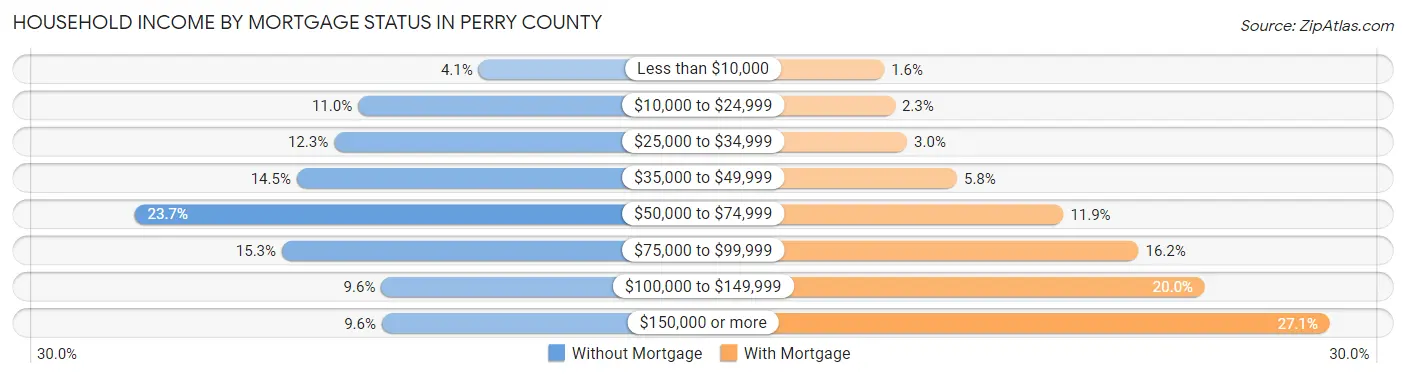
| Household Income | Without Mortgage | With Mortgage |
| Less than $10,000 | 110 (4.1%) | 49 (1.6%) |
| $10,000 to $24,999 | 297 (11.0%) | 67 (2.2%) |
| $25,000 to $34,999 | 334 (12.3%) | 88 (2.9%) |
| $35,000 to $49,999 | 392 (14.4%) | 173 (5.8%) |
| $50,000 to $74,999 | 643 (23.7%) | 354 (11.9%) |
| $75,000 to $99,999 | 415 (15.3%) | 482 (16.2%) |
| $100,000 to $149,999 | 261 (9.6%) | 595 (20.0%) |
| $150,000 or more | 260 (9.6%) | 808 (27.1%) |
| Total | 2,712 (100.0%) | 2,981 (100.0%) |
Property Value to Household Income Ratio in Perry County
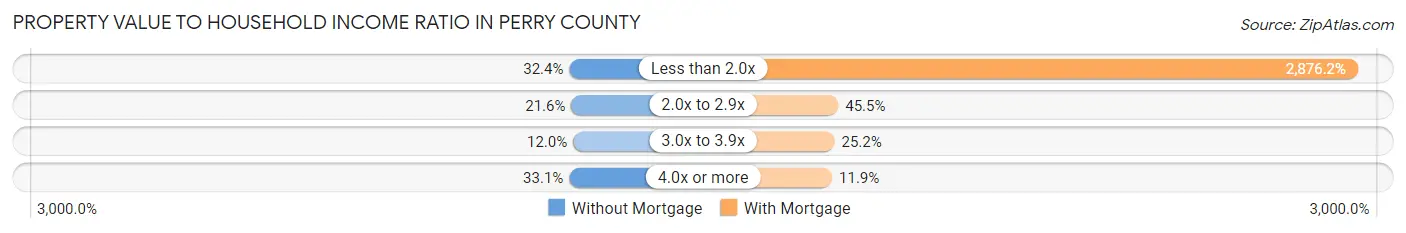
| Value-to-Income Ratio | Without Mortgage | With Mortgage |
| Less than 2.0x | 879 (32.4%) | 85,740 (2,876.2%) |
| 2.0x to 2.9x | 585 (21.6%) | 1,357 (45.5%) |
| 3.0x to 3.9x | 326 (12.0%) | 752 (25.2%) |
| 4.0x or more | 897 (33.1%) | 355 (11.9%) |
| Total | 2,712 (100.0%) | 2,981 (100.0%) |
Real Estate Taxes by Mortgage Status in Perry County
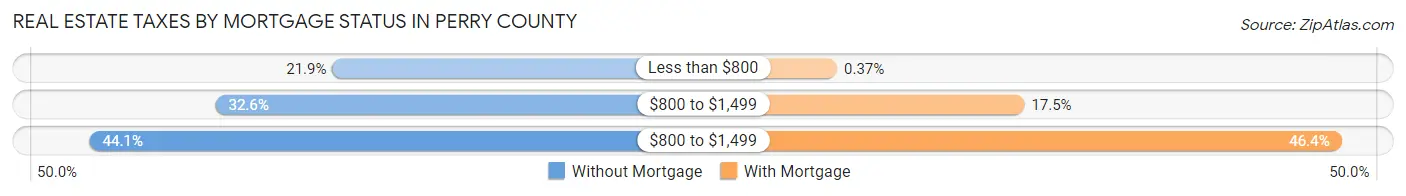
| Property Taxes | Without Mortgage | With Mortgage |
| Less than $800 | 594 (21.9%) | 11 (0.4%) |
| $800 to $1,499 | 883 (32.6%) | 521 (17.5%) |
| $800 to $1,499 | 1,195 (44.1%) | 1,384 (46.4%) |
| Total | 2,712 (100.0%) | 2,981 (100.0%) |
Health & Disability in Perry County
Health Insurance Coverage by Age in Perry County
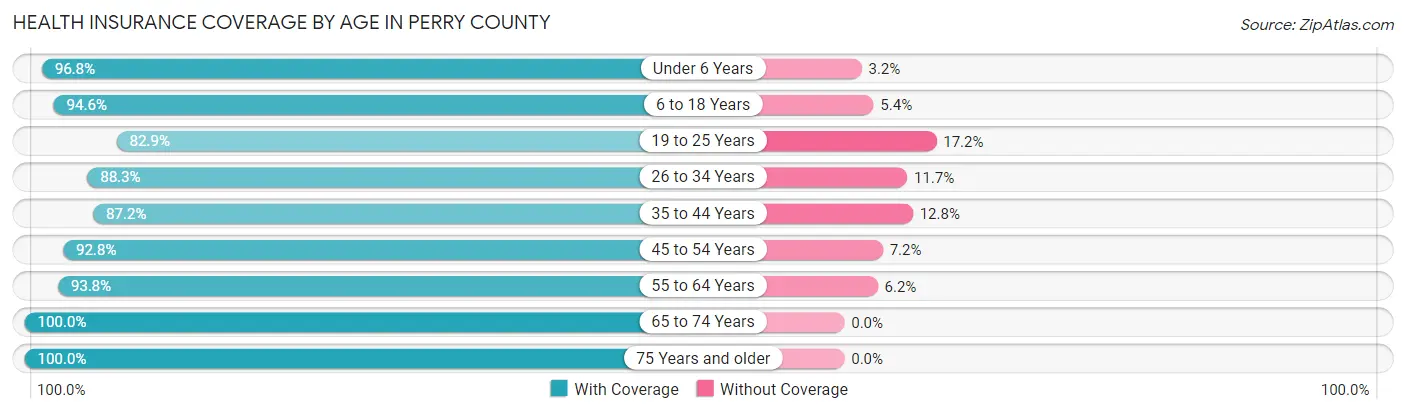
| Age Bracket | With Coverage | Without Coverage |
| Under 6 Years | 1,359 (96.8%) | 45 (3.2%) |
| 6 to 18 Years | 3,068 (94.6%) | 176 (5.4%) |
| 19 to 25 Years | 1,246 (82.9%) | 258 (17.2%) |
| 26 to 34 Years | 1,637 (88.3%) | 217 (11.7%) |
| 35 to 44 Years | 1,941 (87.2%) | 284 (12.8%) |
| 45 to 54 Years | 2,241 (92.8%) | 173 (7.2%) |
| 55 to 64 Years | 2,461 (93.8%) | 163 (6.2%) |
| 65 to 74 Years | 2,009 (100.0%) | 0 (0.0%) |
| 75 Years and older | 1,376 (100.0%) | 0 (0.0%) |
| Total | 17,338 (92.9%) | 1,316 (7.0%) |
Health Insurance Coverage by Citizenship Status in Perry County
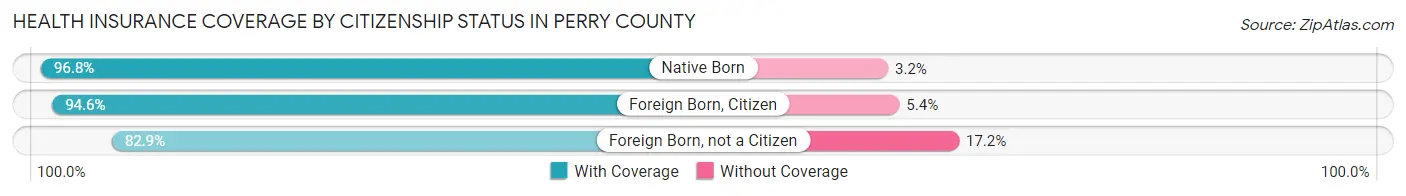
| Citizenship Status | With Coverage | Without Coverage |
| Native Born | 1,359 (96.8%) | 45 (3.2%) |
| Foreign Born, Citizen | 3,068 (94.6%) | 176 (5.4%) |
| Foreign Born, not a Citizen | 1,246 (82.9%) | 258 (17.2%) |
Health Insurance Coverage by Household Income in Perry County
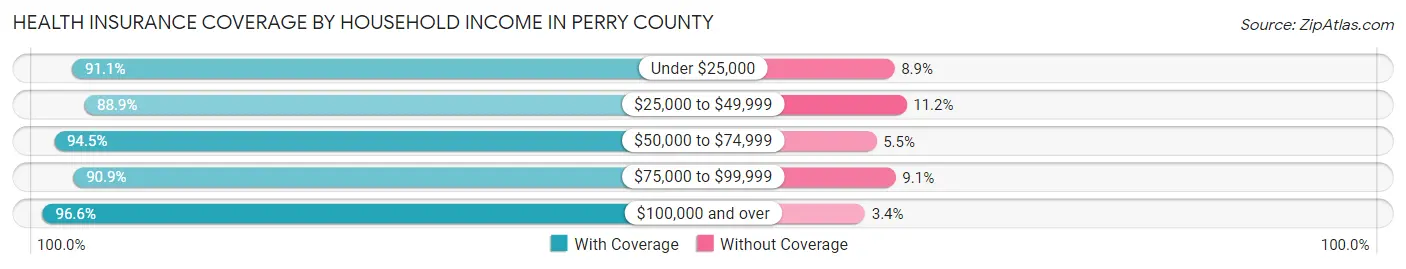
| Household Income | With Coverage | Without Coverage |
| Under $25,000 | 1,619 (91.1%) | 158 (8.9%) |
| $25,000 to $49,999 | 3,458 (88.8%) | 434 (11.2%) |
| $50,000 to $74,999 | 2,986 (94.5%) | 174 (5.5%) |
| $75,000 to $99,999 | 3,151 (90.9%) | 316 (9.1%) |
| $100,000 and over | 6,078 (96.6%) | 212 (3.4%) |
Public vs Private Health Insurance Coverage by Age in Perry County
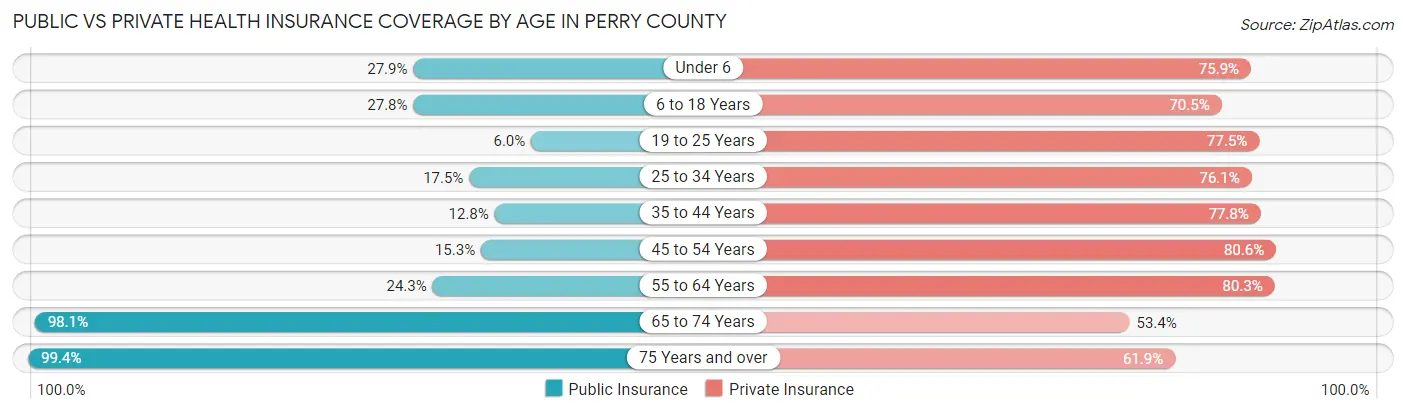
| Age Bracket | Public Insurance | Private Insurance |
| Under 6 | 391 (27.9%) | 1,066 (75.9%) |
| 6 to 18 Years | 903 (27.8%) | 2,286 (70.5%) |
| 19 to 25 Years | 90 (6.0%) | 1,165 (77.5%) |
| 25 to 34 Years | 324 (17.5%) | 1,410 (76.0%) |
| 35 to 44 Years | 284 (12.8%) | 1,730 (77.7%) |
| 45 to 54 Years | 369 (15.3%) | 1,946 (80.6%) |
| 55 to 64 Years | 637 (24.3%) | 2,108 (80.3%) |
| 65 to 74 Years | 1,971 (98.1%) | 1,073 (53.4%) |
| 75 Years and over | 1,367 (99.4%) | 851 (61.9%) |
| Total | 6,336 (34.0%) | 13,635 (73.1%) |
Disability Status by Sex by Age in Perry County
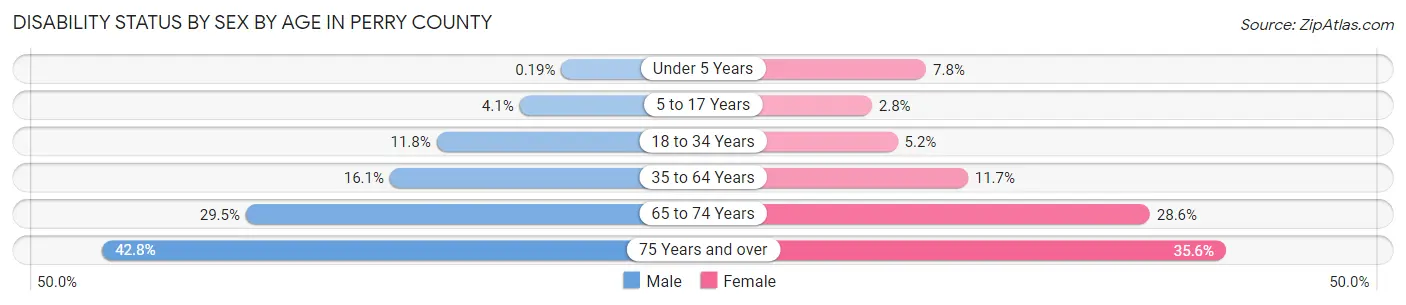
| Age Bracket | Male | Female |
| Under 5 Years | 1 (0.2%) | 39 (7.8%) |
| 5 to 17 Years | 68 (4.1%) | 46 (2.8%) |
| 18 to 34 Years | 216 (11.8%) | 94 (5.2%) |
| 35 to 64 Years | 584 (16.1%) | 425 (11.7%) |
| 65 to 74 Years | 290 (29.5%) | 293 (28.6%) |
| 75 Years and over | 261 (42.8%) | 273 (35.6%) |
Disability Class by Sex by Age in Perry County
Disability Class: Hearing Difficulty
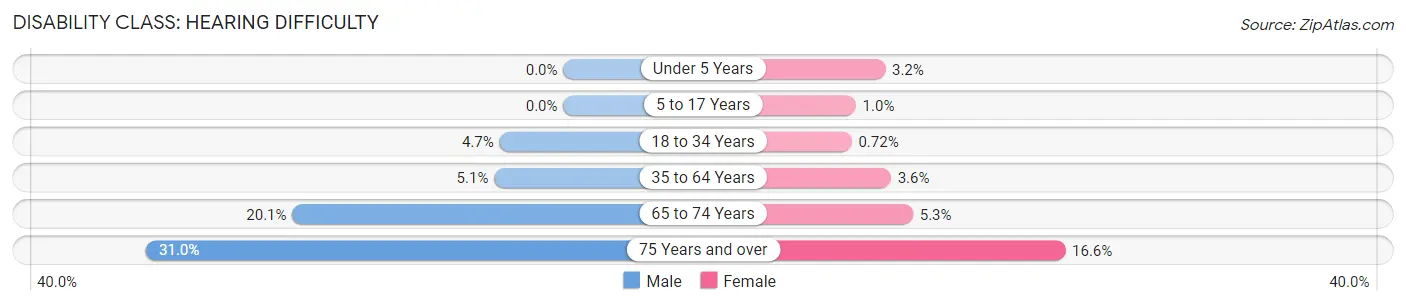
| Age Bracket | Male | Female |
| Under 5 Years | 0 (0.0%) | 16 (3.2%) |
| 5 to 17 Years | 0 (0.0%) | 17 (1.0%) |
| 18 to 34 Years | 87 (4.7%) | 13 (0.7%) |
| 35 to 64 Years | 186 (5.1%) | 132 (3.6%) |
| 65 to 74 Years | 198 (20.1%) | 54 (5.3%) |
| 75 Years and over | 189 (31.0%) | 127 (16.6%) |
Disability Class: Vision Difficulty
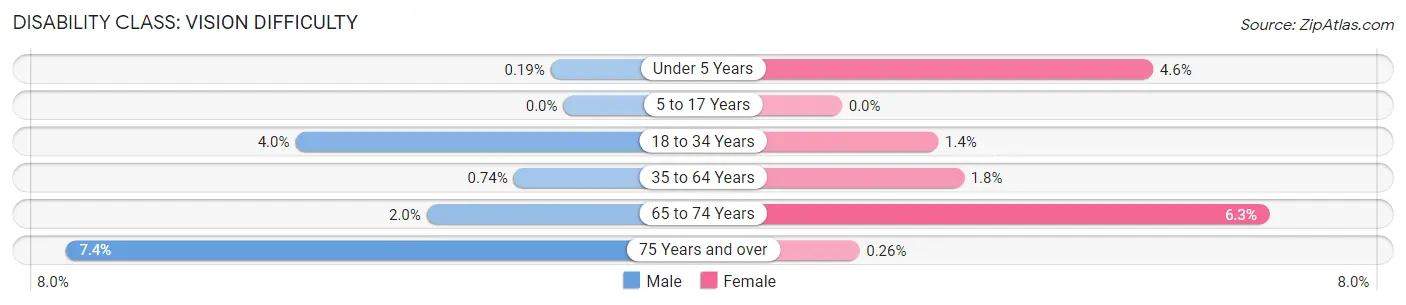
| Age Bracket | Male | Female |
| Under 5 Years | 1 (0.2%) | 23 (4.6%) |
| 5 to 17 Years | 0 (0.0%) | 0 (0.0%) |
| 18 to 34 Years | 73 (4.0%) | 26 (1.4%) |
| 35 to 64 Years | 27 (0.7%) | 66 (1.8%) |
| 65 to 74 Years | 20 (2.0%) | 65 (6.3%) |
| 75 Years and over | 45 (7.4%) | 2 (0.3%) |
Disability Class: Cognitive Difficulty
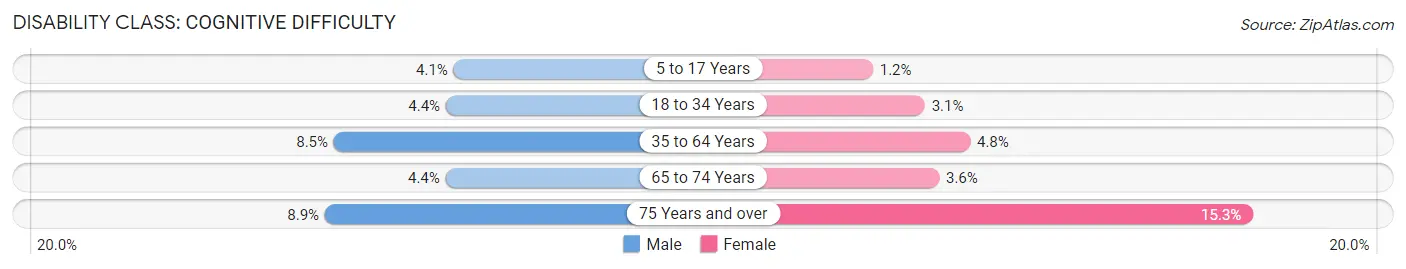
| Age Bracket | Male | Female |
| 5 to 17 Years | 68 (4.1%) | 19 (1.1%) |
| 18 to 34 Years | 80 (4.4%) | 56 (3.1%) |
| 35 to 64 Years | 309 (8.5%) | 173 (4.8%) |
| 65 to 74 Years | 43 (4.4%) | 37 (3.6%) |
| 75 Years and over | 54 (8.8%) | 117 (15.3%) |
Disability Class: Ambulatory Difficulty
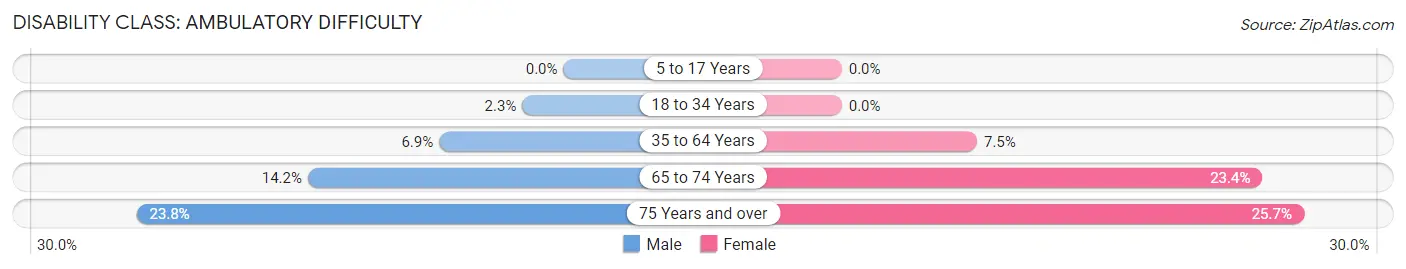
| Age Bracket | Male | Female |
| 5 to 17 Years | 0 (0.0%) | 0 (0.0%) |
| 18 to 34 Years | 42 (2.3%) | 0 (0.0%) |
| 35 to 64 Years | 251 (6.9%) | 274 (7.5%) |
| 65 to 74 Years | 140 (14.2%) | 240 (23.4%) |
| 75 Years and over | 145 (23.8%) | 197 (25.7%) |
Disability Class: Self-Care Difficulty
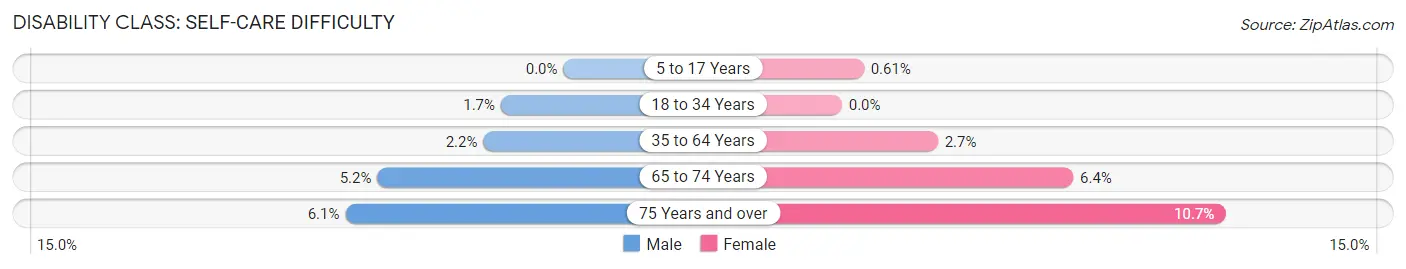
| Age Bracket | Male | Female |
| 5 to 17 Years | 0 (0.0%) | 10 (0.6%) |
| 18 to 34 Years | 32 (1.7%) | 0 (0.0%) |
| 35 to 64 Years | 81 (2.2%) | 97 (2.7%) |
| 65 to 74 Years | 51 (5.2%) | 66 (6.4%) |
| 75 Years and over | 37 (6.1%) | 82 (10.7%) |
Technology Access in Perry County
Computing Device Access in Perry County
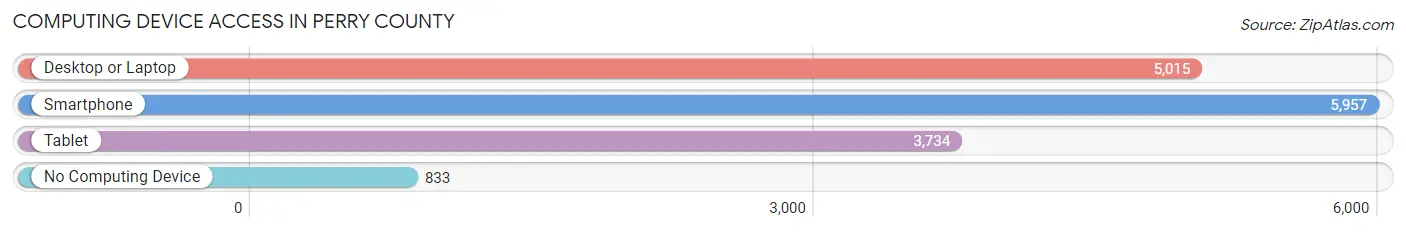
| Device Type | # Households | % Households |
| Desktop or Laptop | 5,015 | 68.4% |
| Smartphone | 5,957 | 81.3% |
| Tablet | 3,734 | 50.9% |
| No Computing Device | 833 | 11.4% |
| Total | 7,329 | 100.0% |
Internet Access in Perry County
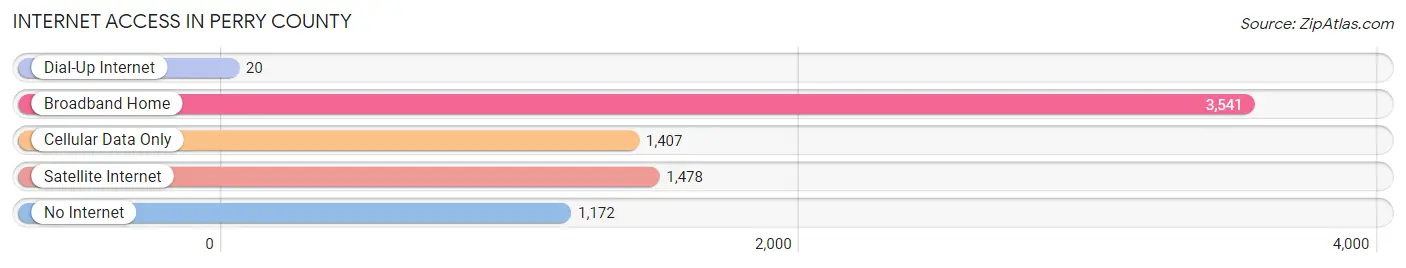
| Internet Type | # Households | % Households |
| Dial-Up Internet | 20 | 0.3% |
| Broadband Home | 3,541 | 48.3% |
| Cellular Data Only | 1,407 | 19.2% |
| Satellite Internet | 1,478 | 20.2% |
| No Internet | 1,172 | 16.0% |
| Total | 7,329 | 100.0% |
Perry County Summary
Perry County is located in the southeastern corner of Missouri, and is part of the St. Louis Metropolitan Statistical Area. The county was established in 1820 and named after Commodore Oliver Hazard Perry, a hero of the War of 1812. As of the 2010 census, the population was 18,971, making it the fourth least populous county in Missouri.
Geography
Perry County is located in the southeastern corner of Missouri, and is bordered by Cape Girardeau County to the north, Bollinger County to the east, St. Francois County to the south, and Madison County to the west. The county has a total area of 517 square miles, of which 515 square miles is land and 2.2 square miles is water. The highest point in the county is located at the intersection of County Road 514 and County Road 515, at an elevation of 1,039 feet.
The county is divided into two distinct regions: the Ozark Plateau in the north and the Mississippi Alluvial Plain in the south. The Ozark Plateau is characterized by rolling hills and valleys, while the Mississippi Alluvial Plain is characterized by flat, fertile farmland. The county is home to several rivers and streams, including the Big River, the Castor River, and the Whitewater River.
Demographics
As of the 2010 census, there were 18,971 people, 7,541 households, and 5,092 families residing in the county. The population density was 37 people per square mile. There were 8,541 housing units at an average density of 17 per square mile. The racial makeup of the county was 97.2% White, 0.7% Black or African American, 0.3% Native American, 0.2% Asian, 0.1% Pacific Islander, 0.3% from other races, and 1.2% from two or more races. 1.7% of the population were Hispanic or Latino of any race.
There were 7,541 households, out of which 30.2% had children under the age of 18 living with them, 54.2% were married couples living together, 10.2% had a female householder with no husband present, and 30.7% were non-families. 26.2% of all households were made up of individuals, and 12.2% had someone living alone who was 65 years of age or older. The average household size was 2.48 and the average family size was 2.98.
The median income for a household in the county was $35,945, and the median income for a family was $43,945. Males had a median income of $31,945 versus $22,945 for females. The per capita income for the county was $17,945. About 11.2% of families and 14.2% of the population were below the poverty line, including 19.2% of those under age 18 and 11.2% of those age 65 or over.
Economy
Perry County is largely rural, and the economy is largely based on agriculture. The county is home to several large farms, and the main crops grown are corn, soybeans, and wheat. The county is also home to several small businesses, including restaurants, retail stores, and service providers.
The county is home to several large employers, including Perry County Memorial Hospital, Perry County Schools, and Perry County Sheriff's Office. The county is also home to several small businesses, including restaurants, retail stores, and service providers.
The county is served by two airports: Perryville Regional Airport and Perry County Airport. The county is also served by several highways, including Interstate 55, U.S. Route 61, and Missouri Route 51.
Conclusion
Perry County is a rural county located in the southeastern corner of Missouri. The county is home to 18,971 people, and the economy is largely based on agriculture. The county is served by two airports, several highways, and several large and small businesses.
Common Questions
What is Per Capita Income in Perry County?
Per Capita income in Perry County is $30,731.
What is the Median Family Income in Perry County?
Median Family Income in Perry County is $78,134.
What is the Median Household income in Perry County?
Median Household Income in Perry County is $61,486.
What is Income or Wage Gap in Perry County?
Income or Wage Gap in Perry County is 22.7%.
Women in Perry County earn 77.3 cents for every dollar earned by a man.
What is Family Income Deficit in Perry County?
Family Income Deficit in Perry County is $10,983.
Families that are below poverty line in Perry County earn $10,983 less on average than the poverty threshold level.
What is Inequality or Gini Index in Perry County?
Inequality or Gini Index in Perry County is 0.42.
What is the Total Population of Perry County?
Total Population of Perry County is 18,970.
What is the Total Male Population of Perry County?
Total Male Population of Perry County is 9,415.
What is the Total Female Population of Perry County?
Total Female Population of Perry County is 9,555.
What is the Ratio of Males per 100 Females in Perry County?
There are 98.53 Males per 100 Females in Perry County.
What is the Ratio of Females per 100 Males in Perry County?
There are 101.49 Females per 100 Males in Perry County.
What is the Median Population Age in Perry County?
Median Population Age in Perry County is 41.4 Years.
What is the Average Family Size in Perry County
Average Family Size in Perry County is 3.1 People.
What is the Average Household Size in Perry County
Average Household Size in Perry County is 2.5 People.
How Large is the Labor Force in Perry County?
There are 9,608 People in the Labor Forcein in Perry County.
What is the Percentage of People in the Labor Force in Perry County?
63.2% of People are in the Labor Force in Perry County.
What is the Unemployment Rate in Perry County?
Unemployment Rate in Perry County is 5.1%.