Pemiscot County, MO Map & Demographics
Pemiscot County Overview
$24,295
PER CAPITA INCOME
$50,797
AVG FAMILY INCOME
$37,426
AVG HOUSEHOLD INCOME
47.3%
WAGE / INCOME GAP [ % ]
52.7¢/ $1
WAGE / INCOME GAP [ $ ]
$13,275
FAMILY INCOME DEFICIT
0.50
INEQUALITY / GINI INDEX
15,555
TOTAL POPULATION
7,304
MALE POPULATION
8,251
FEMALE POPULATION
88.52
MALES / 100 FEMALES
112.97
FEMALES / 100 MALES
39.2
MEDIAN AGE
3.1
AVG FAMILY SIZE
2.5
AVG HOUSEHOLD SIZE
6,163
LABOR FORCE [ PEOPLE ]
51.1%
PERCENT IN LABOR FORCE
9.6%
UNEMPLOYMENT RATE
Pemiscot County Area Codes
Income in Pemiscot County
Income Overview in Pemiscot County
Per Capita Income in Pemiscot County is $24,295, while median incomes of families and households are $50,797 and $37,426 respectively.
| Characteristic | Number | Measure |
| Per Capita Income | 15,555 | $24,295 |
| Median Family Income | 3,910 | $50,797 |
| Mean Family Income | 3,910 | $72,158 |
| Median Household Income | 6,275 | $37,426 |
| Mean Household Income | 6,275 | $59,683 |
| Income Deficit | 3,910 | $13,275 |
| Wage / Income Gap (%) | 15,555 | 47.31% |
| Wage / Income Gap ($) | 15,555 | 52.69¢ per $1 |
| Gini / Inequality Index | 15,555 | 0.50 |
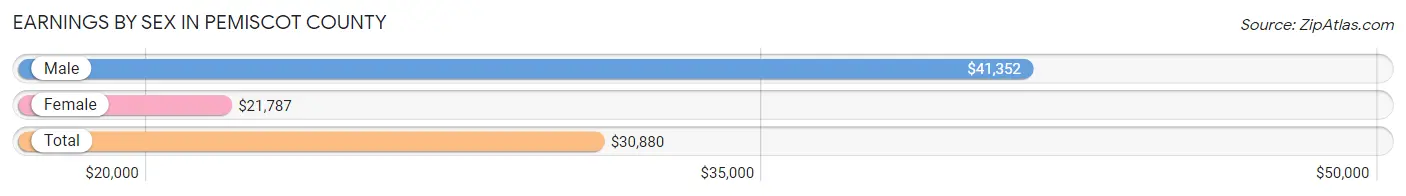
Earnings by Sex in Pemiscot County
Average Earnings in Pemiscot County are $30,880, $41,352 for men and $21,787 for women, a difference of 47.3%.
| Sex | Number | Average Earnings |
| Male | 3,084 (48.9%) | $41,352 |
| Female | 3,222 (51.1%) | $21,787 |
| Total | 6,306 (100.0%) | $30,880 |
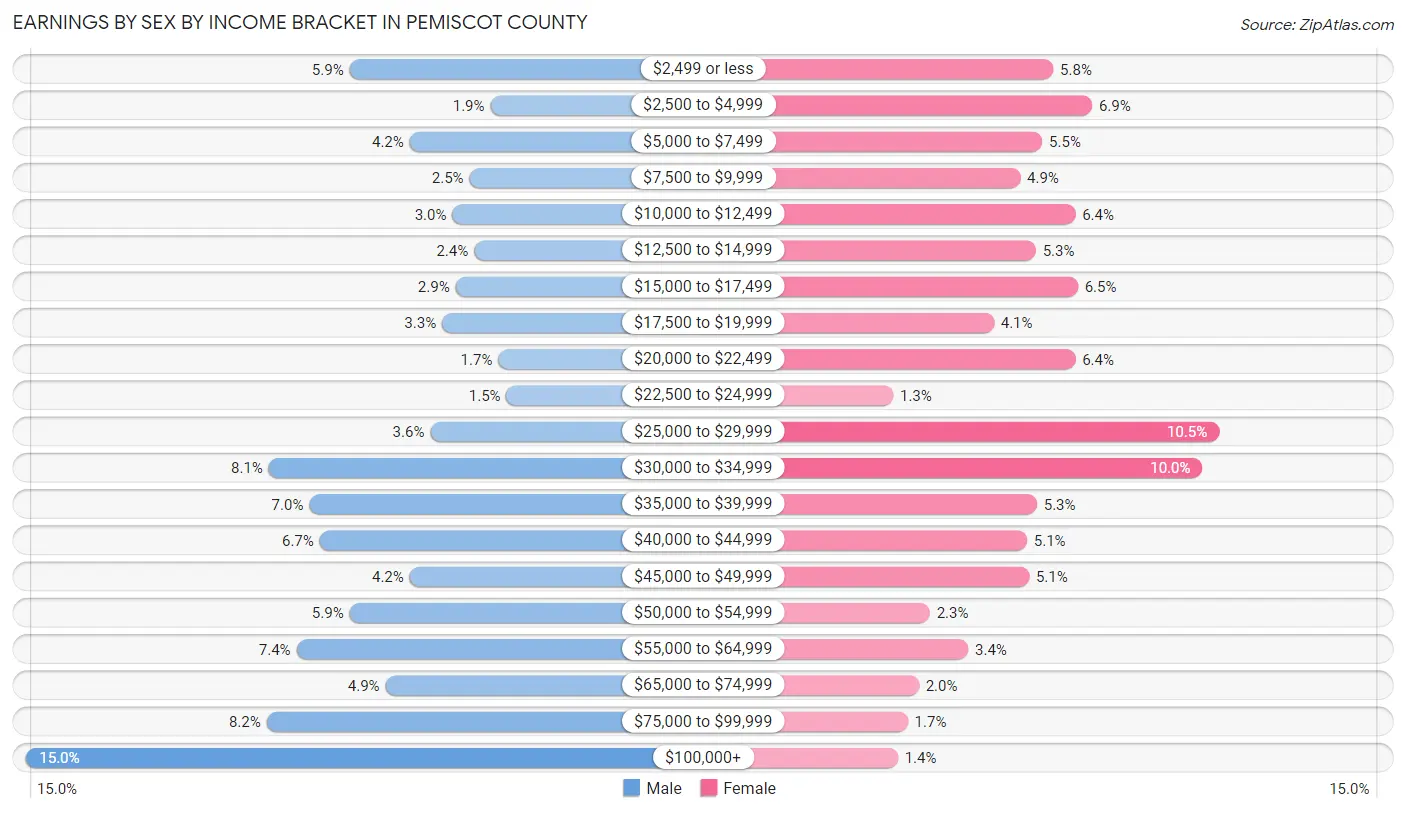
Earnings by Sex by Income Bracket in Pemiscot County
The most common earnings brackets in Pemiscot County are $100,000+ for men (461 | 14.9%) and $25,000 to $29,999 for women (337 | 10.5%).
| Income | Male | Female |
| $2,499 or less | 181 (5.9%) | 187 (5.8%) |
| $2,500 to $4,999 | 59 (1.9%) | 222 (6.9%) |
| $5,000 to $7,499 | 129 (4.2%) | 177 (5.5%) |
| $7,500 to $9,999 | 77 (2.5%) | 157 (4.9%) |
| $10,000 to $12,499 | 92 (3.0%) | 207 (6.4%) |
| $12,500 to $14,999 | 73 (2.4%) | 171 (5.3%) |
| $15,000 to $17,499 | 89 (2.9%) | 209 (6.5%) |
| $17,500 to $19,999 | 101 (3.3%) | 133 (4.1%) |
| $20,000 to $22,499 | 52 (1.7%) | 207 (6.4%) |
| $22,500 to $24,999 | 45 (1.5%) | 42 (1.3%) |
| $25,000 to $29,999 | 111 (3.6%) | 337 (10.5%) |
| $30,000 to $34,999 | 251 (8.1%) | 322 (10.0%) |
| $35,000 to $39,999 | 216 (7.0%) | 172 (5.3%) |
| $40,000 to $44,999 | 207 (6.7%) | 163 (5.1%) |
| $45,000 to $49,999 | 129 (4.2%) | 165 (5.1%) |
| $50,000 to $54,999 | 181 (5.9%) | 75 (2.3%) |
| $55,000 to $64,999 | 227 (7.4%) | 110 (3.4%) |
| $65,000 to $74,999 | 150 (4.9%) | 65 (2.0%) |
| $75,000 to $99,999 | 253 (8.2%) | 55 (1.7%) |
| $100,000+ | 461 (14.9%) | 46 (1.4%) |
| Total | 3,084 (100.0%) | 3,222 (100.0%) |
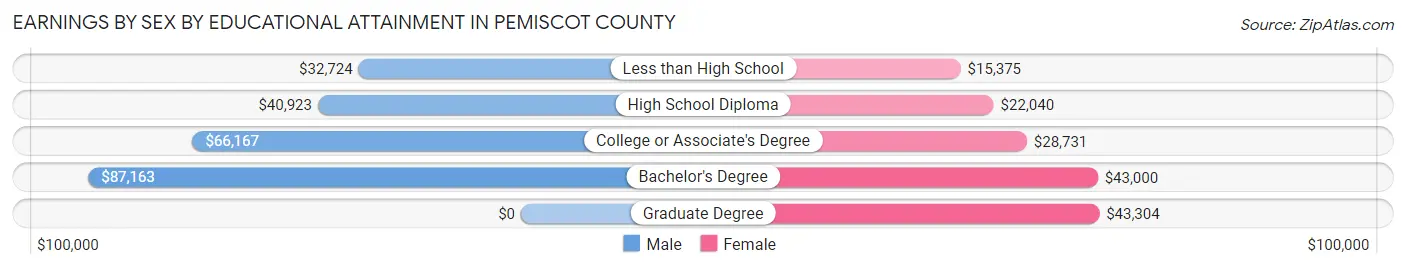
Earnings by Sex by Educational Attainment in Pemiscot County
Average earnings in Pemiscot County are $46,495 for men and $26,250 for women, a difference of 43.5%. Men with an educational attainment of bachelor's degree enjoy the highest average annual earnings of $87,163, while those with less than high school education earn the least with $32,724. Women with an educational attainment of graduate degree earn the most with the average annual earnings of $43,304, while those with less than high school education have the smallest earnings of $15,375.
| Educational Attainment | Male Income | Female Income |
| Less than High School | $32,724 | $15,375 |
| High School Diploma | $40,923 | $22,040 |
| College or Associate's Degree | $66,167 | $28,731 |
| Bachelor's Degree | $87,163 | $43,000 |
| Graduate Degree | - | - |
| Total | $46,495 | $26,250 |
Family Income in Pemiscot County
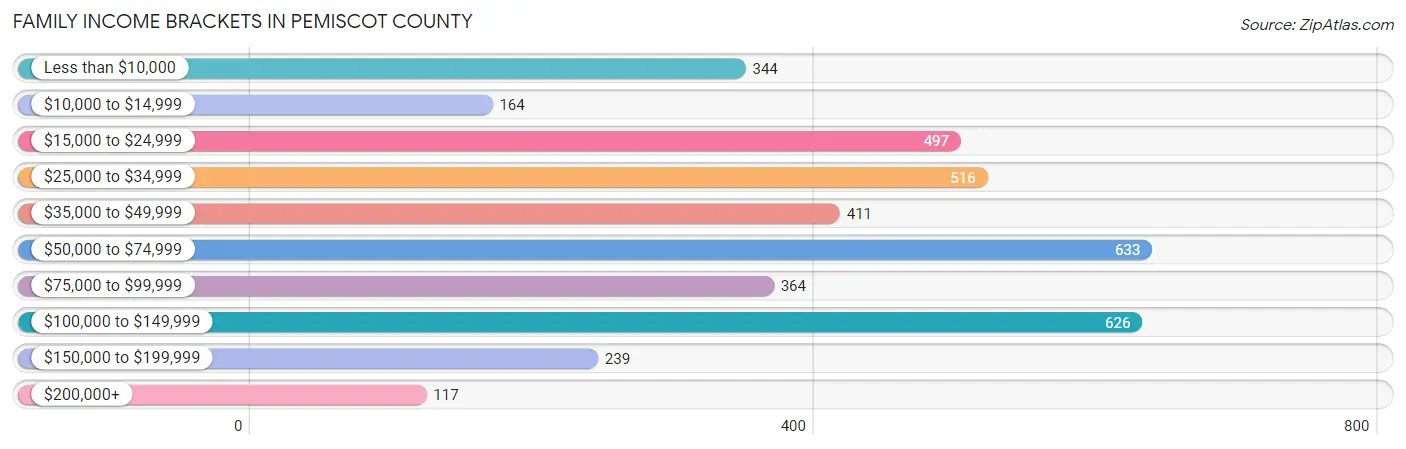
Family Income Brackets in Pemiscot County
According to the Pemiscot County family income data, there are 633 families falling into the $50,000 to $74,999 income range, which is the most common income bracket and makes up 16.2% of all families. Conversely, the $200,000+ income bracket is the least frequent group with only 117 families (3.0%) belonging to this category.
| Income Bracket | # Families | % Families |
| Less than $10,000 | 344 | 8.8% |
| $10,000 to $14,999 | 164 | 4.2% |
| $15,000 to $24,999 | 497 | 12.7% |
| $25,000 to $34,999 | 516 | 13.2% |
| $35,000 to $49,999 | 411 | 10.5% |
| $50,000 to $74,999 | 633 | 16.2% |
| $75,000 to $99,999 | 364 | 9.3% |
| $100,000 to $149,999 | 626 | 16.0% |
| $150,000 to $199,999 | 239 | 6.1% |
| $200,000+ | 117 | 3.0% |
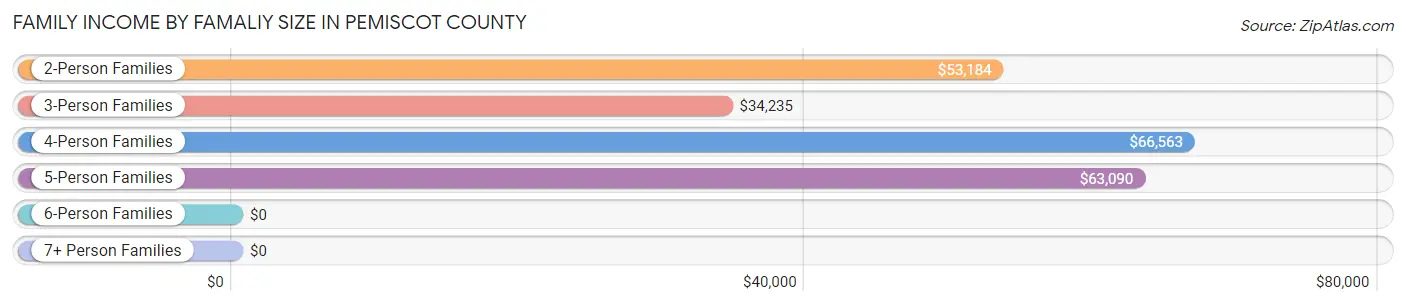
Family Income by Famaliy Size in Pemiscot County
4-person families (551 | 14.1%) account for the highest median family income in Pemiscot County with $66,563 per family, while 2-person families (1,805 | 46.2%) have the highest median income of $26,592 per family member.
| Income Bracket | # Families | Median Income |
| 2-Person Families | 1,805 (46.2%) | $53,184 |
| 3-Person Families | 978 (25.0%) | $34,235 |
| 4-Person Families | 551 (14.1%) | $66,563 |
| 5-Person Families | 309 (7.9%) | $63,090 |
| 6-Person Families | 181 (4.6%) | $0 |
| 7+ Person Families | 86 (2.2%) | $0 |
| Total | 3,910 (100.0%) | $50,797 |
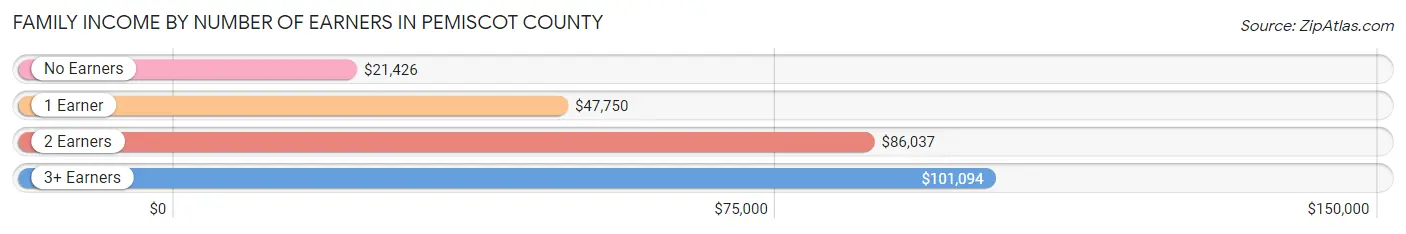
Family Income by Number of Earners in Pemiscot County
The median family income in Pemiscot County is $50,797, with families comprising 3+ earners (287) having the highest median family income of $101,094, while families with no earners (964) have the lowest median family income of $21,426, accounting for 7.3% and 24.6% of families, respectively.
| Number of Earners | # Families | Median Income |
| No Earners | 964 (24.6%) | $21,426 |
| 1 Earner | 1,717 (43.9%) | $47,750 |
| 2 Earners | 942 (24.1%) | $86,037 |
| 3+ Earners | 287 (7.3%) | $101,094 |
| Total | 3,910 (100.0%) | $50,797 |
Household Income in Pemiscot County
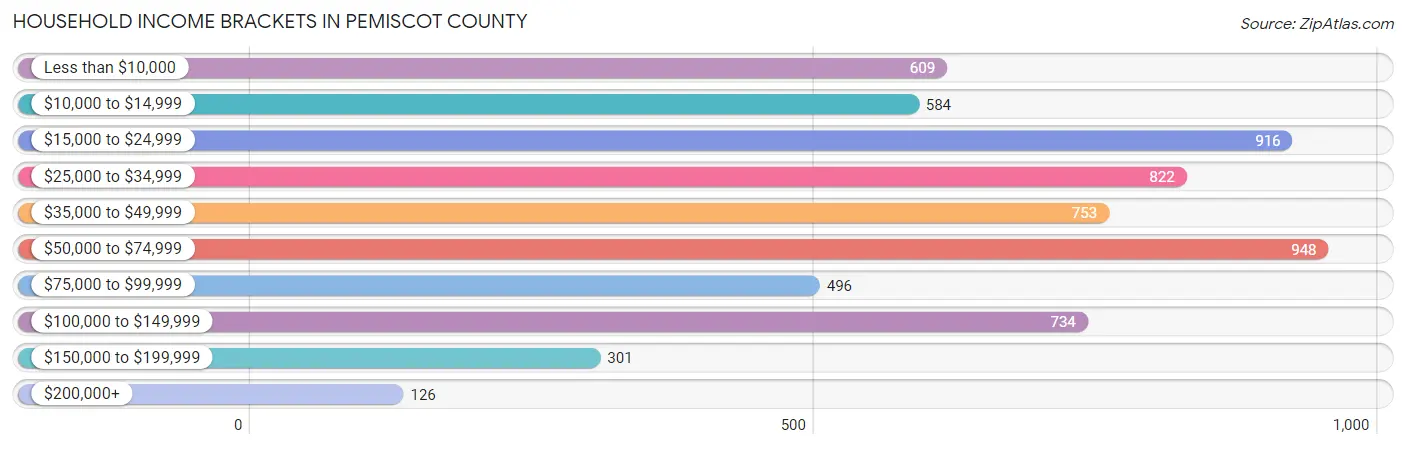
Household Income Brackets in Pemiscot County
With 948 households falling in the category, the $50,000 to $74,999 income range is the most frequent in Pemiscot County, accounting for 15.1% of all households. In contrast, only 126 households (2.0%) fall into the $200,000+ income bracket, making it the least populous group.
| Income Bracket | # Households | % Households |
| Less than $10,000 | 609 | 9.7% |
| $10,000 to $14,999 | 584 | 9.3% |
| $15,000 to $24,999 | 916 | 14.6% |
| $25,000 to $34,999 | 822 | 13.1% |
| $35,000 to $49,999 | 753 | 12.0% |
| $50,000 to $74,999 | 948 | 15.1% |
| $75,000 to $99,999 | 496 | 7.9% |
| $100,000 to $149,999 | 734 | 11.7% |
| $150,000 to $199,999 | 301 | 4.8% |
| $200,000+ | 126 | 2.0% |
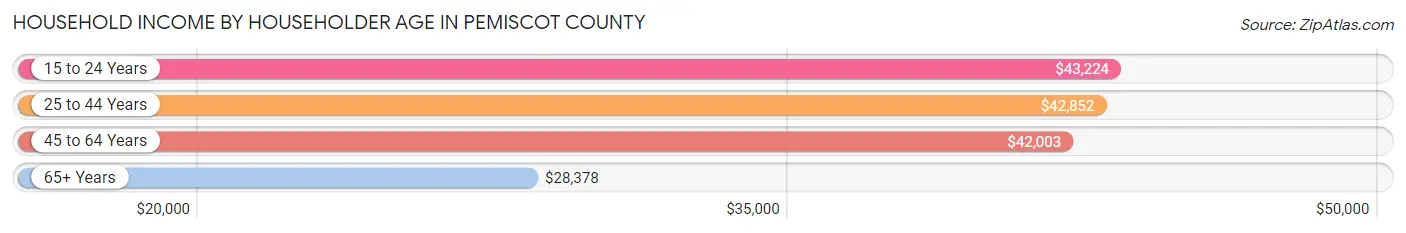
Household Income by Householder Age in Pemiscot County
The median household income in Pemiscot County is $37,426, with the highest median household income of $43,224 found in the 15 to 24 years age bracket for the primary householder. A total of 199 households (3.2%) fall into this category. Meanwhile, the 65+ years age bracket for the primary householder has the lowest median household income of $28,378, with 1,756 households (28.0%) in this group.
| Income Bracket | # Households | Median Income |
| 15 to 24 Years | 199 (3.2%) | $43,224 |
| 25 to 44 Years | 1,919 (30.6%) | $42,852 |
| 45 to 64 Years | 2,401 (38.3%) | $42,003 |
| 65+ Years | 1,756 (28.0%) | $28,378 |
| Total | 6,275 (100.0%) | $37,426 |
Poverty in Pemiscot County
Income Below Poverty by Sex and Age in Pemiscot County
With 26.4% poverty level for males and 31.8% for females among the residents of Pemiscot County, 6 to 11 year old males and 5 year old females are the most vulnerable to poverty, with 367 males (54.5%) and 106 females (89.8%) in their respective age groups living below the poverty level.
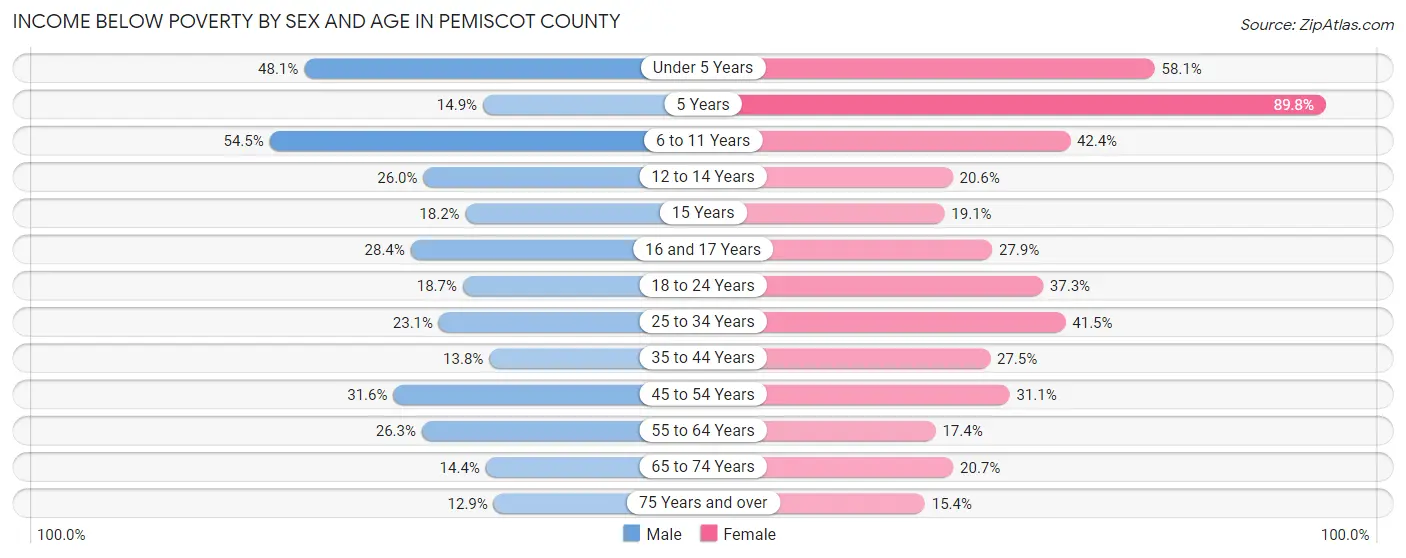
| Age Bracket | Male | Female |
| Under 5 Years | 218 (48.1%) | 374 (58.1%) |
| 5 Years | 10 (14.9%) | 106 (89.8%) |
| 6 to 11 Years | 367 (54.5%) | 332 (42.3%) |
| 12 to 14 Years | 99 (26.0%) | 37 (20.6%) |
| 15 Years | 14 (18.2%) | 16 (19.1%) |
| 16 and 17 Years | 74 (28.3%) | 70 (27.9%) |
| 18 to 24 Years | 114 (18.7%) | 243 (37.3%) |
| 25 to 34 Years | 208 (23.1%) | 381 (41.5%) |
| 35 to 44 Years | 110 (13.8%) | 271 (27.5%) |
| 45 to 54 Years | 261 (31.6%) | 303 (31.1%) |
| 55 to 64 Years | 261 (26.3%) | 189 (17.4%) |
| 65 to 74 Years | 111 (14.4%) | 168 (20.7%) |
| 75 Years and over | 48 (12.9%) | 104 (15.4%) |
| Total | 1,895 (26.4%) | 2,594 (31.8%) |
Income Above Poverty by Sex and Age in Pemiscot County
According to the poverty statistics in Pemiscot County, males aged 75 years and over and females aged 75 years and over are the age groups that are most secure financially, with 87.1% of males and 84.6% of females in these age groups living above the poverty line.
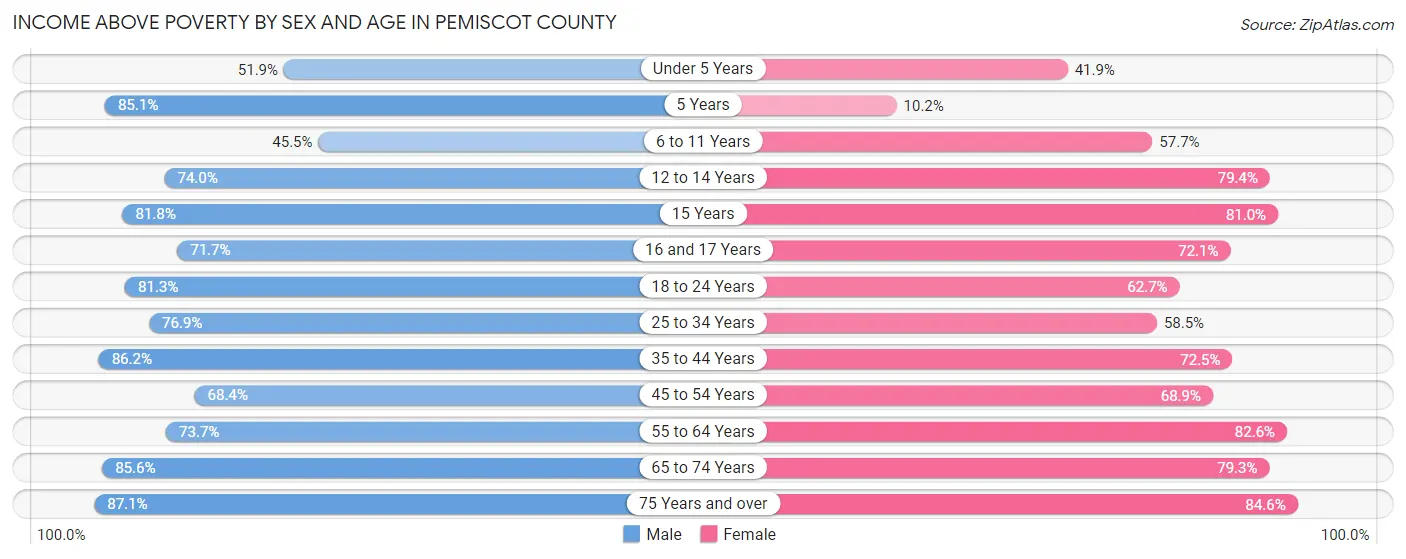
| Age Bracket | Male | Female |
| Under 5 Years | 235 (51.9%) | 270 (41.9%) |
| 5 Years | 57 (85.1%) | 12 (10.2%) |
| 6 to 11 Years | 306 (45.5%) | 452 (57.7%) |
| 12 to 14 Years | 282 (74.0%) | 143 (79.4%) |
| 15 Years | 63 (81.8%) | 68 (80.9%) |
| 16 and 17 Years | 187 (71.7%) | 181 (72.1%) |
| 18 to 24 Years | 497 (81.3%) | 408 (62.7%) |
| 25 to 34 Years | 692 (76.9%) | 537 (58.5%) |
| 35 to 44 Years | 689 (86.2%) | 714 (72.5%) |
| 45 to 54 Years | 566 (68.4%) | 670 (68.9%) |
| 55 to 64 Years | 732 (73.7%) | 898 (82.6%) |
| 65 to 74 Years | 659 (85.6%) | 645 (79.3%) |
| 75 Years and over | 323 (87.1%) | 571 (84.6%) |
| Total | 5,288 (73.6%) | 5,569 (68.2%) |
Income Below Poverty Among Married-Couple Families in Pemiscot County
The poverty statistics for married-couple families in Pemiscot County show that 11.6% or 274 of the total 2,355 families live below the poverty line. Families with 5 or more children have the highest poverty rate of 88.2%, comprising of 15 families. On the other hand, families with 3 or 4 children have the lowest poverty rate of 0.0%, which includes 0 families.
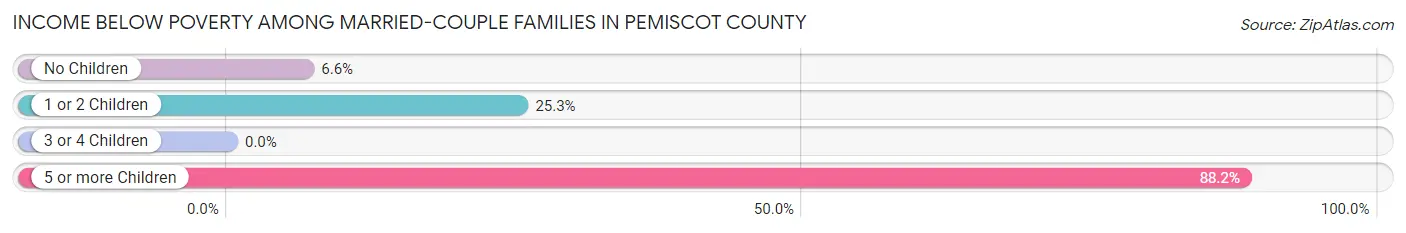
| Children | Above Poverty | Below Poverty |
| No Children | 1,392 (93.4%) | 99 (6.6%) |
| 1 or 2 Children | 473 (74.7%) | 160 (25.3%) |
| 3 or 4 Children | 214 (100.0%) | 0 (0.0%) |
| 5 or more Children | 2 (11.8%) | 15 (88.2%) |
| Total | 2,081 (88.4%) | 274 (11.6%) |
Income Below Poverty Among Single-Parent Households in Pemiscot County
According to the poverty data in Pemiscot County, 21.3% or 70 single-father households and 45.9% or 563 single-mother households are living below the poverty line. Among single-father households, those with 5 or more children have the highest poverty rate, with 49 households (100.0%) experiencing poverty. Likewise, among single-mother households, those with 3 or 4 children have the highest poverty rate, with 126 households (88.7%) falling below the poverty line.
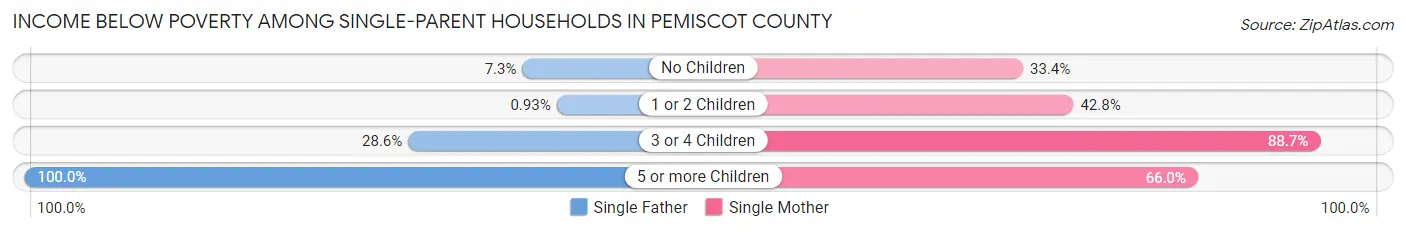
| Children | Single Father | Single Mother |
| No Children | 10 (7.3%) | 135 (33.4%) |
| 1 or 2 Children | 1 (0.9%) | 271 (42.8%) |
| 3 or 4 Children | 10 (28.6%) | 126 (88.7%) |
| 5 or more Children | 49 (100.0%) | 31 (66.0%) |
| Total | 70 (21.3%) | 563 (45.9%) |
Income Below Poverty Among Married-Couple vs Single-Parent Households in Pemiscot County
The poverty data for Pemiscot County shows that 274 of the married-couple family households (11.6%) and 633 of the single-parent households (40.7%) are living below the poverty level. Within the married-couple family households, those with 5 or more children have the highest poverty rate, with 15 households (88.2%) falling below the poverty line. Among the single-parent households, those with 5 or more children have the highest poverty rate, with 80 household (83.3%) living below poverty.
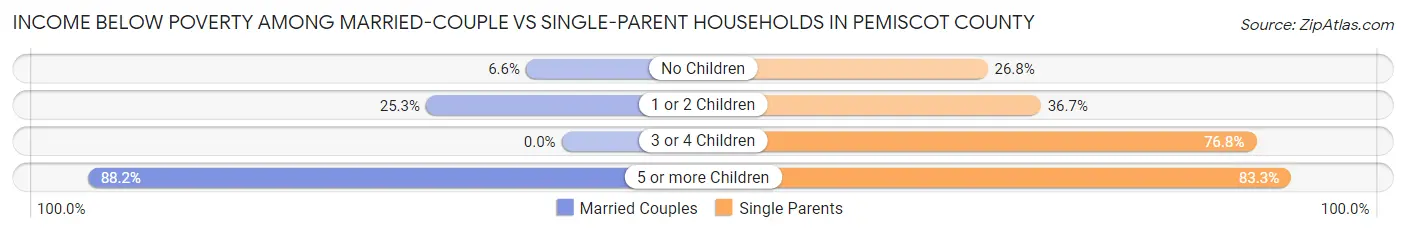
| Children | Married-Couple Families | Single-Parent Households |
| No Children | 99 (6.6%) | 145 (26.8%) |
| 1 or 2 Children | 160 (25.3%) | 272 (36.7%) |
| 3 or 4 Children | 0 (0.0%) | 136 (76.8%) |
| 5 or more Children | 15 (88.2%) | 80 (83.3%) |
| Total | 274 (11.6%) | 633 (40.7%) |
Race in Pemiscot County
The most populous races in Pemiscot County are White / Caucasian (10,408 | 66.9%), Black / African American (4,071 | 26.2%), and Two or more Races (932 | 6.0%).
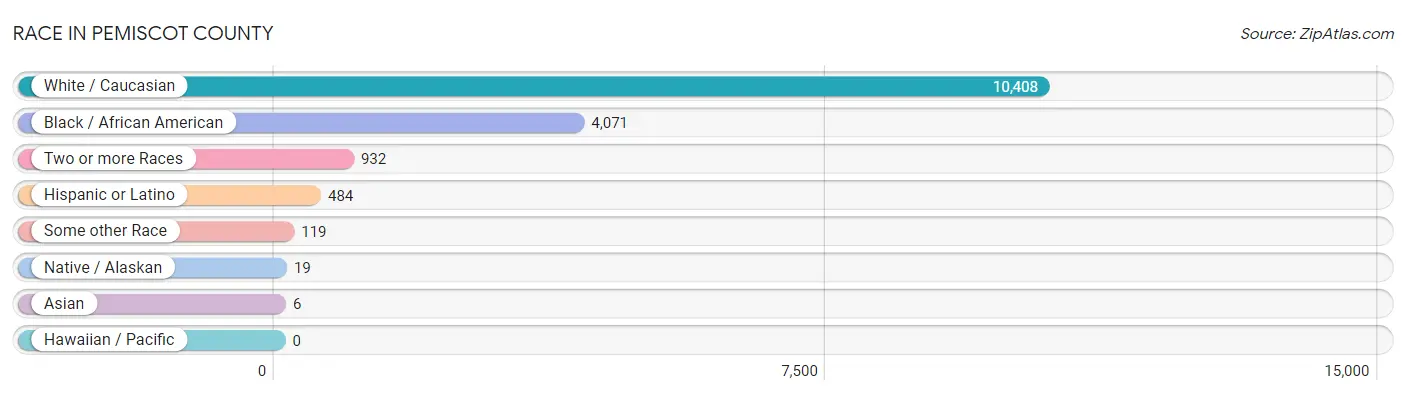
| Race | # Population | % Population |
| Asian | 6 | 0.0% |
| Black / African American | 4,071 | 26.2% |
| Hawaiian / Pacific | 0 | 0.0% |
| Hispanic or Latino | 484 | 3.1% |
| Native / Alaskan | 19 | 0.1% |
| White / Caucasian | 10,408 | 66.9% |
| Two or more Races | 932 | 6.0% |
| Some other Race | 119 | 0.8% |
| Total | 15,555 | 100.0% |
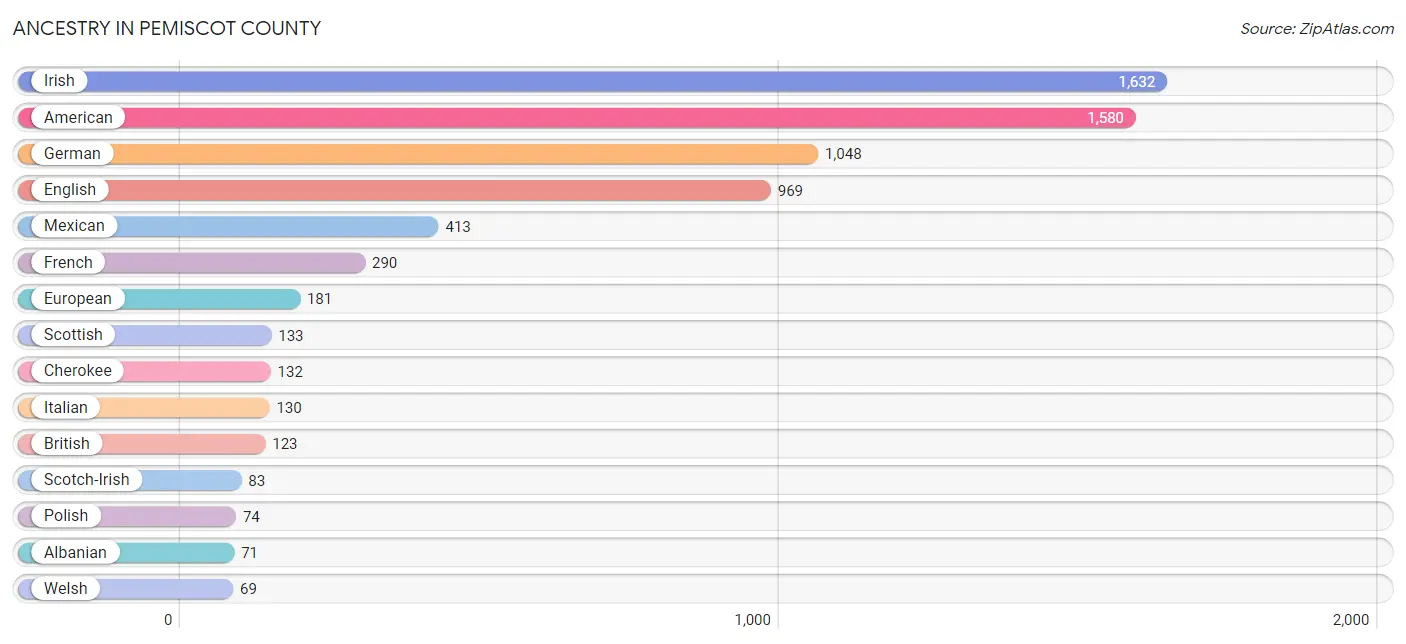
Ancestry in Pemiscot County
The most populous ancestries reported in Pemiscot County are Irish (1,632 | 10.5%), American (1,580 | 10.2%), German (1,048 | 6.7%), English (969 | 6.2%), and Mexican (413 | 2.7%), together accounting for 36.3% of all Pemiscot County residents.
| Ancestry | # Population | % Population |
| African | 21 | 0.1% |
| Albanian | 71 | 0.5% |
| American | 1,580 | 10.2% |
| Apache | 2 | 0.0% |
| Arab | 62 | 0.4% |
| Austrian | 19 | 0.1% |
| Blackfeet | 16 | 0.1% |
| British | 123 | 0.8% |
| Celtic | 10 | 0.1% |
| Cherokee | 132 | 0.9% |
| Chickasaw | 18 | 0.1% |
| Choctaw | 5 | 0.0% |
| Crow | 2 | 0.0% |
| Czechoslovakian | 7 | 0.1% |
| Danish | 11 | 0.1% |
| Dutch | 45 | 0.3% |
| Dutch West Indian | 13 | 0.1% |
| Eastern European | 19 | 0.1% |
| English | 969 | 6.2% |
| European | 181 | 1.2% |
| Finnish | 14 | 0.1% |
| French | 290 | 1.9% |
| French Canadian | 4 | 0.0% |
| German | 1,048 | 6.7% |
| Greek | 5 | 0.0% |
| Irish | 1,632 | 10.5% |
| Italian | 130 | 0.8% |
| Korean | 6 | 0.0% |
| Lebanese | 62 | 0.4% |
| Mexican | 413 | 2.7% |
| Native Hawaiian | 9 | 0.1% |
| Norwegian | 7 | 0.1% |
| Paraguayan | 66 | 0.4% |
| Polish | 74 | 0.5% |
| Portuguese | 2 | 0.0% |
| Puerto Rican | 4 | 0.0% |
| Romanian | 9 | 0.1% |
| Russian | 4 | 0.0% |
| Scandinavian | 55 | 0.4% |
| Scotch-Irish | 83 | 0.5% |
| Scottish | 133 | 0.9% |
| Serbian | 10 | 0.1% |
| Sioux | 4 | 0.0% |
| Slovak | 2 | 0.0% |
| South African | 7 | 0.1% |
| South American | 66 | 0.4% |
| Spanish | 1 | 0.0% |
| Subsaharan African | 28 | 0.2% |
| Swedish | 26 | 0.2% |
| Swiss | 1 | 0.0% |
| Welsh | 69 | 0.4% | View All 51 Rows |
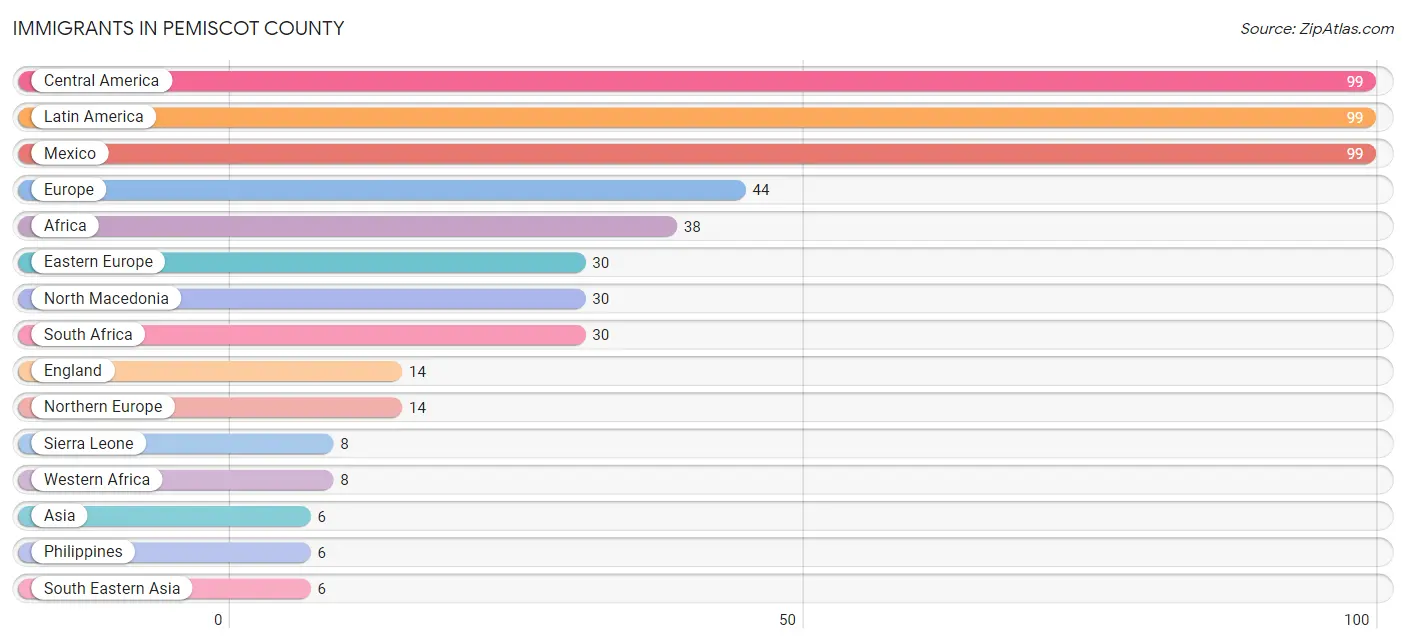
Immigrants in Pemiscot County
The most numerous immigrant groups reported in Pemiscot County came from Central America (99 | 0.6%), Latin America (99 | 0.6%), Mexico (99 | 0.6%), Europe (44 | 0.3%), and Africa (38 | 0.2%), together accounting for 2.4% of all Pemiscot County residents.
| Immigration Origin | # Population | % Population |
| Africa | 38 | 0.2% |
| Asia | 6 | 0.0% |
| Central America | 99 | 0.6% |
| Eastern Europe | 30 | 0.2% |
| England | 14 | 0.1% |
| Europe | 44 | 0.3% |
| Latin America | 99 | 0.6% |
| Mexico | 99 | 0.6% |
| North Macedonia | 30 | 0.2% |
| Northern Europe | 14 | 0.1% |
| Philippines | 6 | 0.0% |
| Sierra Leone | 8 | 0.1% |
| South Africa | 30 | 0.2% |
| South Eastern Asia | 6 | 0.0% |
| Western Africa | 8 | 0.1% | View All 15 Rows |
Sex and Age in Pemiscot County
Sex and Age in Pemiscot County
The most populous age groups in Pemiscot County are 5 to 9 Years (595 | 8.2%) for men and 55 to 59 Years (648 | 7.9%) for women.
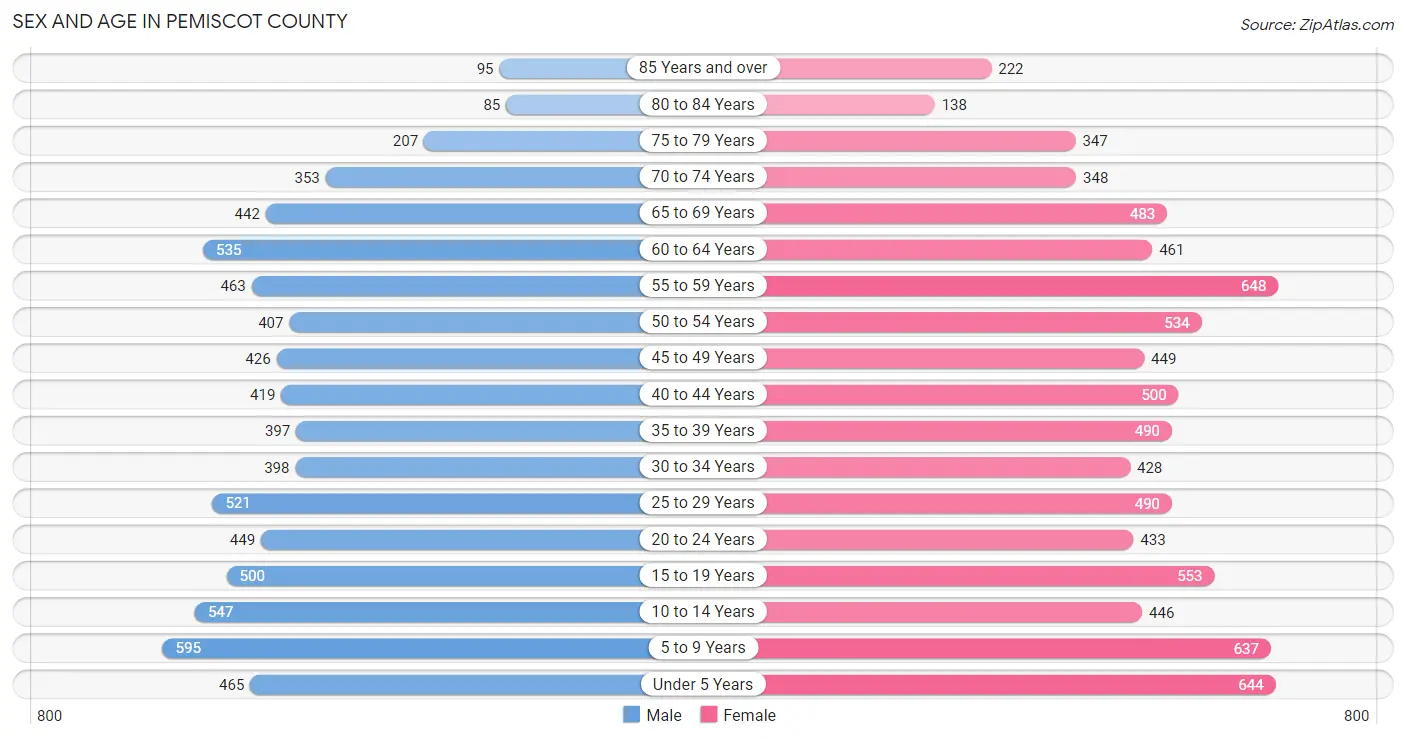
| Age Bracket | Male | Female |
| Under 5 Years | 465 (6.4%) | 644 (7.8%) |
| 5 to 9 Years | 595 (8.2%) | 637 (7.7%) |
| 10 to 14 Years | 547 (7.5%) | 446 (5.4%) |
| 15 to 19 Years | 500 (6.9%) | 553 (6.7%) |
| 20 to 24 Years | 449 (6.1%) | 433 (5.2%) |
| 25 to 29 Years | 521 (7.1%) | 490 (5.9%) |
| 30 to 34 Years | 398 (5.4%) | 428 (5.2%) |
| 35 to 39 Years | 397 (5.4%) | 490 (5.9%) |
| 40 to 44 Years | 419 (5.7%) | 500 (6.1%) |
| 45 to 49 Years | 426 (5.8%) | 449 (5.4%) |
| 50 to 54 Years | 407 (5.6%) | 534 (6.5%) |
| 55 to 59 Years | 463 (6.3%) | 648 (7.9%) |
| 60 to 64 Years | 535 (7.3%) | 461 (5.6%) |
| 65 to 69 Years | 442 (6.0%) | 483 (5.9%) |
| 70 to 74 Years | 353 (4.8%) | 348 (4.2%) |
| 75 to 79 Years | 207 (2.8%) | 347 (4.2%) |
| 80 to 84 Years | 85 (1.2%) | 138 (1.7%) |
| 85 Years and over | 95 (1.3%) | 222 (2.7%) |
| Total | 7,304 (100.0%) | 8,251 (100.0%) |
Families and Households in Pemiscot County
Median Family Size in Pemiscot County
The median family size in Pemiscot County is 3.09 persons per family, with single female/mother families (1,226 | 31.4%) accounting for the largest median family size of 3.34 persons per family. On the other hand, married-couple families (2,355 | 60.2%) represent the smallest median family size with 2.93 persons per family.
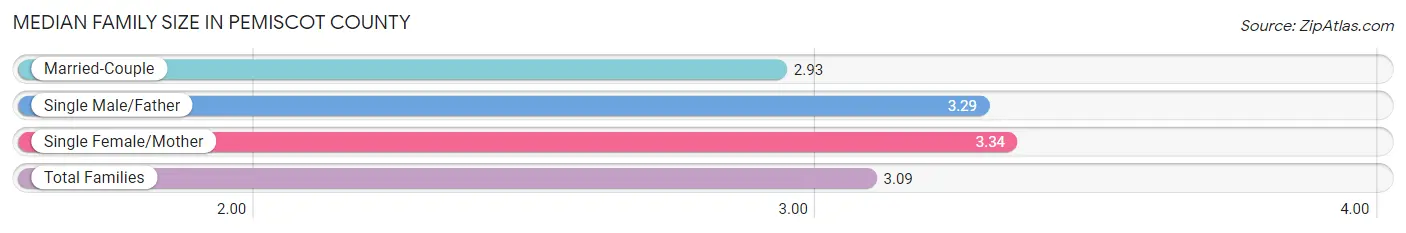
| Family Type | # Families | Family Size |
| Married-Couple | 2,355 (60.2%) | 2.93 |
| Single Male/Father | 329 (8.4%) | 3.29 |
| Single Female/Mother | 1,226 (31.4%) | 3.34 |
| Total Families | 3,910 (100.0%) | 3.09 |
Median Household Size in Pemiscot County
The median household size in Pemiscot County is 2.45 persons per household, with single male/father households (329 | 5.2%) accounting for the largest median household size of 3.95 persons per household. non-family households (2,365 | 37.7%) represent the smallest median household size with 1.22 persons per household.
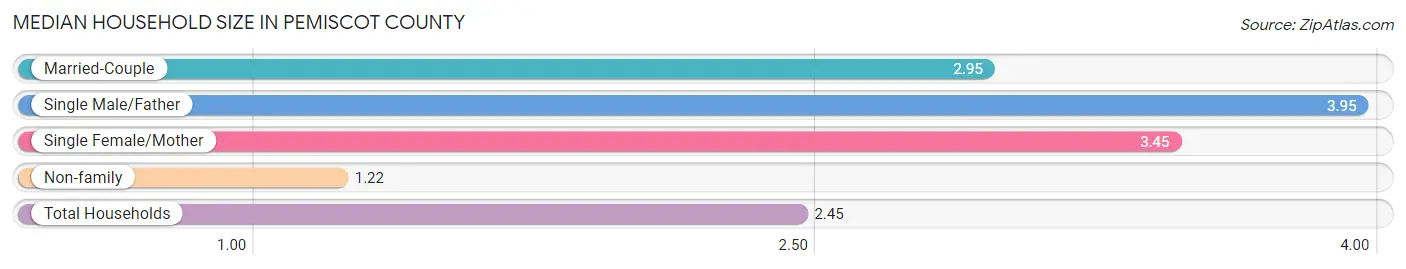
| Household Type | # Households | Household Size |
| Married-Couple | 2,355 (37.5%) | 2.95 |
| Single Male/Father | 329 (5.2%) | 3.95 |
| Single Female/Mother | 1,226 (19.5%) | 3.45 |
| Non-family | 2,365 (37.7%) | 1.22 |
| Total Households | 6,275 (100.0%) | 2.45 |
Household Size by Marriage Status in Pemiscot County
Out of a total of 6,275 households in Pemiscot County, 3,910 (62.3%) are family households, while 2,365 (37.7%) are nonfamily households. The most numerous type of family households are 2-person households, comprising 1,759, and the most common type of nonfamily households are 1-person households, comprising 1,969.
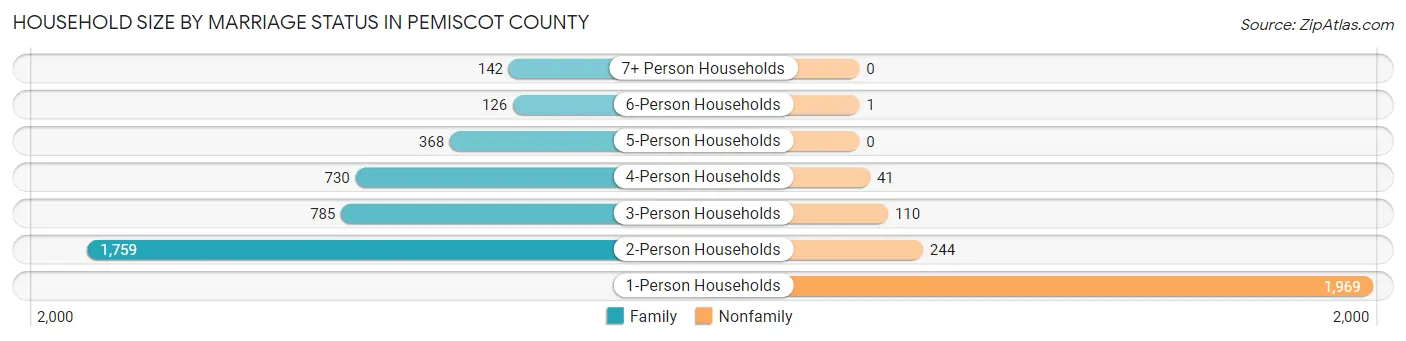
| Household Size | Family Households | Nonfamily Households |
| 1-Person Households | - | 1,969 (31.4%) |
| 2-Person Households | 1,759 (28.0%) | 244 (3.9%) |
| 3-Person Households | 785 (12.5%) | 110 (1.8%) |
| 4-Person Households | 730 (11.6%) | 41 (0.6%) |
| 5-Person Households | 368 (5.9%) | 0 (0.0%) |
| 6-Person Households | 126 (2.0%) | 1 (0.0%) |
| 7+ Person Households | 142 (2.3%) | 0 (0.0%) |
| Total | 3,910 (62.3%) | 2,365 (37.7%) |
Female Fertility in Pemiscot County
Fertility by Age in Pemiscot County
Average fertility rate in Pemiscot County is 57.0 births per 1,000 women. Women in the age bracket of 20 to 34 years have the highest fertility rate with 93.0 births per 1,000 women. Women in the age bracket of 20 to 34 years acount for 63.6% of all women with births.
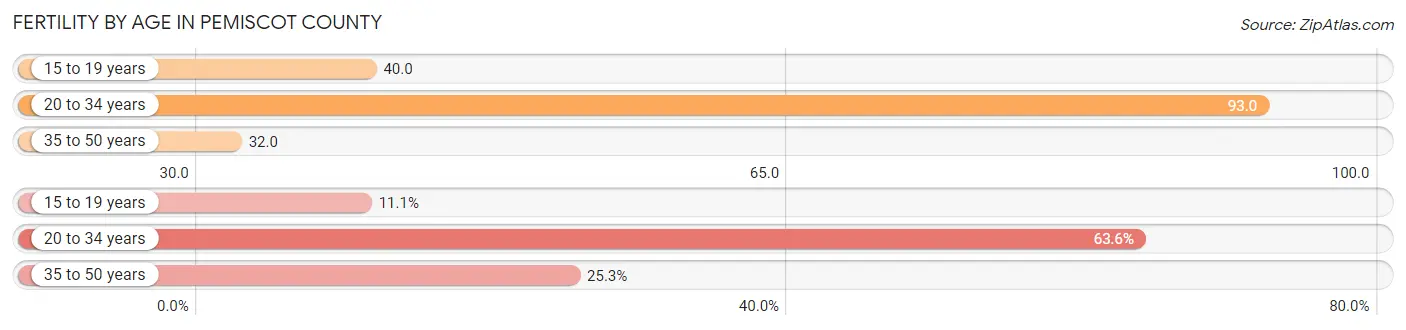
| Age Bracket | Women with Births | Births / 1,000 Women |
| 15 to 19 years | 22 (11.1%) | 40.0 |
| 20 to 34 years | 126 (63.6%) | 93.0 |
| 35 to 50 years | 50 (25.3%) | 32.0 |
| Total | 198 (100.0%) | 57.0 |
Fertility by Age by Marriage Status in Pemiscot County
60.6% of women with births (198) in Pemiscot County are married. The highest percentage of unmarried women with births falls into 15 to 19 years age bracket with 100.0% of them unmarried at the time of birth, while the lowest percentage of unmarried women with births belong to 35 to 50 years age bracket with 14.0% of them unmarried.
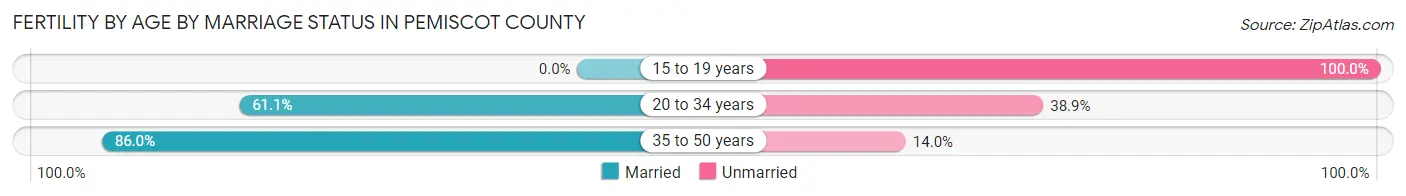
| Age Bracket | Married | Unmarried |
| 15 to 19 years | 0 (0.0%) | 22 (100.0%) |
| 20 to 34 years | 77 (61.1%) | 49 (38.9%) |
| 35 to 50 years | 43 (86.0%) | 7 (14.0%) |
| Total | 120 (60.6%) | 78 (39.4%) |
Fertility by Education in Pemiscot County
Average fertility rate in Pemiscot County is 57.0 births per 1,000 women. Women with the education attainment of graduate degree have the highest fertility rate of 181.0 births per 1,000 women, while women with the education attainment of college or associate's degree have the lowest fertility at 20.0 births per 1,000 women. Women with the education attainment of high school diploma represent 51.0% of all women with births.
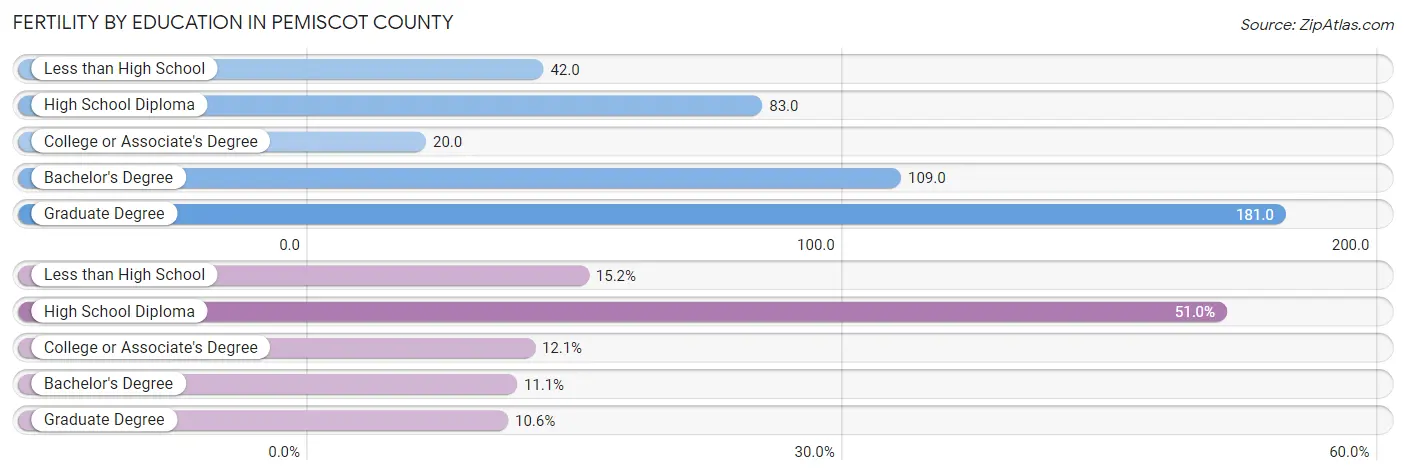
| Educational Attainment | Women with Births | Births / 1,000 Women |
| Less than High School | 30 (15.1%) | 42.0 |
| High School Diploma | 101 (51.0%) | 83.0 |
| College or Associate's Degree | 24 (12.1%) | 20.0 |
| Bachelor's Degree | 22 (11.1%) | 109.0 |
| Graduate Degree | 21 (10.6%) | 181.0 |
| Total | 198 (100.0%) | 57.0 |
Fertility by Education by Marriage Status in Pemiscot County
39.4% of women with births in Pemiscot County are unmarried. Women with the educational attainment of less than high school are most likely to be married with 100.0% of them married at childbirth, while women with the educational attainment of bachelor's degree are least likely to be married with 68.2% of them unmarried at childbirth.
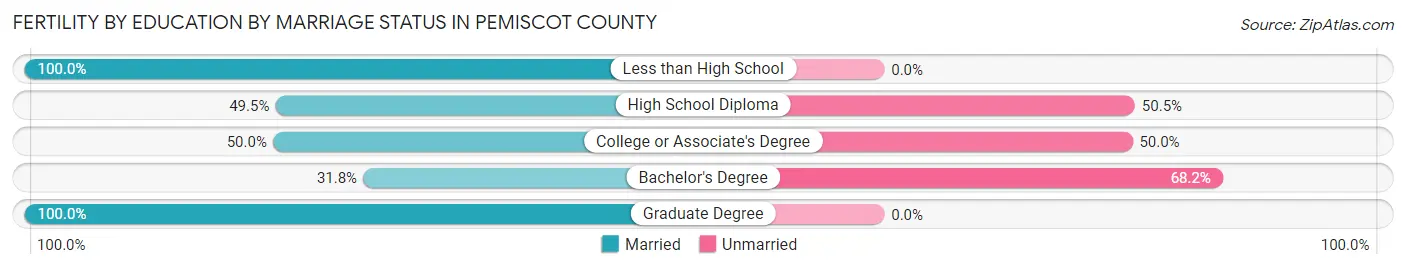
| Educational Attainment | Married | Unmarried |
| Less than High School | 30 (100.0%) | 0 (0.0%) |
| High School Diploma | 50 (49.5%) | 51 (50.5%) |
| College or Associate's Degree | 12 (50.0%) | 12 (50.0%) |
| Bachelor's Degree | 7 (31.8%) | 15 (68.2%) |
| Graduate Degree | 21 (100.0%) | 0 (0.0%) |
| Total | 120 (60.6%) | 78 (39.4%) |
Employment Characteristics in Pemiscot County
Employment by Class of Employer in Pemiscot County
Among the 5,504 employed individuals in Pemiscot County, private company employees (3,879 | 70.5%), local government employees (451 | 8.2%), and self-employed (not incorporated) (422 | 7.7%) make up the most common classes of employment.
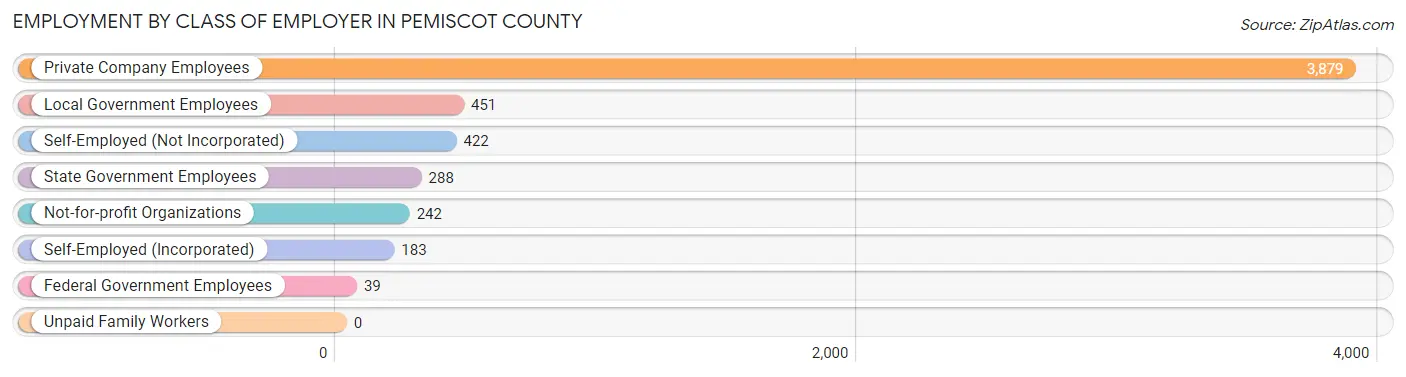
| Employer Class | # Employees | % Employees |
| Private Company Employees | 3,879 | 70.5% |
| Self-Employed (Incorporated) | 183 | 3.3% |
| Self-Employed (Not Incorporated) | 422 | 7.7% |
| Not-for-profit Organizations | 242 | 4.4% |
| Local Government Employees | 451 | 8.2% |
| State Government Employees | 288 | 5.2% |
| Federal Government Employees | 39 | 0.7% |
| Unpaid Family Workers | 0 | 0.0% |
| Total | 5,504 | 100.0% |
Employment Status by Age in Pemiscot County
According to the labor force statistics for Pemiscot County, out of the total population over 16 years of age (12,060), 51.1% or 6,163 individuals are in the labor force, with 9.6% or 592 of them unemployed. The age group with the highest labor force participation rate is 30 to 34 years, with 85.0% or 702 individuals in the labor force. Within the labor force, the 25 to 29 years age range has the highest percentage of unemployed individuals, with 24.2% or 195 of them being unemployed.
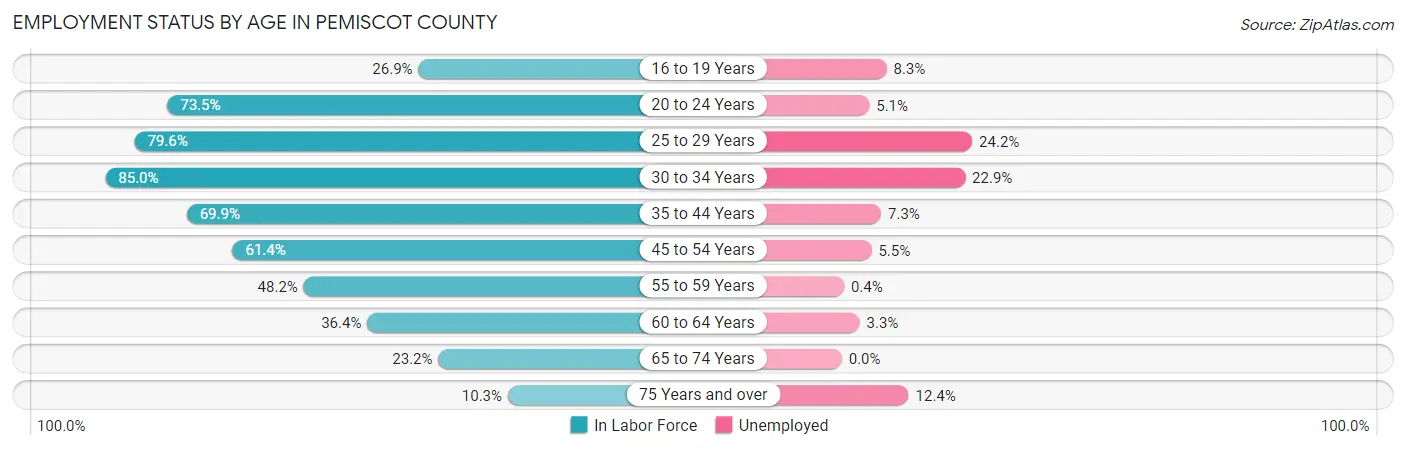
| Age Bracket | In Labor Force | Unemployed |
| 16 to 19 Years | 240 (26.9%) | 20 (8.3%) |
| 20 to 24 Years | 648 (73.5%) | 33 (5.1%) |
| 25 to 29 Years | 805 (79.6%) | 195 (24.2%) |
| 30 to 34 Years | 702 (85.0%) | 161 (22.9%) |
| 35 to 44 Years | 1,262 (69.9%) | 92 (7.3%) |
| 45 to 54 Years | 1,115 (61.4%) | 61 (5.5%) |
| 55 to 59 Years | 536 (48.2%) | 2 (0.4%) |
| 60 to 64 Years | 363 (36.4%) | 12 (3.3%) |
| 65 to 74 Years | 377 (23.2%) | 0 (0.0%) |
| 75 Years and over | 113 (10.3%) | 14 (12.4%) |
| Total | 6,163 (51.1%) | 592 (9.6%) |
Employment Status by Educational Attainment in Pemiscot County
According to labor force statistics for Pemiscot County, 63.2% of individuals (4,782) out of the total population between 25 and 64 years of age (7,566) are in the labor force, with 10.9% or 521 of them being unemployed. The group with the highest labor force participation rate are those with the educational attainment of bachelor's degree or higher, with 79.7% or 700 individuals in the labor force. Within the labor force, individuals with college / associate degree education have the highest percentage of unemployment, with 19.3% or 267 of them being unemployed.
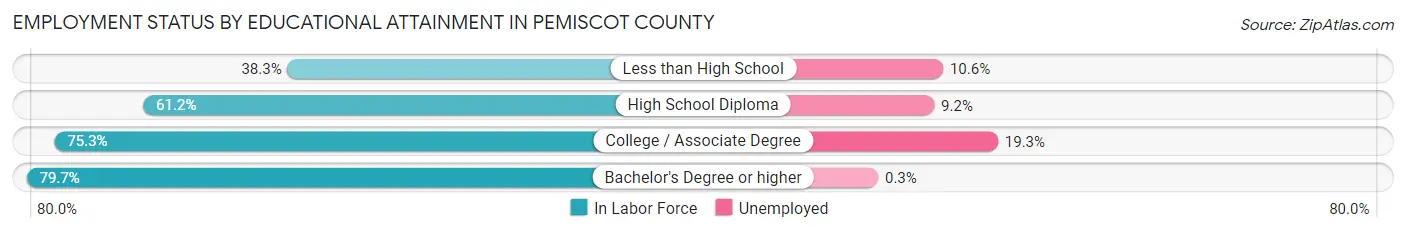
| Educational Attainment | In Labor Force | Unemployed |
| Less than High School | 454 (38.3%) | 126 (10.6%) |
| High School Diploma | 2,241 (61.2%) | 337 (9.2%) |
| College / Associate Degree | 1,386 (75.3%) | 355 (19.3%) |
| Bachelor's Degree or higher | 700 (79.7%) | 3 (0.3%) |
| Total | 4,782 (63.2%) | 825 (10.9%) |
Employment Occupations by Sex in Pemiscot County
Management, Business, Science and Arts Occupations
The most common Management, Business, Science and Arts occupations in Pemiscot County are Management (580 | 10.4%), Community & Social Service (475 | 8.5%), Education Instruction & Library (330 | 5.9%), Health Diagnosing & Treating (134 | 2.4%), and Education, Arts & Media (120 | 2.1%).
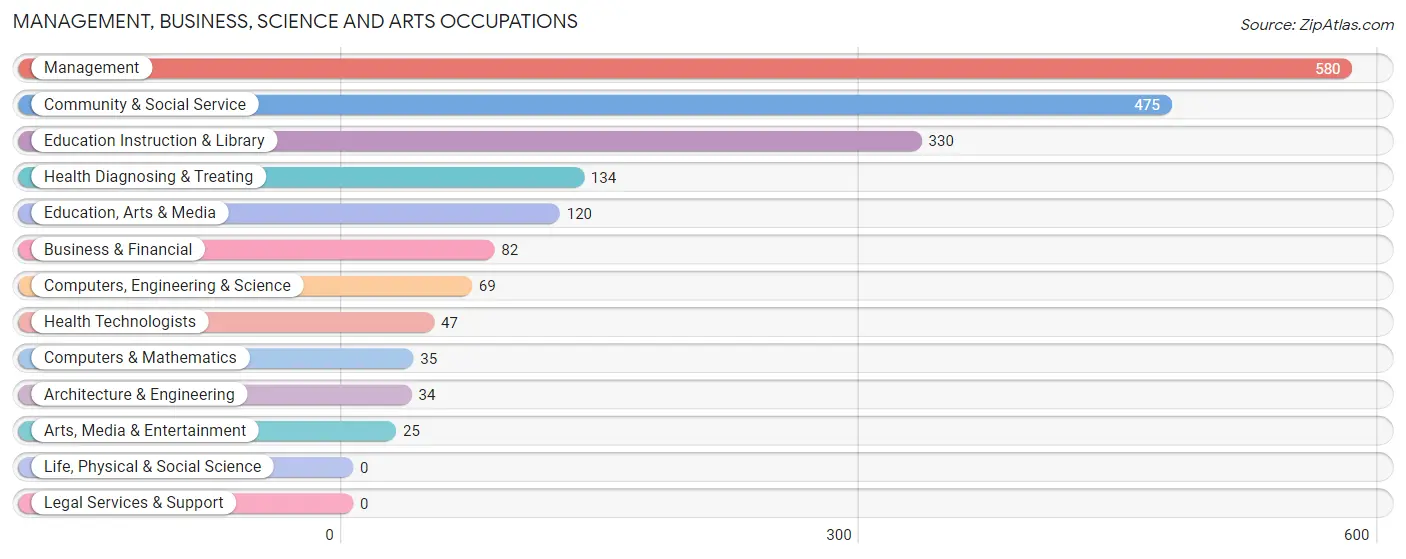
Management, Business, Science and Arts Occupations by Sex
Within the Management, Business, Science and Arts occupations in Pemiscot County, the most male-oriented occupations are Computers & Mathematics (91.4%), Computers, Engineering & Science (89.9%), and Architecture & Engineering (88.2%), while the most female-oriented occupations are Education Instruction & Library (96.1%), Health Diagnosing & Treating (93.3%), and Community & Social Service (91.8%).
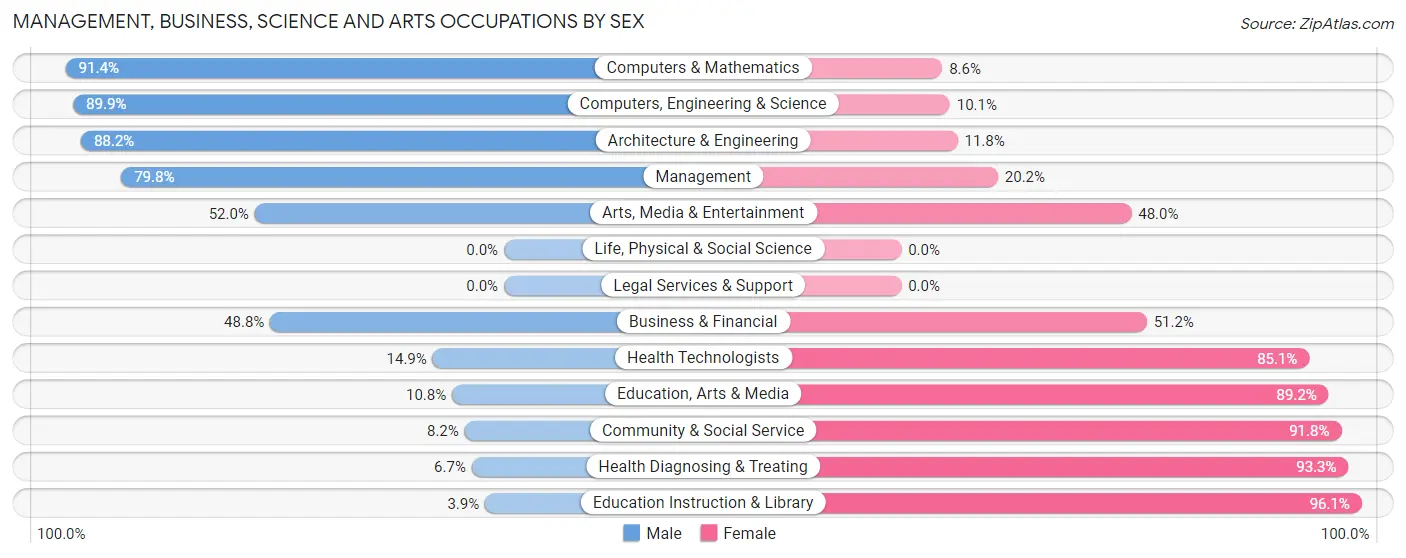
| Occupation | Male | Female |
| Management | 463 (79.8%) | 117 (20.2%) |
| Business & Financial | 40 (48.8%) | 42 (51.2%) |
| Computers, Engineering & Science | 62 (89.9%) | 7 (10.1%) |
| Computers & Mathematics | 32 (91.4%) | 3 (8.6%) |
| Architecture & Engineering | 30 (88.2%) | 4 (11.8%) |
| Life, Physical & Social Science | 0 (0.0%) | 0 (0.0%) |
| Community & Social Service | 39 (8.2%) | 436 (91.8%) |
| Education, Arts & Media | 13 (10.8%) | 107 (89.2%) |
| Legal Services & Support | 0 (0.0%) | 0 (0.0%) |
| Education Instruction & Library | 13 (3.9%) | 317 (96.1%) |
| Arts, Media & Entertainment | 13 (52.0%) | 12 (48.0%) |
| Health Diagnosing & Treating | 9 (6.7%) | 125 (93.3%) |
| Health Technologists | 7 (14.9%) | 40 (85.1%) |
| Total (Category) | 613 (45.8%) | 727 (54.2%) |
| Total (Overall) | 2,752 (49.4%) | 2,820 (50.6%) |
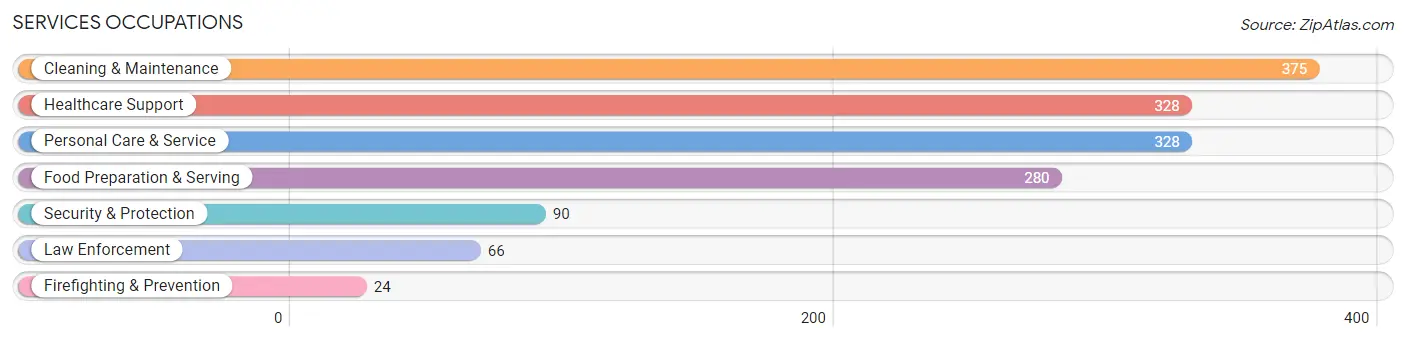
Services Occupations
The most common Services occupations in Pemiscot County are Cleaning & Maintenance (375 | 6.7%), Healthcare Support (328 | 5.9%), Personal Care & Service (328 | 5.9%), Food Preparation & Serving (280 | 5.0%), and Security & Protection (90 | 1.6%).
Services Occupations by Sex
Within the Services occupations in Pemiscot County, the most male-oriented occupations are Law Enforcement (72.7%), Security & Protection (70.0%), and Firefighting & Prevention (62.5%), while the most female-oriented occupations are Personal Care & Service (97.3%), Healthcare Support (79.6%), and Cleaning & Maintenance (69.3%).
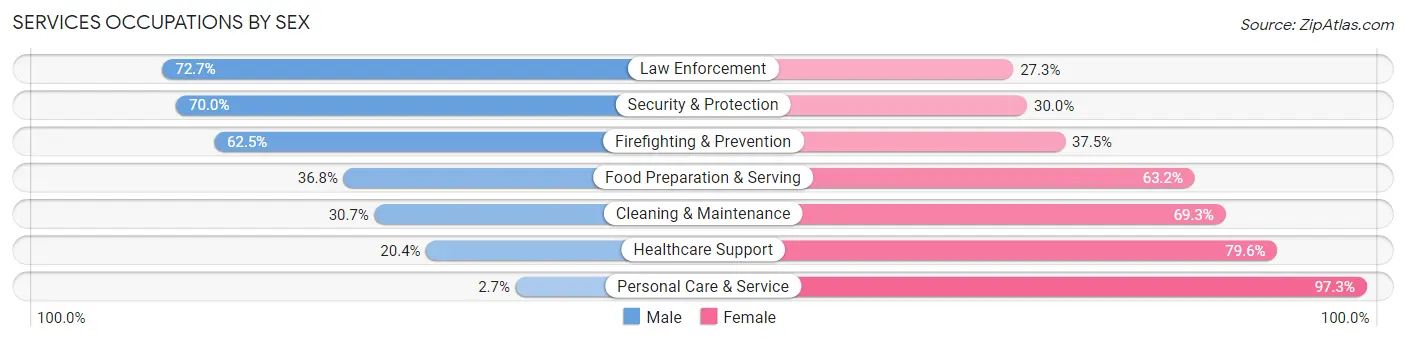
| Occupation | Male | Female |
| Healthcare Support | 67 (20.4%) | 261 (79.6%) |
| Security & Protection | 63 (70.0%) | 27 (30.0%) |
| Firefighting & Prevention | 15 (62.5%) | 9 (37.5%) |
| Law Enforcement | 48 (72.7%) | 18 (27.3%) |
| Food Preparation & Serving | 103 (36.8%) | 177 (63.2%) |
| Cleaning & Maintenance | 115 (30.7%) | 260 (69.3%) |
| Personal Care & Service | 9 (2.7%) | 319 (97.3%) |
| Total (Category) | 357 (25.5%) | 1,044 (74.5%) |
| Total (Overall) | 2,752 (49.4%) | 2,820 (50.6%) |
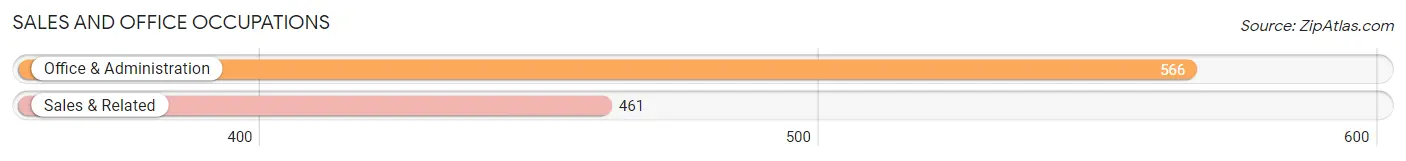
Sales and Office Occupations
The most common Sales and Office occupations in Pemiscot County are Office & Administration (566 | 10.2%), and Sales & Related (461 | 8.3%).
Sales and Office Occupations by Sex
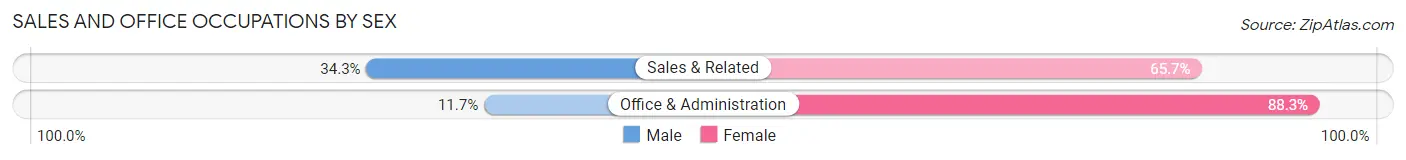
| Occupation | Male | Female |
| Sales & Related | 158 (34.3%) | 303 (65.7%) |
| Office & Administration | 66 (11.7%) | 500 (88.3%) |
| Total (Category) | 224 (21.8%) | 803 (78.2%) |
| Total (Overall) | 2,752 (49.4%) | 2,820 (50.6%) |
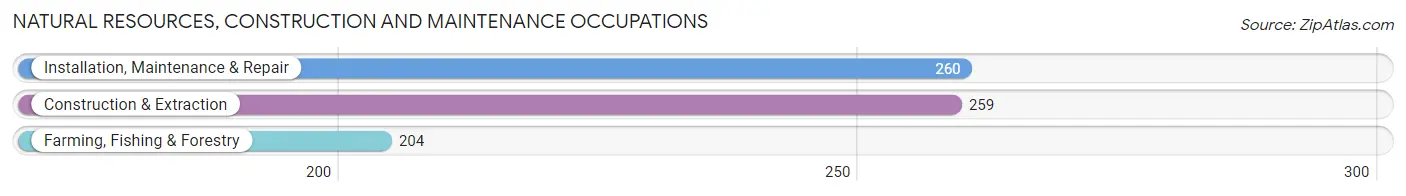
Natural Resources, Construction and Maintenance Occupations
The most common Natural Resources, Construction and Maintenance occupations in Pemiscot County are Installation, Maintenance & Repair (260 | 4.7%), Construction & Extraction (259 | 4.6%), and Farming, Fishing & Forestry (204 | 3.7%).
Natural Resources, Construction and Maintenance Occupations by Sex
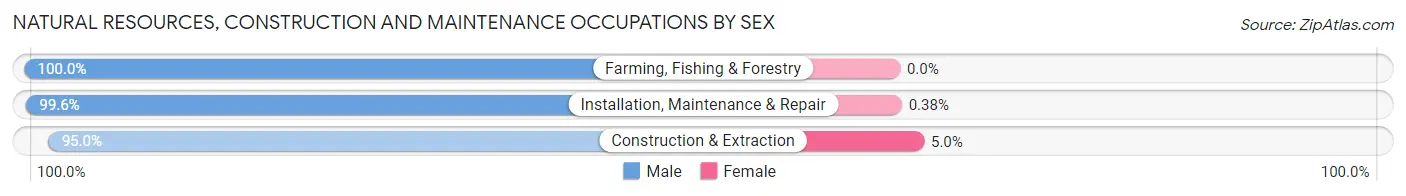
| Occupation | Male | Female |
| Farming, Fishing & Forestry | 204 (100.0%) | 0 (0.0%) |
| Construction & Extraction | 246 (95.0%) | 13 (5.0%) |
| Installation, Maintenance & Repair | 259 (99.6%) | 1 (0.4%) |
| Total (Category) | 709 (98.1%) | 14 (1.9%) |
| Total (Overall) | 2,752 (49.4%) | 2,820 (50.6%) |
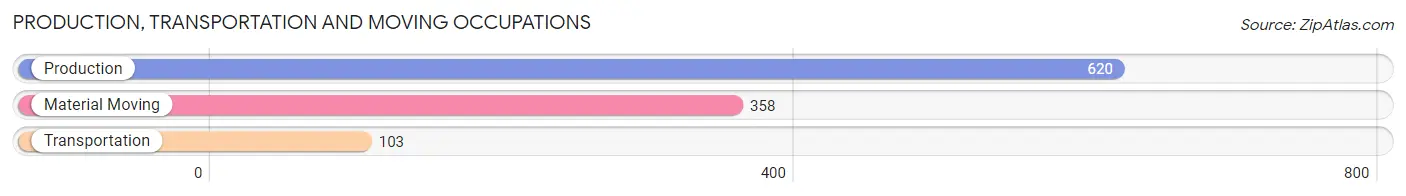
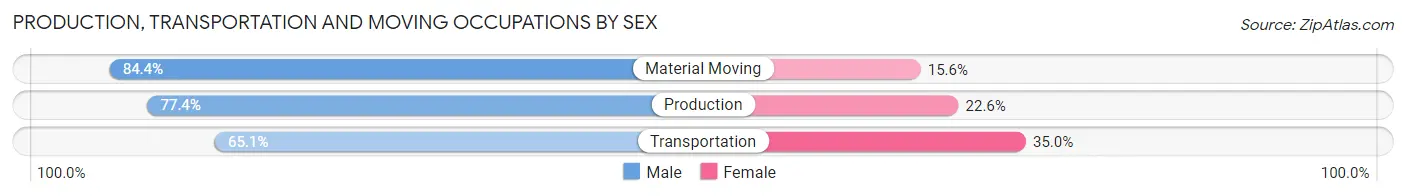
Production, Transportation and Moving Occupations
The most common Production, Transportation and Moving occupations in Pemiscot County are Production (620 | 11.1%), Material Moving (358 | 6.4%), and Transportation (103 | 1.8%).
Production, Transportation and Moving Occupations by Sex
| Occupation | Male | Female |
| Production | 480 (77.4%) | 140 (22.6%) |
| Transportation | 67 (65.0%) | 36 (34.9%) |
| Material Moving | 302 (84.4%) | 56 (15.6%) |
| Total (Category) | 849 (78.5%) | 232 (21.5%) |
| Total (Overall) | 2,752 (49.4%) | 2,820 (50.6%) |
Employment Industries by Sex in Pemiscot County
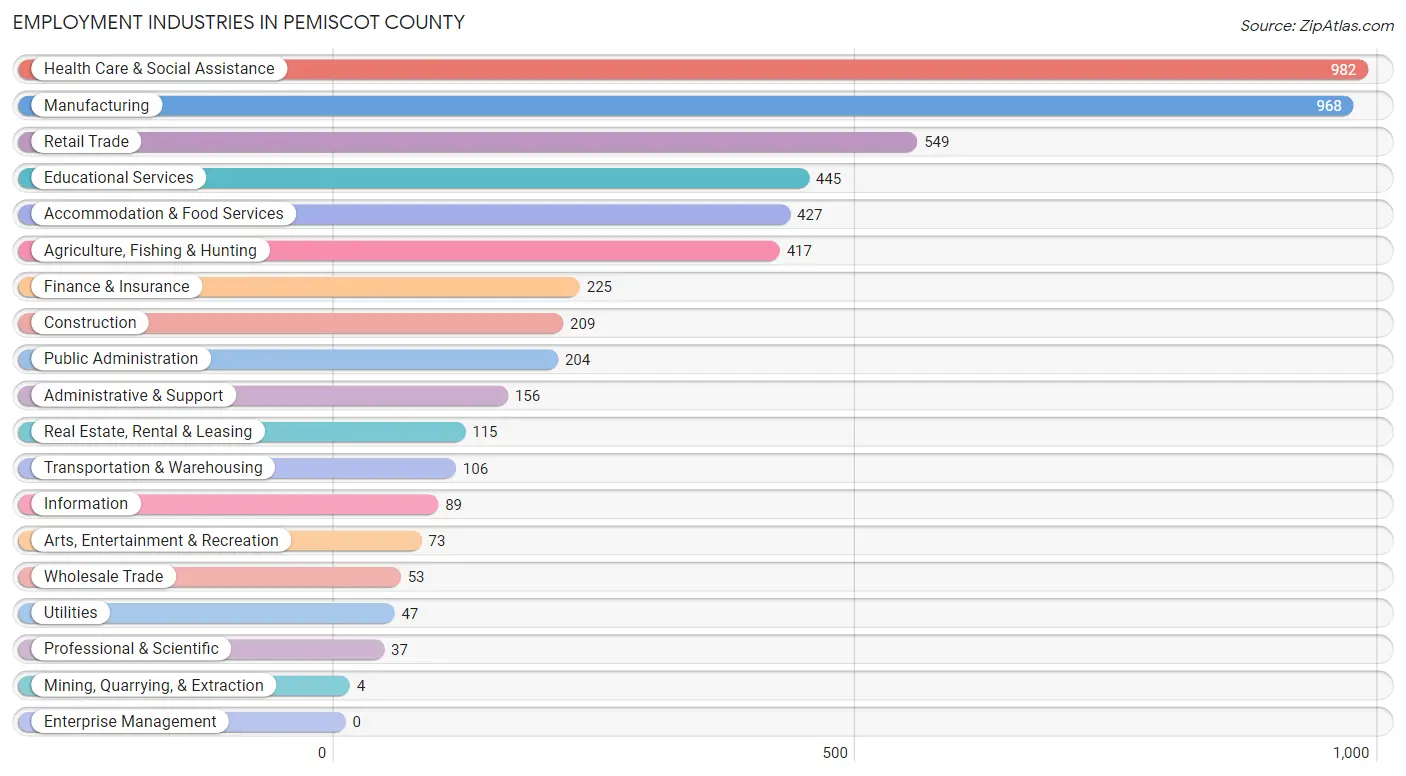
Employment Industries in Pemiscot County
The major employment industries in Pemiscot County include Health Care & Social Assistance (982 | 17.6%), Manufacturing (968 | 17.4%), Retail Trade (549 | 9.9%), Educational Services (445 | 8.0%), and Accommodation & Food Services (427 | 7.7%).
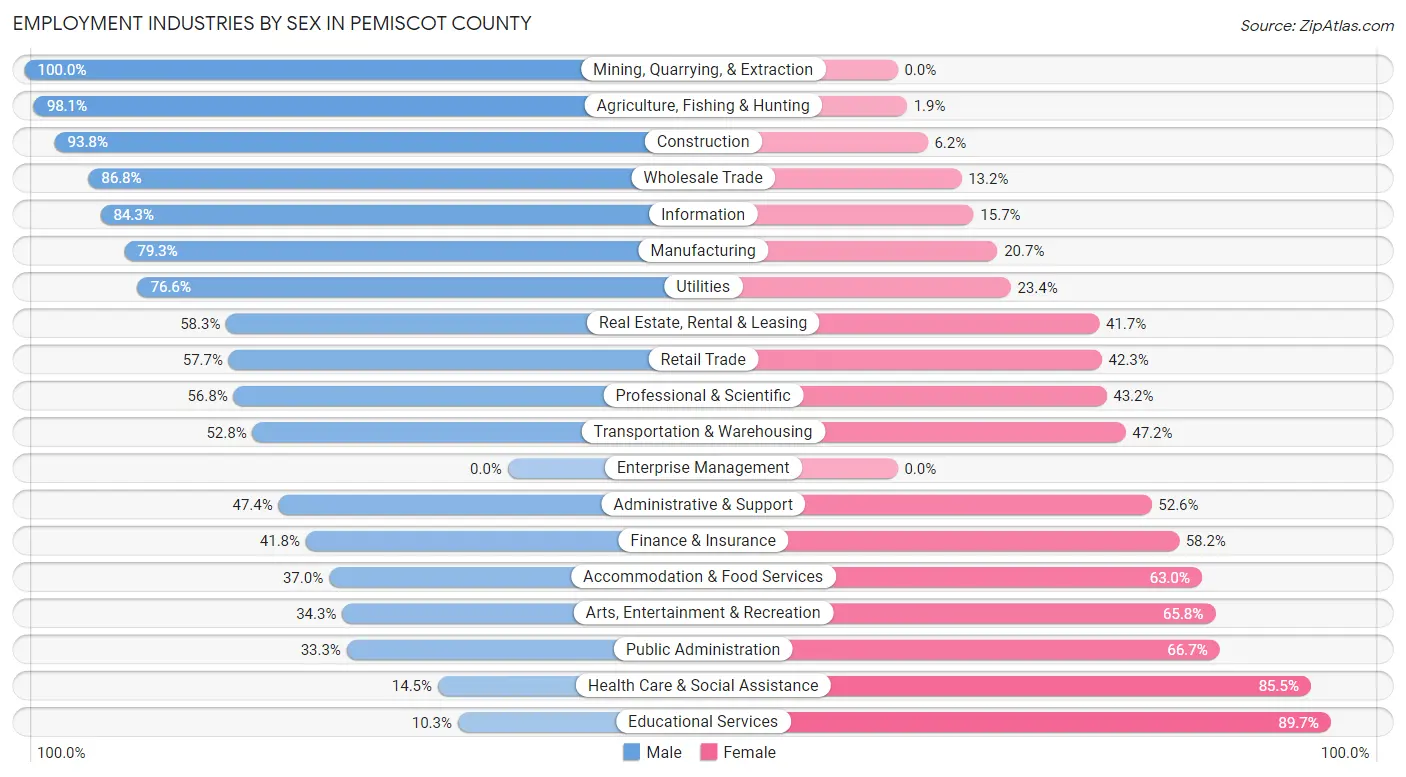
Employment Industries by Sex in Pemiscot County
The Pemiscot County industries that see more men than women are Mining, Quarrying, & Extraction (100.0%), Agriculture, Fishing & Hunting (98.1%), and Construction (93.8%), whereas the industries that tend to have a higher number of women are Educational Services (89.7%), Health Care & Social Assistance (85.5%), and Public Administration (66.7%).
| Industry | Male | Female |
| Agriculture, Fishing & Hunting | 409 (98.1%) | 8 (1.9%) |
| Mining, Quarrying, & Extraction | 4 (100.0%) | 0 (0.0%) |
| Construction | 196 (93.8%) | 13 (6.2%) |
| Manufacturing | 768 (79.3%) | 200 (20.7%) |
| Wholesale Trade | 46 (86.8%) | 7 (13.2%) |
| Retail Trade | 317 (57.7%) | 232 (42.3%) |
| Transportation & Warehousing | 56 (52.8%) | 50 (47.2%) |
| Utilities | 36 (76.6%) | 11 (23.4%) |
| Information | 75 (84.3%) | 14 (15.7%) |
| Finance & Insurance | 94 (41.8%) | 131 (58.2%) |
| Real Estate, Rental & Leasing | 67 (58.3%) | 48 (41.7%) |
| Professional & Scientific | 21 (56.8%) | 16 (43.2%) |
| Enterprise Management | 0 (0.0%) | 0 (0.0%) |
| Administrative & Support | 74 (47.4%) | 82 (52.6%) |
| Educational Services | 46 (10.3%) | 399 (89.7%) |
| Health Care & Social Assistance | 142 (14.5%) | 840 (85.5%) |
| Arts, Entertainment & Recreation | 25 (34.3%) | 48 (65.7%) |
| Accommodation & Food Services | 158 (37.0%) | 269 (63.0%) |
| Public Administration | 68 (33.3%) | 136 (66.7%) |
| Total | 2,752 (49.4%) | 2,820 (50.6%) |
Education in Pemiscot County
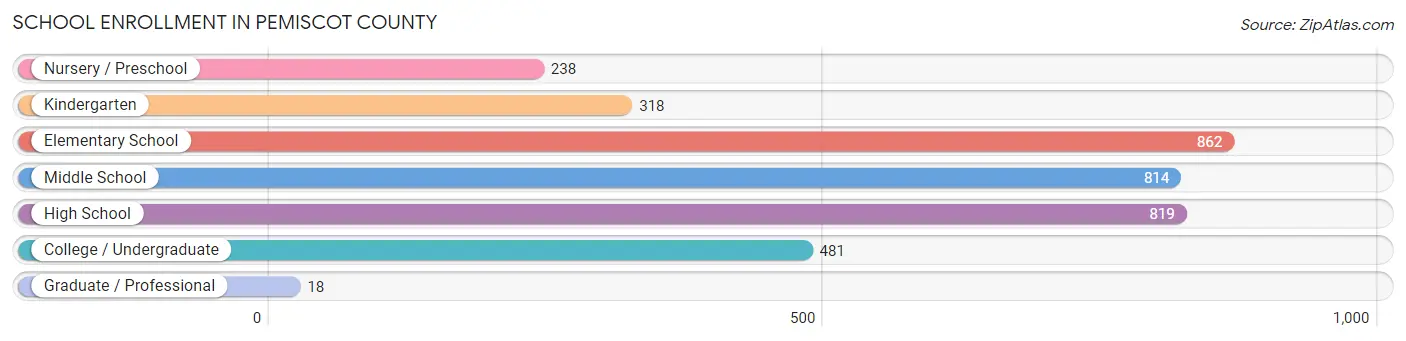
School Enrollment in Pemiscot County
The most common levels of schooling among the 3,550 students in Pemiscot County are elementary school (862 | 24.3%), high school (819 | 23.1%), and middle school (814 | 22.9%).
| School Level | # Students | % Students |
| Nursery / Preschool | 238 | 6.7% |
| Kindergarten | 318 | 9.0% |
| Elementary School | 862 | 24.3% |
| Middle School | 814 | 22.9% |
| High School | 819 | 23.1% |
| College / Undergraduate | 481 | 13.6% |
| Graduate / Professional | 18 | 0.5% |
| Total | 3,550 | 100.0% |
School Enrollment by Age by Funding Source in Pemiscot County
Out of a total of 3,550 students who are enrolled in schools in Pemiscot County, 227 (6.4%) attend a private institution, while the remaining 3,323 (93.6%) are enrolled in public schools. The age group of 35 years and over has the highest likelihood of being enrolled in private schools, with 16 (23.9% in the age bracket) enrolled. Conversely, the age group of 18 to 19 year olds has the lowest likelihood of being enrolled in a private school, with 221 (100.0% in the age bracket) attending a public institution.
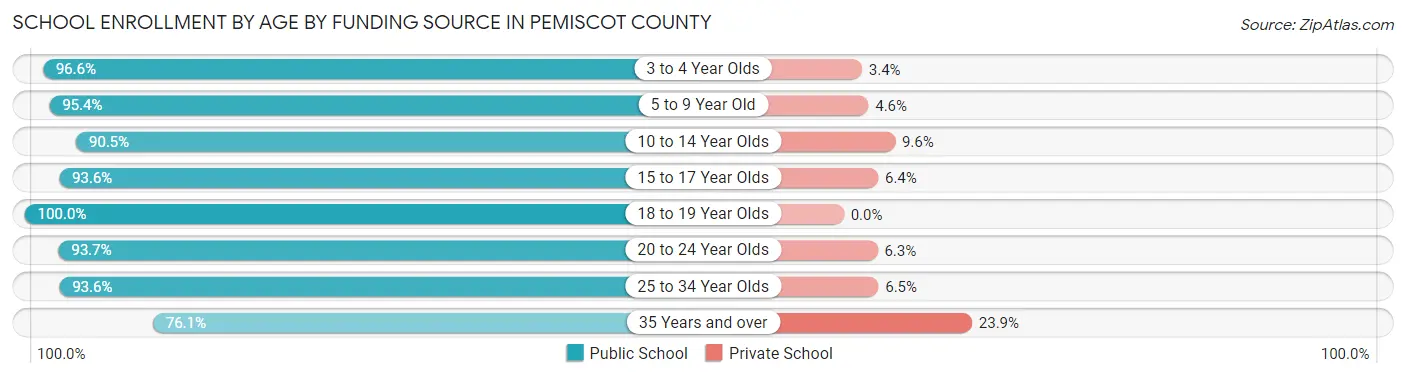
| Age Bracket | Public School | Private School |
| 3 to 4 Year Olds | 200 (96.6%) | 7 (3.4%) |
| 5 to 9 Year Old | 1,061 (95.4%) | 51 (4.6%) |
| 10 to 14 Year Olds | 862 (90.4%) | 91 (9.6%) |
| 15 to 17 Year Olds | 556 (93.6%) | 38 (6.4%) |
| 18 to 19 Year Olds | 221 (100.0%) | 0 (0.0%) |
| 20 to 24 Year Olds | 313 (93.7%) | 21 (6.3%) |
| 25 to 34 Year Olds | 58 (93.5%) | 4 (6.5%) |
| 35 Years and over | 51 (76.1%) | 16 (23.9%) |
| Total | 3,323 (93.6%) | 227 (6.4%) |
Educational Attainment by Field of Study in Pemiscot County
Education (443 | 35.6%), business (274 | 22.0%), bio, nature & agricultural (125 | 10.1%), science & technology (89 | 7.2%), and social sciences (70 | 5.6%) are the most common fields of study among 1,243 individuals in Pemiscot County who have obtained a bachelor's degree or higher.
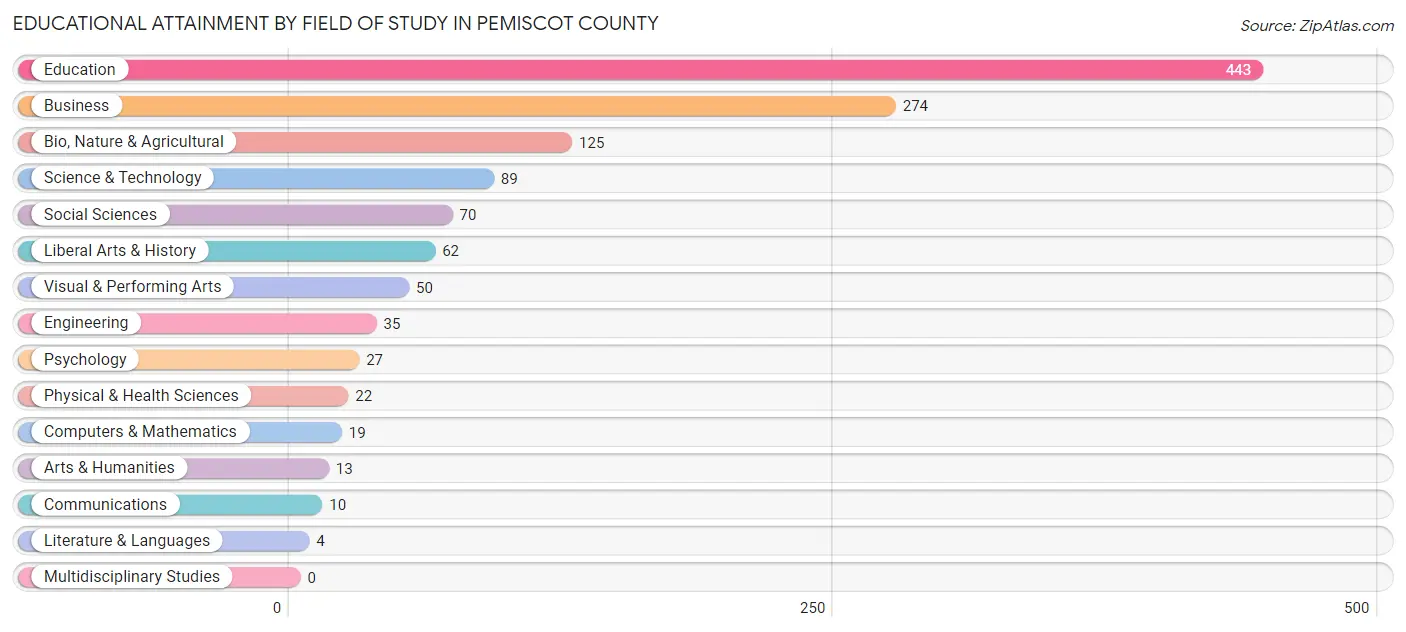
| Field of Study | # Graduates | % Graduates |
| Computers & Mathematics | 19 | 1.5% |
| Bio, Nature & Agricultural | 125 | 10.1% |
| Physical & Health Sciences | 22 | 1.8% |
| Psychology | 27 | 2.2% |
| Social Sciences | 70 | 5.6% |
| Engineering | 35 | 2.8% |
| Multidisciplinary Studies | 0 | 0.0% |
| Science & Technology | 89 | 7.2% |
| Business | 274 | 22.0% |
| Education | 443 | 35.6% |
| Literature & Languages | 4 | 0.3% |
| Liberal Arts & History | 62 | 5.0% |
| Visual & Performing Arts | 50 | 4.0% |
| Communications | 10 | 0.8% |
| Arts & Humanities | 13 | 1.1% |
| Total | 1,243 | 100.0% |
Transportation & Commute in Pemiscot County
Vehicle Availability by Sex in Pemiscot County
The most prevalent vehicle ownership categories in Pemiscot County are males with 2 vehicles (932, accounting for 34.6%) and females with 2 vehicles (834, making up 33.2%).
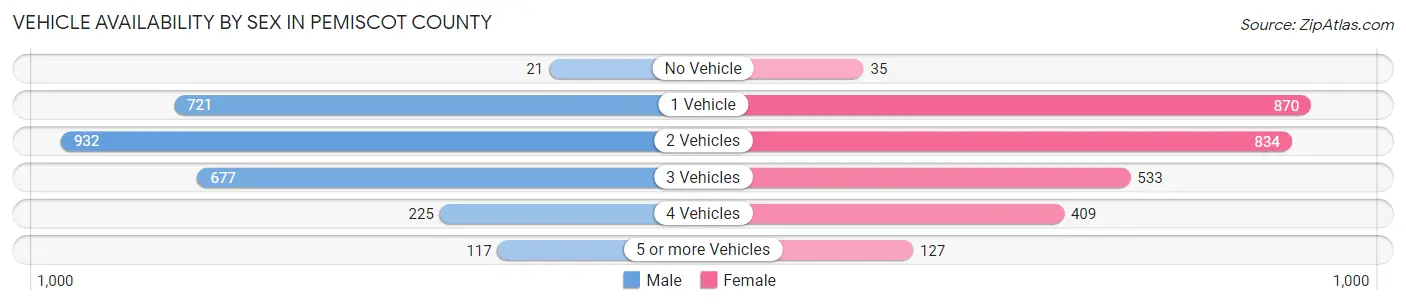
| Vehicles Available | Male | Female |
| No Vehicle | 21 (0.8%) | 35 (1.3%) |
| 1 Vehicle | 721 (26.8%) | 870 (31.0%) |
| 2 Vehicles | 932 (34.6%) | 834 (29.7%) |
| 3 Vehicles | 677 (25.1%) | 533 (19.0%) |
| 4 Vehicles | 225 (8.4%) | 409 (14.6%) |
| 5 or more Vehicles | 117 (4.3%) | 127 (4.5%) |
| Total | 2,693 (100.0%) | 2,808 (100.0%) |
Commute Time in Pemiscot County
The most frequently occuring commute durations in Pemiscot County are 5 to 9 minutes (905 commuters, 17.2%), 20 to 24 minutes (875 commuters, 16.6%), and 10 to 14 minutes (856 commuters, 16.3%).
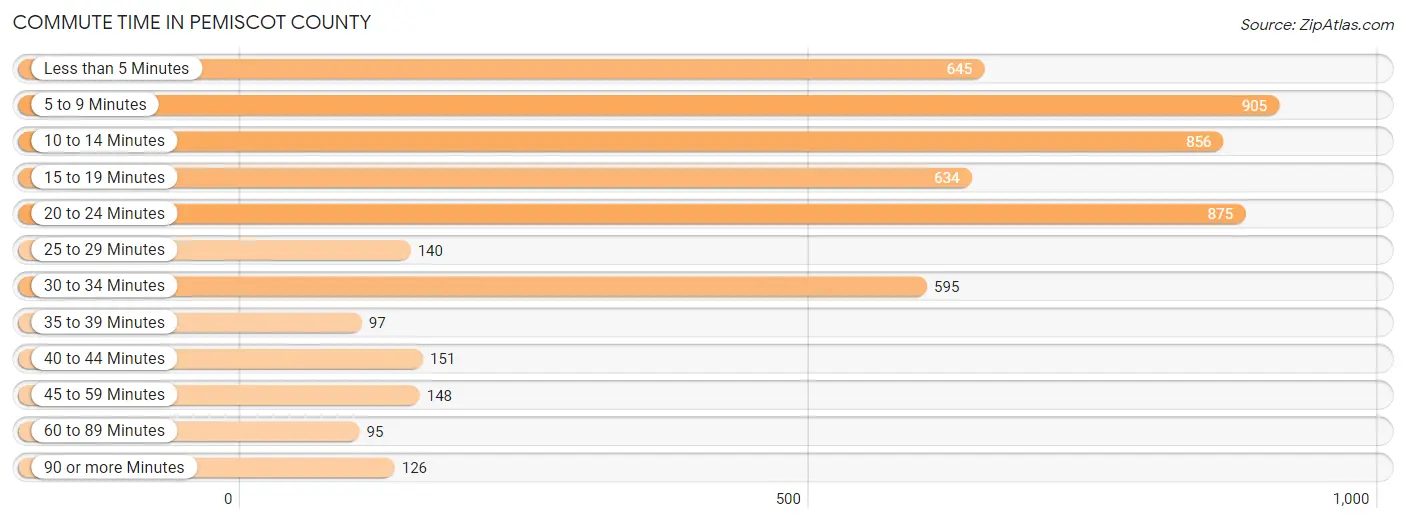
| Commute Time | # Commuters | % Commuters |
| Less than 5 Minutes | 645 | 12.2% |
| 5 to 9 Minutes | 905 | 17.2% |
| 10 to 14 Minutes | 856 | 16.3% |
| 15 to 19 Minutes | 634 | 12.0% |
| 20 to 24 Minutes | 875 | 16.6% |
| 25 to 29 Minutes | 140 | 2.7% |
| 30 to 34 Minutes | 595 | 11.3% |
| 35 to 39 Minutes | 97 | 1.8% |
| 40 to 44 Minutes | 151 | 2.9% |
| 45 to 59 Minutes | 148 | 2.8% |
| 60 to 89 Minutes | 95 | 1.8% |
| 90 or more Minutes | 126 | 2.4% |
Commute Time by Sex in Pemiscot County
The most common commute times in Pemiscot County are 20 to 24 minutes (531 commuters, 21.2%) for males and 5 to 9 minutes (548 commuters, 19.9%) for females.
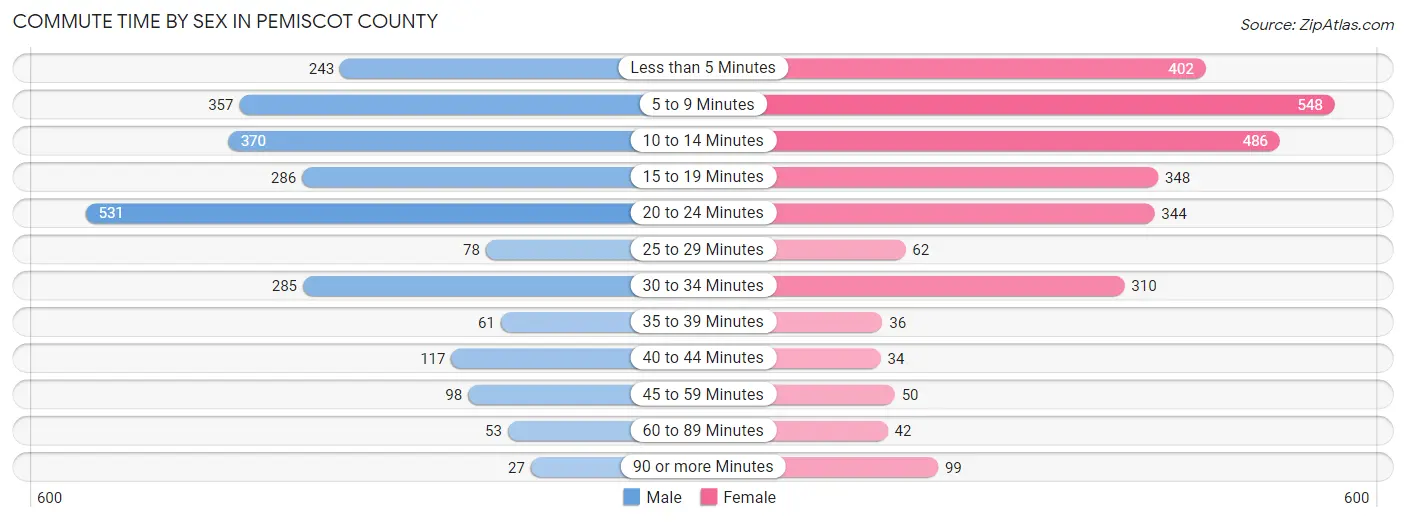
| Commute Time | Male | Female |
| Less than 5 Minutes | 243 (9.7%) | 402 (14.6%) |
| 5 to 9 Minutes | 357 (14.2%) | 548 (19.9%) |
| 10 to 14 Minutes | 370 (14.8%) | 486 (17.6%) |
| 15 to 19 Minutes | 286 (11.4%) | 348 (12.6%) |
| 20 to 24 Minutes | 531 (21.2%) | 344 (12.5%) |
| 25 to 29 Minutes | 78 (3.1%) | 62 (2.2%) |
| 30 to 34 Minutes | 285 (11.4%) | 310 (11.2%) |
| 35 to 39 Minutes | 61 (2.4%) | 36 (1.3%) |
| 40 to 44 Minutes | 117 (4.7%) | 34 (1.2%) |
| 45 to 59 Minutes | 98 (3.9%) | 50 (1.8%) |
| 60 to 89 Minutes | 53 (2.1%) | 42 (1.5%) |
| 90 or more Minutes | 27 (1.1%) | 99 (3.6%) |
Time of Departure to Work by Sex in Pemiscot County
The most frequent times of departure to work in Pemiscot County are 6:00 AM to 6:29 AM (362, 14.4%) for males and 7:30 AM to 7:59 AM (807, 29.2%) for females.

| Time of Departure | Male | Female |
| 12:00 AM to 4:59 AM | 195 (7.8%) | 124 (4.5%) |
| 5:00 AM to 5:29 AM | 287 (11.5%) | 87 (3.2%) |
| 5:30 AM to 5:59 AM | 190 (7.6%) | 49 (1.8%) |
| 6:00 AM to 6:29 AM | 362 (14.4%) | 155 (5.6%) |
| 6:30 AM to 6:59 AM | 303 (12.1%) | 199 (7.2%) |
| 7:00 AM to 7:29 AM | 325 (13.0%) | 405 (14.7%) |
| 7:30 AM to 7:59 AM | 324 (12.9%) | 807 (29.2%) |
| 8:00 AM to 8:29 AM | 160 (6.4%) | 285 (10.3%) |
| 8:30 AM to 8:59 AM | 93 (3.7%) | 144 (5.2%) |
| 9:00 AM to 9:59 AM | 47 (1.9%) | 228 (8.3%) |
| 10:00 AM to 10:59 AM | 13 (0.5%) | 18 (0.6%) |
| 11:00 AM to 11:59 AM | 23 (0.9%) | 10 (0.4%) |
| 12:00 PM to 3:59 PM | 16 (0.6%) | 151 (5.5%) |
| 4:00 PM to 11:59 PM | 168 (6.7%) | 99 (3.6%) |
| Total | 2,506 (100.0%) | 2,761 (100.0%) |
Housing Occupancy in Pemiscot County
Occupancy by Ownership in Pemiscot County
Of the total 6,275 dwellings in Pemiscot County, owner-occupied units account for 3,530 (56.2%), while renter-occupied units make up 2,745 (43.8%).
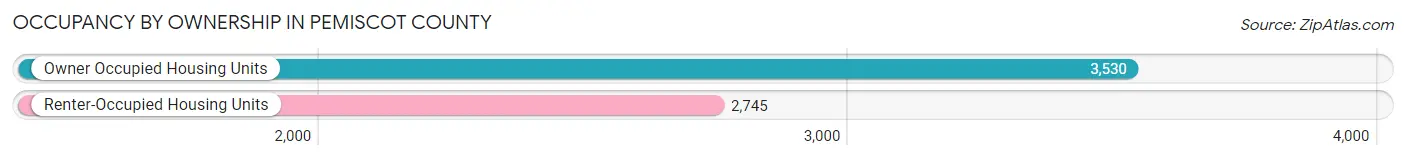
| Occupancy | # Housing Units | % Housing Units |
| Owner Occupied Housing Units | 3,530 | 56.2% |
| Renter-Occupied Housing Units | 2,745 | 43.8% |
| Total Occupied Housing Units | 6,275 | 100.0% |
Occupancy by Household Size in Pemiscot County
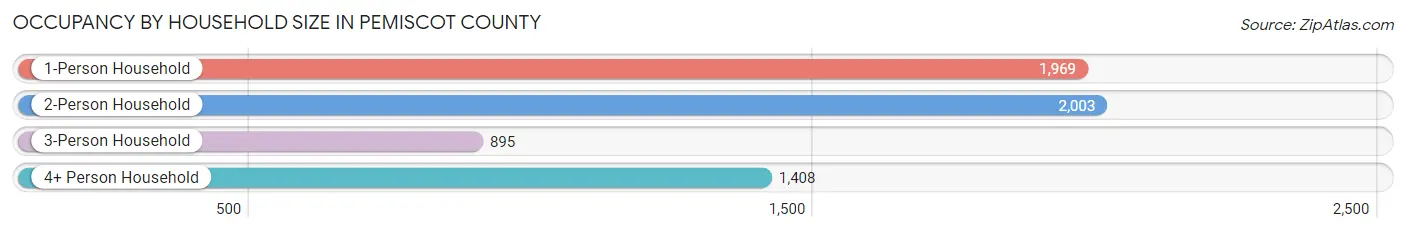
| Household Size | # Housing Units | % Housing Units |
| 1-Person Household | 1,969 | 31.4% |
| 2-Person Household | 2,003 | 31.9% |
| 3-Person Household | 895 | 14.3% |
| 4+ Person Household | 1,408 | 22.4% |
| Total Housing Units | 6,275 | 100.0% |
Occupancy by Ownership by Household Size in Pemiscot County
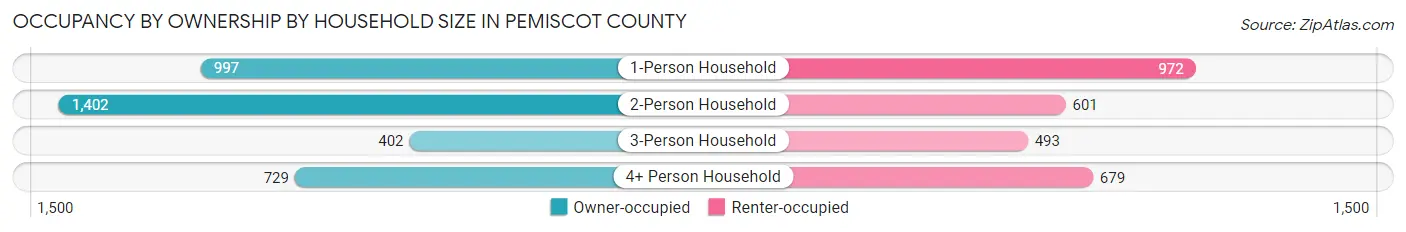
| Household Size | Owner-occupied | Renter-occupied |
| 1-Person Household | 997 (50.6%) | 972 (49.4%) |
| 2-Person Household | 1,402 (70.0%) | 601 (30.0%) |
| 3-Person Household | 402 (44.9%) | 493 (55.1%) |
| 4+ Person Household | 729 (51.8%) | 679 (48.2%) |
| Total Housing Units | 3,530 (56.2%) | 2,745 (43.8%) |
Occupancy by Educational Attainment in Pemiscot County
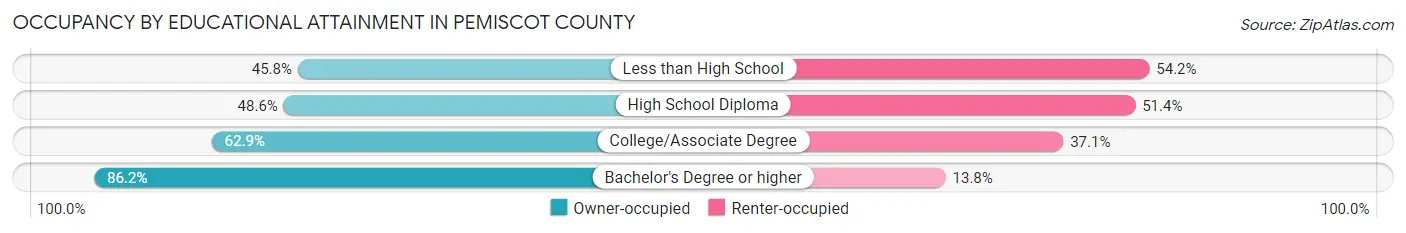
| Household Size | Owner-occupied | Renter-occupied |
| Less than High School | 483 (45.8%) | 571 (54.2%) |
| High School Diploma | 1,427 (48.6%) | 1,507 (51.4%) |
| College/Associate Degree | 950 (62.9%) | 560 (37.1%) |
| Bachelor's Degree or higher | 670 (86.2%) | 107 (13.8%) |
Occupancy by Age of Householder in Pemiscot County
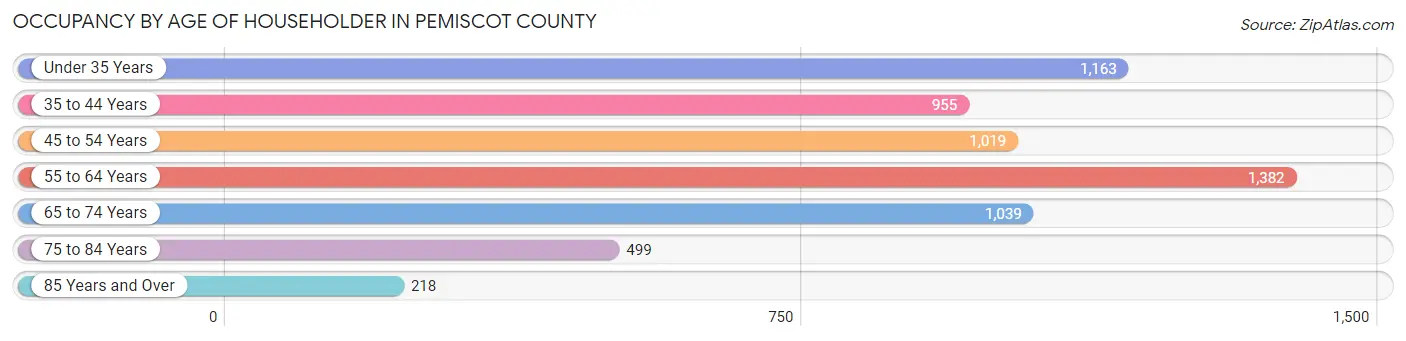
| Age Bracket | # Households | % Households |
| Under 35 Years | 1,163 | 18.5% |
| 35 to 44 Years | 955 | 15.2% |
| 45 to 54 Years | 1,019 | 16.2% |
| 55 to 64 Years | 1,382 | 22.0% |
| 65 to 74 Years | 1,039 | 16.6% |
| 75 to 84 Years | 499 | 8.0% |
| 85 Years and Over | 218 | 3.5% |
| Total | 6,275 | 100.0% |
Housing Finances in Pemiscot County
Median Income by Occupancy in Pemiscot County
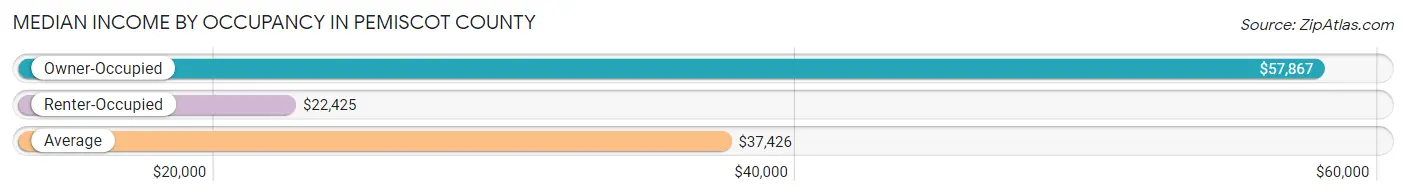
| Occupancy Type | # Households | Median Income |
| Owner-Occupied | 3,530 (56.2%) | $57,867 |
| Renter-Occupied | 2,745 (43.8%) | $22,425 |
| Average | 6,275 (100.0%) | $37,426 |
Occupancy by Householder Income Bracket in Pemiscot County
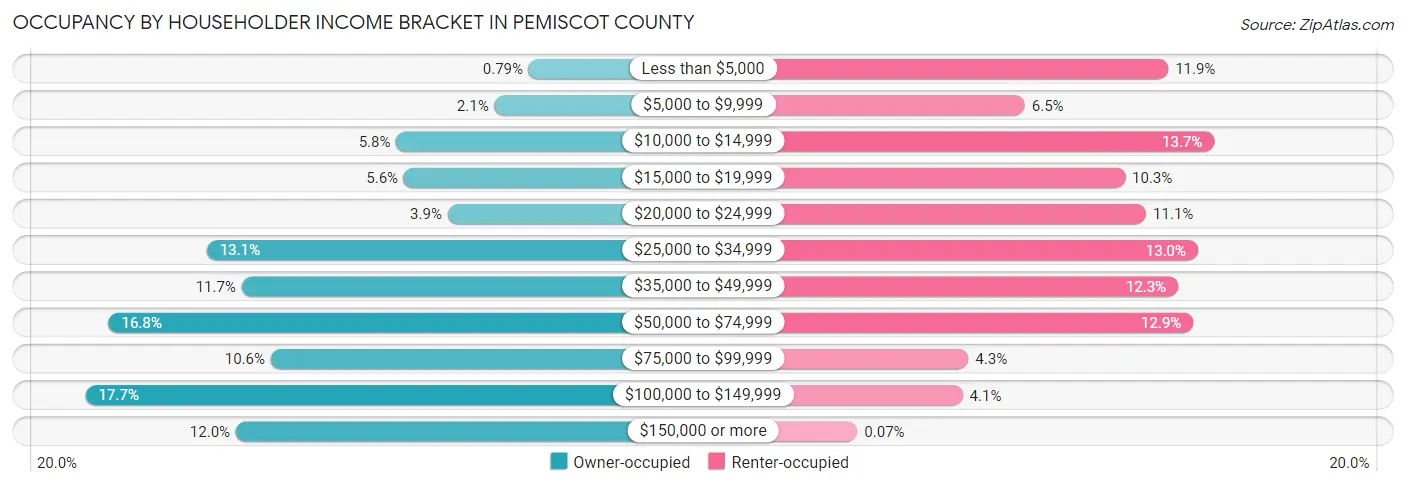
| Income Bracket | Owner-occupied | Renter-occupied |
| Less than $5,000 | 28 (0.8%) | 327 (11.9%) |
| $5,000 to $9,999 | 74 (2.1%) | 177 (6.5%) |
| $10,000 to $14,999 | 206 (5.8%) | 375 (13.7%) |
| $15,000 to $19,999 | 196 (5.6%) | 282 (10.3%) |
| $20,000 to $24,999 | 137 (3.9%) | 304 (11.1%) |
| $25,000 to $34,999 | 461 (13.1%) | 358 (13.0%) |
| $35,000 to $49,999 | 414 (11.7%) | 337 (12.3%) |
| $50,000 to $74,999 | 593 (16.8%) | 353 (12.9%) |
| $75,000 to $99,999 | 375 (10.6%) | 118 (4.3%) |
| $100,000 to $149,999 | 624 (17.7%) | 112 (4.1%) |
| $150,000 or more | 422 (11.9%) | 2 (0.1%) |
| Total | 3,530 (100.0%) | 2,745 (100.0%) |
Monthly Housing Cost Tiers in Pemiscot County
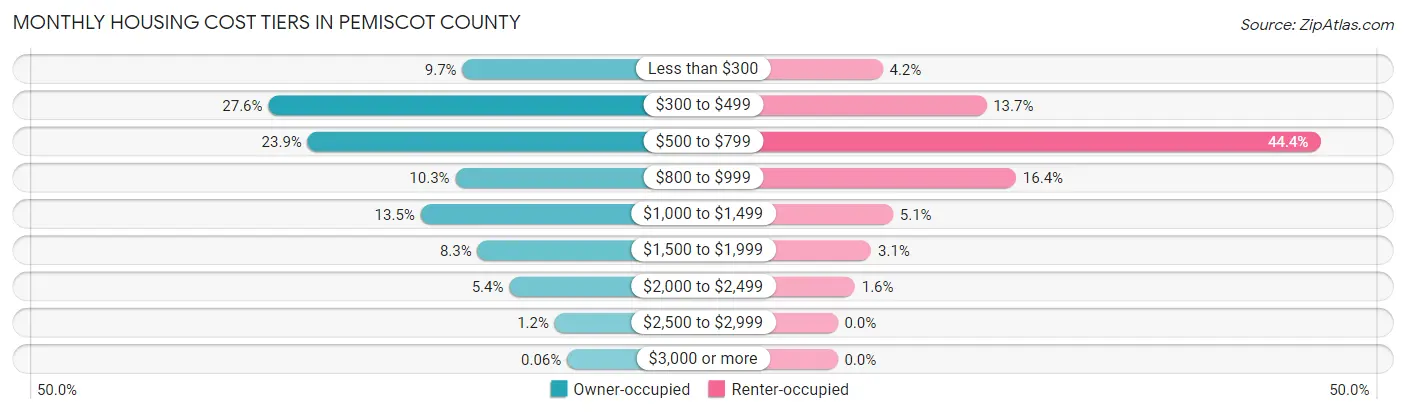
| Monthly Cost | Owner-occupied | Renter-occupied |
| Less than $300 | 342 (9.7%) | 114 (4.2%) |
| $300 to $499 | 973 (27.6%) | 376 (13.7%) |
| $500 to $799 | 845 (23.9%) | 1,220 (44.4%) |
| $800 to $999 | 365 (10.3%) | 451 (16.4%) |
| $1,000 to $1,499 | 478 (13.5%) | 140 (5.1%) |
| $1,500 to $1,999 | 293 (8.3%) | 85 (3.1%) |
| $2,000 to $2,499 | 190 (5.4%) | 44 (1.6%) |
| $2,500 to $2,999 | 42 (1.2%) | 0 (0.0%) |
| $3,000 or more | 2 (0.1%) | 0 (0.0%) |
| Total | 3,530 (100.0%) | 2,745 (100.0%) |
Physical Housing Characteristics in Pemiscot County
Housing Structures in Pemiscot County
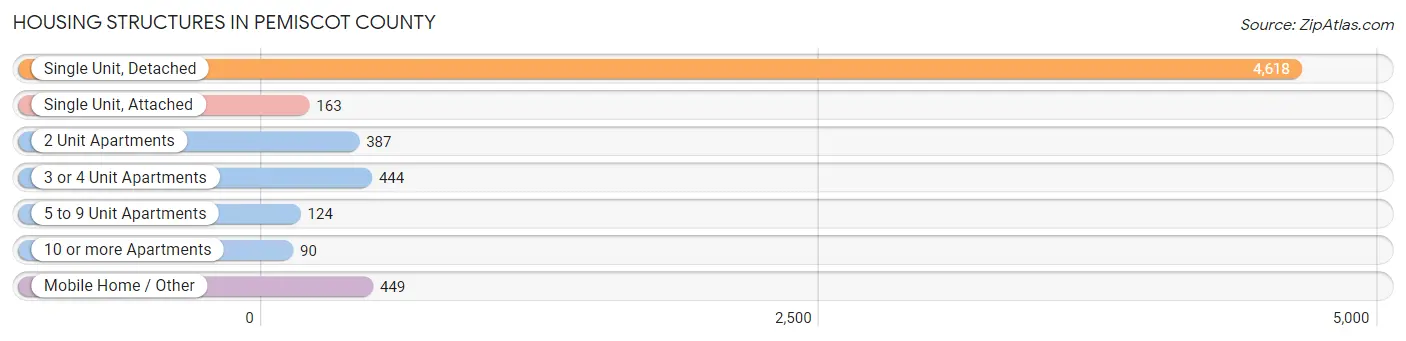
| Structure Type | # Housing Units | % Housing Units |
| Single Unit, Detached | 4,618 | 73.6% |
| Single Unit, Attached | 163 | 2.6% |
| 2 Unit Apartments | 387 | 6.2% |
| 3 or 4 Unit Apartments | 444 | 7.1% |
| 5 to 9 Unit Apartments | 124 | 2.0% |
| 10 or more Apartments | 90 | 1.4% |
| Mobile Home / Other | 449 | 7.2% |
| Total | 6,275 | 100.0% |
Housing Structures by Occupancy in Pemiscot County
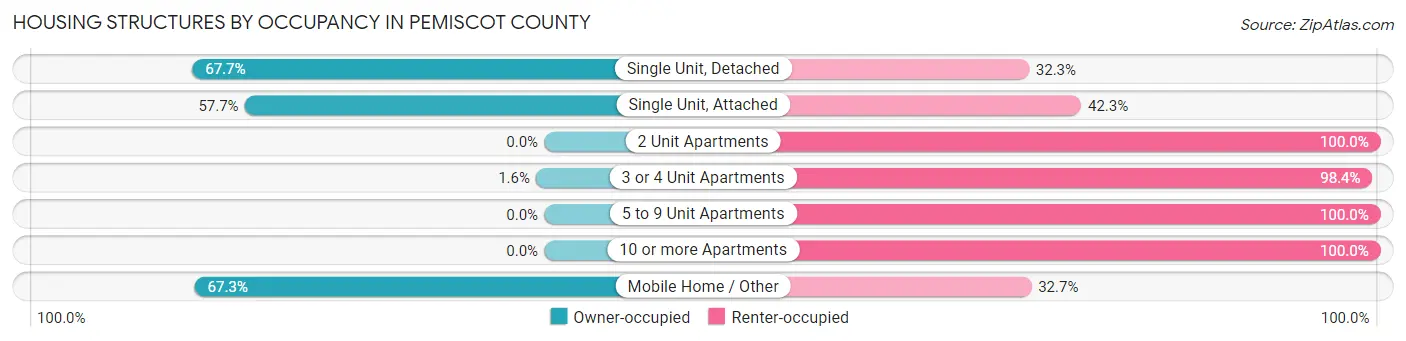
| Structure Type | Owner-occupied | Renter-occupied |
| Single Unit, Detached | 3,127 (67.7%) | 1,491 (32.3%) |
| Single Unit, Attached | 94 (57.7%) | 69 (42.3%) |
| 2 Unit Apartments | 0 (0.0%) | 387 (100.0%) |
| 3 or 4 Unit Apartments | 7 (1.6%) | 437 (98.4%) |
| 5 to 9 Unit Apartments | 0 (0.0%) | 124 (100.0%) |
| 10 or more Apartments | 0 (0.0%) | 90 (100.0%) |
| Mobile Home / Other | 302 (67.3%) | 147 (32.7%) |
| Total | 3,530 (56.2%) | 2,745 (43.8%) |
Housing Structures by Number of Rooms in Pemiscot County
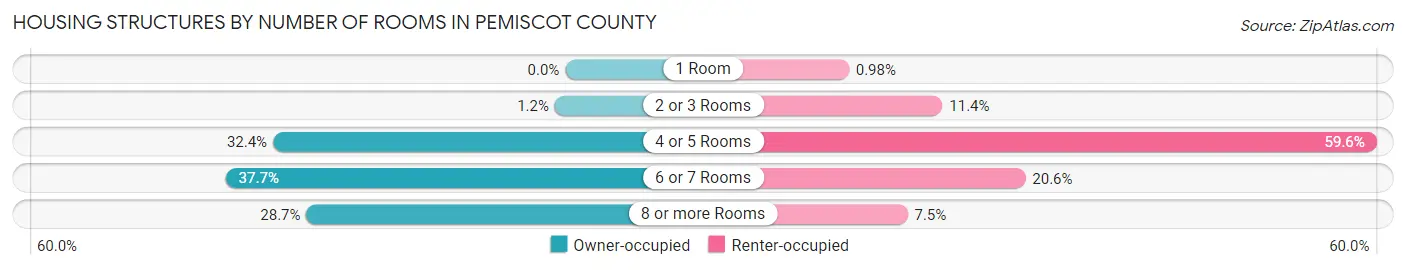
| Number of Rooms | Owner-occupied | Renter-occupied |
| 1 Room | 0 (0.0%) | 27 (1.0%) |
| 2 or 3 Rooms | 41 (1.2%) | 312 (11.4%) |
| 4 or 5 Rooms | 1,145 (32.4%) | 1,635 (59.6%) |
| 6 or 7 Rooms | 1,330 (37.7%) | 565 (20.6%) |
| 8 or more Rooms | 1,014 (28.7%) | 206 (7.5%) |
| Total | 3,530 (100.0%) | 2,745 (100.0%) |
Housing Structure by Heating Type in Pemiscot County
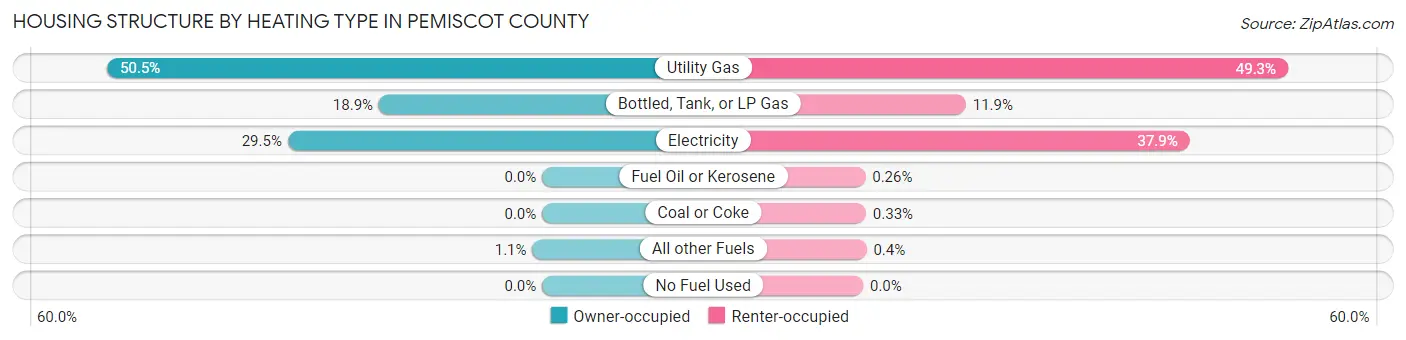
| Heating Type | Owner-occupied | Renter-occupied |
| Utility Gas | 1,781 (50.4%) | 1,352 (49.2%) |
| Bottled, Tank, or LP Gas | 668 (18.9%) | 327 (11.9%) |
| Electricity | 1,041 (29.5%) | 1,039 (37.9%) |
| Fuel Oil or Kerosene | 0 (0.0%) | 7 (0.3%) |
| Coal or Coke | 0 (0.0%) | 9 (0.3%) |
| All other Fuels | 40 (1.1%) | 11 (0.4%) |
| No Fuel Used | 0 (0.0%) | 0 (0.0%) |
| Total | 3,530 (100.0%) | 2,745 (100.0%) |
Household Vehicle Usage in Pemiscot County
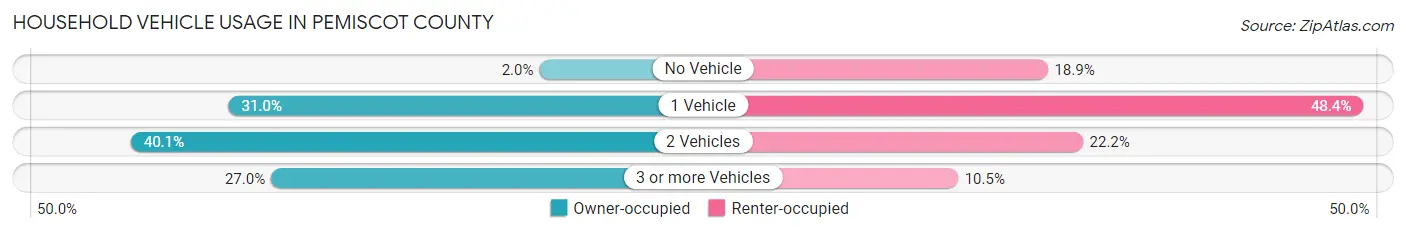
| Vehicles per Household | Owner-occupied | Renter-occupied |
| No Vehicle | 69 (1.9%) | 519 (18.9%) |
| 1 Vehicle | 1,093 (31.0%) | 1,328 (48.4%) |
| 2 Vehicles | 1,415 (40.1%) | 609 (22.2%) |
| 3 or more Vehicles | 953 (27.0%) | 289 (10.5%) |
| Total | 3,530 (100.0%) | 2,745 (100.0%) |
Real Estate & Mortgages in Pemiscot County
Real Estate and Mortgage Overview in Pemiscot County
| Characteristic | Without Mortgage | With Mortgage |
| Housing Units | 1,999 | 1,531 |
| Median Property Value | $81,400 | $126,700 |
| Median Household Income | $41,625 | $253 |
| Monthly Housing Costs | $440 | $2 |
| Real Estate Taxes | $721 | $22 |
Property Value by Mortgage Status in Pemiscot County
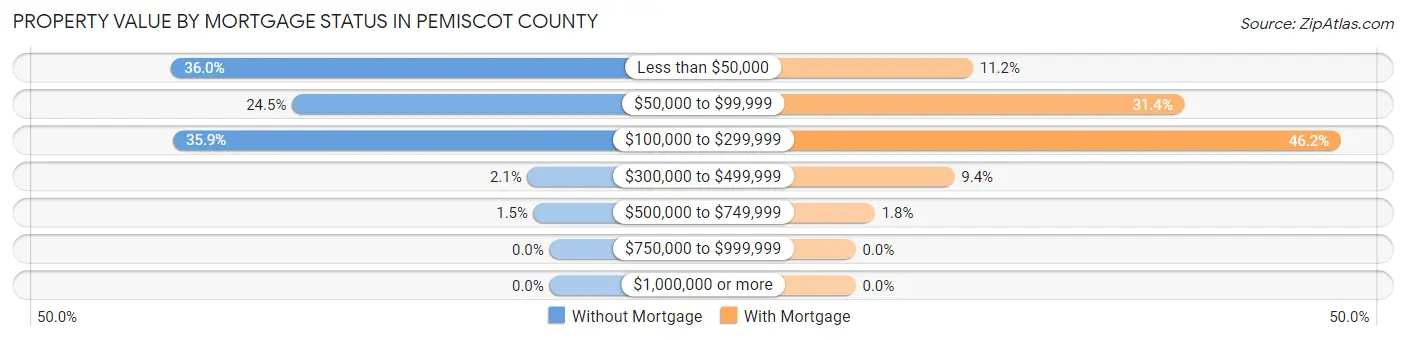
| Property Value | Without Mortgage | With Mortgage |
| Less than $50,000 | 720 (36.0%) | 171 (11.2%) |
| $50,000 to $99,999 | 490 (24.5%) | 480 (31.4%) |
| $100,000 to $299,999 | 717 (35.9%) | 708 (46.2%) |
| $300,000 to $499,999 | 42 (2.1%) | 144 (9.4%) |
| $500,000 to $749,999 | 30 (1.5%) | 28 (1.8%) |
| $750,000 to $999,999 | 0 (0.0%) | 0 (0.0%) |
| $1,000,000 or more | 0 (0.0%) | 0 (0.0%) |
| Total | 1,999 (100.0%) | 1,531 (100.0%) |
Household Income by Mortgage Status in Pemiscot County
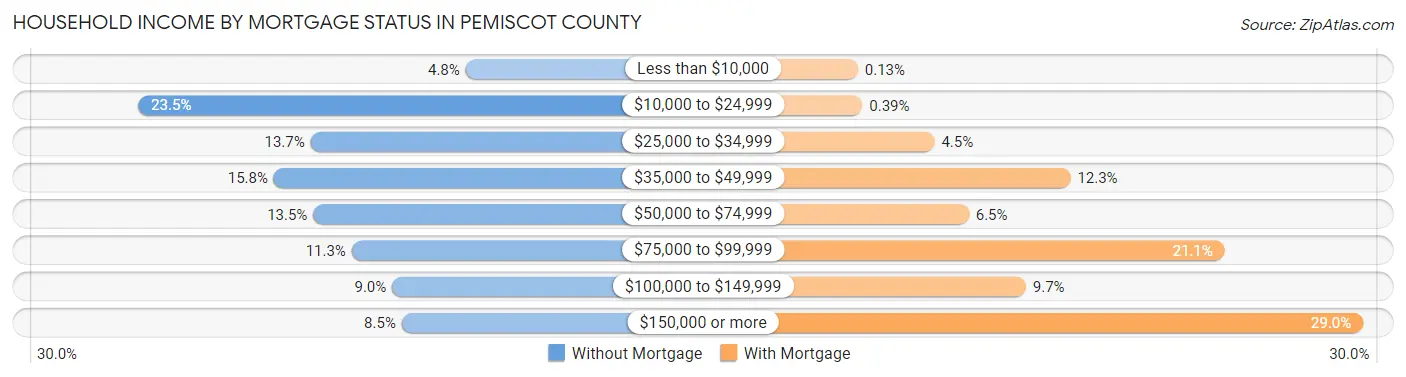
| Household Income | Without Mortgage | With Mortgage |
| Less than $10,000 | 96 (4.8%) | 2 (0.1%) |
| $10,000 to $24,999 | 470 (23.5%) | 6 (0.4%) |
| $25,000 to $34,999 | 273 (13.7%) | 69 (4.5%) |
| $35,000 to $49,999 | 315 (15.8%) | 188 (12.3%) |
| $50,000 to $74,999 | 270 (13.5%) | 99 (6.5%) |
| $75,000 to $99,999 | 226 (11.3%) | 323 (21.1%) |
| $100,000 to $149,999 | 180 (9.0%) | 149 (9.7%) |
| $150,000 or more | 169 (8.5%) | 444 (29.0%) |
| Total | 1,999 (100.0%) | 1,531 (100.0%) |
Property Value to Household Income Ratio in Pemiscot County
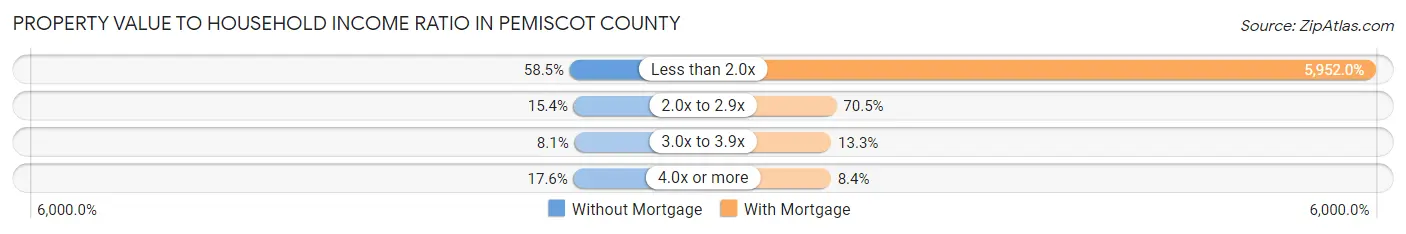
| Value-to-Income Ratio | Without Mortgage | With Mortgage |
| Less than 2.0x | 1,169 (58.5%) | 91,125 (5,952.0%) |
| 2.0x to 2.9x | 308 (15.4%) | 1,079 (70.5%) |
| 3.0x to 3.9x | 161 (8.1%) | 204 (13.3%) |
| 4.0x or more | 352 (17.6%) | 128 (8.4%) |
| Total | 1,999 (100.0%) | 1,531 (100.0%) |
Real Estate Taxes by Mortgage Status in Pemiscot County
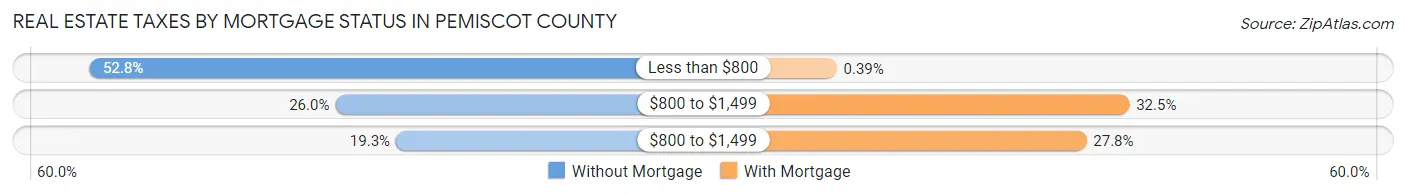
| Property Taxes | Without Mortgage | With Mortgage |
| Less than $800 | 1,056 (52.8%) | 6 (0.4%) |
| $800 to $1,499 | 519 (26.0%) | 497 (32.5%) |
| $800 to $1,499 | 386 (19.3%) | 425 (27.8%) |
| Total | 1,999 (100.0%) | 1,531 (100.0%) |
Health & Disability in Pemiscot County
Health Insurance Coverage by Age in Pemiscot County
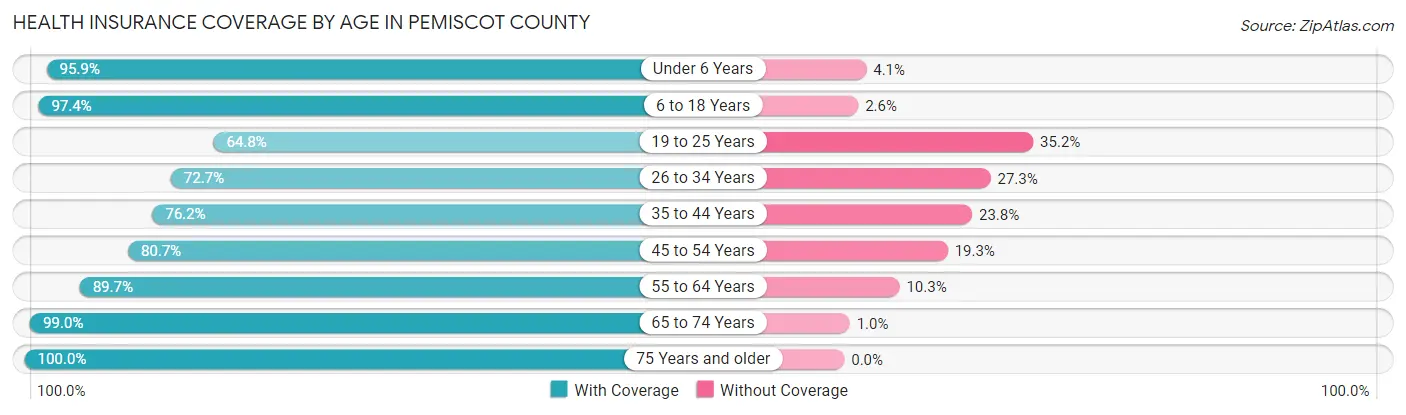
| Age Bracket | With Coverage | Without Coverage |
| Under 6 Years | 1,241 (95.9%) | 53 (4.1%) |
| 6 to 18 Years | 2,901 (97.4%) | 77 (2.6%) |
| 19 to 25 Years | 767 (64.8%) | 417 (35.2%) |
| 26 to 34 Years | 1,186 (72.7%) | 445 (27.3%) |
| 35 to 44 Years | 1,359 (76.2%) | 425 (23.8%) |
| 45 to 54 Years | 1,453 (80.7%) | 347 (19.3%) |
| 55 to 64 Years | 1,866 (89.7%) | 214 (10.3%) |
| 65 to 74 Years | 1,567 (99.0%) | 16 (1.0%) |
| 75 Years and older | 1,046 (100.0%) | 0 (0.0%) |
| Total | 13,386 (87.0%) | 1,994 (13.0%) |
Health Insurance Coverage by Citizenship Status in Pemiscot County
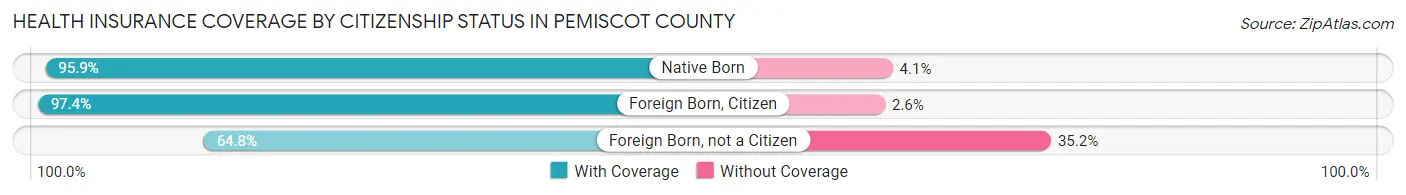
| Citizenship Status | With Coverage | Without Coverage |
| Native Born | 1,241 (95.9%) | 53 (4.1%) |
| Foreign Born, Citizen | 2,901 (97.4%) | 77 (2.6%) |
| Foreign Born, not a Citizen | 767 (64.8%) | 417 (35.2%) |
Health Insurance Coverage by Household Income in Pemiscot County
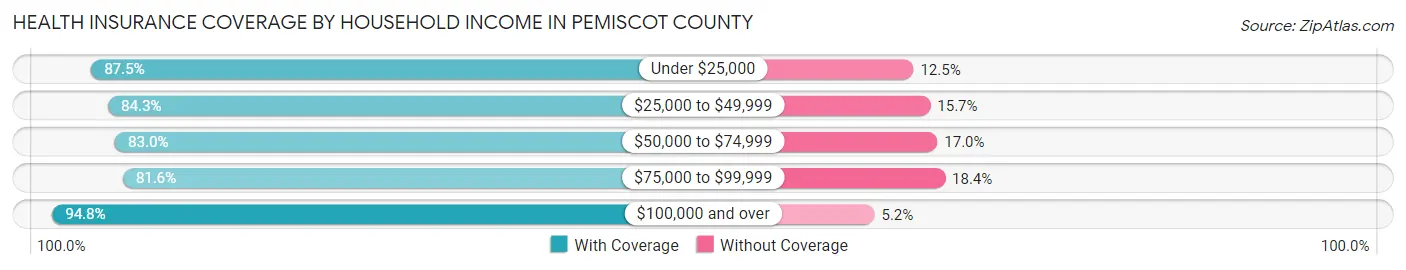
| Household Income | With Coverage | Without Coverage |
| Under $25,000 | 3,743 (87.5%) | 534 (12.5%) |
| $25,000 to $49,999 | 3,076 (84.3%) | 571 (15.7%) |
| $50,000 to $74,999 | 2,118 (83.0%) | 433 (17.0%) |
| $75,000 to $99,999 | 1,227 (81.6%) | 277 (18.4%) |
| $100,000 and over | 3,207 (94.8%) | 176 (5.2%) |
Public vs Private Health Insurance Coverage by Age in Pemiscot County
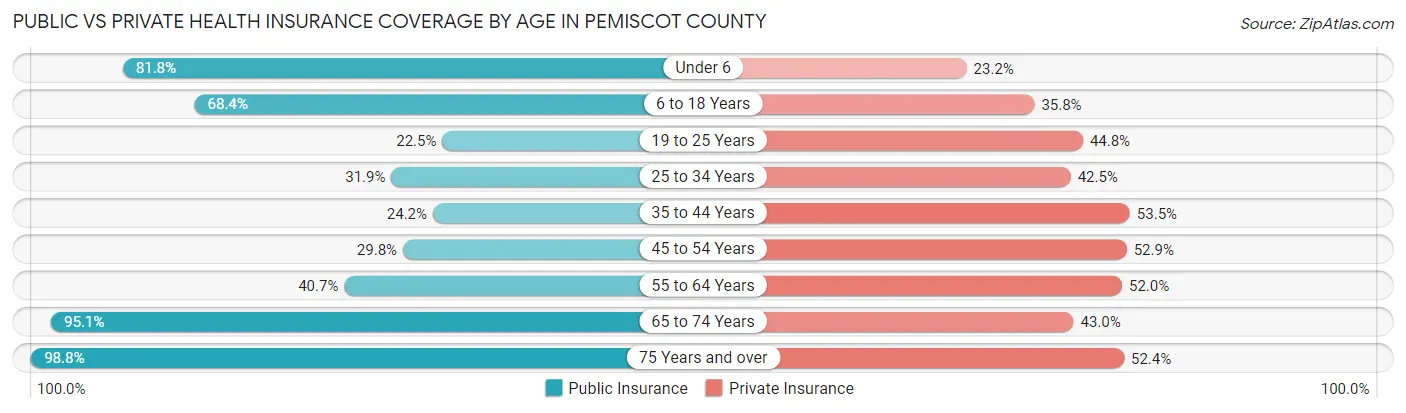
| Age Bracket | Public Insurance | Private Insurance |
| Under 6 | 1,058 (81.8%) | 300 (23.2%) |
| 6 to 18 Years | 2,038 (68.4%) | 1,065 (35.8%) |
| 19 to 25 Years | 266 (22.5%) | 530 (44.8%) |
| 25 to 34 Years | 521 (31.9%) | 693 (42.5%) |
| 35 to 44 Years | 432 (24.2%) | 954 (53.5%) |
| 45 to 54 Years | 536 (29.8%) | 952 (52.9%) |
| 55 to 64 Years | 846 (40.7%) | 1,082 (52.0%) |
| 65 to 74 Years | 1,505 (95.1%) | 681 (43.0%) |
| 75 Years and over | 1,033 (98.8%) | 548 (52.4%) |
| Total | 8,235 (53.5%) | 6,805 (44.3%) |
Disability Status by Sex by Age in Pemiscot County
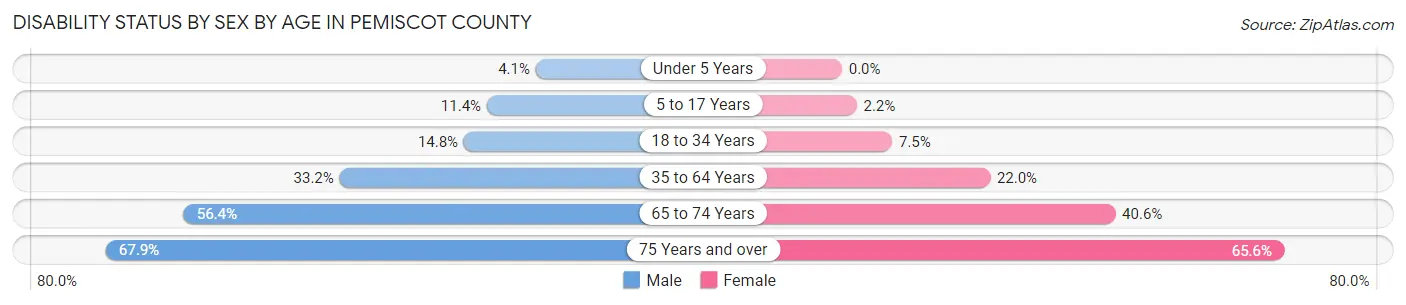
| Age Bracket | Male | Female |
| Under 5 Years | 19 (4.1%) | 0 (0.0%) |
| 5 to 17 Years | 168 (11.4%) | 31 (2.2%) |
| 18 to 34 Years | 223 (14.8%) | 117 (7.5%) |
| 35 to 64 Years | 870 (33.2%) | 670 (22.0%) |
| 65 to 74 Years | 434 (56.4%) | 330 (40.6%) |
| 75 Years and over | 252 (67.9%) | 443 (65.6%) |
Disability Class by Sex by Age in Pemiscot County
Disability Class: Hearing Difficulty
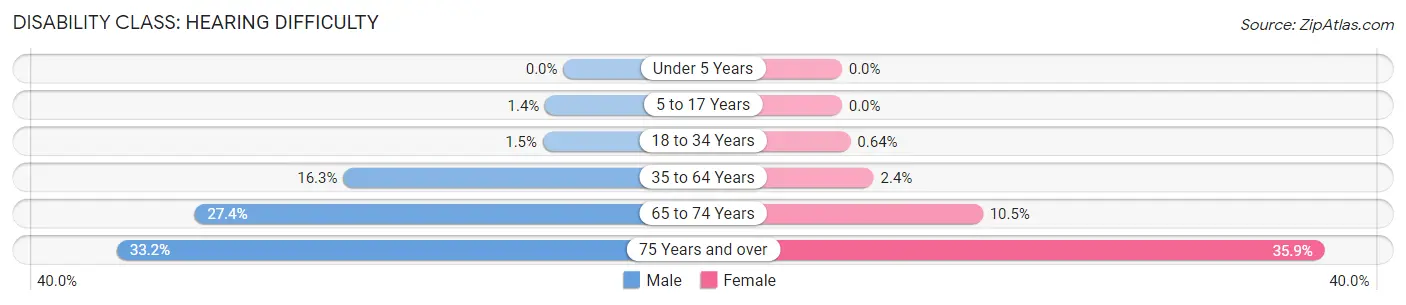
| Age Bracket | Male | Female |
| Under 5 Years | 0 (0.0%) | 0 (0.0%) |
| 5 to 17 Years | 20 (1.3%) | 0 (0.0%) |
| 18 to 34 Years | 23 (1.5%) | 10 (0.6%) |
| 35 to 64 Years | 428 (16.3%) | 72 (2.4%) |
| 65 to 74 Years | 211 (27.4%) | 85 (10.5%) |
| 75 Years and over | 123 (33.2%) | 242 (35.8%) |
Disability Class: Vision Difficulty
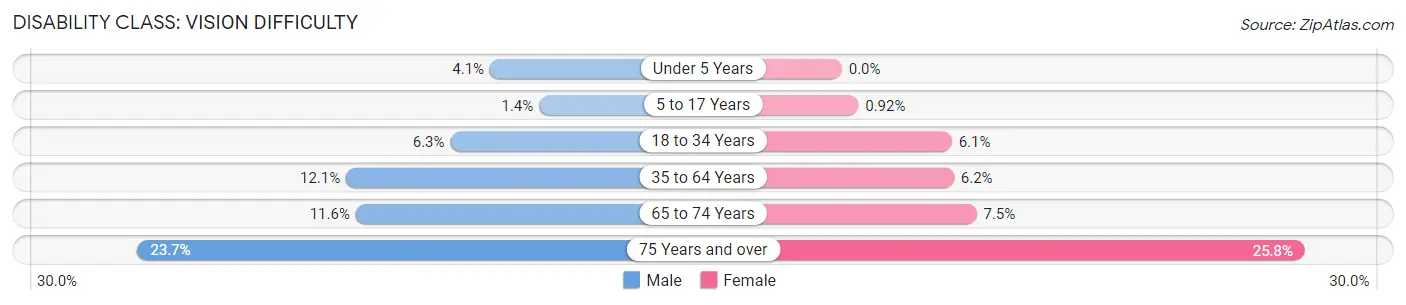
| Age Bracket | Male | Female |
| Under 5 Years | 19 (4.1%) | 0 (0.0%) |
| 5 to 17 Years | 20 (1.3%) | 13 (0.9%) |
| 18 to 34 Years | 95 (6.3%) | 96 (6.1%) |
| 35 to 64 Years | 317 (12.1%) | 190 (6.2%) |
| 65 to 74 Years | 89 (11.6%) | 61 (7.5%) |
| 75 Years and over | 88 (23.7%) | 174 (25.8%) |
Disability Class: Cognitive Difficulty
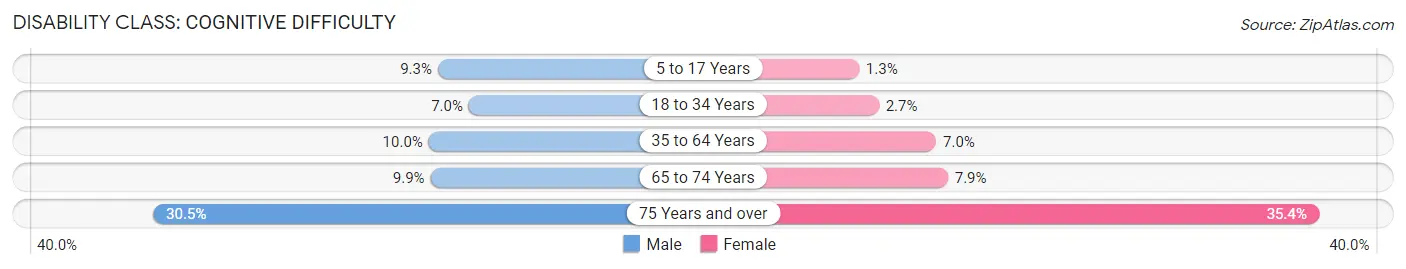
| Age Bracket | Male | Female |
| 5 to 17 Years | 138 (9.3%) | 18 (1.3%) |
| 18 to 34 Years | 106 (7.0%) | 43 (2.7%) |
| 35 to 64 Years | 262 (10.0%) | 213 (7.0%) |
| 65 to 74 Years | 76 (9.9%) | 64 (7.9%) |
| 75 Years and over | 113 (30.5%) | 239 (35.4%) |
Disability Class: Ambulatory Difficulty
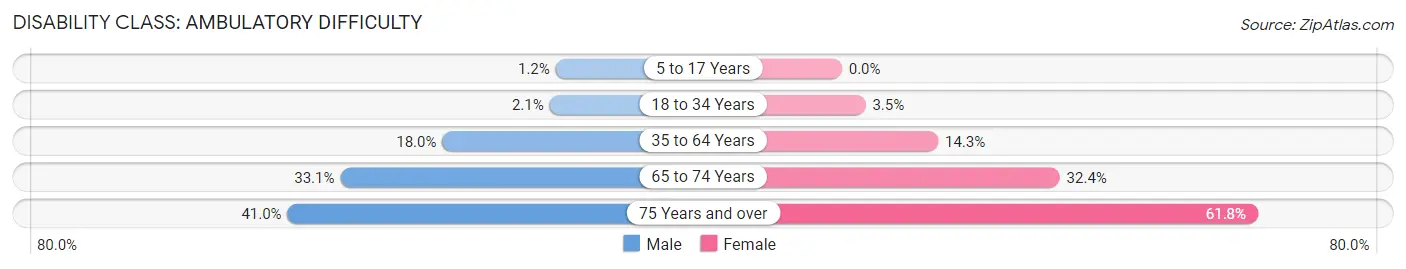
| Age Bracket | Male | Female |
| 5 to 17 Years | 17 (1.1%) | 0 (0.0%) |
| 18 to 34 Years | 31 (2.1%) | 55 (3.5%) |
| 35 to 64 Years | 471 (18.0%) | 435 (14.3%) |
| 65 to 74 Years | 255 (33.1%) | 263 (32.4%) |
| 75 Years and over | 152 (41.0%) | 417 (61.8%) |
Disability Class: Self-Care Difficulty
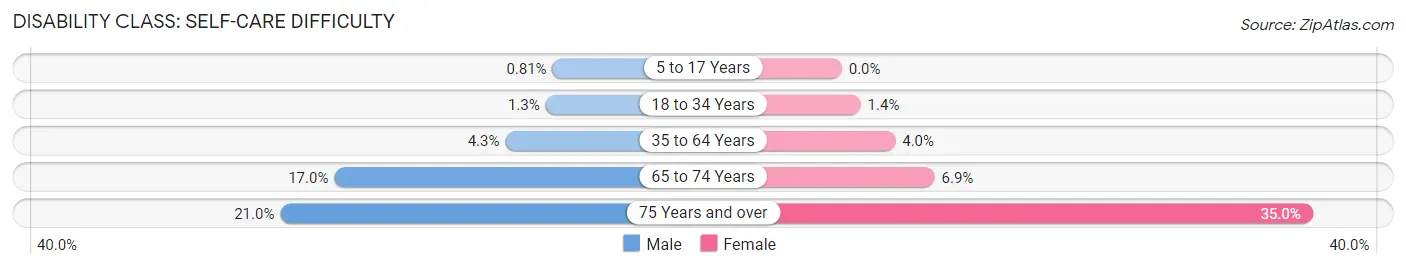
| Age Bracket | Male | Female |
| 5 to 17 Years | 12 (0.8%) | 0 (0.0%) |
| 18 to 34 Years | 20 (1.3%) | 22 (1.4%) |
| 35 to 64 Years | 113 (4.3%) | 121 (4.0%) |
| 65 to 74 Years | 131 (17.0%) | 56 (6.9%) |
| 75 Years and over | 78 (21.0%) | 236 (35.0%) |
Technology Access in Pemiscot County
Computing Device Access in Pemiscot County
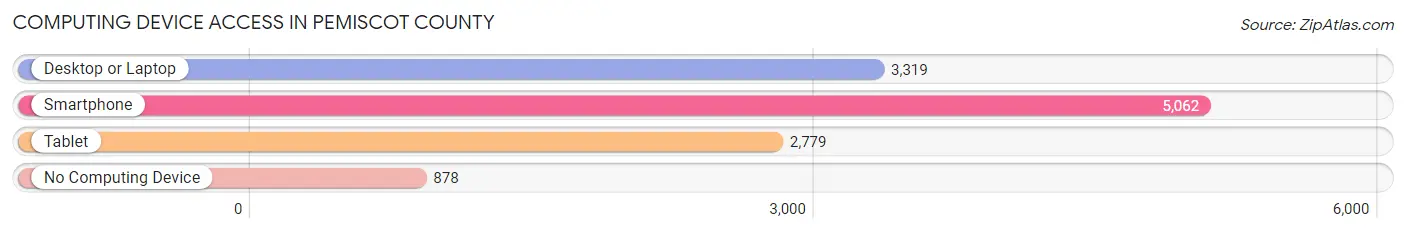
| Device Type | # Households | % Households |
| Desktop or Laptop | 3,319 | 52.9% |
| Smartphone | 5,062 | 80.7% |
| Tablet | 2,779 | 44.3% |
| No Computing Device | 878 | 14.0% |
| Total | 6,275 | 100.0% |
Internet Access in Pemiscot County
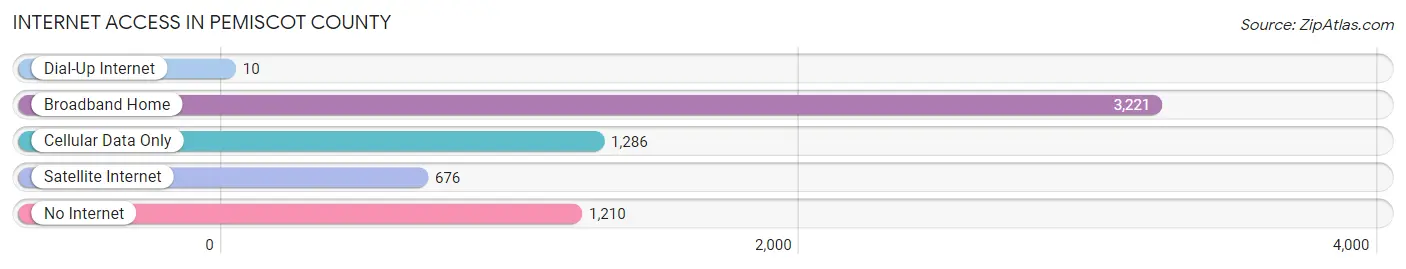
| Internet Type | # Households | % Households |
| Dial-Up Internet | 10 | 0.2% |
| Broadband Home | 3,221 | 51.3% |
| Cellular Data Only | 1,286 | 20.5% |
| Satellite Internet | 676 | 10.8% |
| No Internet | 1,210 | 19.3% |
| Total | 6,275 | 100.0% |
Pemiscot County Summary
Pemiscot County is located in the southeastern corner of Missouri, and is bordered by Arkansas to the south and the Mississippi River to the east. It is part of the Bootheel region of Missouri, and is the second-smallest county in the state. The county seat is Caruthersville, and the county is named after the Pemiscot Bayou, which runs through the county.
History
Pemiscot County was formed in 1851 from parts of New Madrid and Dunklin counties. The county was named after the Pemiscot Bayou, which runs through the county. The county was originally inhabited by the Chickasaw and Choctaw tribes, and the first European settlers arrived in the early 1800s. The county was a major cotton-producing region, and the economy was largely based on agriculture.
During the Civil War, Pemiscot County was a major battleground, with several battles taking place in the county. After the war, the county experienced a period of economic growth, with the development of the railroad and the establishment of several towns.
Geography
Pemiscot County is located in the southeastern corner of Missouri, and is bordered by Arkansas to the south and the Mississippi River to the east. The county is part of the Bootheel region of Missouri, and is the second-smallest county in the state. The county has a total area of 517 square miles, of which 514 square miles is land and 3 square miles is water.
The county is mostly flat, with some rolling hills in the northern part of the county. The highest point in the county is located in the northern part of the county, and is approximately 300 feet above sea level. The county is drained by the Pemiscot Bayou, which runs through the county.
Economy
The economy of Pemiscot County is largely based on agriculture. The county is a major producer of cotton, soybeans, corn, and wheat. The county also has a large timber industry, and is home to several manufacturing plants.
The county also has a large tourism industry, with several attractions, including the historic town of Caruthersville, the Pemiscot Bayou, and the Bootheel Wildlife Museum.
Demographics
As of the 2010 census, Pemiscot County had a population of 18,296. The racial makeup of the county was 79.2% White, 18.3% African American, 0.3% Native American, 0.2% Asian, 0.1% Pacific Islander, 0.7% from other races, and 1.4% from two or more races. Hispanic or Latino of any race were 2.2% of the population.
The median income for a household in the county was $30,945, and the median income for a family was $37,917. The per capita income for the county was $15,945. About 19.2% of the population was below the poverty line.
Common Questions
What is Per Capita Income in Pemiscot County?
Per Capita income in Pemiscot County is $24,295.
What is the Median Family Income in Pemiscot County?
Median Family Income in Pemiscot County is $50,797.
What is the Median Household income in Pemiscot County?
Median Household Income in Pemiscot County is $37,426.
What is Income or Wage Gap in Pemiscot County?
Income or Wage Gap in Pemiscot County is 47.3%.
Women in Pemiscot County earn 52.7 cents for every dollar earned by a man.
What is Family Income Deficit in Pemiscot County?
Family Income Deficit in Pemiscot County is $13,275.
Families that are below poverty line in Pemiscot County earn $13,275 less on average than the poverty threshold level.
What is Inequality or Gini Index in Pemiscot County?
Inequality or Gini Index in Pemiscot County is 0.50.
What is the Total Population of Pemiscot County?
Total Population of Pemiscot County is 15,555.
What is the Total Male Population of Pemiscot County?
Total Male Population of Pemiscot County is 7,304.
What is the Total Female Population of Pemiscot County?
Total Female Population of Pemiscot County is 8,251.
What is the Ratio of Males per 100 Females in Pemiscot County?
There are 88.52 Males per 100 Females in Pemiscot County.
What is the Ratio of Females per 100 Males in Pemiscot County?
There are 112.97 Females per 100 Males in Pemiscot County.
What is the Median Population Age in Pemiscot County?
Median Population Age in Pemiscot County is 39.2 Years.
What is the Average Family Size in Pemiscot County
Average Family Size in Pemiscot County is 3.1 People.
What is the Average Household Size in Pemiscot County
Average Household Size in Pemiscot County is 2.5 People.
How Large is the Labor Force in Pemiscot County?
There are 6,163 People in the Labor Forcein in Pemiscot County.
What is the Percentage of People in the Labor Force in Pemiscot County?
51.1% of People are in the Labor Force in Pemiscot County.
What is the Unemployment Rate in Pemiscot County?
Unemployment Rate in Pemiscot County is 9.6%.