Osage County, MO Map & Demographics
Osage County Map
Osage County Overview
$38,553
PER CAPITA INCOME
$86,042
AVG FAMILY INCOME
$70,313
AVG HOUSEHOLD INCOME
27.5%
WAGE / INCOME GAP [ % ]
72.5¢/ $1
WAGE / INCOME GAP [ $ ]
$6,552
FAMILY INCOME DEFICIT
0.47
INEQUALITY / GINI INDEX
13,374
TOTAL POPULATION
6,899
MALE POPULATION
6,475
FEMALE POPULATION
106.55
MALES / 100 FEMALES
93.85
FEMALES / 100 MALES
41.4
MEDIAN AGE
3.0
AVG FAMILY SIZE
2.5
AVG HOUSEHOLD SIZE
6,784
LABOR FORCE [ PEOPLE ]
63.5%
PERCENT IN LABOR FORCE
1.0%
UNEMPLOYMENT RATE
Osage County Area Codes
Income in Osage County
Income Overview in Osage County
Per Capita Income in Osage County is $38,553, while median incomes of families and households are $86,042 and $70,313 respectively.
| Characteristic | Number | Measure |
| Per Capita Income | 13,374 | $38,553 |
| Median Family Income | 3,637 | $86,042 |
| Mean Family Income | 3,637 | $119,599 |
| Median Household Income | 5,220 | $70,313 |
| Mean Household Income | 5,220 | $96,390 |
| Income Deficit | 3,637 | $6,552 |
| Wage / Income Gap (%) | 13,374 | 27.51% |
| Wage / Income Gap ($) | 13,374 | 72.49¢ per $1 |
| Gini / Inequality Index | 13,374 | 0.47 |
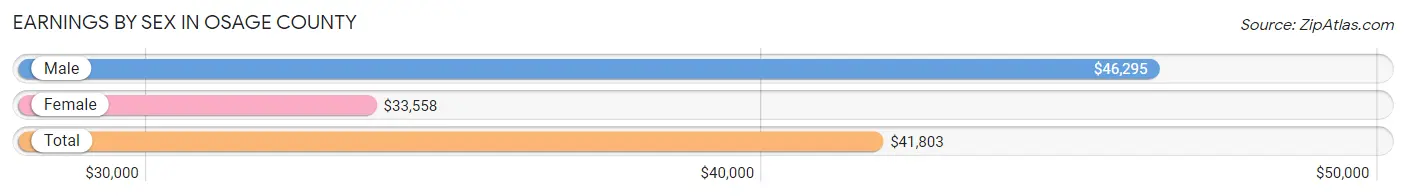
Earnings by Sex in Osage County
Average Earnings in Osage County are $41,803, $46,295 for men and $33,558 for women, a difference of 27.5%.
| Sex | Number | Average Earnings |
| Male | 3,951 (54.4%) | $46,295 |
| Female | 3,308 (45.6%) | $33,558 |
| Total | 7,259 (100.0%) | $41,803 |
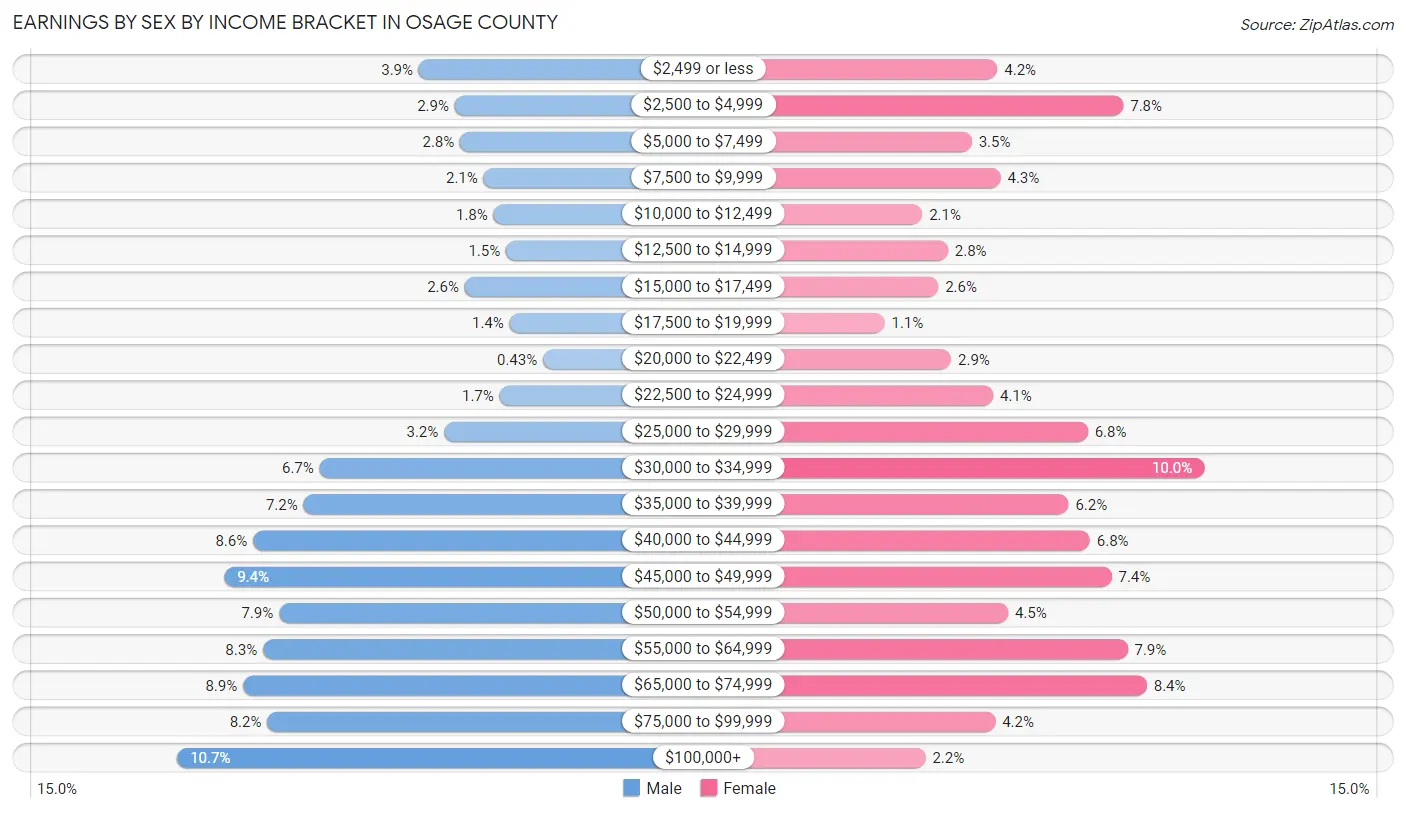
Earnings by Sex by Income Bracket in Osage County
The most common earnings brackets in Osage County are $100,000+ for men (423 | 10.7%) and $30,000 to $34,999 for women (332 | 10.0%).
| Income | Male | Female |
| $2,499 or less | 155 (3.9%) | 140 (4.2%) |
| $2,500 to $4,999 | 115 (2.9%) | 257 (7.8%) |
| $5,000 to $7,499 | 109 (2.8%) | 116 (3.5%) |
| $7,500 to $9,999 | 83 (2.1%) | 143 (4.3%) |
| $10,000 to $12,499 | 72 (1.8%) | 70 (2.1%) |
| $12,500 to $14,999 | 58 (1.5%) | 94 (2.8%) |
| $15,000 to $17,499 | 104 (2.6%) | 85 (2.6%) |
| $17,500 to $19,999 | 54 (1.4%) | 35 (1.1%) |
| $20,000 to $22,499 | 17 (0.4%) | 97 (2.9%) |
| $22,500 to $24,999 | 65 (1.7%) | 136 (4.1%) |
| $25,000 to $29,999 | 127 (3.2%) | 224 (6.8%) |
| $30,000 to $34,999 | 265 (6.7%) | 332 (10.0%) |
| $35,000 to $39,999 | 283 (7.2%) | 206 (6.2%) |
| $40,000 to $44,999 | 339 (8.6%) | 226 (6.8%) |
| $45,000 to $49,999 | 371 (9.4%) | 246 (7.4%) |
| $50,000 to $54,999 | 310 (7.9%) | 150 (4.5%) |
| $55,000 to $64,999 | 328 (8.3%) | 261 (7.9%) |
| $65,000 to $74,999 | 350 (8.9%) | 279 (8.4%) |
| $75,000 to $99,999 | 323 (8.2%) | 138 (4.2%) |
| $100,000+ | 423 (10.7%) | 73 (2.2%) |
| Total | 3,951 (100.0%) | 3,308 (100.0%) |
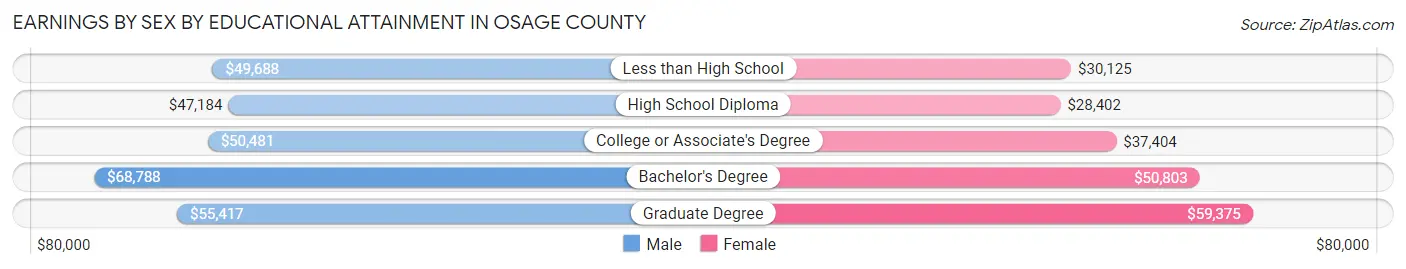
Earnings by Sex by Educational Attainment in Osage County
Average earnings in Osage County are $51,059 for men and $39,350 for women, a difference of 22.9%. Men with an educational attainment of bachelor's degree enjoy the highest average annual earnings of $68,788, while those with high school diploma education earn the least with $47,184. Women with an educational attainment of graduate degree earn the most with the average annual earnings of $59,375, while those with high school diploma education have the smallest earnings of $28,402.
| Educational Attainment | Male Income | Female Income |
| Less than High School | $49,688 | $30,125 |
| High School Diploma | $47,184 | $28,402 |
| College or Associate's Degree | $50,481 | $37,404 |
| Bachelor's Degree | $68,788 | $50,803 |
| Graduate Degree | $55,417 | $59,375 |
| Total | $51,059 | $39,350 |
Family Income in Osage County
Family Income Brackets in Osage County
According to the Osage County family income data, there are 935 families falling into the $100,000 to $149,999 income range, which is the most common income bracket and makes up 25.7% of all families. Conversely, the less than $10,000 income bracket is the least frequent group with only 25 families (0.7%) belonging to this category.
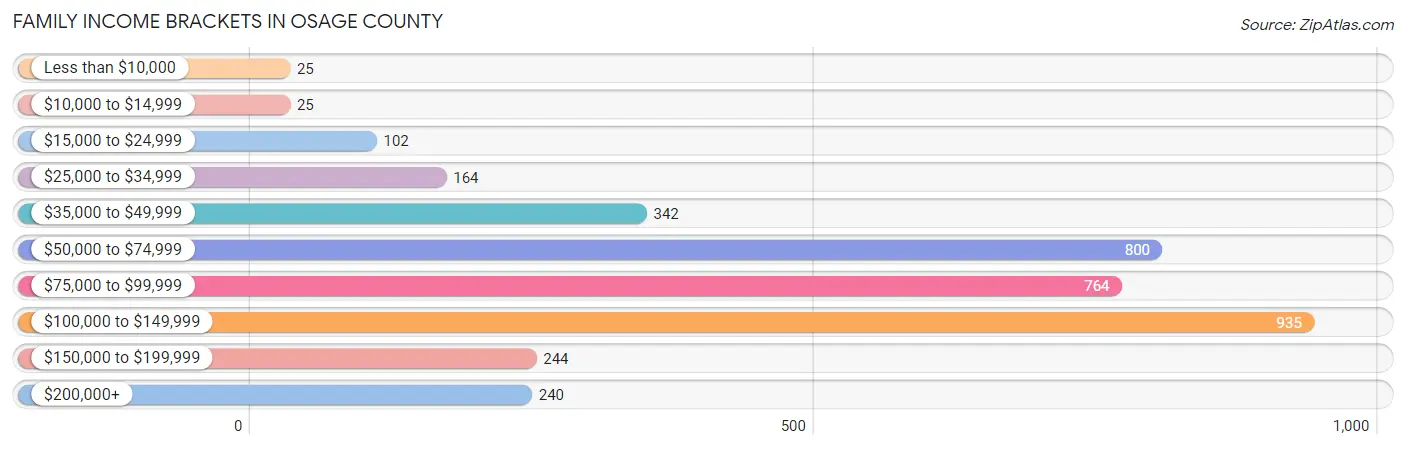
| Income Bracket | # Families | % Families |
| Less than $10,000 | 25 | 0.7% |
| $10,000 to $14,999 | 25 | 0.7% |
| $15,000 to $24,999 | 102 | 2.8% |
| $25,000 to $34,999 | 164 | 4.5% |
| $35,000 to $49,999 | 342 | 9.4% |
| $50,000 to $74,999 | 800 | 22.0% |
| $75,000 to $99,999 | 764 | 21.0% |
| $100,000 to $149,999 | 935 | 25.7% |
| $150,000 to $199,999 | 244 | 6.7% |
| $200,000+ | 240 | 6.6% |
Family Income by Famaliy Size in Osage County
5-person families (392 | 10.8%) account for the highest median family income in Osage County with $122,109 per family, while 2-person families (1,887 | 51.9%) have the highest median income of $36,962 per family member.
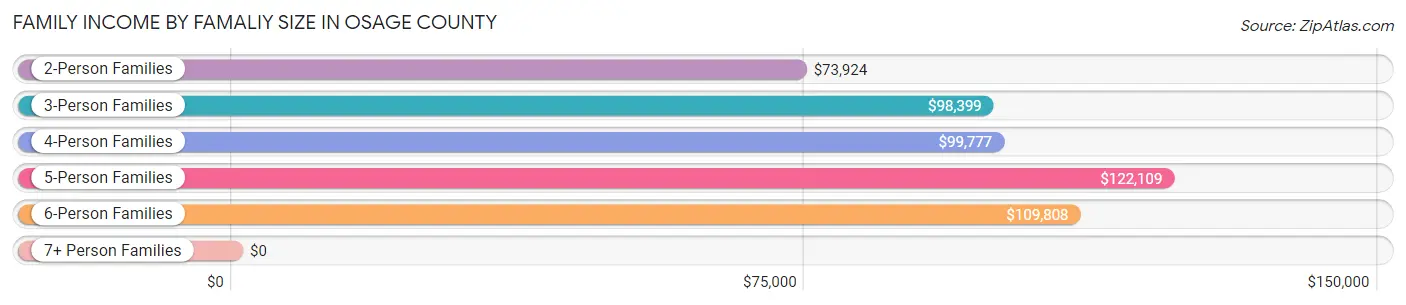
| Income Bracket | # Families | Median Income |
| 2-Person Families | 1,887 (51.9%) | $73,924 |
| 3-Person Families | 705 (19.4%) | $98,399 |
| 4-Person Families | 547 (15.0%) | $99,777 |
| 5-Person Families | 392 (10.8%) | $122,109 |
| 6-Person Families | 98 (2.7%) | $109,808 |
| 7+ Person Families | 8 (0.2%) | $0 |
| Total | 3,637 (100.0%) | $86,042 |
Family Income by Number of Earners in Osage County
The median family income in Osage County is $86,042, with families comprising 3+ earners (511) having the highest median family income of $120,927, while families with no earners (652) have the lowest median family income of $50,625, accounting for 14.1% and 17.9% of families, respectively.
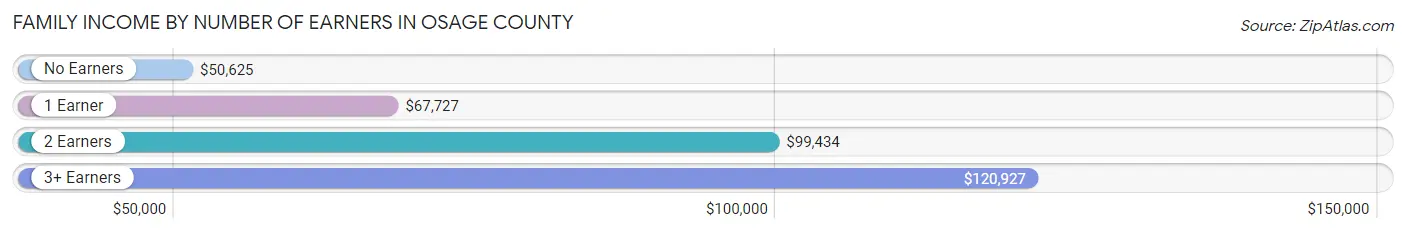
| Number of Earners | # Families | Median Income |
| No Earners | 652 (17.9%) | $50,625 |
| 1 Earner | 812 (22.3%) | $67,727 |
| 2 Earners | 1,662 (45.7%) | $99,434 |
| 3+ Earners | 511 (14.1%) | $120,927 |
| Total | 3,637 (100.0%) | $86,042 |
Household Income in Osage County
Household Income Brackets in Osage County
With 1,049 households falling in the category, the $50,000 to $74,999 income range is the most frequent in Osage County, accounting for 20.1% of all households. In contrast, only 157 households (3.0%) fall into the less than $10,000 income bracket, making it the least populous group.
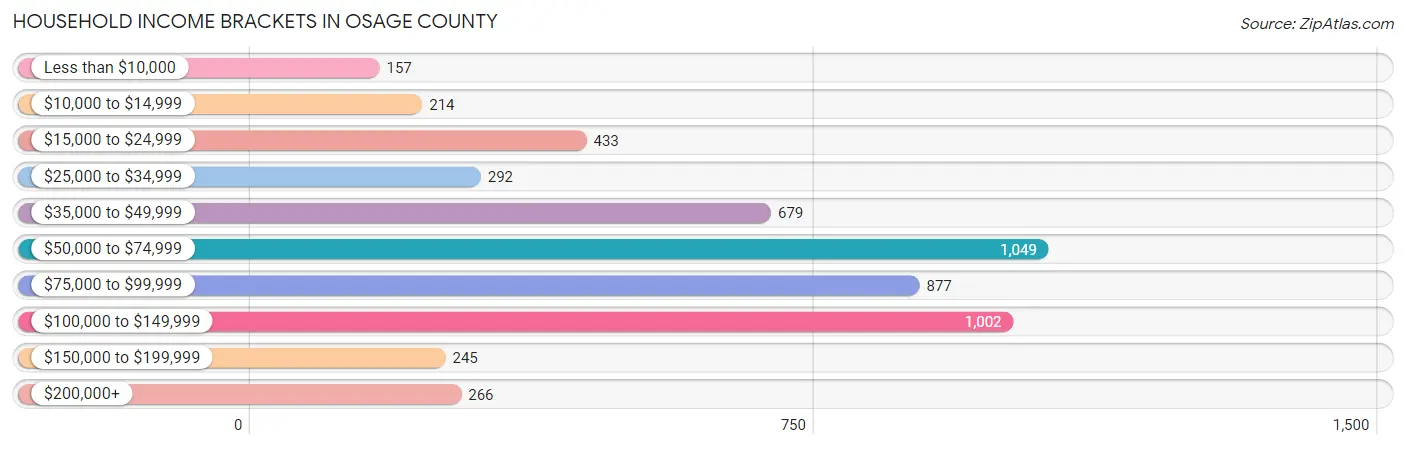
| Income Bracket | # Households | % Households |
| Less than $10,000 | 157 | 3.0% |
| $10,000 to $14,999 | 214 | 4.1% |
| $15,000 to $24,999 | 433 | 8.3% |
| $25,000 to $34,999 | 292 | 5.6% |
| $35,000 to $49,999 | 679 | 13.0% |
| $50,000 to $74,999 | 1,049 | 20.1% |
| $75,000 to $99,999 | 877 | 16.8% |
| $100,000 to $149,999 | 1,002 | 19.2% |
| $150,000 to $199,999 | 245 | 4.7% |
| $200,000+ | 266 | 5.1% |
Household Income by Householder Age in Osage County
The median household income in Osage County is $70,313, with the highest median household income of $91,354 found in the 45 to 64 years age bracket for the primary householder. A total of 1,884 households (36.1%) fall into this category. Meanwhile, the 15 to 24 years age bracket for the primary householder has the lowest median household income of $0, with 214 households (4.1%) in this group.
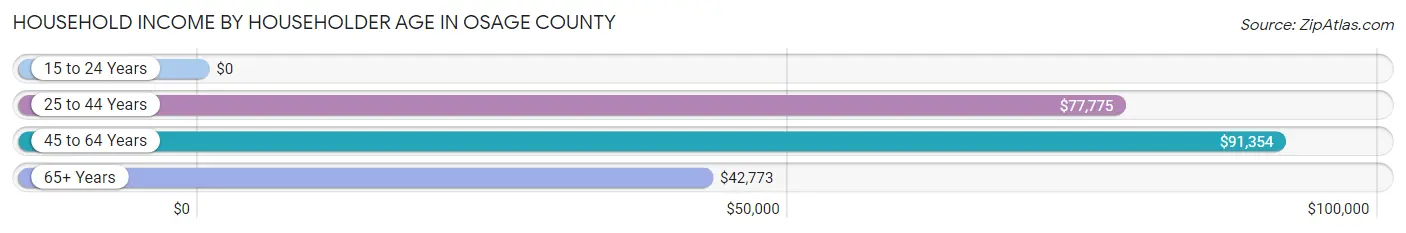
| Income Bracket | # Households | Median Income |
| 15 to 24 Years | 214 (4.1%) | $0 |
| 25 to 44 Years | 1,627 (31.2%) | $77,775 |
| 45 to 64 Years | 1,884 (36.1%) | $91,354 |
| 65+ Years | 1,495 (28.6%) | $42,773 |
| Total | 5,220 (100.0%) | $70,313 |
Poverty in Osage County
Income Below Poverty by Sex and Age in Osage County
With 6.9% poverty level for males and 8.4% for females among the residents of Osage County, 18 to 24 year old males and 18 to 24 year old females are the most vulnerable to poverty, with 141 males (24.0%) and 127 females (25.8%) in their respective age groups living below the poverty level.
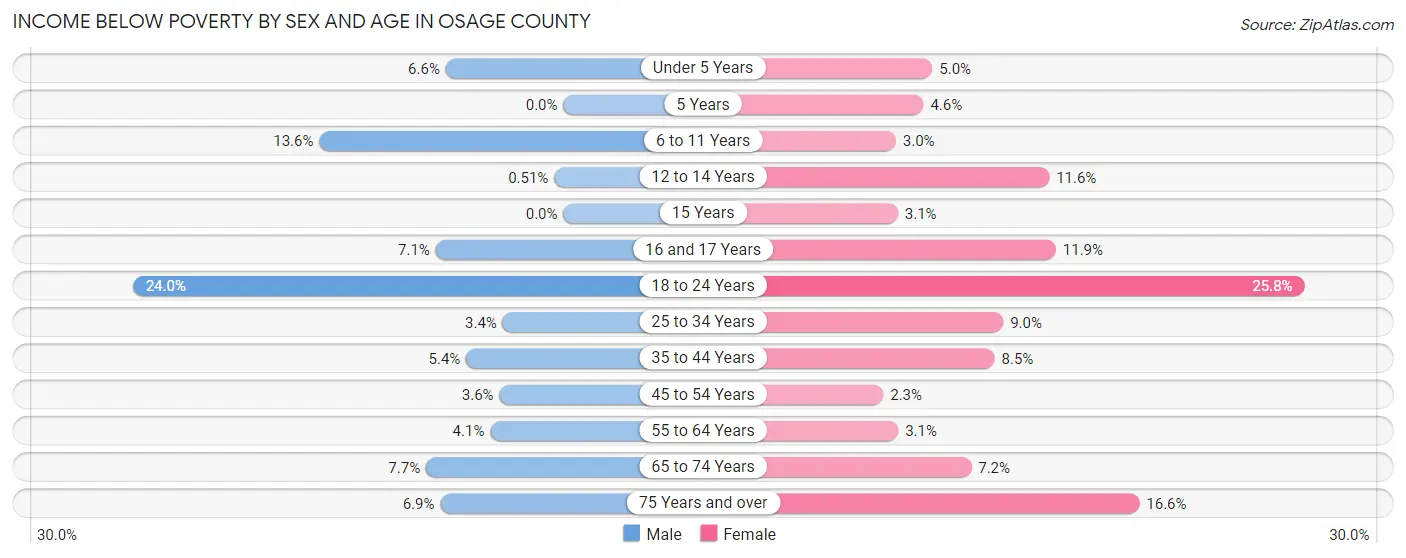
| Age Bracket | Male | Female |
| Under 5 Years | 22 (6.6%) | 17 (5.0%) |
| 5 Years | 0 (0.0%) | 1 (4.5%) |
| 6 to 11 Years | 61 (13.6%) | 15 (3.0%) |
| 12 to 14 Years | 2 (0.5%) | 38 (11.6%) |
| 15 Years | 0 (0.0%) | 3 (3.1%) |
| 16 and 17 Years | 14 (7.1%) | 23 (11.9%) |
| 18 to 24 Years | 141 (24.0%) | 127 (25.8%) |
| 25 to 34 Years | 26 (3.4%) | 65 (9.0%) |
| 35 to 44 Years | 44 (5.4%) | 63 (8.5%) |
| 45 to 54 Years | 31 (3.6%) | 19 (2.3%) |
| 55 to 64 Years | 42 (4.1%) | 29 (3.1%) |
| 65 to 74 Years | 52 (7.6%) | 47 (7.2%) |
| 75 Years and over | 30 (6.9%) | 87 (16.6%) |
| Total | 465 (6.9%) | 534 (8.4%) |
Income Above Poverty by Sex and Age in Osage County
According to the poverty statistics in Osage County, males aged 5 years and females aged 45 to 54 years are the age groups that are most secure financially, with 100.0% of males and 97.7% of females in these age groups living above the poverty line.
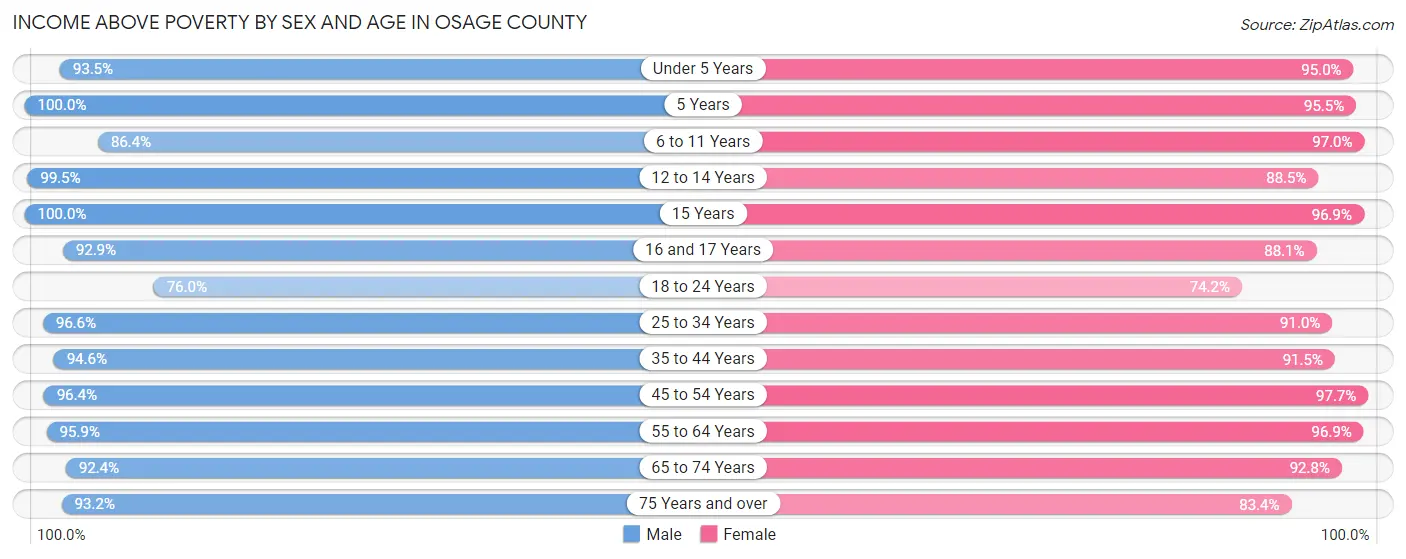
| Age Bracket | Male | Female |
| Under 5 Years | 314 (93.4%) | 320 (95.0%) |
| 5 Years | 35 (100.0%) | 21 (95.5%) |
| 6 to 11 Years | 388 (86.4%) | 484 (97.0%) |
| 12 to 14 Years | 389 (99.5%) | 291 (88.4%) |
| 15 Years | 109 (100.0%) | 93 (96.9%) |
| 16 and 17 Years | 183 (92.9%) | 170 (88.1%) |
| 18 to 24 Years | 447 (76.0%) | 366 (74.2%) |
| 25 to 34 Years | 744 (96.6%) | 658 (91.0%) |
| 35 to 44 Years | 770 (94.6%) | 677 (91.5%) |
| 45 to 54 Years | 841 (96.4%) | 802 (97.7%) |
| 55 to 64 Years | 989 (95.9%) | 895 (96.9%) |
| 65 to 74 Years | 628 (92.3%) | 605 (92.8%) |
| 75 Years and over | 408 (93.1%) | 438 (83.4%) |
| Total | 6,245 (93.1%) | 5,820 (91.6%) |
Income Below Poverty Among Married-Couple Families in Osage County
The poverty statistics for married-couple families in Osage County show that 1.8% or 57 of the total 3,219 families live below the poverty line. Families with 3 or 4 children have the highest poverty rate of 5.5%, comprising of 18 families. On the other hand, families with 5 or more children have the lowest poverty rate of 0.0%, which includes 0 families.
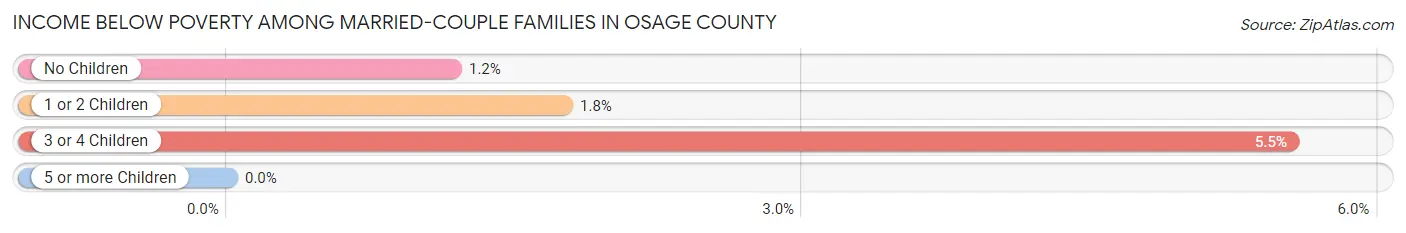
| Children | Above Poverty | Below Poverty |
| No Children | 1,947 (98.8%) | 23 (1.2%) |
| 1 or 2 Children | 900 (98.3%) | 16 (1.8%) |
| 3 or 4 Children | 307 (94.5%) | 18 (5.5%) |
| 5 or more Children | 8 (100.0%) | 0 (0.0%) |
| Total | 3,162 (98.2%) | 57 (1.8%) |
Income Below Poverty Among Single-Parent Households in Osage County
According to the poverty data in Osage County, 23.7% or 31 single-father households and 11.8% or 34 single-mother households are living below the poverty line. Among single-father households, those with 3 or 4 children have the highest poverty rate, with 1 households (50.0%) experiencing poverty. Likewise, among single-mother households, those with 3 or 4 children have the highest poverty rate, with 9 households (52.9%) falling below the poverty line.
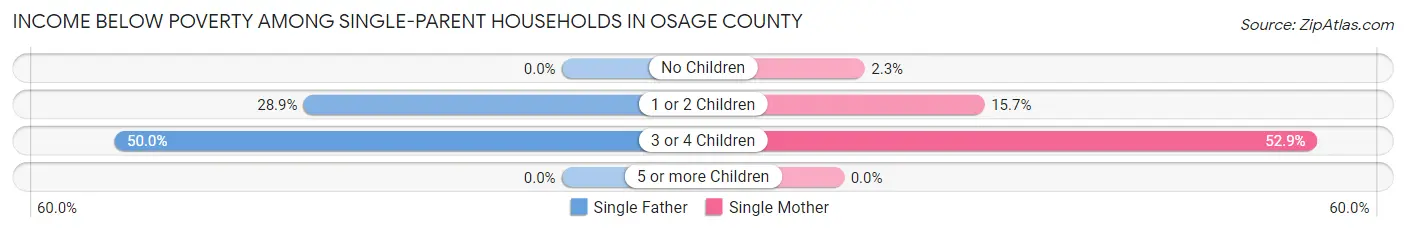
| Children | Single Father | Single Mother |
| No Children | 0 (0.0%) | 3 (2.3%) |
| 1 or 2 Children | 30 (28.8%) | 22 (15.7%) |
| 3 or 4 Children | 1 (50.0%) | 9 (52.9%) |
| 5 or more Children | 0 (0.0%) | 0 (0.0%) |
| Total | 31 (23.7%) | 34 (11.8%) |
Income Below Poverty Among Married-Couple vs Single-Parent Households in Osage County
The poverty data for Osage County shows that 57 of the married-couple family households (1.8%) and 65 of the single-parent households (15.5%) are living below the poverty level. Within the married-couple family households, those with 3 or 4 children have the highest poverty rate, with 18 households (5.5%) falling below the poverty line. Among the single-parent households, those with 3 or 4 children have the highest poverty rate, with 10 household (52.6%) living below poverty.
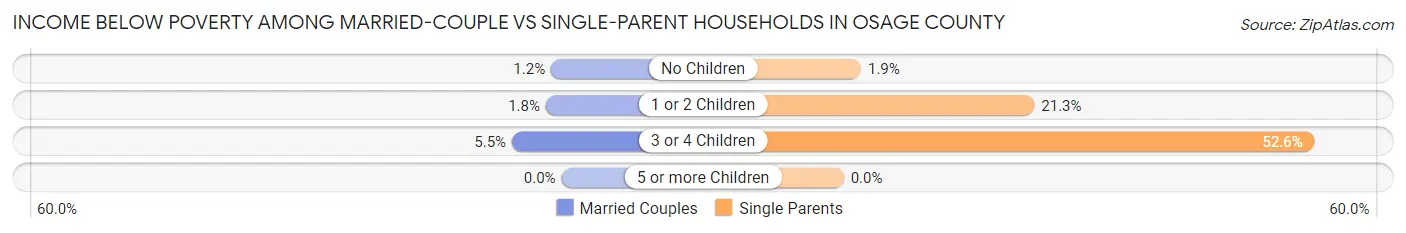
| Children | Married-Couple Families | Single-Parent Households |
| No Children | 23 (1.2%) | 3 (1.9%) |
| 1 or 2 Children | 16 (1.8%) | 52 (21.3%) |
| 3 or 4 Children | 18 (5.5%) | 10 (52.6%) |
| 5 or more Children | 0 (0.0%) | 0 (0.0%) |
| Total | 57 (1.8%) | 65 (15.5%) |
Race in Osage County
The most populous races in Osage County are White / Caucasian (13,089 | 97.9%), Two or more Races (189 | 1.4%), and Hispanic or Latino (134 | 1.0%).
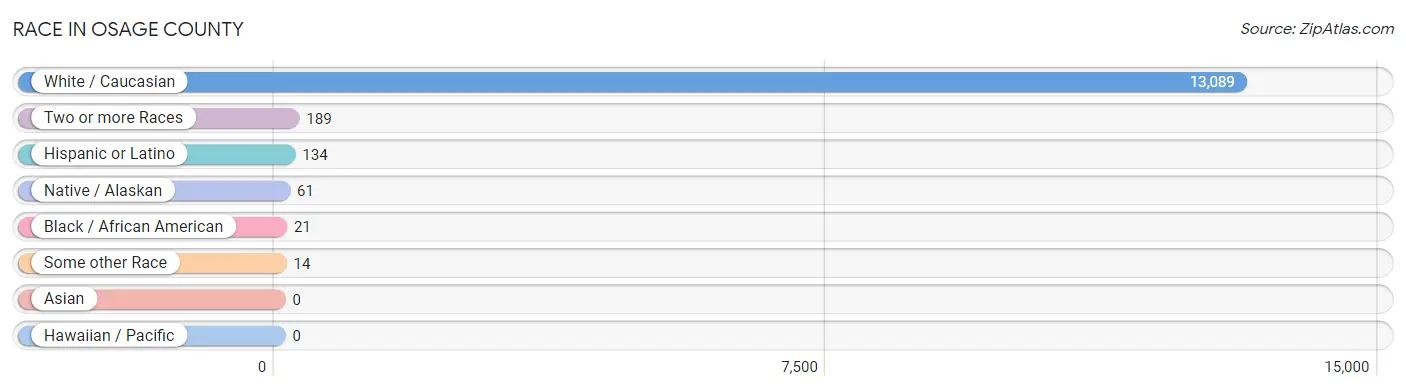
| Race | # Population | % Population |
| Asian | 0 | 0.0% |
| Black / African American | 21 | 0.2% |
| Hawaiian / Pacific | 0 | 0.0% |
| Hispanic or Latino | 134 | 1.0% |
| Native / Alaskan | 61 | 0.5% |
| White / Caucasian | 13,089 | 97.9% |
| Two or more Races | 189 | 1.4% |
| Some other Race | 14 | 0.1% |
| Total | 13,374 | 100.0% |
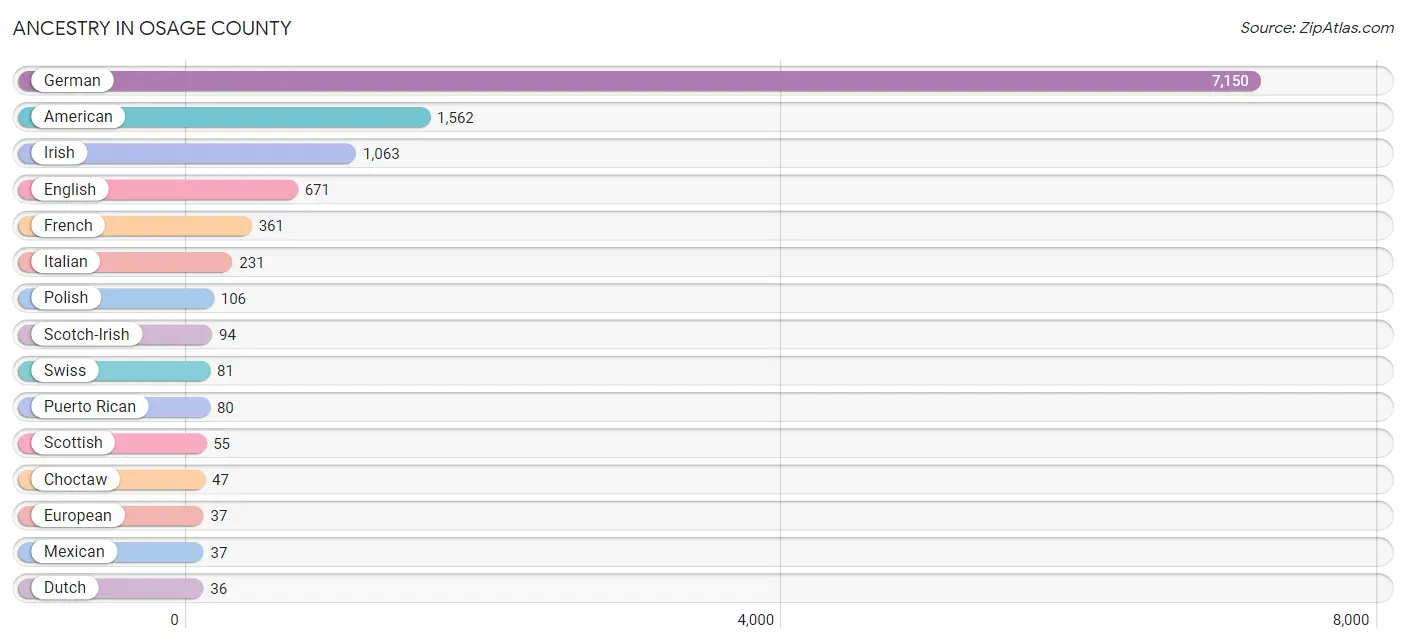
Ancestry in Osage County
The most populous ancestries reported in Osage County are German (7,150 | 53.5%), American (1,562 | 11.7%), Irish (1,063 | 8.0%), English (671 | 5.0%), and French (361 | 2.7%), together accounting for 80.8% of all Osage County residents.
| Ancestry | # Population | % Population |
| American | 1,562 | 11.7% |
| Argentinean | 1 | 0.0% |
| Australian | 33 | 0.3% |
| Austrian | 11 | 0.1% |
| Belgian | 11 | 0.1% |
| Burmese | 4 | 0.0% |
| Cherokee | 32 | 0.2% |
| Chippewa | 9 | 0.1% |
| Choctaw | 47 | 0.4% |
| Colombian | 15 | 0.1% |
| Comanche | 2 | 0.0% |
| Croatian | 6 | 0.0% |
| Cuban | 1 | 0.0% |
| Czech | 1 | 0.0% |
| Danish | 3 | 0.0% |
| Dutch | 36 | 0.3% |
| Eastern European | 28 | 0.2% |
| English | 671 | 5.0% |
| Estonian | 4 | 0.0% |
| European | 37 | 0.3% |
| Finnish | 3 | 0.0% |
| French | 361 | 2.7% |
| German | 7,150 | 53.5% |
| Greek | 1 | 0.0% |
| Hungarian | 10 | 0.1% |
| Irish | 1,063 | 8.0% |
| Italian | 231 | 1.7% |
| Lithuanian | 16 | 0.1% |
| Mexican | 37 | 0.3% |
| Norwegian | 23 | 0.2% |
| Polish | 106 | 0.8% |
| Puerto Rican | 80 | 0.6% |
| Russian | 29 | 0.2% |
| Scandinavian | 19 | 0.1% |
| Scotch-Irish | 94 | 0.7% |
| Scottish | 55 | 0.4% |
| Serbian | 6 | 0.0% |
| Sioux | 3 | 0.0% |
| Slavic | 6 | 0.0% |
| South American | 16 | 0.1% |
| Swedish | 12 | 0.1% |
| Swiss | 81 | 0.6% |
| Welsh | 5 | 0.0% | View All 43 Rows |
Immigrants in Osage County
The most numerous immigrant groups reported in Osage County came from Europe (19 | 0.1%), Latin America (18 | 0.1%), Central America (16 | 0.1%), Mexico (16 | 0.1%), and Western Europe (15 | 0.1%), together accounting for 0.6% of all Osage County residents.
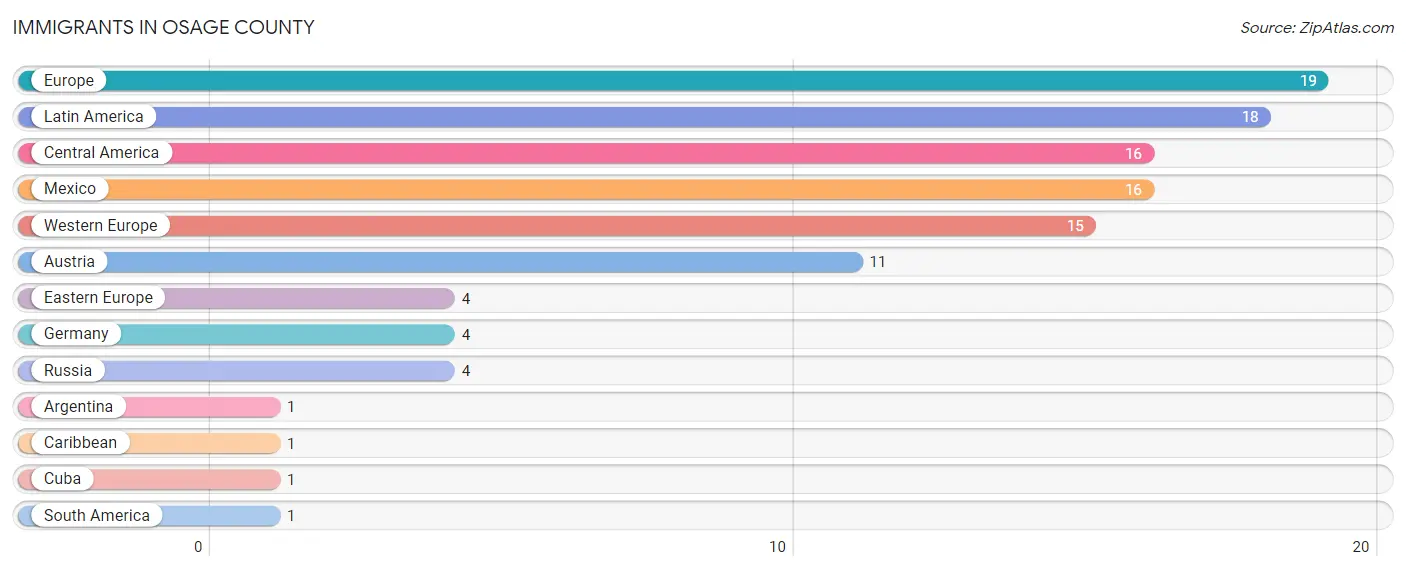
| Immigration Origin | # Population | % Population |
| Argentina | 1 | 0.0% |
| Austria | 11 | 0.1% |
| Caribbean | 1 | 0.0% |
| Central America | 16 | 0.1% |
| Cuba | 1 | 0.0% |
| Eastern Europe | 4 | 0.0% |
| Europe | 19 | 0.1% |
| Germany | 4 | 0.0% |
| Latin America | 18 | 0.1% |
| Mexico | 16 | 0.1% |
| Russia | 4 | 0.0% |
| South America | 1 | 0.0% |
| Western Europe | 15 | 0.1% | View All 13 Rows |
Sex and Age in Osage County
Sex and Age in Osage County
The most populous age groups in Osage County are 55 to 59 Years (629 | 9.1%) for men and 10 to 14 Years (600 | 9.3%) for women.
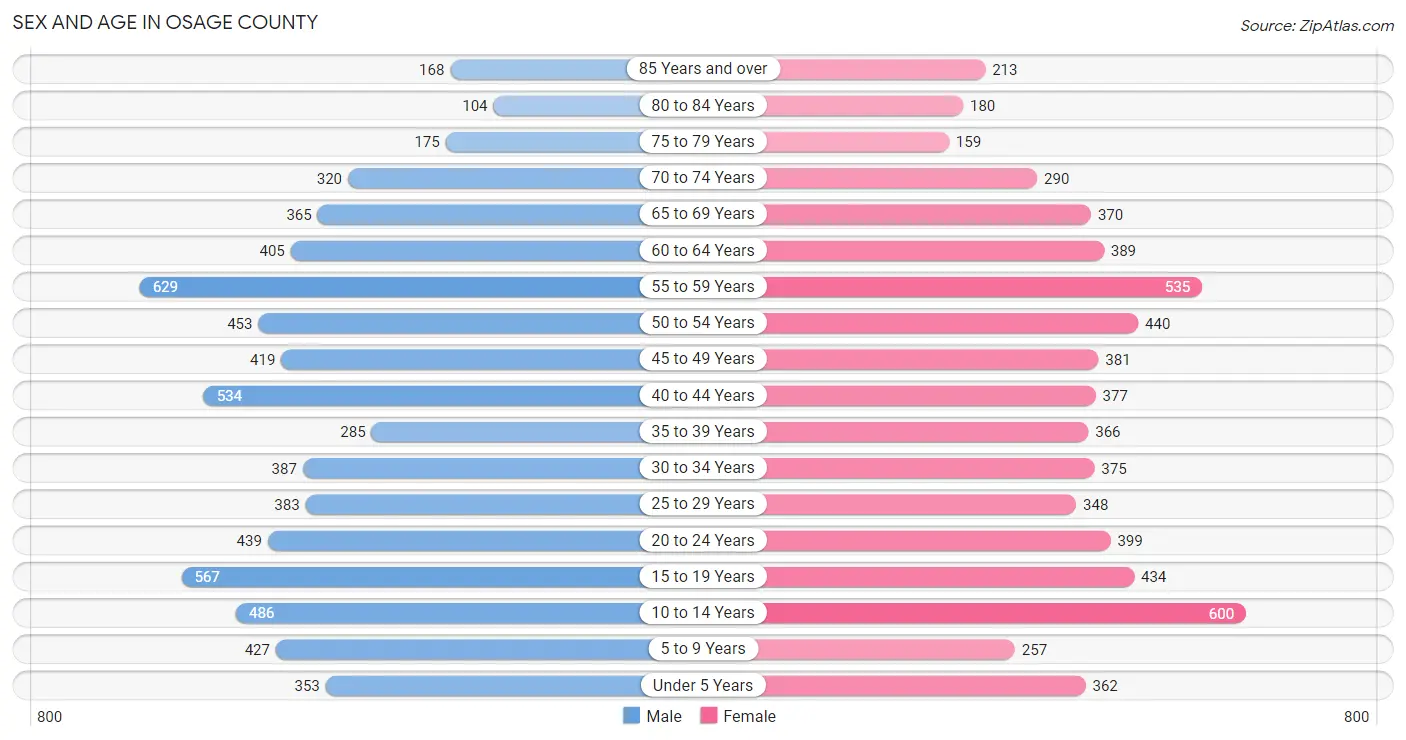
| Age Bracket | Male | Female |
| Under 5 Years | 353 (5.1%) | 362 (5.6%) |
| 5 to 9 Years | 427 (6.2%) | 257 (4.0%) |
| 10 to 14 Years | 486 (7.0%) | 600 (9.3%) |
| 15 to 19 Years | 567 (8.2%) | 434 (6.7%) |
| 20 to 24 Years | 439 (6.4%) | 399 (6.2%) |
| 25 to 29 Years | 383 (5.6%) | 348 (5.4%) |
| 30 to 34 Years | 387 (5.6%) | 375 (5.8%) |
| 35 to 39 Years | 285 (4.1%) | 366 (5.7%) |
| 40 to 44 Years | 534 (7.7%) | 377 (5.8%) |
| 45 to 49 Years | 419 (6.1%) | 381 (5.9%) |
| 50 to 54 Years | 453 (6.6%) | 440 (6.8%) |
| 55 to 59 Years | 629 (9.1%) | 535 (8.3%) |
| 60 to 64 Years | 405 (5.9%) | 389 (6.0%) |
| 65 to 69 Years | 365 (5.3%) | 370 (5.7%) |
| 70 to 74 Years | 320 (4.6%) | 290 (4.5%) |
| 75 to 79 Years | 175 (2.5%) | 159 (2.5%) |
| 80 to 84 Years | 104 (1.5%) | 180 (2.8%) |
| 85 Years and over | 168 (2.4%) | 213 (3.3%) |
| Total | 6,899 (100.0%) | 6,475 (100.0%) |
Families and Households in Osage County
Median Family Size in Osage County
The median family size in Osage County is 3.03 persons per family, with single female/mother families (287 | 7.9%) accounting for the largest median family size of 3.18 persons per family. On the other hand, single male/father families (131 | 3.6%) represent the smallest median family size with 2.98 persons per family.
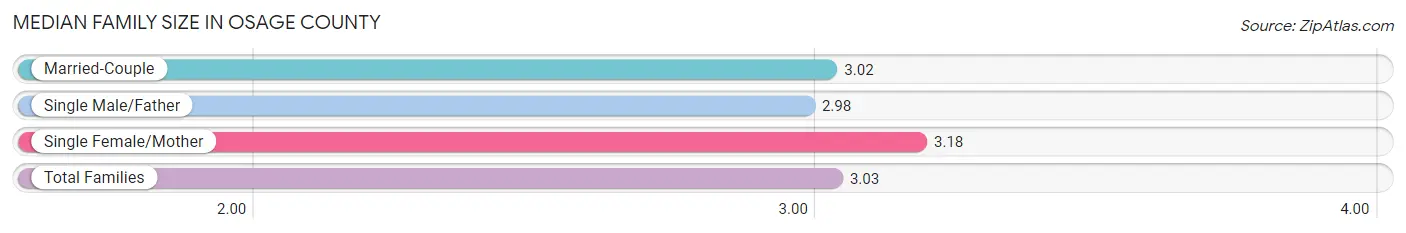
| Family Type | # Families | Family Size |
| Married-Couple | 3,219 (88.5%) | 3.02 |
| Single Male/Father | 131 (3.6%) | 2.98 |
| Single Female/Mother | 287 (7.9%) | 3.18 |
| Total Families | 3,637 (100.0%) | 3.03 |
Median Household Size in Osage County
The median household size in Osage County is 2.51 persons per household, with single male/father households (131 | 2.5%) accounting for the largest median household size of 3.85 persons per household. non-family households (1,583 | 30.3%) represent the smallest median household size with 1.21 persons per household.
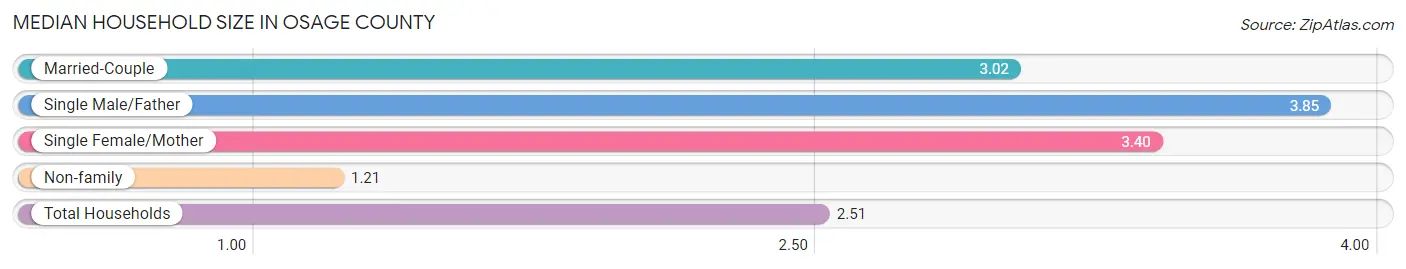
| Household Type | # Households | Household Size |
| Married-Couple | 3,219 (61.7%) | 3.02 |
| Single Male/Father | 131 (2.5%) | 3.85 |
| Single Female/Mother | 287 (5.5%) | 3.40 |
| Non-family | 1,583 (30.3%) | 1.21 |
| Total Households | 5,220 (100.0%) | 2.51 |
Household Size by Marriage Status in Osage County
Out of a total of 5,220 households in Osage County, 3,637 (69.7%) are family households, while 1,583 (30.3%) are nonfamily households. The most numerous type of family households are 2-person households, comprising 1,807, and the most common type of nonfamily households are 1-person households, comprising 1,385.
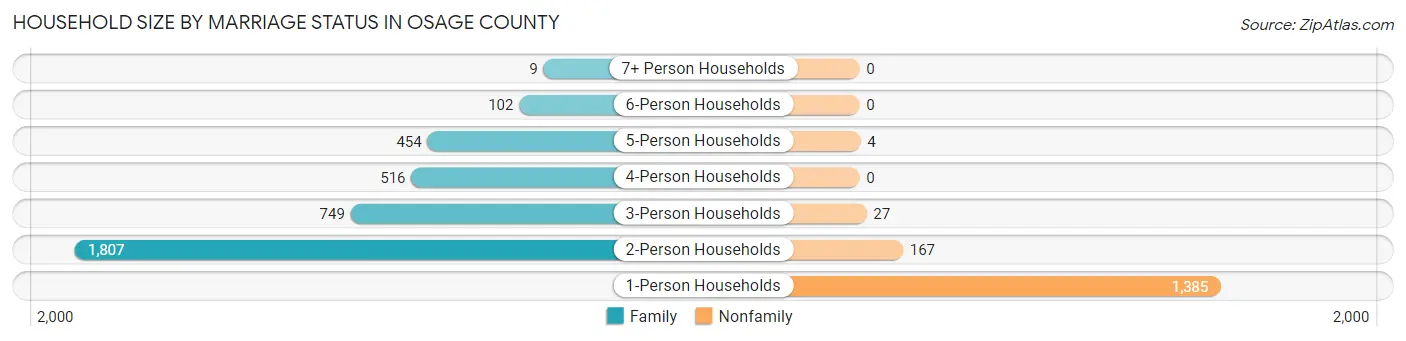
| Household Size | Family Households | Nonfamily Households |
| 1-Person Households | - | 1,385 (26.5%) |
| 2-Person Households | 1,807 (34.6%) | 167 (3.2%) |
| 3-Person Households | 749 (14.3%) | 27 (0.5%) |
| 4-Person Households | 516 (9.9%) | 0 (0.0%) |
| 5-Person Households | 454 (8.7%) | 4 (0.1%) |
| 6-Person Households | 102 (1.9%) | 0 (0.0%) |
| 7+ Person Households | 9 (0.2%) | 0 (0.0%) |
| Total | 3,637 (69.7%) | 1,583 (30.3%) |
Female Fertility in Osage County
Fertility by Age in Osage County
Average fertility rate in Osage County is 73.0 births per 1,000 women. Women in the age bracket of 20 to 34 years have the highest fertility rate with 119.0 births per 1,000 women. Women in the age bracket of 20 to 34 years acount for 65.8% of all women with births.
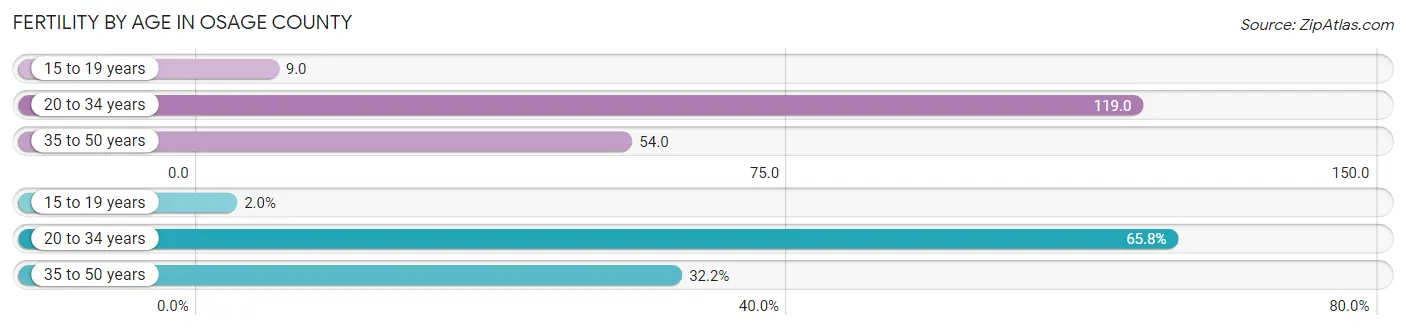
| Age Bracket | Women with Births | Births / 1,000 Women |
| 15 to 19 years | 4 (2.0%) | 9.0 |
| 20 to 34 years | 133 (65.8%) | 119.0 |
| 35 to 50 years | 65 (32.2%) | 54.0 |
| Total | 202 (100.0%) | 73.0 |
Fertility by Age by Marriage Status in Osage County
89.1% of women with births (202) in Osage County are married. The highest percentage of unmarried women with births falls into 15 to 19 years age bracket with 100.0% of them unmarried at the time of birth, while the lowest percentage of unmarried women with births belong to 35 to 50 years age bracket with 0.0% of them unmarried.
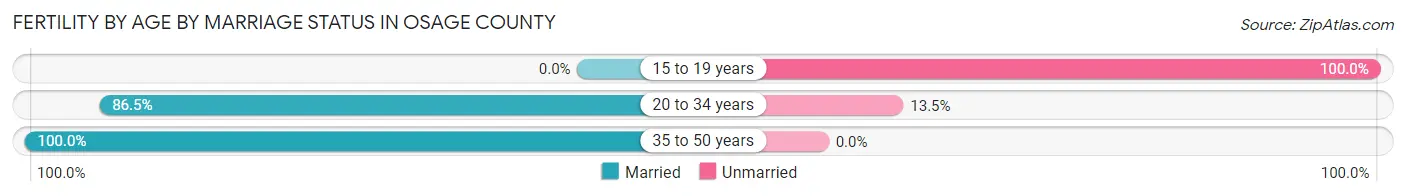
| Age Bracket | Married | Unmarried |
| 15 to 19 years | 0 (0.0%) | 4 (100.0%) |
| 20 to 34 years | 115 (86.5%) | 18 (13.5%) |
| 35 to 50 years | 65 (100.0%) | 0 (0.0%) |
| Total | 180 (89.1%) | 22 (10.9%) |
Fertility by Education in Osage County
Average fertility rate in Osage County is 73.0 births per 1,000 women. Women with the education attainment of bachelor's degree have the highest fertility rate of 224.0 births per 1,000 women, while women with the education attainment of college or associate's degree have the lowest fertility at 4.0 births per 1,000 women. Women with the education attainment of bachelor's degree represent 74.3% of all women with births.
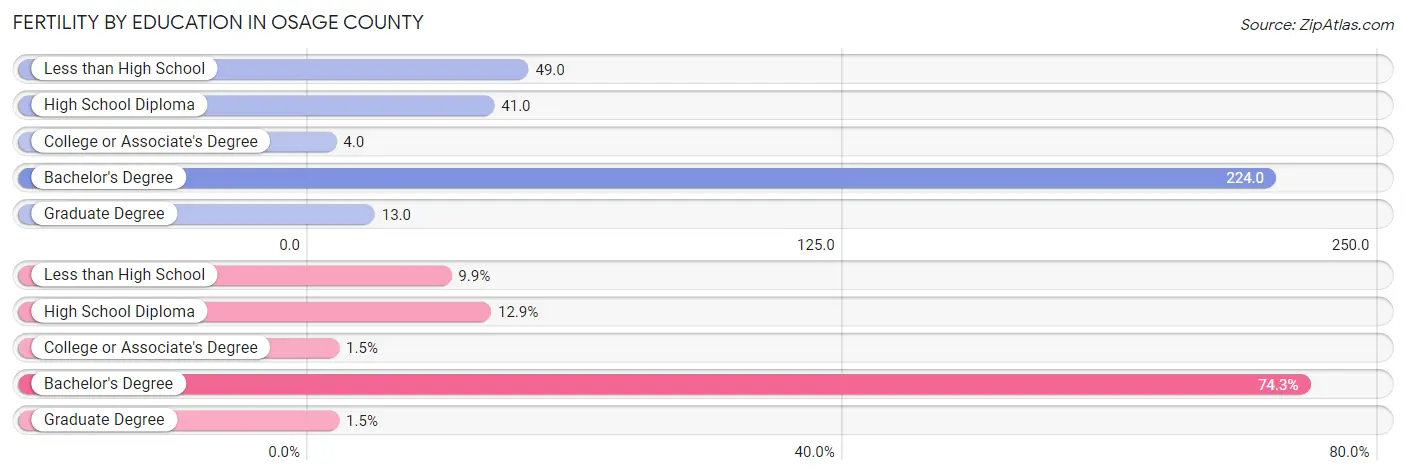
| Educational Attainment | Women with Births | Births / 1,000 Women |
| Less than High School | 20 (9.9%) | 49.0 |
| High School Diploma | 26 (12.9%) | 41.0 |
| College or Associate's Degree | 3 (1.5%) | 4.0 |
| Bachelor's Degree | 150 (74.3%) | 224.0 |
| Graduate Degree | 3 (1.5%) | 13.0 |
| Total | 202 (100.0%) | 73.0 |
Fertility by Education by Marriage Status in Osage County
10.9% of women with births in Osage County are unmarried. Women with the educational attainment of college or associate's degree are most likely to be married with 100.0% of them married at childbirth, while women with the educational attainment of less than high school are least likely to be married with 65.0% of them unmarried at childbirth.
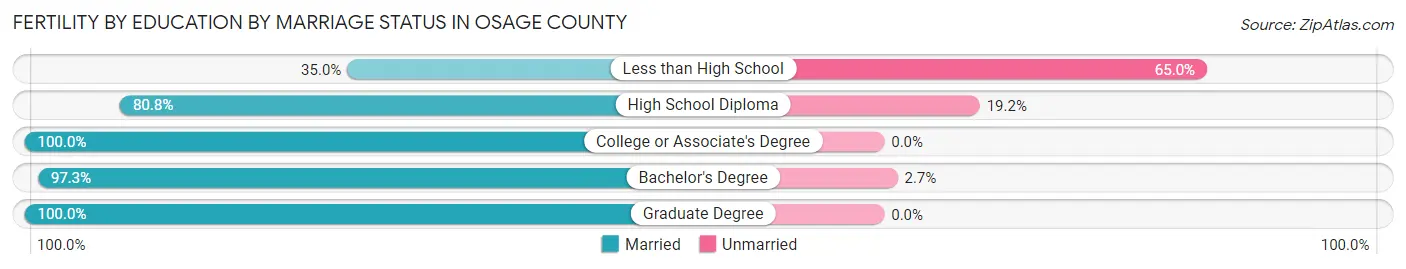
| Educational Attainment | Married | Unmarried |
| Less than High School | 7 (35.0%) | 13 (65.0%) |
| High School Diploma | 21 (80.8%) | 5 (19.2%) |
| College or Associate's Degree | 3 (100.0%) | 0 (0.0%) |
| Bachelor's Degree | 146 (97.3%) | 4 (2.7%) |
| Graduate Degree | 3 (100.0%) | 0 (0.0%) |
| Total | 180 (89.1%) | 22 (10.9%) |
Employment Characteristics in Osage County
Employment by Class of Employer in Osage County
Among the 6,686 employed individuals in Osage County, private company employees (3,784 | 56.6%), state government employees (1,105 | 16.5%), and self-employed (not incorporated) (608 | 9.1%) make up the most common classes of employment.
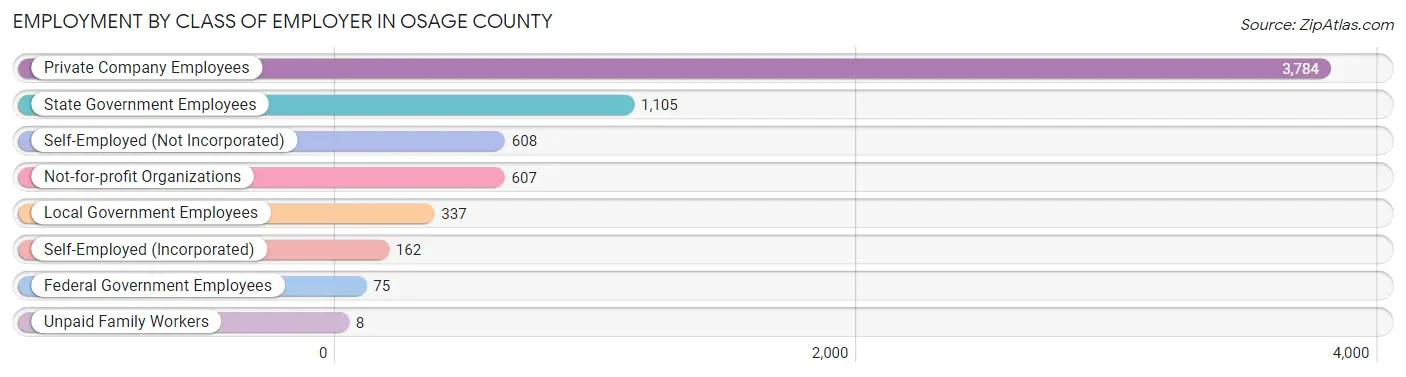
| Employer Class | # Employees | % Employees |
| Private Company Employees | 3,784 | 56.6% |
| Self-Employed (Incorporated) | 162 | 2.4% |
| Self-Employed (Not Incorporated) | 608 | 9.1% |
| Not-for-profit Organizations | 607 | 9.1% |
| Local Government Employees | 337 | 5.0% |
| State Government Employees | 1,105 | 16.5% |
| Federal Government Employees | 75 | 1.1% |
| Unpaid Family Workers | 8 | 0.1% |
| Total | 6,686 | 100.0% |
Employment Status by Age in Osage County
According to the labor force statistics for Osage County, out of the total population over 16 years of age (10,684), 63.5% or 6,784 individuals are in the labor force, with 1.0% or 68 of them unemployed. The age group with the highest labor force participation rate is 25 to 29 years, with 94.1% or 688 individuals in the labor force. Within the labor force, the 20 to 24 years age range has the highest percentage of unemployed individuals, with 5.5% or 31 of them being unemployed.
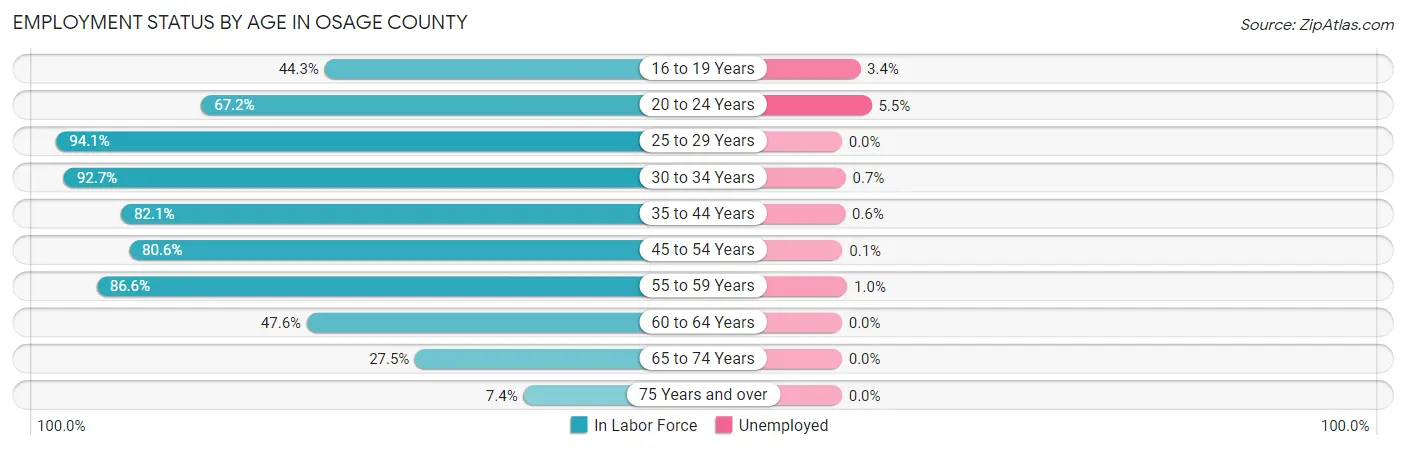
| Age Bracket | In Labor Force | Unemployed |
| 16 to 19 Years | 353 (44.3%) | 12 (3.4%) |
| 20 to 24 Years | 563 (67.2%) | 31 (5.5%) |
| 25 to 29 Years | 688 (94.1%) | 0 (0.0%) |
| 30 to 34 Years | 706 (92.7%) | 5 (0.7%) |
| 35 to 44 Years | 1,282 (82.1%) | 8 (0.6%) |
| 45 to 54 Years | 1,365 (80.6%) | 1 (0.1%) |
| 55 to 59 Years | 1,008 (86.6%) | 10 (1.0%) |
| 60 to 64 Years | 378 (47.6%) | 0 (0.0%) |
| 65 to 74 Years | 370 (27.5%) | 0 (0.0%) |
| 75 Years and over | 74 (7.4%) | 0 (0.0%) |
| Total | 6,784 (63.5%) | 68 (1.0%) |
Employment Status by Educational Attainment in Osage County
According to labor force statistics for Osage County, 80.9% of individuals (5,425) out of the total population between 25 and 64 years of age (6,706) are in the labor force, with 0.5% or 27 of them being unemployed. The group with the highest labor force participation rate are those with the educational attainment of bachelor's degree or higher, with 94.2% or 1,600 individuals in the labor force. Within the labor force, individuals with college / associate degree education have the highest percentage of unemployment, with 0.6% or 10 of them being unemployed.
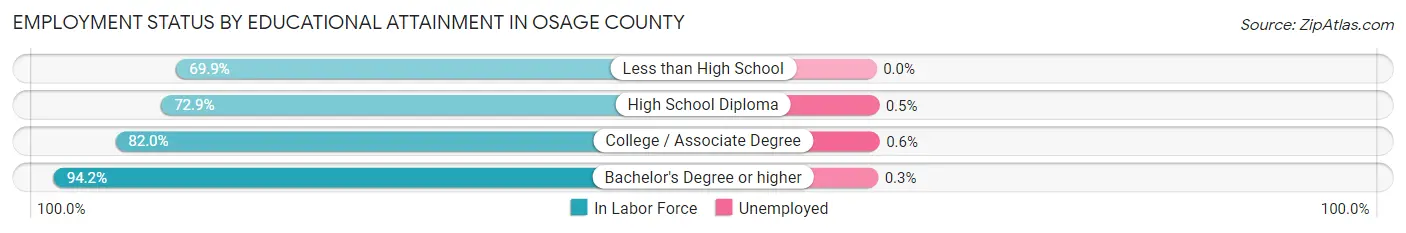
| Educational Attainment | In Labor Force | Unemployed |
| Less than High School | 218 (69.9%) | 0 (0.0%) |
| High School Diploma | 1,935 (72.9%) | 13 (0.5%) |
| College / Associate Degree | 1,674 (82.0%) | 12 (0.6%) |
| Bachelor's Degree or higher | 1,600 (94.2%) | 5 (0.3%) |
| Total | 5,425 (80.9%) | 34 (0.5%) |
Employment Occupations by Sex in Osage County
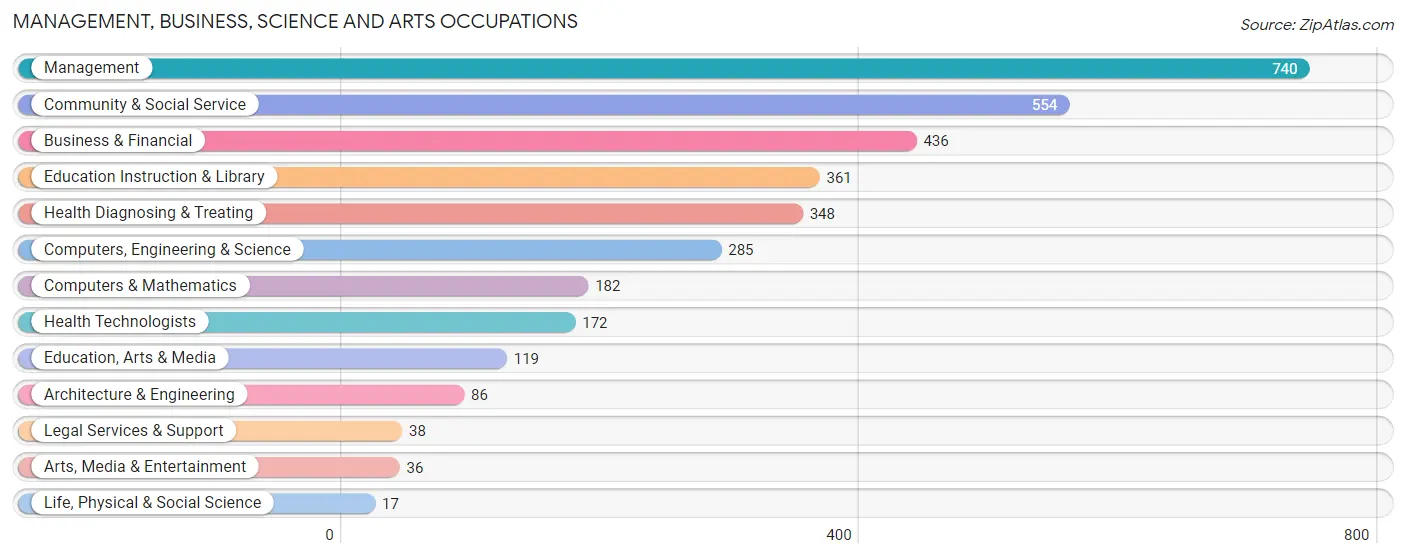
Management, Business, Science and Arts Occupations
The most common Management, Business, Science and Arts occupations in Osage County are Management (740 | 11.0%), Community & Social Service (554 | 8.3%), Business & Financial (436 | 6.5%), Education Instruction & Library (361 | 5.4%), and Health Diagnosing & Treating (348 | 5.2%).
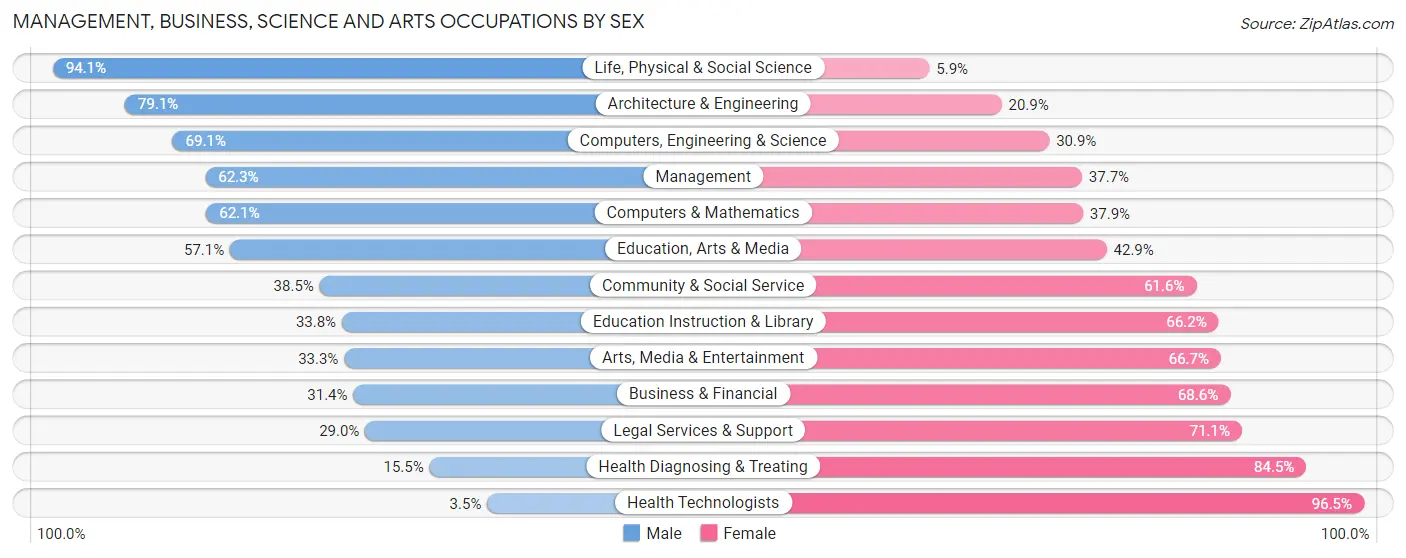
Management, Business, Science and Arts Occupations by Sex
Within the Management, Business, Science and Arts occupations in Osage County, the most male-oriented occupations are Life, Physical & Social Science (94.1%), Architecture & Engineering (79.1%), and Computers, Engineering & Science (69.1%), while the most female-oriented occupations are Health Technologists (96.5%), Health Diagnosing & Treating (84.5%), and Legal Services & Support (71.1%).
| Occupation | Male | Female |
| Management | 461 (62.3%) | 279 (37.7%) |
| Business & Financial | 137 (31.4%) | 299 (68.6%) |
| Computers, Engineering & Science | 197 (69.1%) | 88 (30.9%) |
| Computers & Mathematics | 113 (62.1%) | 69 (37.9%) |
| Architecture & Engineering | 68 (79.1%) | 18 (20.9%) |
| Life, Physical & Social Science | 16 (94.1%) | 1 (5.9%) |
| Community & Social Service | 213 (38.5%) | 341 (61.6%) |
| Education, Arts & Media | 68 (57.1%) | 51 (42.9%) |
| Legal Services & Support | 11 (28.9%) | 27 (71.1%) |
| Education Instruction & Library | 122 (33.8%) | 239 (66.2%) |
| Arts, Media & Entertainment | 12 (33.3%) | 24 (66.7%) |
| Health Diagnosing & Treating | 54 (15.5%) | 294 (84.5%) |
| Health Technologists | 6 (3.5%) | 166 (96.5%) |
| Total (Category) | 1,062 (44.9%) | 1,301 (55.1%) |
| Total (Overall) | 3,640 (54.2%) | 3,076 (45.8%) |
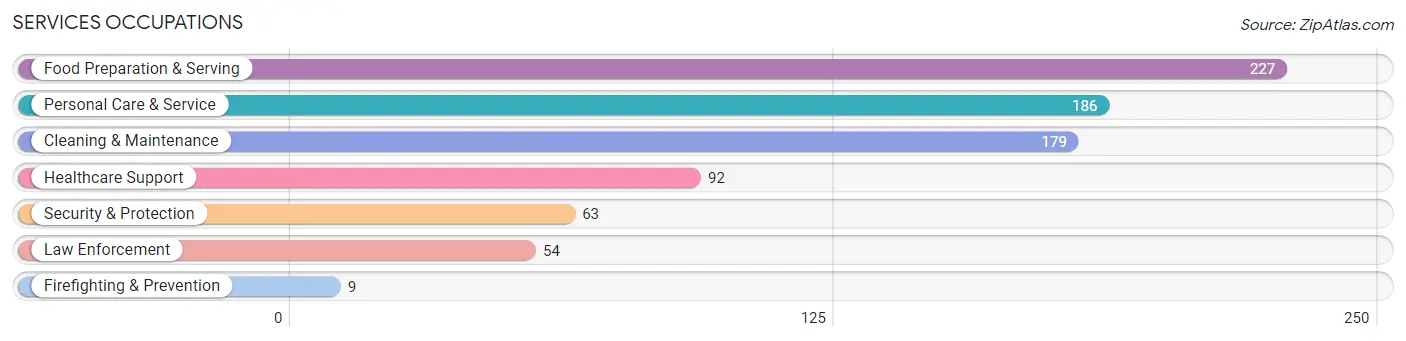
Services Occupations
The most common Services occupations in Osage County are Food Preparation & Serving (227 | 3.4%), Personal Care & Service (186 | 2.8%), Cleaning & Maintenance (179 | 2.7%), Healthcare Support (92 | 1.4%), and Security & Protection (63 | 0.9%).
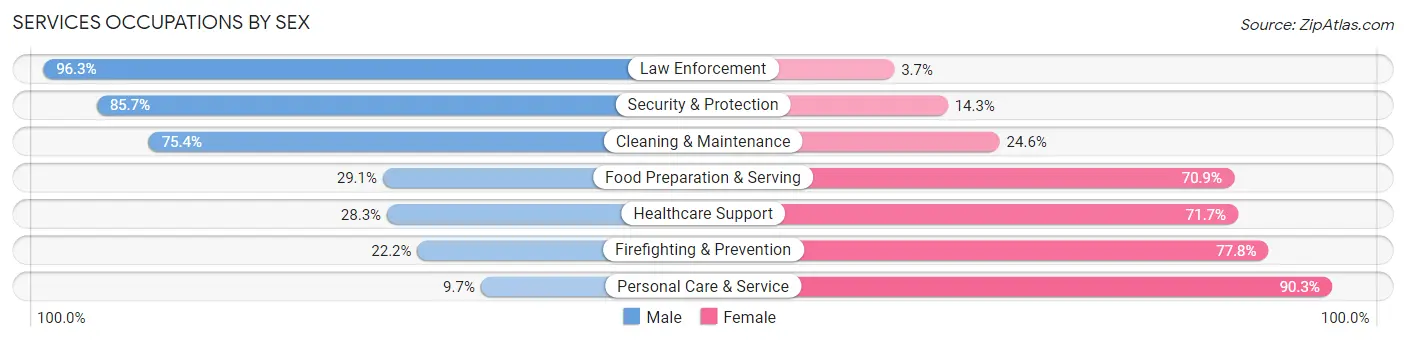
Services Occupations by Sex
Within the Services occupations in Osage County, the most male-oriented occupations are Law Enforcement (96.3%), Security & Protection (85.7%), and Cleaning & Maintenance (75.4%), while the most female-oriented occupations are Personal Care & Service (90.3%), Firefighting & Prevention (77.8%), and Healthcare Support (71.7%).
| Occupation | Male | Female |
| Healthcare Support | 26 (28.3%) | 66 (71.7%) |
| Security & Protection | 54 (85.7%) | 9 (14.3%) |
| Firefighting & Prevention | 2 (22.2%) | 7 (77.8%) |
| Law Enforcement | 52 (96.3%) | 2 (3.7%) |
| Food Preparation & Serving | 66 (29.1%) | 161 (70.9%) |
| Cleaning & Maintenance | 135 (75.4%) | 44 (24.6%) |
| Personal Care & Service | 18 (9.7%) | 168 (90.3%) |
| Total (Category) | 299 (40.0%) | 448 (60.0%) |
| Total (Overall) | 3,640 (54.2%) | 3,076 (45.8%) |
Sales and Office Occupations
The most common Sales and Office occupations in Osage County are Office & Administration (825 | 12.3%), and Sales & Related (517 | 7.7%).
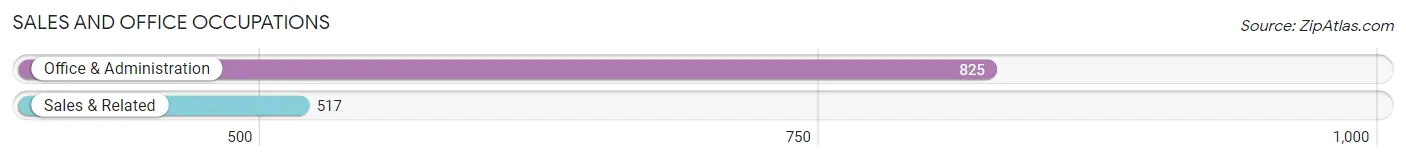
Sales and Office Occupations by Sex

| Occupation | Male | Female |
| Sales & Related | 261 (50.5%) | 256 (49.5%) |
| Office & Administration | 85 (10.3%) | 740 (89.7%) |
| Total (Category) | 346 (25.8%) | 996 (74.2%) |
| Total (Overall) | 3,640 (54.2%) | 3,076 (45.8%) |
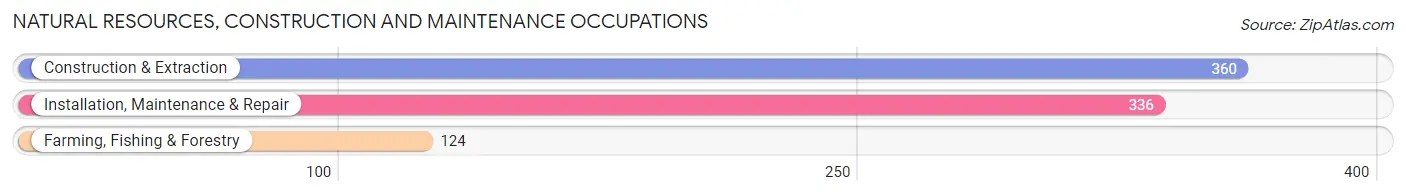
Natural Resources, Construction and Maintenance Occupations
The most common Natural Resources, Construction and Maintenance occupations in Osage County are Construction & Extraction (360 | 5.4%), Installation, Maintenance & Repair (336 | 5.0%), and Farming, Fishing & Forestry (124 | 1.8%).
Natural Resources, Construction and Maintenance Occupations by Sex
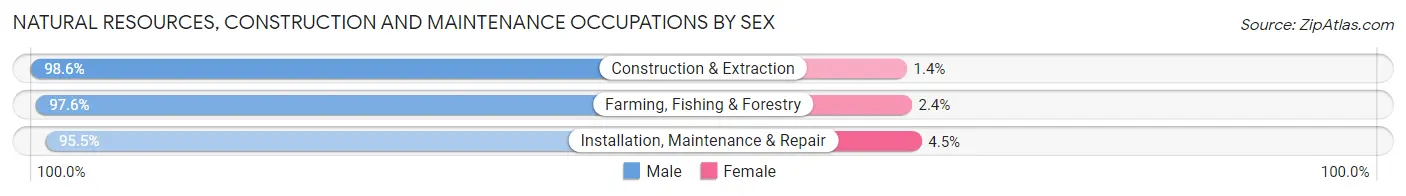
| Occupation | Male | Female |
| Farming, Fishing & Forestry | 121 (97.6%) | 3 (2.4%) |
| Construction & Extraction | 355 (98.6%) | 5 (1.4%) |
| Installation, Maintenance & Repair | 321 (95.5%) | 15 (4.5%) |
| Total (Category) | 797 (97.2%) | 23 (2.8%) |
| Total (Overall) | 3,640 (54.2%) | 3,076 (45.8%) |
Production, Transportation and Moving Occupations
The most common Production, Transportation and Moving occupations in Osage County are Production (797 | 11.9%), Material Moving (376 | 5.6%), and Transportation (271 | 4.0%).
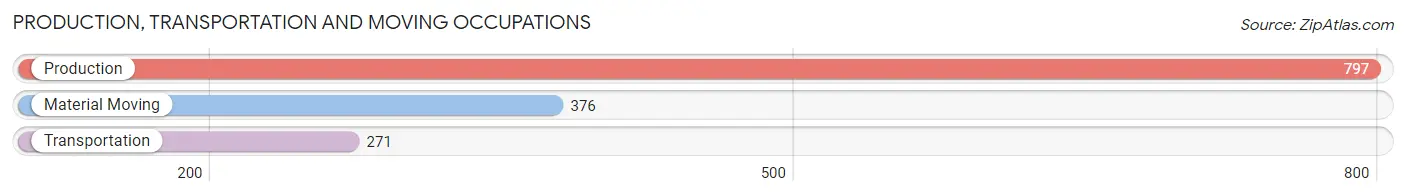
Production, Transportation and Moving Occupations by Sex
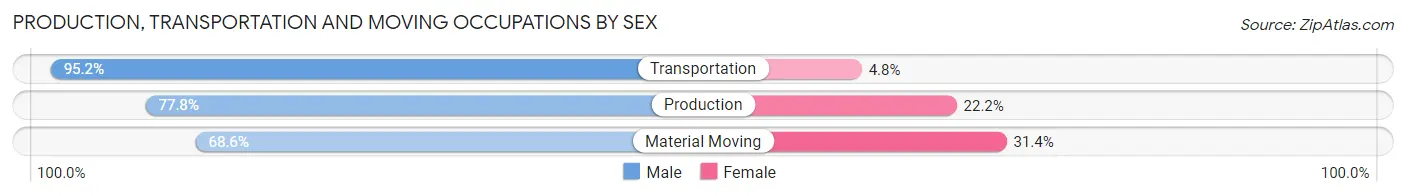
| Occupation | Male | Female |
| Production | 620 (77.8%) | 177 (22.2%) |
| Transportation | 258 (95.2%) | 13 (4.8%) |
| Material Moving | 258 (68.6%) | 118 (31.4%) |
| Total (Category) | 1,136 (78.7%) | 308 (21.3%) |
| Total (Overall) | 3,640 (54.2%) | 3,076 (45.8%) |
Employment Industries by Sex in Osage County
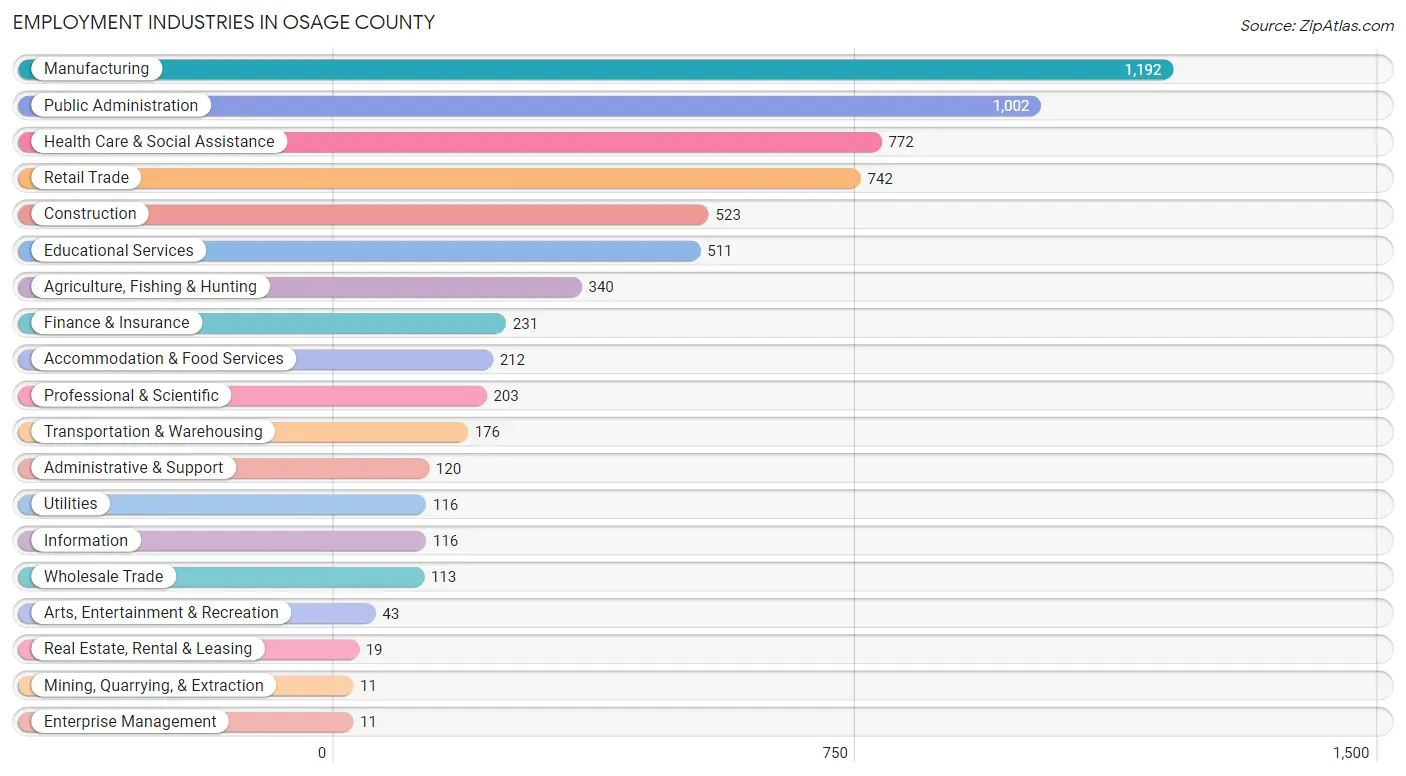
Employment Industries in Osage County
The major employment industries in Osage County include Manufacturing (1,192 | 17.7%), Public Administration (1,002 | 14.9%), Health Care & Social Assistance (772 | 11.5%), Retail Trade (742 | 11.1%), and Construction (523 | 7.8%).
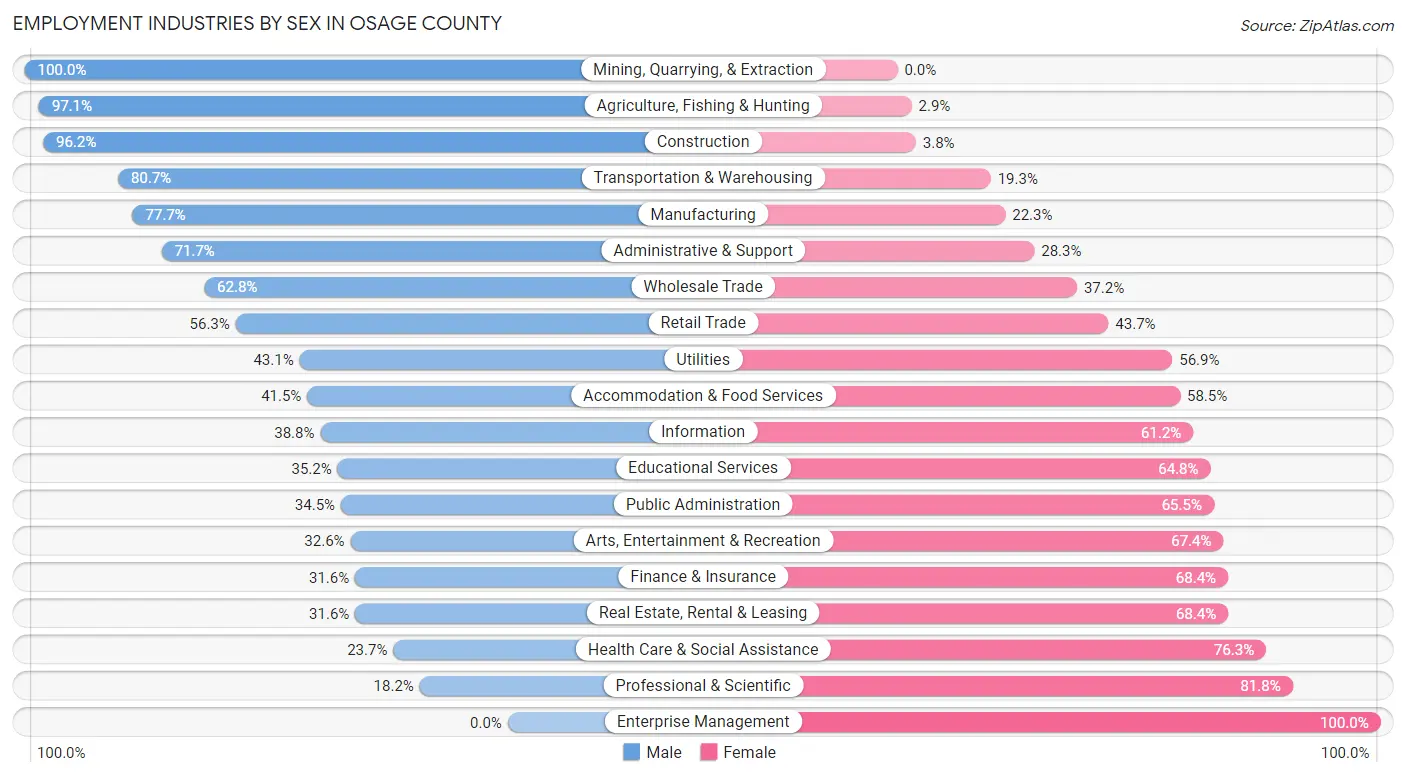
Employment Industries by Sex in Osage County
The Osage County industries that see more men than women are Mining, Quarrying, & Extraction (100.0%), Agriculture, Fishing & Hunting (97.1%), and Construction (96.2%), whereas the industries that tend to have a higher number of women are Enterprise Management (100.0%), Professional & Scientific (81.8%), and Health Care & Social Assistance (76.3%).
| Industry | Male | Female |
| Agriculture, Fishing & Hunting | 330 (97.1%) | 10 (2.9%) |
| Mining, Quarrying, & Extraction | 11 (100.0%) | 0 (0.0%) |
| Construction | 503 (96.2%) | 20 (3.8%) |
| Manufacturing | 926 (77.7%) | 266 (22.3%) |
| Wholesale Trade | 71 (62.8%) | 42 (37.2%) |
| Retail Trade | 418 (56.3%) | 324 (43.7%) |
| Transportation & Warehousing | 142 (80.7%) | 34 (19.3%) |
| Utilities | 50 (43.1%) | 66 (56.9%) |
| Information | 45 (38.8%) | 71 (61.2%) |
| Finance & Insurance | 73 (31.6%) | 158 (68.4%) |
| Real Estate, Rental & Leasing | 6 (31.6%) | 13 (68.4%) |
| Professional & Scientific | 37 (18.2%) | 166 (81.8%) |
| Enterprise Management | 0 (0.0%) | 11 (100.0%) |
| Administrative & Support | 86 (71.7%) | 34 (28.3%) |
| Educational Services | 180 (35.2%) | 331 (64.8%) |
| Health Care & Social Assistance | 183 (23.7%) | 589 (76.3%) |
| Arts, Entertainment & Recreation | 14 (32.6%) | 29 (67.4%) |
| Accommodation & Food Services | 88 (41.5%) | 124 (58.5%) |
| Public Administration | 346 (34.5%) | 656 (65.5%) |
| Total | 3,640 (54.2%) | 3,076 (45.8%) |
Education in Osage County
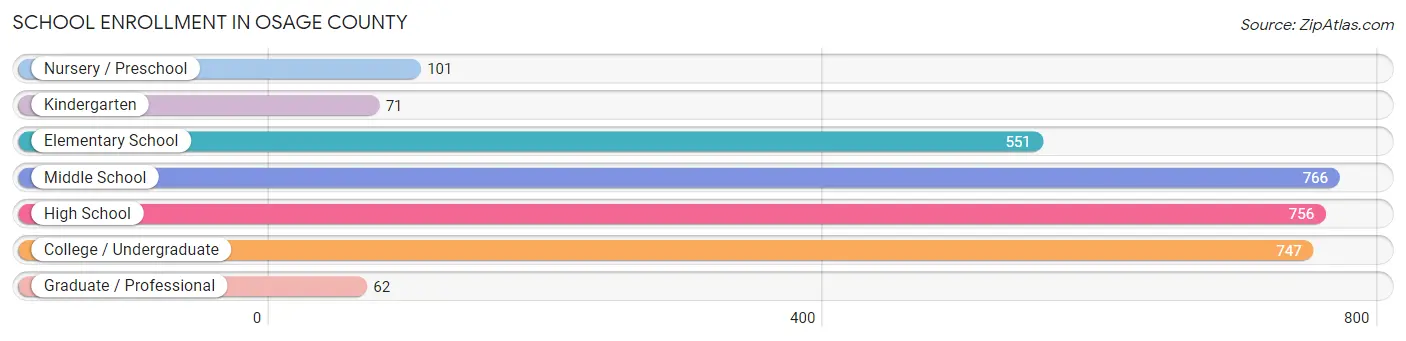
School Enrollment in Osage County
The most common levels of schooling among the 3,054 students in Osage County are middle school (766 | 25.1%), high school (756 | 24.7%), and college / undergraduate (747 | 24.5%).
| School Level | # Students | % Students |
| Nursery / Preschool | 101 | 3.3% |
| Kindergarten | 71 | 2.3% |
| Elementary School | 551 | 18.0% |
| Middle School | 766 | 25.1% |
| High School | 756 | 24.7% |
| College / Undergraduate | 747 | 24.5% |
| Graduate / Professional | 62 | 2.0% |
| Total | 3,054 | 100.0% |
School Enrollment by Age by Funding Source in Osage County
Out of a total of 3,054 students who are enrolled in schools in Osage County, 764 (25.0%) attend a private institution, while the remaining 2,290 (75.0%) are enrolled in public schools. The age group of 3 to 4 year olds has the highest likelihood of being enrolled in private schools, with 36 (51.4% in the age bracket) enrolled. Conversely, the age group of 15 to 17 year olds has the lowest likelihood of being enrolled in a private school, with 497 (89.5% in the age bracket) attending a public institution.
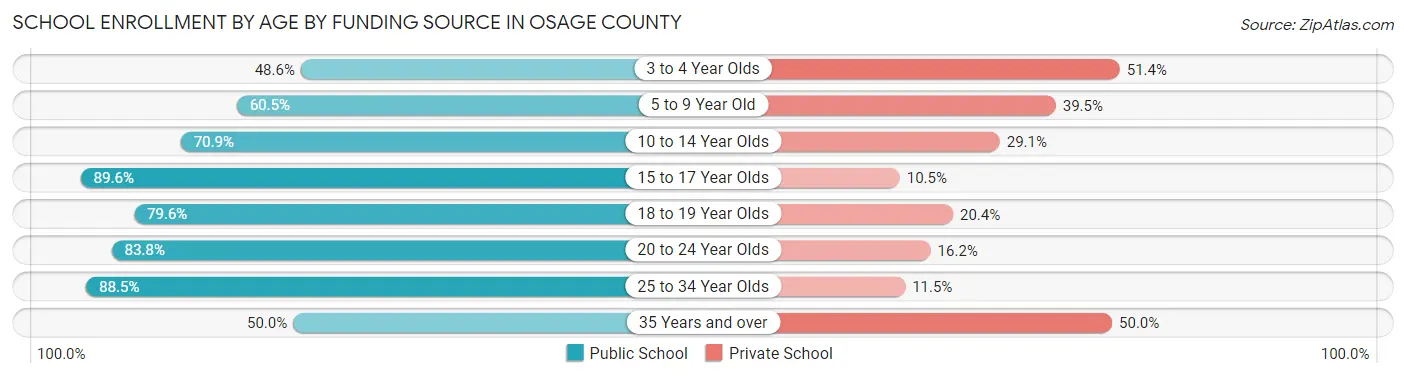
| Age Bracket | Public School | Private School |
| 3 to 4 Year Olds | 34 (48.6%) | 36 (51.4%) |
| 5 to 9 Year Old | 343 (60.5%) | 224 (39.5%) |
| 10 to 14 Year Olds | 678 (70.9%) | 278 (29.1%) |
| 15 to 17 Year Olds | 497 (89.5%) | 58 (10.4%) |
| 18 to 19 Year Olds | 305 (79.6%) | 78 (20.4%) |
| 20 to 24 Year Olds | 331 (83.8%) | 64 (16.2%) |
| 25 to 34 Year Olds | 85 (88.5%) | 11 (11.5%) |
| 35 Years and over | 16 (50.0%) | 16 (50.0%) |
| Total | 2,290 (75.0%) | 764 (25.0%) |
Educational Attainment by Field of Study in Osage County
Business (478 | 21.5%), education (381 | 17.1%), bio, nature & agricultural (256 | 11.5%), liberal arts & history (230 | 10.3%), and computers & mathematics (187 | 8.4%) are the most common fields of study among 2,225 individuals in Osage County who have obtained a bachelor's degree or higher.
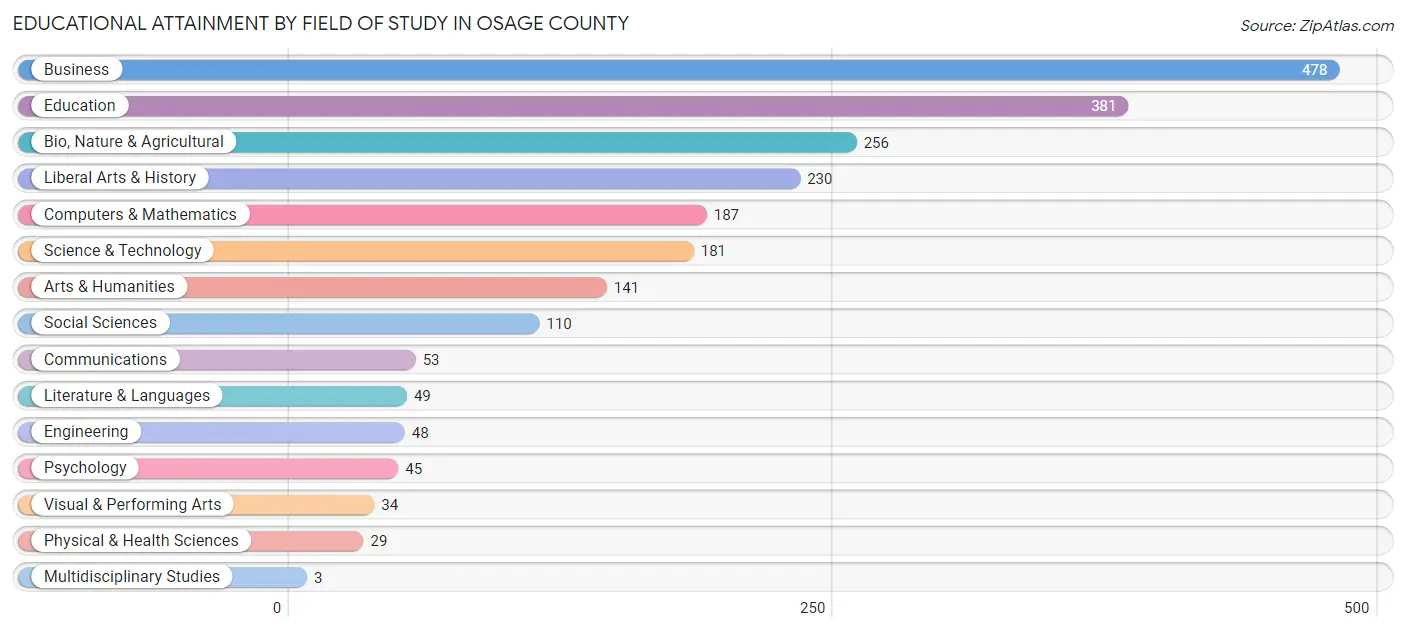
| Field of Study | # Graduates | % Graduates |
| Computers & Mathematics | 187 | 8.4% |
| Bio, Nature & Agricultural | 256 | 11.5% |
| Physical & Health Sciences | 29 | 1.3% |
| Psychology | 45 | 2.0% |
| Social Sciences | 110 | 4.9% |
| Engineering | 48 | 2.2% |
| Multidisciplinary Studies | 3 | 0.1% |
| Science & Technology | 181 | 8.1% |
| Business | 478 | 21.5% |
| Education | 381 | 17.1% |
| Literature & Languages | 49 | 2.2% |
| Liberal Arts & History | 230 | 10.3% |
| Visual & Performing Arts | 34 | 1.5% |
| Communications | 53 | 2.4% |
| Arts & Humanities | 141 | 6.3% |
| Total | 2,225 | 100.0% |
Transportation & Commute in Osage County
Vehicle Availability by Sex in Osage County
The most prevalent vehicle ownership categories in Osage County are males with 3 vehicles (1,136, accounting for 31.6%) and females with 3 vehicles (1,086, making up 37.7%).
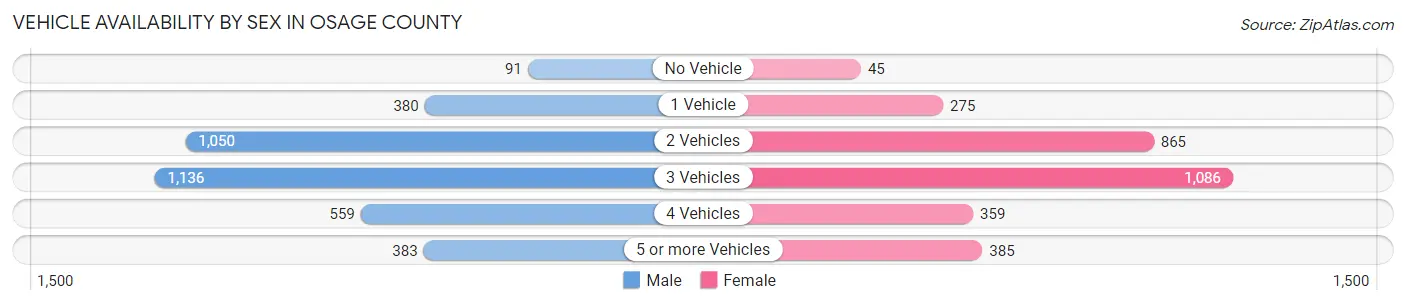
| Vehicles Available | Male | Female |
| No Vehicle | 91 (2.5%) | 45 (1.5%) |
| 1 Vehicle | 380 (10.6%) | 275 (9.1%) |
| 2 Vehicles | 1,050 (29.2%) | 865 (28.7%) |
| 3 Vehicles | 1,136 (31.6%) | 1,086 (36.0%) |
| 4 Vehicles | 559 (15.5%) | 359 (11.9%) |
| 5 or more Vehicles | 383 (10.6%) | 385 (12.8%) |
| Total | 3,599 (100.0%) | 3,015 (100.0%) |
Commute Time in Osage County
The most frequently occuring commute durations in Osage County are 30 to 34 minutes (969 commuters, 15.5%), 20 to 24 minutes (901 commuters, 14.4%), and 5 to 9 minutes (751 commuters, 12.0%).
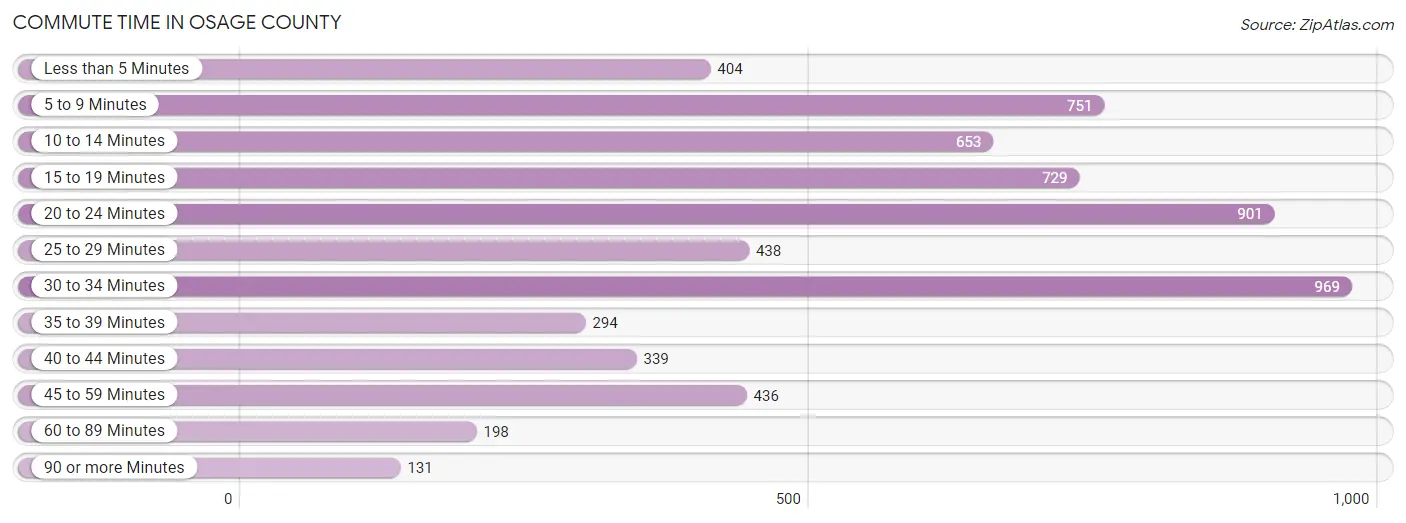
| Commute Time | # Commuters | % Commuters |
| Less than 5 Minutes | 404 | 6.5% |
| 5 to 9 Minutes | 751 | 12.0% |
| 10 to 14 Minutes | 653 | 10.5% |
| 15 to 19 Minutes | 729 | 11.7% |
| 20 to 24 Minutes | 901 | 14.4% |
| 25 to 29 Minutes | 438 | 7.0% |
| 30 to 34 Minutes | 969 | 15.5% |
| 35 to 39 Minutes | 294 | 4.7% |
| 40 to 44 Minutes | 339 | 5.4% |
| 45 to 59 Minutes | 436 | 7.0% |
| 60 to 89 Minutes | 198 | 3.2% |
| 90 or more Minutes | 131 | 2.1% |
Commute Time by Sex in Osage County
The most common commute times in Osage County are 20 to 24 minutes (550 commuters, 16.0%) for males and 30 to 34 minutes (544 commuters, 19.4%) for females.
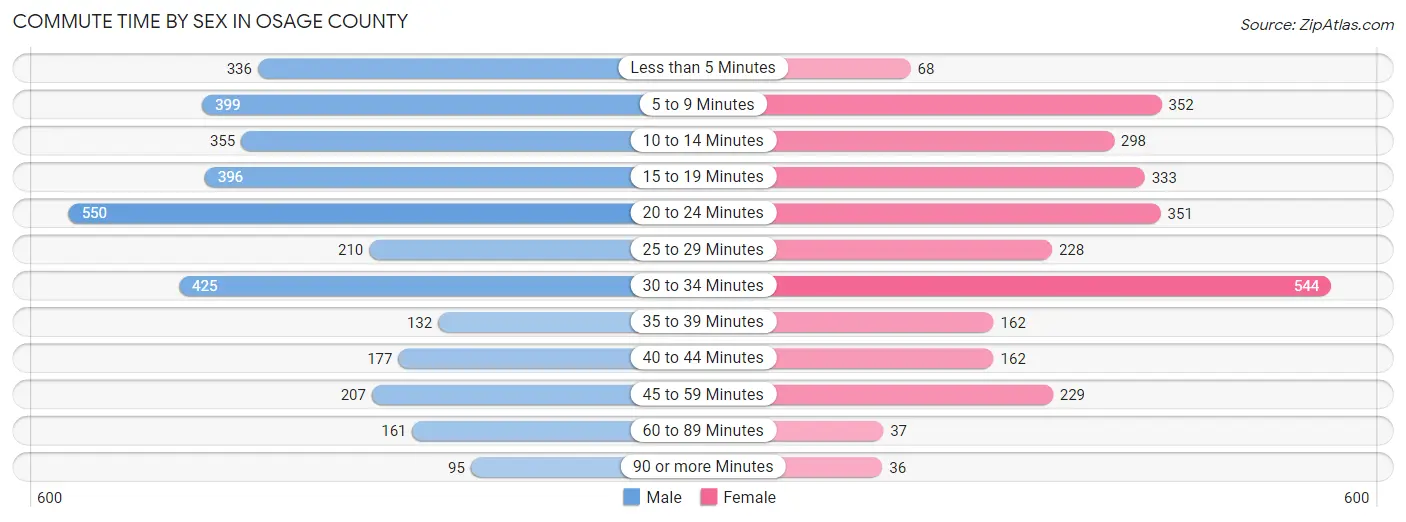
| Commute Time | Male | Female |
| Less than 5 Minutes | 336 (9.8%) | 68 (2.4%) |
| 5 to 9 Minutes | 399 (11.6%) | 352 (12.6%) |
| 10 to 14 Minutes | 355 (10.3%) | 298 (10.6%) |
| 15 to 19 Minutes | 396 (11.5%) | 333 (11.9%) |
| 20 to 24 Minutes | 550 (16.0%) | 351 (12.5%) |
| 25 to 29 Minutes | 210 (6.1%) | 228 (8.1%) |
| 30 to 34 Minutes | 425 (12.3%) | 544 (19.4%) |
| 35 to 39 Minutes | 132 (3.8%) | 162 (5.8%) |
| 40 to 44 Minutes | 177 (5.1%) | 162 (5.8%) |
| 45 to 59 Minutes | 207 (6.0%) | 229 (8.2%) |
| 60 to 89 Minutes | 161 (4.7%) | 37 (1.3%) |
| 90 or more Minutes | 95 (2.8%) | 36 (1.3%) |
Time of Departure to Work by Sex in Osage County
The most frequent times of departure to work in Osage County are 6:00 AM to 6:29 AM (698, 20.3%) for males and 7:00 AM to 7:29 AM (736, 26.3%) for females.
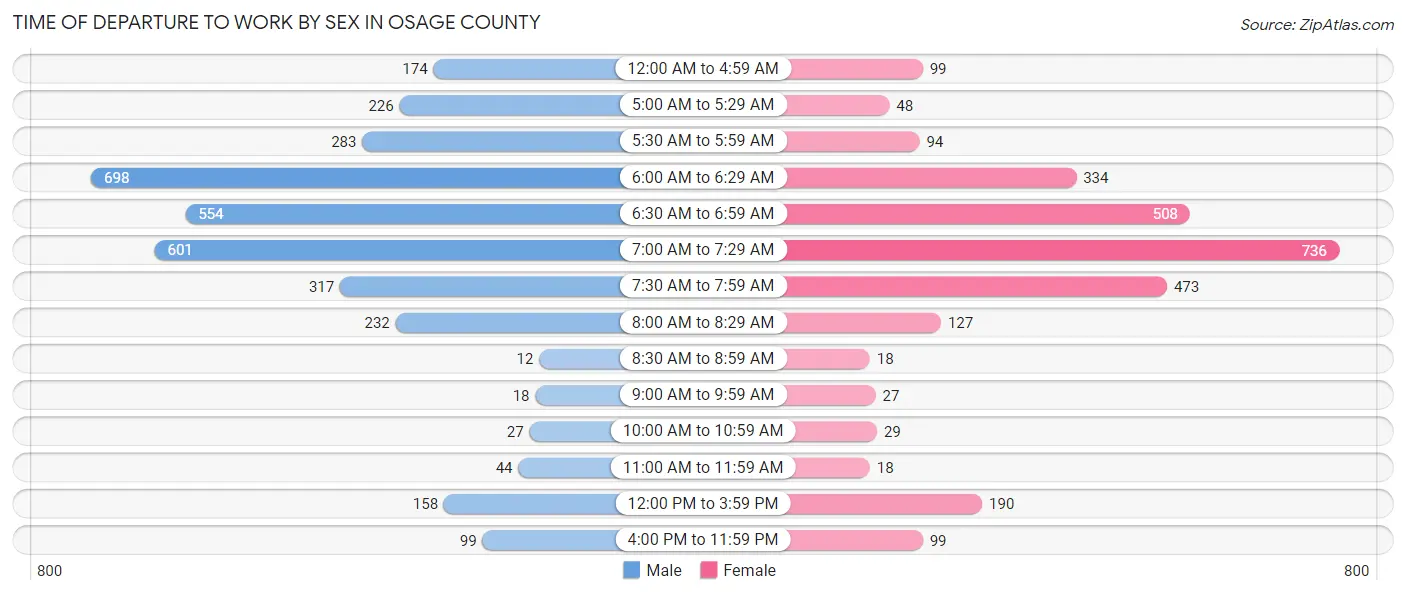
| Time of Departure | Male | Female |
| 12:00 AM to 4:59 AM | 174 (5.1%) | 99 (3.5%) |
| 5:00 AM to 5:29 AM | 226 (6.6%) | 48 (1.7%) |
| 5:30 AM to 5:59 AM | 283 (8.2%) | 94 (3.4%) |
| 6:00 AM to 6:29 AM | 698 (20.3%) | 334 (11.9%) |
| 6:30 AM to 6:59 AM | 554 (16.1%) | 508 (18.1%) |
| 7:00 AM to 7:29 AM | 601 (17.5%) | 736 (26.3%) |
| 7:30 AM to 7:59 AM | 317 (9.2%) | 473 (16.9%) |
| 8:00 AM to 8:29 AM | 232 (6.7%) | 127 (4.5%) |
| 8:30 AM to 8:59 AM | 12 (0.4%) | 18 (0.6%) |
| 9:00 AM to 9:59 AM | 18 (0.5%) | 27 (1.0%) |
| 10:00 AM to 10:59 AM | 27 (0.8%) | 29 (1.0%) |
| 11:00 AM to 11:59 AM | 44 (1.3%) | 18 (0.6%) |
| 12:00 PM to 3:59 PM | 158 (4.6%) | 190 (6.8%) |
| 4:00 PM to 11:59 PM | 99 (2.9%) | 99 (3.5%) |
| Total | 3,443 (100.0%) | 2,800 (100.0%) |
Housing Occupancy in Osage County
Occupancy by Ownership in Osage County
Of the total 5,220 dwellings in Osage County, owner-occupied units account for 4,342 (83.2%), while renter-occupied units make up 878 (16.8%).
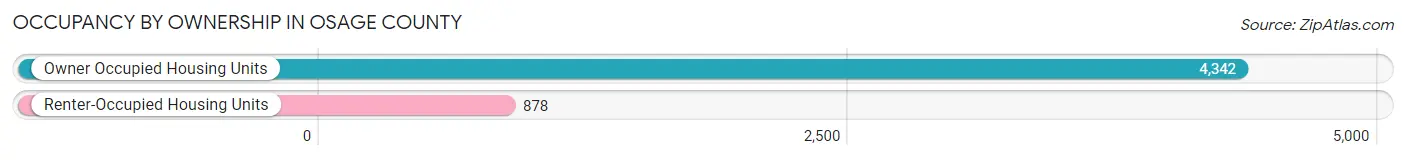
| Occupancy | # Housing Units | % Housing Units |
| Owner Occupied Housing Units | 4,342 | 83.2% |
| Renter-Occupied Housing Units | 878 | 16.8% |
| Total Occupied Housing Units | 5,220 | 100.0% |
Occupancy by Household Size in Osage County
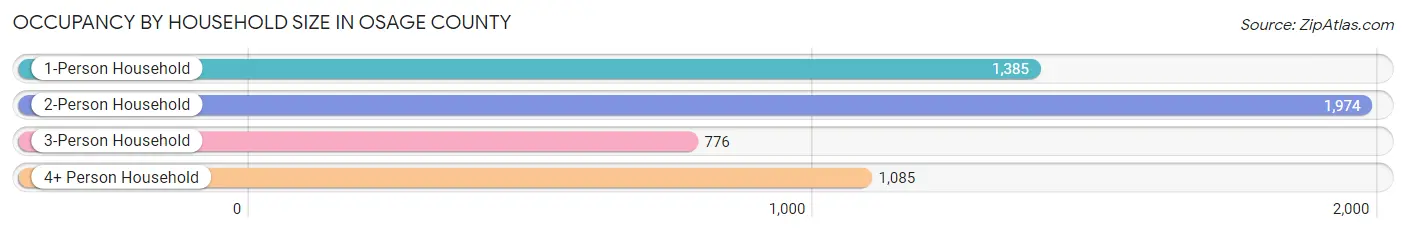
| Household Size | # Housing Units | % Housing Units |
| 1-Person Household | 1,385 | 26.5% |
| 2-Person Household | 1,974 | 37.8% |
| 3-Person Household | 776 | 14.9% |
| 4+ Person Household | 1,085 | 20.8% |
| Total Housing Units | 5,220 | 100.0% |
Occupancy by Ownership by Household Size in Osage County
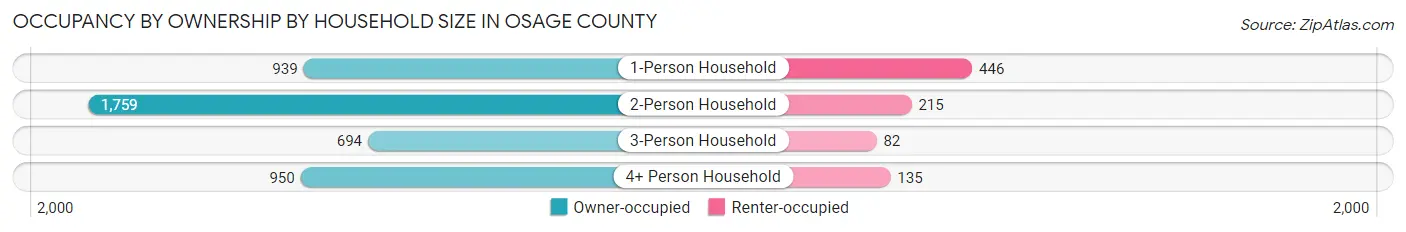
| Household Size | Owner-occupied | Renter-occupied |
| 1-Person Household | 939 (67.8%) | 446 (32.2%) |
| 2-Person Household | 1,759 (89.1%) | 215 (10.9%) |
| 3-Person Household | 694 (89.4%) | 82 (10.6%) |
| 4+ Person Household | 950 (87.6%) | 135 (12.4%) |
| Total Housing Units | 4,342 (83.2%) | 878 (16.8%) |
Occupancy by Educational Attainment in Osage County
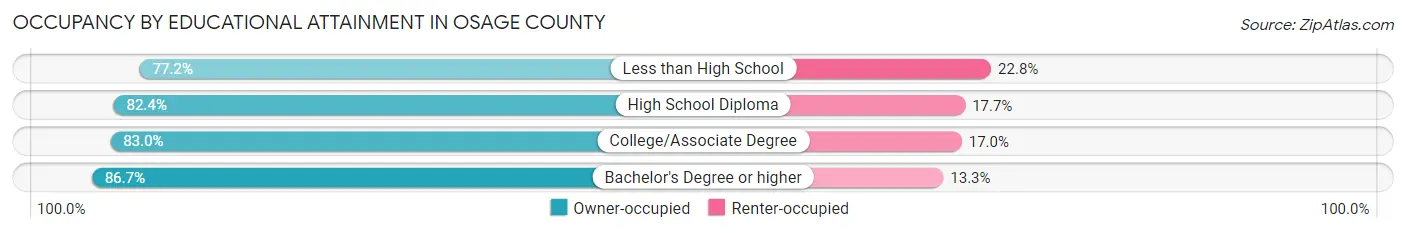
| Household Size | Owner-occupied | Renter-occupied |
| Less than High School | 298 (77.2%) | 88 (22.8%) |
| High School Diploma | 1,745 (82.4%) | 374 (17.6%) |
| College/Associate Degree | 1,232 (83.0%) | 252 (17.0%) |
| Bachelor's Degree or higher | 1,067 (86.7%) | 164 (13.3%) |
Occupancy by Age of Householder in Osage County
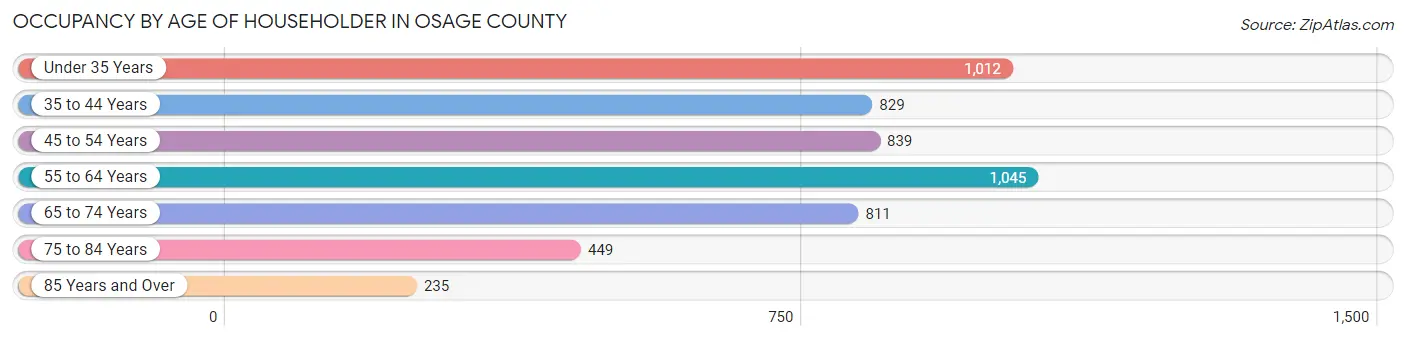
| Age Bracket | # Households | % Households |
| Under 35 Years | 1,012 | 19.4% |
| 35 to 44 Years | 829 | 15.9% |
| 45 to 54 Years | 839 | 16.1% |
| 55 to 64 Years | 1,045 | 20.0% |
| 65 to 74 Years | 811 | 15.5% |
| 75 to 84 Years | 449 | 8.6% |
| 85 Years and Over | 235 | 4.5% |
| Total | 5,220 | 100.0% |
Housing Finances in Osage County
Median Income by Occupancy in Osage County
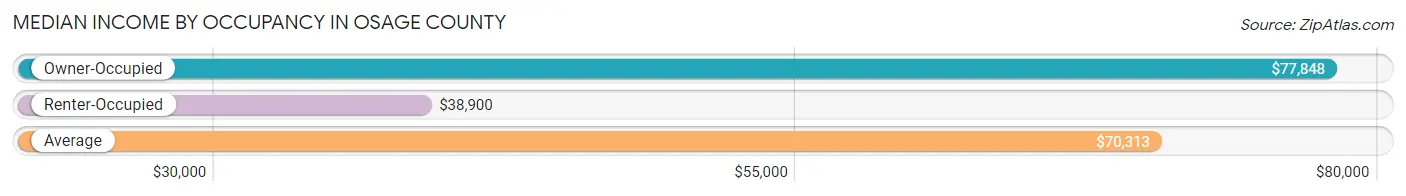
| Occupancy Type | # Households | Median Income |
| Owner-Occupied | 4,342 (83.2%) | $77,848 |
| Renter-Occupied | 878 (16.8%) | $38,900 |
| Average | 5,220 (100.0%) | $70,313 |
Occupancy by Householder Income Bracket in Osage County
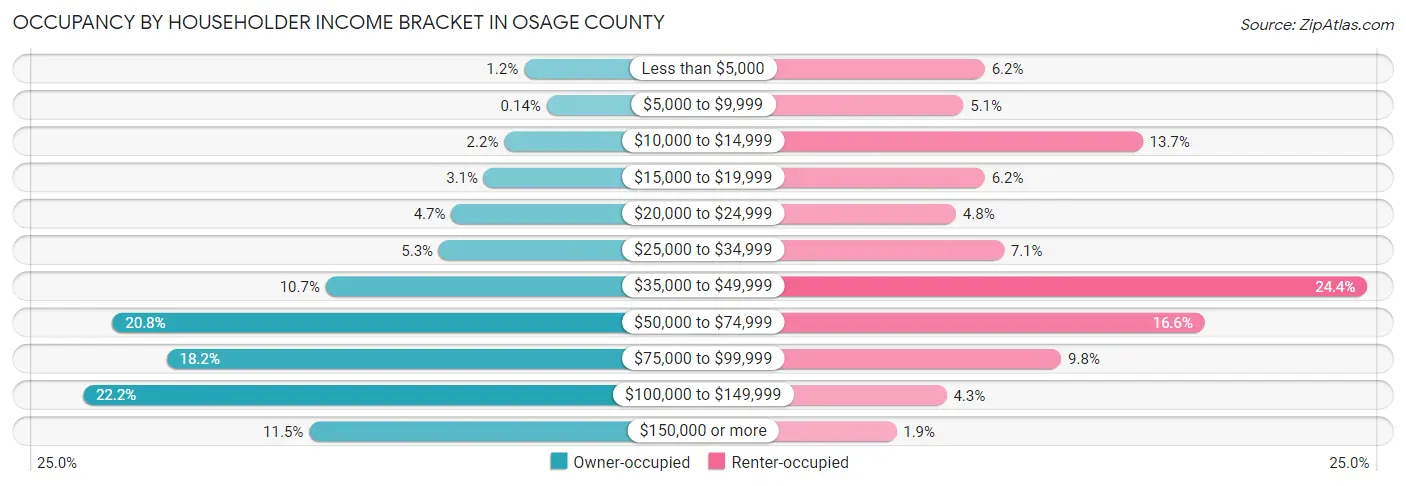
| Income Bracket | Owner-occupied | Renter-occupied |
| Less than $5,000 | 53 (1.2%) | 54 (6.1%) |
| $5,000 to $9,999 | 6 (0.1%) | 45 (5.1%) |
| $10,000 to $14,999 | 94 (2.2%) | 120 (13.7%) |
| $15,000 to $19,999 | 136 (3.1%) | 54 (6.1%) |
| $20,000 to $24,999 | 203 (4.7%) | 42 (4.8%) |
| $25,000 to $34,999 | 229 (5.3%) | 62 (7.1%) |
| $35,000 to $49,999 | 463 (10.7%) | 214 (24.4%) |
| $50,000 to $74,999 | 904 (20.8%) | 146 (16.6%) |
| $75,000 to $99,999 | 792 (18.2%) | 86 (9.8%) |
| $100,000 to $149,999 | 965 (22.2%) | 38 (4.3%) |
| $150,000 or more | 497 (11.5%) | 17 (1.9%) |
| Total | 4,342 (100.0%) | 878 (100.0%) |
Monthly Housing Cost Tiers in Osage County
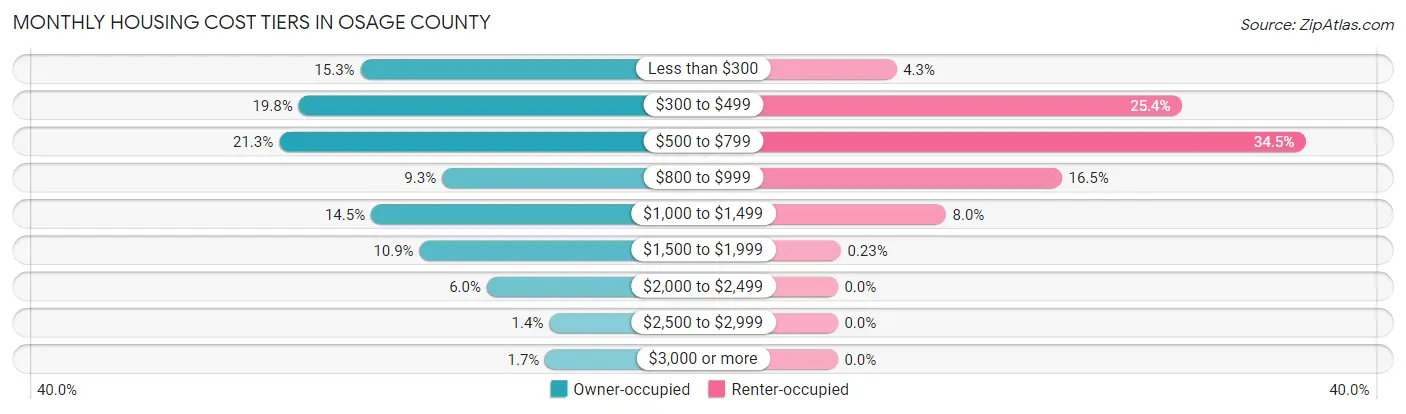
| Monthly Cost | Owner-occupied | Renter-occupied |
| Less than $300 | 663 (15.3%) | 38 (4.3%) |
| $300 to $499 | 861 (19.8%) | 223 (25.4%) |
| $500 to $799 | 923 (21.3%) | 303 (34.5%) |
| $800 to $999 | 402 (9.3%) | 145 (16.5%) |
| $1,000 to $1,499 | 629 (14.5%) | 70 (8.0%) |
| $1,500 to $1,999 | 474 (10.9%) | 2 (0.2%) |
| $2,000 to $2,499 | 259 (6.0%) | 0 (0.0%) |
| $2,500 to $2,999 | 59 (1.4%) | 0 (0.0%) |
| $3,000 or more | 72 (1.7%) | 0 (0.0%) |
| Total | 4,342 (100.0%) | 878 (100.0%) |
Physical Housing Characteristics in Osage County
Housing Structures in Osage County
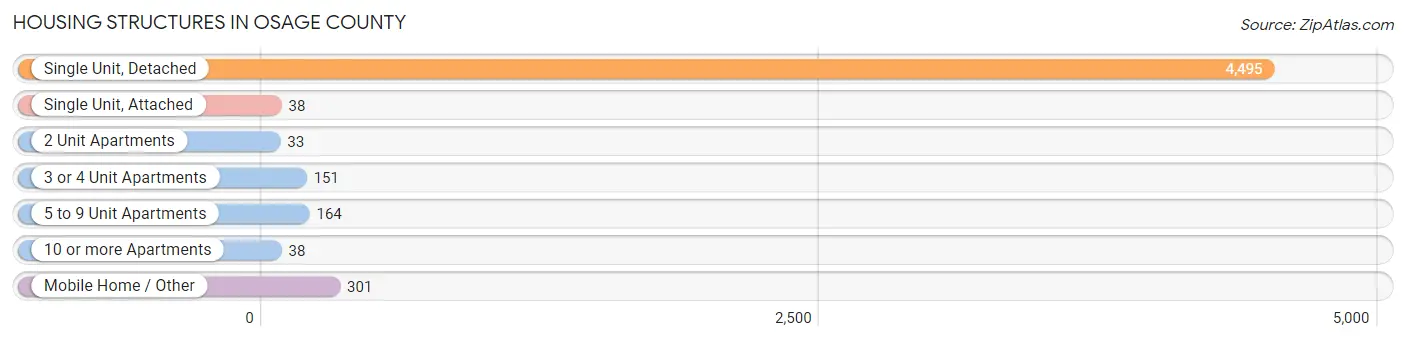
| Structure Type | # Housing Units | % Housing Units |
| Single Unit, Detached | 4,495 | 86.1% |
| Single Unit, Attached | 38 | 0.7% |
| 2 Unit Apartments | 33 | 0.6% |
| 3 or 4 Unit Apartments | 151 | 2.9% |
| 5 to 9 Unit Apartments | 164 | 3.1% |
| 10 or more Apartments | 38 | 0.7% |
| Mobile Home / Other | 301 | 5.8% |
| Total | 5,220 | 100.0% |
Housing Structures by Occupancy in Osage County
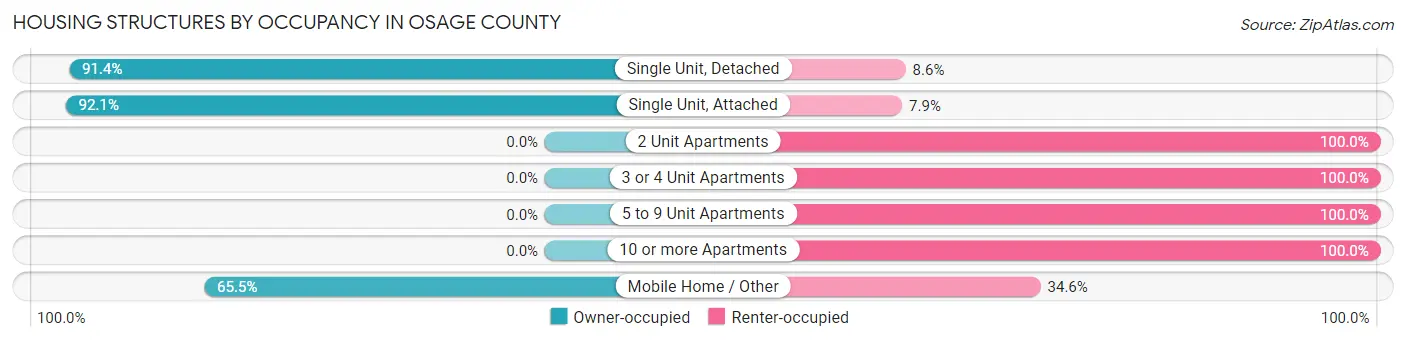
| Structure Type | Owner-occupied | Renter-occupied |
| Single Unit, Detached | 4,110 (91.4%) | 385 (8.6%) |
| Single Unit, Attached | 35 (92.1%) | 3 (7.9%) |
| 2 Unit Apartments | 0 (0.0%) | 33 (100.0%) |
| 3 or 4 Unit Apartments | 0 (0.0%) | 151 (100.0%) |
| 5 to 9 Unit Apartments | 0 (0.0%) | 164 (100.0%) |
| 10 or more Apartments | 0 (0.0%) | 38 (100.0%) |
| Mobile Home / Other | 197 (65.4%) | 104 (34.5%) |
| Total | 4,342 (83.2%) | 878 (16.8%) |
Housing Structures by Number of Rooms in Osage County
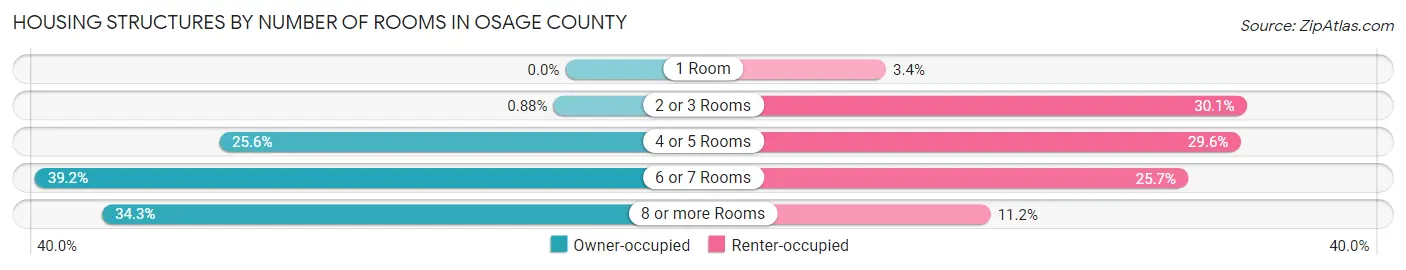
| Number of Rooms | Owner-occupied | Renter-occupied |
| 1 Room | 0 (0.0%) | 30 (3.4%) |
| 2 or 3 Rooms | 38 (0.9%) | 264 (30.1%) |
| 4 or 5 Rooms | 1,112 (25.6%) | 260 (29.6%) |
| 6 or 7 Rooms | 1,704 (39.2%) | 226 (25.7%) |
| 8 or more Rooms | 1,488 (34.3%) | 98 (11.2%) |
| Total | 4,342 (100.0%) | 878 (100.0%) |
Housing Structure by Heating Type in Osage County
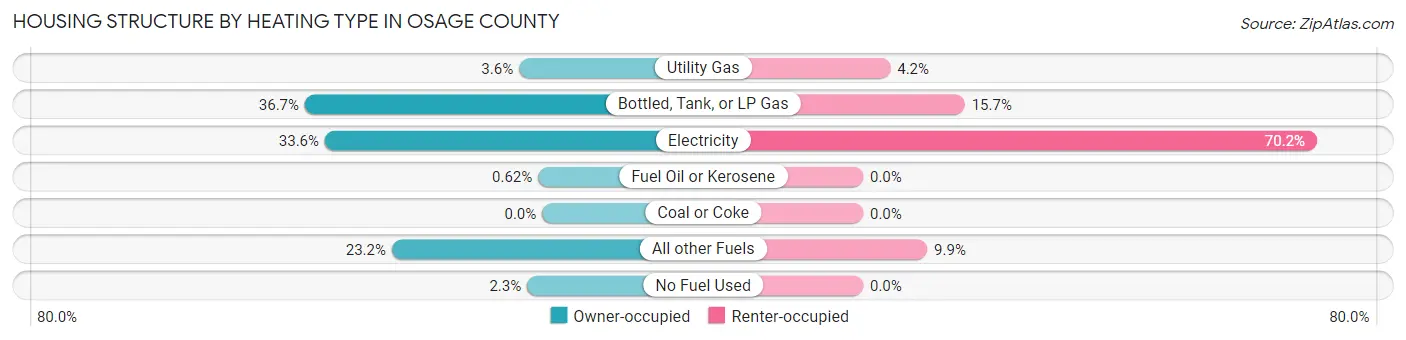
| Heating Type | Owner-occupied | Renter-occupied |
| Utility Gas | 155 (3.6%) | 37 (4.2%) |
| Bottled, Tank, or LP Gas | 1,592 (36.7%) | 138 (15.7%) |
| Electricity | 1,458 (33.6%) | 616 (70.2%) |
| Fuel Oil or Kerosene | 27 (0.6%) | 0 (0.0%) |
| Coal or Coke | 0 (0.0%) | 0 (0.0%) |
| All other Fuels | 1,009 (23.2%) | 87 (9.9%) |
| No Fuel Used | 101 (2.3%) | 0 (0.0%) |
| Total | 4,342 (100.0%) | 878 (100.0%) |
Household Vehicle Usage in Osage County
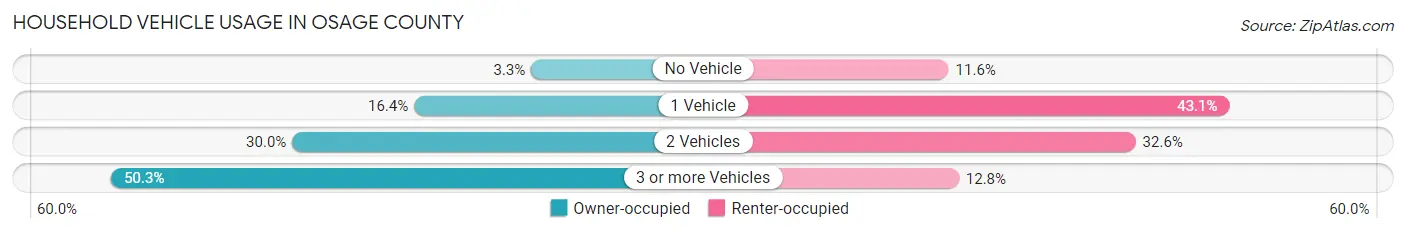
| Vehicles per Household | Owner-occupied | Renter-occupied |
| No Vehicle | 142 (3.3%) | 102 (11.6%) |
| 1 Vehicle | 711 (16.4%) | 378 (43.0%) |
| 2 Vehicles | 1,304 (30.0%) | 286 (32.6%) |
| 3 or more Vehicles | 2,185 (50.3%) | 112 (12.8%) |
| Total | 4,342 (100.0%) | 878 (100.0%) |
Real Estate & Mortgages in Osage County
Real Estate and Mortgage Overview in Osage County
| Characteristic | Without Mortgage | With Mortgage |
| Housing Units | 2,161 | 2,181 |
| Median Property Value | $186,100 | $179,200 |
| Median Household Income | $71,048 | $299 |
| Monthly Housing Costs | $391 | $67 |
| Real Estate Taxes | $1,155 | $36 |
Property Value by Mortgage Status in Osage County
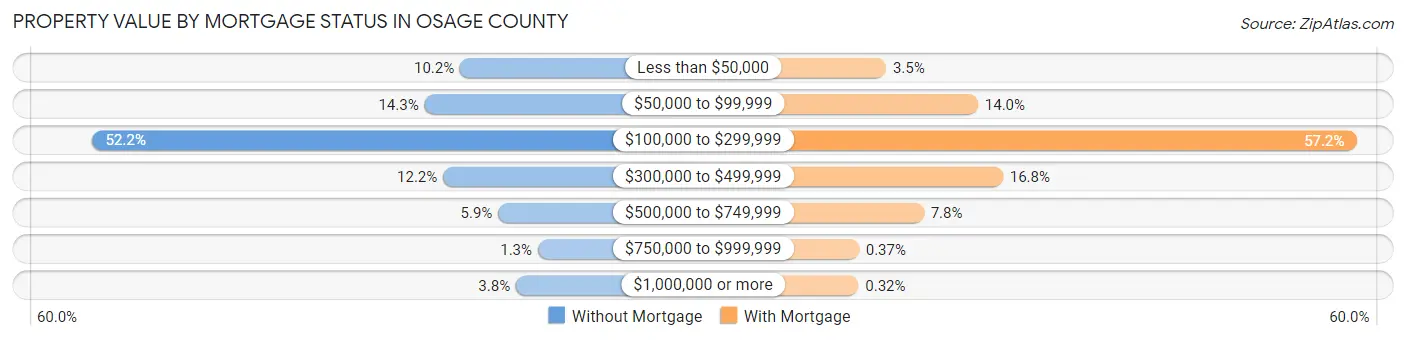
| Property Value | Without Mortgage | With Mortgage |
| Less than $50,000 | 221 (10.2%) | 76 (3.5%) |
| $50,000 to $99,999 | 309 (14.3%) | 305 (14.0%) |
| $100,000 to $299,999 | 1,129 (52.2%) | 1,248 (57.2%) |
| $300,000 to $499,999 | 263 (12.2%) | 367 (16.8%) |
| $500,000 to $749,999 | 127 (5.9%) | 170 (7.8%) |
| $750,000 to $999,999 | 29 (1.3%) | 8 (0.4%) |
| $1,000,000 or more | 83 (3.8%) | 7 (0.3%) |
| Total | 2,161 (100.0%) | 2,181 (100.0%) |
Household Income by Mortgage Status in Osage County
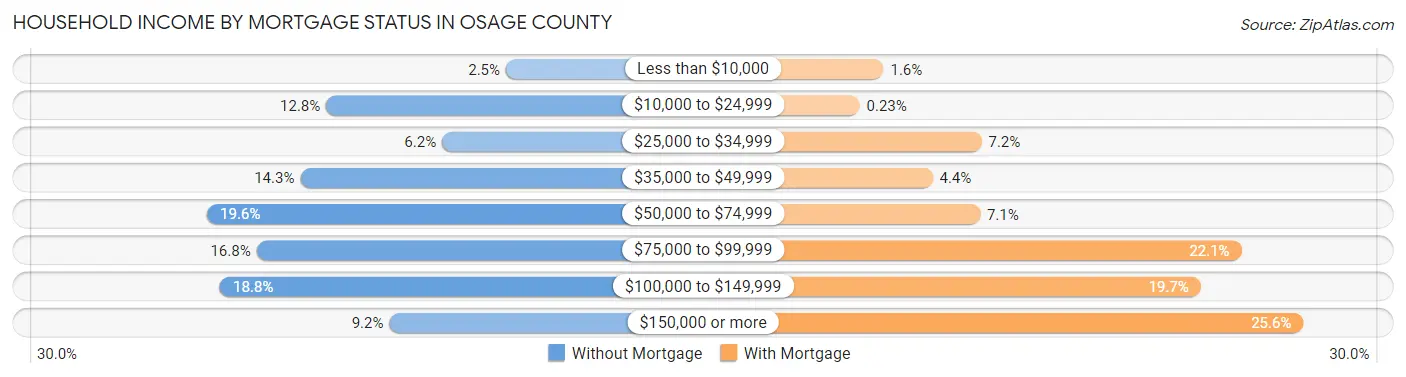
| Household Income | Without Mortgage | With Mortgage |
| Less than $10,000 | 54 (2.5%) | 35 (1.6%) |
| $10,000 to $24,999 | 276 (12.8%) | 5 (0.2%) |
| $25,000 to $34,999 | 133 (6.1%) | 157 (7.2%) |
| $35,000 to $49,999 | 308 (14.2%) | 96 (4.4%) |
| $50,000 to $74,999 | 423 (19.6%) | 155 (7.1%) |
| $75,000 to $99,999 | 362 (16.8%) | 481 (22.1%) |
| $100,000 to $149,999 | 407 (18.8%) | 430 (19.7%) |
| $150,000 or more | 198 (9.2%) | 558 (25.6%) |
| Total | 2,161 (100.0%) | 2,181 (100.0%) |
Property Value to Household Income Ratio in Osage County
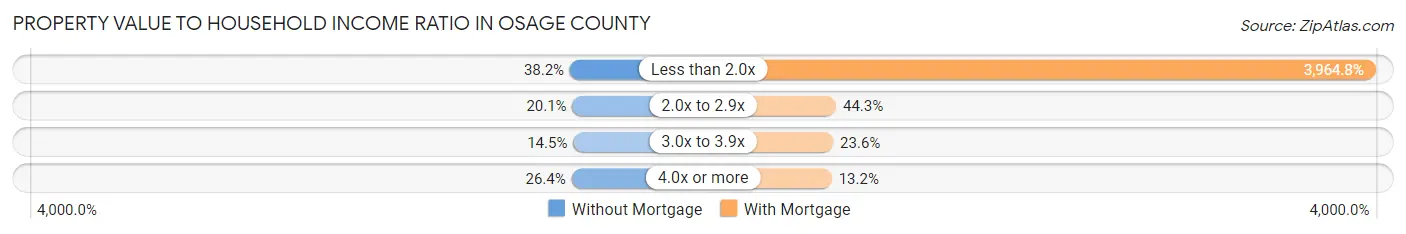
| Value-to-Income Ratio | Without Mortgage | With Mortgage |
| Less than 2.0x | 825 (38.2%) | 86,473 (3,964.8%) |
| 2.0x to 2.9x | 434 (20.1%) | 967 (44.3%) |
| 3.0x to 3.9x | 313 (14.5%) | 514 (23.6%) |
| 4.0x or more | 571 (26.4%) | 287 (13.2%) |
| Total | 2,161 (100.0%) | 2,181 (100.0%) |
Real Estate Taxes by Mortgage Status in Osage County
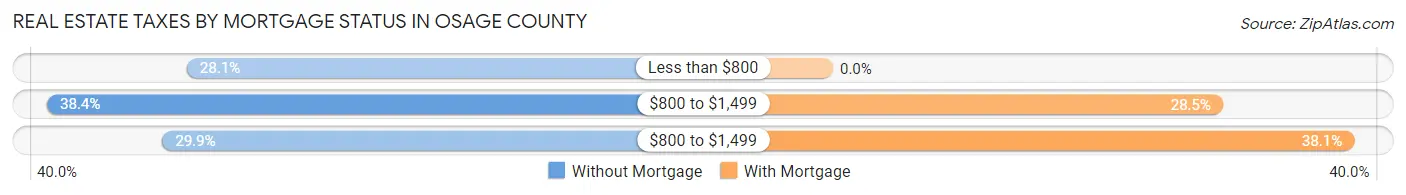
| Property Taxes | Without Mortgage | With Mortgage |
| Less than $800 | 608 (28.1%) | 0 (0.0%) |
| $800 to $1,499 | 829 (38.4%) | 621 (28.5%) |
| $800 to $1,499 | 647 (29.9%) | 830 (38.1%) |
| Total | 2,161 (100.0%) | 2,181 (100.0%) |
Health & Disability in Osage County
Health Insurance Coverage by Age in Osage County
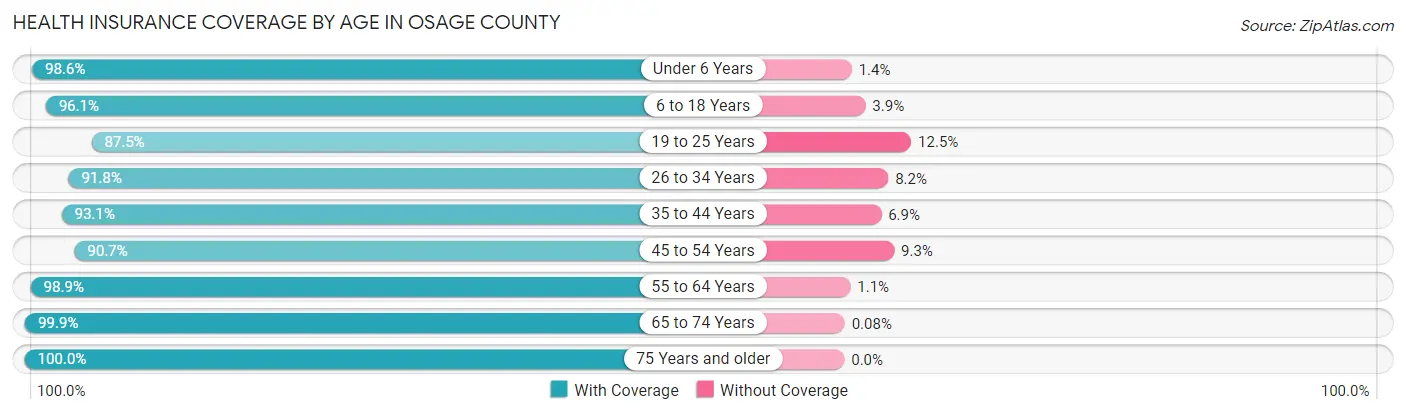
| Age Bracket | With Coverage | Without Coverage |
| Under 6 Years | 781 (98.6%) | 11 (1.4%) |
| 6 to 18 Years | 2,342 (96.1%) | 96 (3.9%) |
| 19 to 25 Years | 1,067 (87.5%) | 152 (12.5%) |
| 26 to 34 Years | 1,256 (91.8%) | 112 (8.2%) |
| 35 to 44 Years | 1,447 (93.1%) | 107 (6.9%) |
| 45 to 54 Years | 1,533 (90.7%) | 157 (9.3%) |
| 55 to 64 Years | 1,933 (98.9%) | 22 (1.1%) |
| 65 to 74 Years | 1,331 (99.9%) | 1 (0.1%) |
| 75 Years and older | 963 (100.0%) | 0 (0.0%) |
| Total | 12,653 (95.1%) | 658 (4.9%) |
Health Insurance Coverage by Citizenship Status in Osage County
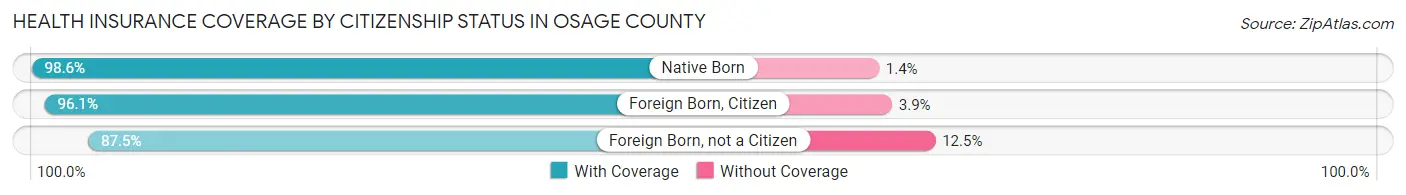
| Citizenship Status | With Coverage | Without Coverage |
| Native Born | 781 (98.6%) | 11 (1.4%) |
| Foreign Born, Citizen | 2,342 (96.1%) | 96 (3.9%) |
| Foreign Born, not a Citizen | 1,067 (87.5%) | 152 (12.5%) |
Health Insurance Coverage by Household Income in Osage County
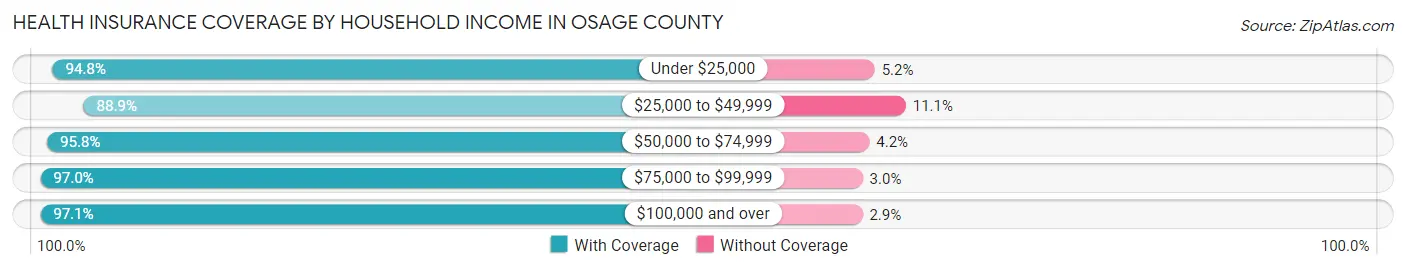
| Household Income | With Coverage | Without Coverage |
| Under $25,000 | 1,086 (94.8%) | 60 (5.2%) |
| $25,000 to $49,999 | 1,504 (88.9%) | 187 (11.1%) |
| $50,000 to $74,999 | 2,535 (95.8%) | 112 (4.2%) |
| $75,000 to $99,999 | 2,453 (97.0%) | 75 (3.0%) |
| $100,000 and over | 4,958 (97.1%) | 150 (2.9%) |
Public vs Private Health Insurance Coverage by Age in Osage County
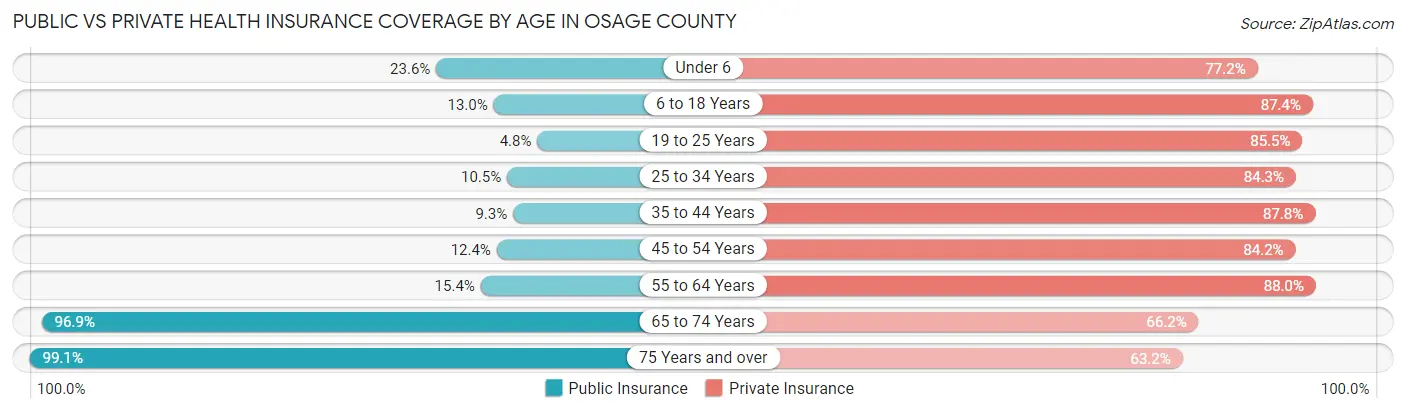
| Age Bracket | Public Insurance | Private Insurance |
| Under 6 | 187 (23.6%) | 611 (77.1%) |
| 6 to 18 Years | 316 (13.0%) | 2,131 (87.4%) |
| 19 to 25 Years | 59 (4.8%) | 1,042 (85.5%) |
| 25 to 34 Years | 143 (10.4%) | 1,153 (84.3%) |
| 35 to 44 Years | 145 (9.3%) | 1,365 (87.8%) |
| 45 to 54 Years | 209 (12.4%) | 1,423 (84.2%) |
| 55 to 64 Years | 300 (15.3%) | 1,720 (88.0%) |
| 65 to 74 Years | 1,290 (96.9%) | 882 (66.2%) |
| 75 Years and over | 954 (99.1%) | 609 (63.2%) |
| Total | 3,603 (27.1%) | 10,936 (82.2%) |
Disability Status by Sex by Age in Osage County
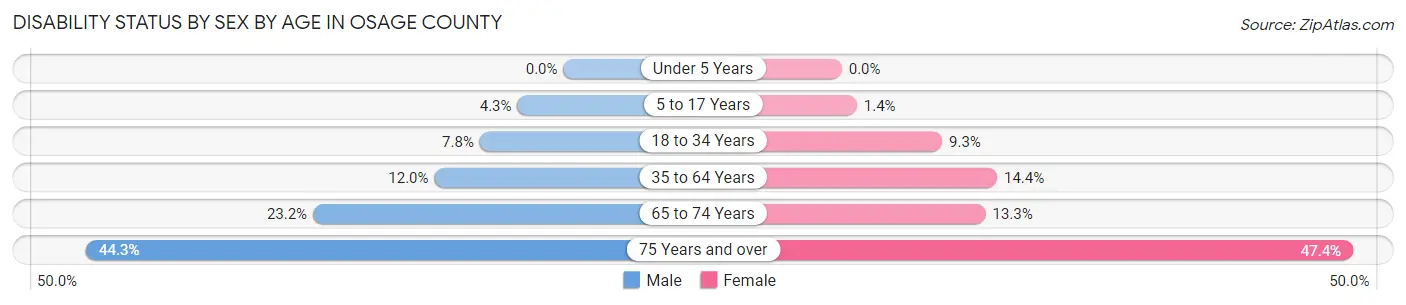
| Age Bracket | Male | Female |
| Under 5 Years | 0 (0.0%) | 0 (0.0%) |
| 5 to 17 Years | 52 (4.3%) | 16 (1.4%) |
| 18 to 34 Years | 114 (7.8%) | 118 (9.3%) |
| 35 to 64 Years | 325 (12.0%) | 358 (14.4%) |
| 65 to 74 Years | 158 (23.2%) | 87 (13.3%) |
| 75 Years and over | 194 (44.3%) | 249 (47.4%) |
Disability Class by Sex by Age in Osage County
Disability Class: Hearing Difficulty
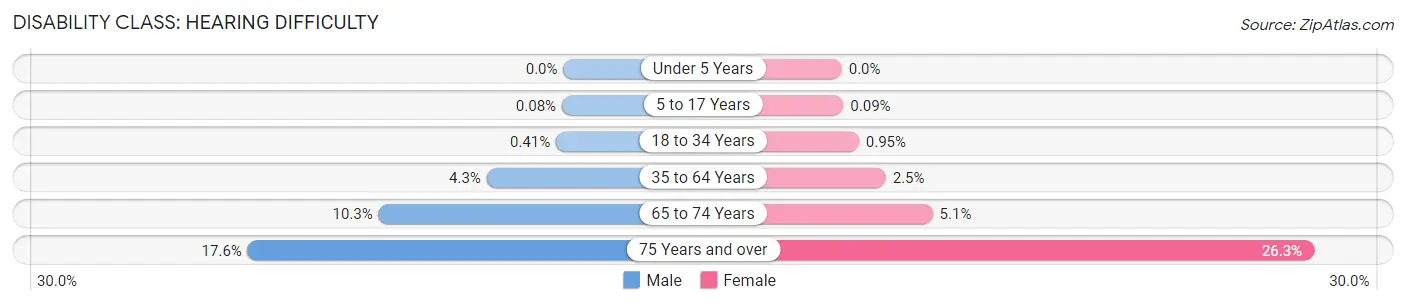
| Age Bracket | Male | Female |
| Under 5 Years | 0 (0.0%) | 0 (0.0%) |
| 5 to 17 Years | 1 (0.1%) | 1 (0.1%) |
| 18 to 34 Years | 6 (0.4%) | 12 (0.9%) |
| 35 to 64 Years | 116 (4.3%) | 61 (2.5%) |
| 65 to 74 Years | 70 (10.3%) | 33 (5.1%) |
| 75 Years and over | 77 (17.6%) | 138 (26.3%) |
Disability Class: Vision Difficulty
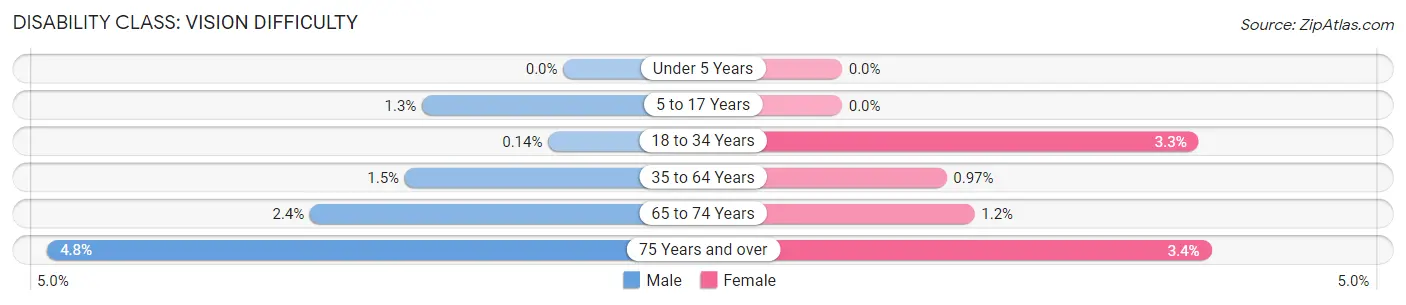
| Age Bracket | Male | Female |
| Under 5 Years | 0 (0.0%) | 0 (0.0%) |
| 5 to 17 Years | 16 (1.3%) | 0 (0.0%) |
| 18 to 34 Years | 2 (0.1%) | 42 (3.3%) |
| 35 to 64 Years | 40 (1.5%) | 24 (1.0%) |
| 65 to 74 Years | 16 (2.4%) | 8 (1.2%) |
| 75 Years and over | 21 (4.8%) | 18 (3.4%) |
Disability Class: Cognitive Difficulty
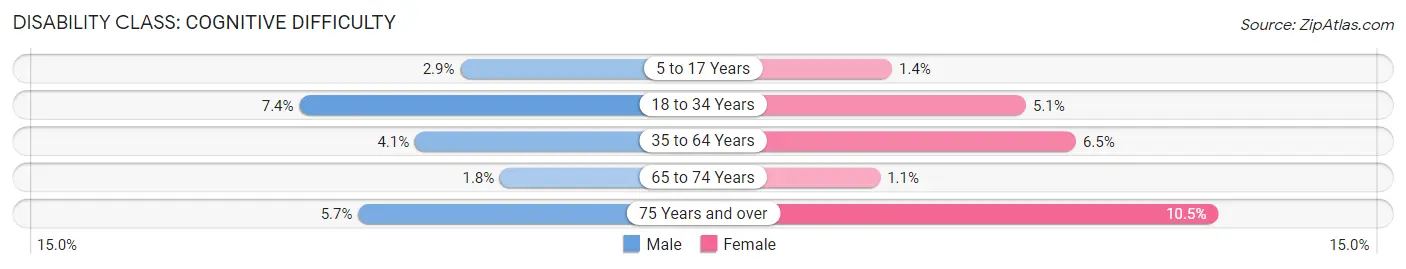
| Age Bracket | Male | Female |
| 5 to 17 Years | 35 (2.9%) | 16 (1.4%) |
| 18 to 34 Years | 108 (7.3%) | 65 (5.1%) |
| 35 to 64 Years | 112 (4.1%) | 162 (6.5%) |
| 65 to 74 Years | 12 (1.8%) | 7 (1.1%) |
| 75 Years and over | 25 (5.7%) | 55 (10.5%) |
Disability Class: Ambulatory Difficulty
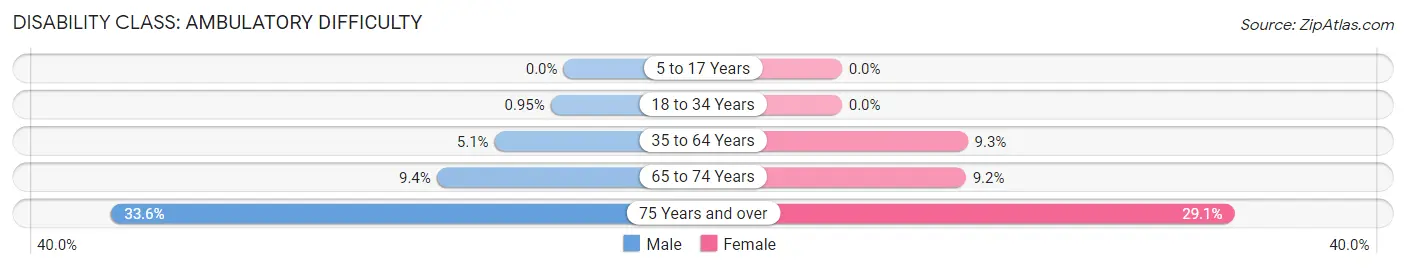
| Age Bracket | Male | Female |
| 5 to 17 Years | 0 (0.0%) | 0 (0.0%) |
| 18 to 34 Years | 14 (0.9%) | 0 (0.0%) |
| 35 to 64 Years | 139 (5.1%) | 232 (9.3%) |
| 65 to 74 Years | 64 (9.4%) | 60 (9.2%) |
| 75 Years and over | 147 (33.6%) | 153 (29.1%) |
Disability Class: Self-Care Difficulty
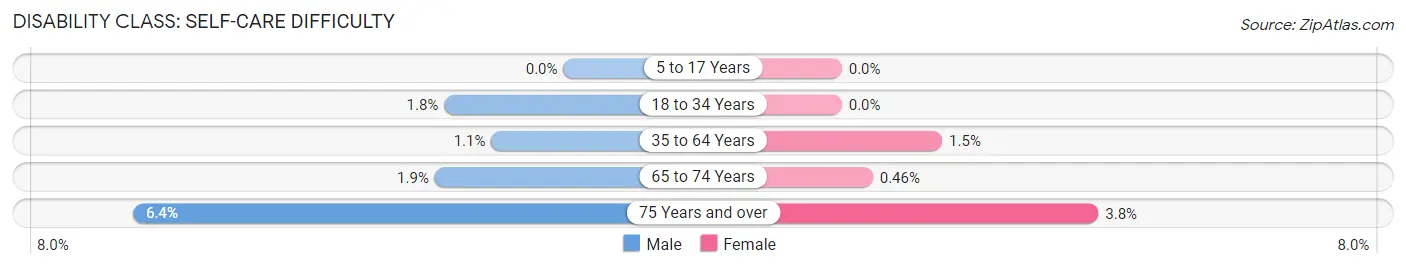
| Age Bracket | Male | Female |
| 5 to 17 Years | 0 (0.0%) | 0 (0.0%) |
| 18 to 34 Years | 26 (1.8%) | 0 (0.0%) |
| 35 to 64 Years | 29 (1.1%) | 37 (1.5%) |
| 65 to 74 Years | 13 (1.9%) | 3 (0.5%) |
| 75 Years and over | 28 (6.4%) | 20 (3.8%) |
Technology Access in Osage County
Computing Device Access in Osage County
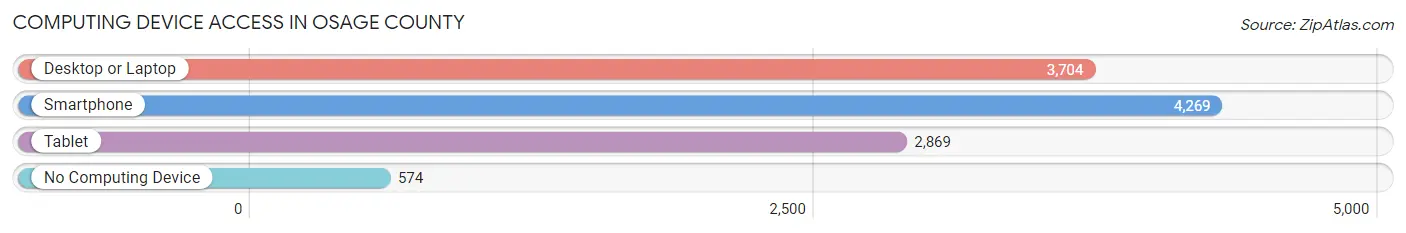
| Device Type | # Households | % Households |
| Desktop or Laptop | 3,704 | 71.0% |
| Smartphone | 4,269 | 81.8% |
| Tablet | 2,869 | 55.0% |
| No Computing Device | 574 | 11.0% |
| Total | 5,220 | 100.0% |
Internet Access in Osage County
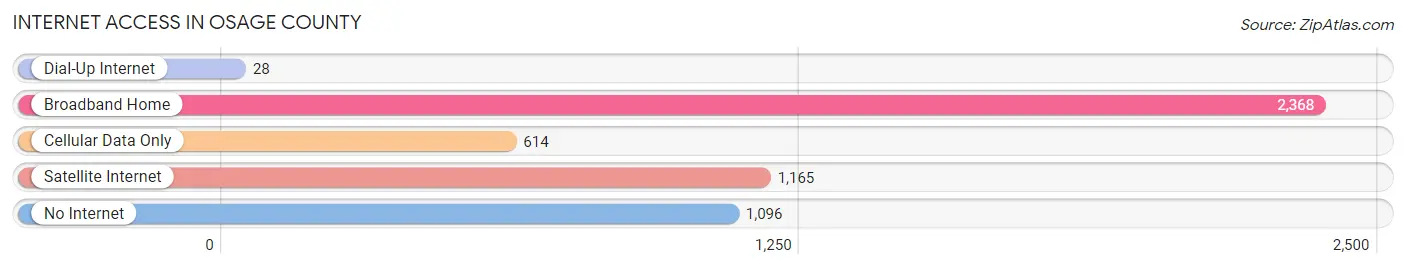
| Internet Type | # Households | % Households |
| Dial-Up Internet | 28 | 0.5% |
| Broadband Home | 2,368 | 45.4% |
| Cellular Data Only | 614 | 11.8% |
| Satellite Internet | 1,165 | 22.3% |
| No Internet | 1,096 | 21.0% |
| Total | 5,220 | 100.0% |
Osage County Summary
Osage County is located in the central part of Missouri, and is bordered by Miller, Maries, Gasconade, and Cole Counties. It is part of the Jefferson City, MO Metropolitan Statistical Area. The county seat is Linn. As of the 2010 census, the population was 13,878.
History
Osage County was established in 1841 and named after the Osage Indians who once inhabited the area. The county was originally part of Gasconade County, but was split off in 1841. The first settlers arrived in the area in the early 1800s, and the county was officially organized in 1841.
The county was home to several Native American tribes, including the Osage, Shawnee, and Delaware. The Osage were the dominant tribe in the area, and their presence in the county dates back to the 1700s.
Geography
Osage County is located in the central part of Missouri, and is bordered by Miller, Maries, Gasconade, and Cole Counties. It is part of the Jefferson City, MO Metropolitan Statistical Area. The county has a total area of 576 square miles, of which 574 square miles is land and 2 square miles is water.
The county is mostly rural, with rolling hills and wooded areas. The Osage River runs through the county, and there are several small lakes and streams. The highest point in the county is located in the northwest corner, at an elevation of 1,068 feet.
Economy
The economy of Osage County is largely based on agriculture. The county is home to several large farms, and the main crops grown in the area are corn, soybeans, wheat, and hay. Livestock production is also important to the local economy, with cattle, hogs, and poultry being the main animals raised.
The county also has a strong manufacturing sector, with several factories producing a variety of products, including furniture, clothing, and automotive parts. Tourism is also an important part of the local economy, with several attractions, including the Osage County Historical Museum and the Osage County Fair.
Demographics
As of the 2010 census, there were 13,878 people, 5,541 households, and 3,845 families living in the county. The population density was 24.2 people per square mile. The racial makeup of the county was 97.3% White, 0.7% African American, 0.3% Native American, 0.2% Asian, 0.1% Pacific Islander, 0.3% from other races, and 1.2% from two or more races. Hispanic or Latino of any race were 1.2% of the population.
The median income for a household in the county was $41,945, and the median income for a family was $50,945. The per capita income for the county was $20,945. About 11.2% of families and 14.2% of the population were below the poverty line, including 19.2% of those under age 18 and 8.2% of those age 65 or over.
Common Questions
What is Per Capita Income in Osage County?
Per Capita income in Osage County is $38,553.
What is the Median Family Income in Osage County?
Median Family Income in Osage County is $86,042.
What is the Median Household income in Osage County?
Median Household Income in Osage County is $70,313.
What is Income or Wage Gap in Osage County?
Income or Wage Gap in Osage County is 27.5%.
Women in Osage County earn 72.5 cents for every dollar earned by a man.
What is Family Income Deficit in Osage County?
Family Income Deficit in Osage County is $6,552.
Families that are below poverty line in Osage County earn $6,552 less on average than the poverty threshold level.
What is Inequality or Gini Index in Osage County?
Inequality or Gini Index in Osage County is 0.47.
What is the Total Population of Osage County?
Total Population of Osage County is 13,374.
What is the Total Male Population of Osage County?
Total Male Population of Osage County is 6,899.
What is the Total Female Population of Osage County?
Total Female Population of Osage County is 6,475.
What is the Ratio of Males per 100 Females in Osage County?
There are 106.55 Males per 100 Females in Osage County.
What is the Ratio of Females per 100 Males in Osage County?
There are 93.85 Females per 100 Males in Osage County.
What is the Median Population Age in Osage County?
Median Population Age in Osage County is 41.4 Years.
What is the Average Family Size in Osage County
Average Family Size in Osage County is 3.0 People.
What is the Average Household Size in Osage County
Average Household Size in Osage County is 2.5 People.
How Large is the Labor Force in Osage County?
There are 6,784 People in the Labor Forcein in Osage County.
What is the Percentage of People in the Labor Force in Osage County?
63.5% of People are in the Labor Force in Osage County.
What is the Unemployment Rate in Osage County?
Unemployment Rate in Osage County is 1.0%.