New Madrid County, MO Map & Demographics
New Madrid County Overview
$26,357
PER CAPITA INCOME
$60,033
AVG FAMILY INCOME
$44,092
AVG HOUSEHOLD INCOME
30.4%
WAGE / INCOME GAP [ % ]
69.6¢/ $1
WAGE / INCOME GAP [ $ ]
$10,240
FAMILY INCOME DEFICIT
0.46
INEQUALITY / GINI INDEX
16,341
TOTAL POPULATION
7,817
MALE POPULATION
8,524
FEMALE POPULATION
91.71
MALES / 100 FEMALES
109.04
FEMALES / 100 MALES
41.8
MEDIAN AGE
3.0
AVG FAMILY SIZE
2.4
AVG HOUSEHOLD SIZE
6,782
LABOR FORCE [ PEOPLE ]
52.4%
PERCENT IN LABOR FORCE
4.0%
UNEMPLOYMENT RATE
New Madrid County Area Codes
Income in New Madrid County
Income Overview in New Madrid County
Per Capita Income in New Madrid County is $26,357, while median incomes of families and households are $60,033 and $44,092 respectively.
| Characteristic | Number | Measure |
| Per Capita Income | 16,341 | $26,357 |
| Median Family Income | 4,271 | $60,033 |
| Mean Family Income | 4,271 | $76,589 |
| Median Household Income | 6,769 | $44,092 |
| Mean Household Income | 6,769 | $62,832 |
| Income Deficit | 4,271 | $10,240 |
| Wage / Income Gap (%) | 16,341 | 30.40% |
| Wage / Income Gap ($) | 16,341 | 69.60¢ per $1 |
| Gini / Inequality Index | 16,341 | 0.46 |
Earnings by Sex in New Madrid County
Average Earnings in New Madrid County are $33,956, $40,069 for men and $27,888 for women, a difference of 30.4%.
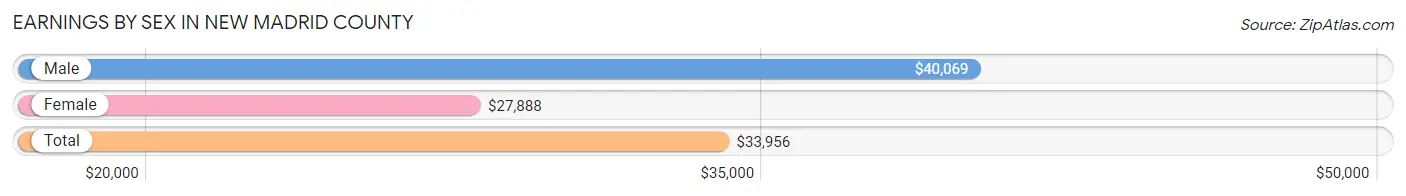
| Sex | Number | Average Earnings |
| Male | 3,759 (51.2%) | $40,069 |
| Female | 3,576 (48.7%) | $27,888 |
| Total | 7,335 (100.0%) | $33,956 |
Earnings by Sex by Income Bracket in New Madrid County
The most common earnings brackets in New Madrid County are $55,000 to $64,999 for men (439 | 11.7%) and $30,000 to $34,999 for women (364 | 10.2%).
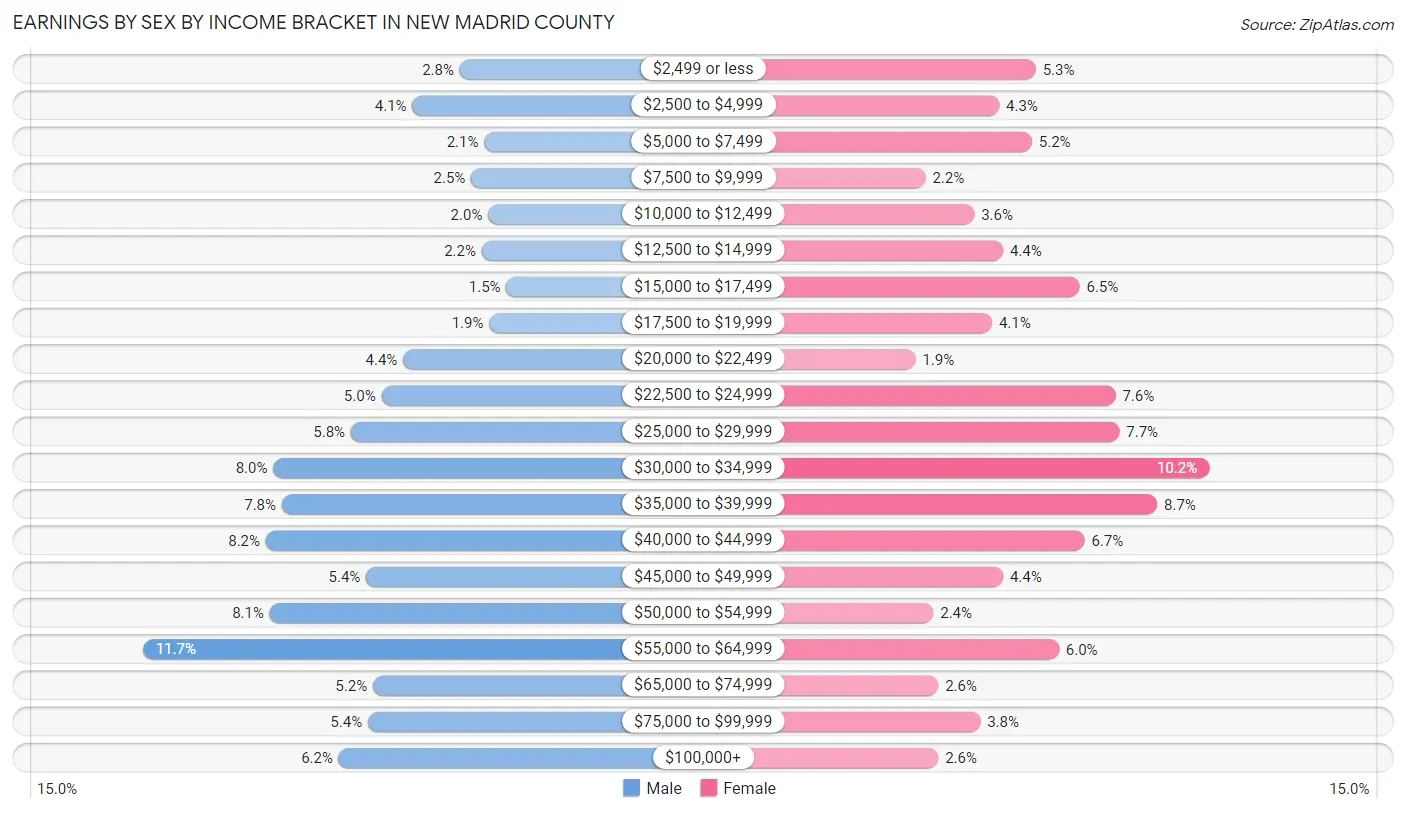
| Income | Male | Female |
| $2,499 or less | 104 (2.8%) | 190 (5.3%) |
| $2,500 to $4,999 | 154 (4.1%) | 153 (4.3%) |
| $5,000 to $7,499 | 78 (2.1%) | 186 (5.2%) |
| $7,500 to $9,999 | 92 (2.5%) | 79 (2.2%) |
| $10,000 to $12,499 | 74 (2.0%) | 128 (3.6%) |
| $12,500 to $14,999 | 81 (2.1%) | 157 (4.4%) |
| $15,000 to $17,499 | 55 (1.5%) | 234 (6.5%) |
| $17,500 to $19,999 | 73 (1.9%) | 146 (4.1%) |
| $20,000 to $22,499 | 164 (4.4%) | 69 (1.9%) |
| $22,500 to $24,999 | 187 (5.0%) | 270 (7.5%) |
| $25,000 to $29,999 | 219 (5.8%) | 274 (7.7%) |
| $30,000 to $34,999 | 301 (8.0%) | 364 (10.2%) |
| $35,000 to $39,999 | 292 (7.8%) | 312 (8.7%) |
| $40,000 to $44,999 | 309 (8.2%) | 239 (6.7%) |
| $45,000 to $49,999 | 203 (5.4%) | 157 (4.4%) |
| $50,000 to $54,999 | 305 (8.1%) | 87 (2.4%) |
| $55,000 to $64,999 | 439 (11.7%) | 213 (6.0%) |
| $65,000 to $74,999 | 196 (5.2%) | 92 (2.6%) |
| $75,000 to $99,999 | 201 (5.3%) | 134 (3.7%) |
| $100,000+ | 232 (6.2%) | 92 (2.6%) |
| Total | 3,759 (100.0%) | 3,576 (100.0%) |
Earnings by Sex by Educational Attainment in New Madrid County
Average earnings in New Madrid County are $42,908 for men and $31,470 for women, a difference of 26.7%. Men with an educational attainment of graduate degree enjoy the highest average annual earnings of $52,841, while those with less than high school education earn the least with $36,442. Women with an educational attainment of graduate degree earn the most with the average annual earnings of $52,043, while those with less than high school education have the smallest earnings of $19,044.
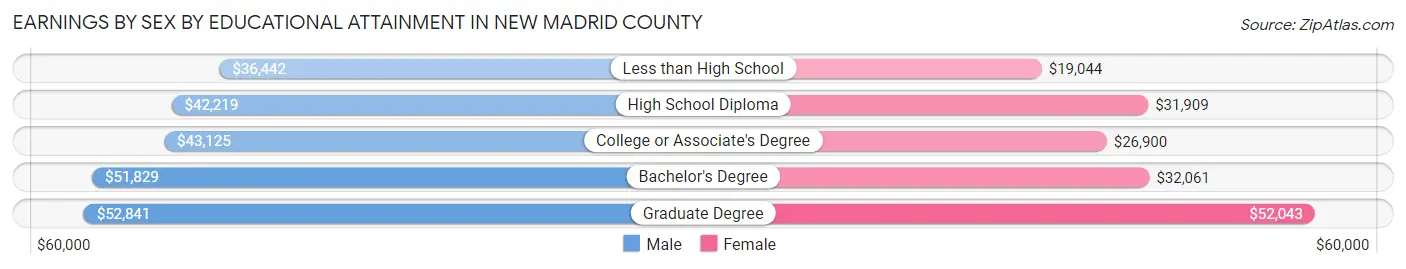
| Educational Attainment | Male Income | Female Income |
| Less than High School | $36,442 | $19,044 |
| High School Diploma | $42,219 | $31,909 |
| College or Associate's Degree | $43,125 | $26,900 |
| Bachelor's Degree | $51,829 | $32,061 |
| Graduate Degree | $52,841 | $52,043 |
| Total | $42,908 | $31,470 |
Family Income in New Madrid County
Family Income Brackets in New Madrid County
According to the New Madrid County family income data, there are 905 families falling into the $50,000 to $74,999 income range, which is the most common income bracket and makes up 21.2% of all families. Conversely, the $200,000+ income bracket is the least frequent group with only 98 families (2.3%) belonging to this category.
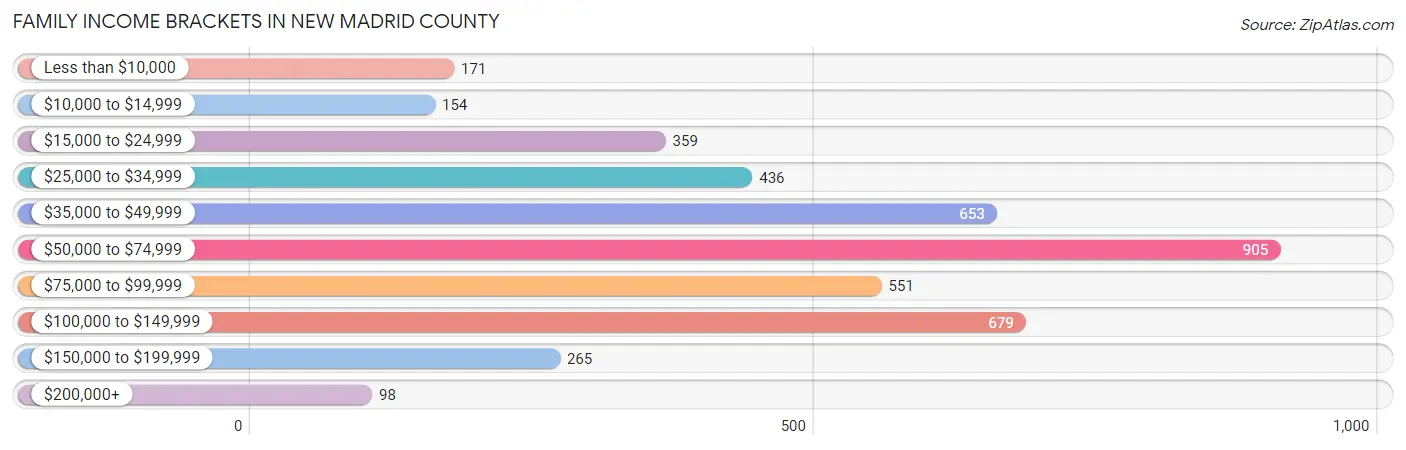
| Income Bracket | # Families | % Families |
| Less than $10,000 | 171 | 4.0% |
| $10,000 to $14,999 | 154 | 3.6% |
| $15,000 to $24,999 | 359 | 8.4% |
| $25,000 to $34,999 | 436 | 10.2% |
| $35,000 to $49,999 | 653 | 15.3% |
| $50,000 to $74,999 | 905 | 21.2% |
| $75,000 to $99,999 | 551 | 12.9% |
| $100,000 to $149,999 | 679 | 15.9% |
| $150,000 to $199,999 | 265 | 6.2% |
| $200,000+ | 98 | 2.3% |
Family Income by Famaliy Size in New Madrid County
6-person families (79 | 1.8%) account for the highest median family income in New Madrid County with $77,019 per family, while 2-person families (2,231 | 52.2%) have the highest median income of $29,936 per family member.
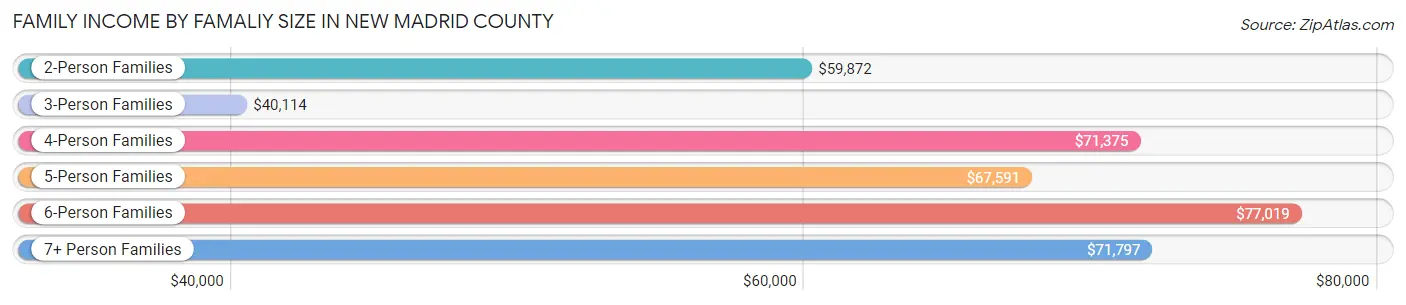
| Income Bracket | # Families | Median Income |
| 2-Person Families | 2,231 (52.2%) | $59,872 |
| 3-Person Families | 776 (18.2%) | $40,114 |
| 4-Person Families | 915 (21.4%) | $71,375 |
| 5-Person Families | 229 (5.4%) | $67,591 |
| 6-Person Families | 79 (1.8%) | $77,019 |
| 7+ Person Families | 41 (1.0%) | $71,797 |
| Total | 4,271 (100.0%) | $60,033 |
Family Income by Number of Earners in New Madrid County
The median family income in New Madrid County is $60,033, with families comprising 3+ earners (395) having the highest median family income of $122,202, while families with no earners (790) have the lowest median family income of $37,356, accounting for 9.2% and 18.5% of families, respectively.
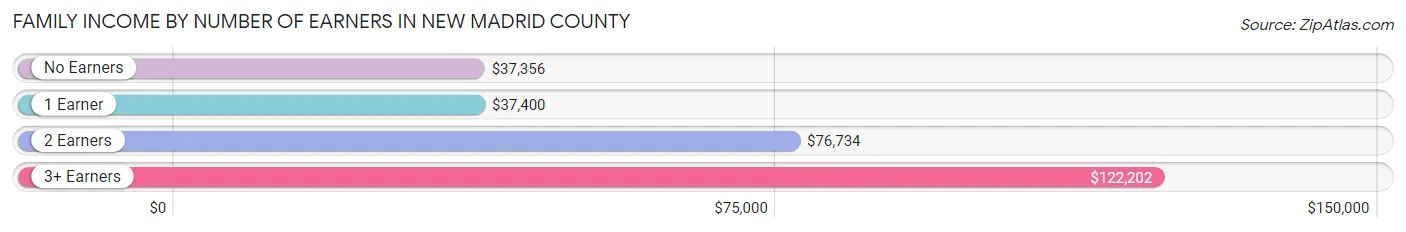
| Number of Earners | # Families | Median Income |
| No Earners | 790 (18.5%) | $37,356 |
| 1 Earner | 1,583 (37.1%) | $37,400 |
| 2 Earners | 1,503 (35.2%) | $76,734 |
| 3+ Earners | 395 (9.2%) | $122,202 |
| Total | 4,271 (100.0%) | $60,033 |
Household Income in New Madrid County
Household Income Brackets in New Madrid County
With 1,164 households falling in the category, the $50,000 to $74,999 income range is the most frequent in New Madrid County, accounting for 17.2% of all households. In contrast, only 135 households (2.0%) fall into the $200,000+ income bracket, making it the least populous group.
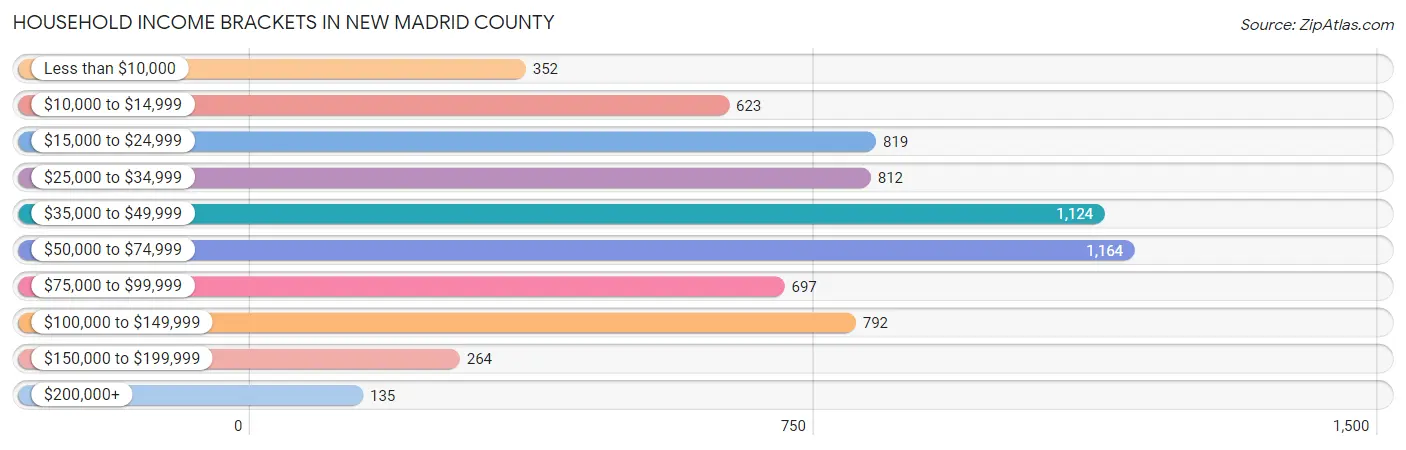
| Income Bracket | # Households | % Households |
| Less than $10,000 | 352 | 5.2% |
| $10,000 to $14,999 | 623 | 9.2% |
| $15,000 to $24,999 | 819 | 12.1% |
| $25,000 to $34,999 | 812 | 12.0% |
| $35,000 to $49,999 | 1,124 | 16.6% |
| $50,000 to $74,999 | 1,164 | 17.2% |
| $75,000 to $99,999 | 697 | 10.3% |
| $100,000 to $149,999 | 792 | 11.7% |
| $150,000 to $199,999 | 264 | 3.9% |
| $200,000+ | 135 | 2.0% |
Household Income by Householder Age in New Madrid County
The median household income in New Madrid County is $44,092, with the highest median household income of $51,553 found in the 25 to 44 years age bracket for the primary householder. A total of 1,798 households (26.6%) fall into this category. Meanwhile, the 15 to 24 years age bracket for the primary householder has the lowest median household income of $30,889, with 236 households (3.5%) in this group.
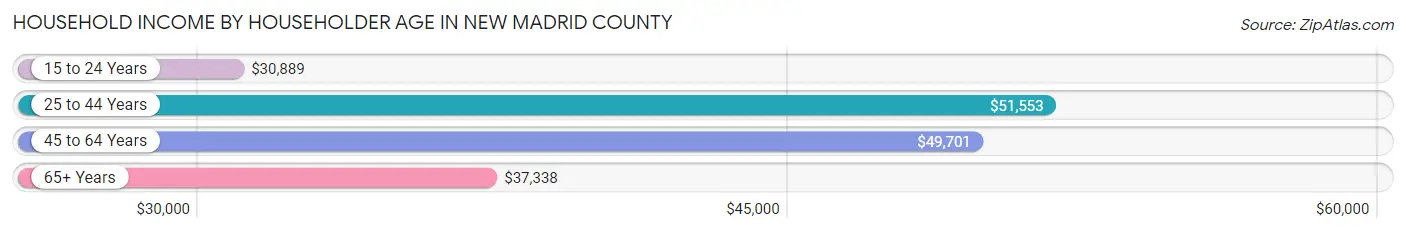
| Income Bracket | # Households | Median Income |
| 15 to 24 Years | 236 (3.5%) | $30,889 |
| 25 to 44 Years | 1,798 (26.6%) | $51,553 |
| 45 to 64 Years | 2,641 (39.0%) | $49,701 |
| 65+ Years | 2,094 (30.9%) | $37,338 |
| Total | 6,769 (100.0%) | $44,092 |
Poverty in New Madrid County
Income Below Poverty by Sex and Age in New Madrid County
With 15.5% poverty level for males and 18.9% for females among the residents of New Madrid County, 15 year old males and 5 year old females are the most vulnerable to poverty, with 74 males (53.6%) and 36 females (26.3%) in their respective age groups living below the poverty level.
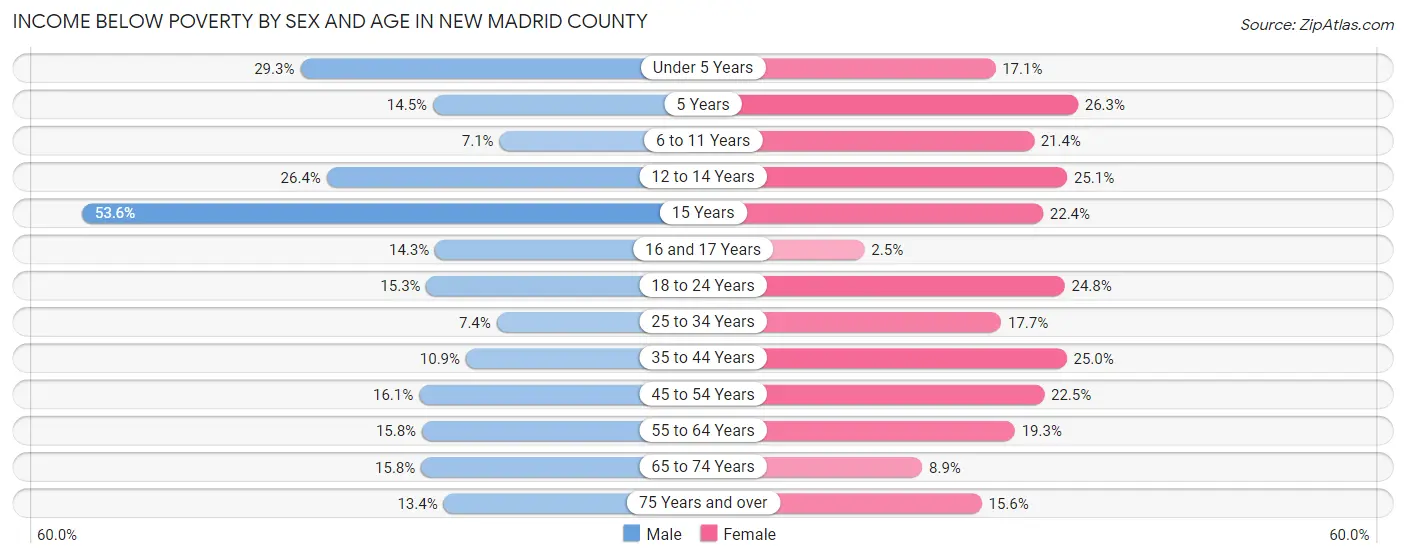
| Age Bracket | Male | Female |
| Under 5 Years | 150 (29.3%) | 88 (17.1%) |
| 5 Years | 17 (14.5%) | 36 (26.3%) |
| 6 to 11 Years | 42 (7.1%) | 122 (21.4%) |
| 12 to 14 Years | 92 (26.4%) | 72 (25.1%) |
| 15 Years | 74 (53.6%) | 15 (22.4%) |
| 16 and 17 Years | 24 (14.3%) | 7 (2.5%) |
| 18 to 24 Years | 99 (15.2%) | 161 (24.8%) |
| 25 to 34 Years | 61 (7.4%) | 165 (17.7%) |
| 35 to 44 Years | 97 (10.9%) | 234 (25.0%) |
| 45 to 54 Years | 158 (16.1%) | 241 (22.5%) |
| 55 to 64 Years | 169 (15.8%) | 230 (19.3%) |
| 65 to 74 Years | 131 (15.8%) | 87 (8.9%) |
| 75 Years and over | 59 (13.4%) | 113 (15.6%) |
| Total | 1,173 (15.5%) | 1,571 (18.9%) |
Income Above Poverty by Sex and Age in New Madrid County
According to the poverty statistics in New Madrid County, males aged 6 to 11 years and females aged 16 and 17 years are the age groups that are most secure financially, with 92.9% of males and 97.5% of females in these age groups living above the poverty line.
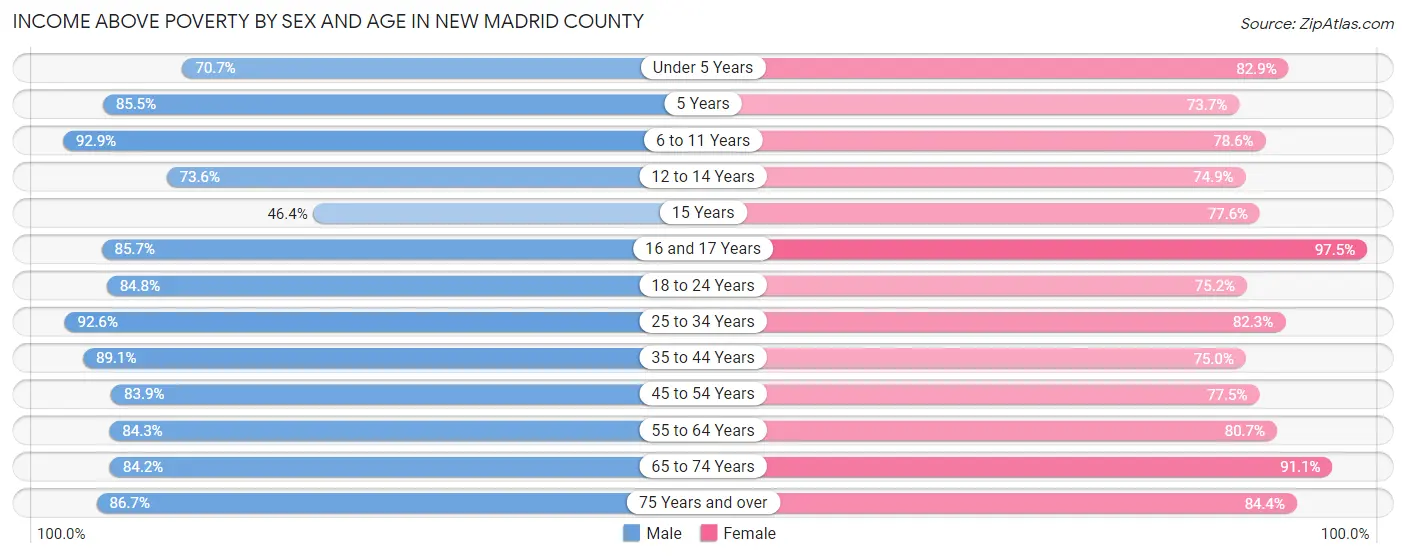
| Age Bracket | Male | Female |
| Under 5 Years | 362 (70.7%) | 427 (82.9%) |
| 5 Years | 100 (85.5%) | 101 (73.7%) |
| 6 to 11 Years | 548 (92.9%) | 449 (78.6%) |
| 12 to 14 Years | 257 (73.6%) | 215 (74.9%) |
| 15 Years | 64 (46.4%) | 52 (77.6%) |
| 16 and 17 Years | 144 (85.7%) | 271 (97.5%) |
| 18 to 24 Years | 550 (84.8%) | 488 (75.2%) |
| 25 to 34 Years | 760 (92.6%) | 765 (82.3%) |
| 35 to 44 Years | 796 (89.1%) | 701 (75.0%) |
| 45 to 54 Years | 825 (83.9%) | 829 (77.5%) |
| 55 to 64 Years | 904 (84.3%) | 964 (80.7%) |
| 65 to 74 Years | 696 (84.2%) | 886 (91.1%) |
| 75 Years and over | 383 (86.7%) | 613 (84.4%) |
| Total | 6,389 (84.5%) | 6,761 (81.1%) |
Income Below Poverty Among Married-Couple Families in New Madrid County
The poverty statistics for married-couple families in New Madrid County show that 5.6% or 147 of the total 2,636 families live below the poverty line. Families with 3 or 4 children have the highest poverty rate of 10.3%, comprising of 15 families. On the other hand, families with 5 or more children have the lowest poverty rate of 0.0%, which includes 0 families.
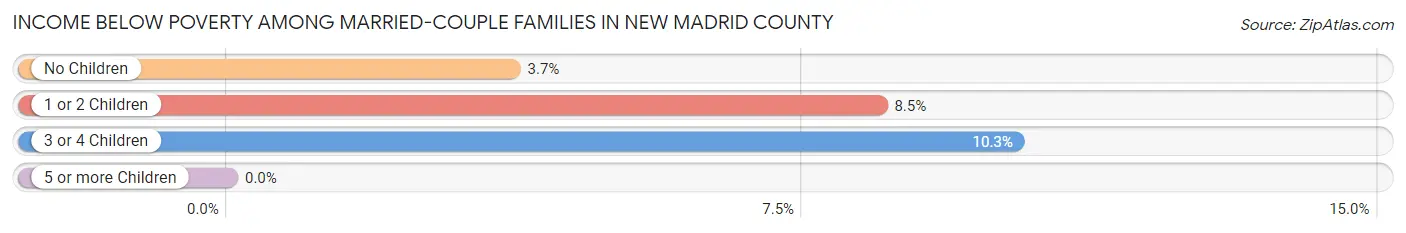
| Children | Above Poverty | Below Poverty |
| No Children | 1,539 (96.3%) | 59 (3.7%) |
| 1 or 2 Children | 788 (91.5%) | 73 (8.5%) |
| 3 or 4 Children | 131 (89.7%) | 15 (10.3%) |
| 5 or more Children | 31 (100.0%) | 0 (0.0%) |
| Total | 2,489 (94.4%) | 147 (5.6%) |
Income Below Poverty Among Single-Parent Households in New Madrid County
According to the poverty data in New Madrid County, 12.1% or 55 single-father households and 31.5% or 372 single-mother households are living below the poverty line. Among single-father households, those with 3 or 4 children have the highest poverty rate, with 9 households (27.3%) experiencing poverty. Likewise, among single-mother households, those with 1 or 2 children have the highest poverty rate, with 232 households (44.9%) falling below the poverty line.
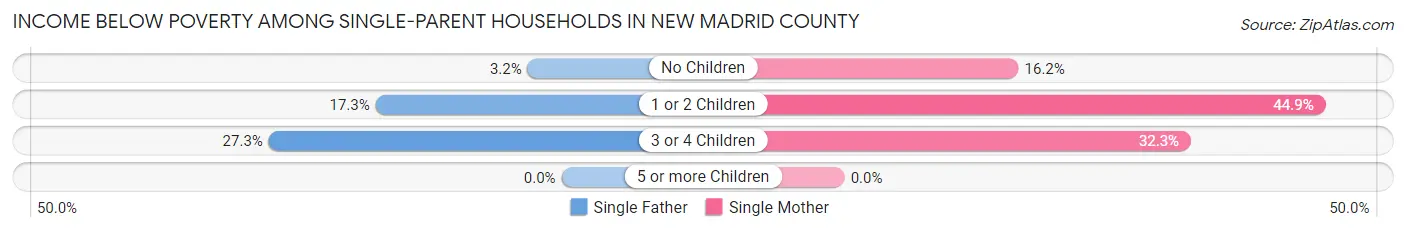
| Children | Single Father | Single Mother |
| No Children | 6 (3.2%) | 75 (16.2%) |
| 1 or 2 Children | 40 (17.3%) | 232 (44.9%) |
| 3 or 4 Children | 9 (27.3%) | 65 (32.3%) |
| 5 or more Children | 0 (0.0%) | 0 (0.0%) |
| Total | 55 (12.1%) | 372 (31.5%) |
Income Below Poverty Among Married-Couple vs Single-Parent Households in New Madrid County
The poverty data for New Madrid County shows that 147 of the married-couple family households (5.6%) and 427 of the single-parent households (26.1%) are living below the poverty level. Within the married-couple family households, those with 3 or 4 children have the highest poverty rate, with 15 households (10.3%) falling below the poverty line. Among the single-parent households, those with 1 or 2 children have the highest poverty rate, with 272 household (36.4%) living below poverty.
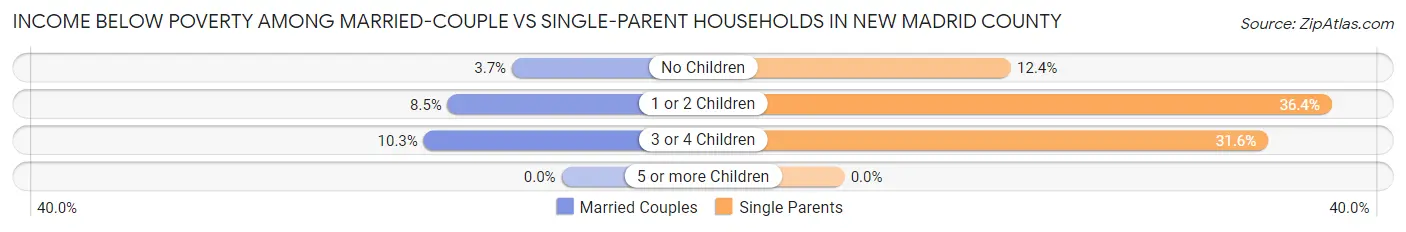
| Children | Married-Couple Families | Single-Parent Households |
| No Children | 59 (3.7%) | 81 (12.4%) |
| 1 or 2 Children | 73 (8.5%) | 272 (36.4%) |
| 3 or 4 Children | 15 (10.3%) | 74 (31.6%) |
| 5 or more Children | 0 (0.0%) | 0 (0.0%) |
| Total | 147 (5.6%) | 427 (26.1%) |
Race in New Madrid County
The most populous races in New Madrid County are White / Caucasian (12,636 | 77.3%), Black / African American (1,987 | 12.2%), and Two or more Races (1,676 | 10.3%).
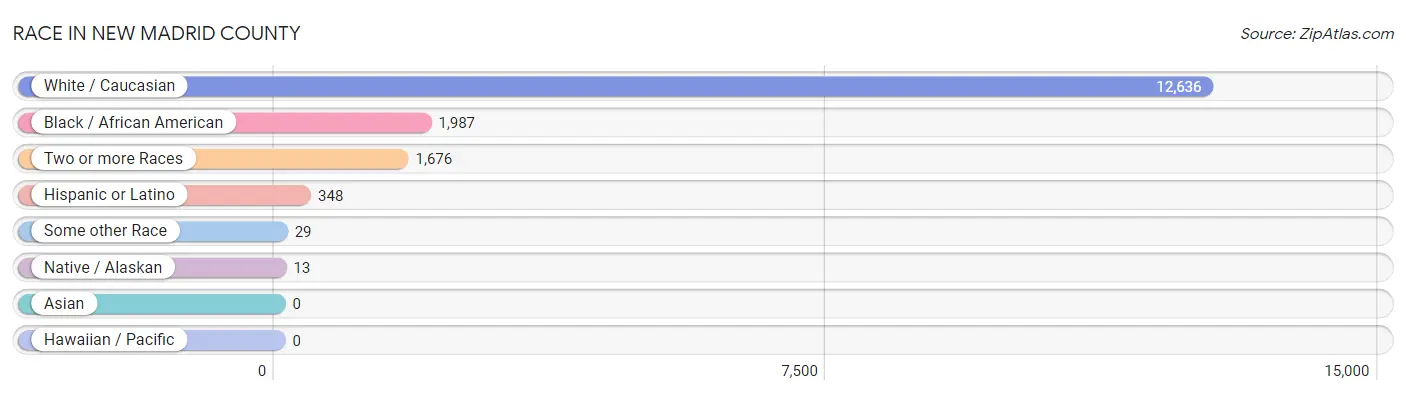
| Race | # Population | % Population |
| Asian | 0 | 0.0% |
| Black / African American | 1,987 | 12.2% |
| Hawaiian / Pacific | 0 | 0.0% |
| Hispanic or Latino | 348 | 2.1% |
| Native / Alaskan | 13 | 0.1% |
| White / Caucasian | 12,636 | 77.3% |
| Two or more Races | 1,676 | 10.3% |
| Some other Race | 29 | 0.2% |
| Total | 16,341 | 100.0% |
Ancestry in New Madrid County
The most populous ancestries reported in New Madrid County are Irish (2,876 | 17.6%), German (2,620 | 16.0%), English (1,538 | 9.4%), American (1,124 | 6.9%), and French (708 | 4.3%), together accounting for 54.2% of all New Madrid County residents.
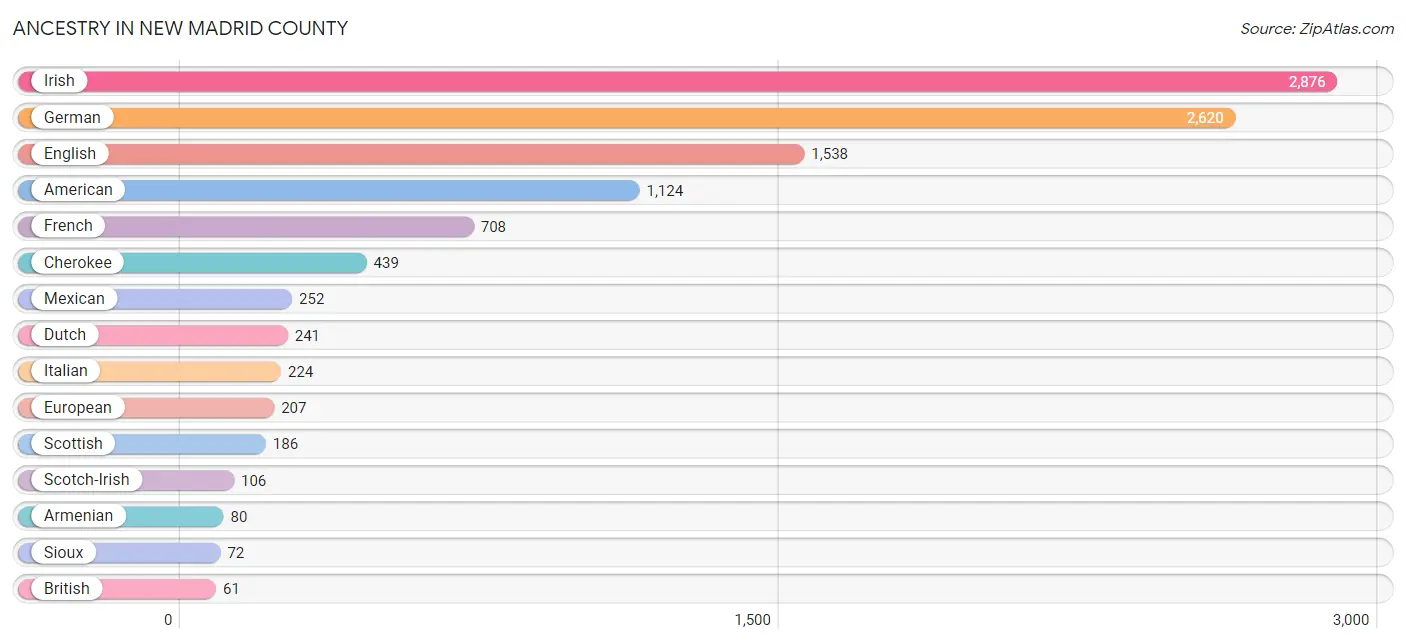
| Ancestry | # Population | % Population |
| African | 21 | 0.1% |
| American | 1,124 | 6.9% |
| Apache | 3 | 0.0% |
| Armenian | 80 | 0.5% |
| Austrian | 13 | 0.1% |
| Belgian | 6 | 0.0% |
| Bhutanese | 14 | 0.1% |
| Blackfeet | 45 | 0.3% |
| British | 61 | 0.4% |
| Canadian | 2 | 0.0% |
| Central American | 58 | 0.4% |
| Cherokee | 439 | 2.7% |
| Choctaw | 31 | 0.2% |
| Comanche | 3 | 0.0% |
| Czechoslovakian | 8 | 0.1% |
| Danish | 9 | 0.1% |
| Dutch | 241 | 1.5% |
| English | 1,538 | 9.4% |
| European | 207 | 1.3% |
| Finnish | 12 | 0.1% |
| French | 708 | 4.3% |
| French Canadian | 8 | 0.1% |
| German | 2,620 | 16.0% |
| Guatemalan | 35 | 0.2% |
| Irish | 2,876 | 17.6% |
| Italian | 224 | 1.4% |
| Kiowa | 12 | 0.1% |
| Korean | 17 | 0.1% |
| Mexican | 252 | 1.5% |
| Norwegian | 22 | 0.1% |
| Pennsylvania German | 24 | 0.2% |
| Polish | 21 | 0.1% |
| Puerto Rican | 28 | 0.2% |
| Romanian | 17 | 0.1% |
| Salvadoran | 23 | 0.1% |
| Scandinavian | 24 | 0.2% |
| Scotch-Irish | 106 | 0.6% |
| Scottish | 186 | 1.1% |
| Sioux | 72 | 0.4% |
| South American Indian | 35 | 0.2% |
| Subsaharan African | 29 | 0.2% |
| Swedish | 51 | 0.3% |
| Swiss | 4 | 0.0% |
| Welsh | 48 | 0.3% | View All 44 Rows |
Immigrants in New Madrid County
The most numerous immigrant groups reported in New Madrid County came from Europe (42 | 0.3%), Northern Europe (34 | 0.2%), Latin America (32 | 0.2%), Central America (18 | 0.1%), and Canada (15 | 0.1%), together accounting for 0.9% of all New Madrid County residents.
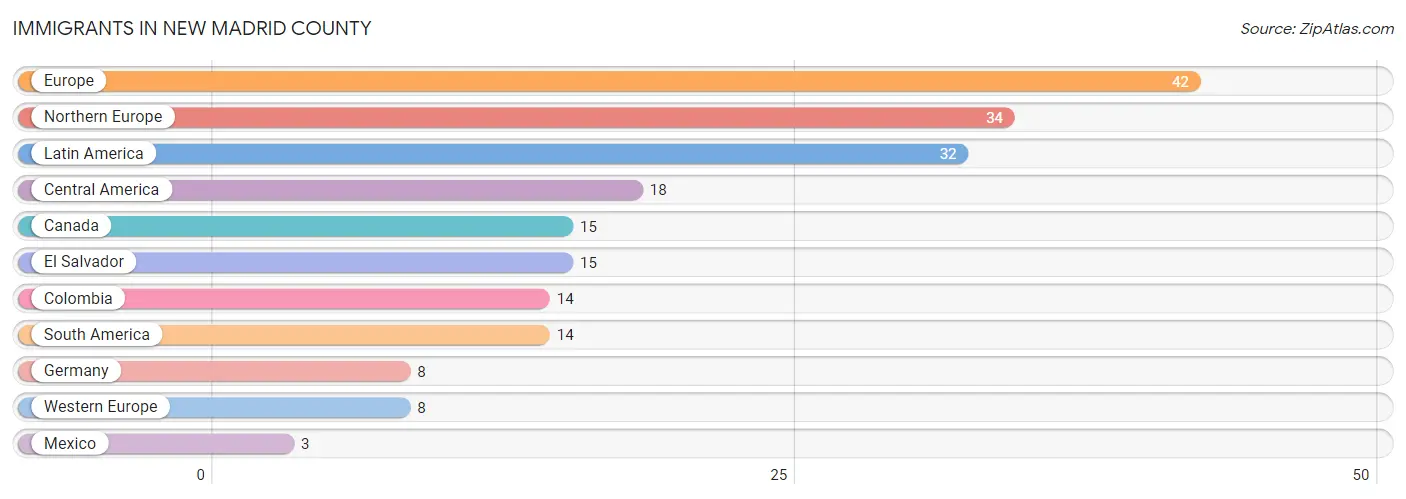
| Immigration Origin | # Population | % Population |
| Canada | 15 | 0.1% |
| Central America | 18 | 0.1% |
| Colombia | 14 | 0.1% |
| El Salvador | 15 | 0.1% |
| Europe | 42 | 0.3% |
| Germany | 8 | 0.1% |
| Latin America | 32 | 0.2% |
| Mexico | 3 | 0.0% |
| Northern Europe | 34 | 0.2% |
| South America | 14 | 0.1% |
| Western Europe | 8 | 0.1% | View All 11 Rows |
Sex and Age in New Madrid County
Sex and Age in New Madrid County
The most populous age groups in New Madrid County are 10 to 14 Years (649 | 8.3%) for men and 55 to 59 Years (679 | 8.0%) for women.
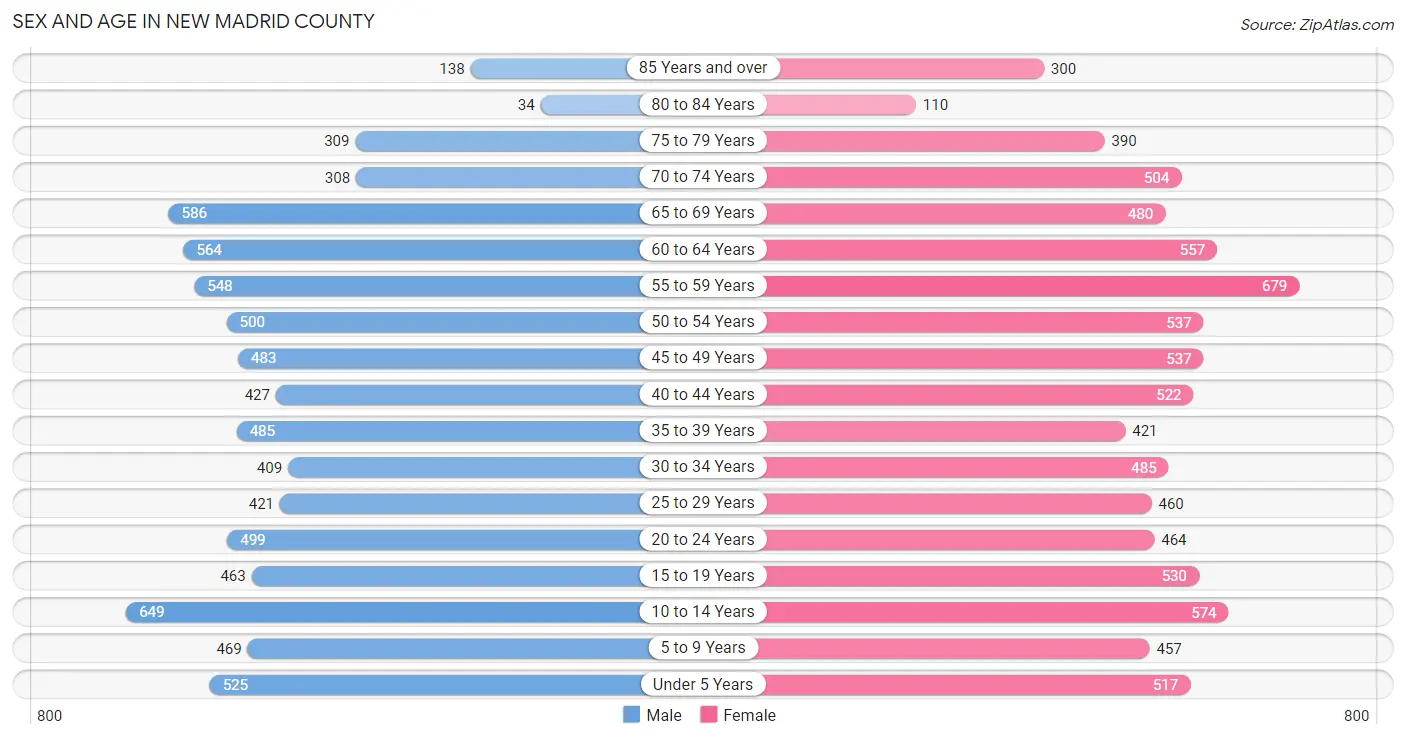
| Age Bracket | Male | Female |
| Under 5 Years | 525 (6.7%) | 517 (6.1%) |
| 5 to 9 Years | 469 (6.0%) | 457 (5.4%) |
| 10 to 14 Years | 649 (8.3%) | 574 (6.7%) |
| 15 to 19 Years | 463 (5.9%) | 530 (6.2%) |
| 20 to 24 Years | 499 (6.4%) | 464 (5.4%) |
| 25 to 29 Years | 421 (5.4%) | 460 (5.4%) |
| 30 to 34 Years | 409 (5.2%) | 485 (5.7%) |
| 35 to 39 Years | 485 (6.2%) | 421 (4.9%) |
| 40 to 44 Years | 427 (5.5%) | 522 (6.1%) |
| 45 to 49 Years | 483 (6.2%) | 537 (6.3%) |
| 50 to 54 Years | 500 (6.4%) | 537 (6.3%) |
| 55 to 59 Years | 548 (7.0%) | 679 (8.0%) |
| 60 to 64 Years | 564 (7.2%) | 557 (6.5%) |
| 65 to 69 Years | 586 (7.5%) | 480 (5.6%) |
| 70 to 74 Years | 308 (3.9%) | 504 (5.9%) |
| 75 to 79 Years | 309 (4.0%) | 390 (4.6%) |
| 80 to 84 Years | 34 (0.4%) | 110 (1.3%) |
| 85 Years and over | 138 (1.8%) | 300 (3.5%) |
| Total | 7,817 (100.0%) | 8,524 (100.0%) |
Families and Households in New Madrid County
Median Family Size in New Madrid County
The median family size in New Madrid County is 2.95 persons per family, with married-couple families (2,636 | 61.7%) accounting for the largest median family size of 3.04 persons per family. On the other hand, single female/mother families (1,181 | 27.7%) represent the smallest median family size with 2.77 persons per family.
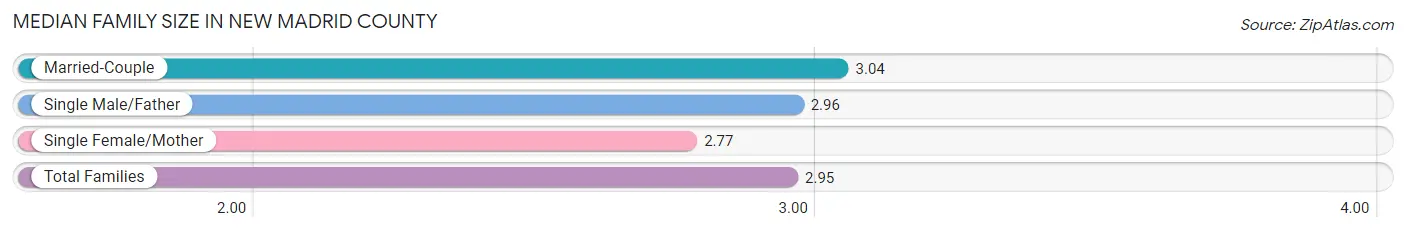
| Family Type | # Families | Family Size |
| Married-Couple | 2,636 (61.7%) | 3.04 |
| Single Male/Father | 454 (10.6%) | 2.96 |
| Single Female/Mother | 1,181 (27.7%) | 2.77 |
| Total Families | 4,271 (100.0%) | 2.95 |
Median Household Size in New Madrid County
The median household size in New Madrid County is 2.36 persons per household, with single male/father households (454 | 6.7%) accounting for the largest median household size of 3.21 persons per household. non-family households (2,498 | 36.9%) represent the smallest median household size with 1.16 persons per household.
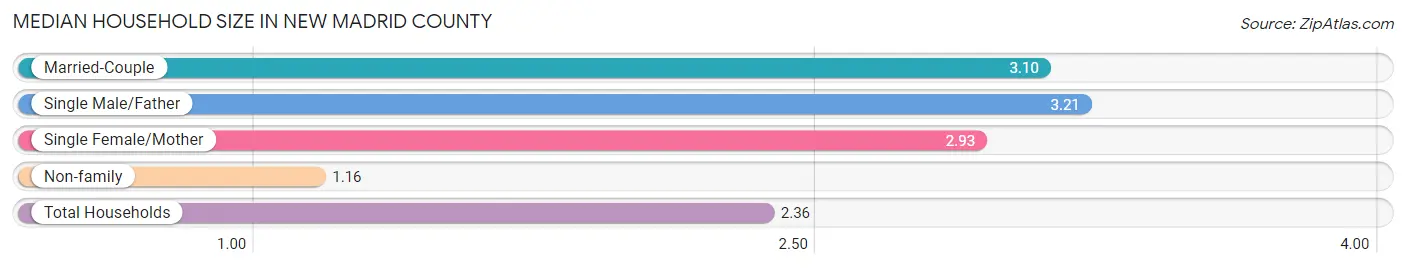
| Household Type | # Households | Household Size |
| Married-Couple | 2,636 (38.9%) | 3.10 |
| Single Male/Father | 454 (6.7%) | 3.21 |
| Single Female/Mother | 1,181 (17.4%) | 2.93 |
| Non-family | 2,498 (36.9%) | 1.16 |
| Total Households | 6,769 (100.0%) | 2.36 |
Household Size by Marriage Status in New Madrid County
Out of a total of 6,769 households in New Madrid County, 4,271 (63.1%) are family households, while 2,498 (36.9%) are nonfamily households. The most numerous type of family households are 2-person households, comprising 2,092, and the most common type of nonfamily households are 1-person households, comprising 2,243.
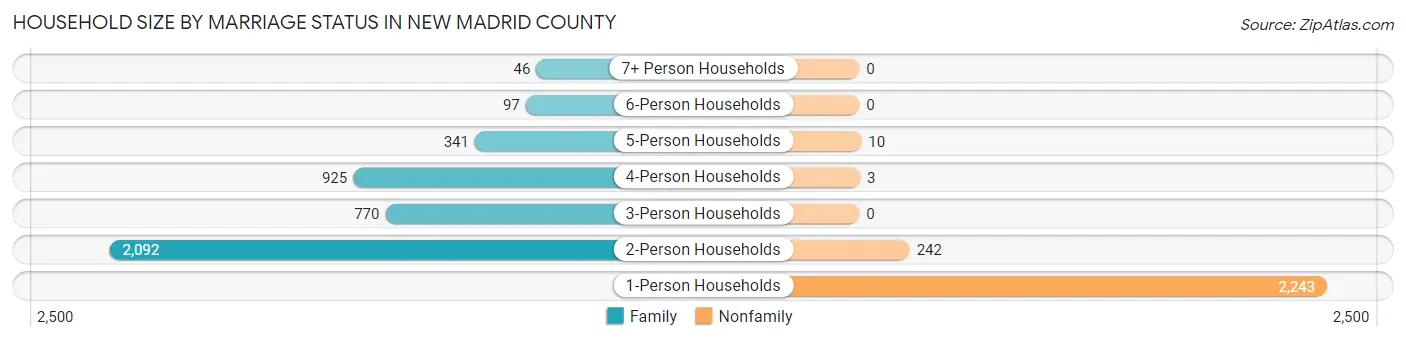
| Household Size | Family Households | Nonfamily Households |
| 1-Person Households | - | 2,243 (33.1%) |
| 2-Person Households | 2,092 (30.9%) | 242 (3.6%) |
| 3-Person Households | 770 (11.4%) | 0 (0.0%) |
| 4-Person Households | 925 (13.7%) | 3 (0.0%) |
| 5-Person Households | 341 (5.0%) | 10 (0.2%) |
| 6-Person Households | 97 (1.4%) | 0 (0.0%) |
| 7+ Person Households | 46 (0.7%) | 0 (0.0%) |
| Total | 4,271 (63.1%) | 2,498 (36.9%) |
Female Fertility in New Madrid County
Fertility by Age in New Madrid County
Average fertility rate in New Madrid County is 69.0 births per 1,000 women. Women in the age bracket of 20 to 34 years have the highest fertility rate with 163.0 births per 1,000 women. Women in the age bracket of 20 to 34 years acount for 93.9% of all women with births.
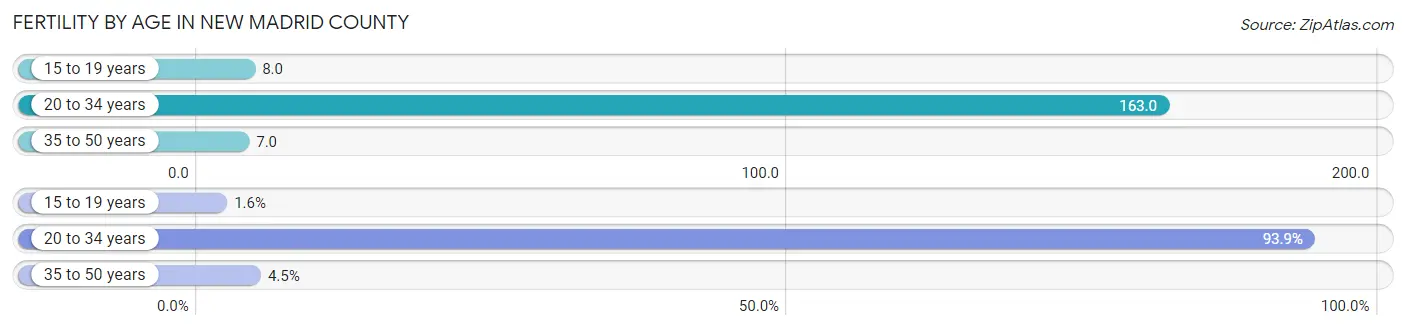
| Age Bracket | Women with Births | Births / 1,000 Women |
| 15 to 19 years | 4 (1.6%) | 8.0 |
| 20 to 34 years | 230 (93.9%) | 163.0 |
| 35 to 50 years | 11 (4.5%) | 7.0 |
| Total | 245 (100.0%) | 69.0 |
Fertility by Age by Marriage Status in New Madrid County
62.4% of women with births (245) in New Madrid County are married. The highest percentage of unmarried women with births falls into 15 to 19 years age bracket with 100.0% of them unmarried at the time of birth, while the lowest percentage of unmarried women with births belong to 35 to 50 years age bracket with 27.3% of them unmarried.
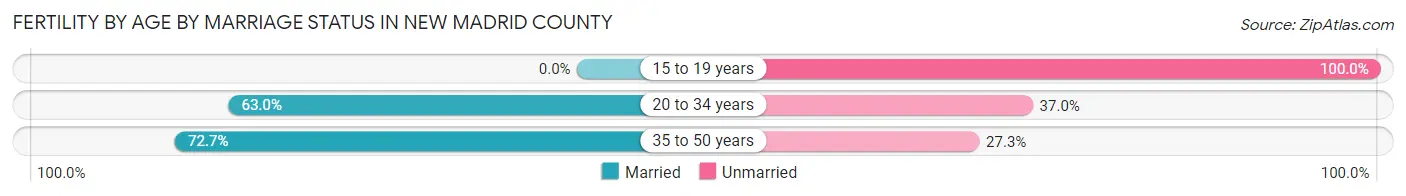
| Age Bracket | Married | Unmarried |
| 15 to 19 years | 0 (0.0%) | 4 (100.0%) |
| 20 to 34 years | 145 (63.0%) | 85 (37.0%) |
| 35 to 50 years | 8 (72.7%) | 3 (27.3%) |
| Total | 153 (62.5%) | 92 (37.6%) |
Fertility by Education in New Madrid County
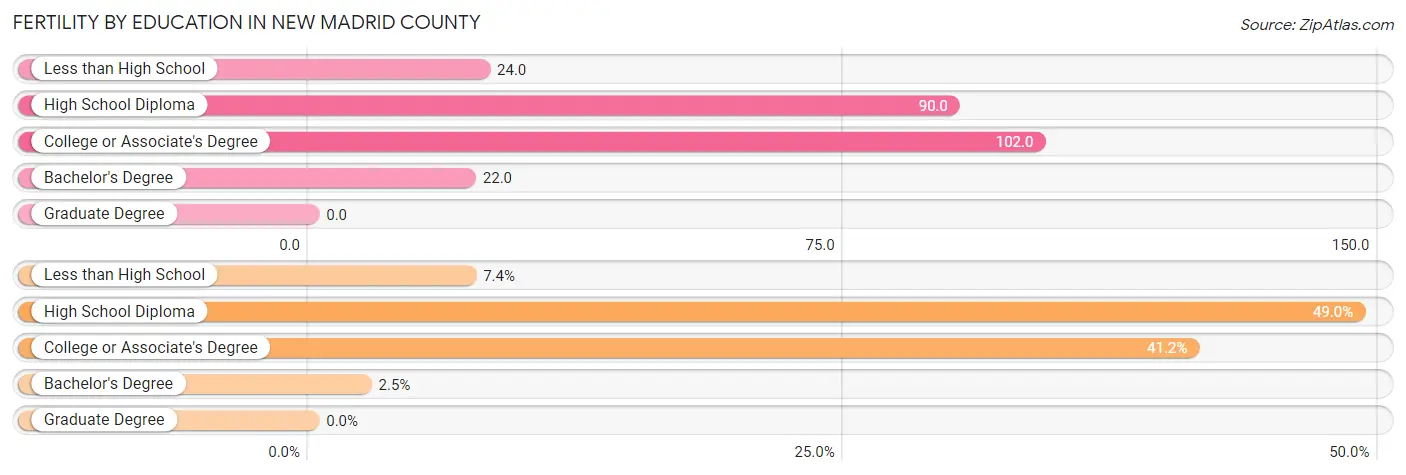
| Educational Attainment | Women with Births | Births / 1,000 Women |
| Less than High School | 18 (7.3%) | 24.0 |
| High School Diploma | 120 (49.0%) | 90.0 |
| College or Associate's Degree | 101 (41.2%) | 102.0 |
| Bachelor's Degree | 6 (2.5%) | 22.0 |
| Graduate Degree | 0 (0.0%) | 0.0 |
| Total | 245 (100.0%) | 69.0 |
Fertility by Education by Marriage Status in New Madrid County
37.6% of women with births in New Madrid County are unmarried. Women with the educational attainment of college or associate's degree are most likely to be married with 86.1% of them married at childbirth, while women with the educational attainment of bachelor's degree are least likely to be married with 100.0% of them unmarried at childbirth.
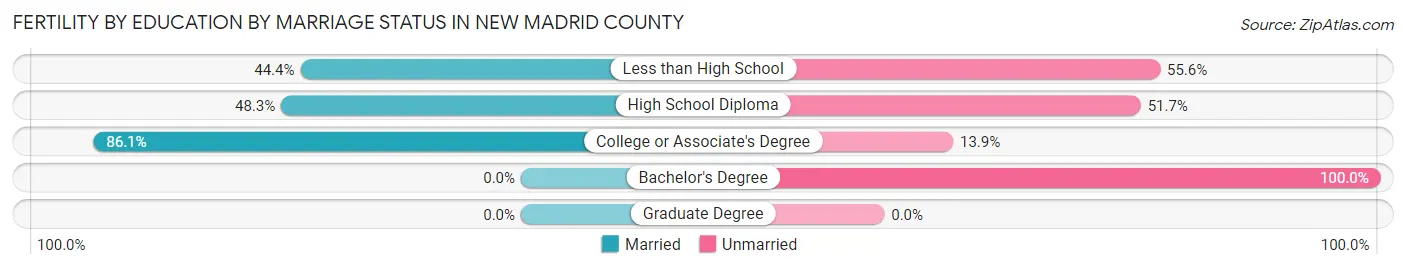
| Educational Attainment | Married | Unmarried |
| Less than High School | 8 (44.4%) | 10 (55.6%) |
| High School Diploma | 58 (48.3%) | 62 (51.7%) |
| College or Associate's Degree | 87 (86.1%) | 14 (13.9%) |
| Bachelor's Degree | 0 (0.0%) | 6 (100.0%) |
| Graduate Degree | 0 (0.0%) | 0 (0.0%) |
| Total | 153 (62.5%) | 92 (37.6%) |
Employment Characteristics in New Madrid County
Employment by Class of Employer in New Madrid County
Among the 6,385 employed individuals in New Madrid County, private company employees (4,338 | 67.9%), self-employed (not incorporated) (559 | 8.7%), and local government employees (501 | 7.9%) make up the most common classes of employment.
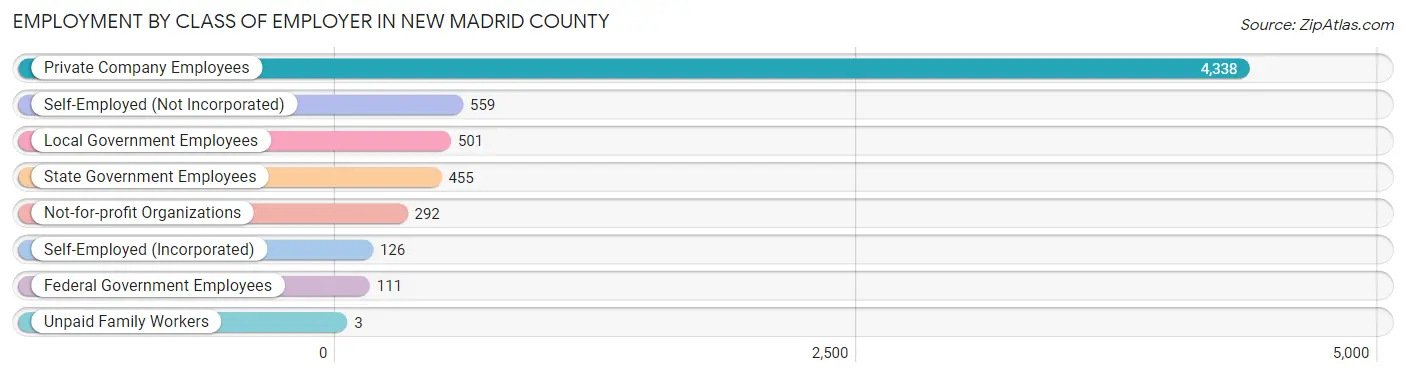
| Employer Class | # Employees | % Employees |
| Private Company Employees | 4,338 | 67.9% |
| Self-Employed (Incorporated) | 126 | 2.0% |
| Self-Employed (Not Incorporated) | 559 | 8.7% |
| Not-for-profit Organizations | 292 | 4.6% |
| Local Government Employees | 501 | 7.9% |
| State Government Employees | 455 | 7.1% |
| Federal Government Employees | 111 | 1.7% |
| Unpaid Family Workers | 3 | 0.1% |
| Total | 6,385 | 100.0% |
Employment Status by Age in New Madrid County
According to the labor force statistics for New Madrid County, out of the total population over 16 years of age (12,942), 52.4% or 6,782 individuals are in the labor force, with 4.0% or 271 of them unemployed. The age group with the highest labor force participation rate is 30 to 34 years, with 81.1% or 725 individuals in the labor force. Within the labor force, the 16 to 19 years age range has the highest percentage of unemployed individuals, with 9.2% or 31 of them being unemployed.
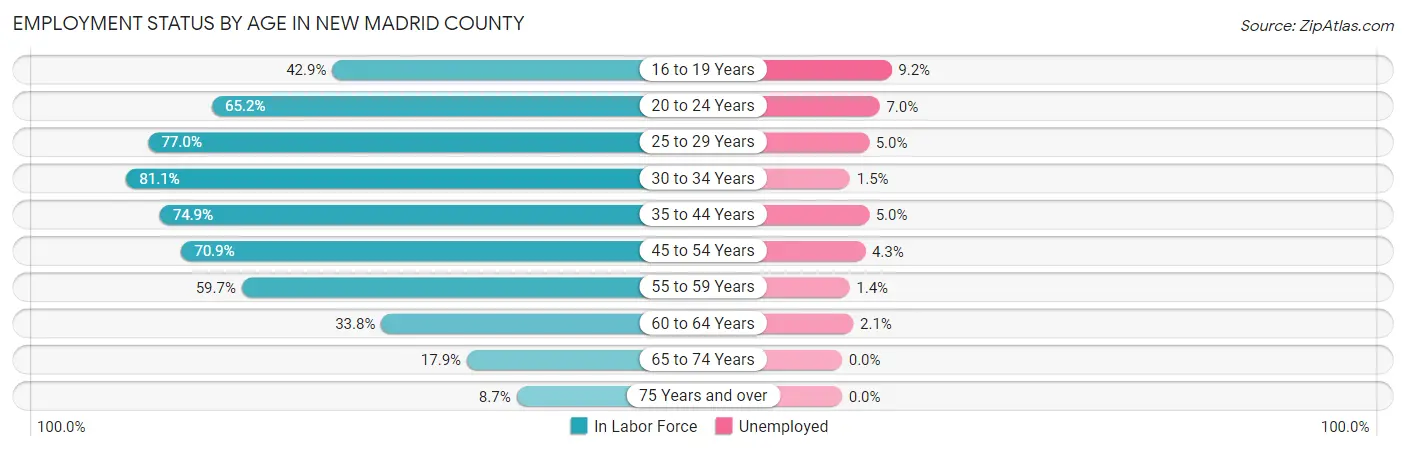
| Age Bracket | In Labor Force | Unemployed |
| 16 to 19 Years | 337 (42.9%) | 31 (9.2%) |
| 20 to 24 Years | 628 (65.2%) | 44 (7.0%) |
| 25 to 29 Years | 678 (77.0%) | 34 (5.0%) |
| 30 to 34 Years | 725 (81.1%) | 11 (1.5%) |
| 35 to 44 Years | 1,389 (74.9%) | 69 (5.0%) |
| 45 to 54 Years | 1,458 (70.9%) | 63 (4.3%) |
| 55 to 59 Years | 733 (59.7%) | 10 (1.4%) |
| 60 to 64 Years | 379 (33.8%) | 8 (2.1%) |
| 65 to 74 Years | 336 (17.9%) | 0 (0.0%) |
| 75 Years and over | 111 (8.7%) | 0 (0.0%) |
| Total | 6,782 (52.4%) | 271 (4.0%) |
Employment Status by Educational Attainment in New Madrid County
According to labor force statistics for New Madrid County, 66.7% of individuals (5,359) out of the total population between 25 and 64 years of age (8,035) are in the labor force, with 3.6% or 193 of them being unemployed. The group with the highest labor force participation rate are those with the educational attainment of bachelor's degree or higher, with 80.1% or 818 individuals in the labor force. Within the labor force, individuals with less than high school education have the highest percentage of unemployment, with 6.9% or 36 of them being unemployed.
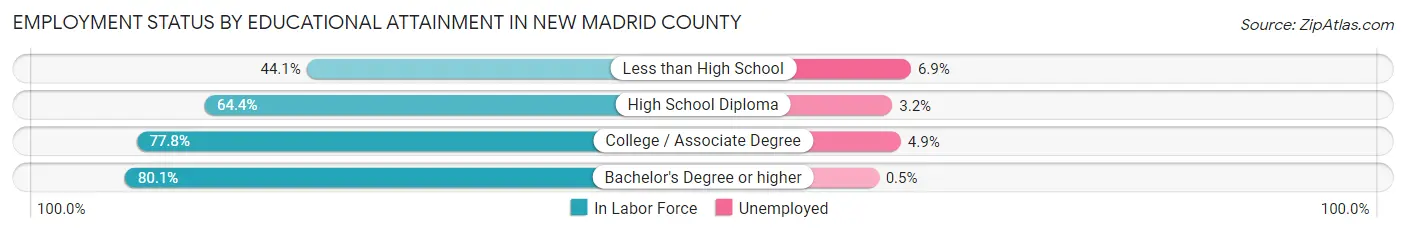
| Educational Attainment | In Labor Force | Unemployed |
| Less than High School | 519 (44.1%) | 81 (6.9%) |
| High School Diploma | 2,490 (64.4%) | 124 (3.2%) |
| College / Associate Degree | 1,533 (77.8%) | 97 (4.9%) |
| Bachelor's Degree or higher | 818 (80.1%) | 5 (0.5%) |
| Total | 5,359 (66.7%) | 289 (3.6%) |
Employment Occupations by Sex in New Madrid County
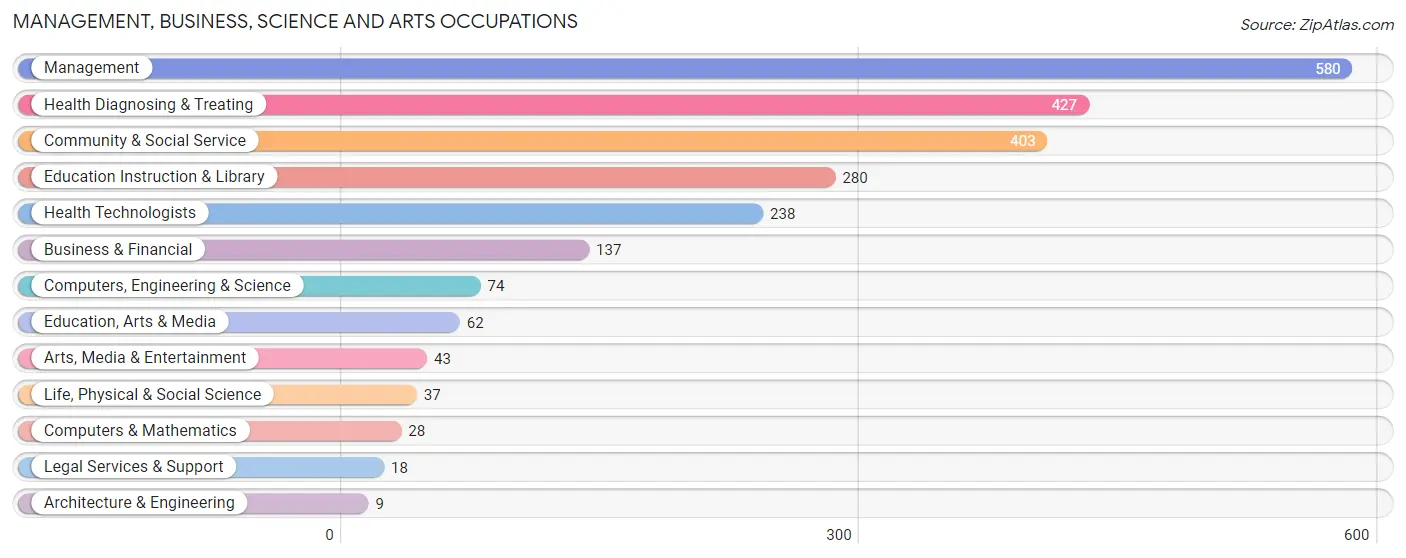
Management, Business, Science and Arts Occupations
The most common Management, Business, Science and Arts occupations in New Madrid County are Management (580 | 8.9%), Health Diagnosing & Treating (427 | 6.6%), Community & Social Service (403 | 6.2%), Education Instruction & Library (280 | 4.3%), and Health Technologists (238 | 3.7%).
Management, Business, Science and Arts Occupations by Sex
Within the Management, Business, Science and Arts occupations in New Madrid County, the most male-oriented occupations are Architecture & Engineering (100.0%), Legal Services & Support (77.8%), and Computers & Mathematics (71.4%), while the most female-oriented occupations are Health Technologists (92.0%), Health Diagnosing & Treating (89.2%), and Arts, Media & Entertainment (88.4%).
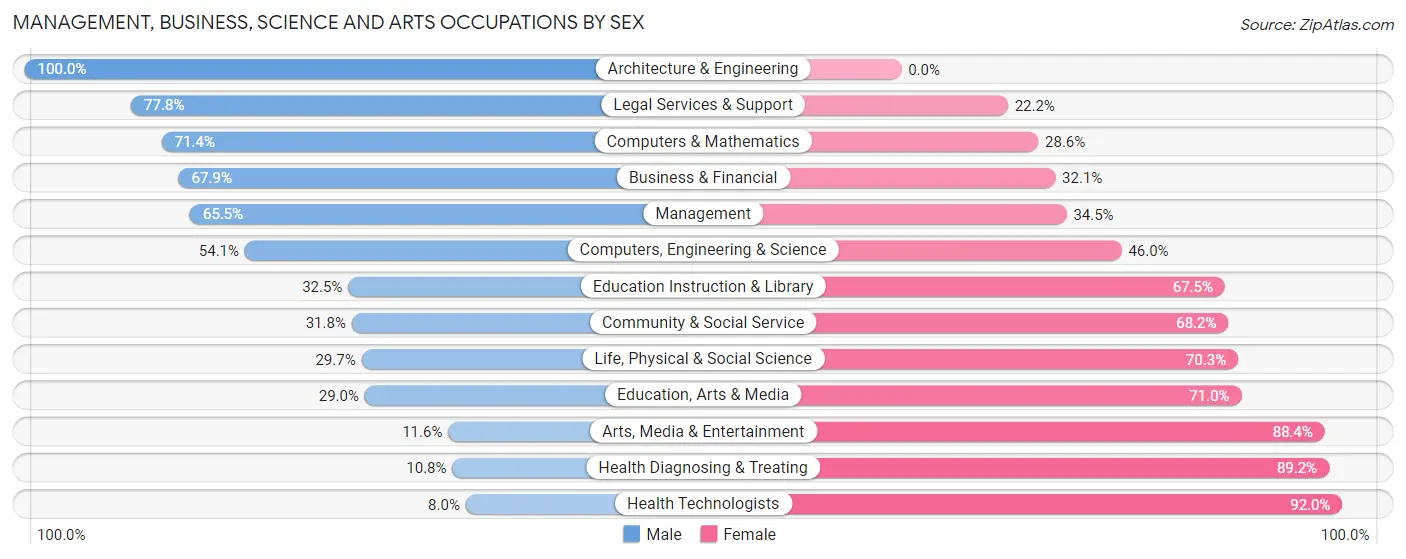
| Occupation | Male | Female |
| Management | 380 (65.5%) | 200 (34.5%) |
| Business & Financial | 93 (67.9%) | 44 (32.1%) |
| Computers, Engineering & Science | 40 (54.0%) | 34 (46.0%) |
| Computers & Mathematics | 20 (71.4%) | 8 (28.6%) |
| Architecture & Engineering | 9 (100.0%) | 0 (0.0%) |
| Life, Physical & Social Science | 11 (29.7%) | 26 (70.3%) |
| Community & Social Service | 128 (31.8%) | 275 (68.2%) |
| Education, Arts & Media | 18 (29.0%) | 44 (71.0%) |
| Legal Services & Support | 14 (77.8%) | 4 (22.2%) |
| Education Instruction & Library | 91 (32.5%) | 189 (67.5%) |
| Arts, Media & Entertainment | 5 (11.6%) | 38 (88.4%) |
| Health Diagnosing & Treating | 46 (10.8%) | 381 (89.2%) |
| Health Technologists | 19 (8.0%) | 219 (92.0%) |
| Total (Category) | 687 (42.4%) | 934 (57.6%) |
| Total (Overall) | 3,292 (50.7%) | 3,198 (49.3%) |
Services Occupations
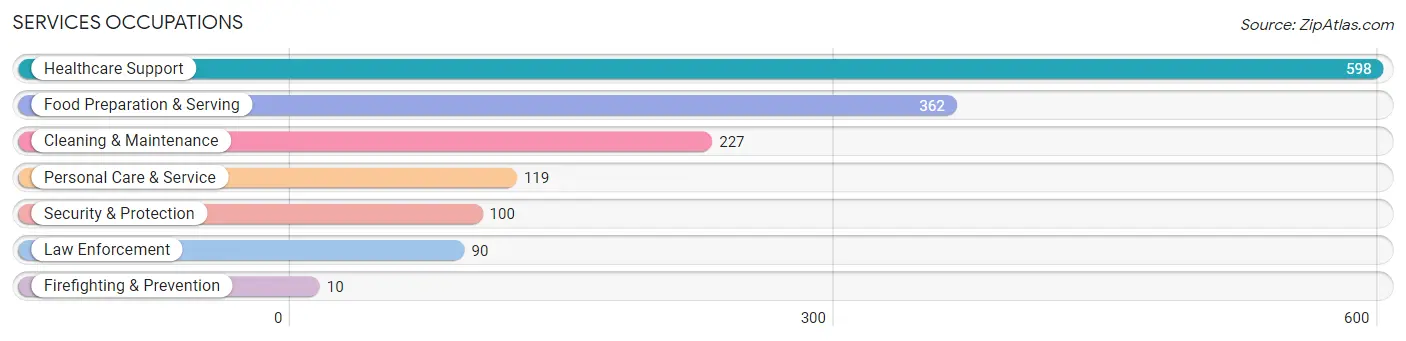
The most common Services occupations in New Madrid County are Healthcare Support (598 | 9.2%), Food Preparation & Serving (362 | 5.6%), Cleaning & Maintenance (227 | 3.5%), Personal Care & Service (119 | 1.8%), and Security & Protection (100 | 1.5%).
Services Occupations by Sex
Within the Services occupations in New Madrid County, the most male-oriented occupations are Law Enforcement (91.1%), Security & Protection (88.0%), and Firefighting & Prevention (60.0%), while the most female-oriented occupations are Food Preparation & Serving (95.3%), Personal Care & Service (84.0%), and Healthcare Support (82.1%).
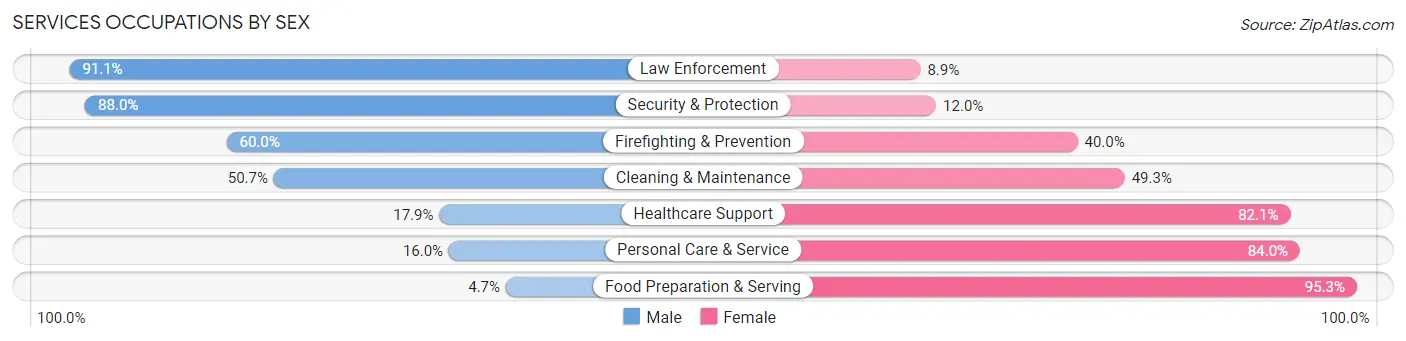
| Occupation | Male | Female |
| Healthcare Support | 107 (17.9%) | 491 (82.1%) |
| Security & Protection | 88 (88.0%) | 12 (12.0%) |
| Firefighting & Prevention | 6 (60.0%) | 4 (40.0%) |
| Law Enforcement | 82 (91.1%) | 8 (8.9%) |
| Food Preparation & Serving | 17 (4.7%) | 345 (95.3%) |
| Cleaning & Maintenance | 115 (50.7%) | 112 (49.3%) |
| Personal Care & Service | 19 (16.0%) | 100 (84.0%) |
| Total (Category) | 346 (24.6%) | 1,060 (75.4%) |
| Total (Overall) | 3,292 (50.7%) | 3,198 (49.3%) |
Sales and Office Occupations
The most common Sales and Office occupations in New Madrid County are Office & Administration (765 | 11.8%), and Sales & Related (741 | 11.4%).

Sales and Office Occupations by Sex

| Occupation | Male | Female |
| Sales & Related | 425 (57.4%) | 316 (42.6%) |
| Office & Administration | 143 (18.7%) | 622 (81.3%) |
| Total (Category) | 568 (37.7%) | 938 (62.3%) |
| Total (Overall) | 3,292 (50.7%) | 3,198 (49.3%) |
Natural Resources, Construction and Maintenance Occupations
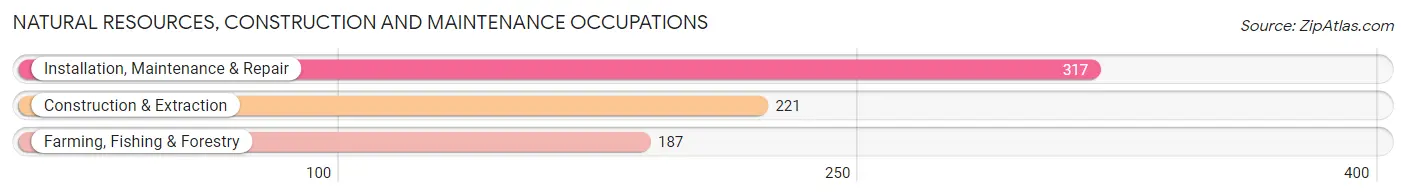
The most common Natural Resources, Construction and Maintenance occupations in New Madrid County are Installation, Maintenance & Repair (317 | 4.9%), Construction & Extraction (221 | 3.4%), and Farming, Fishing & Forestry (187 | 2.9%).
Natural Resources, Construction and Maintenance Occupations by Sex
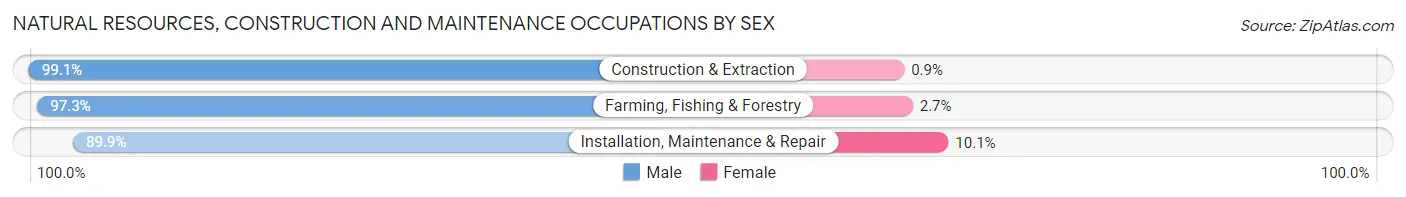
| Occupation | Male | Female |
| Farming, Fishing & Forestry | 182 (97.3%) | 5 (2.7%) |
| Construction & Extraction | 219 (99.1%) | 2 (0.9%) |
| Installation, Maintenance & Repair | 285 (89.9%) | 32 (10.1%) |
| Total (Category) | 686 (94.6%) | 39 (5.4%) |
| Total (Overall) | 3,292 (50.7%) | 3,198 (49.3%) |
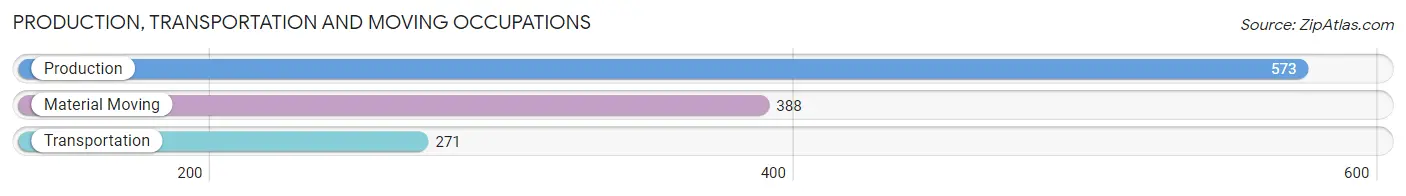
Production, Transportation and Moving Occupations
The most common Production, Transportation and Moving occupations in New Madrid County are Production (573 | 8.8%), Material Moving (388 | 6.0%), and Transportation (271 | 4.2%).
Production, Transportation and Moving Occupations by Sex
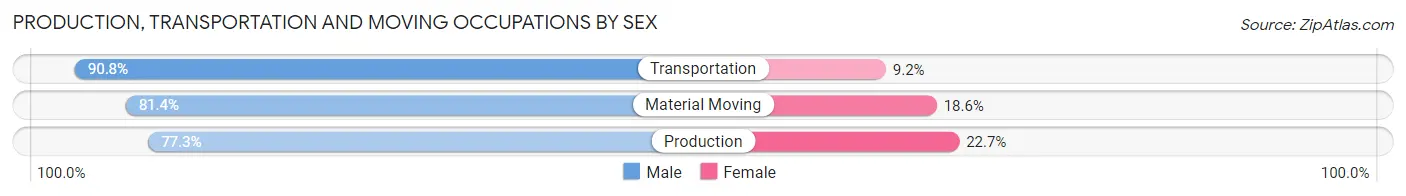
| Occupation | Male | Female |
| Production | 443 (77.3%) | 130 (22.7%) |
| Transportation | 246 (90.8%) | 25 (9.2%) |
| Material Moving | 316 (81.4%) | 72 (18.6%) |
| Total (Category) | 1,005 (81.6%) | 227 (18.4%) |
| Total (Overall) | 3,292 (50.7%) | 3,198 (49.3%) |
Employment Industries by Sex in New Madrid County
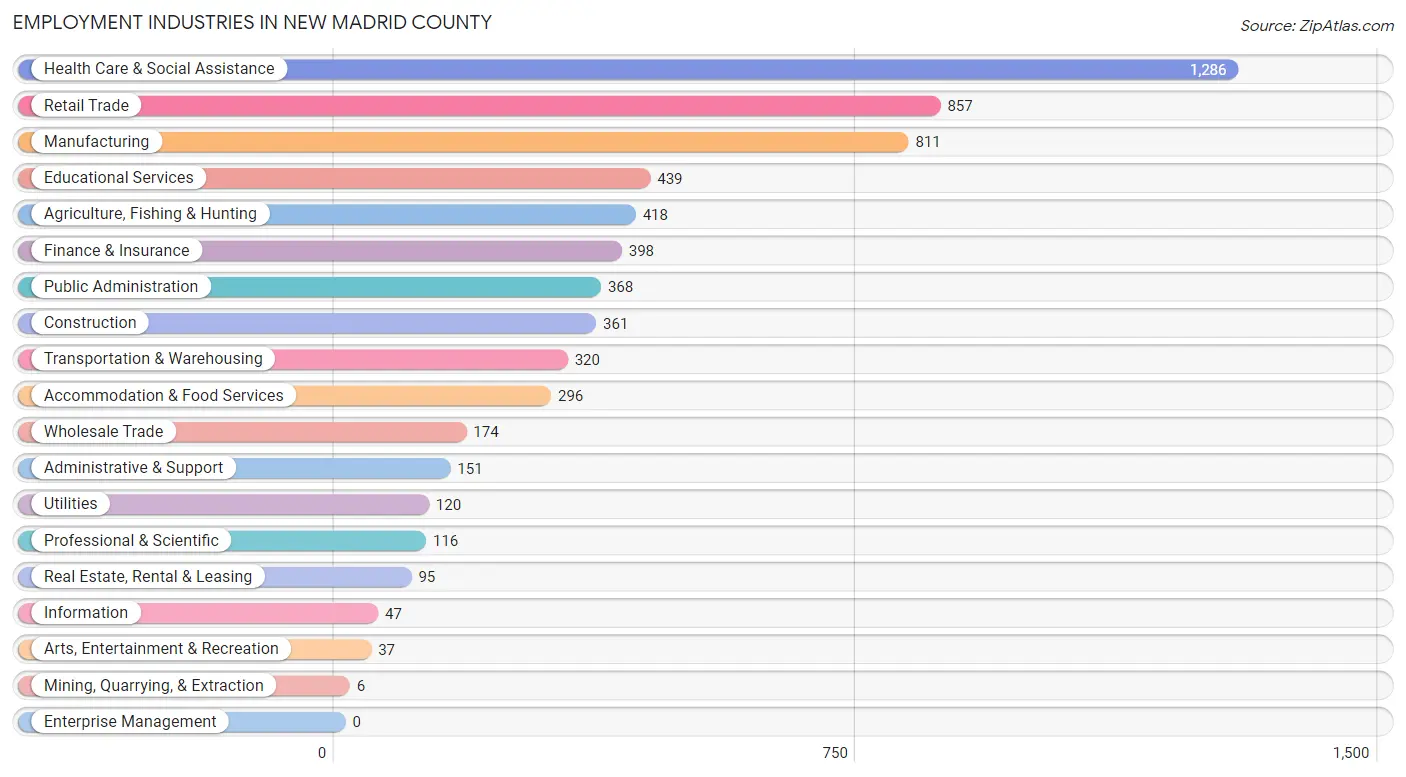
Employment Industries in New Madrid County
The major employment industries in New Madrid County include Health Care & Social Assistance (1,286 | 19.8%), Retail Trade (857 | 13.2%), Manufacturing (811 | 12.5%), Educational Services (439 | 6.8%), and Agriculture, Fishing & Hunting (418 | 6.4%).
Employment Industries by Sex in New Madrid County
The New Madrid County industries that see more men than women are Mining, Quarrying, & Extraction (100.0%), Utilities (100.0%), and Construction (98.1%), whereas the industries that tend to have a higher number of women are Health Care & Social Assistance (83.6%), Professional & Scientific (77.6%), and Educational Services (74.5%).
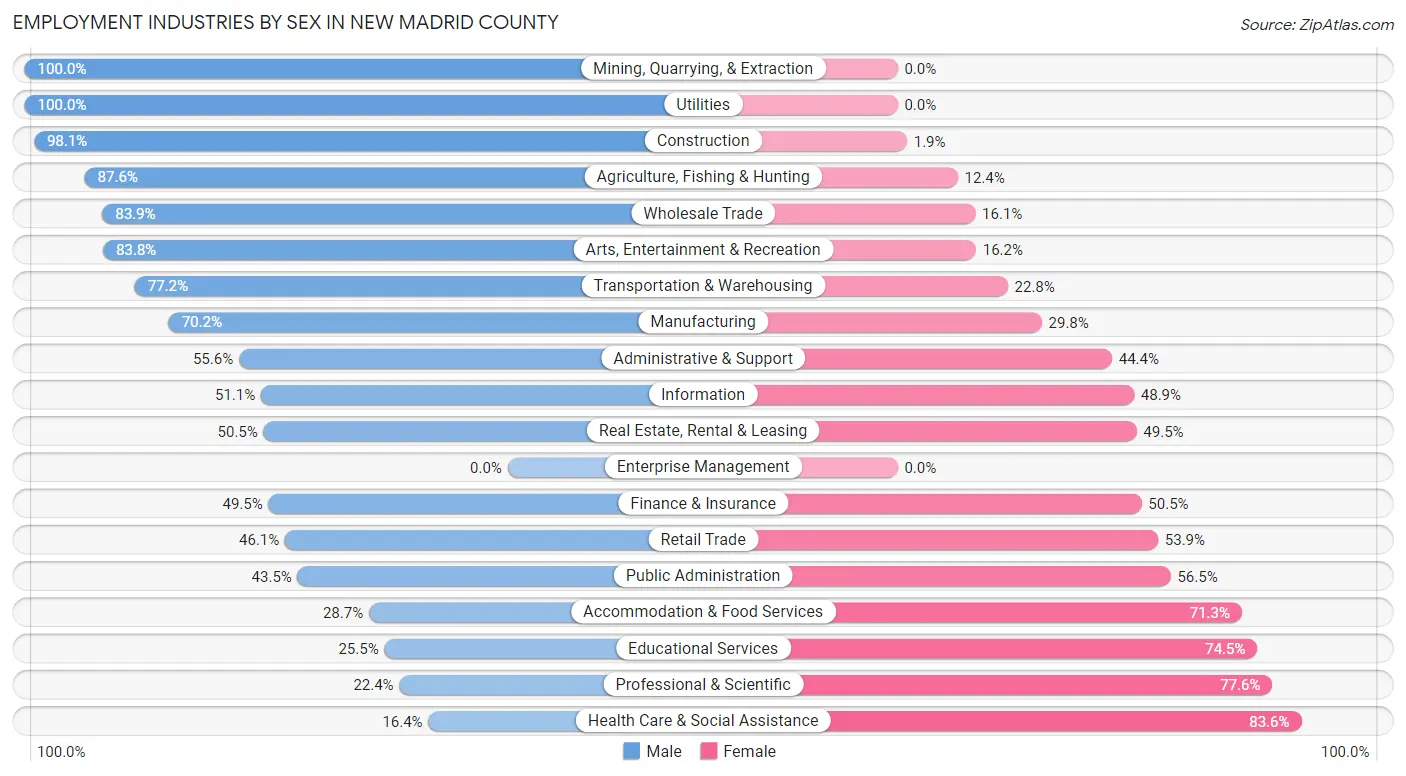
| Industry | Male | Female |
| Agriculture, Fishing & Hunting | 366 (87.6%) | 52 (12.4%) |
| Mining, Quarrying, & Extraction | 6 (100.0%) | 0 (0.0%) |
| Construction | 354 (98.1%) | 7 (1.9%) |
| Manufacturing | 569 (70.2%) | 242 (29.8%) |
| Wholesale Trade | 146 (83.9%) | 28 (16.1%) |
| Retail Trade | 395 (46.1%) | 462 (53.9%) |
| Transportation & Warehousing | 247 (77.2%) | 73 (22.8%) |
| Utilities | 120 (100.0%) | 0 (0.0%) |
| Information | 24 (51.1%) | 23 (48.9%) |
| Finance & Insurance | 197 (49.5%) | 201 (50.5%) |
| Real Estate, Rental & Leasing | 48 (50.5%) | 47 (49.5%) |
| Professional & Scientific | 26 (22.4%) | 90 (77.6%) |
| Enterprise Management | 0 (0.0%) | 0 (0.0%) |
| Administrative & Support | 84 (55.6%) | 67 (44.4%) |
| Educational Services | 112 (25.5%) | 327 (74.5%) |
| Health Care & Social Assistance | 211 (16.4%) | 1,075 (83.6%) |
| Arts, Entertainment & Recreation | 31 (83.8%) | 6 (16.2%) |
| Accommodation & Food Services | 85 (28.7%) | 211 (71.3%) |
| Public Administration | 160 (43.5%) | 208 (56.5%) |
| Total | 3,292 (50.7%) | 3,198 (49.3%) |
Education in New Madrid County
School Enrollment in New Madrid County
The most common levels of schooling among the 3,495 students in New Madrid County are middle school (877 | 25.1%), high school (845 | 24.2%), and elementary school (743 | 21.3%).
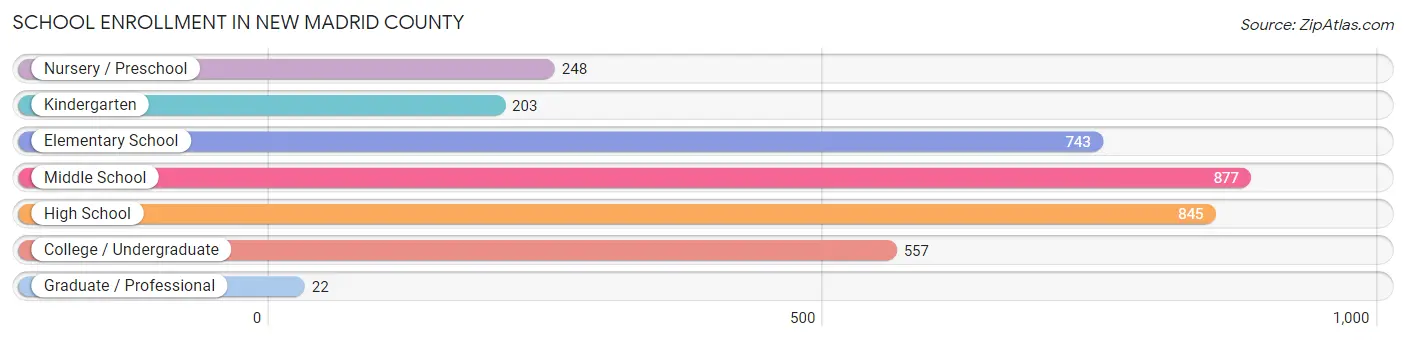
| School Level | # Students | % Students |
| Nursery / Preschool | 248 | 7.1% |
| Kindergarten | 203 | 5.8% |
| Elementary School | 743 | 21.3% |
| Middle School | 877 | 25.1% |
| High School | 845 | 24.2% |
| College / Undergraduate | 557 | 15.9% |
| Graduate / Professional | 22 | 0.6% |
| Total | 3,495 | 100.0% |
School Enrollment by Age by Funding Source in New Madrid County
Out of a total of 3,495 students who are enrolled in schools in New Madrid County, 343 (9.8%) attend a private institution, while the remaining 3,152 (90.2%) are enrolled in public schools. The age group of 25 to 34 year olds has the highest likelihood of being enrolled in private schools, with 44 (48.3% in the age bracket) enrolled. Conversely, the age group of 15 to 17 year olds has the lowest likelihood of being enrolled in a private school, with 610 (97.3% in the age bracket) attending a public institution.
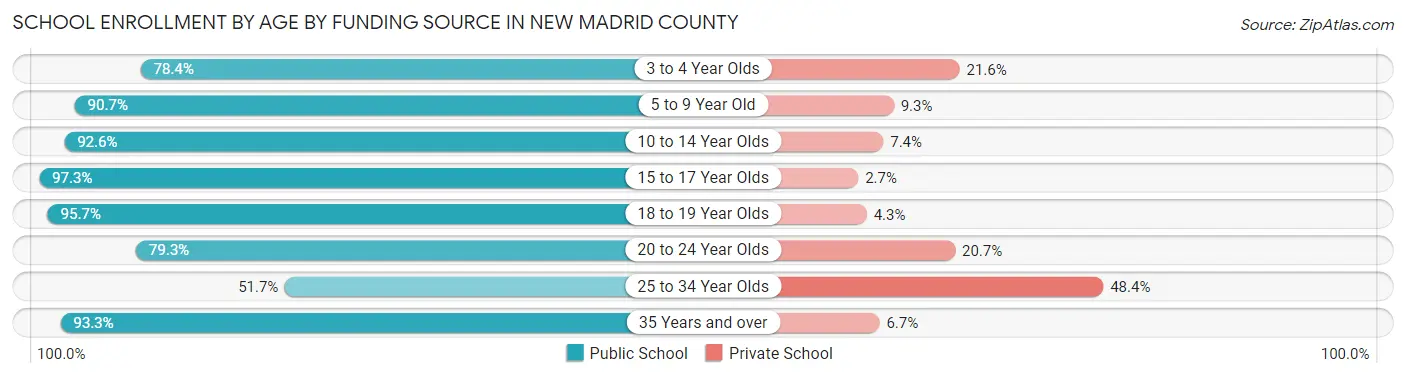
| Age Bracket | Public School | Private School |
| 3 to 4 Year Olds | 138 (78.4%) | 38 (21.6%) |
| 5 to 9 Year Old | 788 (90.7%) | 81 (9.3%) |
| 10 to 14 Year Olds | 1,079 (92.6%) | 86 (7.4%) |
| 15 to 17 Year Olds | 610 (97.3%) | 17 (2.7%) |
| 18 to 19 Year Olds | 156 (95.7%) | 7 (4.3%) |
| 20 to 24 Year Olds | 237 (79.3%) | 62 (20.7%) |
| 25 to 34 Year Olds | 47 (51.6%) | 44 (48.3%) |
| 35 Years and over | 98 (93.3%) | 7 (6.7%) |
| Total | 3,152 (90.2%) | 343 (9.8%) |
Educational Attainment by Field of Study in New Madrid County
Education (472 | 31.2%), business (293 | 19.4%), bio, nature & agricultural (161 | 10.6%), social sciences (128 | 8.5%), and science & technology (127 | 8.4%) are the most common fields of study among 1,513 individuals in New Madrid County who have obtained a bachelor's degree or higher.
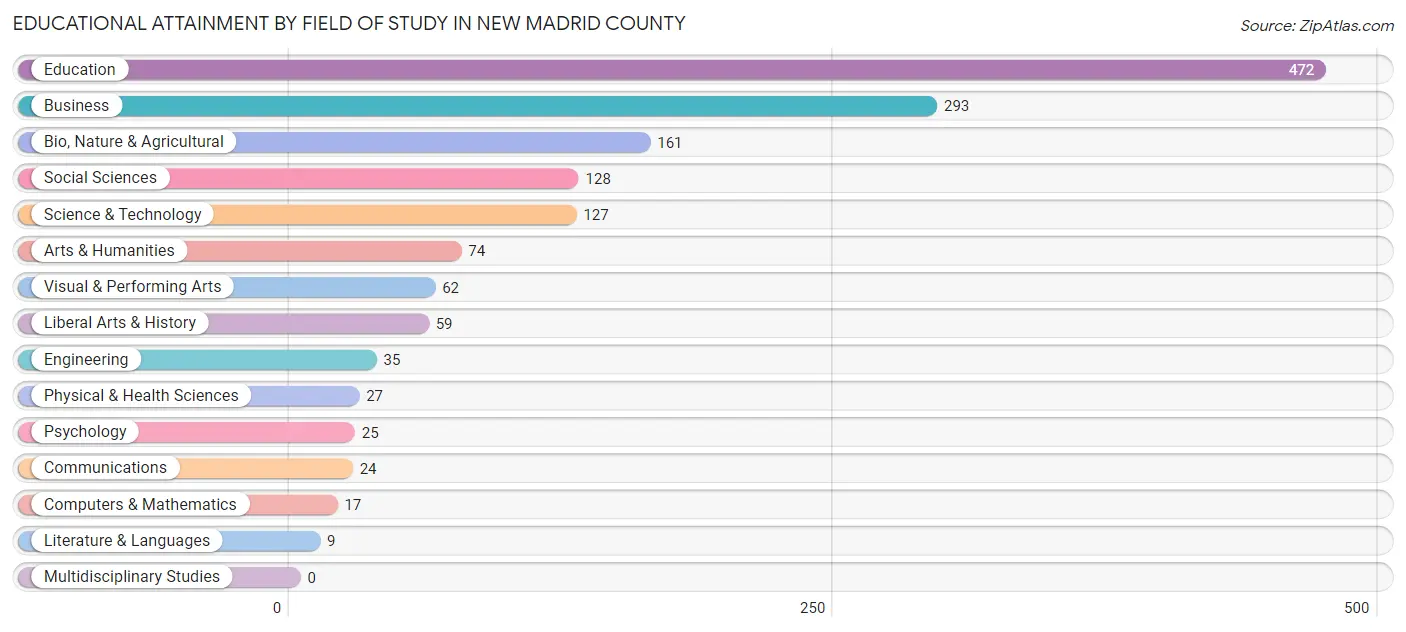
| Field of Study | # Graduates | % Graduates |
| Computers & Mathematics | 17 | 1.1% |
| Bio, Nature & Agricultural | 161 | 10.6% |
| Physical & Health Sciences | 27 | 1.8% |
| Psychology | 25 | 1.7% |
| Social Sciences | 128 | 8.5% |
| Engineering | 35 | 2.3% |
| Multidisciplinary Studies | 0 | 0.0% |
| Science & Technology | 127 | 8.4% |
| Business | 293 | 19.4% |
| Education | 472 | 31.2% |
| Literature & Languages | 9 | 0.6% |
| Liberal Arts & History | 59 | 3.9% |
| Visual & Performing Arts | 62 | 4.1% |
| Communications | 24 | 1.6% |
| Arts & Humanities | 74 | 4.9% |
| Total | 1,513 | 100.0% |
Transportation & Commute in New Madrid County
Vehicle Availability by Sex in New Madrid County
The most prevalent vehicle ownership categories in New Madrid County are males with 2 vehicles (1,343, accounting for 41.3%) and females with 2 vehicles (1,127, making up 42.9%).
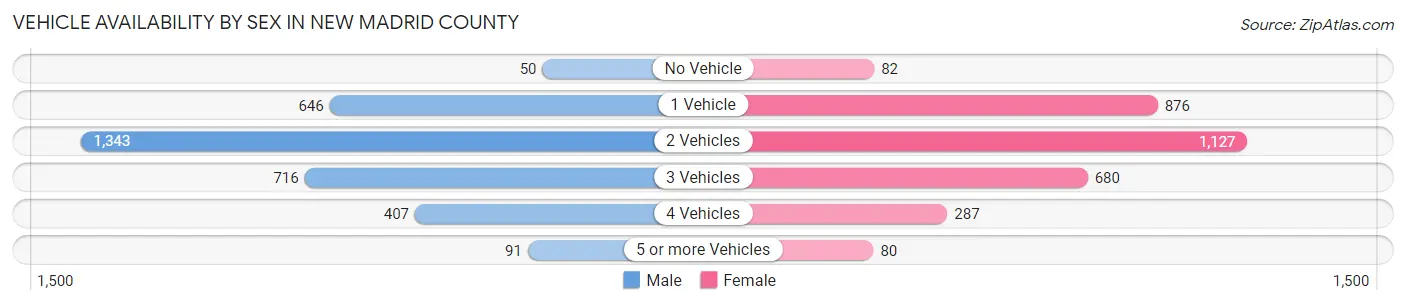
| Vehicles Available | Male | Female |
| No Vehicle | 50 (1.5%) | 82 (2.6%) |
| 1 Vehicle | 646 (19.9%) | 876 (28.0%) |
| 2 Vehicles | 1,343 (41.3%) | 1,127 (36.0%) |
| 3 Vehicles | 716 (22.0%) | 680 (21.7%) |
| 4 Vehicles | 407 (12.5%) | 287 (9.2%) |
| 5 or more Vehicles | 91 (2.8%) | 80 (2.5%) |
| Total | 3,253 (100.0%) | 3,132 (100.0%) |
Commute Time in New Madrid County
The most frequently occuring commute durations in New Madrid County are 5 to 9 minutes (1,286 commuters, 20.9%), 15 to 19 minutes (937 commuters, 15.2%), and 30 to 34 minutes (717 commuters, 11.7%).
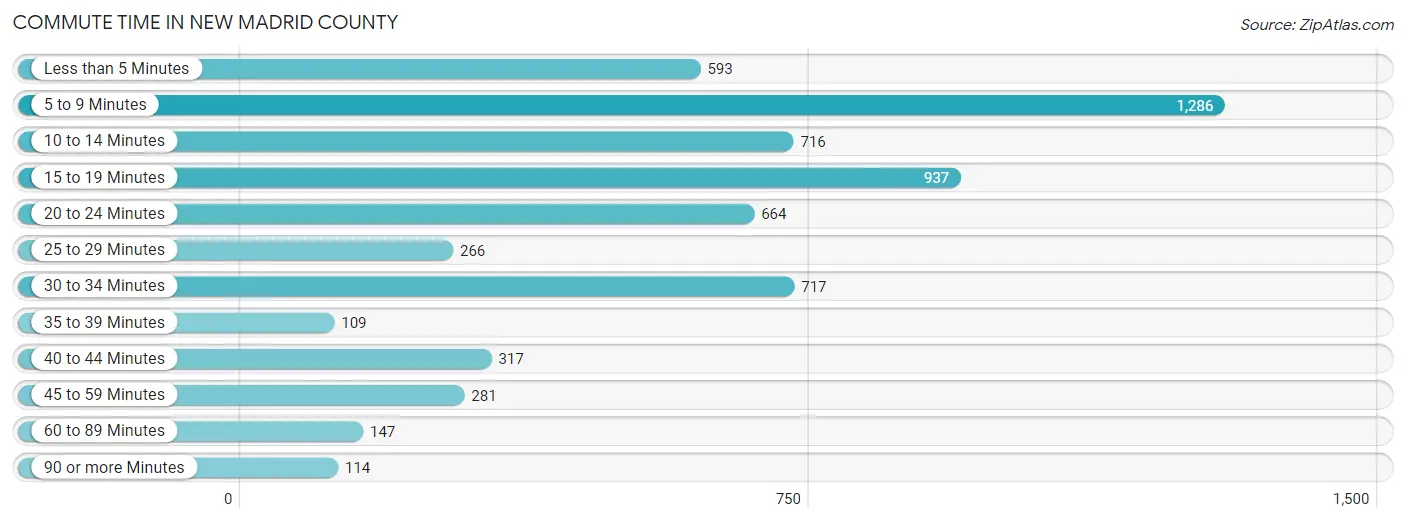
| Commute Time | # Commuters | % Commuters |
| Less than 5 Minutes | 593 | 9.7% |
| 5 to 9 Minutes | 1,286 | 20.9% |
| 10 to 14 Minutes | 716 | 11.7% |
| 15 to 19 Minutes | 937 | 15.2% |
| 20 to 24 Minutes | 664 | 10.8% |
| 25 to 29 Minutes | 266 | 4.3% |
| 30 to 34 Minutes | 717 | 11.7% |
| 35 to 39 Minutes | 109 | 1.8% |
| 40 to 44 Minutes | 317 | 5.2% |
| 45 to 59 Minutes | 281 | 4.6% |
| 60 to 89 Minutes | 147 | 2.4% |
| 90 or more Minutes | 114 | 1.8% |
Commute Time by Sex in New Madrid County
The most common commute times in New Madrid County are 15 to 19 minutes (616 commuters, 19.5%) for males and 5 to 9 minutes (801 commuters, 26.8%) for females.
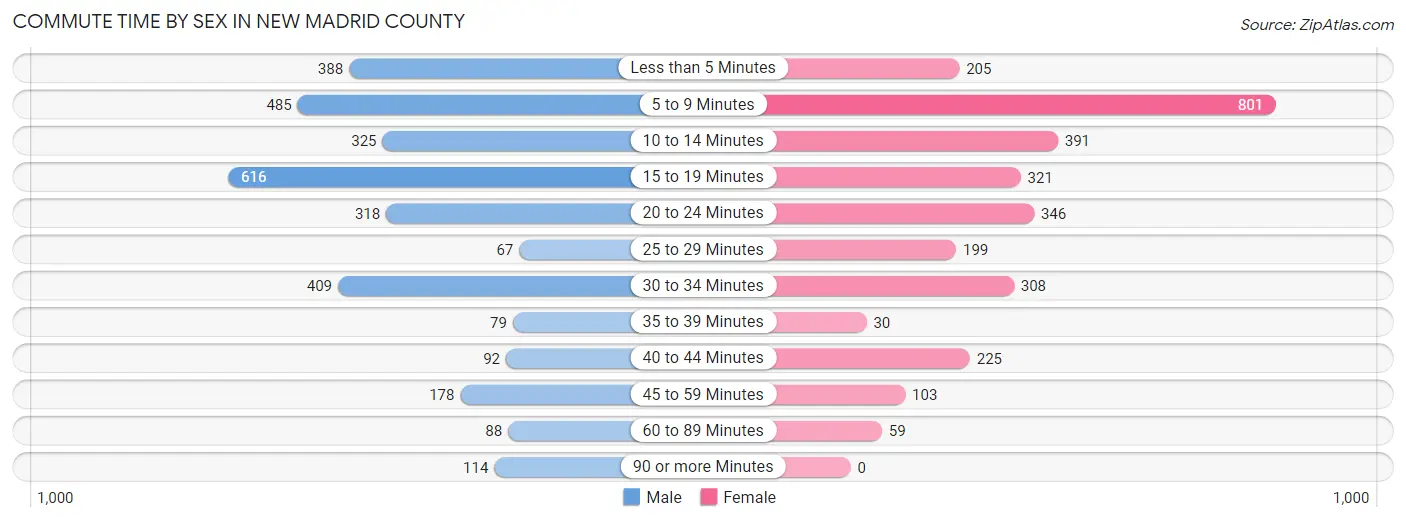
| Commute Time | Male | Female |
| Less than 5 Minutes | 388 (12.3%) | 205 (6.9%) |
| 5 to 9 Minutes | 485 (15.3%) | 801 (26.8%) |
| 10 to 14 Minutes | 325 (10.3%) | 391 (13.1%) |
| 15 to 19 Minutes | 616 (19.5%) | 321 (10.7%) |
| 20 to 24 Minutes | 318 (10.1%) | 346 (11.6%) |
| 25 to 29 Minutes | 67 (2.1%) | 199 (6.7%) |
| 30 to 34 Minutes | 409 (13.0%) | 308 (10.3%) |
| 35 to 39 Minutes | 79 (2.5%) | 30 (1.0%) |
| 40 to 44 Minutes | 92 (2.9%) | 225 (7.5%) |
| 45 to 59 Minutes | 178 (5.6%) | 103 (3.5%) |
| 60 to 89 Minutes | 88 (2.8%) | 59 (2.0%) |
| 90 or more Minutes | 114 (3.6%) | 0 (0.0%) |
Time of Departure to Work by Sex in New Madrid County
The most frequent times of departure to work in New Madrid County are 7:00 AM to 7:29 AM (575, 18.2%) for males and 7:30 AM to 7:59 AM (611, 20.4%) for females.
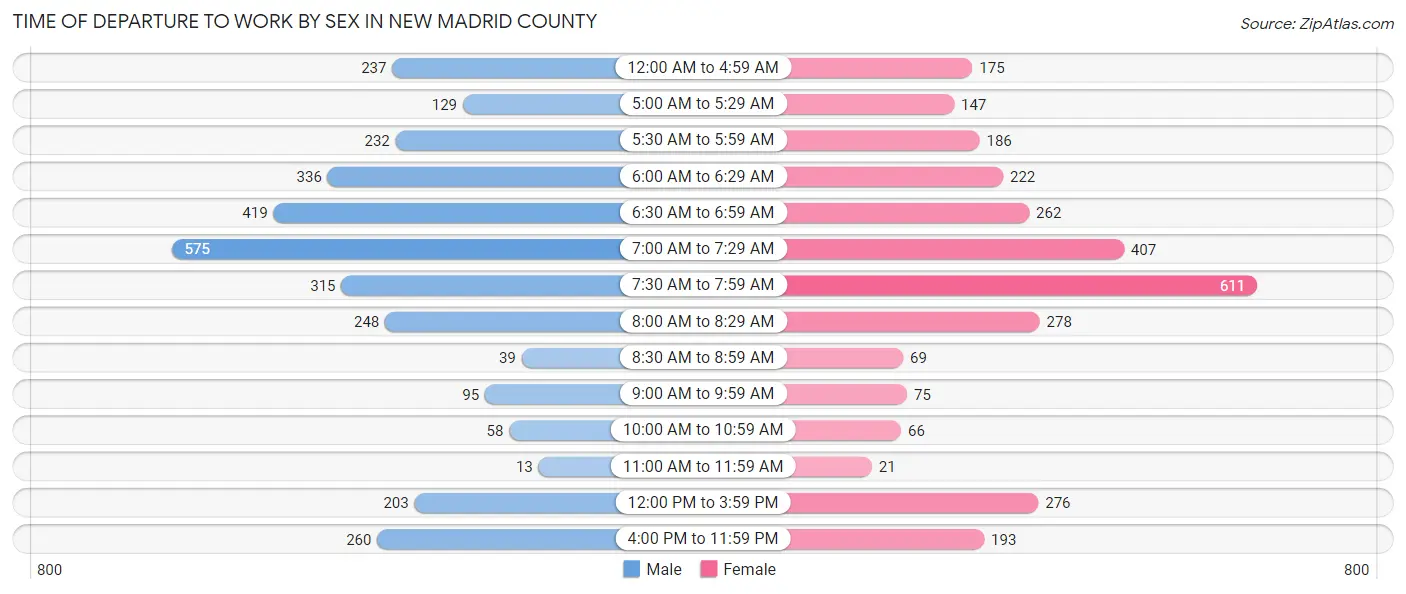
| Time of Departure | Male | Female |
| 12:00 AM to 4:59 AM | 237 (7.5%) | 175 (5.9%) |
| 5:00 AM to 5:29 AM | 129 (4.1%) | 147 (4.9%) |
| 5:30 AM to 5:59 AM | 232 (7.3%) | 186 (6.2%) |
| 6:00 AM to 6:29 AM | 336 (10.6%) | 222 (7.4%) |
| 6:30 AM to 6:59 AM | 419 (13.3%) | 262 (8.8%) |
| 7:00 AM to 7:29 AM | 575 (18.2%) | 407 (13.6%) |
| 7:30 AM to 7:59 AM | 315 (10.0%) | 611 (20.4%) |
| 8:00 AM to 8:29 AM | 248 (7.9%) | 278 (9.3%) |
| 8:30 AM to 8:59 AM | 39 (1.2%) | 69 (2.3%) |
| 9:00 AM to 9:59 AM | 95 (3.0%) | 75 (2.5%) |
| 10:00 AM to 10:59 AM | 58 (1.8%) | 66 (2.2%) |
| 11:00 AM to 11:59 AM | 13 (0.4%) | 21 (0.7%) |
| 12:00 PM to 3:59 PM | 203 (6.4%) | 276 (9.2%) |
| 4:00 PM to 11:59 PM | 260 (8.2%) | 193 (6.5%) |
| Total | 3,159 (100.0%) | 2,988 (100.0%) |
Housing Occupancy in New Madrid County
Occupancy by Ownership in New Madrid County
Of the total 6,769 dwellings in New Madrid County, owner-occupied units account for 4,389 (64.8%), while renter-occupied units make up 2,380 (35.2%).
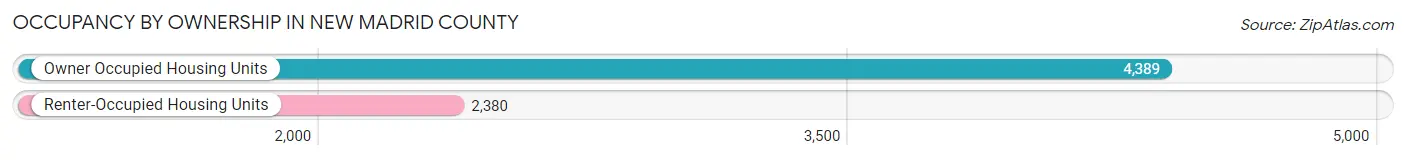
| Occupancy | # Housing Units | % Housing Units |
| Owner Occupied Housing Units | 4,389 | 64.8% |
| Renter-Occupied Housing Units | 2,380 | 35.2% |
| Total Occupied Housing Units | 6,769 | 100.0% |
Occupancy by Household Size in New Madrid County
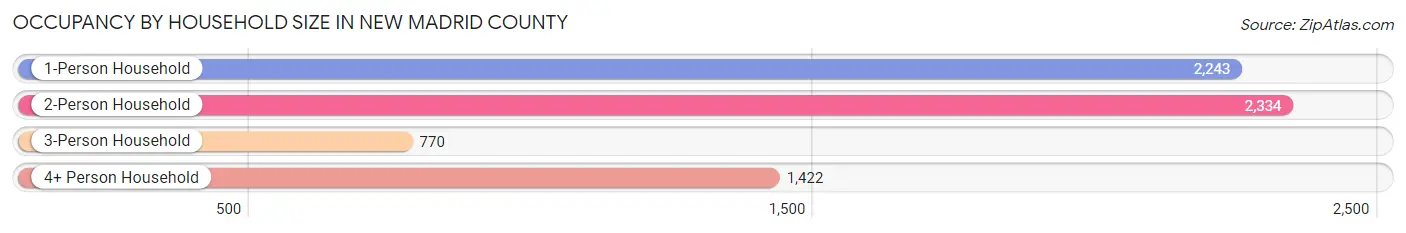
| Household Size | # Housing Units | % Housing Units |
| 1-Person Household | 2,243 | 33.1% |
| 2-Person Household | 2,334 | 34.5% |
| 3-Person Household | 770 | 11.4% |
| 4+ Person Household | 1,422 | 21.0% |
| Total Housing Units | 6,769 | 100.0% |
Occupancy by Ownership by Household Size in New Madrid County
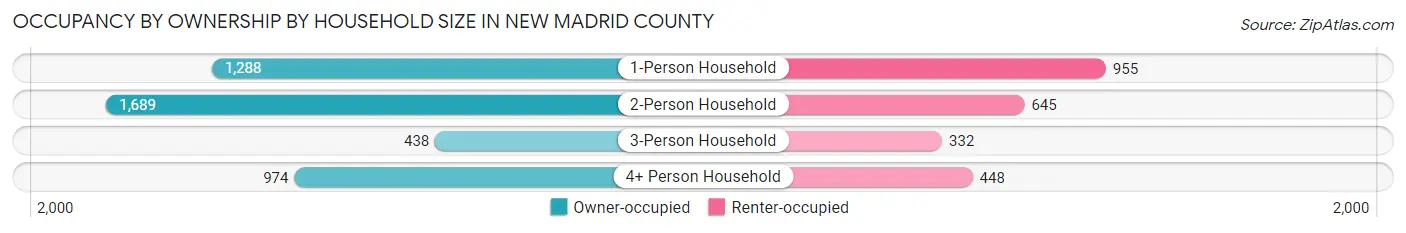
| Household Size | Owner-occupied | Renter-occupied |
| 1-Person Household | 1,288 (57.4%) | 955 (42.6%) |
| 2-Person Household | 1,689 (72.4%) | 645 (27.6%) |
| 3-Person Household | 438 (56.9%) | 332 (43.1%) |
| 4+ Person Household | 974 (68.5%) | 448 (31.5%) |
| Total Housing Units | 4,389 (64.8%) | 2,380 (35.2%) |
Occupancy by Educational Attainment in New Madrid County
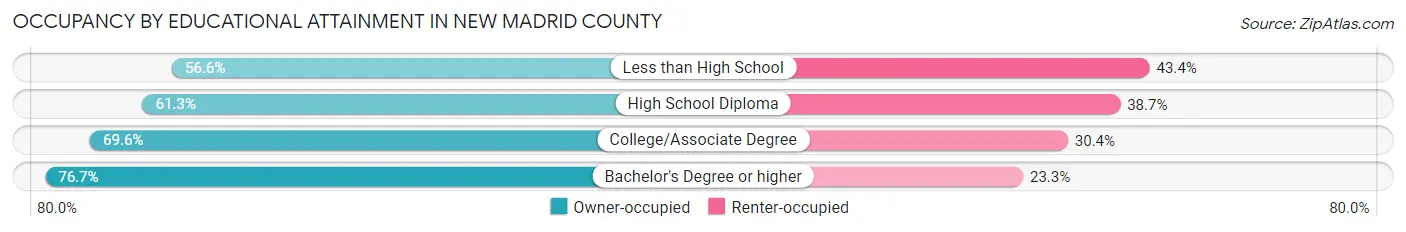
| Household Size | Owner-occupied | Renter-occupied |
| Less than High School | 637 (56.6%) | 488 (43.4%) |
| High School Diploma | 1,783 (61.3%) | 1,126 (38.7%) |
| College/Associate Degree | 1,264 (69.6%) | 552 (30.4%) |
| Bachelor's Degree or higher | 705 (76.7%) | 214 (23.3%) |
Occupancy by Age of Householder in New Madrid County
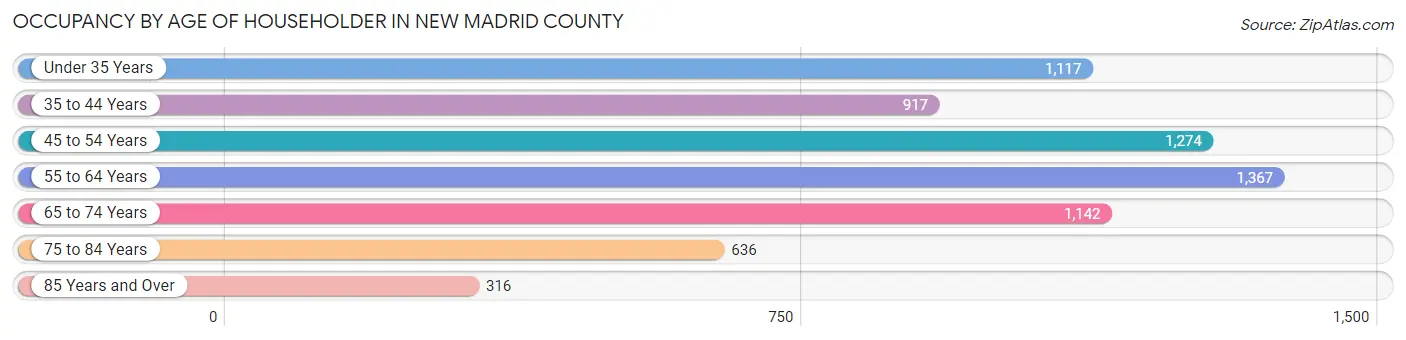
| Age Bracket | # Households | % Households |
| Under 35 Years | 1,117 | 16.5% |
| 35 to 44 Years | 917 | 13.6% |
| 45 to 54 Years | 1,274 | 18.8% |
| 55 to 64 Years | 1,367 | 20.2% |
| 65 to 74 Years | 1,142 | 16.9% |
| 75 to 84 Years | 636 | 9.4% |
| 85 Years and Over | 316 | 4.7% |
| Total | 6,769 | 100.0% |
Housing Finances in New Madrid County
Median Income by Occupancy in New Madrid County
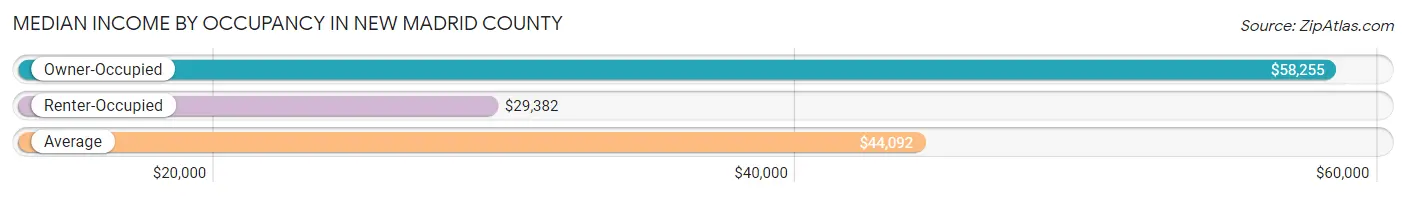
| Occupancy Type | # Households | Median Income |
| Owner-Occupied | 4,389 (64.8%) | $58,255 |
| Renter-Occupied | 2,380 (35.2%) | $29,382 |
| Average | 6,769 (100.0%) | $44,092 |
Occupancy by Householder Income Bracket in New Madrid County
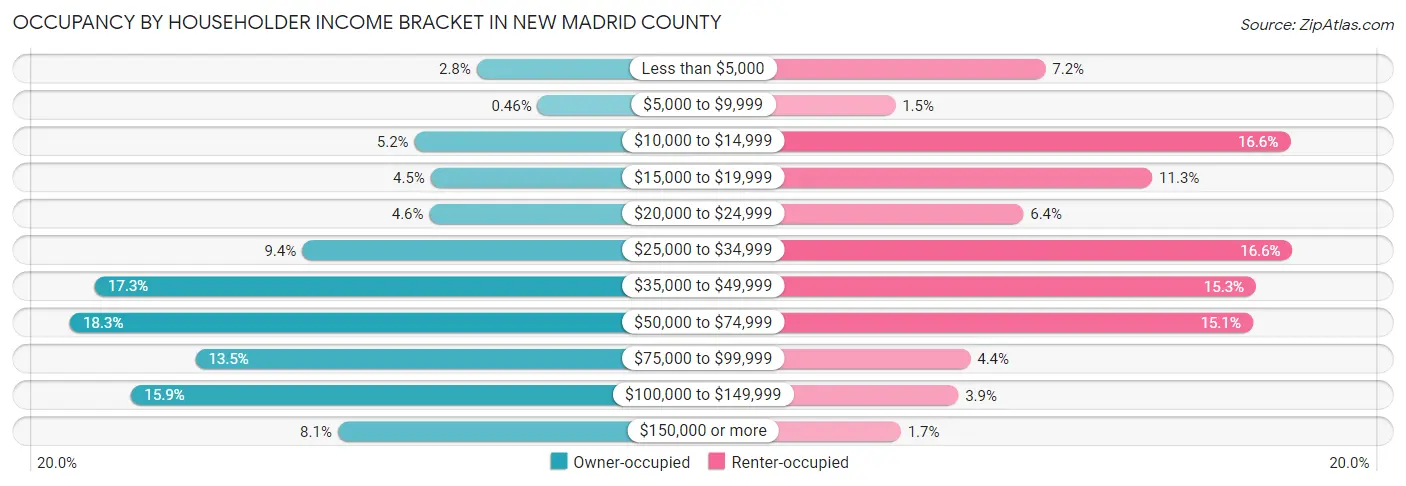
| Income Bracket | Owner-occupied | Renter-occupied |
| Less than $5,000 | 122 (2.8%) | 172 (7.2%) |
| $5,000 to $9,999 | 20 (0.5%) | 36 (1.5%) |
| $10,000 to $14,999 | 226 (5.1%) | 394 (16.6%) |
| $15,000 to $19,999 | 199 (4.5%) | 269 (11.3%) |
| $20,000 to $24,999 | 201 (4.6%) | 152 (6.4%) |
| $25,000 to $34,999 | 414 (9.4%) | 396 (16.6%) |
| $35,000 to $49,999 | 760 (17.3%) | 363 (15.2%) |
| $50,000 to $74,999 | 802 (18.3%) | 360 (15.1%) |
| $75,000 to $99,999 | 592 (13.5%) | 104 (4.4%) |
| $100,000 to $149,999 | 699 (15.9%) | 93 (3.9%) |
| $150,000 or more | 354 (8.1%) | 41 (1.7%) |
| Total | 4,389 (100.0%) | 2,380 (100.0%) |
Monthly Housing Cost Tiers in New Madrid County
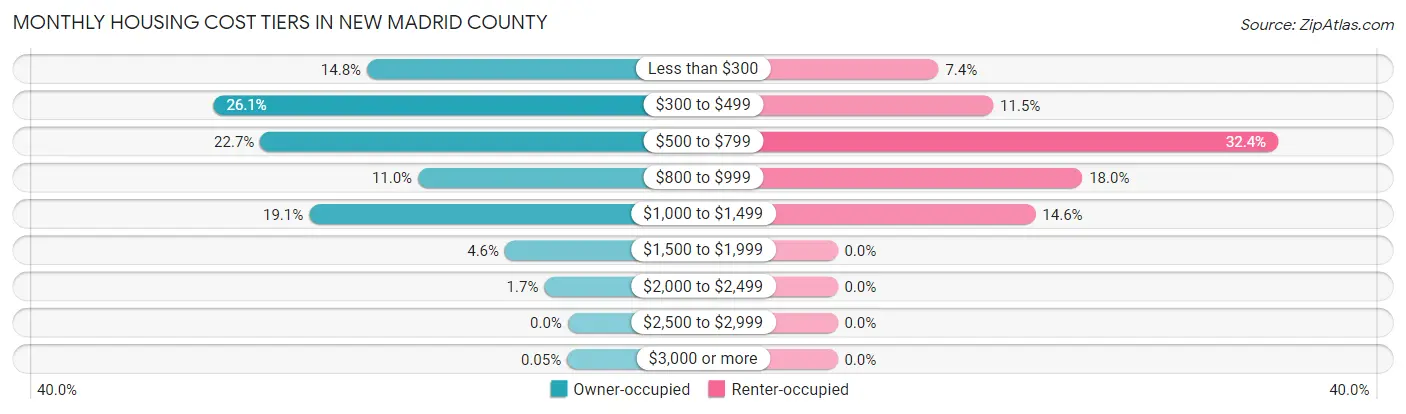
| Monthly Cost | Owner-occupied | Renter-occupied |
| Less than $300 | 649 (14.8%) | 177 (7.4%) |
| $300 to $499 | 1,145 (26.1%) | 273 (11.5%) |
| $500 to $799 | 994 (22.7%) | 772 (32.4%) |
| $800 to $999 | 484 (11.0%) | 429 (18.0%) |
| $1,000 to $1,499 | 836 (19.1%) | 347 (14.6%) |
| $1,500 to $1,999 | 203 (4.6%) | 0 (0.0%) |
| $2,000 to $2,499 | 76 (1.7%) | 0 (0.0%) |
| $2,500 to $2,999 | 0 (0.0%) | 0 (0.0%) |
| $3,000 or more | 2 (0.1%) | 0 (0.0%) |
| Total | 4,389 (100.0%) | 2,380 (100.0%) |
Physical Housing Characteristics in New Madrid County
Housing Structures in New Madrid County
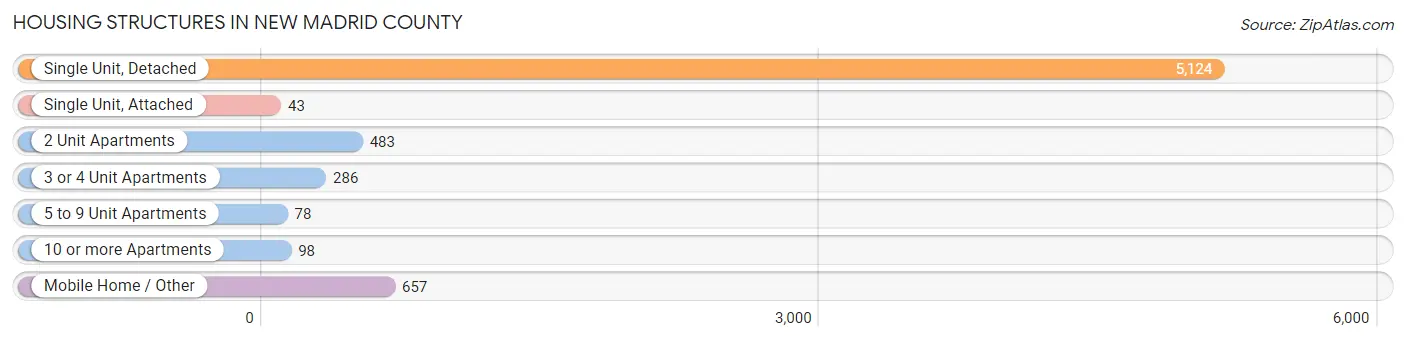
| Structure Type | # Housing Units | % Housing Units |
| Single Unit, Detached | 5,124 | 75.7% |
| Single Unit, Attached | 43 | 0.6% |
| 2 Unit Apartments | 483 | 7.1% |
| 3 or 4 Unit Apartments | 286 | 4.2% |
| 5 to 9 Unit Apartments | 78 | 1.1% |
| 10 or more Apartments | 98 | 1.5% |
| Mobile Home / Other | 657 | 9.7% |
| Total | 6,769 | 100.0% |
Housing Structures by Occupancy in New Madrid County
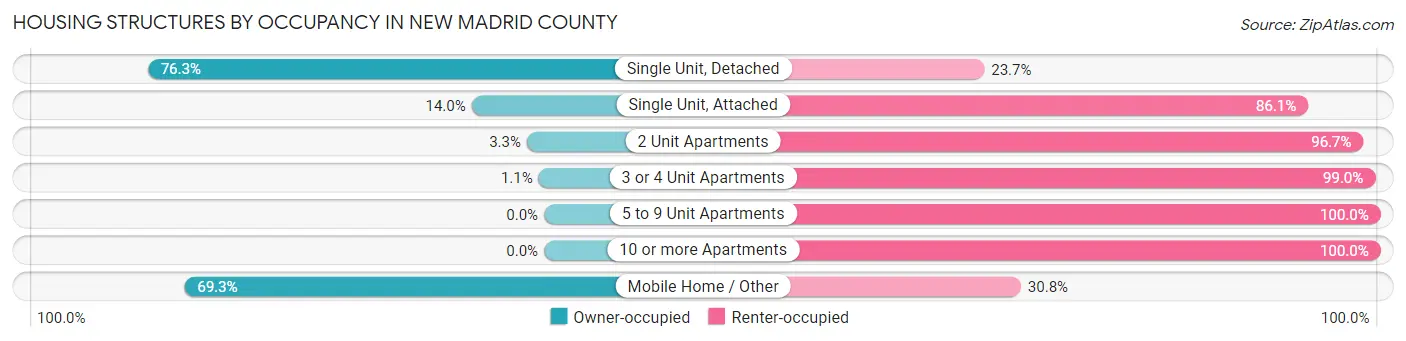
| Structure Type | Owner-occupied | Renter-occupied |
| Single Unit, Detached | 3,909 (76.3%) | 1,215 (23.7%) |
| Single Unit, Attached | 6 (14.0%) | 37 (86.1%) |
| 2 Unit Apartments | 16 (3.3%) | 467 (96.7%) |
| 3 or 4 Unit Apartments | 3 (1.1%) | 283 (99.0%) |
| 5 to 9 Unit Apartments | 0 (0.0%) | 78 (100.0%) |
| 10 or more Apartments | 0 (0.0%) | 98 (100.0%) |
| Mobile Home / Other | 455 (69.3%) | 202 (30.7%) |
| Total | 4,389 (64.8%) | 2,380 (35.2%) |
Housing Structures by Number of Rooms in New Madrid County
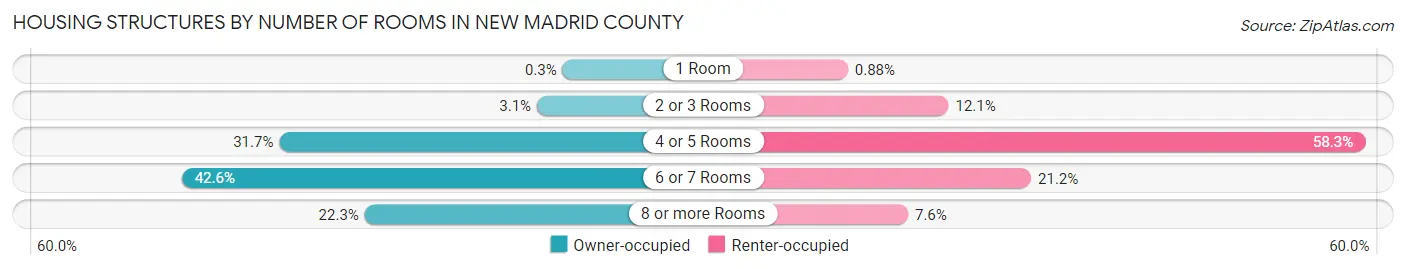
| Number of Rooms | Owner-occupied | Renter-occupied |
| 1 Room | 13 (0.3%) | 21 (0.9%) |
| 2 or 3 Rooms | 138 (3.1%) | 287 (12.1%) |
| 4 or 5 Rooms | 1,393 (31.7%) | 1,387 (58.3%) |
| 6 or 7 Rooms | 1,868 (42.6%) | 505 (21.2%) |
| 8 or more Rooms | 977 (22.3%) | 180 (7.6%) |
| Total | 4,389 (100.0%) | 2,380 (100.0%) |
Housing Structure by Heating Type in New Madrid County
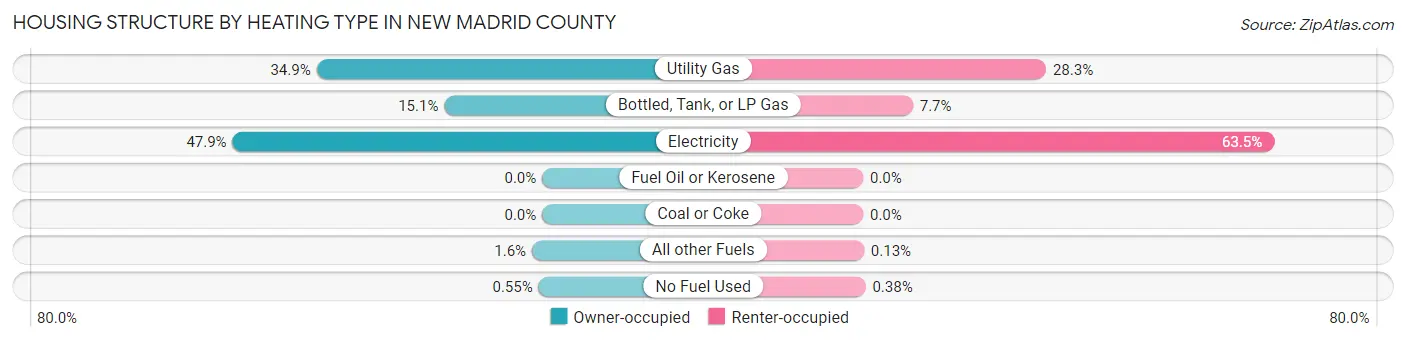
| Heating Type | Owner-occupied | Renter-occupied |
| Utility Gas | 1,531 (34.9%) | 673 (28.3%) |
| Bottled, Tank, or LP Gas | 664 (15.1%) | 183 (7.7%) |
| Electricity | 2,101 (47.9%) | 1,512 (63.5%) |
| Fuel Oil or Kerosene | 0 (0.0%) | 0 (0.0%) |
| Coal or Coke | 0 (0.0%) | 0 (0.0%) |
| All other Fuels | 69 (1.6%) | 3 (0.1%) |
| No Fuel Used | 24 (0.5%) | 9 (0.4%) |
| Total | 4,389 (100.0%) | 2,380 (100.0%) |
Household Vehicle Usage in New Madrid County
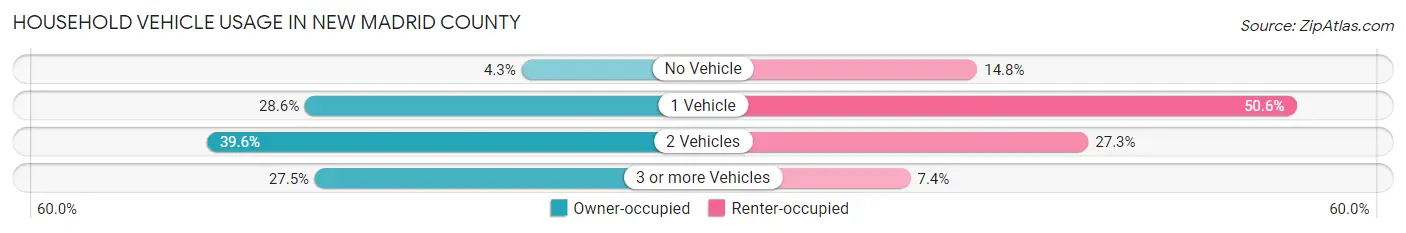
| Vehicles per Household | Owner-occupied | Renter-occupied |
| No Vehicle | 190 (4.3%) | 353 (14.8%) |
| 1 Vehicle | 1,255 (28.6%) | 1,203 (50.5%) |
| 2 Vehicles | 1,738 (39.6%) | 649 (27.3%) |
| 3 or more Vehicles | 1,206 (27.5%) | 175 (7.3%) |
| Total | 4,389 (100.0%) | 2,380 (100.0%) |
Real Estate & Mortgages in New Madrid County
Real Estate and Mortgage Overview in New Madrid County
| Characteristic | Without Mortgage | With Mortgage |
| Housing Units | 2,426 | 1,963 |
| Median Property Value | $75,500 | $126,600 |
| Median Household Income | $47,419 | $213 |
| Monthly Housing Costs | $382 | $0 |
| Real Estate Taxes | $602 | $6 |
Property Value by Mortgage Status in New Madrid County
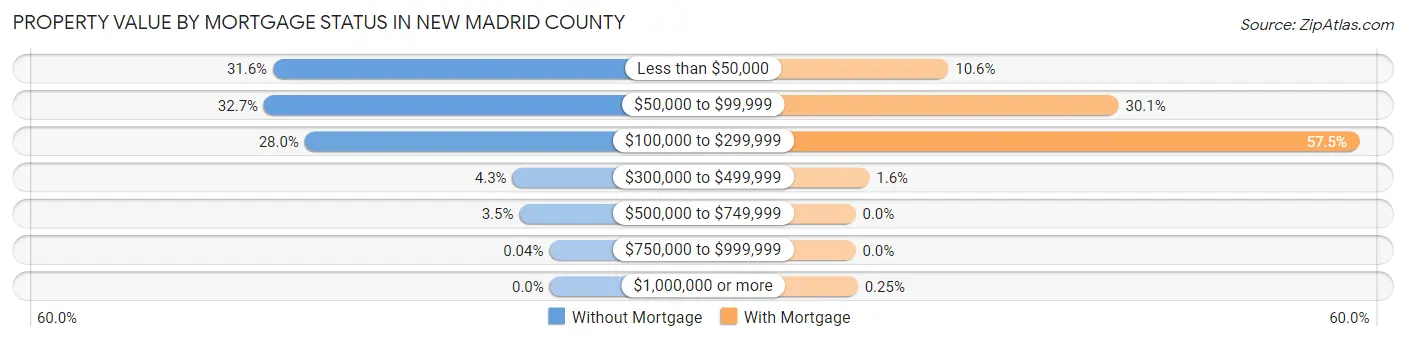
| Property Value | Without Mortgage | With Mortgage |
| Less than $50,000 | 767 (31.6%) | 208 (10.6%) |
| $50,000 to $99,999 | 792 (32.7%) | 590 (30.1%) |
| $100,000 to $299,999 | 679 (28.0%) | 1,129 (57.5%) |
| $300,000 to $499,999 | 103 (4.3%) | 31 (1.6%) |
| $500,000 to $749,999 | 84 (3.5%) | 0 (0.0%) |
| $750,000 to $999,999 | 1 (0.0%) | 0 (0.0%) |
| $1,000,000 or more | 0 (0.0%) | 5 (0.3%) |
| Total | 2,426 (100.0%) | 1,963 (100.0%) |
Household Income by Mortgage Status in New Madrid County
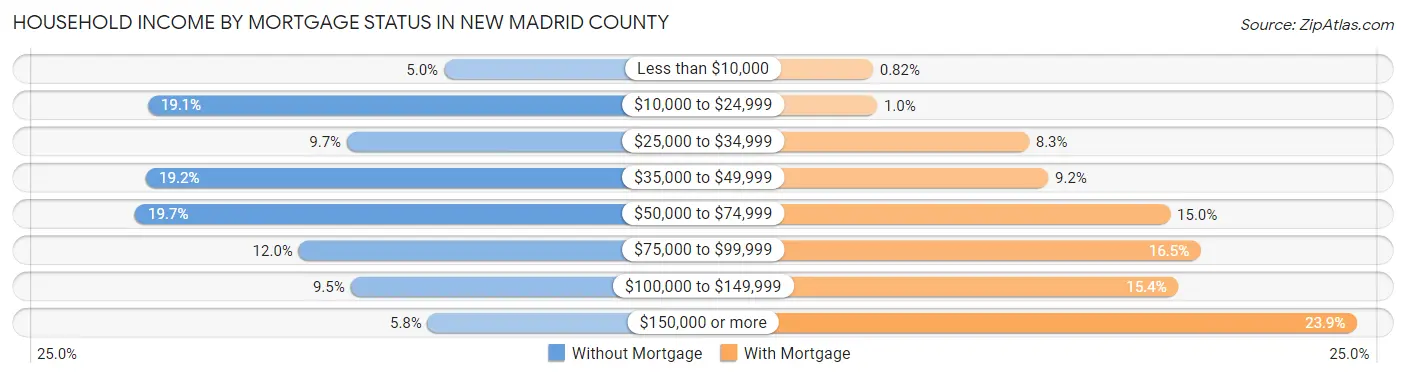
| Household Income | Without Mortgage | With Mortgage |
| Less than $10,000 | 122 (5.0%) | 16 (0.8%) |
| $10,000 to $24,999 | 464 (19.1%) | 20 (1.0%) |
| $25,000 to $34,999 | 234 (9.7%) | 162 (8.3%) |
| $35,000 to $49,999 | 466 (19.2%) | 180 (9.2%) |
| $50,000 to $74,999 | 479 (19.7%) | 294 (15.0%) |
| $75,000 to $99,999 | 290 (11.9%) | 323 (16.5%) |
| $100,000 to $149,999 | 230 (9.5%) | 302 (15.4%) |
| $150,000 or more | 141 (5.8%) | 469 (23.9%) |
| Total | 2,426 (100.0%) | 1,963 (100.0%) |
Property Value to Household Income Ratio in New Madrid County
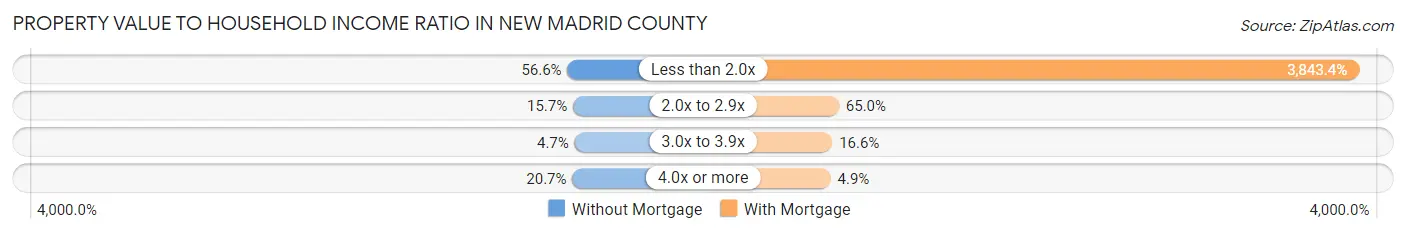
| Value-to-Income Ratio | Without Mortgage | With Mortgage |
| Less than 2.0x | 1,372 (56.6%) | 75,446 (3,843.4%) |
| 2.0x to 2.9x | 380 (15.7%) | 1,276 (65.0%) |
| 3.0x to 3.9x | 113 (4.7%) | 325 (16.6%) |
| 4.0x or more | 501 (20.6%) | 96 (4.9%) |
| Total | 2,426 (100.0%) | 1,963 (100.0%) |
Real Estate Taxes by Mortgage Status in New Madrid County
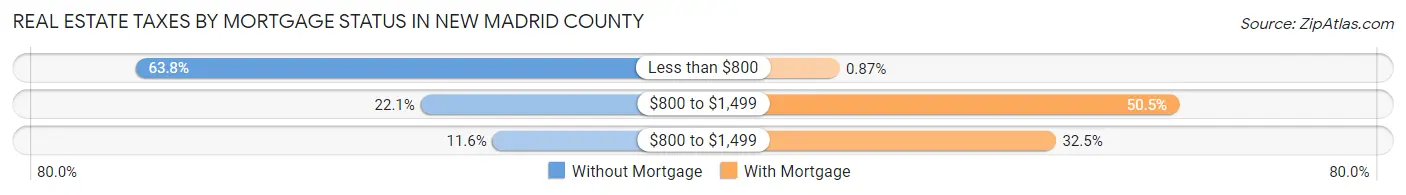
| Property Taxes | Without Mortgage | With Mortgage |
| Less than $800 | 1,547 (63.8%) | 17 (0.9%) |
| $800 to $1,499 | 537 (22.1%) | 992 (50.5%) |
| $800 to $1,499 | 282 (11.6%) | 638 (32.5%) |
| Total | 2,426 (100.0%) | 1,963 (100.0%) |
Health & Disability in New Madrid County
Health Insurance Coverage by Age in New Madrid County
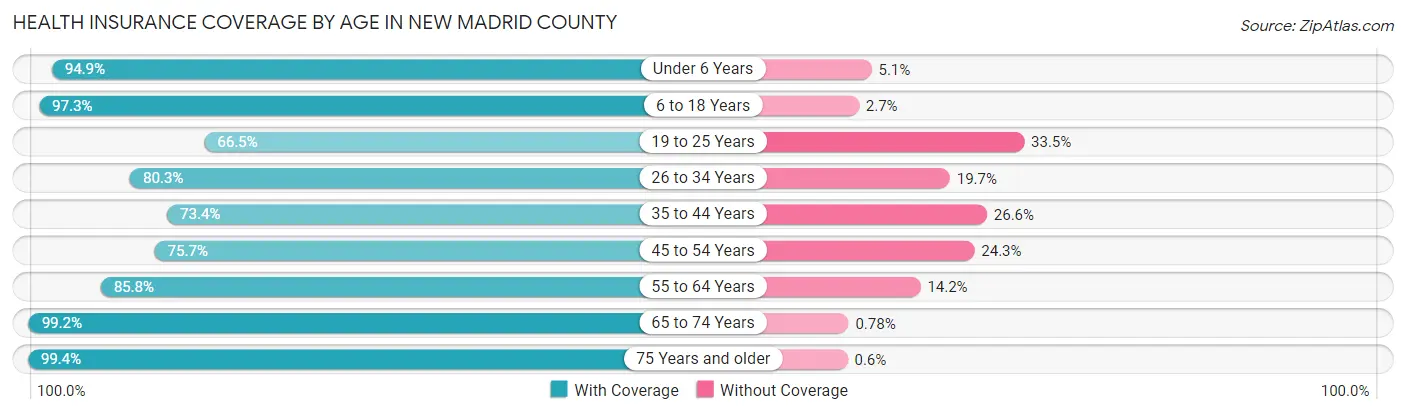
| Age Bracket | With Coverage | Without Coverage |
| Under 6 Years | 1,232 (94.9%) | 66 (5.1%) |
| 6 to 18 Years | 2,649 (97.3%) | 74 (2.7%) |
| 19 to 25 Years | 884 (66.5%) | 446 (33.5%) |
| 26 to 34 Years | 1,221 (80.3%) | 299 (19.7%) |
| 35 to 44 Years | 1,342 (73.4%) | 486 (26.6%) |
| 45 to 54 Years | 1,555 (75.7%) | 498 (24.3%) |
| 55 to 64 Years | 1,945 (85.8%) | 322 (14.2%) |
| 65 to 74 Years | 1,786 (99.2%) | 14 (0.8%) |
| 75 Years and older | 1,161 (99.4%) | 7 (0.6%) |
| Total | 13,775 (86.2%) | 2,212 (13.8%) |
Health Insurance Coverage by Citizenship Status in New Madrid County
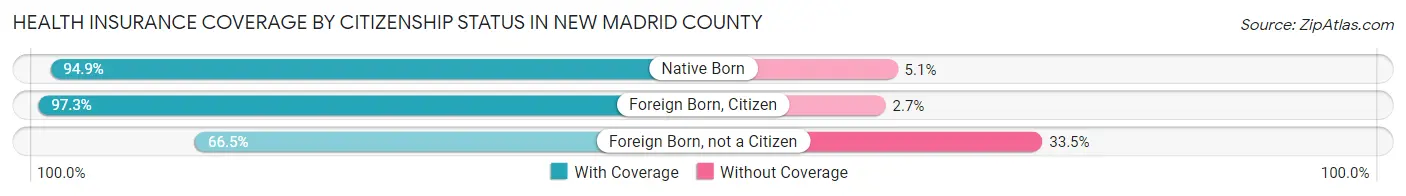
| Citizenship Status | With Coverage | Without Coverage |
| Native Born | 1,232 (94.9%) | 66 (5.1%) |
| Foreign Born, Citizen | 2,649 (97.3%) | 74 (2.7%) |
| Foreign Born, not a Citizen | 884 (66.5%) | 446 (33.5%) |
Health Insurance Coverage by Household Income in New Madrid County
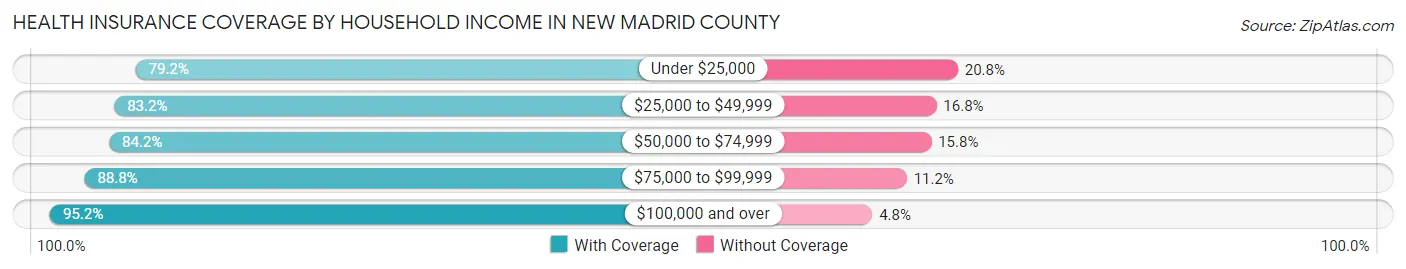
| Household Income | With Coverage | Without Coverage |
| Under $25,000 | 2,387 (79.2%) | 627 (20.8%) |
| $25,000 to $49,999 | 3,301 (83.2%) | 666 (16.8%) |
| $50,000 to $74,999 | 2,672 (84.2%) | 502 (15.8%) |
| $75,000 to $99,999 | 1,923 (88.8%) | 243 (11.2%) |
| $100,000 and over | 3,482 (95.2%) | 174 (4.8%) |
Public vs Private Health Insurance Coverage by Age in New Madrid County
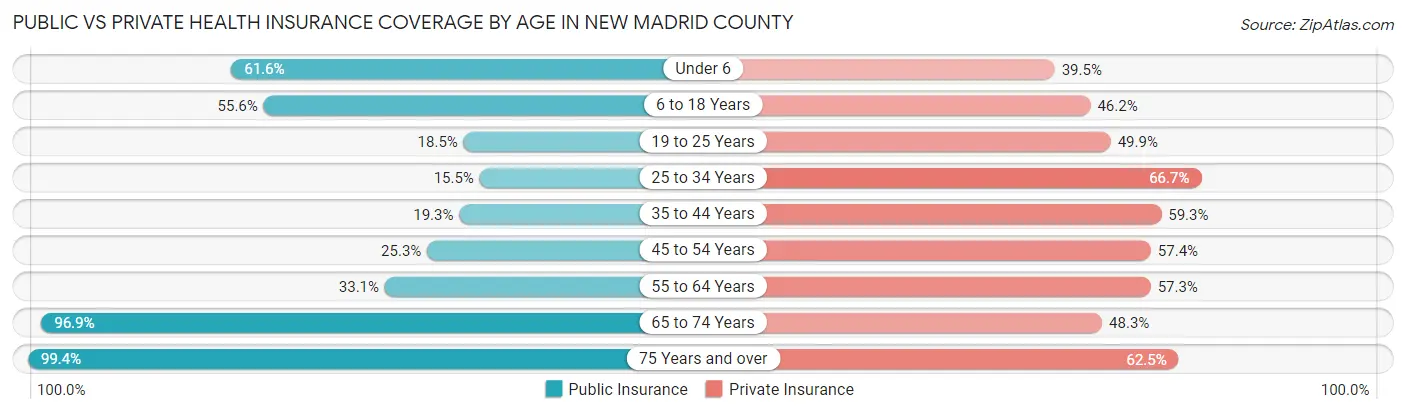
| Age Bracket | Public Insurance | Private Insurance |
| Under 6 | 800 (61.6%) | 513 (39.5%) |
| 6 to 18 Years | 1,515 (55.6%) | 1,257 (46.2%) |
| 19 to 25 Years | 246 (18.5%) | 664 (49.9%) |
| 25 to 34 Years | 236 (15.5%) | 1,014 (66.7%) |
| 35 to 44 Years | 353 (19.3%) | 1,084 (59.3%) |
| 45 to 54 Years | 519 (25.3%) | 1,178 (57.4%) |
| 55 to 64 Years | 751 (33.1%) | 1,300 (57.3%) |
| 65 to 74 Years | 1,744 (96.9%) | 870 (48.3%) |
| 75 Years and over | 1,161 (99.4%) | 730 (62.5%) |
| Total | 7,325 (45.8%) | 8,610 (53.9%) |
Disability Status by Sex by Age in New Madrid County
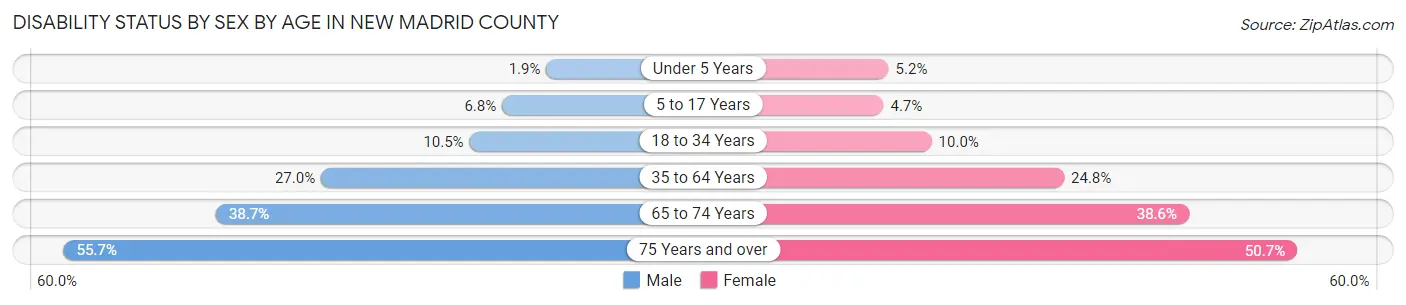
| Age Bracket | Male | Female |
| Under 5 Years | 10 (1.9%) | 27 (5.2%) |
| 5 to 17 Years | 97 (6.8%) | 64 (4.6%) |
| 18 to 34 Years | 152 (10.5%) | 158 (10.0%) |
| 35 to 64 Years | 796 (27.0%) | 792 (24.8%) |
| 65 to 74 Years | 320 (38.7%) | 376 (38.6%) |
| 75 Years and over | 246 (55.7%) | 368 (50.7%) |
Disability Class by Sex by Age in New Madrid County
Disability Class: Hearing Difficulty
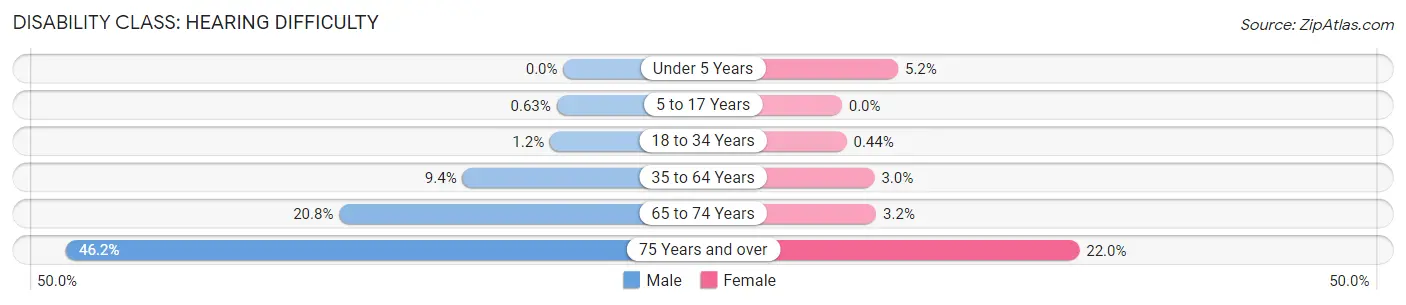
| Age Bracket | Male | Female |
| Under 5 Years | 0 (0.0%) | 27 (5.2%) |
| 5 to 17 Years | 9 (0.6%) | 0 (0.0%) |
| 18 to 34 Years | 18 (1.2%) | 7 (0.4%) |
| 35 to 64 Years | 276 (9.4%) | 97 (3.0%) |
| 65 to 74 Years | 172 (20.8%) | 31 (3.2%) |
| 75 Years and over | 204 (46.2%) | 160 (22.0%) |
Disability Class: Vision Difficulty
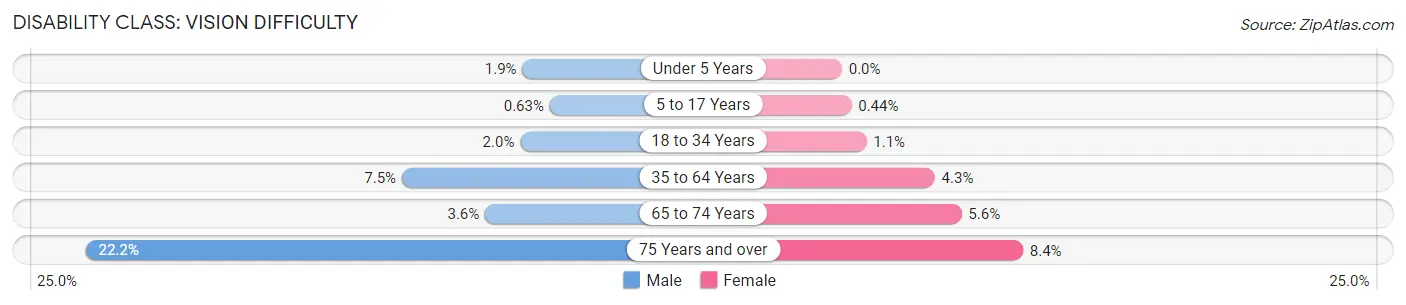
| Age Bracket | Male | Female |
| Under 5 Years | 10 (1.9%) | 0 (0.0%) |
| 5 to 17 Years | 9 (0.6%) | 6 (0.4%) |
| 18 to 34 Years | 29 (2.0%) | 18 (1.1%) |
| 35 to 64 Years | 221 (7.5%) | 138 (4.3%) |
| 65 to 74 Years | 30 (3.6%) | 54 (5.6%) |
| 75 Years and over | 98 (22.2%) | 61 (8.4%) |
Disability Class: Cognitive Difficulty
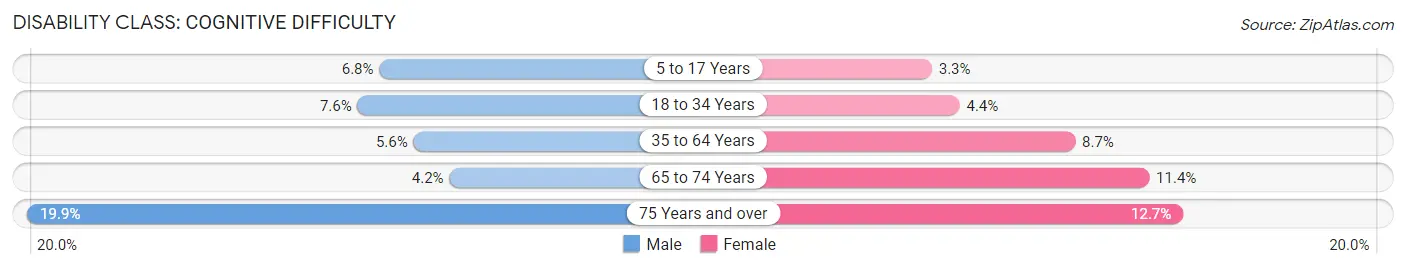
| Age Bracket | Male | Female |
| 5 to 17 Years | 97 (6.8%) | 46 (3.3%) |
| 18 to 34 Years | 111 (7.6%) | 69 (4.4%) |
| 35 to 64 Years | 164 (5.6%) | 277 (8.7%) |
| 65 to 74 Years | 35 (4.2%) | 111 (11.4%) |
| 75 Years and over | 88 (19.9%) | 92 (12.7%) |
Disability Class: Ambulatory Difficulty
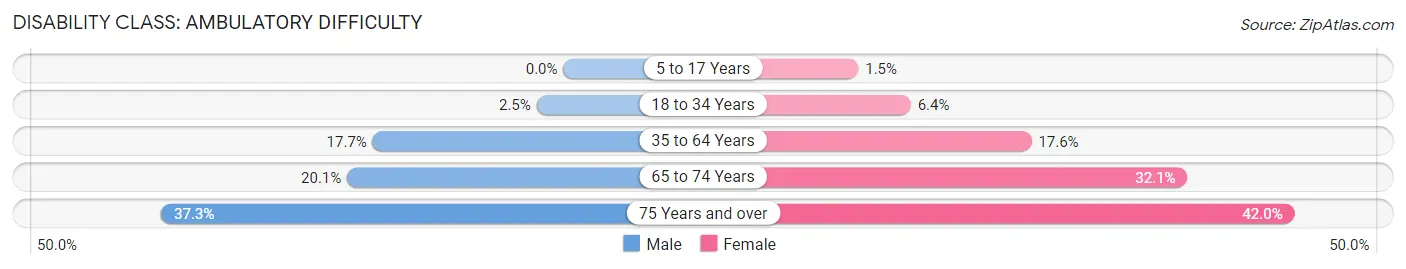
| Age Bracket | Male | Female |
| 5 to 17 Years | 0 (0.0%) | 21 (1.5%) |
| 18 to 34 Years | 36 (2.5%) | 101 (6.4%) |
| 35 to 64 Years | 522 (17.7%) | 563 (17.6%) |
| 65 to 74 Years | 166 (20.1%) | 312 (32.1%) |
| 75 Years and over | 165 (37.3%) | 305 (42.0%) |
Disability Class: Self-Care Difficulty
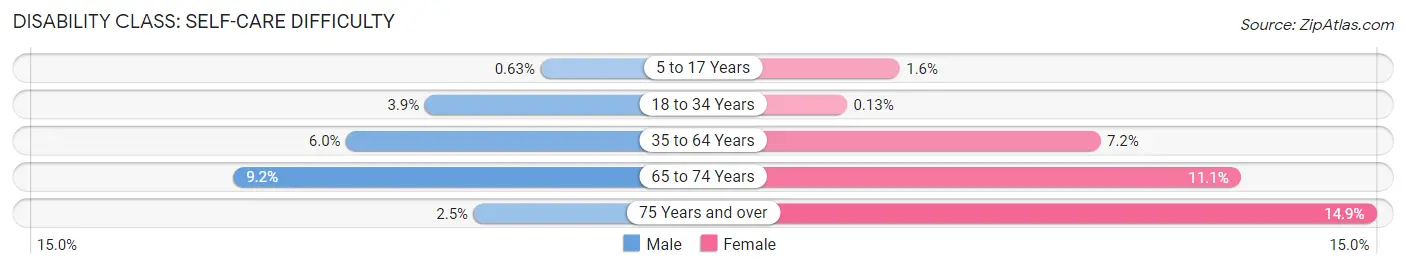
| Age Bracket | Male | Female |
| 5 to 17 Years | 9 (0.6%) | 22 (1.6%) |
| 18 to 34 Years | 56 (3.8%) | 2 (0.1%) |
| 35 to 64 Years | 178 (6.0%) | 230 (7.2%) |
| 65 to 74 Years | 76 (9.2%) | 108 (11.1%) |
| 75 Years and over | 11 (2.5%) | 108 (14.9%) |
Technology Access in New Madrid County
Computing Device Access in New Madrid County
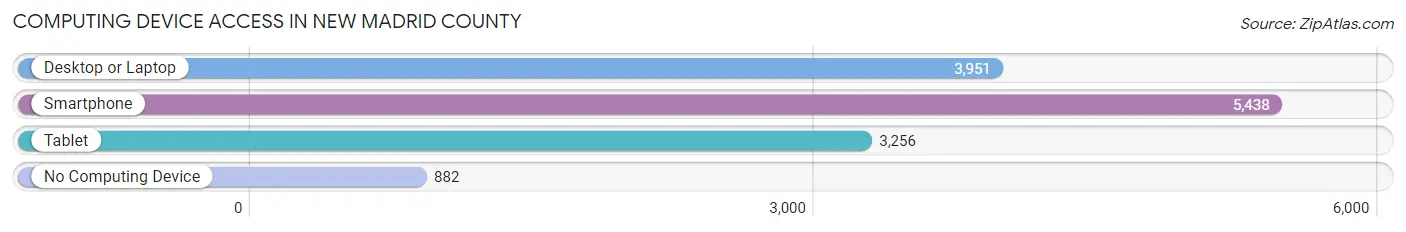
| Device Type | # Households | % Households |
| Desktop or Laptop | 3,951 | 58.4% |
| Smartphone | 5,438 | 80.3% |
| Tablet | 3,256 | 48.1% |
| No Computing Device | 882 | 13.0% |
| Total | 6,769 | 100.0% |
Internet Access in New Madrid County
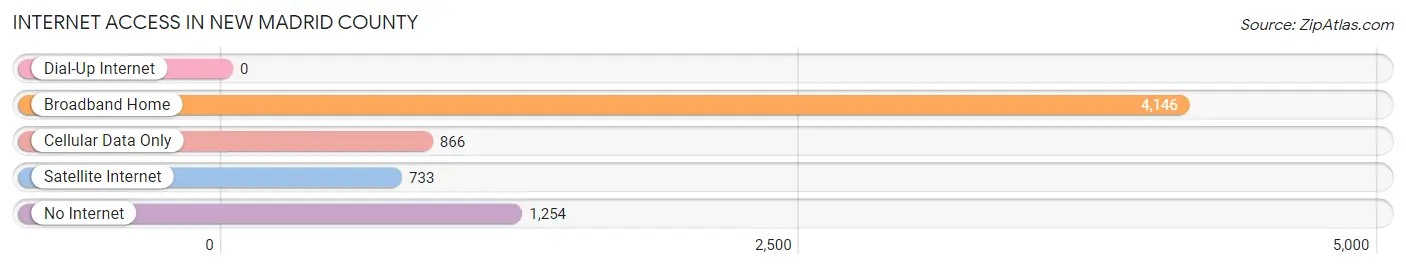
| Internet Type | # Households | % Households |
| Dial-Up Internet | 0 | 0.0% |
| Broadband Home | 4,146 | 61.3% |
| Cellular Data Only | 866 | 12.8% |
| Satellite Internet | 733 | 10.8% |
| No Internet | 1,254 | 18.5% |
| Total | 6,769 | 100.0% |
New Madrid County Summary
New Madrid County is located in the southeastern corner of Missouri, and is part of the Bootheel region. It is bordered by Mississippi County to the north, Scott County to the east, Pemiscot County to the south, and Stoddard County to the west. The county seat is New Madrid, and the county was named after the city, which was named after the Spanish city of Madrid.
History
The area that is now New Madrid County was first inhabited by Native Americans, including the Osage, Chickasaw, and Shawnee tribes. The first European settlers arrived in the area in the late 1700s, and the county was officially established in 1812. The county was initially part of the Louisiana Purchase, and was part of the Missouri Territory until 1821, when it became part of the state of Missouri.
During the Civil War, the county was the site of several battles, including the Battle of Island Number Ten, which was fought in 1862. The county was also the site of the New Madrid Earthquake of 1811-1812, which was one of the most powerful earthquakes ever recorded in the United States.
Geography
New Madrid County covers an area of 576 square miles, and is located in the southeastern corner of Missouri. The county is mostly flat, with some rolling hills in the northern part of the county. The county is drained by the Mississippi River, which forms its eastern border. The county is also home to several lakes, including Clearwater Lake, Lake Wappapello, and Lake Taneycomo.
The county has a humid subtropical climate, with hot, humid summers and mild winters. The average annual temperature is around 60 degrees Fahrenheit, and the average annual precipitation is around 45 inches.
Economy
The economy of New Madrid County is largely based on agriculture, with corn, soybeans, and cotton being the main crops. The county is also home to several manufacturing companies, including a steel mill and a paper mill. Tourism is also an important part of the economy, with several state parks and recreational areas located in the county.
Demographics
As of the 2010 census, the population of New Madrid County was 18,956. The population is mostly white (86.3%), with small percentages of African Americans (10.2%), Hispanics (2.2%), and Native Americans (0.7%). The median household income is $37,945, and the median home value is $90,400.
The county is served by several school districts, including the New Madrid County R-1 School District, the New Madrid County R-2 School District, and the New Madrid County R-3 School District. The county is also home to several higher education institutions, including Three Rivers College and Southeast Missouri State University.
Conclusion
New Madrid County is a rural county located in the southeastern corner of Missouri. The county is mostly agricultural, with corn, soybeans, and cotton being the main crops. The county is also home to several manufacturing companies, and tourism is an important part of the economy. The population of the county is mostly white, with small percentages of African Americans, Hispanics, and Native Americans. The county is served by several school districts, and is home to several higher education institutions.
Common Questions
What is Per Capita Income in New Madrid County?
Per Capita income in New Madrid County is $26,357.
What is the Median Family Income in New Madrid County?
Median Family Income in New Madrid County is $60,033.
What is the Median Household income in New Madrid County?
Median Household Income in New Madrid County is $44,092.
What is Income or Wage Gap in New Madrid County?
Income or Wage Gap in New Madrid County is 30.4%.
Women in New Madrid County earn 69.6 cents for every dollar earned by a man.
What is Family Income Deficit in New Madrid County?
Family Income Deficit in New Madrid County is $10,240.
Families that are below poverty line in New Madrid County earn $10,240 less on average than the poverty threshold level.
What is Inequality or Gini Index in New Madrid County?
Inequality or Gini Index in New Madrid County is 0.46.
What is the Total Population of New Madrid County?
Total Population of New Madrid County is 16,341.
What is the Total Male Population of New Madrid County?
Total Male Population of New Madrid County is 7,817.
What is the Total Female Population of New Madrid County?
Total Female Population of New Madrid County is 8,524.
What is the Ratio of Males per 100 Females in New Madrid County?
There are 91.71 Males per 100 Females in New Madrid County.
What is the Ratio of Females per 100 Males in New Madrid County?
There are 109.04 Females per 100 Males in New Madrid County.
What is the Median Population Age in New Madrid County?
Median Population Age in New Madrid County is 41.8 Years.
What is the Average Family Size in New Madrid County
Average Family Size in New Madrid County is 3.0 People.
What is the Average Household Size in New Madrid County
Average Household Size in New Madrid County is 2.4 People.
How Large is the Labor Force in New Madrid County?
There are 6,782 People in the Labor Forcein in New Madrid County.
What is the Percentage of People in the Labor Force in New Madrid County?
52.4% of People are in the Labor Force in New Madrid County.
What is the Unemployment Rate in New Madrid County?
Unemployment Rate in New Madrid County is 4.0%.