Montgomery County, MO Map & Demographics
Montgomery County Map
Montgomery County Overview
$29,570
PER CAPITA INCOME
$74,714
AVG FAMILY INCOME
$58,660
AVG HOUSEHOLD INCOME
34.1%
WAGE / INCOME GAP [ % ]
65.9¢/ $1
WAGE / INCOME GAP [ $ ]
$11,824
FAMILY INCOME DEFICIT
0.43
INEQUALITY / GINI INDEX
11,421
TOTAL POPULATION
5,756
MALE POPULATION
5,665
FEMALE POPULATION
101.61
MALES / 100 FEMALES
98.42
FEMALES / 100 MALES
43.8
MEDIAN AGE
3.0
AVG FAMILY SIZE
2.4
AVG HOUSEHOLD SIZE
5,283
LABOR FORCE [ PEOPLE ]
57.5%
PERCENT IN LABOR FORCE
3.0%
UNEMPLOYMENT RATE
Income in Montgomery County
Income Overview in Montgomery County
Per Capita Income in Montgomery County is $29,570, while median incomes of families and households are $74,714 and $58,660 respectively.
| Characteristic | Number | Measure |
| Per Capita Income | 11,421 | $29,570 |
| Median Family Income | 3,040 | $74,714 |
| Mean Family Income | 3,040 | $87,541 |
| Median Household Income | 4,644 | $58,660 |
| Mean Household Income | 4,644 | $71,653 |
| Income Deficit | 3,040 | $11,824 |
| Wage / Income Gap (%) | 11,421 | 34.07% |
| Wage / Income Gap ($) | 11,421 | 65.93¢ per $1 |
| Gini / Inequality Index | 11,421 | 0.43 |
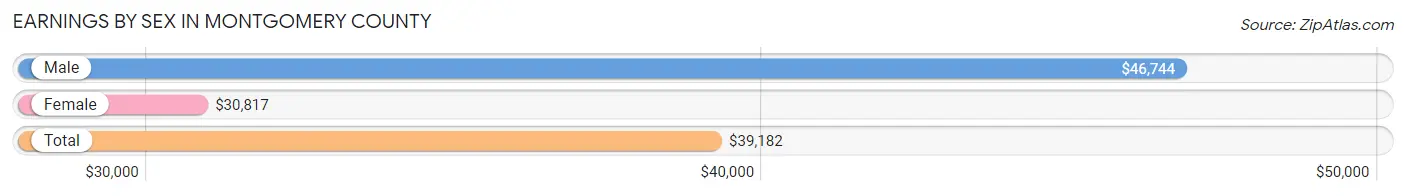
Earnings by Sex in Montgomery County
Average Earnings in Montgomery County are $39,182, $46,744 for men and $30,817 for women, a difference of 34.1%.
| Sex | Number | Average Earnings |
| Male | 2,937 (52.9%) | $46,744 |
| Female | 2,612 (47.1%) | $30,817 |
| Total | 5,549 (100.0%) | $39,182 |
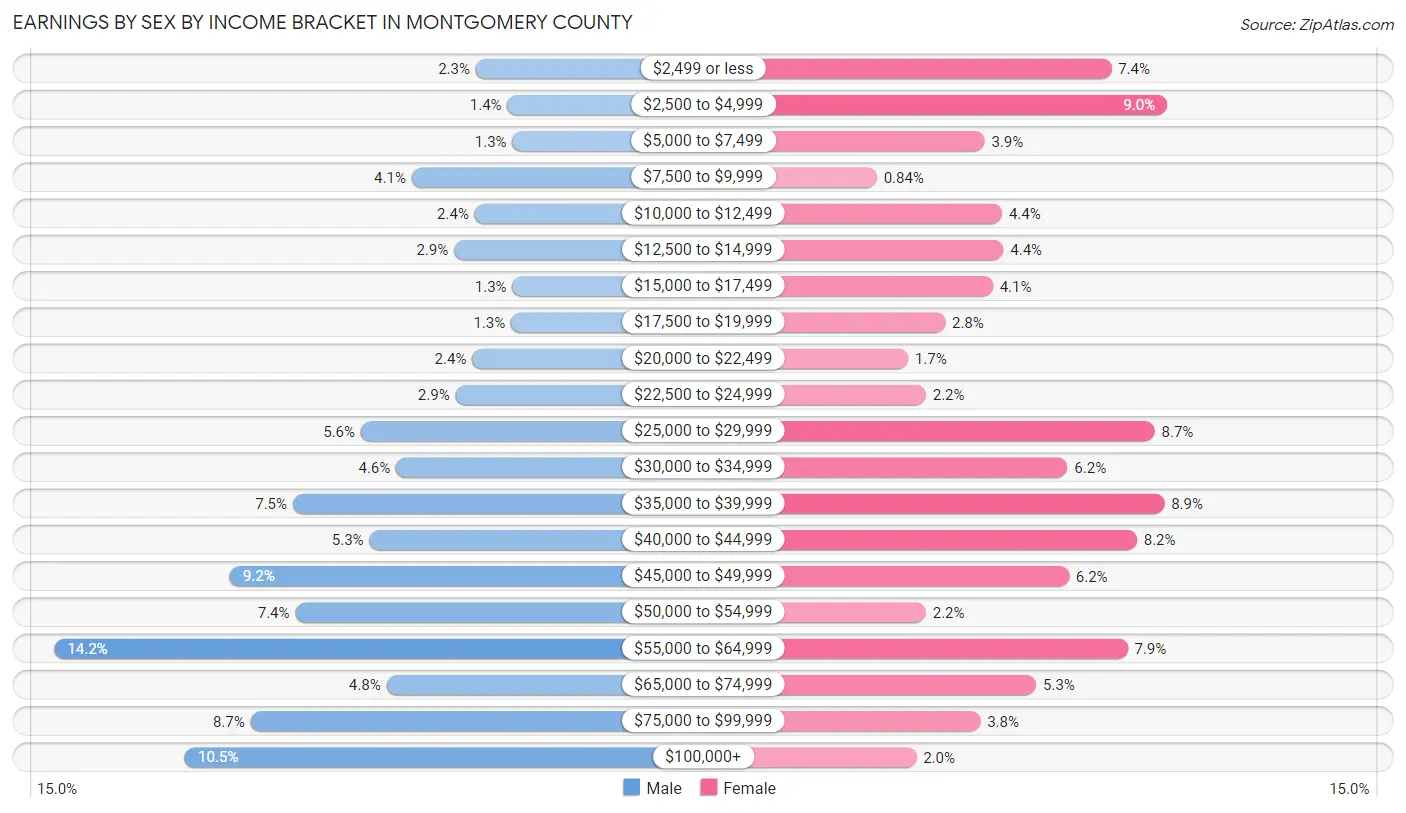
Earnings by Sex by Income Bracket in Montgomery County
The most common earnings brackets in Montgomery County are $55,000 to $64,999 for men (416 | 14.2%) and $2,500 to $4,999 for women (235 | 9.0%).
| Income | Male | Female |
| $2,499 or less | 68 (2.3%) | 194 (7.4%) |
| $2,500 to $4,999 | 42 (1.4%) | 235 (9.0%) |
| $5,000 to $7,499 | 38 (1.3%) | 101 (3.9%) |
| $7,500 to $9,999 | 121 (4.1%) | 22 (0.8%) |
| $10,000 to $12,499 | 69 (2.4%) | 114 (4.4%) |
| $12,500 to $14,999 | 86 (2.9%) | 115 (4.4%) |
| $15,000 to $17,499 | 38 (1.3%) | 107 (4.1%) |
| $17,500 to $19,999 | 39 (1.3%) | 72 (2.8%) |
| $20,000 to $22,499 | 71 (2.4%) | 45 (1.7%) |
| $22,500 to $24,999 | 85 (2.9%) | 58 (2.2%) |
| $25,000 to $29,999 | 163 (5.6%) | 226 (8.6%) |
| $30,000 to $34,999 | 134 (4.6%) | 162 (6.2%) |
| $35,000 to $39,999 | 219 (7.5%) | 233 (8.9%) |
| $40,000 to $44,999 | 156 (5.3%) | 213 (8.2%) |
| $45,000 to $49,999 | 271 (9.2%) | 163 (6.2%) |
| $50,000 to $54,999 | 217 (7.4%) | 58 (2.2%) |
| $55,000 to $64,999 | 416 (14.2%) | 206 (7.9%) |
| $65,000 to $74,999 | 142 (4.8%) | 139 (5.3%) |
| $75,000 to $99,999 | 254 (8.6%) | 98 (3.7%) |
| $100,000+ | 308 (10.5%) | 51 (1.9%) |
| Total | 2,937 (100.0%) | 2,612 (100.0%) |
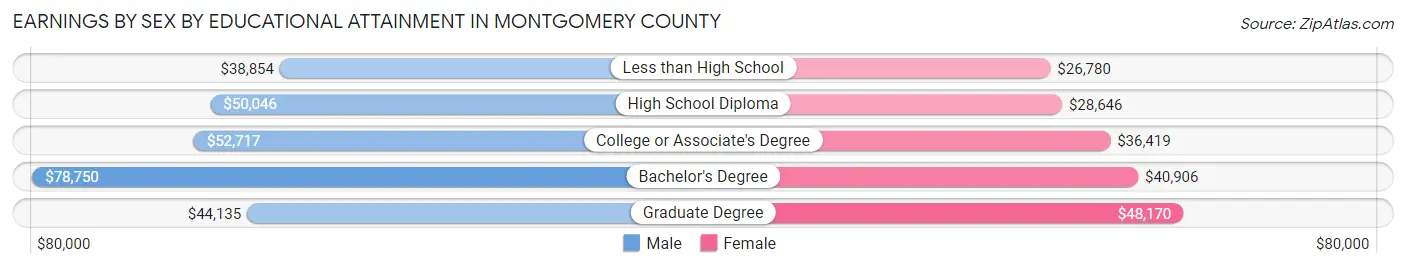
Earnings by Sex by Educational Attainment in Montgomery County
Average earnings in Montgomery County are $50,649 for men and $36,364 for women, a difference of 28.2%. Men with an educational attainment of bachelor's degree enjoy the highest average annual earnings of $78,750, while those with less than high school education earn the least with $38,854. Women with an educational attainment of graduate degree earn the most with the average annual earnings of $48,170, while those with less than high school education have the smallest earnings of $26,780.
| Educational Attainment | Male Income | Female Income |
| Less than High School | $38,854 | $26,780 |
| High School Diploma | $50,046 | $28,646 |
| College or Associate's Degree | $52,717 | $36,419 |
| Bachelor's Degree | $78,750 | $40,906 |
| Graduate Degree | $44,135 | $48,170 |
| Total | $50,649 | $36,364 |
Family Income in Montgomery County
Family Income Brackets in Montgomery County
According to the Montgomery County family income data, there are 608 families falling into the $50,000 to $74,999 income range, which is the most common income bracket and makes up 20.0% of all families. Conversely, the less than $10,000 income bracket is the least frequent group with only 76 families (2.5%) belonging to this category.
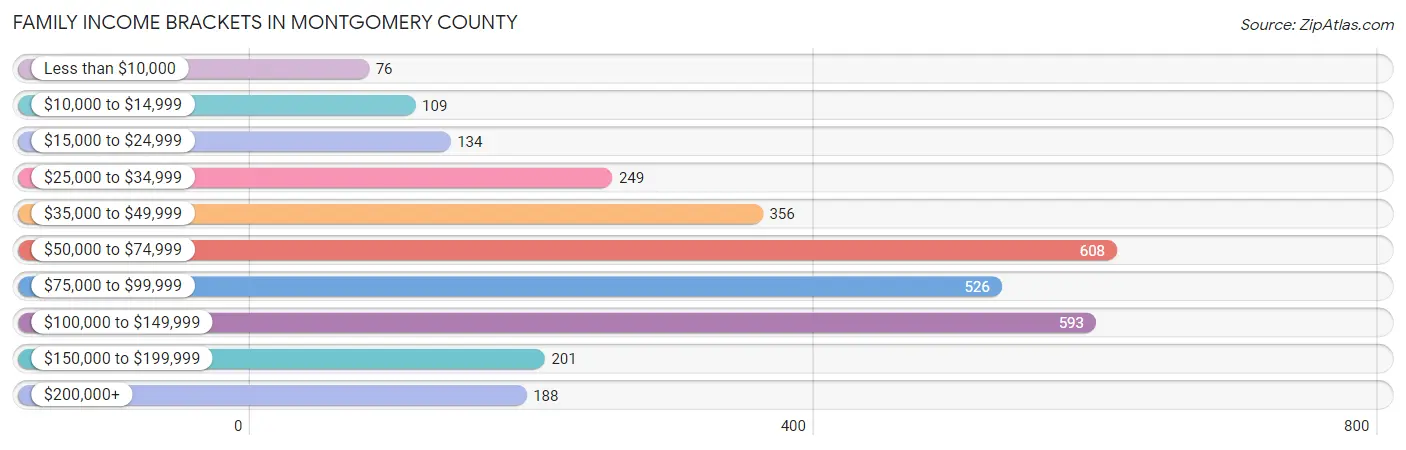
| Income Bracket | # Families | % Families |
| Less than $10,000 | 76 | 2.5% |
| $10,000 to $14,999 | 109 | 3.6% |
| $15,000 to $24,999 | 134 | 4.4% |
| $25,000 to $34,999 | 249 | 8.2% |
| $35,000 to $49,999 | 356 | 11.7% |
| $50,000 to $74,999 | 608 | 20.0% |
| $75,000 to $99,999 | 526 | 17.3% |
| $100,000 to $149,999 | 593 | 19.5% |
| $150,000 to $199,999 | 201 | 6.6% |
| $200,000+ | 188 | 6.2% |
Family Income by Famaliy Size in Montgomery County
7+ person families (11 | 0.4%) account for the highest median family income in Montgomery County with $118,281 per family, while 2-person families (1,532 | 50.4%) have the highest median income of $33,828 per family member.
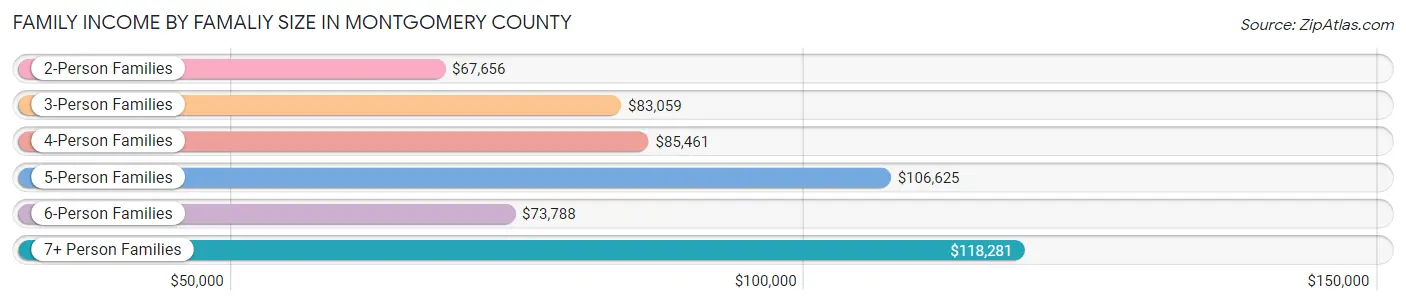
| Income Bracket | # Families | Median Income |
| 2-Person Families | 1,532 (50.4%) | $67,656 |
| 3-Person Families | 601 (19.8%) | $83,059 |
| 4-Person Families | 449 (14.8%) | $85,461 |
| 5-Person Families | 337 (11.1%) | $106,625 |
| 6-Person Families | 110 (3.6%) | $73,788 |
| 7+ Person Families | 11 (0.4%) | $118,281 |
| Total | 3,040 (100.0%) | $74,714 |
Family Income by Number of Earners in Montgomery County
The median family income in Montgomery County is $74,714, with families comprising 3+ earners (230) having the highest median family income of $147,857, while families with no earners (550) have the lowest median family income of $39,872, accounting for 7.6% and 18.1% of families, respectively.
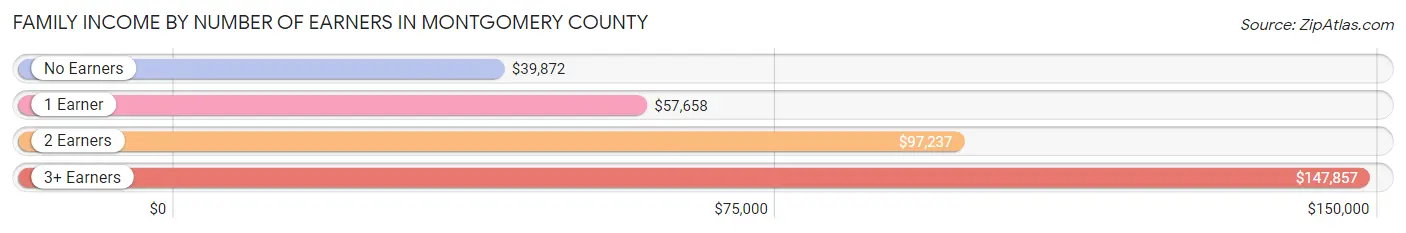
| Number of Earners | # Families | Median Income |
| No Earners | 550 (18.1%) | $39,872 |
| 1 Earner | 1,018 (33.5%) | $57,658 |
| 2 Earners | 1,242 (40.9%) | $97,237 |
| 3+ Earners | 230 (7.6%) | $147,857 |
| Total | 3,040 (100.0%) | $74,714 |
Household Income in Montgomery County
Household Income Brackets in Montgomery County
With 822 households falling in the category, the $50,000 to $74,999 income range is the most frequent in Montgomery County, accounting for 17.7% of all households. In contrast, only 195 households (4.2%) fall into the $200,000+ income bracket, making it the least populous group.
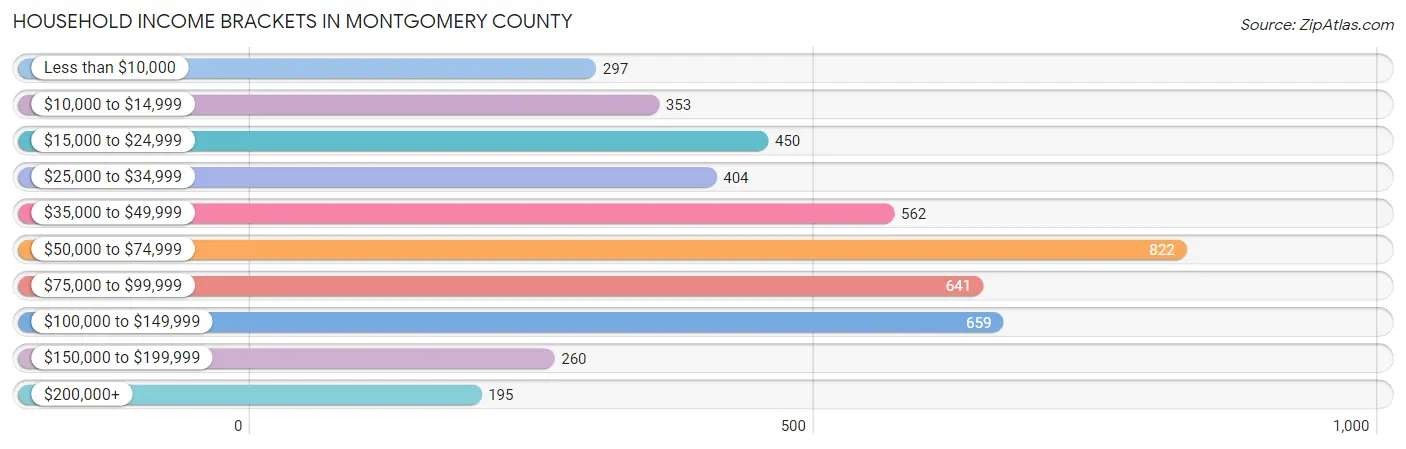
| Income Bracket | # Households | % Households |
| Less than $10,000 | 297 | 6.4% |
| $10,000 to $14,999 | 353 | 7.6% |
| $15,000 to $24,999 | 450 | 9.7% |
| $25,000 to $34,999 | 404 | 8.7% |
| $35,000 to $49,999 | 562 | 12.1% |
| $50,000 to $74,999 | 822 | 17.7% |
| $75,000 to $99,999 | 641 | 13.8% |
| $100,000 to $149,999 | 659 | 14.2% |
| $150,000 to $199,999 | 260 | 5.6% |
| $200,000+ | 195 | 4.2% |
Household Income by Householder Age in Montgomery County
The median household income in Montgomery County is $58,660, with the highest median household income of $73,268 found in the 45 to 64 years age bracket for the primary householder. A total of 1,839 households (39.6%) fall into this category. Meanwhile, the 15 to 24 years age bracket for the primary householder has the lowest median household income of $0, with 219 households (4.7%) in this group.
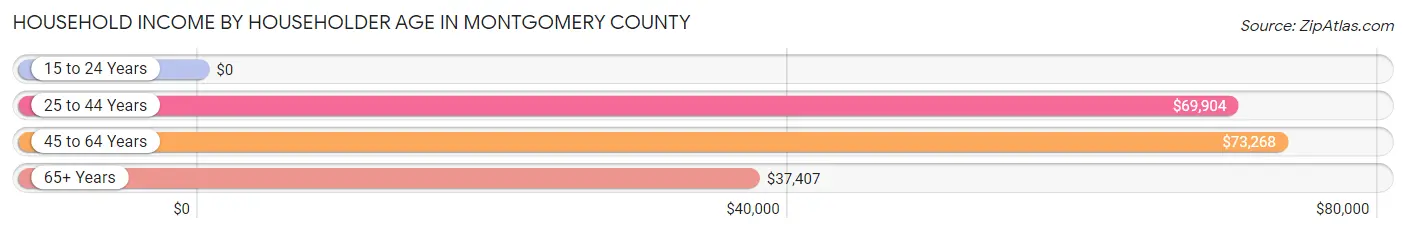
| Income Bracket | # Households | Median Income |
| 15 to 24 Years | 219 (4.7%) | $0 |
| 25 to 44 Years | 1,188 (25.6%) | $69,904 |
| 45 to 64 Years | 1,839 (39.6%) | $73,268 |
| 65+ Years | 1,398 (30.1%) | $37,407 |
| Total | 4,644 (100.0%) | $58,660 |
Poverty in Montgomery County
Income Below Poverty by Sex and Age in Montgomery County
With 14.8% poverty level for males and 14.8% for females among the residents of Montgomery County, 12 to 14 year old males and 18 to 24 year old females are the most vulnerable to poverty, with 49 males (39.8%) and 123 females (29.2%) in their respective age groups living below the poverty level.
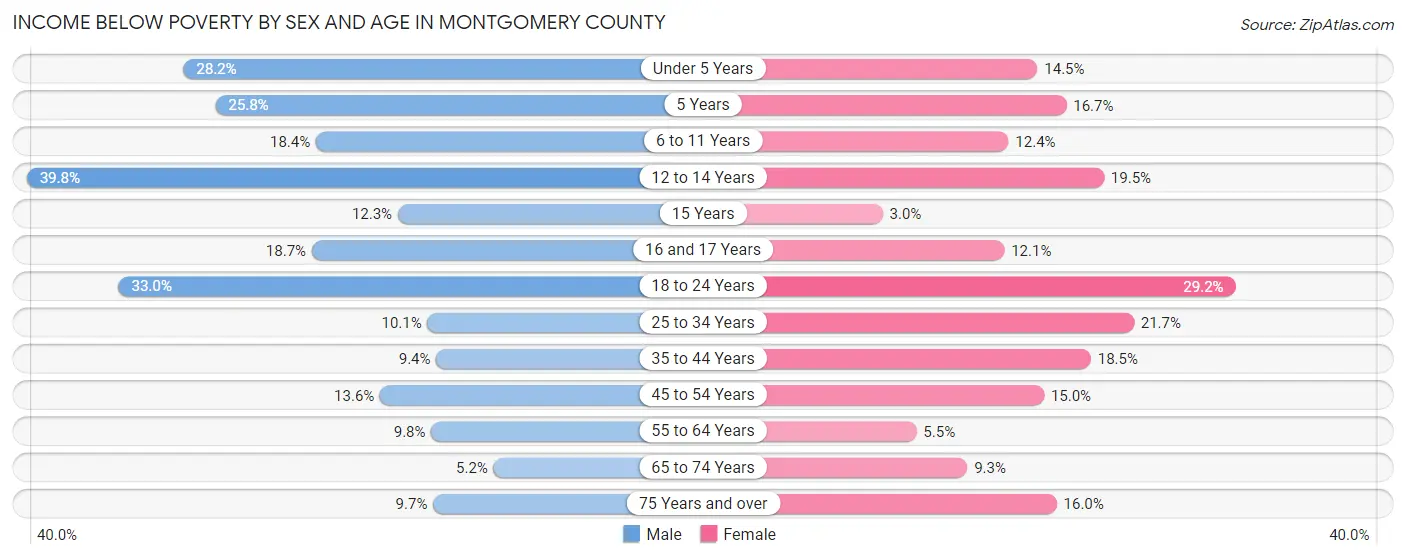
| Age Bracket | Male | Female |
| Under 5 Years | 99 (28.2%) | 45 (14.5%) |
| 5 Years | 39 (25.8%) | 7 (16.7%) |
| 6 to 11 Years | 85 (18.4%) | 47 (12.4%) |
| 12 to 14 Years | 49 (39.8%) | 36 (19.5%) |
| 15 Years | 14 (12.3%) | 2 (3.0%) |
| 16 and 17 Years | 31 (18.7%) | 17 (12.1%) |
| 18 to 24 Years | 140 (33.0%) | 123 (29.2%) |
| 25 to 34 Years | 61 (10.1%) | 121 (21.7%) |
| 35 to 44 Years | 58 (9.4%) | 127 (18.5%) |
| 45 to 54 Years | 96 (13.6%) | 104 (15.0%) |
| 55 to 64 Years | 84 (9.8%) | 50 (5.5%) |
| 65 to 74 Years | 32 (5.2%) | 58 (9.3%) |
| 75 Years and over | 37 (9.7%) | 82 (16.0%) |
| Total | 825 (14.8%) | 819 (14.8%) |
Income Above Poverty by Sex and Age in Montgomery County
According to the poverty statistics in Montgomery County, males aged 65 to 74 years and females aged 15 years are the age groups that are most secure financially, with 94.8% of males and 97.0% of females in these age groups living above the poverty line.
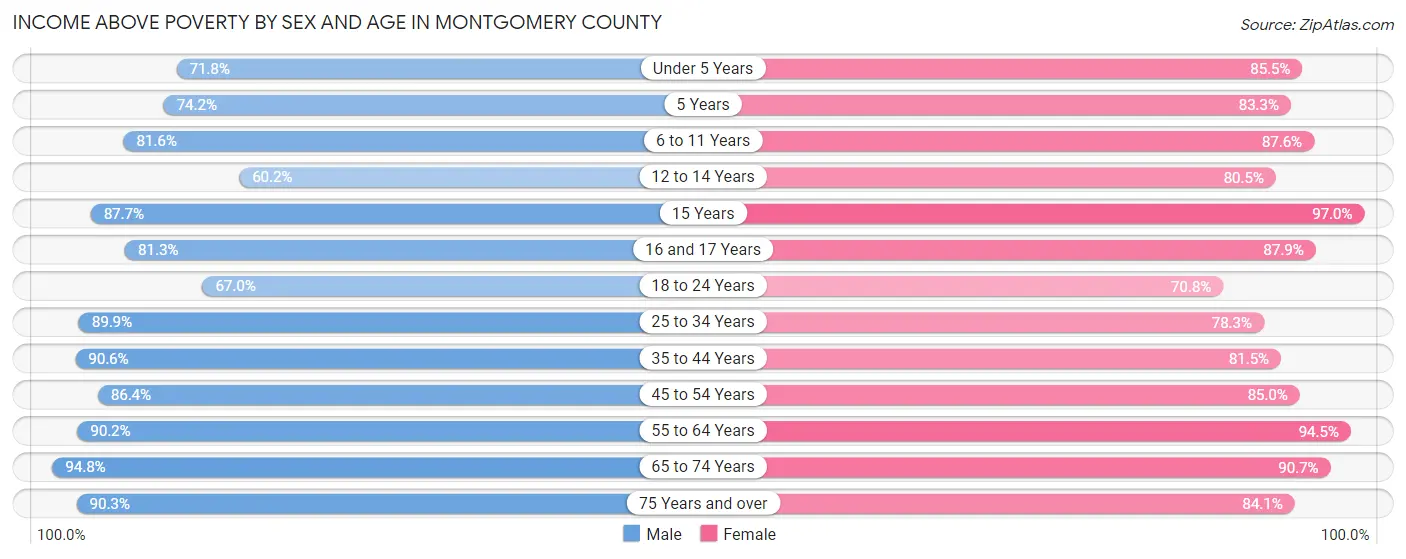
| Age Bracket | Male | Female |
| Under 5 Years | 252 (71.8%) | 265 (85.5%) |
| 5 Years | 112 (74.2%) | 35 (83.3%) |
| 6 to 11 Years | 378 (81.6%) | 333 (87.6%) |
| 12 to 14 Years | 74 (60.2%) | 149 (80.5%) |
| 15 Years | 100 (87.7%) | 64 (97.0%) |
| 16 and 17 Years | 135 (81.3%) | 124 (87.9%) |
| 18 to 24 Years | 284 (67.0%) | 298 (70.8%) |
| 25 to 34 Years | 544 (89.9%) | 437 (78.3%) |
| 35 to 44 Years | 557 (90.6%) | 560 (81.5%) |
| 45 to 54 Years | 610 (86.4%) | 589 (85.0%) |
| 55 to 64 Years | 773 (90.2%) | 853 (94.5%) |
| 65 to 74 Years | 587 (94.8%) | 565 (90.7%) |
| 75 Years and over | 346 (90.3%) | 432 (84.1%) |
| Total | 4,752 (85.2%) | 4,704 (85.2%) |
Income Below Poverty Among Married-Couple Families in Montgomery County
The poverty statistics for married-couple families in Montgomery County show that 5.1% or 120 of the total 2,339 families live below the poverty line. Families with 3 or 4 children have the highest poverty rate of 12.4%, comprising of 26 families. On the other hand, families with 5 or more children have the lowest poverty rate of 0.0%, which includes 0 families.
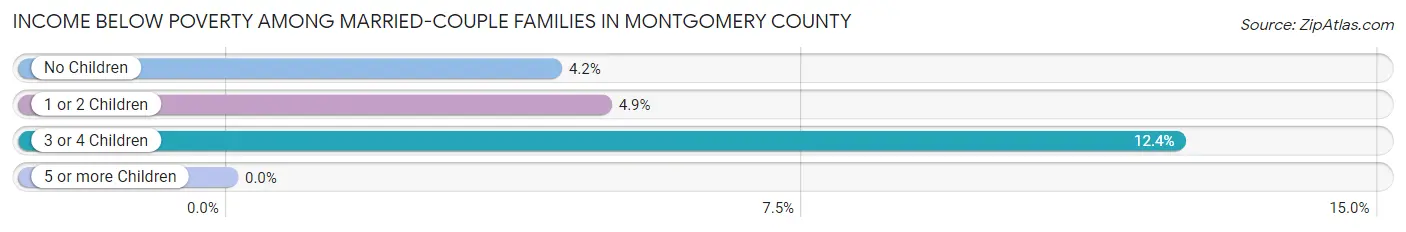
| Children | Above Poverty | Below Poverty |
| No Children | 1,402 (95.8%) | 62 (4.2%) |
| 1 or 2 Children | 624 (95.1%) | 32 (4.9%) |
| 3 or 4 Children | 184 (87.6%) | 26 (12.4%) |
| 5 or more Children | 9 (100.0%) | 0 (0.0%) |
| Total | 2,219 (94.9%) | 120 (5.1%) |
Income Below Poverty Among Single-Parent Households in Montgomery County
According to the poverty data in Montgomery County, 13.2% or 32 single-father households and 29.5% or 135 single-mother households are living below the poverty line. Among single-father households, those with 1 or 2 children have the highest poverty rate, with 23 households (14.9%) experiencing poverty. Likewise, among single-mother households, those with 3 or 4 children have the highest poverty rate, with 54 households (41.2%) falling below the poverty line.
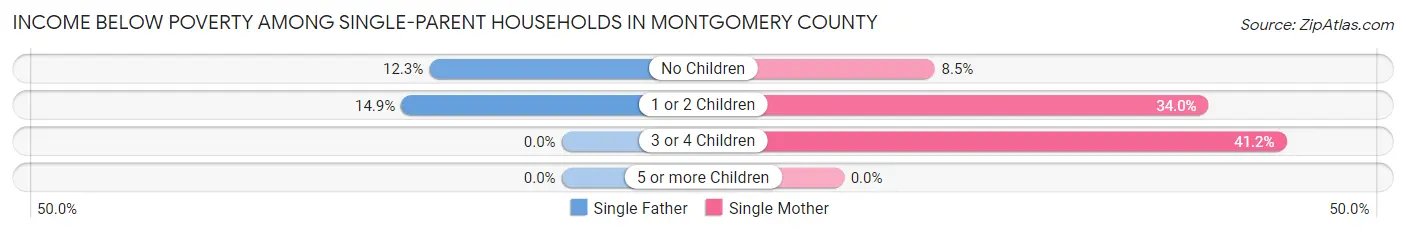
| Children | Single Father | Single Mother |
| No Children | 9 (12.3%) | 10 (8.5%) |
| 1 or 2 Children | 23 (14.9%) | 71 (34.0%) |
| 3 or 4 Children | 0 (0.0%) | 54 (41.2%) |
| 5 or more Children | 0 (0.0%) | 0 (0.0%) |
| Total | 32 (13.2%) | 135 (29.5%) |
Income Below Poverty Among Married-Couple vs Single-Parent Households in Montgomery County
The poverty data for Montgomery County shows that 120 of the married-couple family households (5.1%) and 167 of the single-parent households (23.8%) are living below the poverty level. Within the married-couple family households, those with 3 or 4 children have the highest poverty rate, with 26 households (12.4%) falling below the poverty line. Among the single-parent households, those with 3 or 4 children have the highest poverty rate, with 54 household (36.7%) living below poverty.
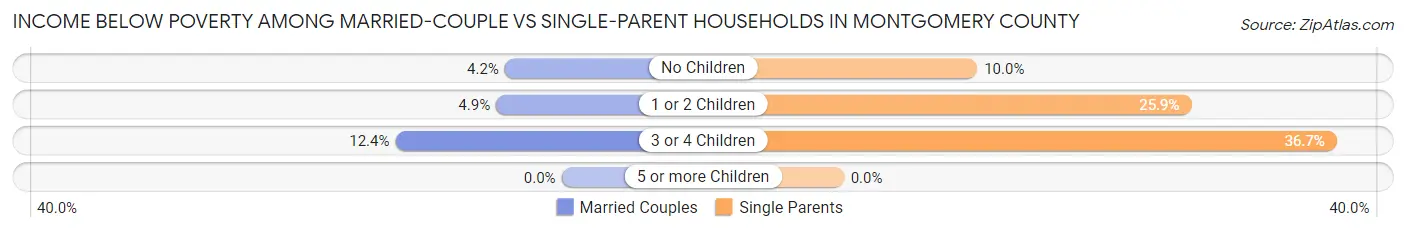
| Children | Married-Couple Families | Single-Parent Households |
| No Children | 62 (4.2%) | 19 (10.0%) |
| 1 or 2 Children | 32 (4.9%) | 94 (25.9%) |
| 3 or 4 Children | 26 (12.4%) | 54 (36.7%) |
| 5 or more Children | 0 (0.0%) | 0 (0.0%) |
| Total | 120 (5.1%) | 167 (23.8%) |
Race in Montgomery County
The most populous races in Montgomery County are White / Caucasian (10,689 | 93.6%), Two or more Races (426 | 3.7%), and Hispanic or Latino (242 | 2.1%).
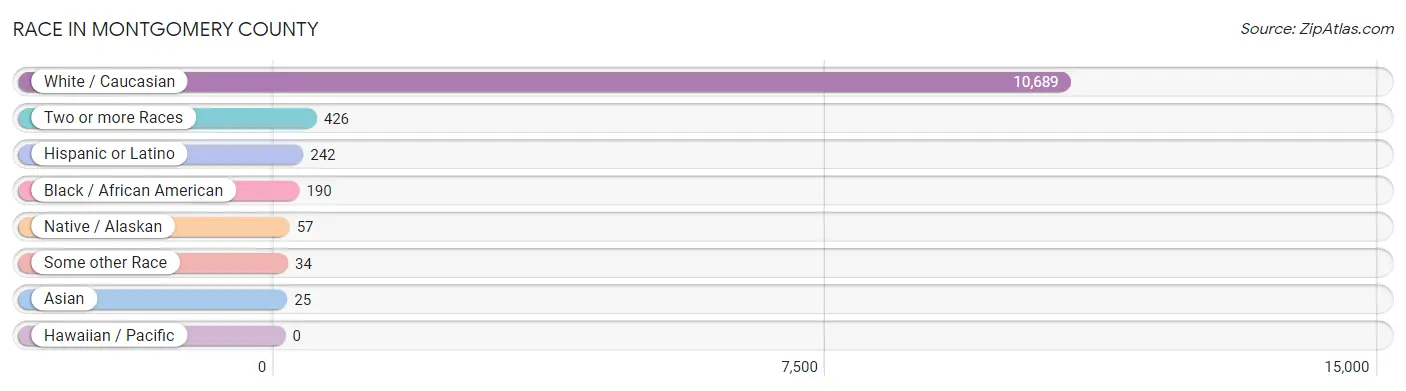
| Race | # Population | % Population |
| Asian | 25 | 0.2% |
| Black / African American | 190 | 1.7% |
| Hawaiian / Pacific | 0 | 0.0% |
| Hispanic or Latino | 242 | 2.1% |
| Native / Alaskan | 57 | 0.5% |
| White / Caucasian | 10,689 | 93.6% |
| Two or more Races | 426 | 3.7% |
| Some other Race | 34 | 0.3% |
| Total | 11,421 | 100.0% |
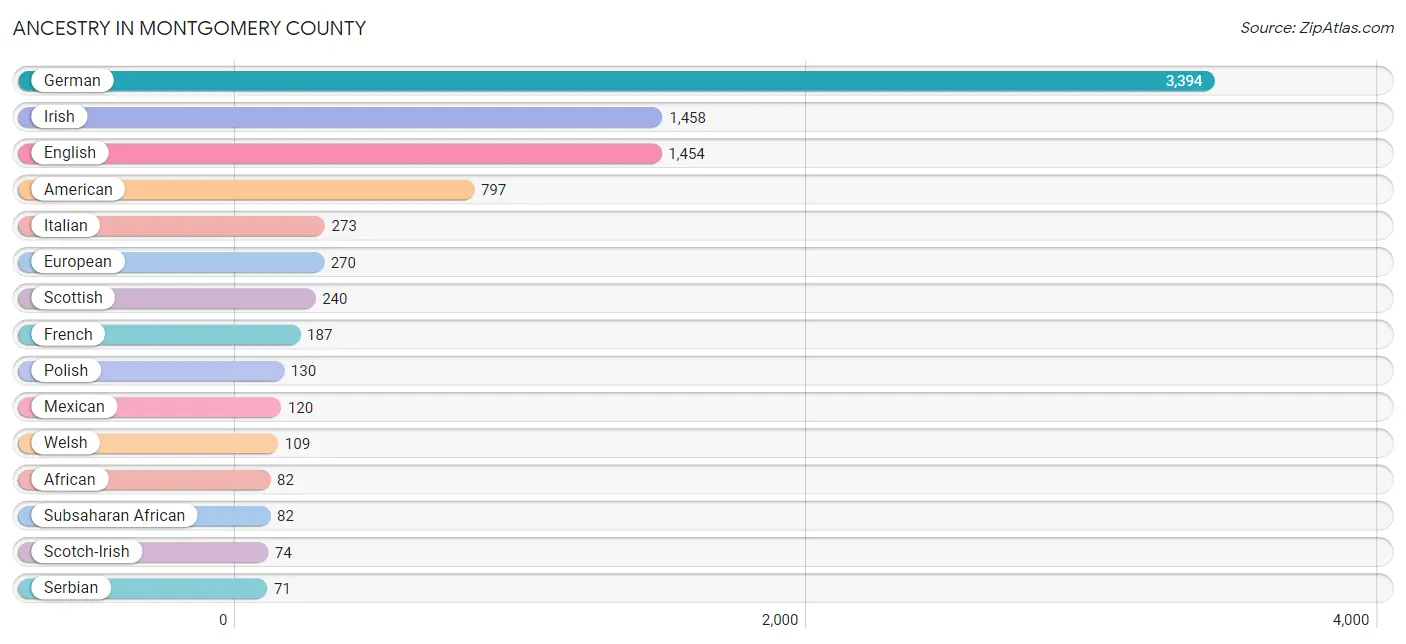
Ancestry in Montgomery County
The most populous ancestries reported in Montgomery County are German (3,394 | 29.7%), Irish (1,458 | 12.8%), English (1,454 | 12.7%), American (797 | 7.0%), and Italian (273 | 2.4%), together accounting for 64.6% of all Montgomery County residents.
| Ancestry | # Population | % Population |
| African | 82 | 0.7% |
| American | 797 | 7.0% |
| Arab | 17 | 0.2% |
| Armenian | 9 | 0.1% |
| Australian | 1 | 0.0% |
| Blackfeet | 2 | 0.0% |
| British | 62 | 0.5% |
| Burmese | 13 | 0.1% |
| Central American | 18 | 0.2% |
| Cherokee | 29 | 0.3% |
| Croatian | 5 | 0.0% |
| Czech | 64 | 0.6% |
| Danish | 10 | 0.1% |
| Dutch | 67 | 0.6% |
| Ecuadorian | 52 | 0.5% |
| English | 1,454 | 12.7% |
| European | 270 | 2.4% |
| French | 187 | 1.6% |
| French American Indian | 19 | 0.2% |
| French Canadian | 27 | 0.2% |
| German | 3,394 | 29.7% |
| Greek | 33 | 0.3% |
| Hopi | 34 | 0.3% |
| Hungarian | 8 | 0.1% |
| Indian (Asian) | 5 | 0.0% |
| Irish | 1,458 | 12.8% |
| Italian | 273 | 2.4% |
| Korean | 24 | 0.2% |
| Mexican | 120 | 1.1% |
| Northern European | 6 | 0.1% |
| Norwegian | 23 | 0.2% |
| Panamanian | 13 | 0.1% |
| Polish | 130 | 1.1% |
| Portuguese | 3 | 0.0% |
| Puerto Rican | 37 | 0.3% |
| Russian | 2 | 0.0% |
| Salvadoran | 5 | 0.0% |
| Scandinavian | 7 | 0.1% |
| Scotch-Irish | 74 | 0.6% |
| Scottish | 240 | 2.1% |
| Serbian | 71 | 0.6% |
| Sioux | 9 | 0.1% |
| Slavic | 1 | 0.0% |
| Slovak | 3 | 0.0% |
| Slovene | 71 | 0.6% |
| South American | 52 | 0.5% |
| Spanish | 2 | 0.0% |
| Sri Lankan | 2 | 0.0% |
| Subsaharan African | 82 | 0.7% |
| Swedish | 65 | 0.6% |
| Swiss | 14 | 0.1% |
| Ukrainian | 21 | 0.2% |
| Welsh | 109 | 0.9% | View All 53 Rows |
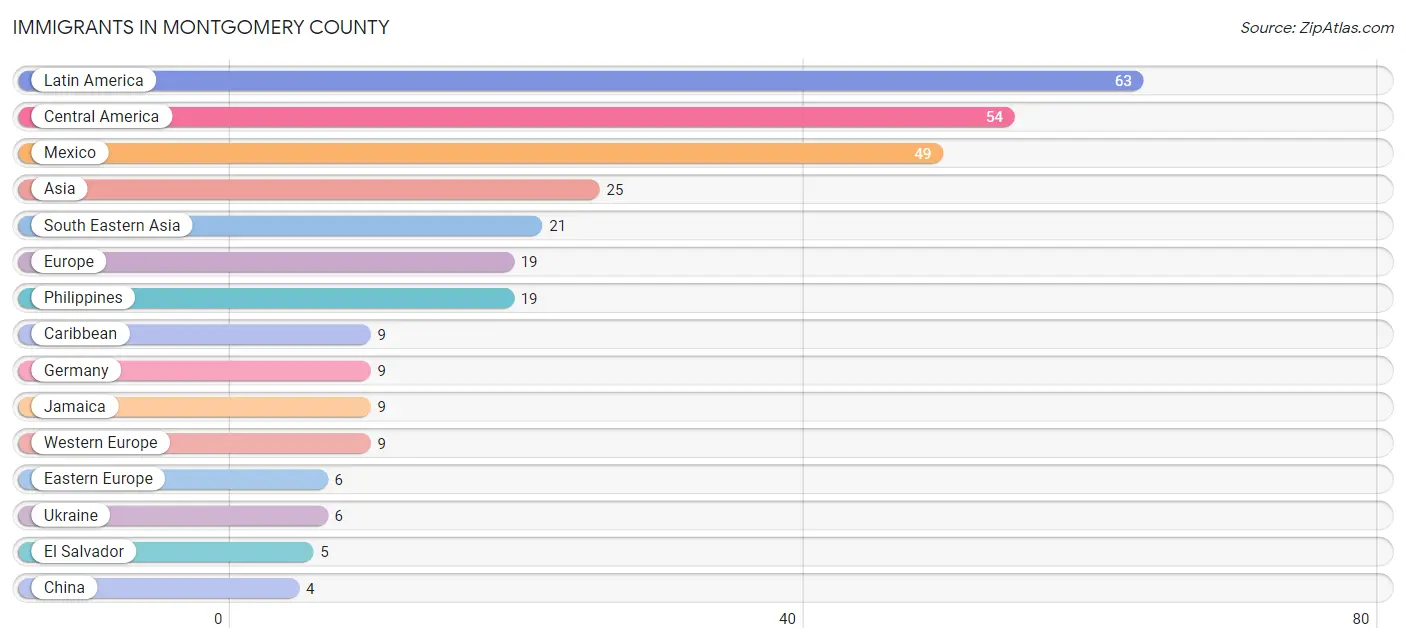
Immigrants in Montgomery County
The most numerous immigrant groups reported in Montgomery County came from Latin America (63 | 0.5%), Central America (54 | 0.5%), Mexico (49 | 0.4%), Asia (25 | 0.2%), and South Eastern Asia (21 | 0.2%), together accounting for 1.8% of all Montgomery County residents.
| Immigration Origin | # Population | % Population |
| Asia | 25 | 0.2% |
| Caribbean | 9 | 0.1% |
| Central America | 54 | 0.5% |
| China | 4 | 0.0% |
| Eastern Asia | 4 | 0.0% |
| Eastern Europe | 6 | 0.1% |
| El Salvador | 5 | 0.0% |
| England | 4 | 0.0% |
| Europe | 19 | 0.2% |
| Germany | 9 | 0.1% |
| Jamaica | 9 | 0.1% |
| Latin America | 63 | 0.5% |
| Mexico | 49 | 0.4% |
| Northern Europe | 4 | 0.0% |
| Philippines | 19 | 0.2% |
| South Eastern Asia | 21 | 0.2% |
| Ukraine | 6 | 0.1% |
| Vietnam | 2 | 0.0% |
| Western Europe | 9 | 0.1% | View All 19 Rows |
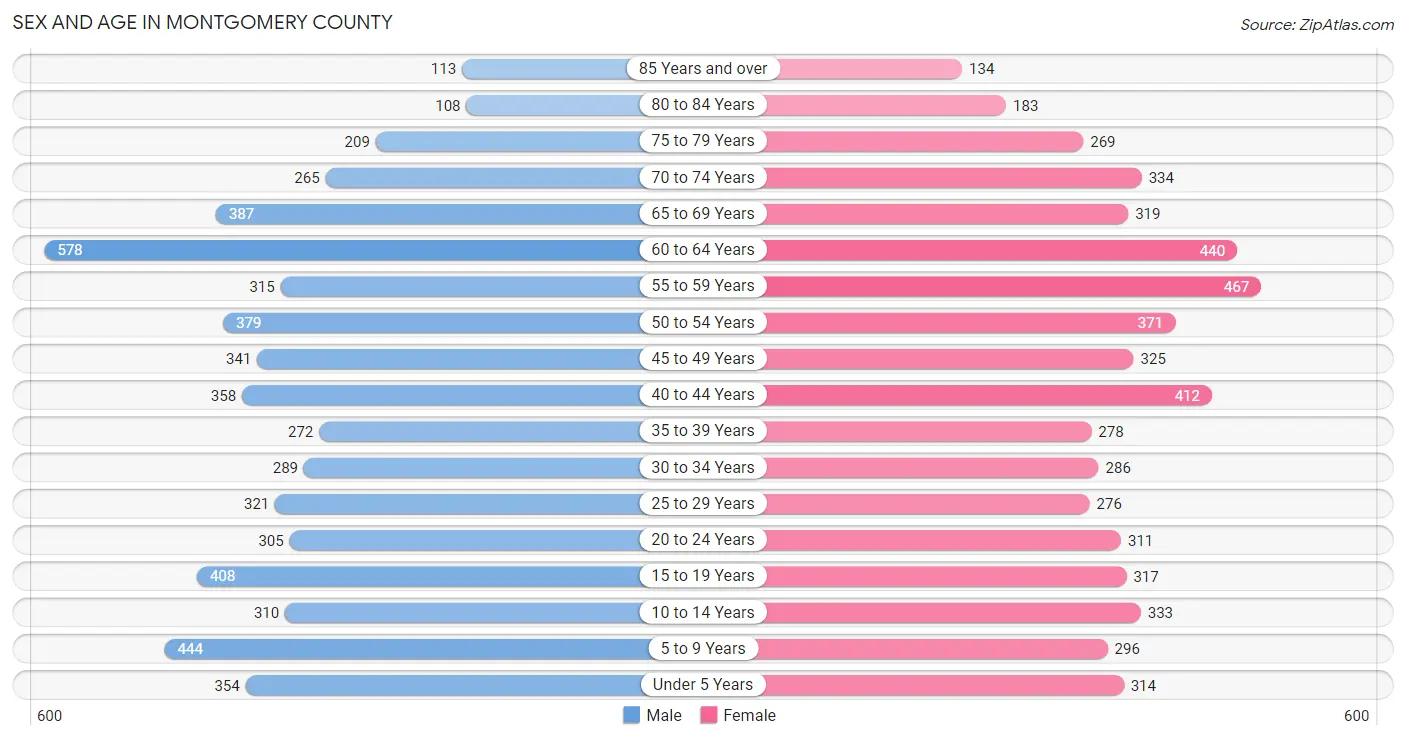
Sex and Age in Montgomery County
Sex and Age in Montgomery County
The most populous age groups in Montgomery County are 60 to 64 Years (578 | 10.0%) for men and 55 to 59 Years (467 | 8.2%) for women.
| Age Bracket | Male | Female |
| Under 5 Years | 354 (6.1%) | 314 (5.5%) |
| 5 to 9 Years | 444 (7.7%) | 296 (5.2%) |
| 10 to 14 Years | 310 (5.4%) | 333 (5.9%) |
| 15 to 19 Years | 408 (7.1%) | 317 (5.6%) |
| 20 to 24 Years | 305 (5.3%) | 311 (5.5%) |
| 25 to 29 Years | 321 (5.6%) | 276 (4.9%) |
| 30 to 34 Years | 289 (5.0%) | 286 (5.1%) |
| 35 to 39 Years | 272 (4.7%) | 278 (4.9%) |
| 40 to 44 Years | 358 (6.2%) | 412 (7.3%) |
| 45 to 49 Years | 341 (5.9%) | 325 (5.7%) |
| 50 to 54 Years | 379 (6.6%) | 371 (6.6%) |
| 55 to 59 Years | 315 (5.5%) | 467 (8.2%) |
| 60 to 64 Years | 578 (10.0%) | 440 (7.8%) |
| 65 to 69 Years | 387 (6.7%) | 319 (5.6%) |
| 70 to 74 Years | 265 (4.6%) | 334 (5.9%) |
| 75 to 79 Years | 209 (3.6%) | 269 (4.8%) |
| 80 to 84 Years | 108 (1.9%) | 183 (3.2%) |
| 85 Years and over | 113 (2.0%) | 134 (2.4%) |
| Total | 5,756 (100.0%) | 5,665 (100.0%) |
Families and Households in Montgomery County
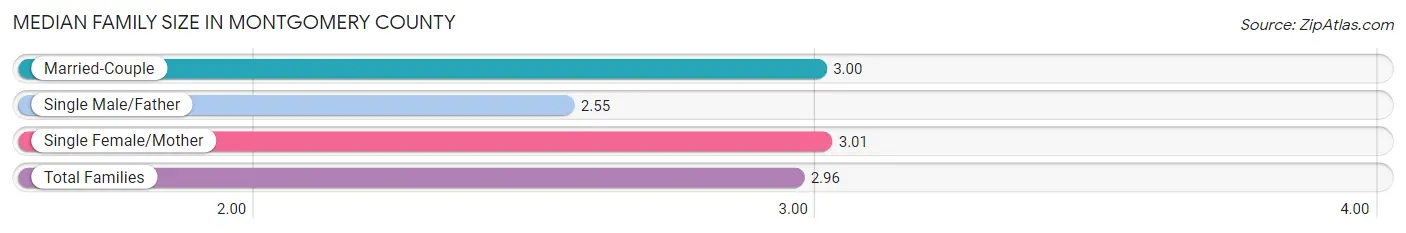
Median Family Size in Montgomery County
The median family size in Montgomery County is 2.96 persons per family, with single female/mother families (458 | 15.1%) accounting for the largest median family size of 3.01 persons per family. On the other hand, single male/father families (243 | 8.0%) represent the smallest median family size with 2.55 persons per family.
| Family Type | # Families | Family Size |
| Married-Couple | 2,339 (76.9%) | 3.00 |
| Single Male/Father | 243 (8.0%) | 2.55 |
| Single Female/Mother | 458 (15.1%) | 3.01 |
| Total Families | 3,040 (100.0%) | 2.96 |
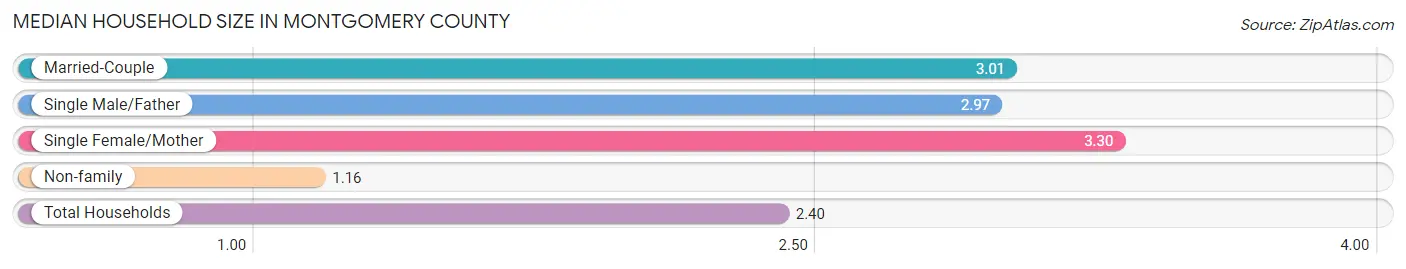
Median Household Size in Montgomery County
The median household size in Montgomery County is 2.40 persons per household, with single female/mother households (458 | 9.9%) accounting for the largest median household size of 3.3 persons per household. non-family households (1,604 | 34.5%) represent the smallest median household size with 1.16 persons per household.
| Household Type | # Households | Household Size |
| Married-Couple | 2,339 (50.4%) | 3.01 |
| Single Male/Father | 243 (5.2%) | 2.97 |
| Single Female/Mother | 458 (9.9%) | 3.30 |
| Non-family | 1,604 (34.5%) | 1.16 |
| Total Households | 4,644 (100.0%) | 2.40 |
Household Size by Marriage Status in Montgomery County
Out of a total of 4,644 households in Montgomery County, 3,040 (65.5%) are family households, while 1,604 (34.5%) are nonfamily households. The most numerous type of family households are 2-person households, comprising 1,465, and the most common type of nonfamily households are 1-person households, comprising 1,394.
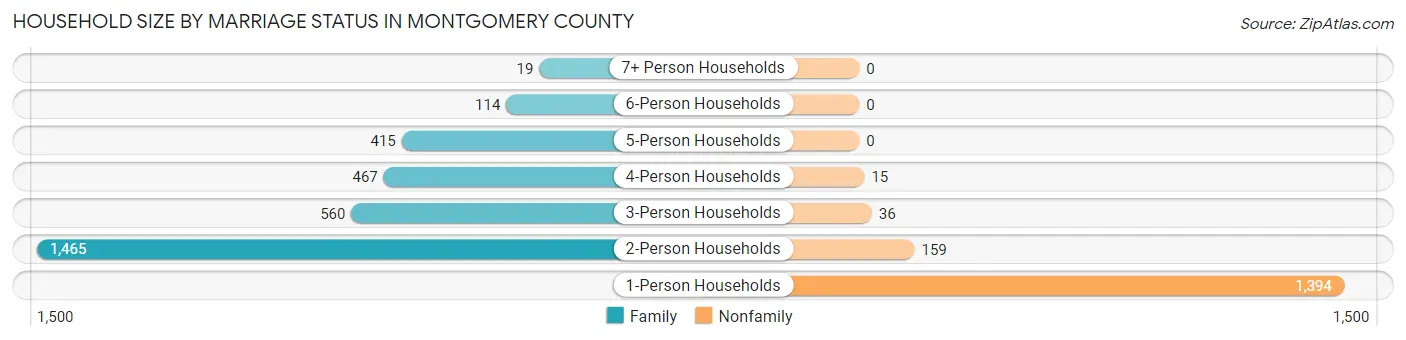
| Household Size | Family Households | Nonfamily Households |
| 1-Person Households | - | 1,394 (30.0%) |
| 2-Person Households | 1,465 (31.6%) | 159 (3.4%) |
| 3-Person Households | 560 (12.1%) | 36 (0.8%) |
| 4-Person Households | 467 (10.1%) | 15 (0.3%) |
| 5-Person Households | 415 (8.9%) | 0 (0.0%) |
| 6-Person Households | 114 (2.5%) | 0 (0.0%) |
| 7+ Person Households | 19 (0.4%) | 0 (0.0%) |
| Total | 3,040 (65.5%) | 1,604 (34.5%) |
Female Fertility in Montgomery County
Fertility by Age in Montgomery County
Average fertility rate in Montgomery County is 40.0 births per 1,000 women. Women in the age bracket of 20 to 34 years have the highest fertility rate with 68.0 births per 1,000 women. Women in the age bracket of 20 to 34 years acount for 67.0% of all women with births.
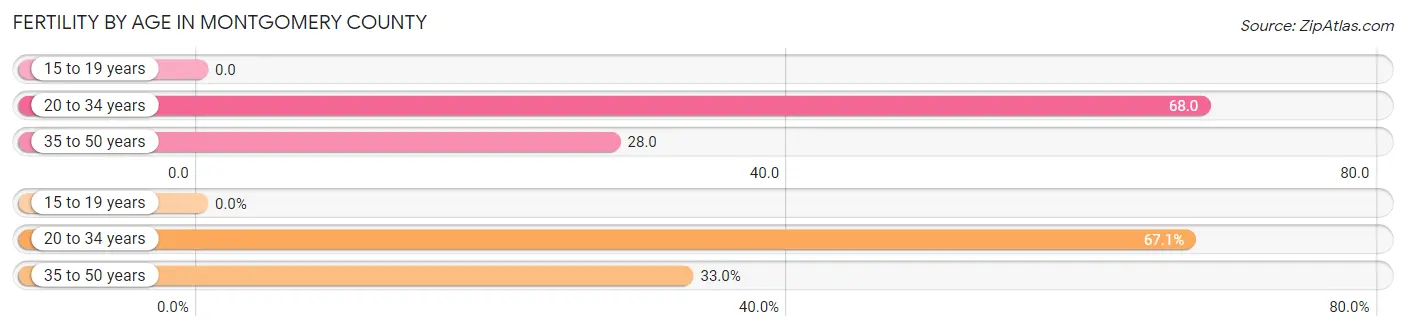
| Age Bracket | Women with Births | Births / 1,000 Women |
| 15 to 19 years | 0 (0.0%) | 0.0 |
| 20 to 34 years | 59 (67.0%) | 68.0 |
| 35 to 50 years | 29 (33.0%) | 28.0 |
| Total | 88 (100.0%) | 40.0 |
Fertility by Age by Marriage Status in Montgomery County
70.5% of women with births (88) in Montgomery County are married. The highest percentage of unmarried women with births falls into 35 to 50 years age bracket with 37.9% of them unmarried at the time of birth, while the lowest percentage of unmarried women with births belong to 20 to 34 years age bracket with 25.4% of them unmarried.
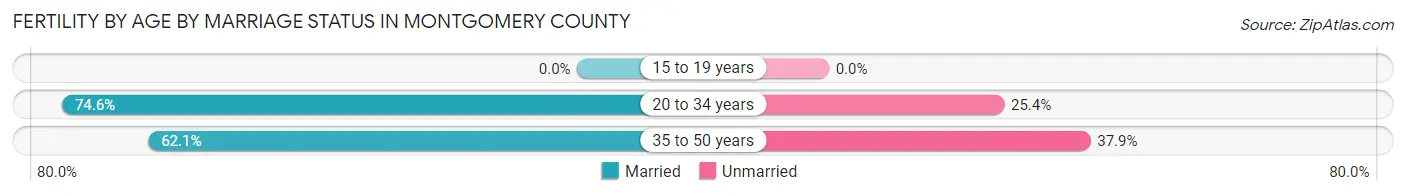
| Age Bracket | Married | Unmarried |
| 15 to 19 years | 0 (0.0%) | 0 (0.0%) |
| 20 to 34 years | 44 (74.6%) | 15 (25.4%) |
| 35 to 50 years | 18 (62.1%) | 11 (37.9%) |
| Total | 62 (70.5%) | 26 (29.5%) |
Fertility by Education in Montgomery County
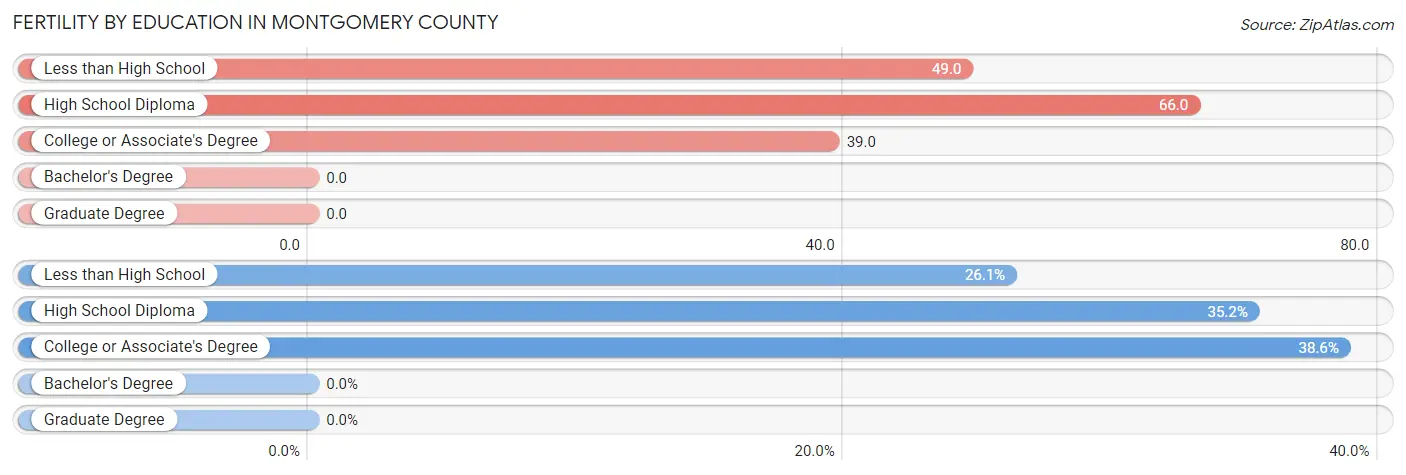
| Educational Attainment | Women with Births | Births / 1,000 Women |
| Less than High School | 23 (26.1%) | 49.0 |
| High School Diploma | 31 (35.2%) | 66.0 |
| College or Associate's Degree | 34 (38.6%) | 39.0 |
| Bachelor's Degree | 0 (0.0%) | 0.0 |
| Graduate Degree | 0 (0.0%) | 0.0 |
| Total | 88 (100.0%) | 40.0 |
Fertility by Education by Marriage Status in Montgomery County
29.5% of women with births in Montgomery County are unmarried. Women with the educational attainment of college or associate's degree are most likely to be married with 91.2% of them married at childbirth, while women with the educational attainment of high school diploma are least likely to be married with 54.8% of them unmarried at childbirth.
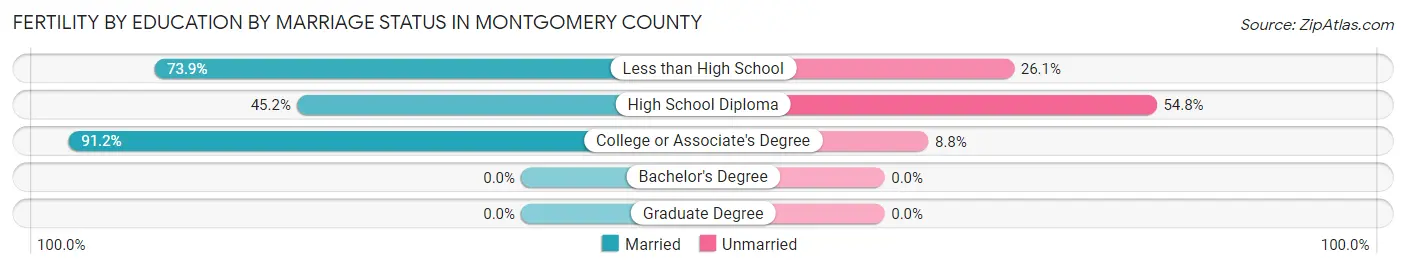
| Educational Attainment | Married | Unmarried |
| Less than High School | 17 (73.9%) | 6 (26.1%) |
| High School Diploma | 14 (45.2%) | 17 (54.8%) |
| College or Associate's Degree | 31 (91.2%) | 3 (8.8%) |
| Bachelor's Degree | 0 (0.0%) | 0 (0.0%) |
| Graduate Degree | 0 (0.0%) | 0 (0.0%) |
| Total | 62 (70.5%) | 26 (29.5%) |
Employment Characteristics in Montgomery County
Employment by Class of Employer in Montgomery County
Among the 5,004 employed individuals in Montgomery County, private company employees (3,405 | 68.0%), self-employed (not incorporated) (432 | 8.6%), and local government employees (384 | 7.7%) make up the most common classes of employment.
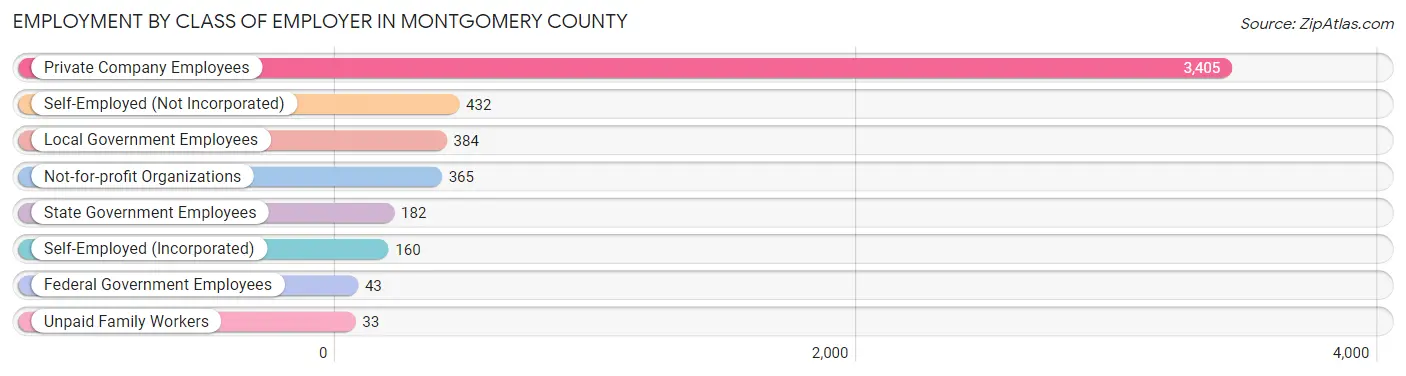
| Employer Class | # Employees | % Employees |
| Private Company Employees | 3,405 | 68.0% |
| Self-Employed (Incorporated) | 160 | 3.2% |
| Self-Employed (Not Incorporated) | 432 | 8.6% |
| Not-for-profit Organizations | 365 | 7.3% |
| Local Government Employees | 384 | 7.7% |
| State Government Employees | 182 | 3.6% |
| Federal Government Employees | 43 | 0.9% |
| Unpaid Family Workers | 33 | 0.7% |
| Total | 5,004 | 100.0% |
Employment Status by Age in Montgomery County
According to the labor force statistics for Montgomery County, out of the total population over 16 years of age (9,188), 57.5% or 5,283 individuals are in the labor force, with 3.0% or 158 of them unemployed. The age group with the highest labor force participation rate is 25 to 29 years, with 85.3% or 509 individuals in the labor force. Within the labor force, the 75 years and over age range has the highest percentage of unemployed individuals, with 20.3% or 12 of them being unemployed.
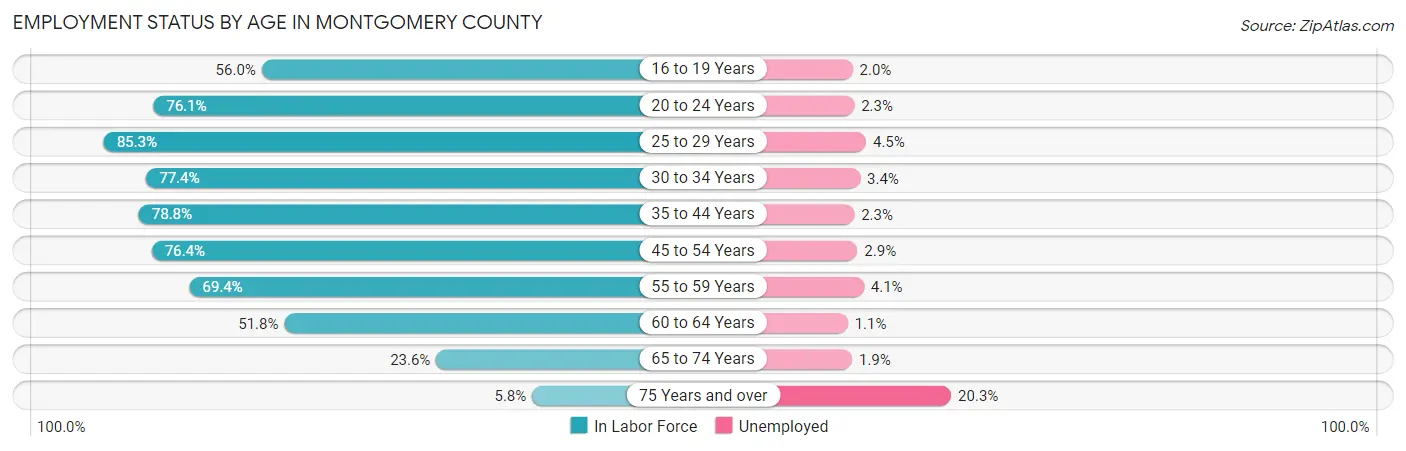
| Age Bracket | In Labor Force | Unemployed |
| 16 to 19 Years | 304 (56.0%) | 6 (2.0%) |
| 20 to 24 Years | 469 (76.1%) | 11 (2.3%) |
| 25 to 29 Years | 509 (85.3%) | 23 (4.5%) |
| 30 to 34 Years | 445 (77.4%) | 15 (3.4%) |
| 35 to 44 Years | 1,040 (78.8%) | 24 (2.3%) |
| 45 to 54 Years | 1,082 (76.4%) | 31 (2.9%) |
| 55 to 59 Years | 543 (69.4%) | 22 (4.1%) |
| 60 to 64 Years | 527 (51.8%) | 6 (1.1%) |
| 65 to 74 Years | 308 (23.6%) | 6 (1.9%) |
| 75 Years and over | 59 (5.8%) | 12 (20.3%) |
| Total | 5,283 (57.5%) | 158 (3.0%) |
Employment Status by Educational Attainment in Montgomery County
According to labor force statistics for Montgomery County, 72.6% of individuals (4,144) out of the total population between 25 and 64 years of age (5,708) are in the labor force, with 2.9% or 120 of them being unemployed. The group with the highest labor force participation rate are those with the educational attainment of bachelor's degree or higher, with 76.9% or 724 individuals in the labor force. Within the labor force, individuals with high school diploma education have the highest percentage of unemployment, with 3.8% or 64 of them being unemployed.
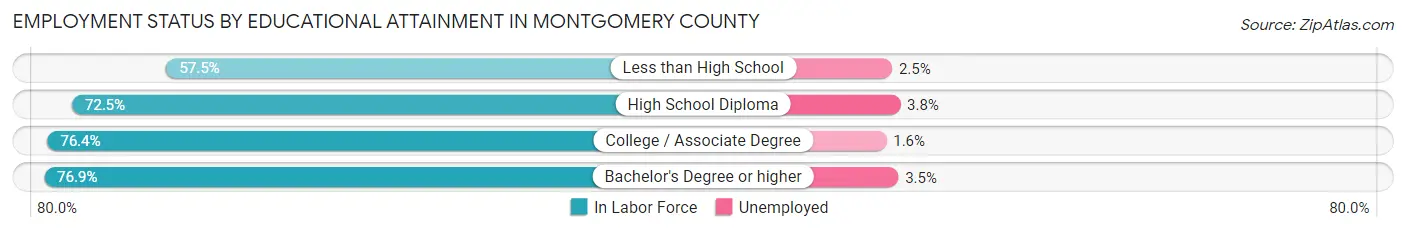
| Educational Attainment | In Labor Force | Unemployed |
| Less than High School | 393 (57.5%) | 17 (2.5%) |
| High School Diploma | 1,673 (72.5%) | 88 (3.8%) |
| College / Associate Degree | 1,355 (76.4%) | 28 (1.6%) |
| Bachelor's Degree or higher | 724 (76.9%) | 33 (3.5%) |
| Total | 4,144 (72.6%) | 166 (2.9%) |
Employment Occupations by Sex in Montgomery County
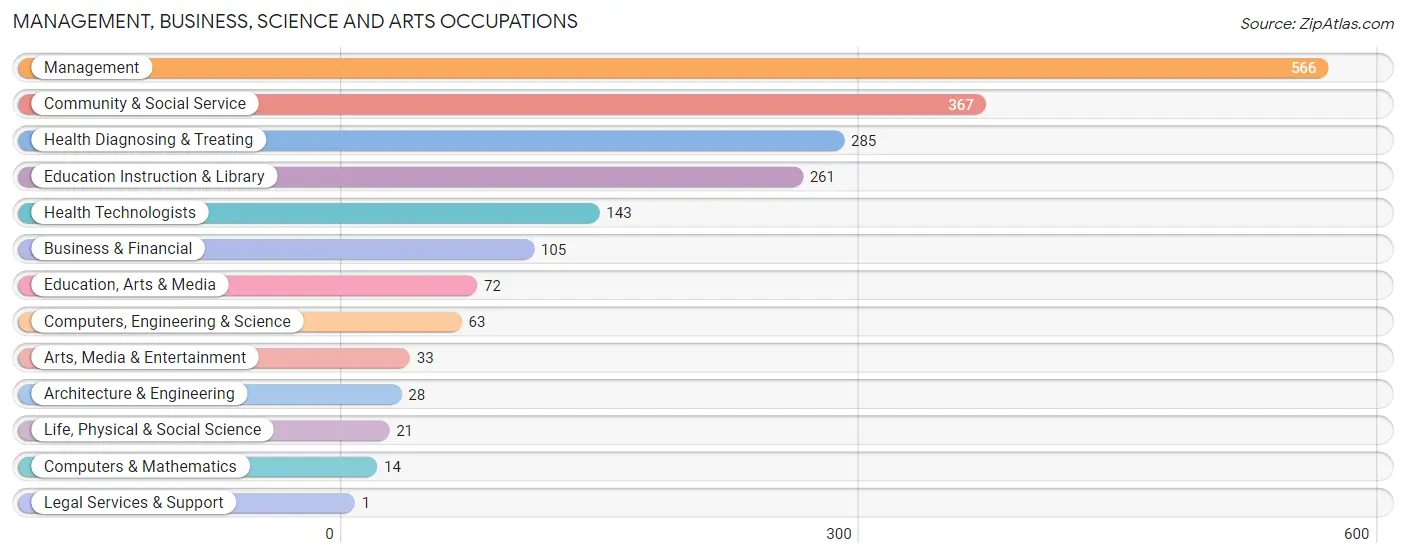
Management, Business, Science and Arts Occupations
The most common Management, Business, Science and Arts occupations in Montgomery County are Management (566 | 11.0%), Community & Social Service (367 | 7.1%), Health Diagnosing & Treating (285 | 5.6%), Education Instruction & Library (261 | 5.1%), and Health Technologists (143 | 2.8%).
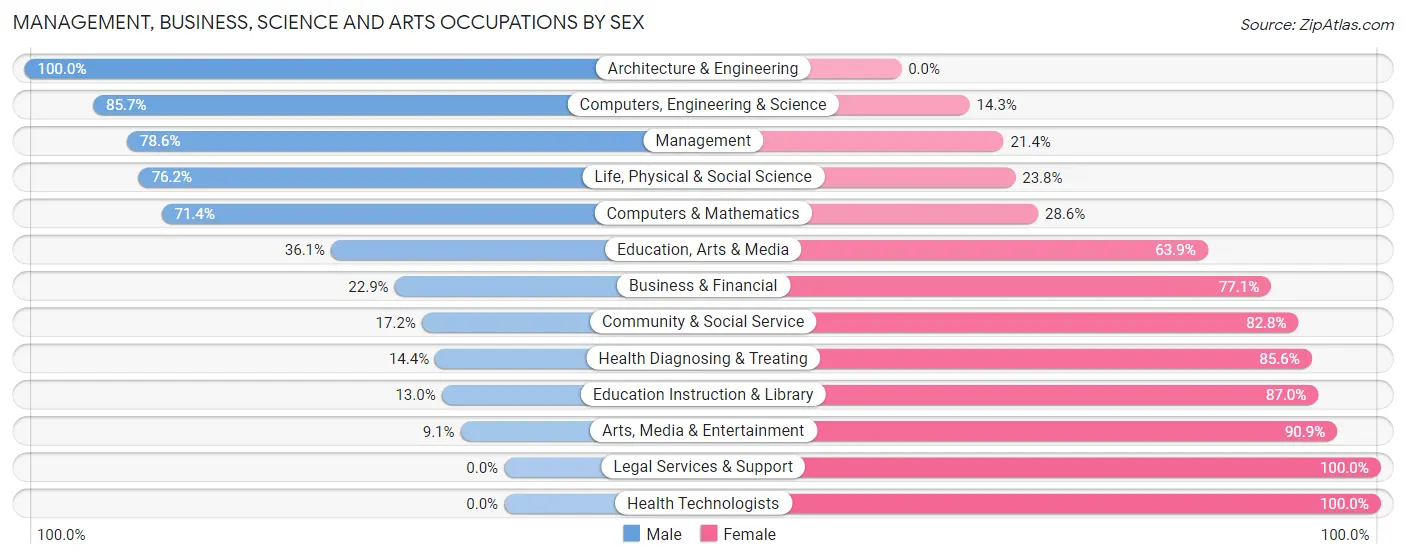
Management, Business, Science and Arts Occupations by Sex
Within the Management, Business, Science and Arts occupations in Montgomery County, the most male-oriented occupations are Architecture & Engineering (100.0%), Computers, Engineering & Science (85.7%), and Management (78.6%), while the most female-oriented occupations are Legal Services & Support (100.0%), Health Technologists (100.0%), and Arts, Media & Entertainment (90.9%).
| Occupation | Male | Female |
| Management | 445 (78.6%) | 121 (21.4%) |
| Business & Financial | 24 (22.9%) | 81 (77.1%) |
| Computers, Engineering & Science | 54 (85.7%) | 9 (14.3%) |
| Computers & Mathematics | 10 (71.4%) | 4 (28.6%) |
| Architecture & Engineering | 28 (100.0%) | 0 (0.0%) |
| Life, Physical & Social Science | 16 (76.2%) | 5 (23.8%) |
| Community & Social Service | 63 (17.2%) | 304 (82.8%) |
| Education, Arts & Media | 26 (36.1%) | 46 (63.9%) |
| Legal Services & Support | 0 (0.0%) | 1 (100.0%) |
| Education Instruction & Library | 34 (13.0%) | 227 (87.0%) |
| Arts, Media & Entertainment | 3 (9.1%) | 30 (90.9%) |
| Health Diagnosing & Treating | 41 (14.4%) | 244 (85.6%) |
| Health Technologists | 0 (0.0%) | 143 (100.0%) |
| Total (Category) | 627 (45.2%) | 759 (54.8%) |
| Total (Overall) | 2,772 (54.0%) | 2,358 (46.0%) |
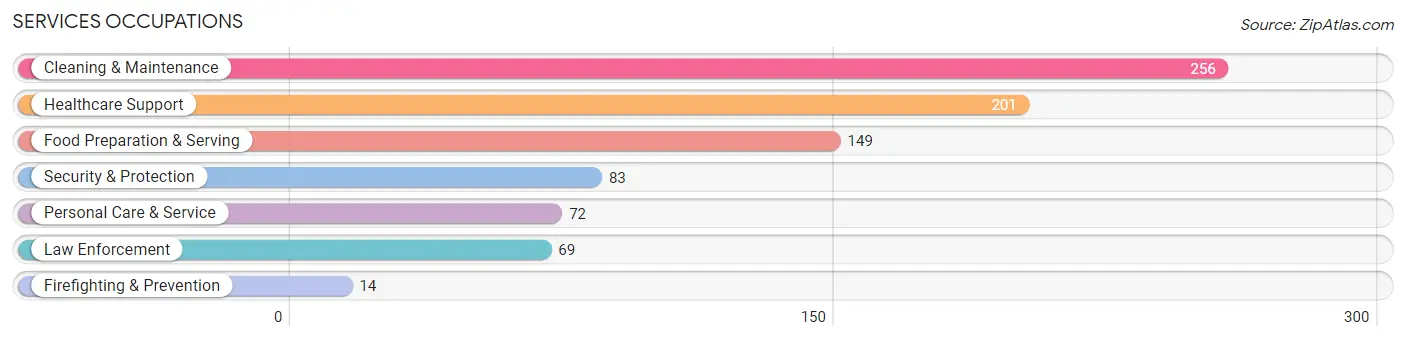
Services Occupations
The most common Services occupations in Montgomery County are Cleaning & Maintenance (256 | 5.0%), Healthcare Support (201 | 3.9%), Food Preparation & Serving (149 | 2.9%), Security & Protection (83 | 1.6%), and Personal Care & Service (72 | 1.4%).
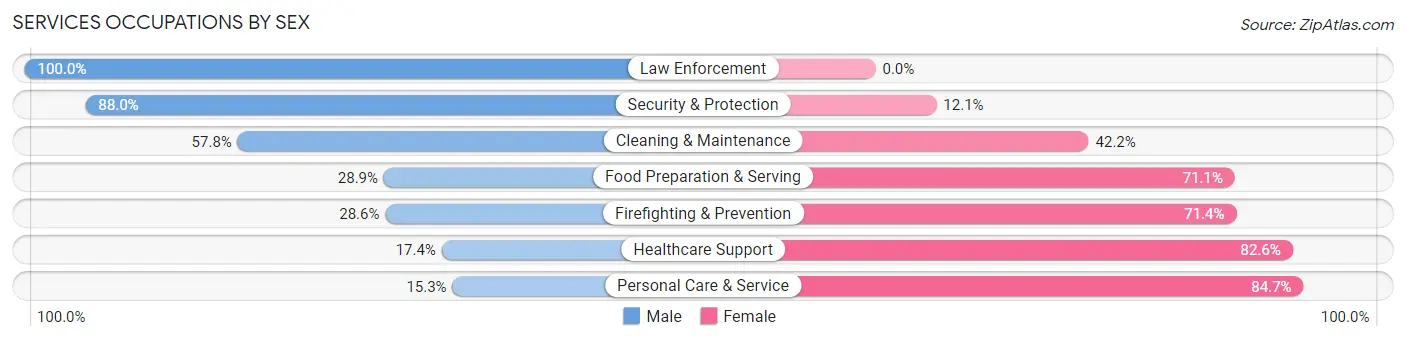
Services Occupations by Sex
Within the Services occupations in Montgomery County, the most male-oriented occupations are Law Enforcement (100.0%), Security & Protection (87.9%), and Cleaning & Maintenance (57.8%), while the most female-oriented occupations are Personal Care & Service (84.7%), Healthcare Support (82.6%), and Firefighting & Prevention (71.4%).
| Occupation | Male | Female |
| Healthcare Support | 35 (17.4%) | 166 (82.6%) |
| Security & Protection | 73 (87.9%) | 10 (12.0%) |
| Firefighting & Prevention | 4 (28.6%) | 10 (71.4%) |
| Law Enforcement | 69 (100.0%) | 0 (0.0%) |
| Food Preparation & Serving | 43 (28.9%) | 106 (71.1%) |
| Cleaning & Maintenance | 148 (57.8%) | 108 (42.2%) |
| Personal Care & Service | 11 (15.3%) | 61 (84.7%) |
| Total (Category) | 310 (40.7%) | 451 (59.3%) |
| Total (Overall) | 2,772 (54.0%) | 2,358 (46.0%) |
Sales and Office Occupations
The most common Sales and Office occupations in Montgomery County are Office & Administration (588 | 11.5%), and Sales & Related (483 | 9.4%).
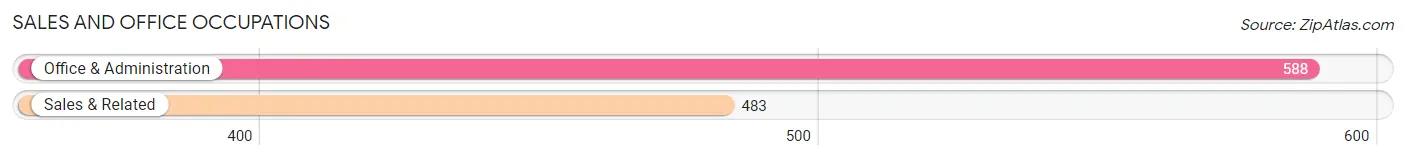
Sales and Office Occupations by Sex
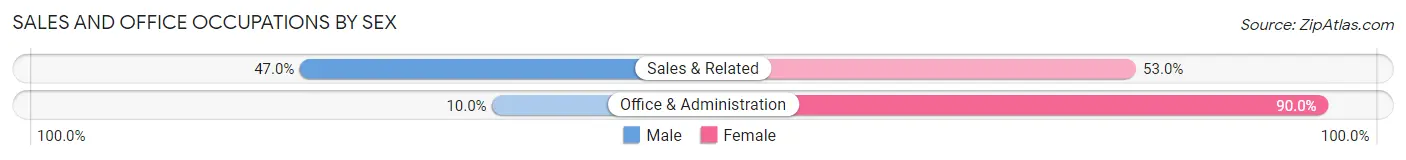
| Occupation | Male | Female |
| Sales & Related | 227 (47.0%) | 256 (53.0%) |
| Office & Administration | 59 (10.0%) | 529 (90.0%) |
| Total (Category) | 286 (26.7%) | 785 (73.3%) |
| Total (Overall) | 2,772 (54.0%) | 2,358 (46.0%) |
Natural Resources, Construction and Maintenance Occupations
The most common Natural Resources, Construction and Maintenance occupations in Montgomery County are Construction & Extraction (352 | 6.9%), Installation, Maintenance & Repair (343 | 6.7%), and Farming, Fishing & Forestry (94 | 1.8%).
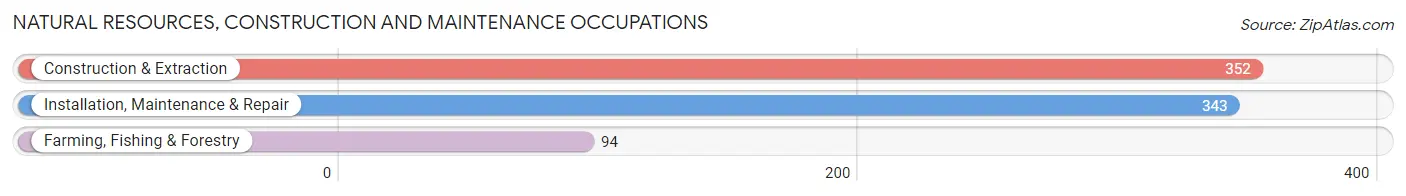
Natural Resources, Construction and Maintenance Occupations by Sex
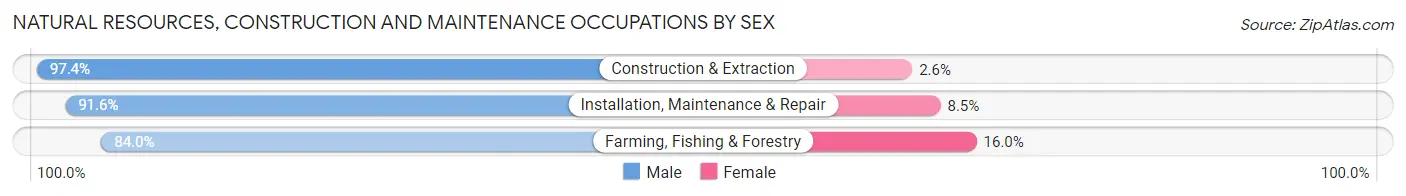
| Occupation | Male | Female |
| Farming, Fishing & Forestry | 79 (84.0%) | 15 (16.0%) |
| Construction & Extraction | 343 (97.4%) | 9 (2.6%) |
| Installation, Maintenance & Repair | 314 (91.5%) | 29 (8.5%) |
| Total (Category) | 736 (93.3%) | 53 (6.7%) |
| Total (Overall) | 2,772 (54.0%) | 2,358 (46.0%) |
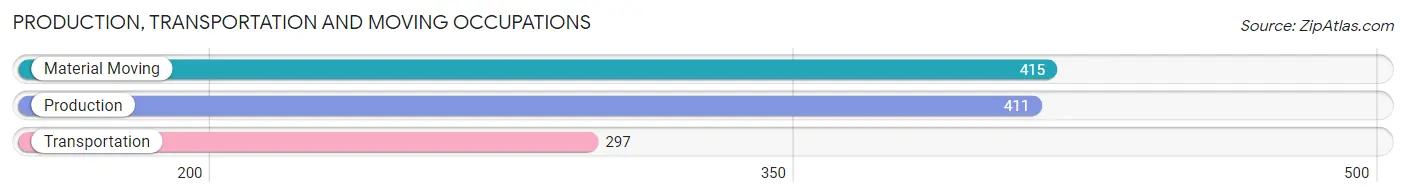
Production, Transportation and Moving Occupations
The most common Production, Transportation and Moving occupations in Montgomery County are Material Moving (415 | 8.1%), Production (411 | 8.0%), and Transportation (297 | 5.8%).
Production, Transportation and Moving Occupations by Sex
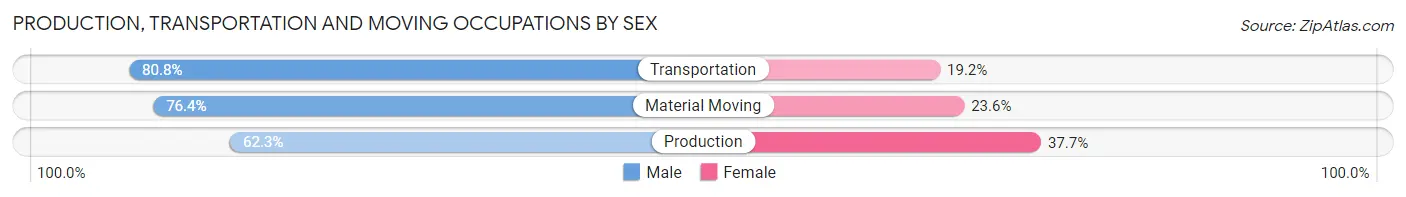
| Occupation | Male | Female |
| Production | 256 (62.3%) | 155 (37.7%) |
| Transportation | 240 (80.8%) | 57 (19.2%) |
| Material Moving | 317 (76.4%) | 98 (23.6%) |
| Total (Category) | 813 (72.4%) | 310 (27.6%) |
| Total (Overall) | 2,772 (54.0%) | 2,358 (46.0%) |
Employment Industries by Sex in Montgomery County
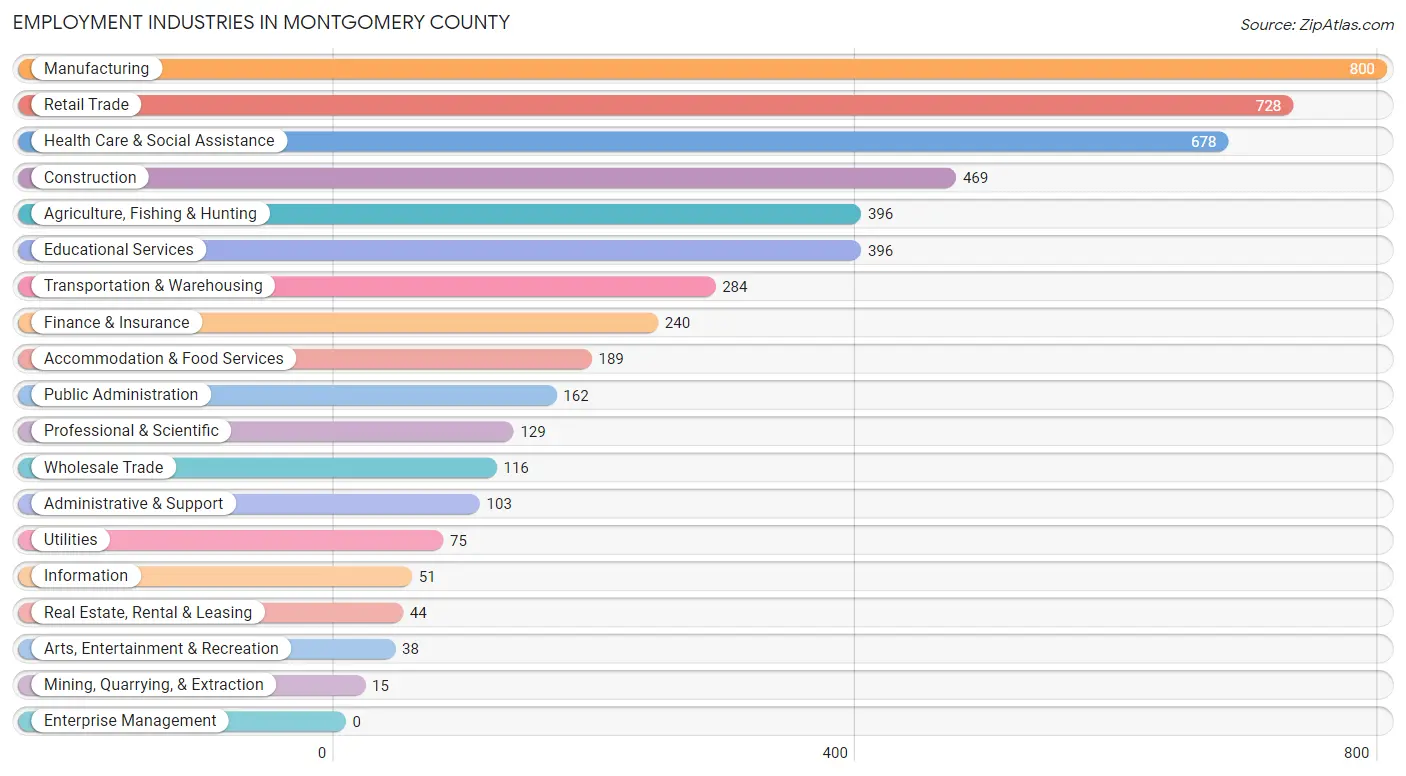
Employment Industries in Montgomery County
The major employment industries in Montgomery County include Manufacturing (800 | 15.6%), Retail Trade (728 | 14.2%), Health Care & Social Assistance (678 | 13.2%), Construction (469 | 9.1%), and Agriculture, Fishing & Hunting (396 | 7.7%).
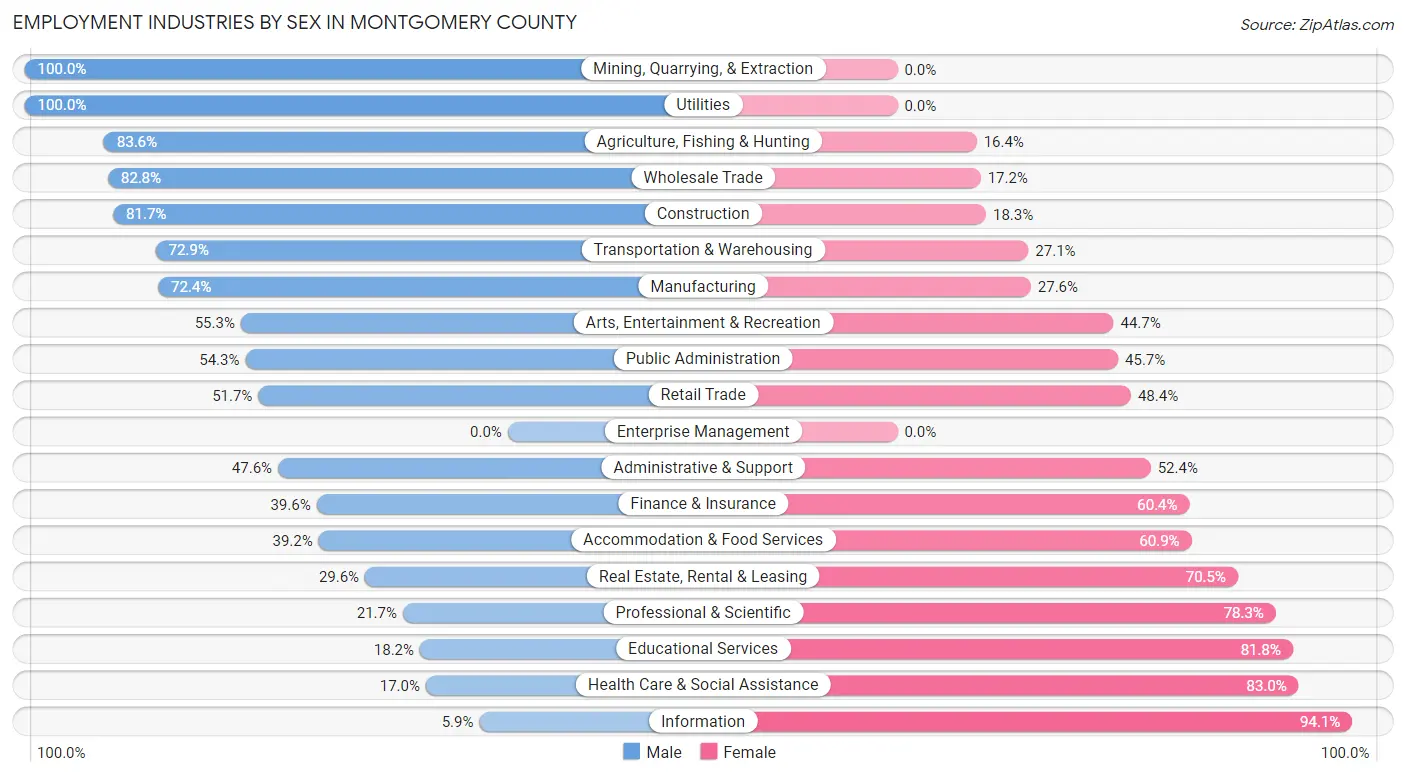
Employment Industries by Sex in Montgomery County
The Montgomery County industries that see more men than women are Mining, Quarrying, & Extraction (100.0%), Utilities (100.0%), and Agriculture, Fishing & Hunting (83.6%), whereas the industries that tend to have a higher number of women are Information (94.1%), Health Care & Social Assistance (83.0%), and Educational Services (81.8%).
| Industry | Male | Female |
| Agriculture, Fishing & Hunting | 331 (83.6%) | 65 (16.4%) |
| Mining, Quarrying, & Extraction | 15 (100.0%) | 0 (0.0%) |
| Construction | 383 (81.7%) | 86 (18.3%) |
| Manufacturing | 579 (72.4%) | 221 (27.6%) |
| Wholesale Trade | 96 (82.8%) | 20 (17.2%) |
| Retail Trade | 376 (51.6%) | 352 (48.3%) |
| Transportation & Warehousing | 207 (72.9%) | 77 (27.1%) |
| Utilities | 75 (100.0%) | 0 (0.0%) |
| Information | 3 (5.9%) | 48 (94.1%) |
| Finance & Insurance | 95 (39.6%) | 145 (60.4%) |
| Real Estate, Rental & Leasing | 13 (29.5%) | 31 (70.5%) |
| Professional & Scientific | 28 (21.7%) | 101 (78.3%) |
| Enterprise Management | 0 (0.0%) | 0 (0.0%) |
| Administrative & Support | 49 (47.6%) | 54 (52.4%) |
| Educational Services | 72 (18.2%) | 324 (81.8%) |
| Health Care & Social Assistance | 115 (17.0%) | 563 (83.0%) |
| Arts, Entertainment & Recreation | 21 (55.3%) | 17 (44.7%) |
| Accommodation & Food Services | 74 (39.2%) | 115 (60.9%) |
| Public Administration | 88 (54.3%) | 74 (45.7%) |
| Total | 2,772 (54.0%) | 2,358 (46.0%) |
Education in Montgomery County
School Enrollment in Montgomery County
The most common levels of schooling among the 2,301 students in Montgomery County are high school (630 | 27.4%), elementary school (567 | 24.6%), and middle school (508 | 22.1%).
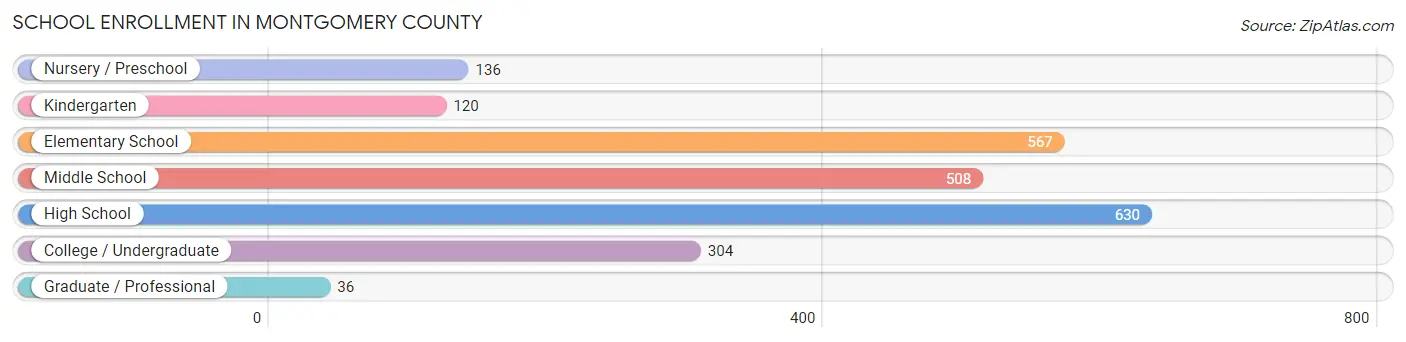
| School Level | # Students | % Students |
| Nursery / Preschool | 136 | 5.9% |
| Kindergarten | 120 | 5.2% |
| Elementary School | 567 | 24.6% |
| Middle School | 508 | 22.1% |
| High School | 630 | 27.4% |
| College / Undergraduate | 304 | 13.2% |
| Graduate / Professional | 36 | 1.6% |
| Total | 2,301 | 100.0% |
School Enrollment by Age by Funding Source in Montgomery County
Out of a total of 2,301 students who are enrolled in schools in Montgomery County, 244 (10.6%) attend a private institution, while the remaining 2,057 (89.4%) are enrolled in public schools. The age group of 25 to 34 year olds has the highest likelihood of being enrolled in private schools, with 19 (22.9% in the age bracket) enrolled. Conversely, the age group of 35 years and over has the lowest likelihood of being enrolled in a private school, with 91 (96.8% in the age bracket) attending a public institution.
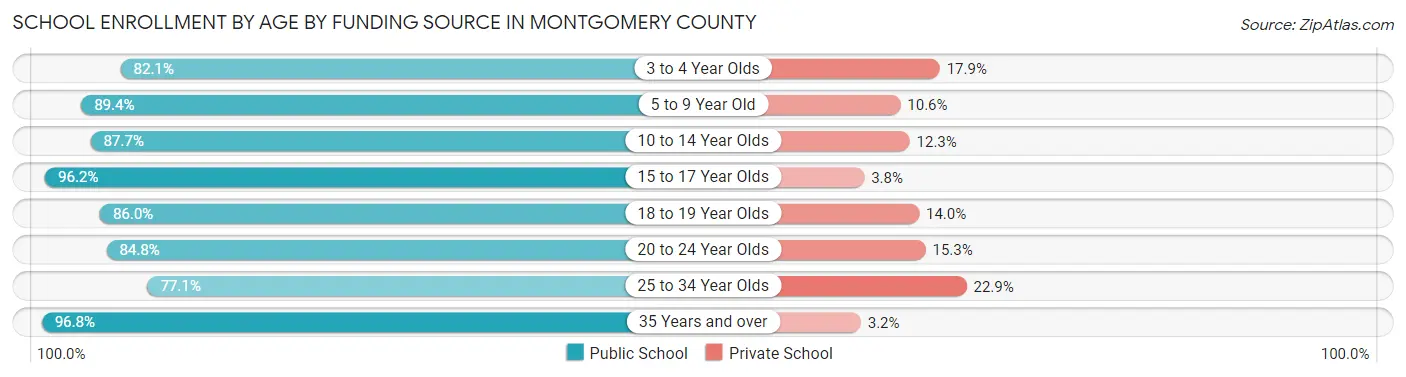
| Age Bracket | Public School | Private School |
| 3 to 4 Year Olds | 78 (82.1%) | 17 (17.9%) |
| 5 to 9 Year Old | 576 (89.4%) | 68 (10.6%) |
| 10 to 14 Year Olds | 543 (87.7%) | 76 (12.3%) |
| 15 to 17 Year Olds | 452 (96.2%) | 18 (3.8%) |
| 18 to 19 Year Olds | 153 (86.0%) | 25 (14.0%) |
| 20 to 24 Year Olds | 100 (84.8%) | 18 (15.2%) |
| 25 to 34 Year Olds | 64 (77.1%) | 19 (22.9%) |
| 35 Years and over | 91 (96.8%) | 3 (3.2%) |
| Total | 2,057 (89.4%) | 244 (10.6%) |
Educational Attainment by Field of Study in Montgomery County
Education (308 | 22.3%), business (238 | 17.2%), bio, nature & agricultural (168 | 12.2%), science & technology (152 | 11.0%), and arts & humanities (110 | 8.0%) are the most common fields of study among 1,380 individuals in Montgomery County who have obtained a bachelor's degree or higher.
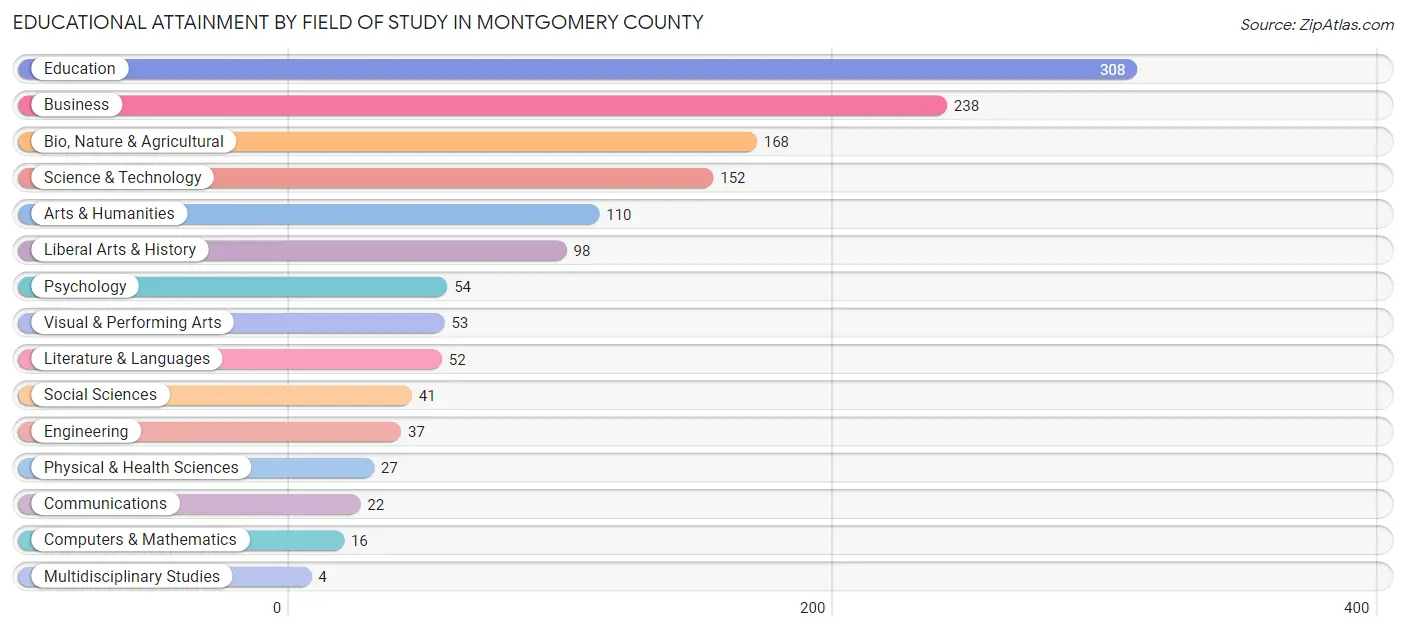
| Field of Study | # Graduates | % Graduates |
| Computers & Mathematics | 16 | 1.2% |
| Bio, Nature & Agricultural | 168 | 12.2% |
| Physical & Health Sciences | 27 | 2.0% |
| Psychology | 54 | 3.9% |
| Social Sciences | 41 | 3.0% |
| Engineering | 37 | 2.7% |
| Multidisciplinary Studies | 4 | 0.3% |
| Science & Technology | 152 | 11.0% |
| Business | 238 | 17.2% |
| Education | 308 | 22.3% |
| Literature & Languages | 52 | 3.8% |
| Liberal Arts & History | 98 | 7.1% |
| Visual & Performing Arts | 53 | 3.8% |
| Communications | 22 | 1.6% |
| Arts & Humanities | 110 | 8.0% |
| Total | 1,380 | 100.0% |
Transportation & Commute in Montgomery County
Vehicle Availability by Sex in Montgomery County
The most prevalent vehicle ownership categories in Montgomery County are males with 2 vehicles (1,003, accounting for 36.9%) and females with 2 vehicles (784, making up 44.0%).
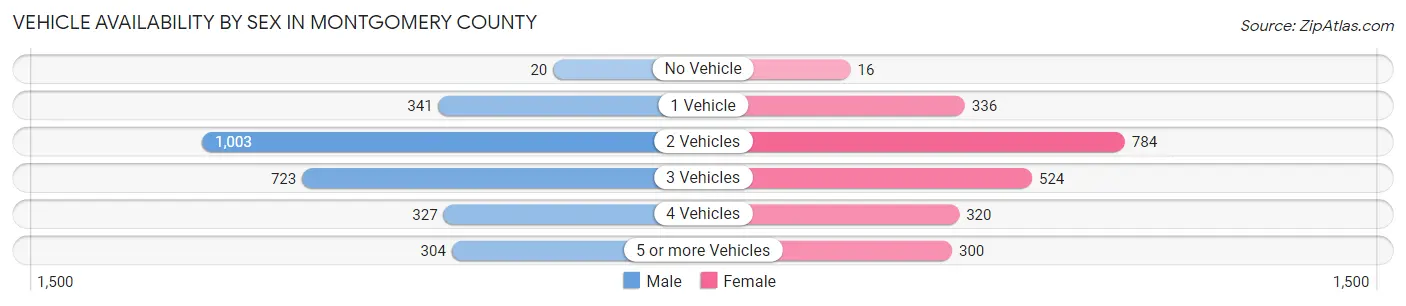
| Vehicles Available | Male | Female |
| No Vehicle | 20 (0.7%) | 16 (0.7%) |
| 1 Vehicle | 341 (12.6%) | 336 (14.7%) |
| 2 Vehicles | 1,003 (36.9%) | 784 (34.4%) |
| 3 Vehicles | 723 (26.6%) | 524 (23.0%) |
| 4 Vehicles | 327 (12.0%) | 320 (14.0%) |
| 5 or more Vehicles | 304 (11.2%) | 300 (13.2%) |
| Total | 2,718 (100.0%) | 2,280 (100.0%) |
Commute Time in Montgomery County
The most frequently occuring commute durations in Montgomery County are 5 to 9 minutes (711 commuters, 15.3%), 30 to 34 minutes (626 commuters, 13.5%), and 45 to 59 minutes (589 commuters, 12.7%).
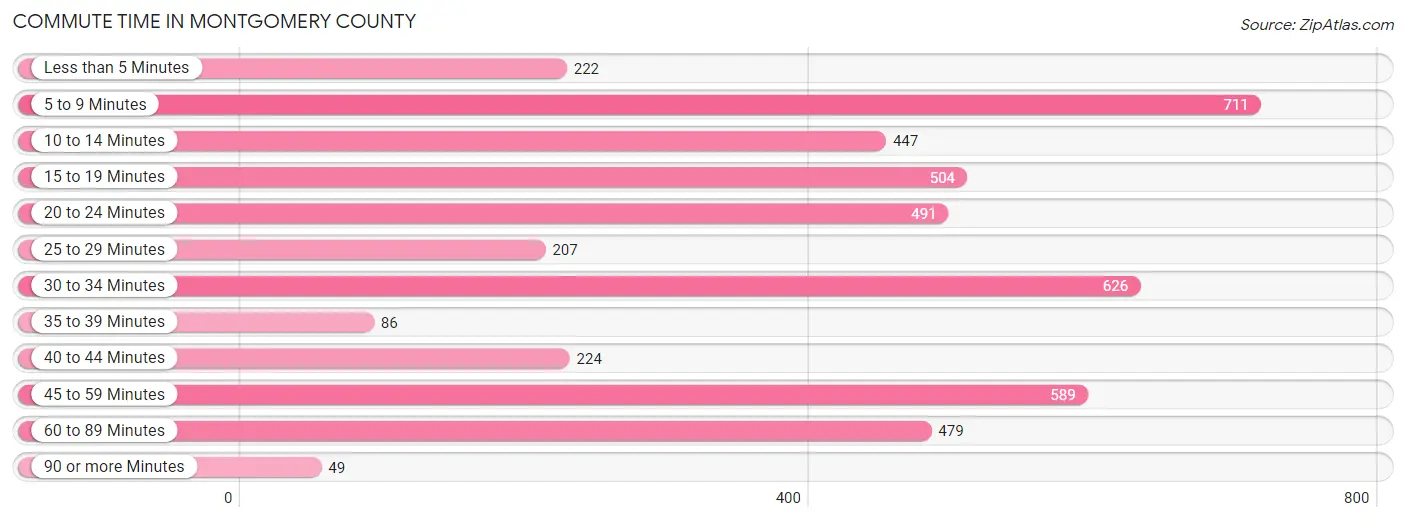
| Commute Time | # Commuters | % Commuters |
| Less than 5 Minutes | 222 | 4.8% |
| 5 to 9 Minutes | 711 | 15.3% |
| 10 to 14 Minutes | 447 | 9.6% |
| 15 to 19 Minutes | 504 | 10.9% |
| 20 to 24 Minutes | 491 | 10.6% |
| 25 to 29 Minutes | 207 | 4.5% |
| 30 to 34 Minutes | 626 | 13.5% |
| 35 to 39 Minutes | 86 | 1.9% |
| 40 to 44 Minutes | 224 | 4.8% |
| 45 to 59 Minutes | 589 | 12.7% |
| 60 to 89 Minutes | 479 | 10.3% |
| 90 or more Minutes | 49 | 1.1% |
Commute Time by Sex in Montgomery County
The most common commute times in Montgomery County are 45 to 59 minutes (373 commuters, 14.3%) for males and 5 to 9 minutes (369 commuters, 18.2%) for females.
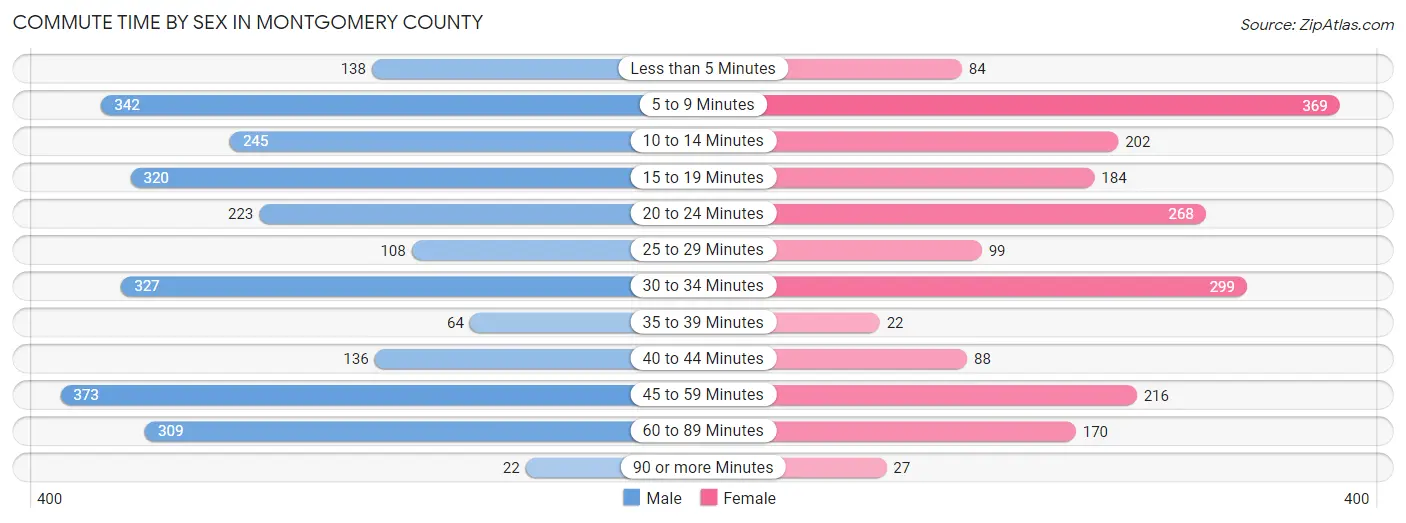
| Commute Time | Male | Female |
| Less than 5 Minutes | 138 (5.3%) | 84 (4.1%) |
| 5 to 9 Minutes | 342 (13.1%) | 369 (18.2%) |
| 10 to 14 Minutes | 245 (9.4%) | 202 (10.0%) |
| 15 to 19 Minutes | 320 (12.3%) | 184 (9.1%) |
| 20 to 24 Minutes | 223 (8.6%) | 268 (13.2%) |
| 25 to 29 Minutes | 108 (4.1%) | 99 (4.9%) |
| 30 to 34 Minutes | 327 (12.5%) | 299 (14.7%) |
| 35 to 39 Minutes | 64 (2.5%) | 22 (1.1%) |
| 40 to 44 Minutes | 136 (5.2%) | 88 (4.3%) |
| 45 to 59 Minutes | 373 (14.3%) | 216 (10.6%) |
| 60 to 89 Minutes | 309 (11.8%) | 170 (8.4%) |
| 90 or more Minutes | 22 (0.8%) | 27 (1.3%) |
Time of Departure to Work by Sex in Montgomery County
The most frequent times of departure to work in Montgomery County are 5:00 AM to 5:29 AM (348, 13.4%) for males and 7:30 AM to 7:59 AM (333, 16.4%) for females.
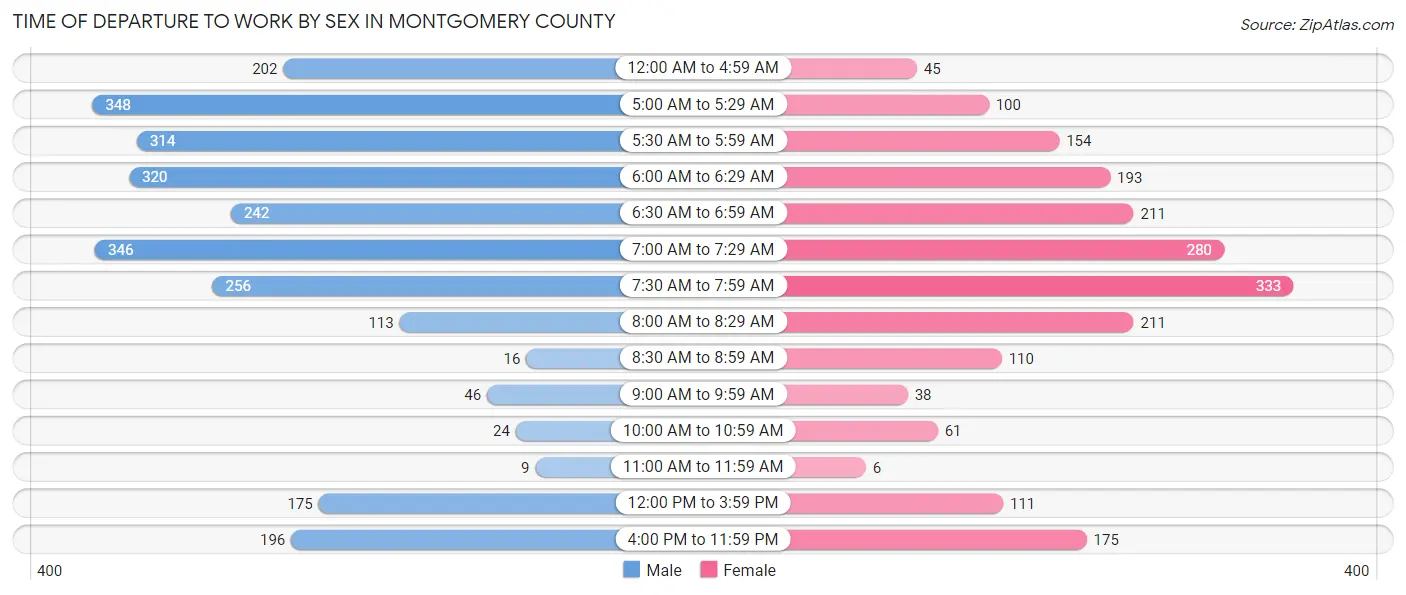
| Time of Departure | Male | Female |
| 12:00 AM to 4:59 AM | 202 (7.7%) | 45 (2.2%) |
| 5:00 AM to 5:29 AM | 348 (13.4%) | 100 (4.9%) |
| 5:30 AM to 5:59 AM | 314 (12.0%) | 154 (7.6%) |
| 6:00 AM to 6:29 AM | 320 (12.3%) | 193 (9.5%) |
| 6:30 AM to 6:59 AM | 242 (9.3%) | 211 (10.4%) |
| 7:00 AM to 7:29 AM | 346 (13.3%) | 280 (13.8%) |
| 7:30 AM to 7:59 AM | 256 (9.8%) | 333 (16.4%) |
| 8:00 AM to 8:29 AM | 113 (4.3%) | 211 (10.4%) |
| 8:30 AM to 8:59 AM | 16 (0.6%) | 110 (5.4%) |
| 9:00 AM to 9:59 AM | 46 (1.8%) | 38 (1.9%) |
| 10:00 AM to 10:59 AM | 24 (0.9%) | 61 (3.0%) |
| 11:00 AM to 11:59 AM | 9 (0.4%) | 6 (0.3%) |
| 12:00 PM to 3:59 PM | 175 (6.7%) | 111 (5.5%) |
| 4:00 PM to 11:59 PM | 196 (7.5%) | 175 (8.6%) |
| Total | 2,607 (100.0%) | 2,028 (100.0%) |
Housing Occupancy in Montgomery County
Occupancy by Ownership in Montgomery County
Of the total 4,644 dwellings in Montgomery County, owner-occupied units account for 3,452 (74.3%), while renter-occupied units make up 1,192 (25.7%).
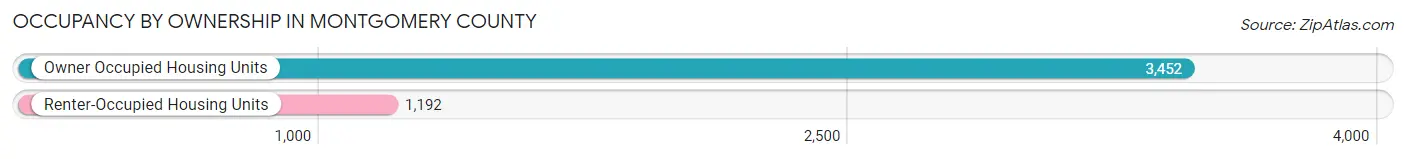
| Occupancy | # Housing Units | % Housing Units |
| Owner Occupied Housing Units | 3,452 | 74.3% |
| Renter-Occupied Housing Units | 1,192 | 25.7% |
| Total Occupied Housing Units | 4,644 | 100.0% |
Occupancy by Household Size in Montgomery County
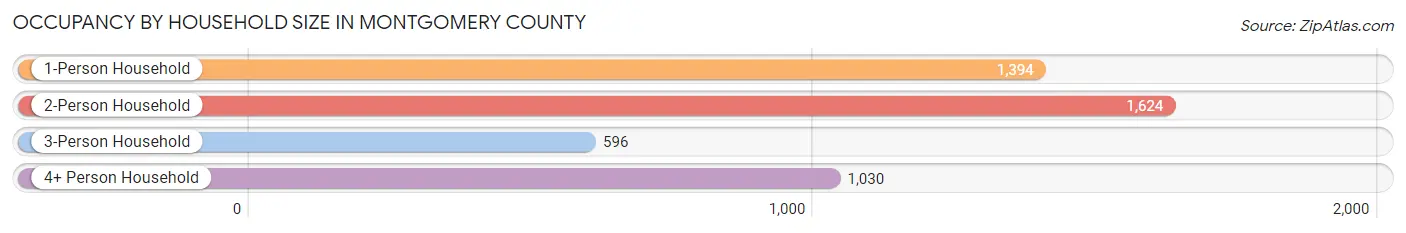
| Household Size | # Housing Units | % Housing Units |
| 1-Person Household | 1,394 | 30.0% |
| 2-Person Household | 1,624 | 35.0% |
| 3-Person Household | 596 | 12.8% |
| 4+ Person Household | 1,030 | 22.2% |
| Total Housing Units | 4,644 | 100.0% |
Occupancy by Ownership by Household Size in Montgomery County
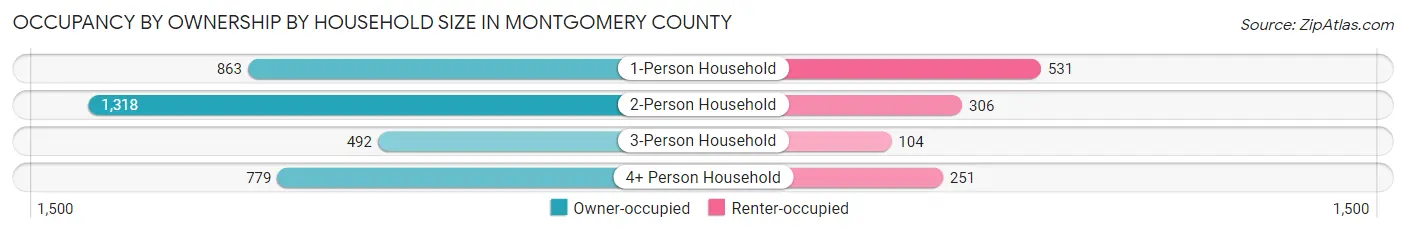
| Household Size | Owner-occupied | Renter-occupied |
| 1-Person Household | 863 (61.9%) | 531 (38.1%) |
| 2-Person Household | 1,318 (81.2%) | 306 (18.8%) |
| 3-Person Household | 492 (82.6%) | 104 (17.4%) |
| 4+ Person Household | 779 (75.6%) | 251 (24.4%) |
| Total Housing Units | 3,452 (74.3%) | 1,192 (25.7%) |
Occupancy by Educational Attainment in Montgomery County
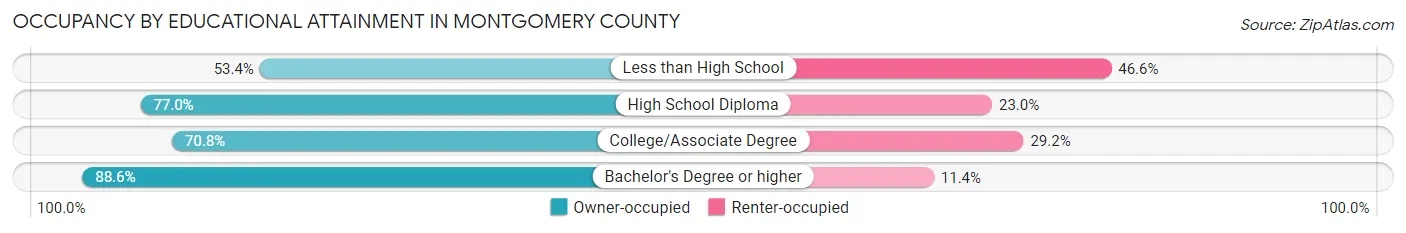
| Household Size | Owner-occupied | Renter-occupied |
| Less than High School | 268 (53.4%) | 234 (46.6%) |
| High School Diploma | 1,556 (77.0%) | 464 (23.0%) |
| College/Associate Degree | 1,001 (70.8%) | 413 (29.2%) |
| Bachelor's Degree or higher | 627 (88.6%) | 81 (11.4%) |
Occupancy by Age of Householder in Montgomery County
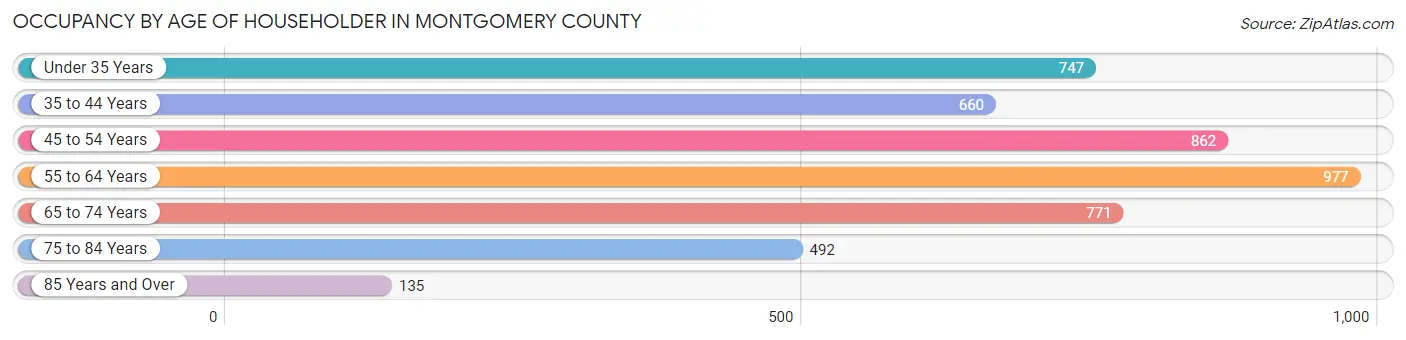
| Age Bracket | # Households | % Households |
| Under 35 Years | 747 | 16.1% |
| 35 to 44 Years | 660 | 14.2% |
| 45 to 54 Years | 862 | 18.6% |
| 55 to 64 Years | 977 | 21.0% |
| 65 to 74 Years | 771 | 16.6% |
| 75 to 84 Years | 492 | 10.6% |
| 85 Years and Over | 135 | 2.9% |
| Total | 4,644 | 100.0% |
Housing Finances in Montgomery County
Median Income by Occupancy in Montgomery County
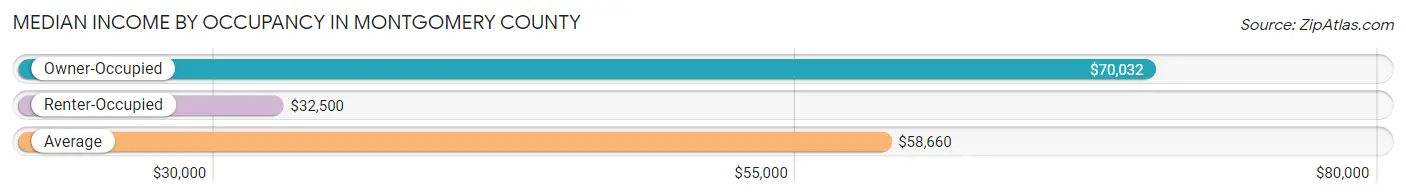
| Occupancy Type | # Households | Median Income |
| Owner-Occupied | 3,452 (74.3%) | $70,032 |
| Renter-Occupied | 1,192 (25.7%) | $32,500 |
| Average | 4,644 (100.0%) | $58,660 |
Occupancy by Householder Income Bracket in Montgomery County
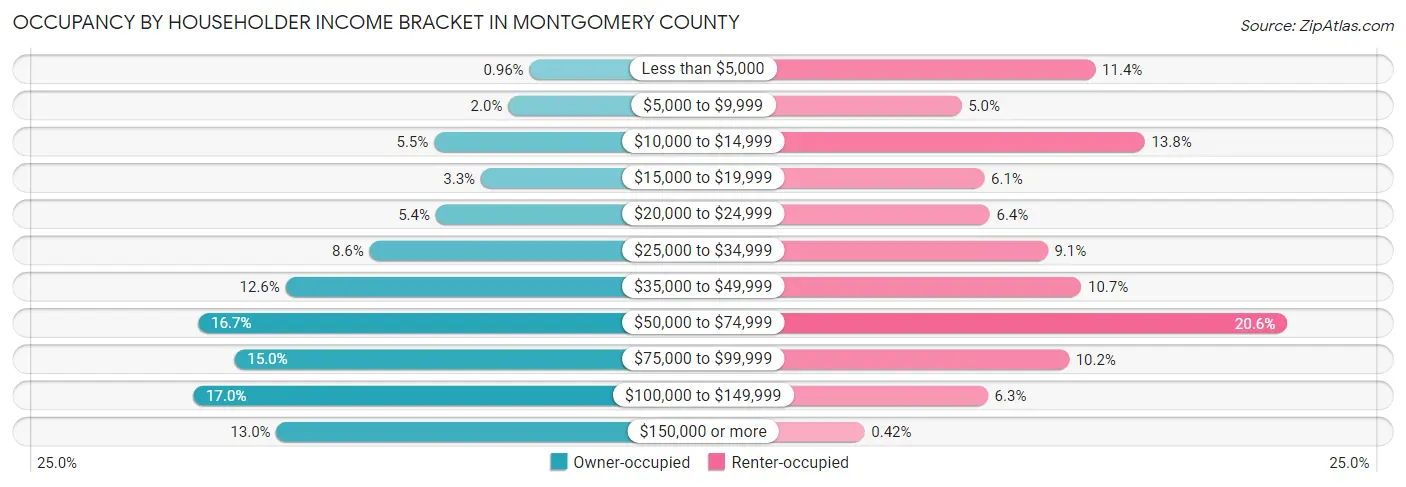
| Income Bracket | Owner-occupied | Renter-occupied |
| Less than $5,000 | 33 (1.0%) | 136 (11.4%) |
| $5,000 to $9,999 | 68 (2.0%) | 60 (5.0%) |
| $10,000 to $14,999 | 190 (5.5%) | 164 (13.8%) |
| $15,000 to $19,999 | 113 (3.3%) | 73 (6.1%) |
| $20,000 to $24,999 | 187 (5.4%) | 76 (6.4%) |
| $25,000 to $34,999 | 296 (8.6%) | 109 (9.1%) |
| $35,000 to $49,999 | 434 (12.6%) | 128 (10.7%) |
| $50,000 to $74,999 | 578 (16.7%) | 245 (20.5%) |
| $75,000 to $99,999 | 518 (15.0%) | 121 (10.2%) |
| $100,000 to $149,999 | 586 (17.0%) | 75 (6.3%) |
| $150,000 or more | 449 (13.0%) | 5 (0.4%) |
| Total | 3,452 (100.0%) | 1,192 (100.0%) |
Monthly Housing Cost Tiers in Montgomery County
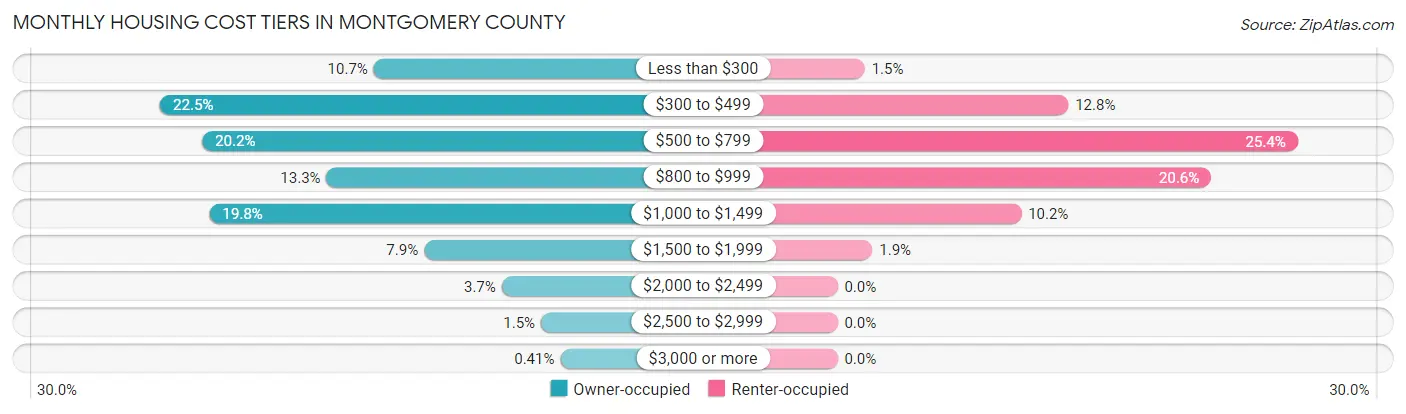
| Monthly Cost | Owner-occupied | Renter-occupied |
| Less than $300 | 370 (10.7%) | 18 (1.5%) |
| $300 to $499 | 777 (22.5%) | 152 (12.8%) |
| $500 to $799 | 697 (20.2%) | 303 (25.4%) |
| $800 to $999 | 460 (13.3%) | 246 (20.6%) |
| $1,000 to $1,499 | 683 (19.8%) | 121 (10.2%) |
| $1,500 to $1,999 | 274 (7.9%) | 23 (1.9%) |
| $2,000 to $2,499 | 126 (3.6%) | 0 (0.0%) |
| $2,500 to $2,999 | 51 (1.5%) | 0 (0.0%) |
| $3,000 or more | 14 (0.4%) | 0 (0.0%) |
| Total | 3,452 (100.0%) | 1,192 (100.0%) |
Physical Housing Characteristics in Montgomery County
Housing Structures in Montgomery County
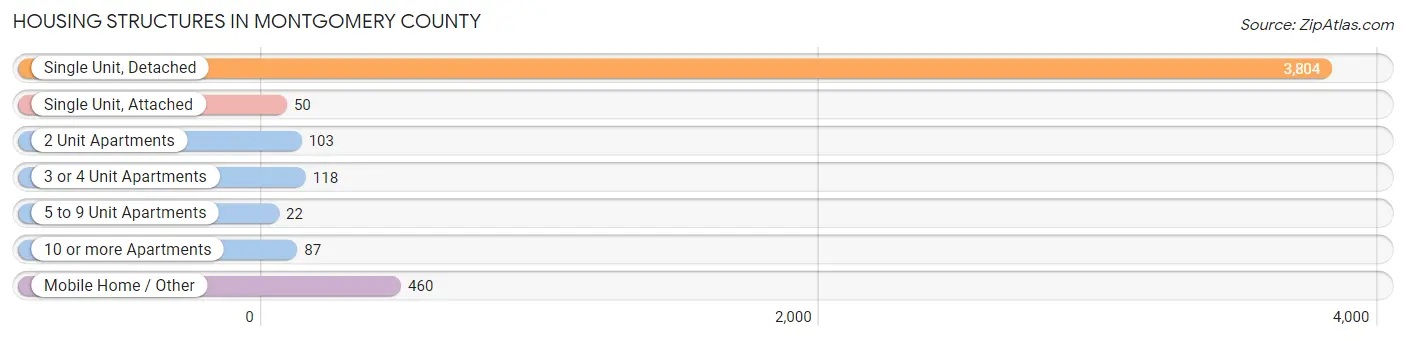
| Structure Type | # Housing Units | % Housing Units |
| Single Unit, Detached | 3,804 | 81.9% |
| Single Unit, Attached | 50 | 1.1% |
| 2 Unit Apartments | 103 | 2.2% |
| 3 or 4 Unit Apartments | 118 | 2.5% |
| 5 to 9 Unit Apartments | 22 | 0.5% |
| 10 or more Apartments | 87 | 1.9% |
| Mobile Home / Other | 460 | 9.9% |
| Total | 4,644 | 100.0% |
Housing Structures by Occupancy in Montgomery County
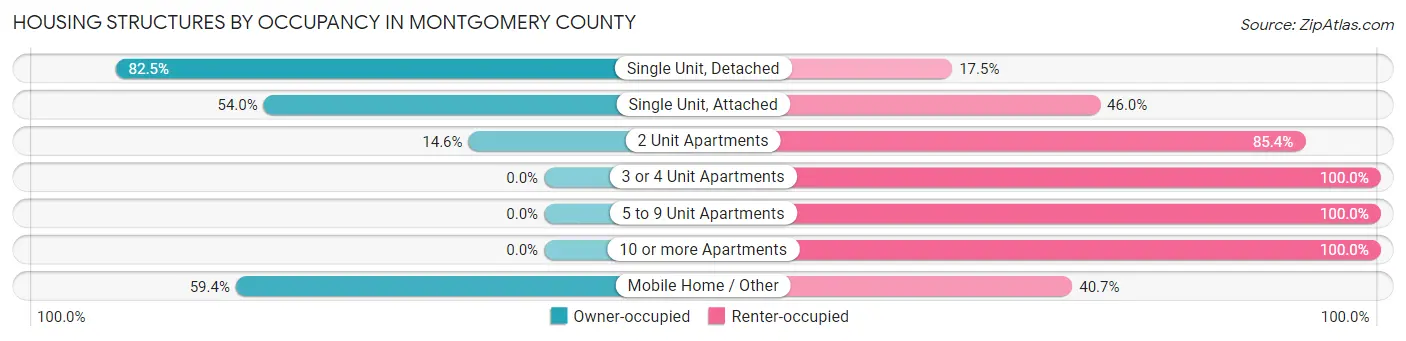
| Structure Type | Owner-occupied | Renter-occupied |
| Single Unit, Detached | 3,137 (82.5%) | 667 (17.5%) |
| Single Unit, Attached | 27 (54.0%) | 23 (46.0%) |
| 2 Unit Apartments | 15 (14.6%) | 88 (85.4%) |
| 3 or 4 Unit Apartments | 0 (0.0%) | 118 (100.0%) |
| 5 to 9 Unit Apartments | 0 (0.0%) | 22 (100.0%) |
| 10 or more Apartments | 0 (0.0%) | 87 (100.0%) |
| Mobile Home / Other | 273 (59.4%) | 187 (40.6%) |
| Total | 3,452 (74.3%) | 1,192 (25.7%) |
Housing Structures by Number of Rooms in Montgomery County
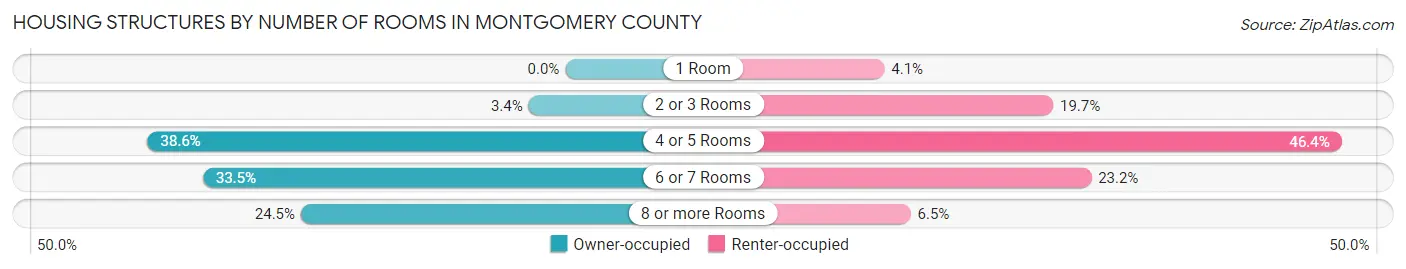
| Number of Rooms | Owner-occupied | Renter-occupied |
| 1 Room | 0 (0.0%) | 49 (4.1%) |
| 2 or 3 Rooms | 117 (3.4%) | 235 (19.7%) |
| 4 or 5 Rooms | 1,334 (38.6%) | 553 (46.4%) |
| 6 or 7 Rooms | 1,157 (33.5%) | 277 (23.2%) |
| 8 or more Rooms | 844 (24.4%) | 78 (6.5%) |
| Total | 3,452 (100.0%) | 1,192 (100.0%) |
Housing Structure by Heating Type in Montgomery County
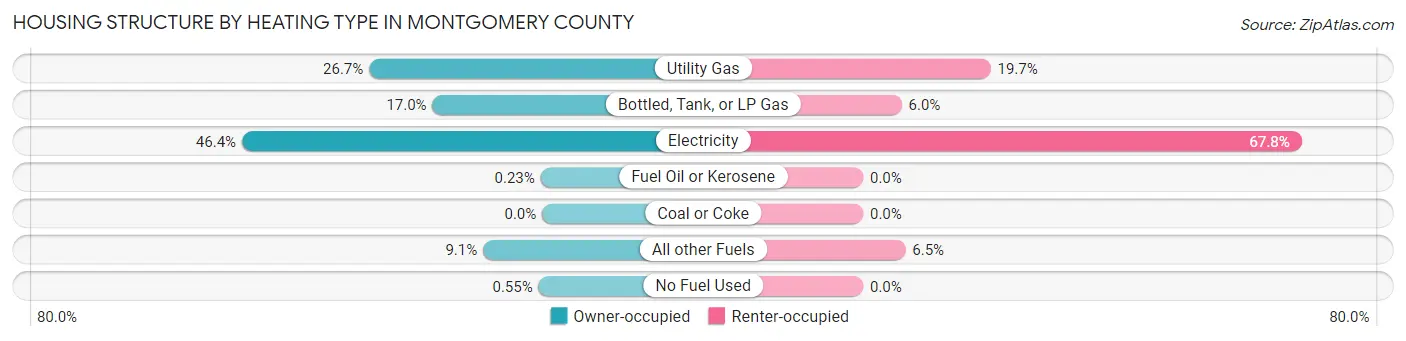
| Heating Type | Owner-occupied | Renter-occupied |
| Utility Gas | 923 (26.7%) | 235 (19.7%) |
| Bottled, Tank, or LP Gas | 585 (17.0%) | 71 (6.0%) |
| Electricity | 1,602 (46.4%) | 808 (67.8%) |
| Fuel Oil or Kerosene | 8 (0.2%) | 0 (0.0%) |
| Coal or Coke | 0 (0.0%) | 0 (0.0%) |
| All other Fuels | 315 (9.1%) | 78 (6.5%) |
| No Fuel Used | 19 (0.5%) | 0 (0.0%) |
| Total | 3,452 (100.0%) | 1,192 (100.0%) |
Household Vehicle Usage in Montgomery County
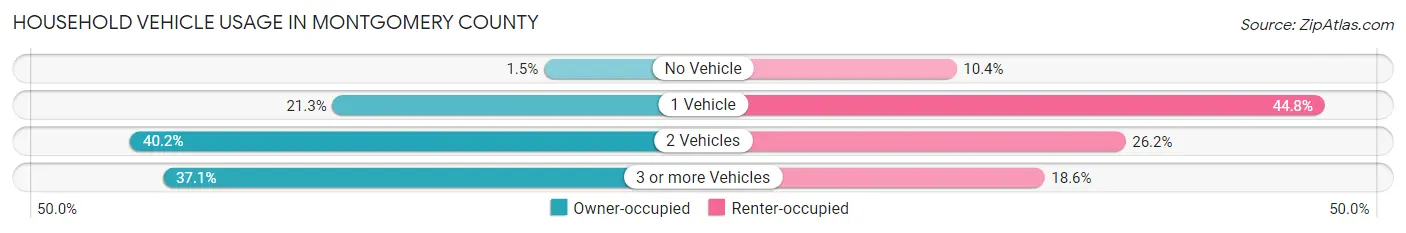
| Vehicles per Household | Owner-occupied | Renter-occupied |
| No Vehicle | 52 (1.5%) | 124 (10.4%) |
| 1 Vehicle | 734 (21.3%) | 534 (44.8%) |
| 2 Vehicles | 1,386 (40.2%) | 312 (26.2%) |
| 3 or more Vehicles | 1,280 (37.1%) | 222 (18.6%) |
| Total | 3,452 (100.0%) | 1,192 (100.0%) |
Real Estate & Mortgages in Montgomery County
Real Estate and Mortgage Overview in Montgomery County
| Characteristic | Without Mortgage | With Mortgage |
| Housing Units | 1,903 | 1,549 |
| Median Property Value | $151,700 | $168,000 |
| Median Household Income | $52,917 | $250 |
| Monthly Housing Costs | $446 | $13 |
| Real Estate Taxes | $1,190 | $18 |
Property Value by Mortgage Status in Montgomery County
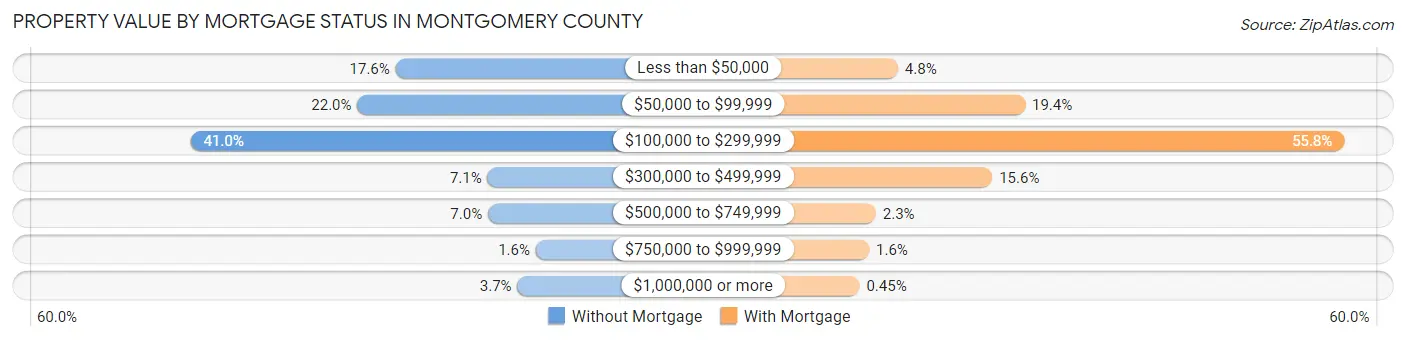
| Property Value | Without Mortgage | With Mortgage |
| Less than $50,000 | 335 (17.6%) | 75 (4.8%) |
| $50,000 to $99,999 | 418 (22.0%) | 300 (19.4%) |
| $100,000 to $299,999 | 781 (41.0%) | 865 (55.8%) |
| $300,000 to $499,999 | 135 (7.1%) | 242 (15.6%) |
| $500,000 to $749,999 | 134 (7.0%) | 36 (2.3%) |
| $750,000 to $999,999 | 30 (1.6%) | 24 (1.5%) |
| $1,000,000 or more | 70 (3.7%) | 7 (0.4%) |
| Total | 1,903 (100.0%) | 1,549 (100.0%) |
Household Income by Mortgage Status in Montgomery County
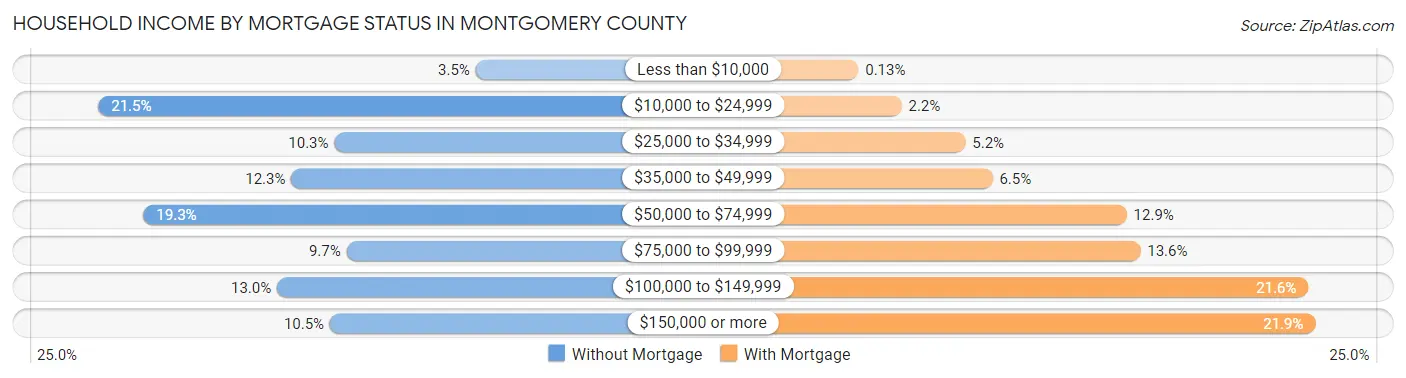
| Household Income | Without Mortgage | With Mortgage |
| Less than $10,000 | 67 (3.5%) | 2 (0.1%) |
| $10,000 to $24,999 | 409 (21.5%) | 34 (2.2%) |
| $25,000 to $34,999 | 195 (10.2%) | 81 (5.2%) |
| $35,000 to $49,999 | 234 (12.3%) | 101 (6.5%) |
| $50,000 to $74,999 | 368 (19.3%) | 200 (12.9%) |
| $75,000 to $99,999 | 184 (9.7%) | 210 (13.6%) |
| $100,000 to $149,999 | 247 (13.0%) | 334 (21.6%) |
| $150,000 or more | 199 (10.5%) | 339 (21.9%) |
| Total | 1,903 (100.0%) | 1,549 (100.0%) |
Property Value to Household Income Ratio in Montgomery County
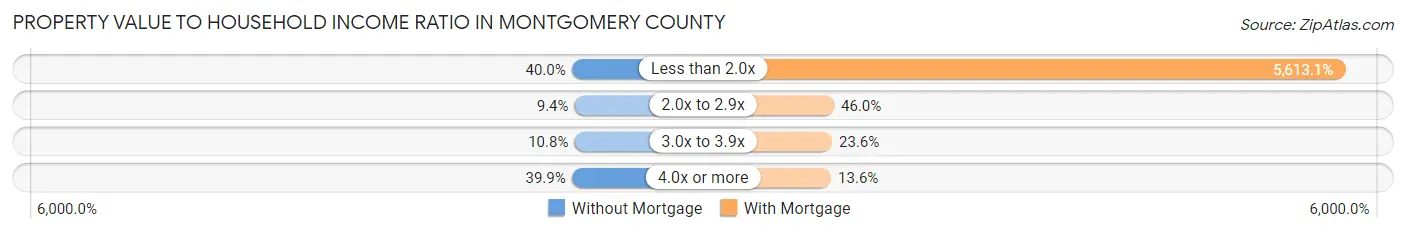
| Value-to-Income Ratio | Without Mortgage | With Mortgage |
| Less than 2.0x | 761 (40.0%) | 86,947 (5,613.1%) |
| 2.0x to 2.9x | 178 (9.3%) | 712 (46.0%) |
| 3.0x to 3.9x | 205 (10.8%) | 365 (23.6%) |
| 4.0x or more | 759 (39.9%) | 210 (13.6%) |
| Total | 1,903 (100.0%) | 1,549 (100.0%) |
Real Estate Taxes by Mortgage Status in Montgomery County
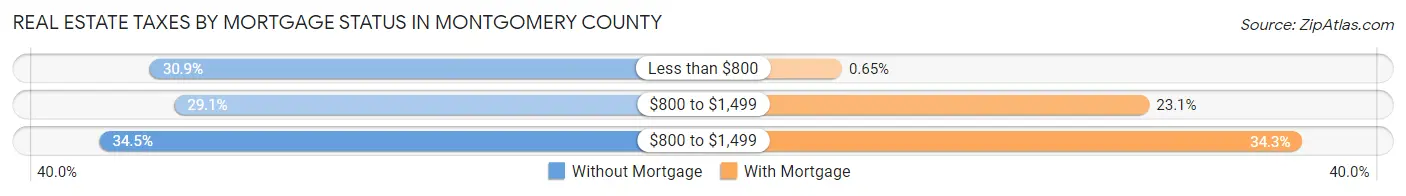
| Property Taxes | Without Mortgage | With Mortgage |
| Less than $800 | 587 (30.8%) | 10 (0.6%) |
| $800 to $1,499 | 553 (29.1%) | 358 (23.1%) |
| $800 to $1,499 | 657 (34.5%) | 531 (34.3%) |
| Total | 1,903 (100.0%) | 1,549 (100.0%) |
Health & Disability in Montgomery County
Health Insurance Coverage by Age in Montgomery County
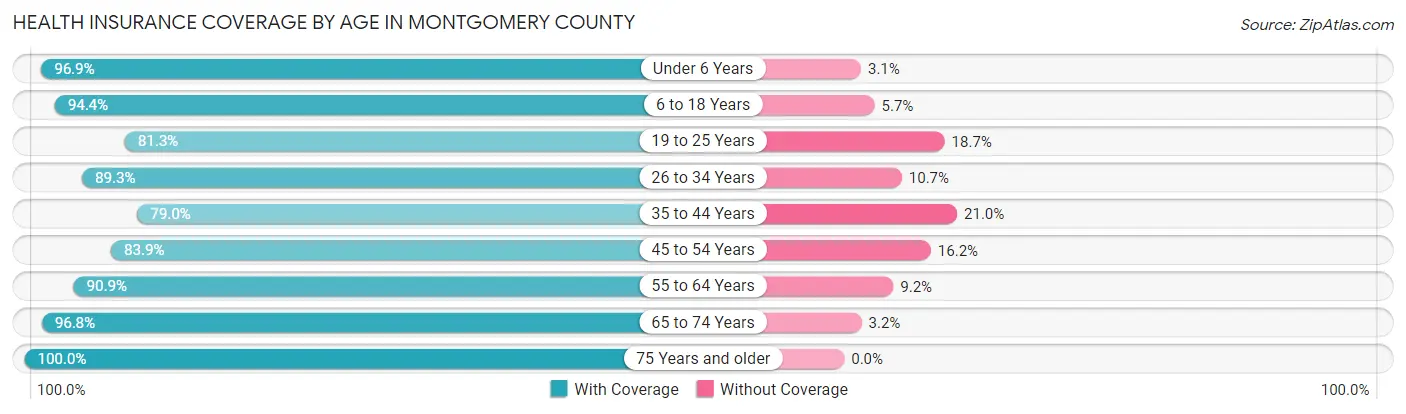
| Age Bracket | With Coverage | Without Coverage |
| Under 6 Years | 837 (96.9%) | 27 (3.1%) |
| 6 to 18 Years | 1,719 (94.4%) | 103 (5.7%) |
| 19 to 25 Years | 630 (81.3%) | 145 (18.7%) |
| 26 to 34 Years | 964 (89.3%) | 116 (10.7%) |
| 35 to 44 Years | 1,028 (79.0%) | 274 (21.0%) |
| 45 to 54 Years | 1,173 (83.9%) | 226 (16.2%) |
| 55 to 64 Years | 1,599 (90.8%) | 161 (9.1%) |
| 65 to 74 Years | 1,202 (96.8%) | 40 (3.2%) |
| 75 Years and older | 897 (100.0%) | 0 (0.0%) |
| Total | 10,049 (90.2%) | 1,092 (9.8%) |
Health Insurance Coverage by Citizenship Status in Montgomery County
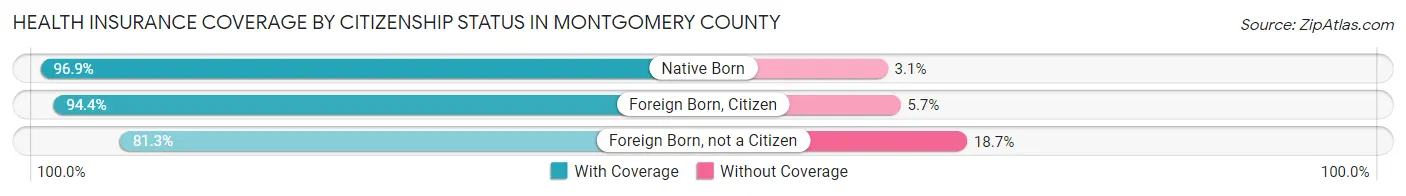
| Citizenship Status | With Coverage | Without Coverage |
| Native Born | 837 (96.9%) | 27 (3.1%) |
| Foreign Born, Citizen | 1,719 (94.4%) | 103 (5.7%) |
| Foreign Born, not a Citizen | 630 (81.3%) | 145 (18.7%) |
Health Insurance Coverage by Household Income in Montgomery County
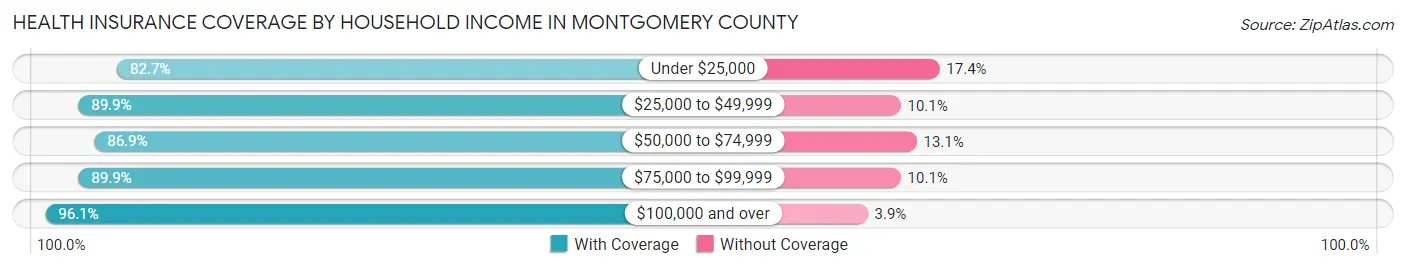
| Household Income | With Coverage | Without Coverage |
| Under $25,000 | 1,434 (82.7%) | 301 (17.3%) |
| $25,000 to $49,999 | 1,803 (89.9%) | 202 (10.1%) |
| $50,000 to $74,999 | 1,830 (86.9%) | 275 (13.1%) |
| $75,000 to $99,999 | 1,559 (89.9%) | 175 (10.1%) |
| $100,000 and over | 3,407 (96.1%) | 138 (3.9%) |
Public vs Private Health Insurance Coverage by Age in Montgomery County
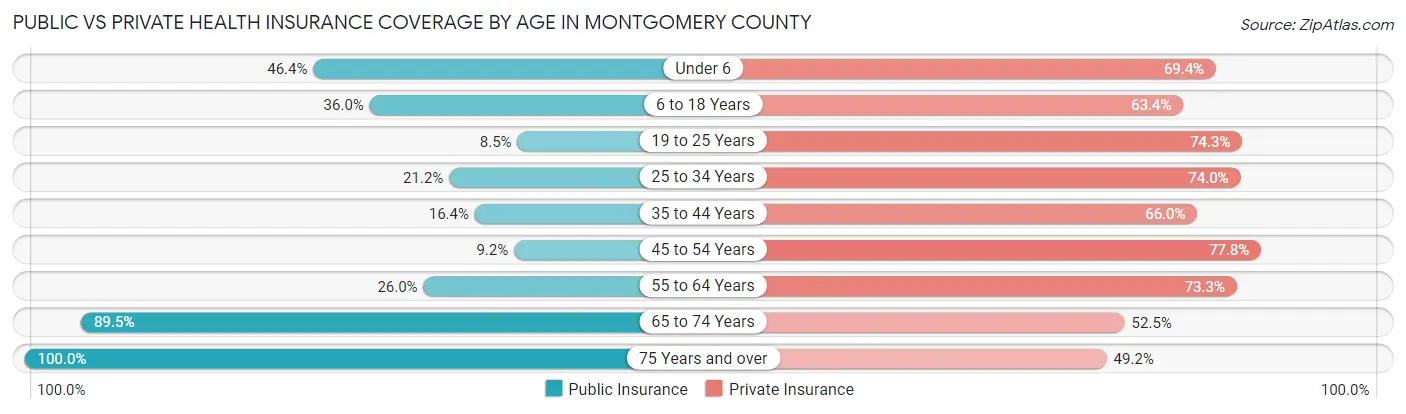
| Age Bracket | Public Insurance | Private Insurance |
| Under 6 | 401 (46.4%) | 600 (69.4%) |
| 6 to 18 Years | 655 (35.9%) | 1,155 (63.4%) |
| 19 to 25 Years | 66 (8.5%) | 576 (74.3%) |
| 25 to 34 Years | 229 (21.2%) | 799 (74.0%) |
| 35 to 44 Years | 214 (16.4%) | 859 (66.0%) |
| 45 to 54 Years | 128 (9.1%) | 1,089 (77.8%) |
| 55 to 64 Years | 457 (26.0%) | 1,290 (73.3%) |
| 65 to 74 Years | 1,112 (89.5%) | 652 (52.5%) |
| 75 Years and over | 897 (100.0%) | 441 (49.2%) |
| Total | 4,159 (37.3%) | 7,461 (67.0%) |
Disability Status by Sex by Age in Montgomery County
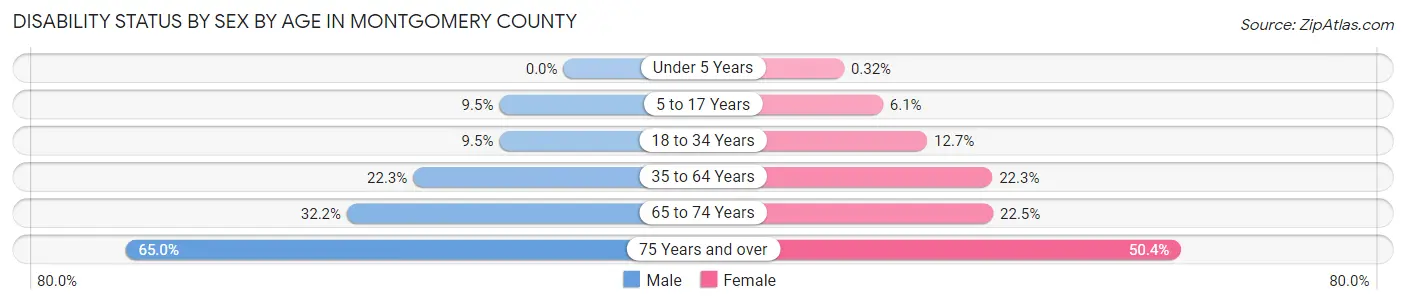
| Age Bracket | Male | Female |
| Under 5 Years | 0 (0.0%) | 1 (0.3%) |
| 5 to 17 Years | 98 (9.5%) | 51 (6.1%) |
| 18 to 34 Years | 98 (9.5%) | 124 (12.7%) |
| 35 to 64 Years | 486 (22.3%) | 510 (22.3%) |
| 65 to 74 Years | 199 (32.2%) | 140 (22.5%) |
| 75 Years and over | 249 (65.0%) | 259 (50.4%) |
Disability Class by Sex by Age in Montgomery County
Disability Class: Hearing Difficulty
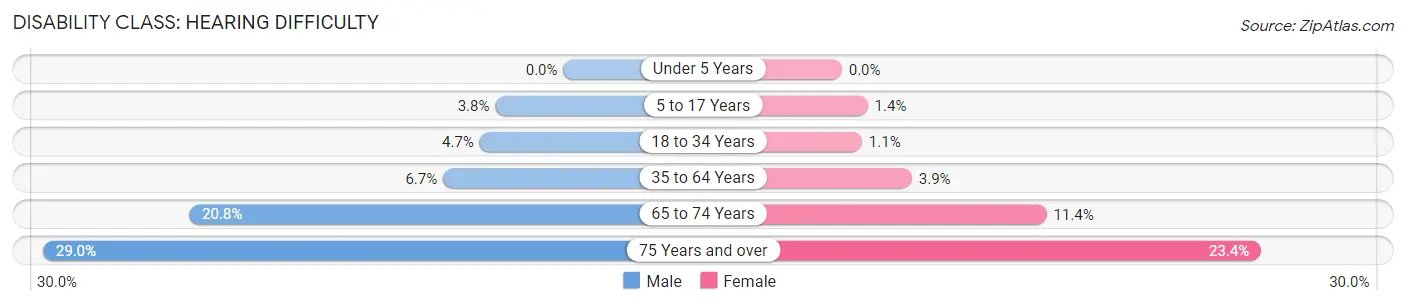
| Age Bracket | Male | Female |
| Under 5 Years | 0 (0.0%) | 0 (0.0%) |
| 5 to 17 Years | 39 (3.8%) | 12 (1.4%) |
| 18 to 34 Years | 48 (4.7%) | 11 (1.1%) |
| 35 to 64 Years | 146 (6.7%) | 89 (3.9%) |
| 65 to 74 Years | 129 (20.8%) | 71 (11.4%) |
| 75 Years and over | 111 (29.0%) | 120 (23.4%) |
Disability Class: Vision Difficulty
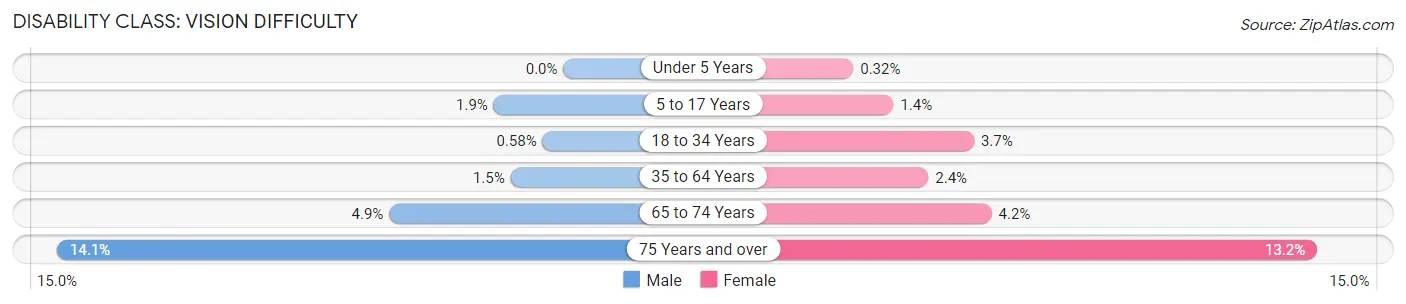
| Age Bracket | Male | Female |
| Under 5 Years | 0 (0.0%) | 1 (0.3%) |
| 5 to 17 Years | 20 (1.9%) | 12 (1.4%) |
| 18 to 34 Years | 6 (0.6%) | 36 (3.7%) |
| 35 to 64 Years | 32 (1.5%) | 55 (2.4%) |
| 65 to 74 Years | 30 (4.9%) | 26 (4.2%) |
| 75 Years and over | 54 (14.1%) | 68 (13.2%) |
Disability Class: Cognitive Difficulty
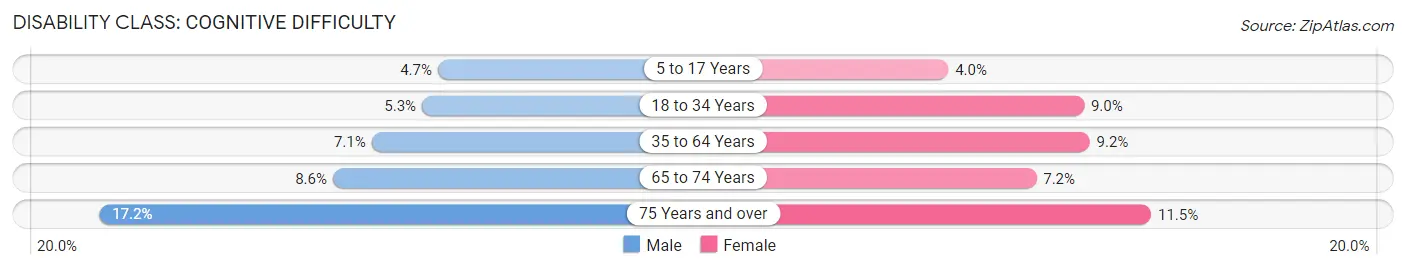
| Age Bracket | Male | Female |
| 5 to 17 Years | 48 (4.7%) | 33 (4.0%) |
| 18 to 34 Years | 54 (5.2%) | 88 (9.0%) |
| 35 to 64 Years | 155 (7.1%) | 210 (9.2%) |
| 65 to 74 Years | 53 (8.6%) | 45 (7.2%) |
| 75 Years and over | 66 (17.2%) | 59 (11.5%) |
Disability Class: Ambulatory Difficulty
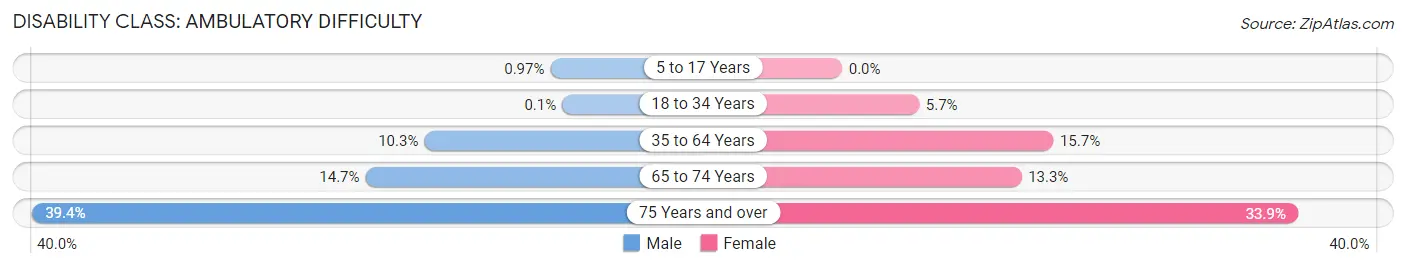
| Age Bracket | Male | Female |
| 5 to 17 Years | 10 (1.0%) | 0 (0.0%) |
| 18 to 34 Years | 1 (0.1%) | 56 (5.7%) |
| 35 to 64 Years | 225 (10.3%) | 358 (15.7%) |
| 65 to 74 Years | 91 (14.7%) | 83 (13.3%) |
| 75 Years and over | 151 (39.4%) | 174 (33.9%) |
Disability Class: Self-Care Difficulty
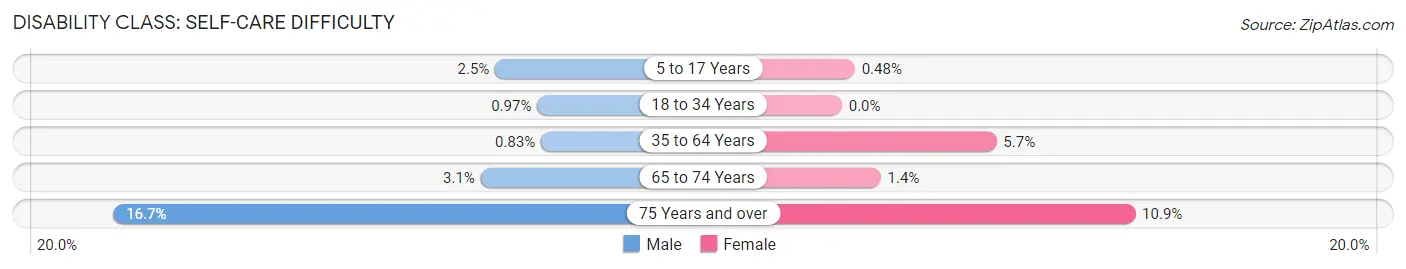
| Age Bracket | Male | Female |
| 5 to 17 Years | 26 (2.5%) | 4 (0.5%) |
| 18 to 34 Years | 10 (1.0%) | 0 (0.0%) |
| 35 to 64 Years | 18 (0.8%) | 131 (5.7%) |
| 65 to 74 Years | 19 (3.1%) | 9 (1.4%) |
| 75 Years and over | 64 (16.7%) | 56 (10.9%) |
Technology Access in Montgomery County
Computing Device Access in Montgomery County
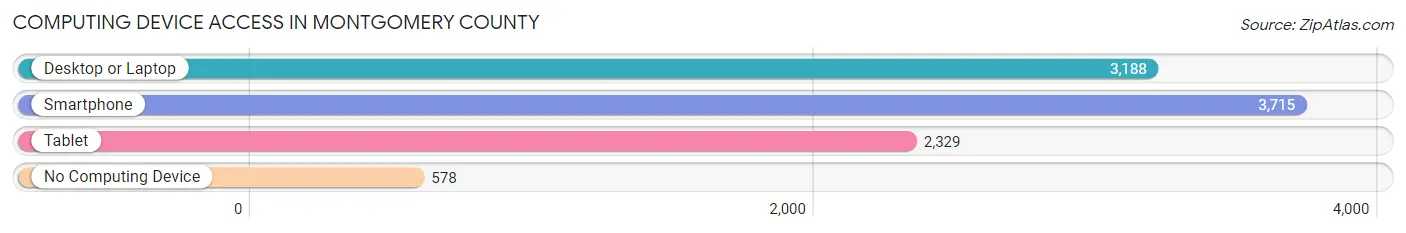
| Device Type | # Households | % Households |
| Desktop or Laptop | 3,188 | 68.6% |
| Smartphone | 3,715 | 80.0% |
| Tablet | 2,329 | 50.1% |
| No Computing Device | 578 | 12.4% |
| Total | 4,644 | 100.0% |
Internet Access in Montgomery County
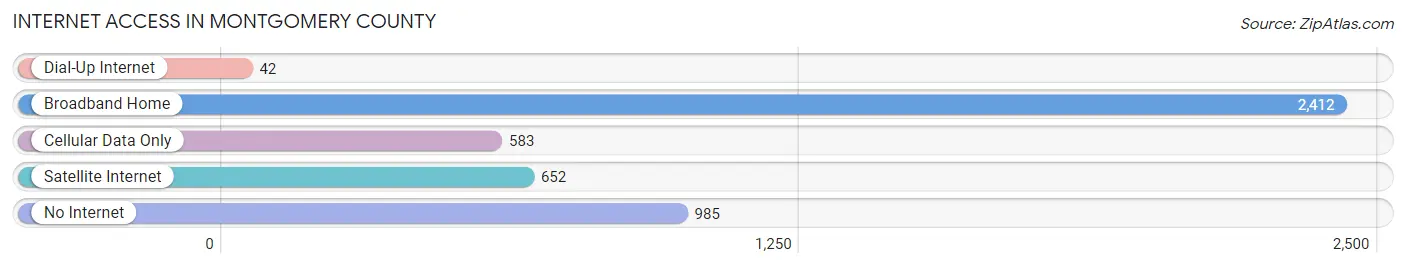
| Internet Type | # Households | % Households |
| Dial-Up Internet | 42 | 0.9% |
| Broadband Home | 2,412 | 51.9% |
| Cellular Data Only | 583 | 12.6% |
| Satellite Internet | 652 | 14.0% |
| No Internet | 985 | 21.2% |
| Total | 4,644 | 100.0% |
Montgomery County Summary
Montgomery County, Missouri is located in the east-central part of the state, and is part of the St. Louis Metropolitan Statistical Area. The county was established in 1818 and named after Richard Montgomery, an American Revolutionary War hero. The county seat is Montgomery City, and the largest city is Wellsville. As of the 2010 census, the population was 12,236.
Geography
Montgomery County is located in the east-central part of Missouri, and is bordered by Audrain County to the north, Callaway County to the east, Gasconade County to the south, and Warren County to the west. The county has a total area of 545 square miles, of which 544 square miles is land and 1.2 square miles (0.2%) is water. The county is located in the Ozark Plateau region of Missouri, and is characterized by rolling hills and valleys. The major waterways in the county are the Cuivre River, the Bourbeuse River, and the Loutre River.
Demographics
As of the 2010 census, there were 12,236 people, 4,845 households, and 3,364 families residing in the county. The population density was 22.4 people per square mile. The racial makeup of the county was 97.3% White, 0.7% Black or African American, 0.3% Native American, 0.2% Asian, 0.2% from other races, and 1.3% from two or more races. 1.3% of the population were Hispanic or Latino of any race.
There were 4,845 households, out of which 30.2% had children under the age of 18 living with them, 56.2% were married couples living together, 9.2% had a female householder with no husband present, and 30.2% were non-families. 25.7% of all households were made up of individuals, and 11.7% had someone living alone who was 65 years of age or older. The average household size was 2.50 and the average family size was 3.00.
The median age in the county was 40.3 years. 24.7% of residents were under the age of 18; 7.7% were between the ages of 18 and 24; 23.7% were from 25 to 44; 28.2% were from 45 to 64; and 15.7% were 65 years of age or older. The gender makeup of the county was 48.7% male and 51.3% female.
Economy
The economy of Montgomery County is largely based on agriculture. The county is home to a variety of crops, including corn, soybeans, wheat, hay, and oats. Livestock production is also important to the county’s economy, with beef cattle, dairy cattle, and hogs being the primary livestock raised.
The county also has a number of manufacturing and service industries. The largest employers in the county are the Montgomery County Hospital, the Montgomery County School District, and the Montgomery County Sheriff’s Office. Other major employers include the Montgomery County Courthouse, the Montgomery County Public Works Department, and the Montgomery County Road and Bridge Department.
The median household income in the county was $41,945 in 2017, and the median family income was $50,945. The per capita income was $20,945. About 11.2% of families and 14.2% of the population were below the poverty line, including 19.2% of those under age 18 and 8.2% of those age 65 or over.
Conclusion
Montgomery County, Missouri is a rural county located in the east-central part of the state. The county is home to a variety of agricultural and manufacturing industries, and is part of the St. Louis Metropolitan Statistical Area. The population of the county was 12,236 as of the 2010 census, and the median household income was $41,945 in 2017.
Common Questions
What is Per Capita Income in Montgomery County?
Per Capita income in Montgomery County is $29,570.
What is the Median Family Income in Montgomery County?
Median Family Income in Montgomery County is $74,714.
What is the Median Household income in Montgomery County?
Median Household Income in Montgomery County is $58,660.
What is Income or Wage Gap in Montgomery County?
Income or Wage Gap in Montgomery County is 34.1%.
Women in Montgomery County earn 65.9 cents for every dollar earned by a man.
What is Family Income Deficit in Montgomery County?
Family Income Deficit in Montgomery County is $11,824.
Families that are below poverty line in Montgomery County earn $11,824 less on average than the poverty threshold level.
What is Inequality or Gini Index in Montgomery County?
Inequality or Gini Index in Montgomery County is 0.43.
What is the Total Population of Montgomery County?
Total Population of Montgomery County is 11,421.
What is the Total Male Population of Montgomery County?
Total Male Population of Montgomery County is 5,756.
What is the Total Female Population of Montgomery County?
Total Female Population of Montgomery County is 5,665.
What is the Ratio of Males per 100 Females in Montgomery County?
There are 101.61 Males per 100 Females in Montgomery County.
What is the Ratio of Females per 100 Males in Montgomery County?
There are 98.42 Females per 100 Males in Montgomery County.
What is the Median Population Age in Montgomery County?
Median Population Age in Montgomery County is 43.8 Years.
What is the Average Family Size in Montgomery County
Average Family Size in Montgomery County is 3.0 People.
What is the Average Household Size in Montgomery County
Average Household Size in Montgomery County is 2.4 People.
How Large is the Labor Force in Montgomery County?
There are 5,283 People in the Labor Forcein in Montgomery County.
What is the Percentage of People in the Labor Force in Montgomery County?
57.5% of People are in the Labor Force in Montgomery County.
What is the Unemployment Rate in Montgomery County?
Unemployment Rate in Montgomery County is 3.0%.