Monroe County, MO Map & Demographics
Monroe County Overview
$28,787
PER CAPITA INCOME
$69,286
AVG FAMILY INCOME
$50,245
AVG HOUSEHOLD INCOME
35.3%
WAGE / INCOME GAP [ % ]
64.7¢/ $1
WAGE / INCOME GAP [ $ ]
0.48
INEQUALITY / GINI INDEX
8,668
TOTAL POPULATION
4,445
MALE POPULATION
4,223
FEMALE POPULATION
105.26
MALES / 100 FEMALES
95.01
FEMALES / 100 MALES
45.8
MEDIAN AGE
3.2
AVG FAMILY SIZE
2.5
AVG HOUSEHOLD SIZE
3,660
LABOR FORCE [ PEOPLE ]
52.0%
PERCENT IN LABOR FORCE
1.2%
UNEMPLOYMENT RATE
Income in Monroe County
Income Overview in Monroe County
Per Capita Income in Monroe County is $28,787, while median incomes of families and households are $69,286 and $50,245 respectively.
| Characteristic | Number | Measure |
| Per Capita Income | 8,668 | $28,787 |
| Median Family Income | 2,188 | $69,286 |
| Mean Family Income | 2,188 | $86,386 |
| Median Household Income | 3,425 | $50,245 |
| Mean Household Income | 3,425 | $67,200 |
| Income Deficit | 2,188 | $0 |
| Wage / Income Gap (%) | 8,668 | 35.32% |
| Wage / Income Gap ($) | 8,668 | 64.68¢ per $1 |
| Gini / Inequality Index | 8,668 | 0.48 |
Earnings by Sex in Monroe County
Average Earnings in Monroe County are $35,813, $42,065 for men and $27,208 for women, a difference of 35.3%.
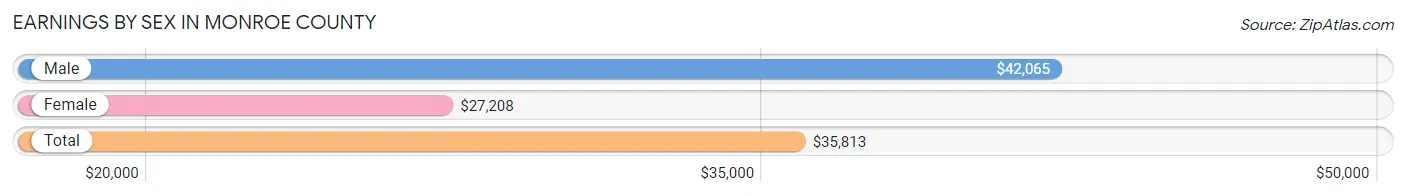
| Sex | Number | Average Earnings |
| Male | 2,200 (55.9%) | $42,065 |
| Female | 1,737 (44.1%) | $27,208 |
| Total | 3,937 (100.0%) | $35,813 |
Earnings by Sex by Income Bracket in Monroe County
The most common earnings brackets in Monroe County are $75,000 to $99,999 for men (255 | 11.6%) and $25,000 to $29,999 for women (209 | 12.0%).
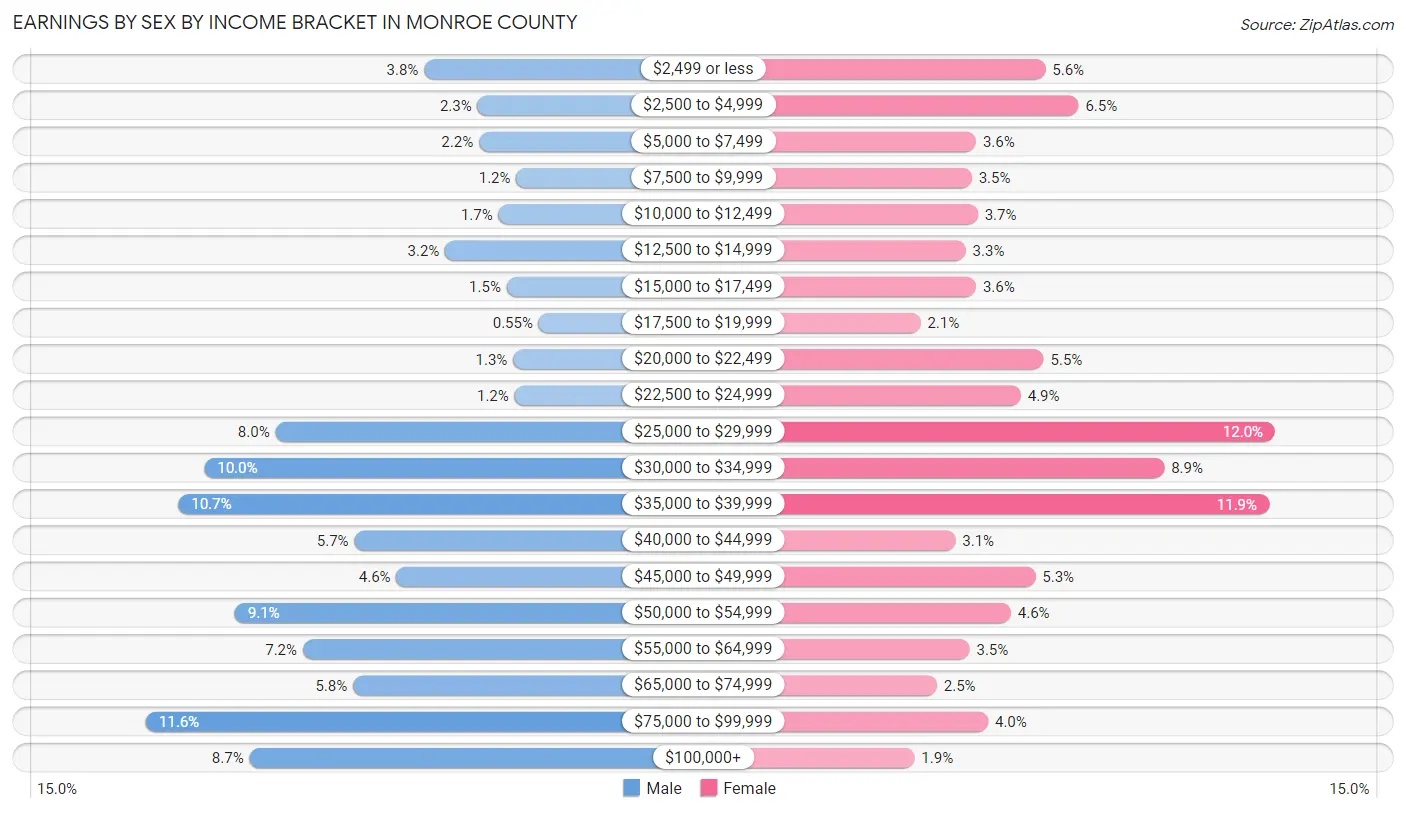
| Income | Male | Female |
| $2,499 or less | 83 (3.8%) | 97 (5.6%) |
| $2,500 to $4,999 | 50 (2.3%) | 113 (6.5%) |
| $5,000 to $7,499 | 49 (2.2%) | 63 (3.6%) |
| $7,500 to $9,999 | 26 (1.2%) | 61 (3.5%) |
| $10,000 to $12,499 | 37 (1.7%) | 64 (3.7%) |
| $12,500 to $14,999 | 70 (3.2%) | 58 (3.3%) |
| $15,000 to $17,499 | 32 (1.5%) | 63 (3.6%) |
| $17,500 to $19,999 | 12 (0.5%) | 36 (2.1%) |
| $20,000 to $22,499 | 28 (1.3%) | 96 (5.5%) |
| $22,500 to $24,999 | 27 (1.2%) | 85 (4.9%) |
| $25,000 to $29,999 | 175 (8.0%) | 209 (12.0%) |
| $30,000 to $34,999 | 219 (10.0%) | 155 (8.9%) |
| $35,000 to $39,999 | 235 (10.7%) | 206 (11.9%) |
| $40,000 to $44,999 | 126 (5.7%) | 53 (3.0%) |
| $45,000 to $49,999 | 100 (4.5%) | 92 (5.3%) |
| $50,000 to $54,999 | 200 (9.1%) | 80 (4.6%) |
| $55,000 to $64,999 | 158 (7.2%) | 60 (3.5%) |
| $65,000 to $74,999 | 127 (5.8%) | 44 (2.5%) |
| $75,000 to $99,999 | 255 (11.6%) | 69 (4.0%) |
| $100,000+ | 191 (8.7%) | 33 (1.9%) |
| Total | 2,200 (100.0%) | 1,737 (100.0%) |
Earnings by Sex by Educational Attainment in Monroe County
Average earnings in Monroe County are $45,423 for men and $29,809 for women, a difference of 34.4%. Men with an educational attainment of graduate degree enjoy the highest average annual earnings of $52,500, while those with high school diploma education earn the least with $43,700. Women with an educational attainment of graduate degree earn the most with the average annual earnings of $45,000, while those with college or associate's degree education have the smallest earnings of $24,844.
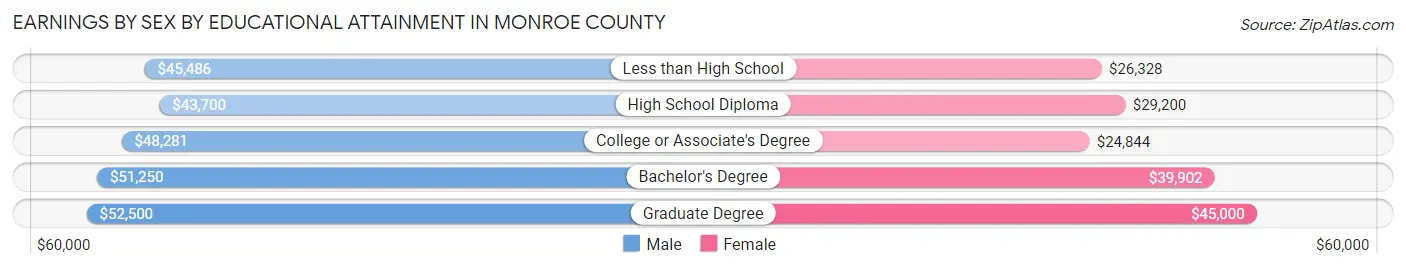
| Educational Attainment | Male Income | Female Income |
| Less than High School | $45,486 | $26,328 |
| High School Diploma | $43,700 | $29,200 |
| College or Associate's Degree | $48,281 | $24,844 |
| Bachelor's Degree | $51,250 | $39,902 |
| Graduate Degree | $52,500 | $45,000 |
| Total | $45,423 | $29,809 |
Family Income in Monroe County
Family Income Brackets in Monroe County
According to the Monroe County family income data, there are 558 families falling into the $50,000 to $74,999 income range, which is the most common income bracket and makes up 25.5% of all families. Conversely, the $10,000 to $14,999 income bracket is the least frequent group with only 48 families (2.2%) belonging to this category.
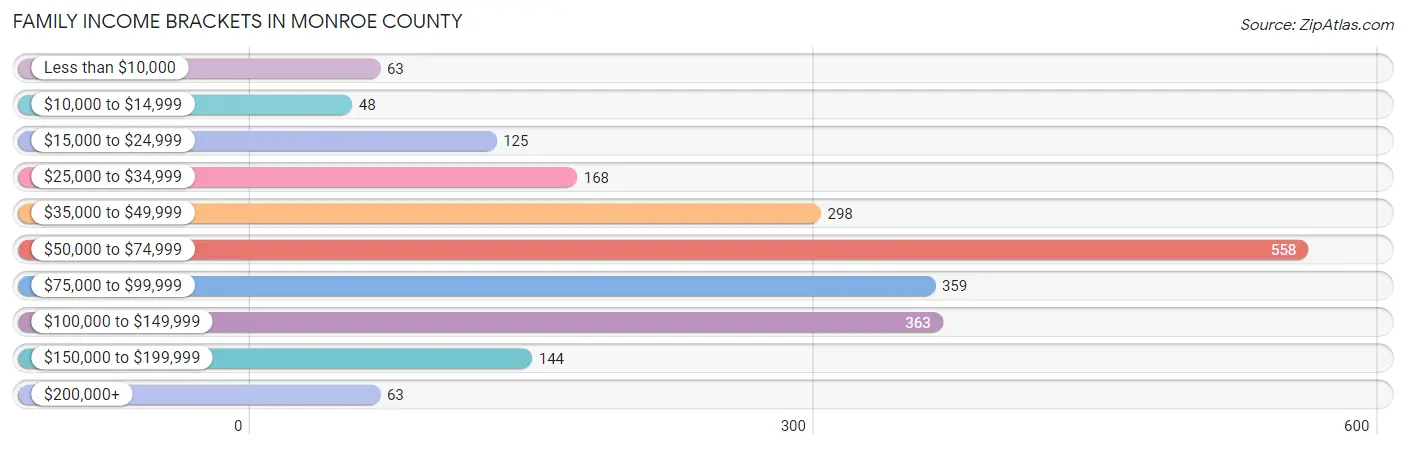
| Income Bracket | # Families | % Families |
| Less than $10,000 | 63 | 2.9% |
| $10,000 to $14,999 | 48 | 2.2% |
| $15,000 to $24,999 | 125 | 5.7% |
| $25,000 to $34,999 | 168 | 7.7% |
| $35,000 to $49,999 | 298 | 13.6% |
| $50,000 to $74,999 | 558 | 25.5% |
| $75,000 to $99,999 | 359 | 16.4% |
| $100,000 to $149,999 | 363 | 16.6% |
| $150,000 to $199,999 | 144 | 6.6% |
| $200,000+ | 63 | 2.9% |
Family Income by Famaliy Size in Monroe County
7+ person families (78 | 3.6%) account for the highest median family income in Monroe County with $120,893 per family, while 2-person families (1,304 | 59.6%) have the highest median income of $28,524 per family member.
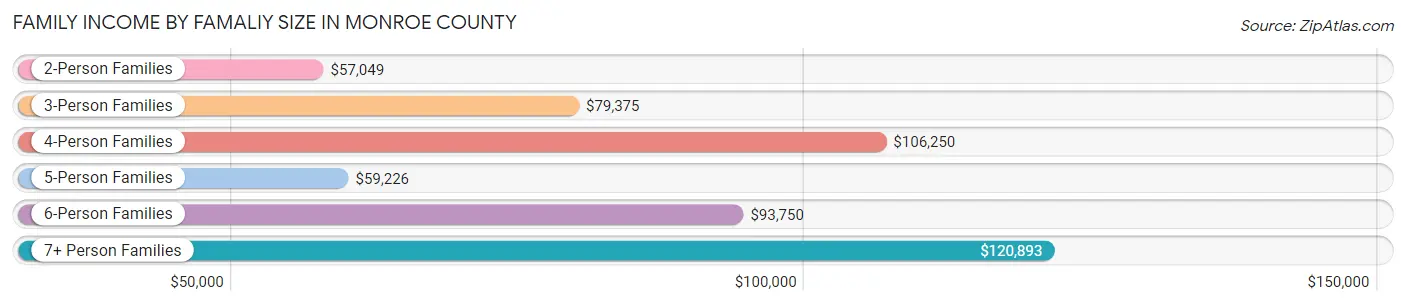
| Income Bracket | # Families | Median Income |
| 2-Person Families | 1,304 (59.6%) | $57,049 |
| 3-Person Families | 342 (15.6%) | $79,375 |
| 4-Person Families | 252 (11.5%) | $106,250 |
| 5-Person Families | 175 (8.0%) | $59,226 |
| 6-Person Families | 37 (1.7%) | $93,750 |
| 7+ Person Families | 78 (3.6%) | $120,893 |
| Total | 2,188 (100.0%) | $69,286 |
Family Income by Number of Earners in Monroe County
The median family income in Monroe County is $69,286, with families comprising 3+ earners (230) having the highest median family income of $129,250, while families with no earners (486) have the lowest median family income of $43,929, accounting for 10.5% and 22.2% of families, respectively.
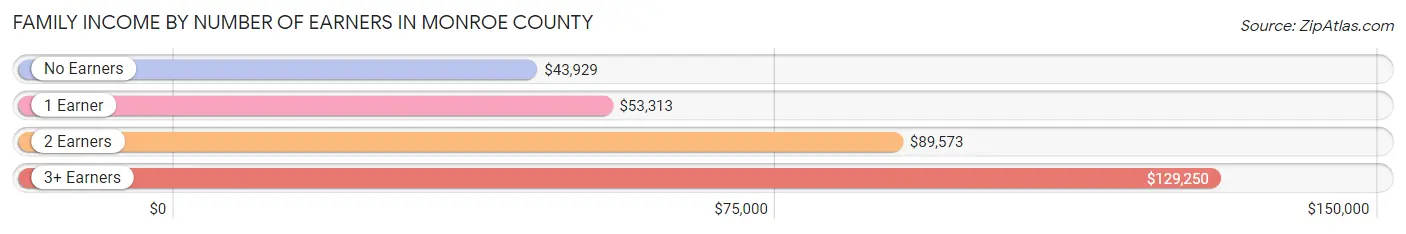
| Number of Earners | # Families | Median Income |
| No Earners | 486 (22.2%) | $43,929 |
| 1 Earner | 736 (33.6%) | $53,313 |
| 2 Earners | 736 (33.6%) | $89,573 |
| 3+ Earners | 230 (10.5%) | $129,250 |
| Total | 2,188 (100.0%) | $69,286 |
Household Income in Monroe County
Household Income Brackets in Monroe County
With 658 households falling in the category, the $50,000 to $74,999 income range is the most frequent in Monroe County, accounting for 19.2% of all households. In contrast, only 62 households (1.8%) fall into the $200,000+ income bracket, making it the least populous group.
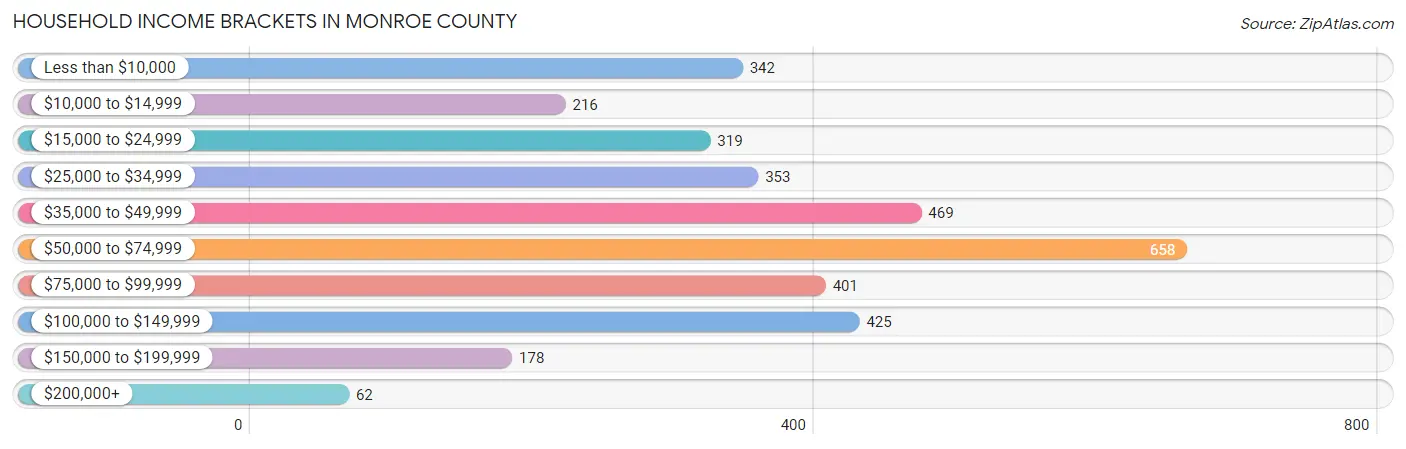
| Income Bracket | # Households | % Households |
| Less than $10,000 | 342 | 10.0% |
| $10,000 to $14,999 | 216 | 6.3% |
| $15,000 to $24,999 | 319 | 9.3% |
| $25,000 to $34,999 | 353 | 10.3% |
| $35,000 to $49,999 | 469 | 13.7% |
| $50,000 to $74,999 | 658 | 19.2% |
| $75,000 to $99,999 | 401 | 11.7% |
| $100,000 to $149,999 | 425 | 12.4% |
| $150,000 to $199,999 | 178 | 5.2% |
| $200,000+ | 62 | 1.8% |
Household Income by Householder Age in Monroe County
The median household income in Monroe County is $50,245, with the highest median household income of $70,954 found in the 25 to 44 years age bracket for the primary householder. A total of 786 households (23.0%) fall into this category. Meanwhile, the 65+ years age bracket for the primary householder has the lowest median household income of $32,750, with 1,332 households (38.9%) in this group.
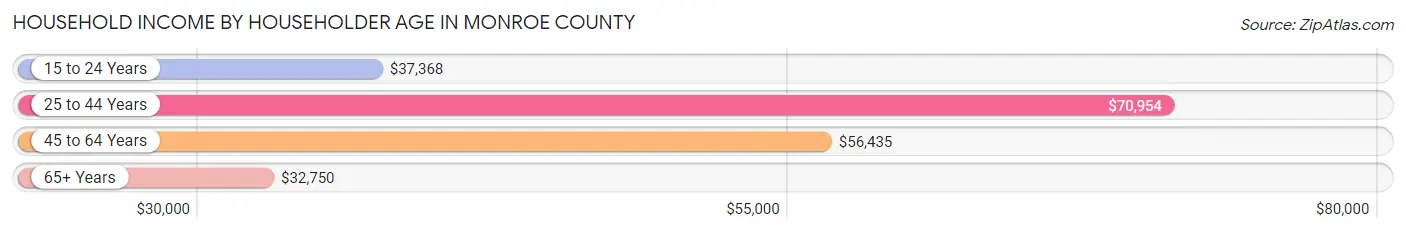
| Income Bracket | # Households | Median Income |
| 15 to 24 Years | 78 (2.3%) | $37,368 |
| 25 to 44 Years | 786 (23.0%) | $70,954 |
| 45 to 64 Years | 1,229 (35.9%) | $56,435 |
| 65+ Years | 1,332 (38.9%) | $32,750 |
| Total | 3,425 (100.0%) | $50,245 |
Poverty in Monroe County
Income Below Poverty by Sex and Age in Monroe County
With 14.6% poverty level for males and 18.4% for females among the residents of Monroe County, 5 year old males and under 5 year old females are the most vulnerable to poverty, with 30 males (60.0%) and 110 females (50.5%) in their respective age groups living below the poverty level.

| Age Bracket | Male | Female |
| Under 5 Years | 21 (8.8%) | 110 (50.5%) |
| 5 Years | 30 (60.0%) | 1 (14.3%) |
| 6 to 11 Years | 88 (25.7%) | 41 (11.7%) |
| 12 to 14 Years | 42 (19.2%) | 18 (17.0%) |
| 15 Years | 0 (0.0%) | 0 (0.0%) |
| 16 and 17 Years | 2 (1.8%) | 19 (10.9%) |
| 18 to 24 Years | 29 (9.1%) | 57 (17.4%) |
| 25 to 34 Years | 50 (11.8%) | 88 (23.1%) |
| 35 to 44 Years | 44 (9.6%) | 25 (5.9%) |
| 45 to 54 Years | 64 (13.1%) | 138 (30.3%) |
| 55 to 64 Years | 104 (15.2%) | 56 (8.5%) |
| 65 to 74 Years | 106 (18.2%) | 98 (17.2%) |
| 75 Years and over | 57 (14.4%) | 116 (24.8%) |
| Total | 637 (14.6%) | 767 (18.4%) |
Income Above Poverty by Sex and Age in Monroe County
According to the poverty statistics in Monroe County, males aged 15 years and females aged 15 years are the age groups that are most secure financially, with 100.0% of males and 100.0% of females in these age groups living above the poverty line.
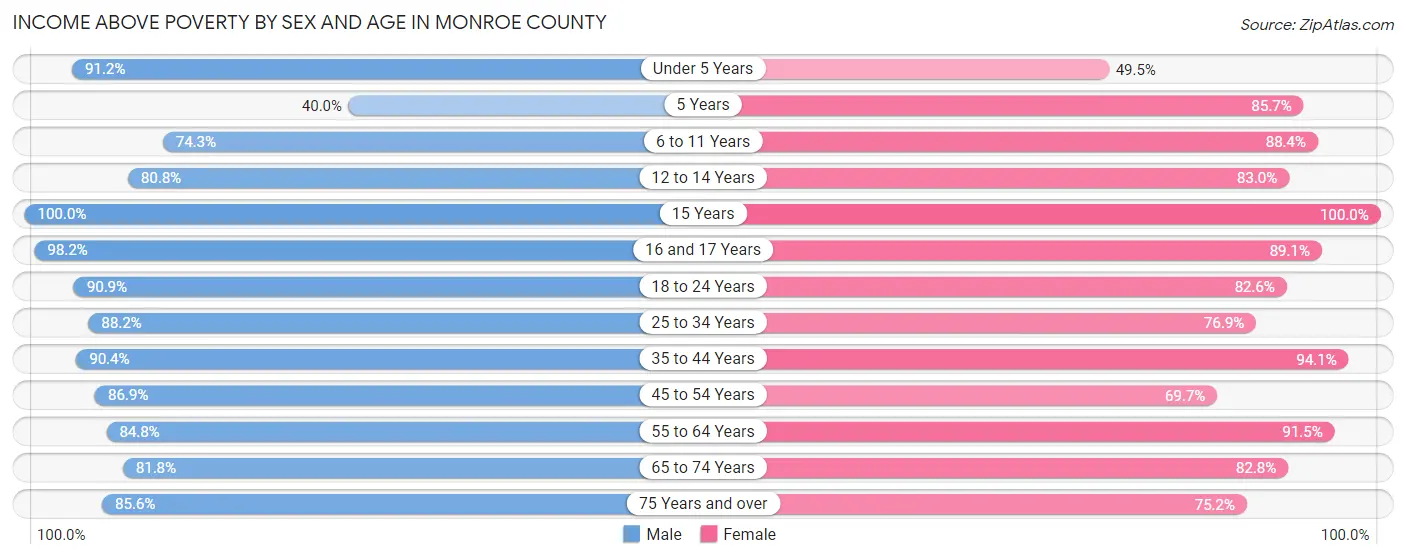
| Age Bracket | Male | Female |
| Under 5 Years | 217 (91.2%) | 108 (49.5%) |
| 5 Years | 20 (40.0%) | 6 (85.7%) |
| 6 to 11 Years | 255 (74.3%) | 311 (88.3%) |
| 12 to 14 Years | 177 (80.8%) | 88 (83.0%) |
| 15 Years | 56 (100.0%) | 23 (100.0%) |
| 16 and 17 Years | 107 (98.2%) | 155 (89.1%) |
| 18 to 24 Years | 288 (90.8%) | 270 (82.6%) |
| 25 to 34 Years | 372 (88.1%) | 293 (76.9%) |
| 35 to 44 Years | 414 (90.4%) | 395 (94.1%) |
| 45 to 54 Years | 425 (86.9%) | 317 (69.7%) |
| 55 to 64 Years | 580 (84.8%) | 600 (91.5%) |
| 65 to 74 Years | 475 (81.8%) | 473 (82.8%) |
| 75 Years and over | 339 (85.6%) | 351 (75.2%) |
| Total | 3,725 (85.4%) | 3,390 (81.6%) |
Income Below Poverty Among Married-Couple Families in Monroe County
The poverty statistics for married-couple families in Monroe County show that 6.2% or 109 of the total 1,767 families live below the poverty line. Families with 3 or 4 children have the highest poverty rate of 20.8%, comprising of 38 families. On the other hand, families with 1 or 2 children have the lowest poverty rate of 2.3%, which includes 7 families.
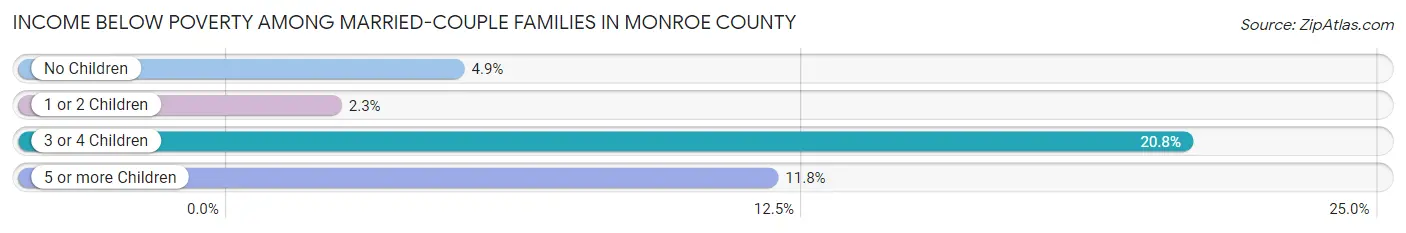
| Children | Above Poverty | Below Poverty |
| No Children | 1,195 (95.1%) | 62 (4.9%) |
| 1 or 2 Children | 303 (97.7%) | 7 (2.3%) |
| 3 or 4 Children | 145 (79.2%) | 38 (20.8%) |
| 5 or more Children | 15 (88.2%) | 2 (11.8%) |
| Total | 1,658 (93.8%) | 109 (6.2%) |
Income Below Poverty Among Single-Parent Households in Monroe County
According to the poverty data in Monroe County, 14.1% or 17 single-father households and 25.7% or 77 single-mother households are living below the poverty line. Among single-father households, those with 5 or more children have the highest poverty rate, with 14 households (100.0%) experiencing poverty. Likewise, among single-mother households, those with 5 or more children have the highest poverty rate, with 1 households (100.0%) falling below the poverty line.
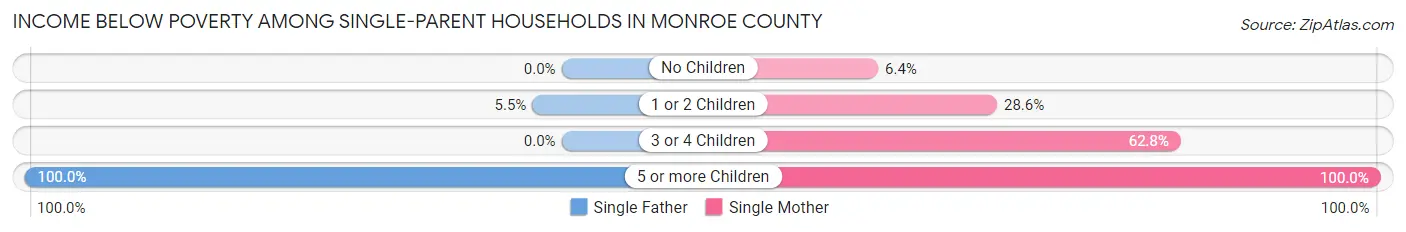
| Children | Single Father | Single Mother |
| No Children | 0 (0.0%) | 7 (6.4%) |
| 1 or 2 Children | 3 (5.4%) | 42 (28.6%) |
| 3 or 4 Children | 0 (0.0%) | 27 (62.8%) |
| 5 or more Children | 14 (100.0%) | 1 (100.0%) |
| Total | 17 (14.1%) | 77 (25.7%) |
Income Below Poverty Among Married-Couple vs Single-Parent Households in Monroe County
The poverty data for Monroe County shows that 109 of the married-couple family households (6.2%) and 94 of the single-parent households (22.3%) are living below the poverty level. Within the married-couple family households, those with 3 or 4 children have the highest poverty rate, with 38 households (20.8%) falling below the poverty line. Among the single-parent households, those with 5 or more children have the highest poverty rate, with 15 household (100.0%) living below poverty.
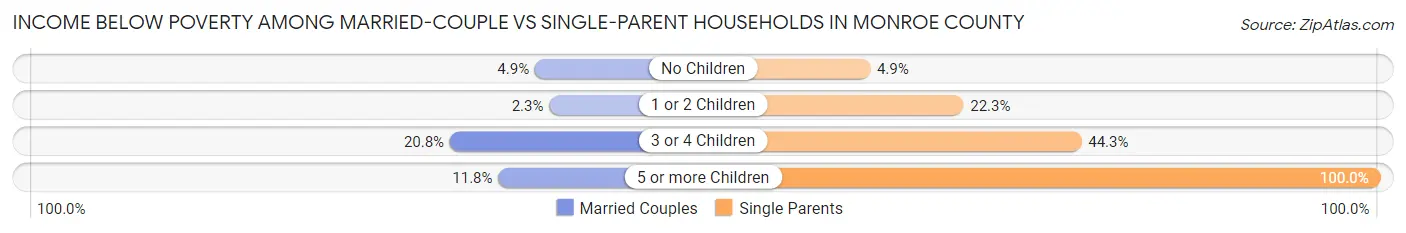
| Children | Married-Couple Families | Single-Parent Households |
| No Children | 62 (4.9%) | 7 (4.9%) |
| 1 or 2 Children | 7 (2.3%) | 45 (22.3%) |
| 3 or 4 Children | 38 (20.8%) | 27 (44.3%) |
| 5 or more Children | 2 (11.8%) | 15 (100.0%) |
| Total | 109 (6.2%) | 94 (22.3%) |
Race in Monroe County
The most populous races in Monroe County are White / Caucasian (8,057 | 92.9%), Black / African American (301 | 3.5%), and Two or more Races (168 | 1.9%).
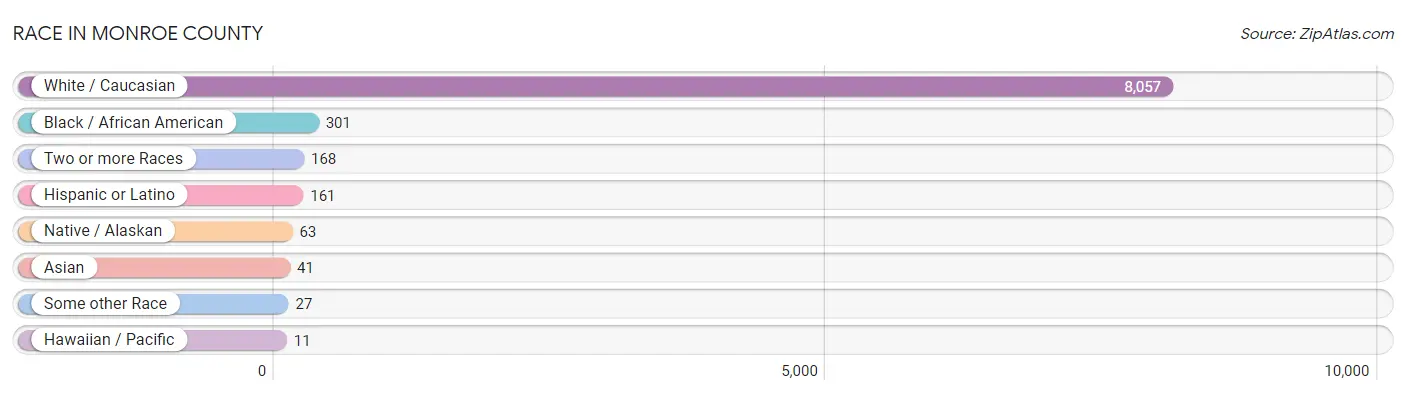
| Race | # Population | % Population |
| Asian | 41 | 0.5% |
| Black / African American | 301 | 3.5% |
| Hawaiian / Pacific | 11 | 0.1% |
| Hispanic or Latino | 161 | 1.9% |
| Native / Alaskan | 63 | 0.7% |
| White / Caucasian | 8,057 | 92.9% |
| Two or more Races | 168 | 1.9% |
| Some other Race | 27 | 0.3% |
| Total | 8,668 | 100.0% |
Ancestry in Monroe County
The most populous ancestries reported in Monroe County are German (1,695 | 19.6%), Irish (1,014 | 11.7%), English (894 | 10.3%), American (808 | 9.3%), and Scotch-Irish (162 | 1.9%), together accounting for 52.7% of all Monroe County residents.
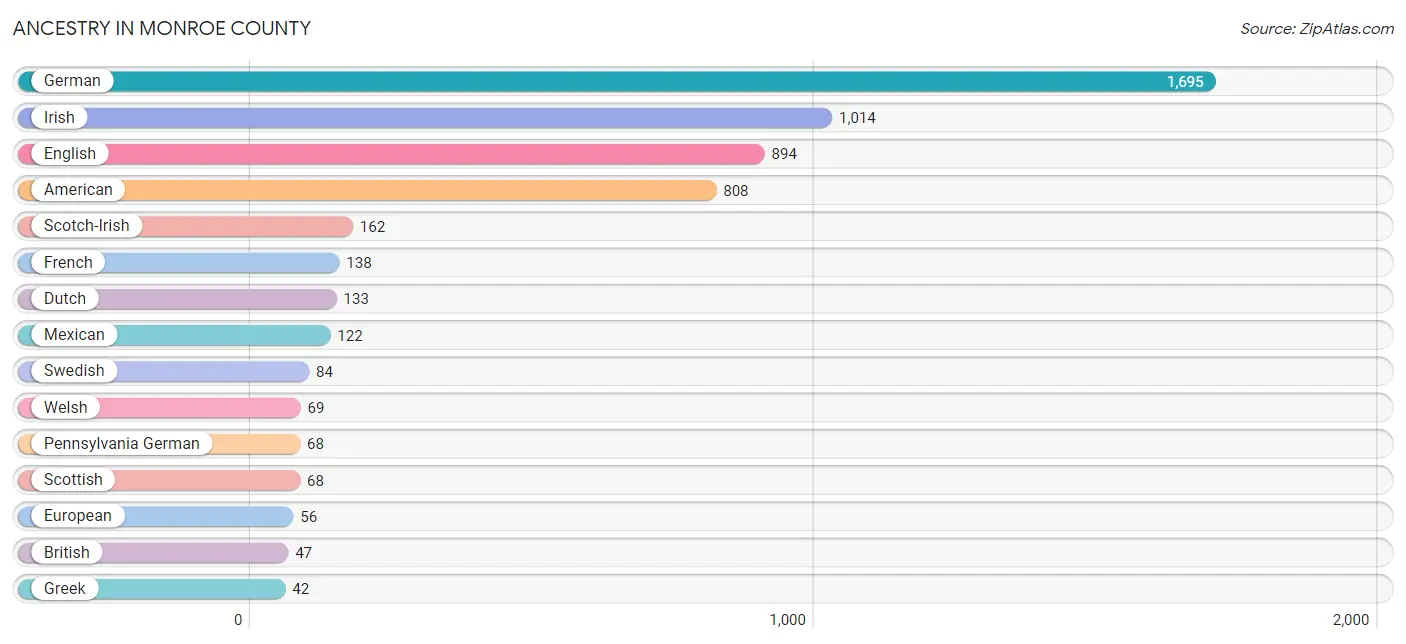
| Ancestry | # Population | % Population |
| African | 39 | 0.4% |
| American | 808 | 9.3% |
| Austrian | 20 | 0.2% |
| Basque | 12 | 0.1% |
| Bhutanese | 3 | 0.0% |
| Blackfeet | 4 | 0.1% |
| British | 47 | 0.5% |
| Burmese | 2 | 0.0% |
| Celtic | 2 | 0.0% |
| Cherokee | 10 | 0.1% |
| Choctaw | 1 | 0.0% |
| Creek | 2 | 0.0% |
| Croatian | 2 | 0.0% |
| Cuban | 16 | 0.2% |
| Czech | 28 | 0.3% |
| Czechoslovakian | 1 | 0.0% |
| Danish | 1 | 0.0% |
| Dutch | 133 | 1.5% |
| Eastern European | 21 | 0.2% |
| English | 894 | 10.3% |
| European | 56 | 0.6% |
| Finnish | 3 | 0.0% |
| French | 138 | 1.6% |
| French Canadian | 29 | 0.3% |
| German | 1,695 | 19.6% |
| Greek | 42 | 0.5% |
| Hungarian | 34 | 0.4% |
| Indian (Asian) | 40 | 0.5% |
| Irish | 1,014 | 11.7% |
| Italian | 14 | 0.2% |
| Laotian | 2 | 0.0% |
| Mexican | 122 | 1.4% |
| Norwegian | 21 | 0.2% |
| Pennsylvania German | 68 | 0.8% |
| Peruvian | 2 | 0.0% |
| Polish | 41 | 0.5% |
| Portuguese | 11 | 0.1% |
| Potawatomi | 13 | 0.2% |
| Puerto Rican | 2 | 0.0% |
| Russian | 12 | 0.1% |
| Samoan | 11 | 0.1% |
| Scandinavian | 12 | 0.1% |
| Scotch-Irish | 162 | 1.9% |
| Scottish | 68 | 0.8% |
| Sioux | 1 | 0.0% |
| South American | 8 | 0.1% |
| Spaniard | 12 | 0.1% |
| Spanish | 1 | 0.0% |
| Subsaharan African | 39 | 0.4% |
| Swedish | 84 | 1.0% |
| Swiss | 5 | 0.1% |
| Thai | 1 | 0.0% |
| Turkish | 8 | 0.1% |
| Ukrainian | 7 | 0.1% |
| Welsh | 69 | 0.8% |
| Yugoslavian | 7 | 0.1% | View All 56 Rows |
Immigrants in Monroe County
The most numerous immigrant groups reported in Monroe County came from Africa (39 | 0.4%), Europe (21 | 0.2%), Asia (20 | 0.2%), Western Europe (13 | 0.2%), and Eastern Asia (11 | 0.1%), together accounting for 1.2% of all Monroe County residents.
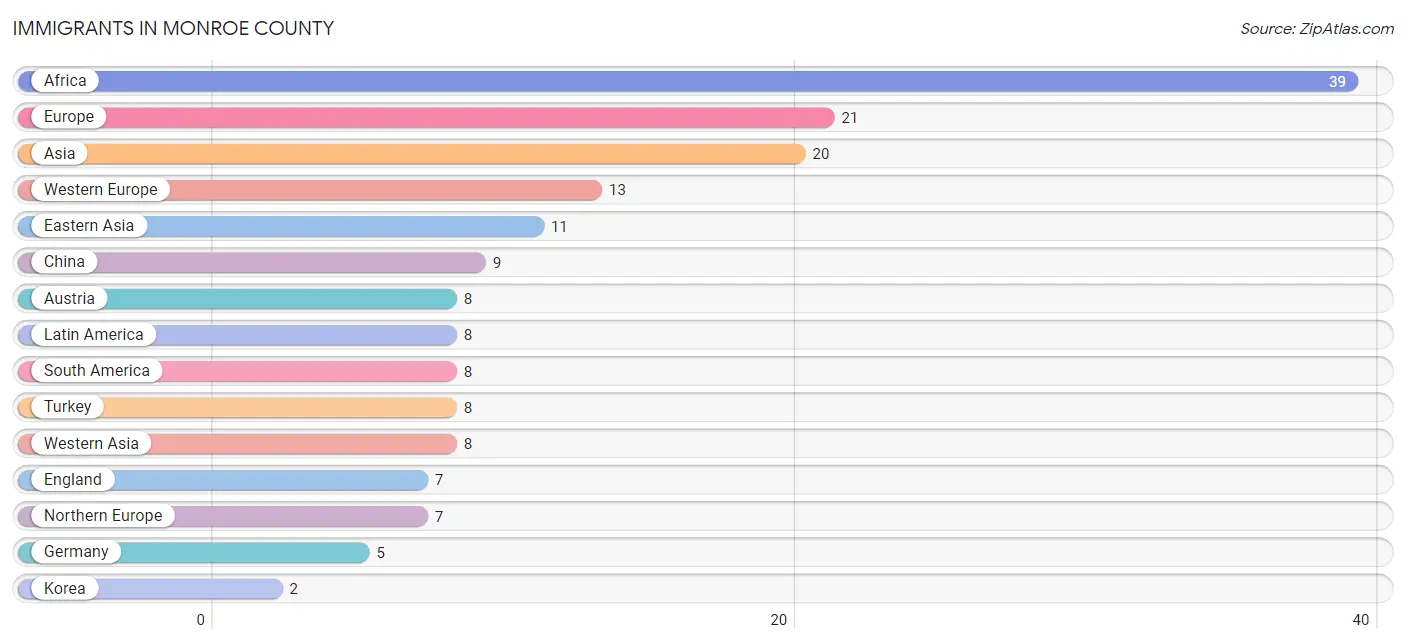
| Immigration Origin | # Population | % Population |
| Africa | 39 | 0.4% |
| Asia | 20 | 0.2% |
| Austria | 8 | 0.1% |
| China | 9 | 0.1% |
| Eastern Asia | 11 | 0.1% |
| Eastern Europe | 1 | 0.0% |
| England | 7 | 0.1% |
| Europe | 21 | 0.2% |
| Germany | 5 | 0.1% |
| Korea | 2 | 0.0% |
| Latin America | 8 | 0.1% |
| Northern Europe | 7 | 0.1% |
| Peru | 2 | 0.0% |
| Russia | 1 | 0.0% |
| South America | 8 | 0.1% |
| South Eastern Asia | 1 | 0.0% |
| Turkey | 8 | 0.1% |
| Vietnam | 1 | 0.0% |
| Western Asia | 8 | 0.1% |
| Western Europe | 13 | 0.2% | View All 20 Rows |
Sex and Age in Monroe County
Sex and Age in Monroe County
The most populous age groups in Monroe County are 60 to 64 Years (477 | 10.7%) for men and 60 to 64 Years (406 | 9.6%) for women.
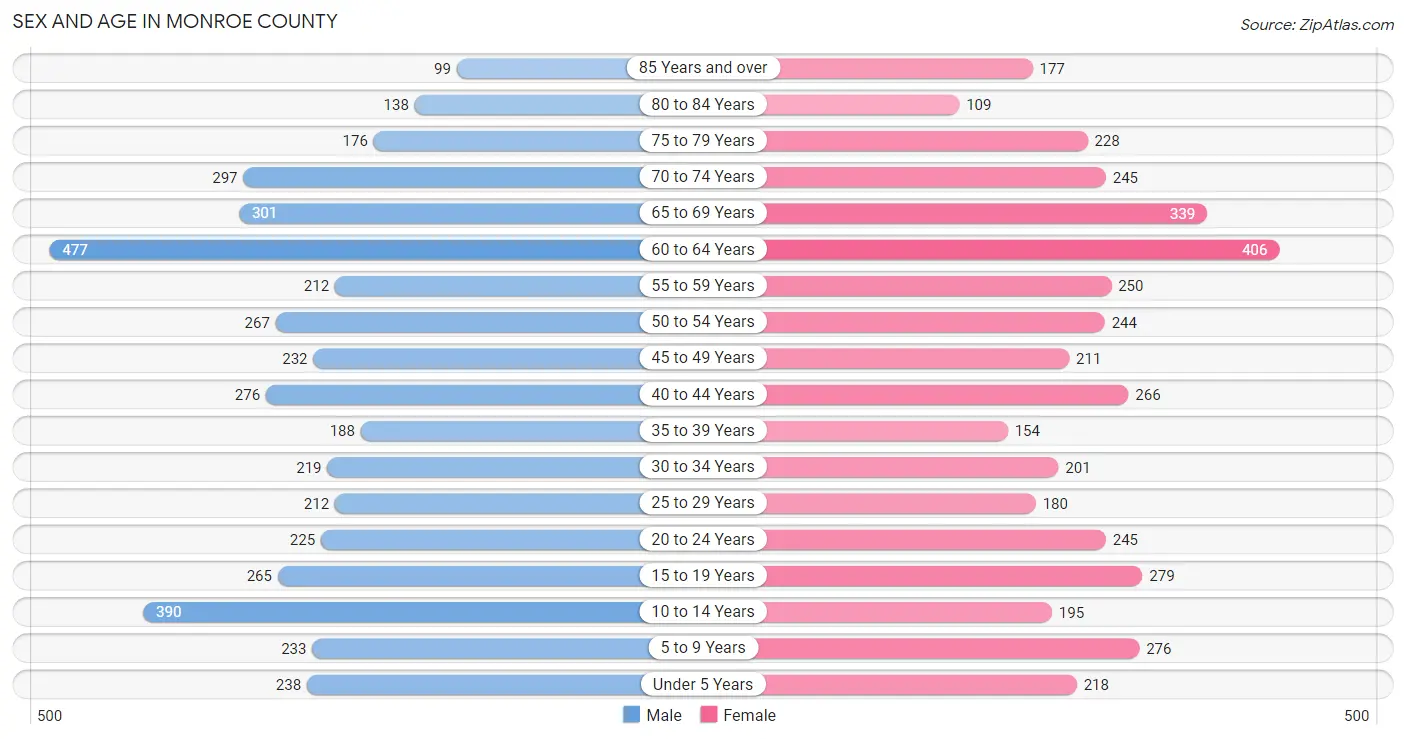
| Age Bracket | Male | Female |
| Under 5 Years | 238 (5.3%) | 218 (5.2%) |
| 5 to 9 Years | 233 (5.2%) | 276 (6.5%) |
| 10 to 14 Years | 390 (8.8%) | 195 (4.6%) |
| 15 to 19 Years | 265 (6.0%) | 279 (6.6%) |
| 20 to 24 Years | 225 (5.1%) | 245 (5.8%) |
| 25 to 29 Years | 212 (4.8%) | 180 (4.3%) |
| 30 to 34 Years | 219 (4.9%) | 201 (4.8%) |
| 35 to 39 Years | 188 (4.2%) | 154 (3.6%) |
| 40 to 44 Years | 276 (6.2%) | 266 (6.3%) |
| 45 to 49 Years | 232 (5.2%) | 211 (5.0%) |
| 50 to 54 Years | 267 (6.0%) | 244 (5.8%) |
| 55 to 59 Years | 212 (4.8%) | 250 (5.9%) |
| 60 to 64 Years | 477 (10.7%) | 406 (9.6%) |
| 65 to 69 Years | 301 (6.8%) | 339 (8.0%) |
| 70 to 74 Years | 297 (6.7%) | 245 (5.8%) |
| 75 to 79 Years | 176 (4.0%) | 228 (5.4%) |
| 80 to 84 Years | 138 (3.1%) | 109 (2.6%) |
| 85 Years and over | 99 (2.2%) | 177 (4.2%) |
| Total | 4,445 (100.0%) | 4,223 (100.0%) |
Families and Households in Monroe County
Median Family Size in Monroe County
The median family size in Monroe County is 3.18 persons per family, with single male/father families (121 | 5.5%) accounting for the largest median family size of 4.36 persons per family. On the other hand, married-couple families (1,767 | 80.8%) represent the smallest median family size with 3.03 persons per family.
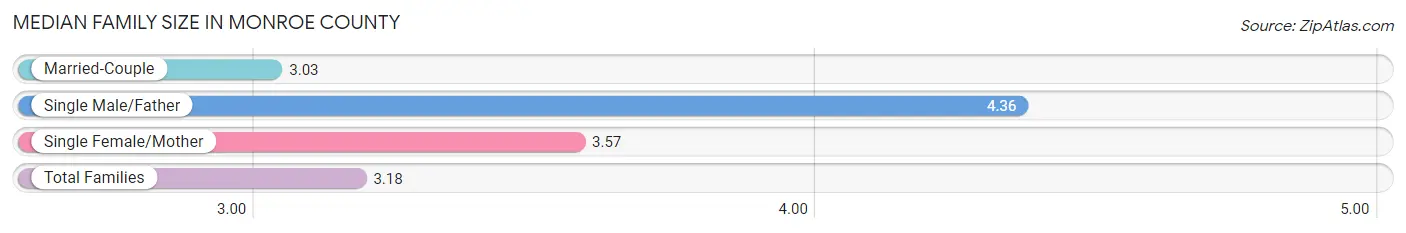
| Family Type | # Families | Family Size |
| Married-Couple | 1,767 (80.8%) | 3.03 |
| Single Male/Father | 121 (5.5%) | 4.36 |
| Single Female/Mother | 300 (13.7%) | 3.57 |
| Total Families | 2,188 (100.0%) | 3.18 |
Median Household Size in Monroe County
The median household size in Monroe County is 2.48 persons per household, with single male/father households (121 | 3.5%) accounting for the largest median household size of 4.51 persons per household. non-family households (1,237 | 36.1%) represent the smallest median household size with 1.14 persons per household.
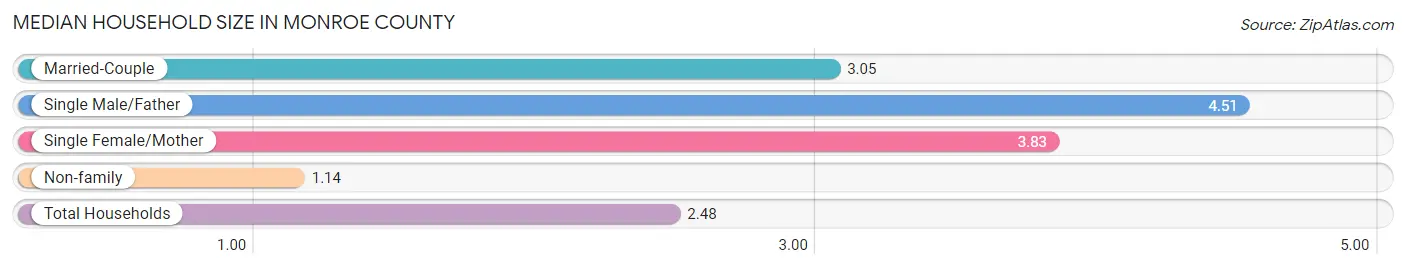
| Household Type | # Households | Household Size |
| Married-Couple | 1,767 (51.6%) | 3.05 |
| Single Male/Father | 121 (3.5%) | 4.51 |
| Single Female/Mother | 300 (8.8%) | 3.83 |
| Non-family | 1,237 (36.1%) | 1.14 |
| Total Households | 3,425 (100.0%) | 2.48 |
Household Size by Marriage Status in Monroe County
Out of a total of 3,425 households in Monroe County, 2,188 (63.9%) are family households, while 1,237 (36.1%) are nonfamily households. The most numerous type of family households are 2-person households, comprising 1,257, and the most common type of nonfamily households are 1-person households, comprising 1,117.
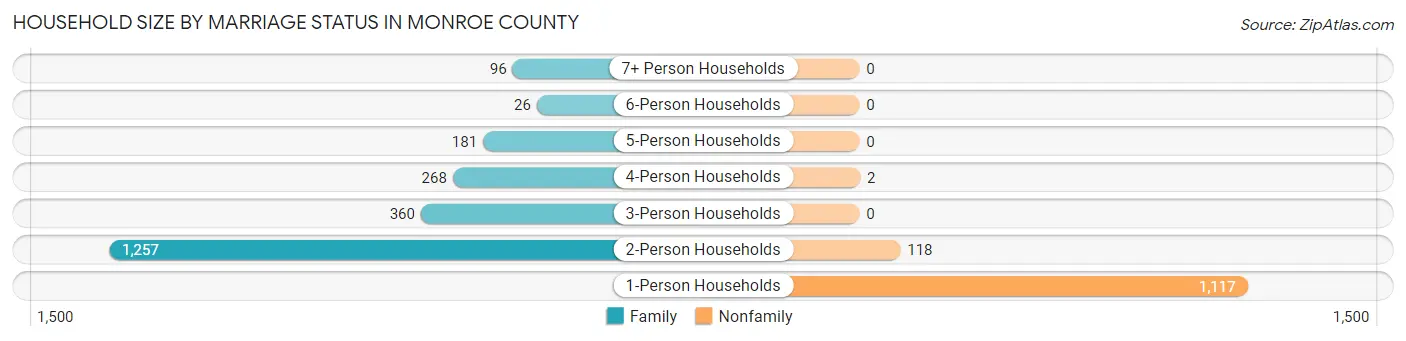
| Household Size | Family Households | Nonfamily Households |
| 1-Person Households | - | 1,117 (32.6%) |
| 2-Person Households | 1,257 (36.7%) | 118 (3.5%) |
| 3-Person Households | 360 (10.5%) | 0 (0.0%) |
| 4-Person Households | 268 (7.8%) | 2 (0.1%) |
| 5-Person Households | 181 (5.3%) | 0 (0.0%) |
| 6-Person Households | 26 (0.8%) | 0 (0.0%) |
| 7+ Person Households | 96 (2.8%) | 0 (0.0%) |
| Total | 2,188 (63.9%) | 1,237 (36.1%) |
Female Fertility in Monroe County
Fertility by Age in Monroe County
Average fertility rate in Monroe County is 76.0 births per 1,000 women. Women in the age bracket of 20 to 34 years have the highest fertility rate with 153.0 births per 1,000 women. Women in the age bracket of 20 to 34 years acount for 79.3% of all women with births.
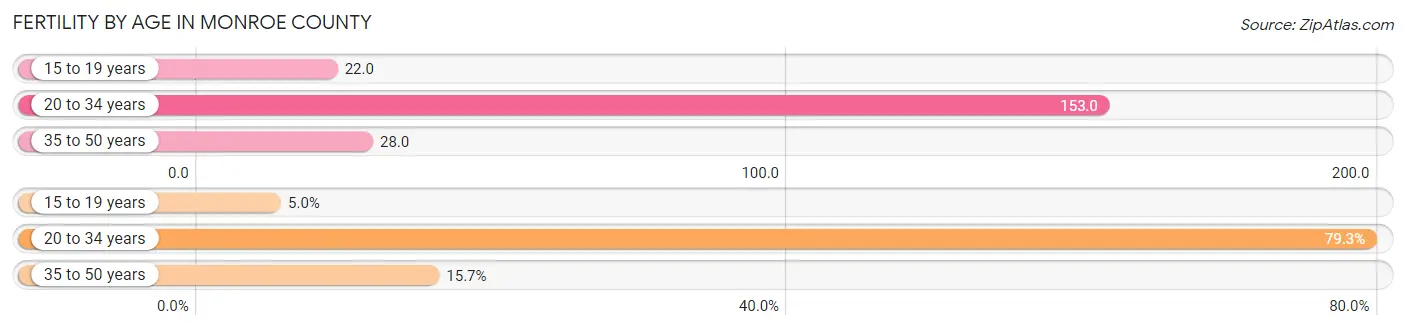
| Age Bracket | Women with Births | Births / 1,000 Women |
| 15 to 19 years | 6 (5.0%) | 22.0 |
| 20 to 34 years | 96 (79.3%) | 153.0 |
| 35 to 50 years | 19 (15.7%) | 28.0 |
| Total | 121 (100.0%) | 76.0 |
Fertility by Age by Marriage Status in Monroe County
87.6% of women with births (121) in Monroe County are married. The highest percentage of unmarried women with births falls into 15 to 19 years age bracket with 83.3% of them unmarried at the time of birth, while the lowest percentage of unmarried women with births belong to 20 to 34 years age bracket with 0.0% of them unmarried.
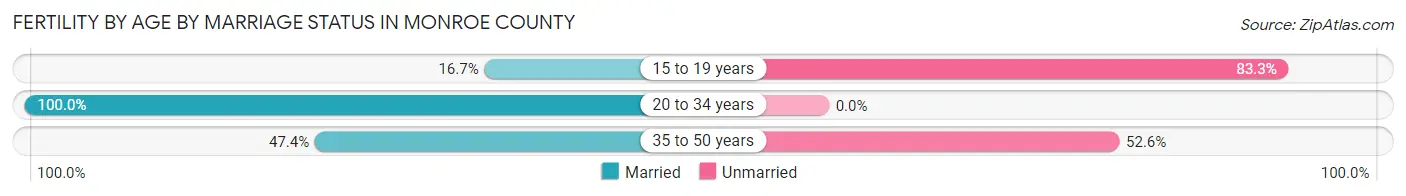
| Age Bracket | Married | Unmarried |
| 15 to 19 years | 1 (16.7%) | 5 (83.3%) |
| 20 to 34 years | 96 (100.0%) | 0 (0.0%) |
| 35 to 50 years | 9 (47.4%) | 10 (52.6%) |
| Total | 106 (87.6%) | 15 (12.4%) |
Fertility by Education in Monroe County
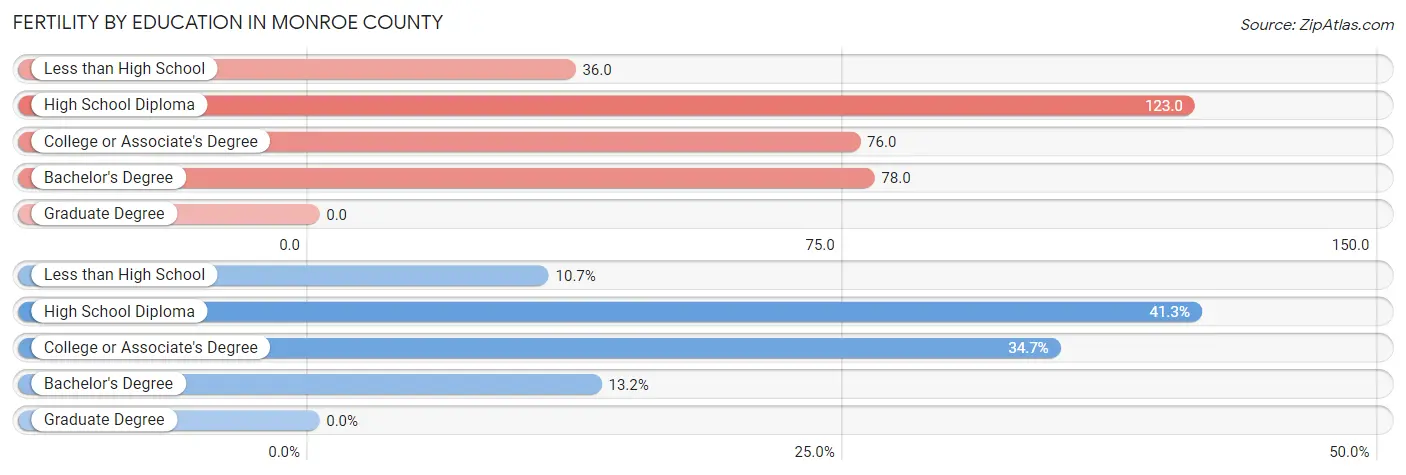
| Educational Attainment | Women with Births | Births / 1,000 Women |
| Less than High School | 13 (10.7%) | 36.0 |
| High School Diploma | 50 (41.3%) | 123.0 |
| College or Associate's Degree | 42 (34.7%) | 76.0 |
| Bachelor's Degree | 16 (13.2%) | 78.0 |
| Graduate Degree | 0 (0.0%) | 0.0 |
| Total | 121 (100.0%) | 76.0 |
Fertility by Education by Marriage Status in Monroe County
12.4% of women with births in Monroe County are unmarried. Women with the educational attainment of college or associate's degree are most likely to be married with 100.0% of them married at childbirth, while women with the educational attainment of less than high school are least likely to be married with 38.5% of them unmarried at childbirth.
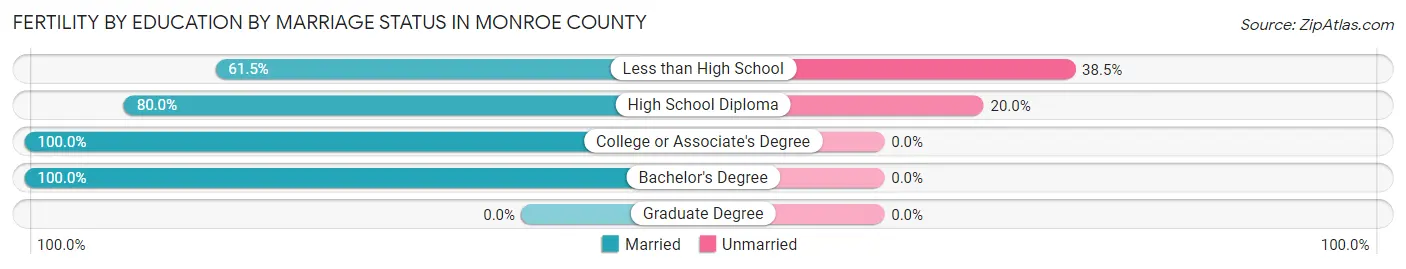
| Educational Attainment | Married | Unmarried |
| Less than High School | 8 (61.5%) | 5 (38.5%) |
| High School Diploma | 40 (80.0%) | 10 (20.0%) |
| College or Associate's Degree | 42 (100.0%) | 0 (0.0%) |
| Bachelor's Degree | 16 (100.0%) | 0 (0.0%) |
| Graduate Degree | 0 (0.0%) | 0 (0.0%) |
| Total | 106 (87.6%) | 15 (12.4%) |
Employment Characteristics in Monroe County
Employment by Class of Employer in Monroe County
Among the 3,592 employed individuals in Monroe County, private company employees (2,227 | 62.0%), self-employed (not incorporated) (325 | 9.0%), and not-for-profit organizations (312 | 8.7%) make up the most common classes of employment.
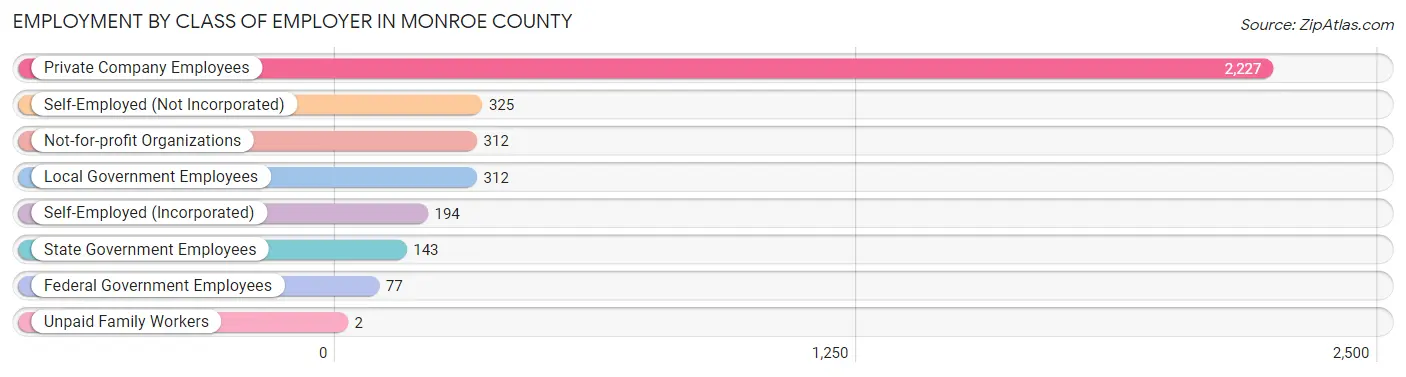
| Employer Class | # Employees | % Employees |
| Private Company Employees | 2,227 | 62.0% |
| Self-Employed (Incorporated) | 194 | 5.4% |
| Self-Employed (Not Incorporated) | 325 | 9.0% |
| Not-for-profit Organizations | 312 | 8.7% |
| Local Government Employees | 312 | 8.7% |
| State Government Employees | 143 | 4.0% |
| Federal Government Employees | 77 | 2.1% |
| Unpaid Family Workers | 2 | 0.1% |
| Total | 3,592 | 100.0% |
Employment Status by Age in Monroe County
According to the labor force statistics for Monroe County, out of the total population over 16 years of age (7,039), 52.0% or 3,660 individuals are in the labor force, with 1.2% or 44 of them unemployed. The age group with the highest labor force participation rate is 35 to 44 years, with 85.6% or 757 individuals in the labor force. Within the labor force, the 20 to 24 years age range has the highest percentage of unemployed individuals, with 2.4% or 8 of them being unemployed.
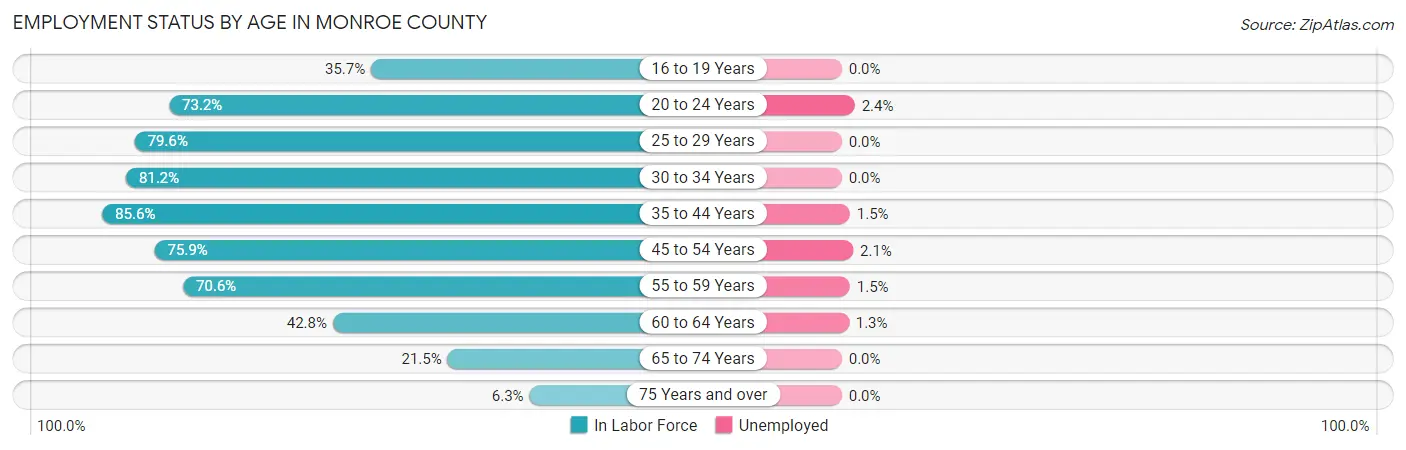
| Age Bracket | In Labor Force | Unemployed |
| 16 to 19 Years | 166 (35.7%) | 0 (0.0%) |
| 20 to 24 Years | 344 (73.2%) | 8 (2.4%) |
| 25 to 29 Years | 312 (79.6%) | 0 (0.0%) |
| 30 to 34 Years | 341 (81.2%) | 0 (0.0%) |
| 35 to 44 Years | 757 (85.6%) | 11 (1.5%) |
| 45 to 54 Years | 724 (75.9%) | 15 (2.1%) |
| 55 to 59 Years | 326 (70.6%) | 5 (1.5%) |
| 60 to 64 Years | 378 (42.8%) | 5 (1.3%) |
| 65 to 74 Years | 254 (21.5%) | 0 (0.0%) |
| 75 Years and over | 58 (6.3%) | 0 (0.0%) |
| Total | 3,660 (52.0%) | 44 (1.2%) |
Employment Status by Educational Attainment in Monroe County
According to labor force statistics for Monroe County, 71.0% of individuals (2,836) out of the total population between 25 and 64 years of age (3,995) are in the labor force, with 1.3% or 37 of them being unemployed. The group with the highest labor force participation rate are those with the educational attainment of bachelor's degree or higher, with 87.3% or 582 individuals in the labor force. Within the labor force, individuals with college / associate degree education have the highest percentage of unemployment, with 1.9% or 14 of them being unemployed.
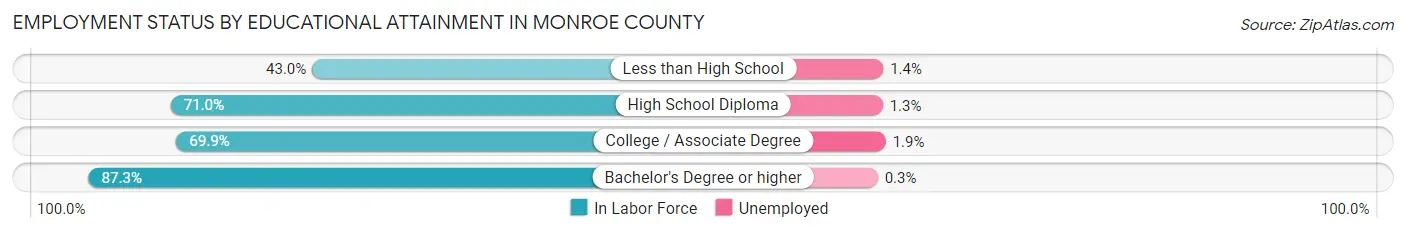
| Educational Attainment | In Labor Force | Unemployed |
| Less than High School | 148 (43.0%) | 5 (1.4%) |
| High School Diploma | 1,361 (71.0%) | 25 (1.3%) |
| College / Associate Degree | 746 (69.9%) | 20 (1.9%) |
| Bachelor's Degree or higher | 582 (87.3%) | 2 (0.3%) |
| Total | 2,836 (71.0%) | 52 (1.3%) |
Employment Occupations by Sex in Monroe County
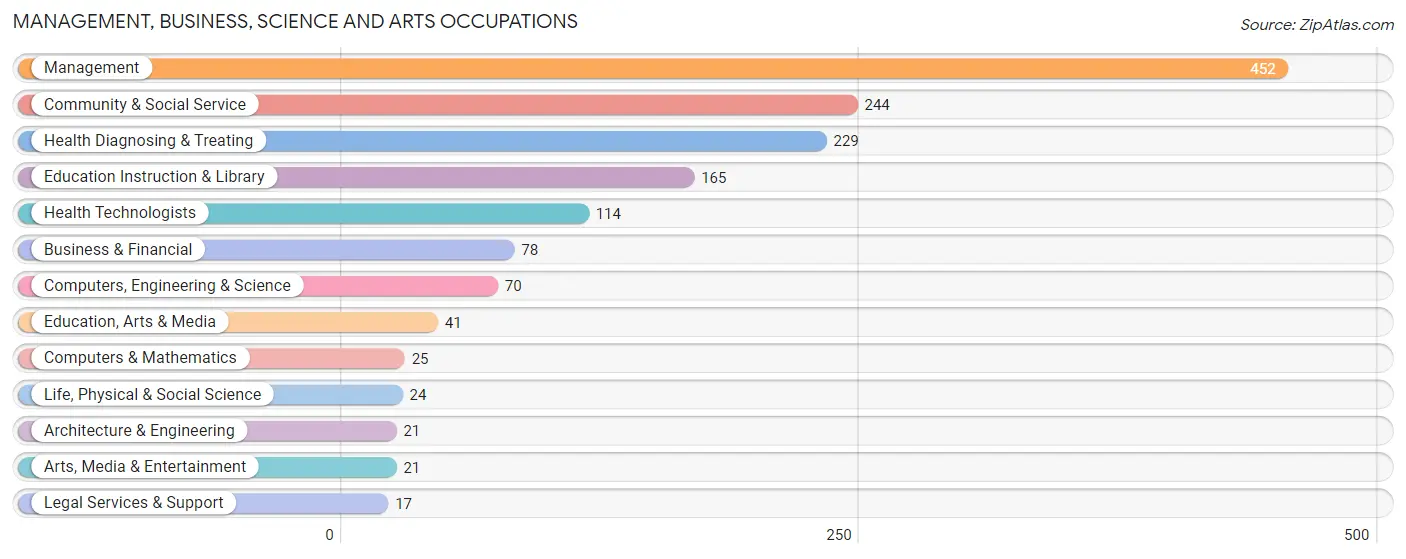
Management, Business, Science and Arts Occupations
The most common Management, Business, Science and Arts occupations in Monroe County are Management (452 | 12.6%), Community & Social Service (244 | 6.8%), Health Diagnosing & Treating (229 | 6.4%), Education Instruction & Library (165 | 4.6%), and Health Technologists (114 | 3.2%).
Management, Business, Science and Arts Occupations by Sex
Within the Management, Business, Science and Arts occupations in Monroe County, the most male-oriented occupations are Architecture & Engineering (100.0%), Life, Physical & Social Science (83.3%), and Computers, Engineering & Science (72.9%), while the most female-oriented occupations are Arts, Media & Entertainment (95.2%), Health Technologists (87.7%), and Business & Financial (87.2%).
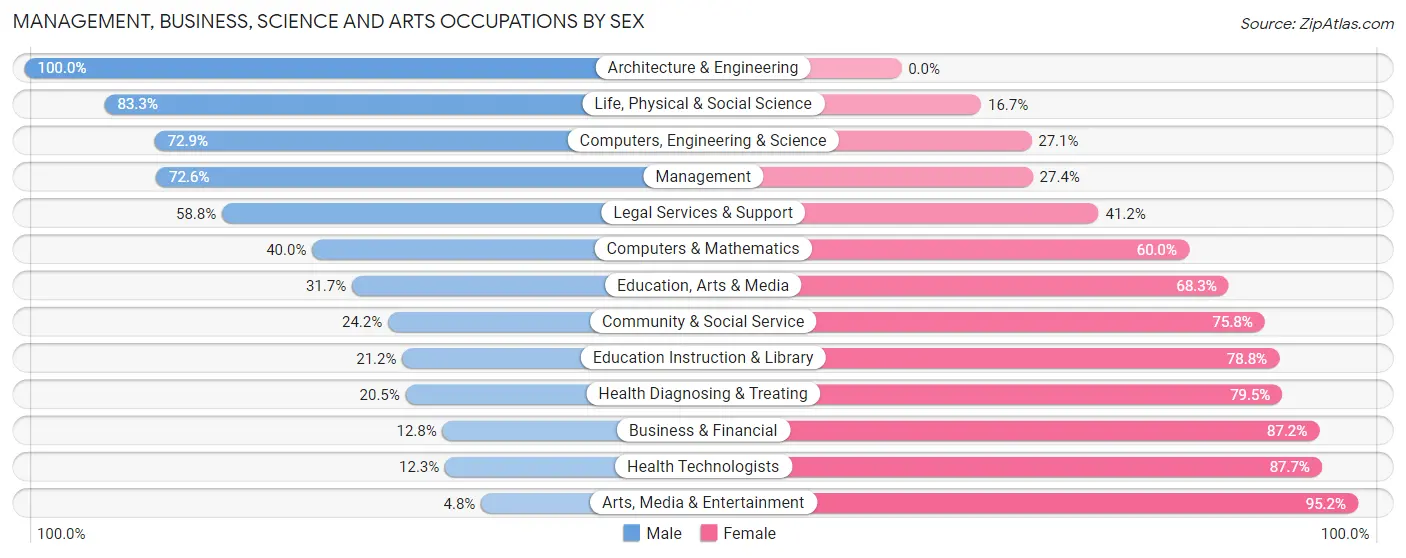
| Occupation | Male | Female |
| Management | 328 (72.6%) | 124 (27.4%) |
| Business & Financial | 10 (12.8%) | 68 (87.2%) |
| Computers, Engineering & Science | 51 (72.9%) | 19 (27.1%) |
| Computers & Mathematics | 10 (40.0%) | 15 (60.0%) |
| Architecture & Engineering | 21 (100.0%) | 0 (0.0%) |
| Life, Physical & Social Science | 20 (83.3%) | 4 (16.7%) |
| Community & Social Service | 59 (24.2%) | 185 (75.8%) |
| Education, Arts & Media | 13 (31.7%) | 28 (68.3%) |
| Legal Services & Support | 10 (58.8%) | 7 (41.2%) |
| Education Instruction & Library | 35 (21.2%) | 130 (78.8%) |
| Arts, Media & Entertainment | 1 (4.8%) | 20 (95.2%) |
| Health Diagnosing & Treating | 47 (20.5%) | 182 (79.5%) |
| Health Technologists | 14 (12.3%) | 100 (87.7%) |
| Total (Category) | 495 (46.1%) | 578 (53.9%) |
| Total (Overall) | 2,001 (55.6%) | 1,598 (44.4%) |
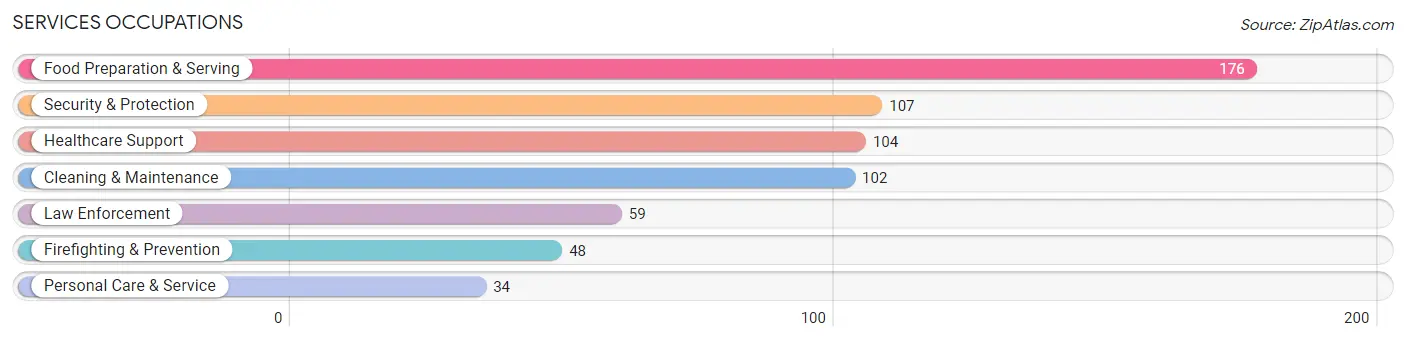
Services Occupations
The most common Services occupations in Monroe County are Food Preparation & Serving (176 | 4.9%), Security & Protection (107 | 3.0%), Healthcare Support (104 | 2.9%), Cleaning & Maintenance (102 | 2.8%), and Law Enforcement (59 | 1.6%).
Services Occupations by Sex
Within the Services occupations in Monroe County, the most male-oriented occupations are Law Enforcement (93.2%), Security & Protection (75.7%), and Cleaning & Maintenance (64.7%), while the most female-oriented occupations are Healthcare Support (100.0%), Personal Care & Service (88.2%), and Food Preparation & Serving (71.0%).
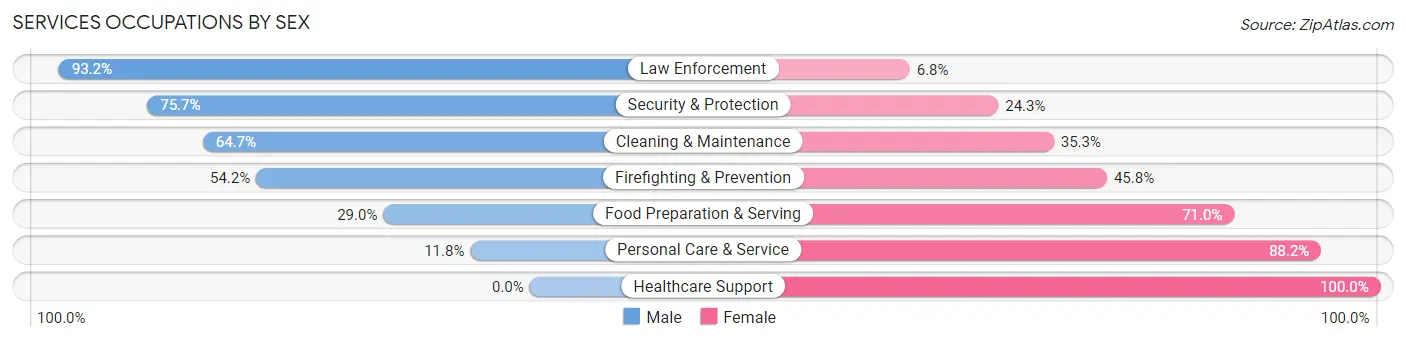
| Occupation | Male | Female |
| Healthcare Support | 0 (0.0%) | 104 (100.0%) |
| Security & Protection | 81 (75.7%) | 26 (24.3%) |
| Firefighting & Prevention | 26 (54.2%) | 22 (45.8%) |
| Law Enforcement | 55 (93.2%) | 4 (6.8%) |
| Food Preparation & Serving | 51 (29.0%) | 125 (71.0%) |
| Cleaning & Maintenance | 66 (64.7%) | 36 (35.3%) |
| Personal Care & Service | 4 (11.8%) | 30 (88.2%) |
| Total (Category) | 202 (38.6%) | 321 (61.4%) |
| Total (Overall) | 2,001 (55.6%) | 1,598 (44.4%) |
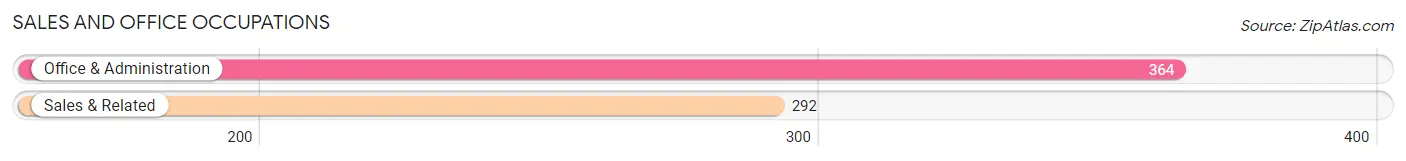
Sales and Office Occupations
The most common Sales and Office occupations in Monroe County are Office & Administration (364 | 10.1%), and Sales & Related (292 | 8.1%).
Sales and Office Occupations by Sex
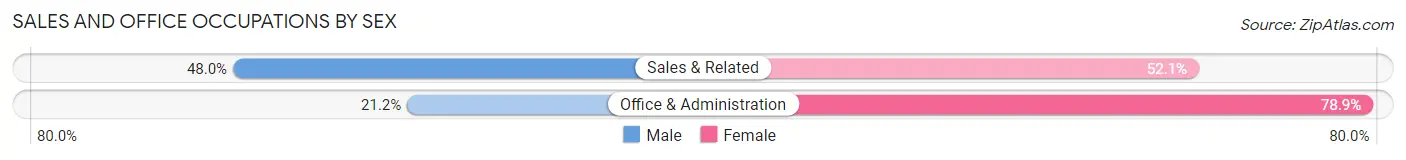
| Occupation | Male | Female |
| Sales & Related | 140 (47.9%) | 152 (52.0%) |
| Office & Administration | 77 (21.1%) | 287 (78.8%) |
| Total (Category) | 217 (33.1%) | 439 (66.9%) |
| Total (Overall) | 2,001 (55.6%) | 1,598 (44.4%) |
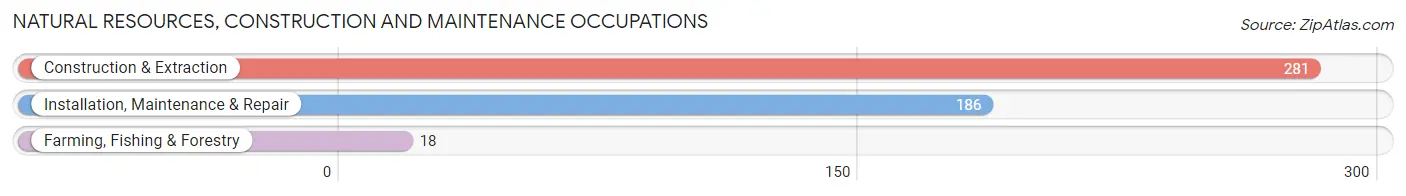
Natural Resources, Construction and Maintenance Occupations
The most common Natural Resources, Construction and Maintenance occupations in Monroe County are Construction & Extraction (281 | 7.8%), Installation, Maintenance & Repair (186 | 5.2%), and Farming, Fishing & Forestry (18 | 0.5%).
Natural Resources, Construction and Maintenance Occupations by Sex
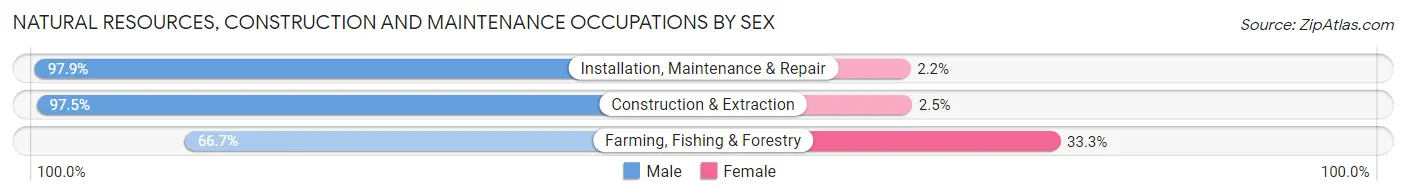
| Occupation | Male | Female |
| Farming, Fishing & Forestry | 12 (66.7%) | 6 (33.3%) |
| Construction & Extraction | 274 (97.5%) | 7 (2.5%) |
| Installation, Maintenance & Repair | 182 (97.9%) | 4 (2.1%) |
| Total (Category) | 468 (96.5%) | 17 (3.5%) |
| Total (Overall) | 2,001 (55.6%) | 1,598 (44.4%) |
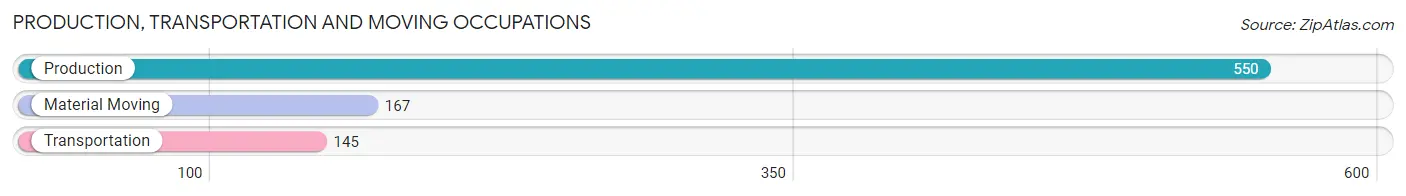
Production, Transportation and Moving Occupations
The most common Production, Transportation and Moving occupations in Monroe County are Production (550 | 15.3%), Material Moving (167 | 4.6%), and Transportation (145 | 4.0%).
Production, Transportation and Moving Occupations by Sex
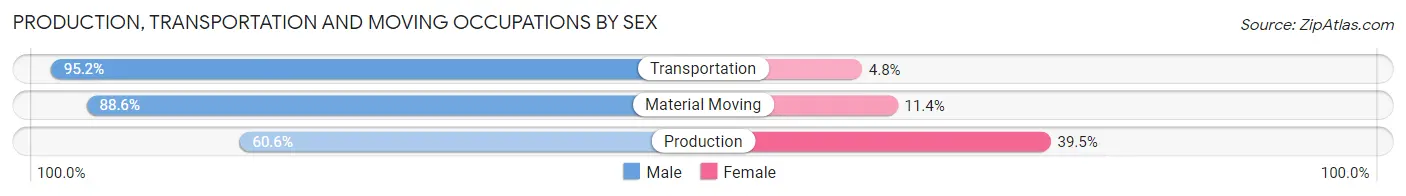
| Occupation | Male | Female |
| Production | 333 (60.6%) | 217 (39.5%) |
| Transportation | 138 (95.2%) | 7 (4.8%) |
| Material Moving | 148 (88.6%) | 19 (11.4%) |
| Total (Category) | 619 (71.8%) | 243 (28.2%) |
| Total (Overall) | 2,001 (55.6%) | 1,598 (44.4%) |
Employment Industries by Sex in Monroe County
Employment Industries in Monroe County
The major employment industries in Monroe County include Manufacturing (733 | 20.4%), Health Care & Social Assistance (548 | 15.2%), Retail Trade (431 | 12.0%), Construction (292 | 8.1%), and Agriculture, Fishing & Hunting (247 | 6.9%).
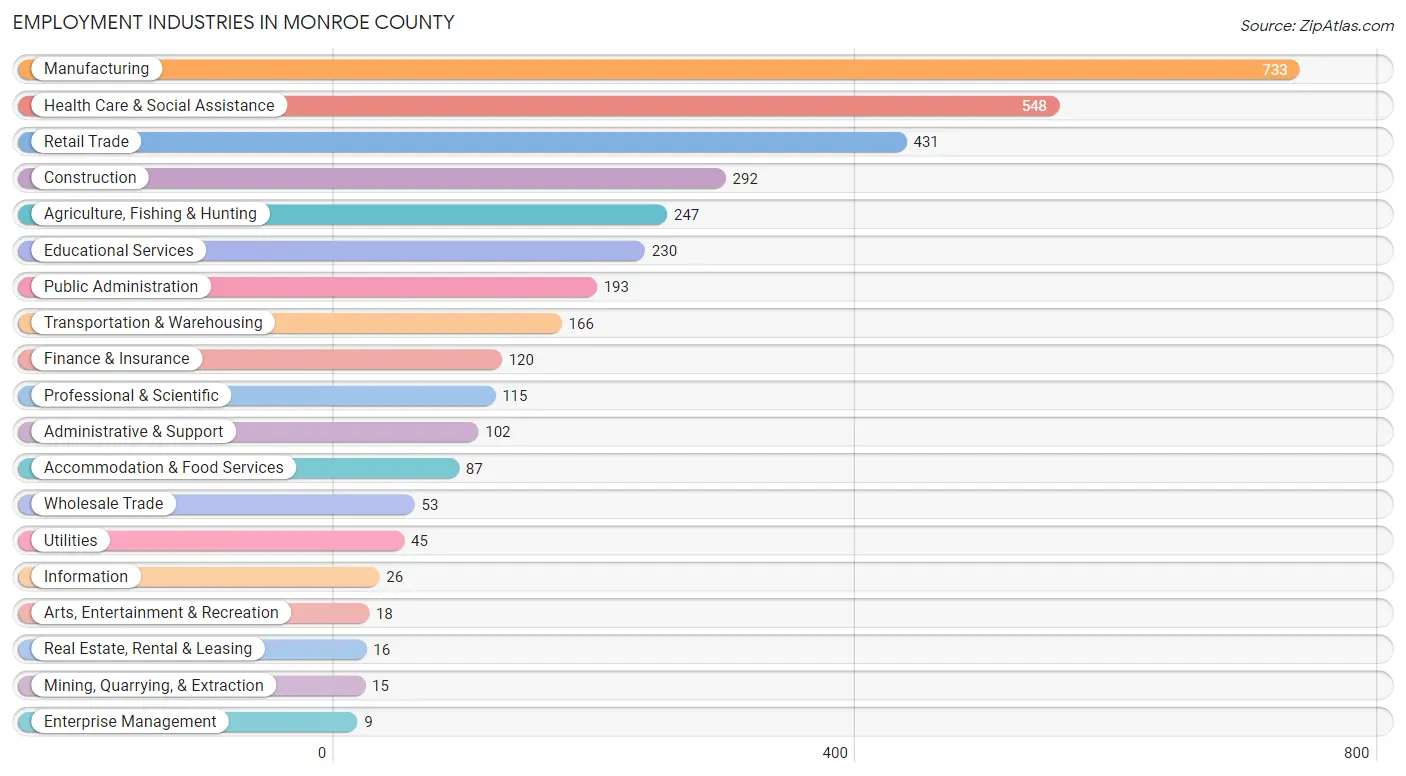
Employment Industries by Sex in Monroe County
The Monroe County industries that see more men than women are Mining, Quarrying, & Extraction (100.0%), Utilities (100.0%), and Agriculture, Fishing & Hunting (96.4%), whereas the industries that tend to have a higher number of women are Accommodation & Food Services (83.9%), Finance & Insurance (77.5%), and Health Care & Social Assistance (75.5%).
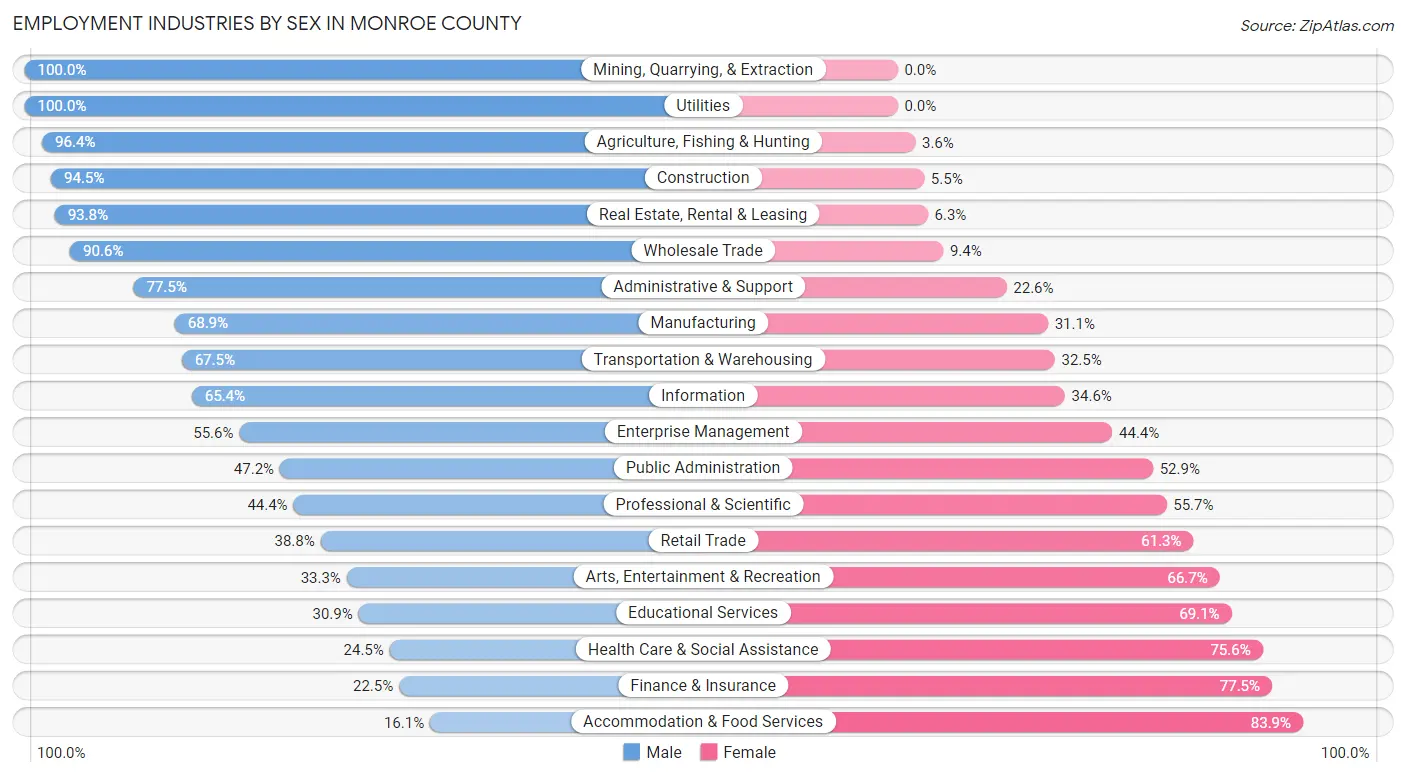
| Industry | Male | Female |
| Agriculture, Fishing & Hunting | 238 (96.4%) | 9 (3.6%) |
| Mining, Quarrying, & Extraction | 15 (100.0%) | 0 (0.0%) |
| Construction | 276 (94.5%) | 16 (5.5%) |
| Manufacturing | 505 (68.9%) | 228 (31.1%) |
| Wholesale Trade | 48 (90.6%) | 5 (9.4%) |
| Retail Trade | 167 (38.8%) | 264 (61.3%) |
| Transportation & Warehousing | 112 (67.5%) | 54 (32.5%) |
| Utilities | 45 (100.0%) | 0 (0.0%) |
| Information | 17 (65.4%) | 9 (34.6%) |
| Finance & Insurance | 27 (22.5%) | 93 (77.5%) |
| Real Estate, Rental & Leasing | 15 (93.8%) | 1 (6.2%) |
| Professional & Scientific | 51 (44.4%) | 64 (55.6%) |
| Enterprise Management | 5 (55.6%) | 4 (44.4%) |
| Administrative & Support | 79 (77.4%) | 23 (22.6%) |
| Educational Services | 71 (30.9%) | 159 (69.1%) |
| Health Care & Social Assistance | 134 (24.4%) | 414 (75.5%) |
| Arts, Entertainment & Recreation | 6 (33.3%) | 12 (66.7%) |
| Accommodation & Food Services | 14 (16.1%) | 73 (83.9%) |
| Public Administration | 91 (47.1%) | 102 (52.8%) |
| Total | 2,001 (55.6%) | 1,598 (44.4%) |
Education in Monroe County
School Enrollment in Monroe County
The most common levels of schooling among the 1,557 students in Monroe County are elementary school (444 | 28.5%), high school (388 | 24.9%), and middle school (364 | 23.4%).
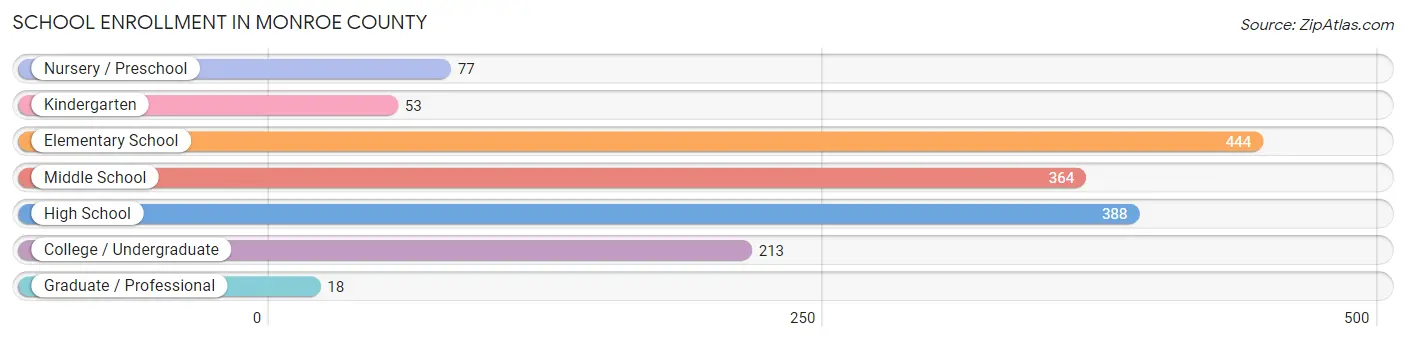
| School Level | # Students | % Students |
| Nursery / Preschool | 77 | 5.0% |
| Kindergarten | 53 | 3.4% |
| Elementary School | 444 | 28.5% |
| Middle School | 364 | 23.4% |
| High School | 388 | 24.9% |
| College / Undergraduate | 213 | 13.7% |
| Graduate / Professional | 18 | 1.2% |
| Total | 1,557 | 100.0% |
School Enrollment by Age by Funding Source in Monroe County
Out of a total of 1,557 students who are enrolled in schools in Monroe County, 316 (20.3%) attend a private institution, while the remaining 1,241 (79.7%) are enrolled in public schools. The age group of 25 to 34 year olds has the highest likelihood of being enrolled in private schools, with 48 (69.6% in the age bracket) enrolled. Conversely, the age group of 20 to 24 year olds has the lowest likelihood of being enrolled in a private school, with 82 (97.6% in the age bracket) attending a public institution.
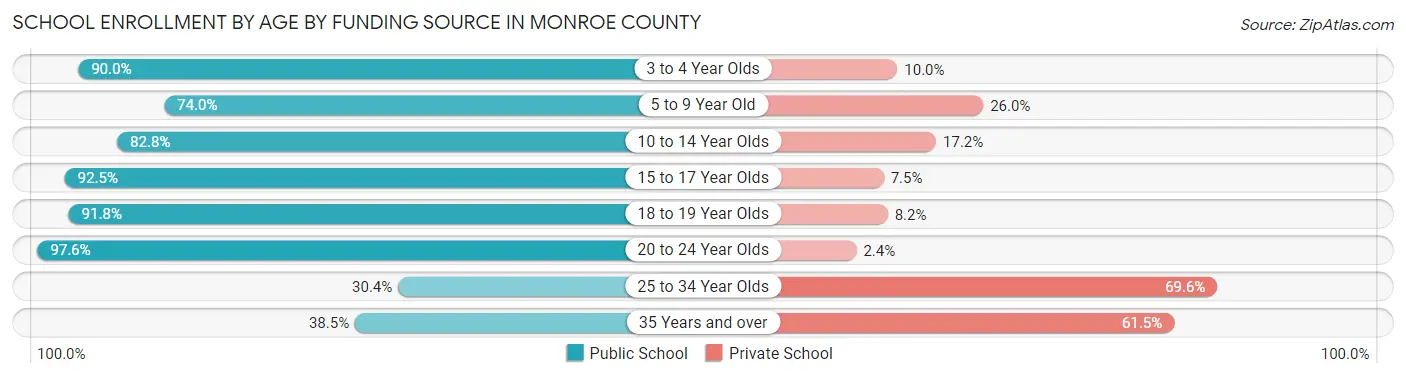
| Age Bracket | Public School | Private School |
| 3 to 4 Year Olds | 54 (90.0%) | 6 (10.0%) |
| 5 to 9 Year Old | 336 (74.0%) | 118 (26.0%) |
| 10 to 14 Year Olds | 399 (82.8%) | 83 (17.2%) |
| 15 to 17 Year Olds | 273 (92.5%) | 22 (7.5%) |
| 18 to 19 Year Olds | 56 (91.8%) | 5 (8.2%) |
| 20 to 24 Year Olds | 82 (97.6%) | 2 (2.4%) |
| 25 to 34 Year Olds | 21 (30.4%) | 48 (69.6%) |
| 35 Years and over | 20 (38.5%) | 32 (61.5%) |
| Total | 1,241 (79.7%) | 316 (20.3%) |
Educational Attainment by Field of Study in Monroe County
Education (289 | 27.7%), bio, nature & agricultural (184 | 17.7%), business (174 | 16.7%), science & technology (140 | 13.4%), and arts & humanities (65 | 6.2%) are the most common fields of study among 1,042 individuals in Monroe County who have obtained a bachelor's degree or higher.
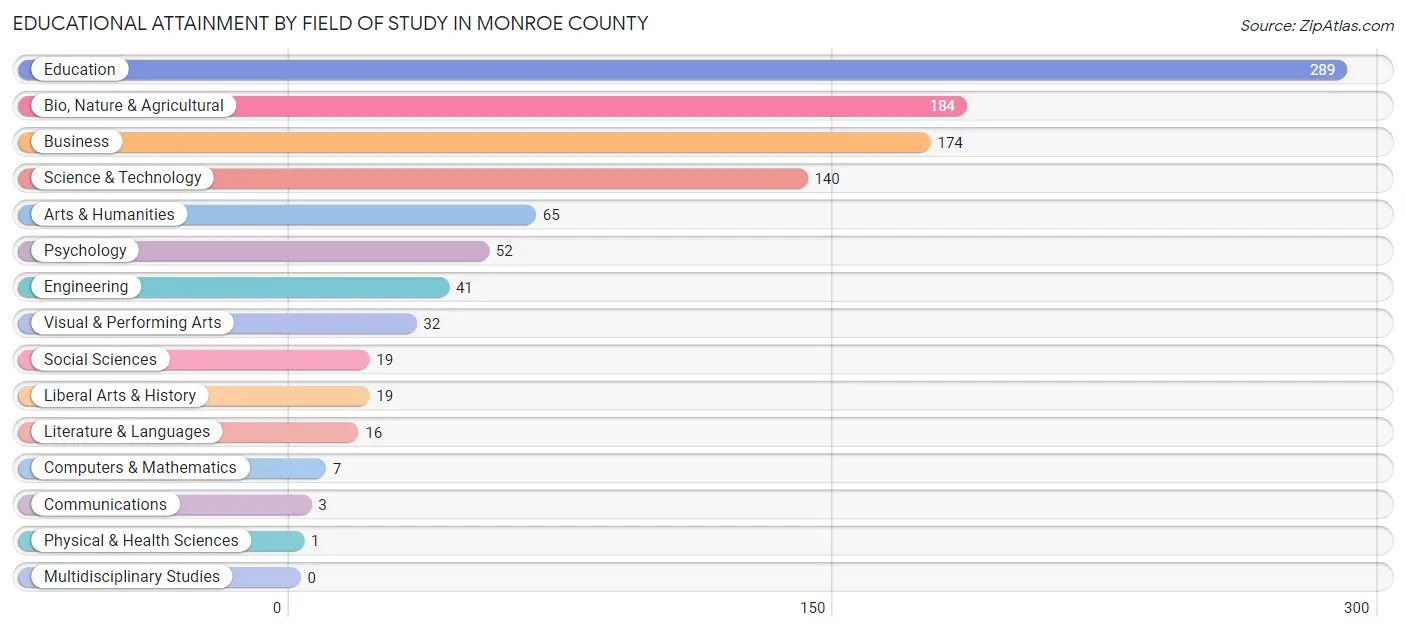
| Field of Study | # Graduates | % Graduates |
| Computers & Mathematics | 7 | 0.7% |
| Bio, Nature & Agricultural | 184 | 17.7% |
| Physical & Health Sciences | 1 | 0.1% |
| Psychology | 52 | 5.0% |
| Social Sciences | 19 | 1.8% |
| Engineering | 41 | 3.9% |
| Multidisciplinary Studies | 0 | 0.0% |
| Science & Technology | 140 | 13.4% |
| Business | 174 | 16.7% |
| Education | 289 | 27.7% |
| Literature & Languages | 16 | 1.5% |
| Liberal Arts & History | 19 | 1.8% |
| Visual & Performing Arts | 32 | 3.1% |
| Communications | 3 | 0.3% |
| Arts & Humanities | 65 | 6.2% |
| Total | 1,042 | 100.0% |
Transportation & Commute in Monroe County
Vehicle Availability by Sex in Monroe County
The most prevalent vehicle ownership categories in Monroe County are males with 3 vehicles (650, accounting for 32.4%) and females with 3 vehicles (380, making up 41.1%).
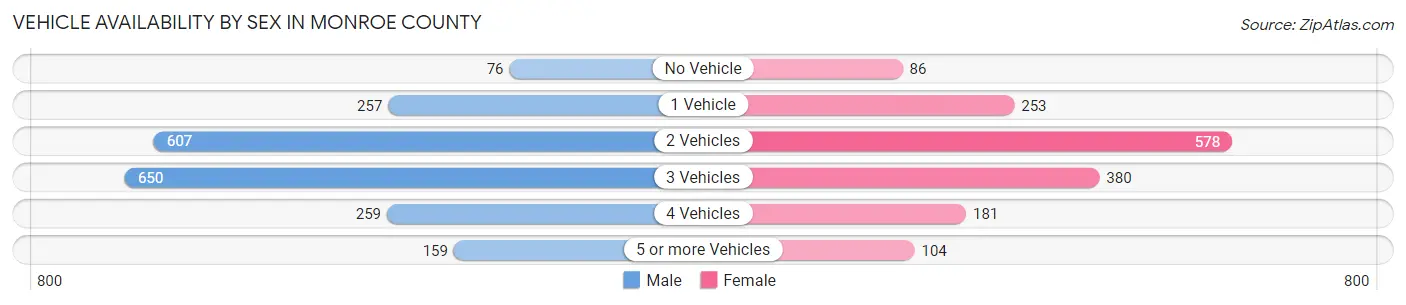
| Vehicles Available | Male | Female |
| No Vehicle | 76 (3.8%) | 86 (5.4%) |
| 1 Vehicle | 257 (12.8%) | 253 (16.0%) |
| 2 Vehicles | 607 (30.2%) | 578 (36.5%) |
| 3 Vehicles | 650 (32.4%) | 380 (24.0%) |
| 4 Vehicles | 259 (12.9%) | 181 (11.4%) |
| 5 or more Vehicles | 159 (7.9%) | 104 (6.6%) |
| Total | 2,008 (100.0%) | 1,582 (100.0%) |
Commute Time in Monroe County
The most frequently occuring commute durations in Monroe County are 20 to 24 minutes (706 commuters, 20.5%), 30 to 34 minutes (632 commuters, 18.3%), and 5 to 9 minutes (505 commuters, 14.6%).
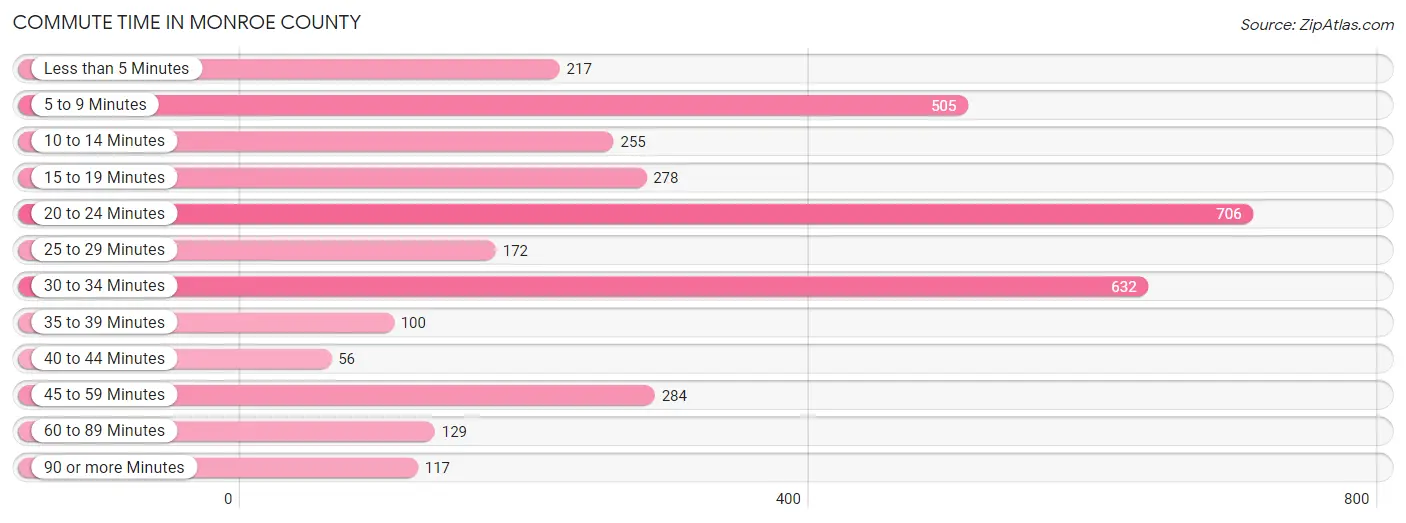
| Commute Time | # Commuters | % Commuters |
| Less than 5 Minutes | 217 | 6.3% |
| 5 to 9 Minutes | 505 | 14.6% |
| 10 to 14 Minutes | 255 | 7.4% |
| 15 to 19 Minutes | 278 | 8.1% |
| 20 to 24 Minutes | 706 | 20.5% |
| 25 to 29 Minutes | 172 | 5.0% |
| 30 to 34 Minutes | 632 | 18.3% |
| 35 to 39 Minutes | 100 | 2.9% |
| 40 to 44 Minutes | 56 | 1.6% |
| 45 to 59 Minutes | 284 | 8.2% |
| 60 to 89 Minutes | 129 | 3.7% |
| 90 or more Minutes | 117 | 3.4% |
Commute Time by Sex in Monroe County
The most common commute times in Monroe County are 30 to 34 minutes (452 commuters, 23.2%) for males and 20 to 24 minutes (330 commuters, 22.0%) for females.
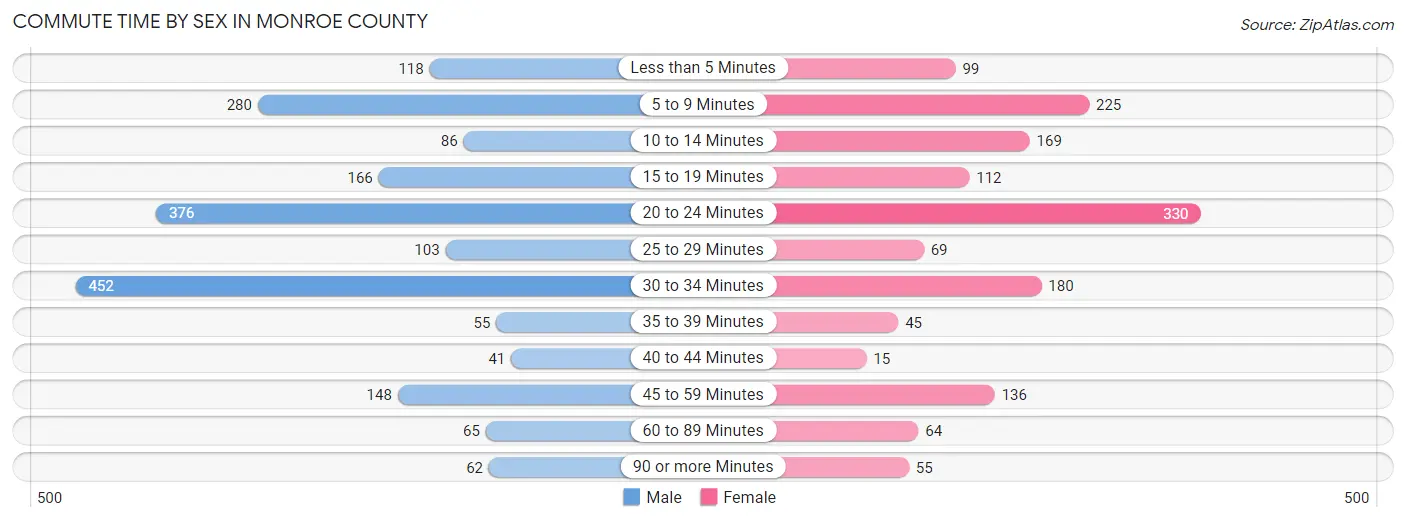
| Commute Time | Male | Female |
| Less than 5 Minutes | 118 (6.0%) | 99 (6.6%) |
| 5 to 9 Minutes | 280 (14.3%) | 225 (15.0%) |
| 10 to 14 Minutes | 86 (4.4%) | 169 (11.3%) |
| 15 to 19 Minutes | 166 (8.5%) | 112 (7.5%) |
| 20 to 24 Minutes | 376 (19.3%) | 330 (22.0%) |
| 25 to 29 Minutes | 103 (5.3%) | 69 (4.6%) |
| 30 to 34 Minutes | 452 (23.2%) | 180 (12.0%) |
| 35 to 39 Minutes | 55 (2.8%) | 45 (3.0%) |
| 40 to 44 Minutes | 41 (2.1%) | 15 (1.0%) |
| 45 to 59 Minutes | 148 (7.6%) | 136 (9.1%) |
| 60 to 89 Minutes | 65 (3.3%) | 64 (4.3%) |
| 90 or more Minutes | 62 (3.2%) | 55 (3.7%) |
Time of Departure to Work by Sex in Monroe County
The most frequent times of departure to work in Monroe County are 7:30 AM to 7:59 AM (509, 26.1%) for males and 7:30 AM to 7:59 AM (547, 36.5%) for females.
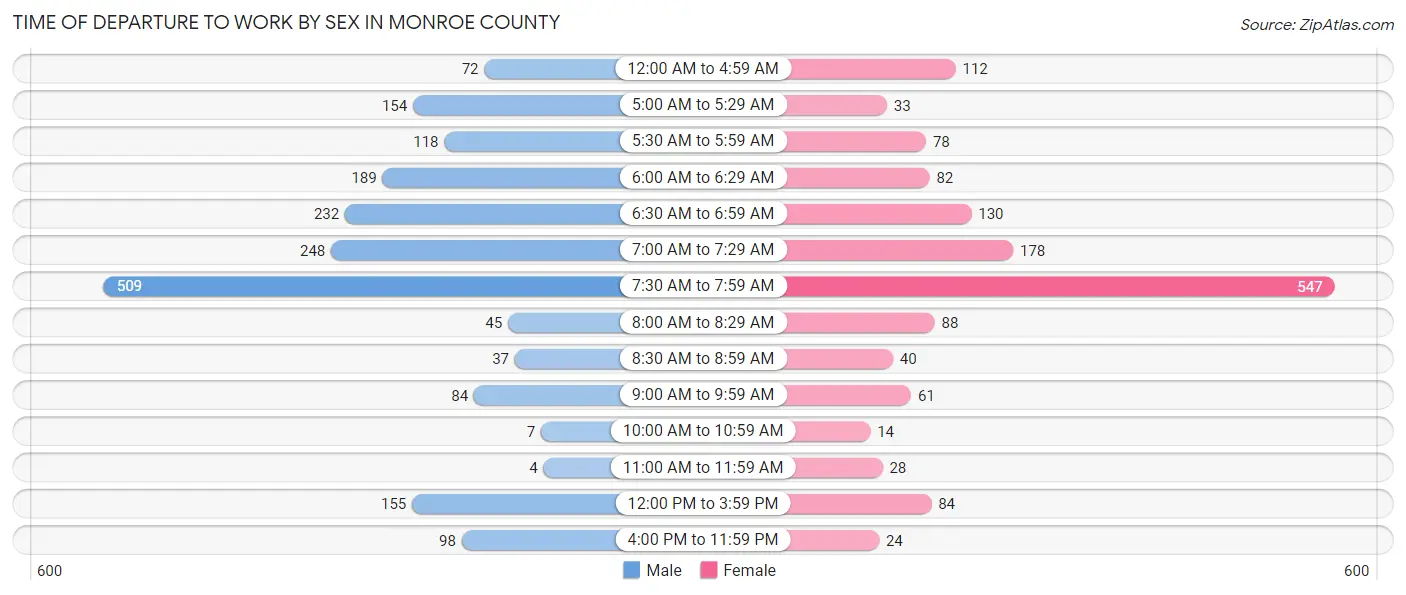
| Time of Departure | Male | Female |
| 12:00 AM to 4:59 AM | 72 (3.7%) | 112 (7.5%) |
| 5:00 AM to 5:29 AM | 154 (7.9%) | 33 (2.2%) |
| 5:30 AM to 5:59 AM | 118 (6.0%) | 78 (5.2%) |
| 6:00 AM to 6:29 AM | 189 (9.7%) | 82 (5.5%) |
| 6:30 AM to 6:59 AM | 232 (11.9%) | 130 (8.7%) |
| 7:00 AM to 7:29 AM | 248 (12.7%) | 178 (11.9%) |
| 7:30 AM to 7:59 AM | 509 (26.1%) | 547 (36.5%) |
| 8:00 AM to 8:29 AM | 45 (2.3%) | 88 (5.9%) |
| 8:30 AM to 8:59 AM | 37 (1.9%) | 40 (2.7%) |
| 9:00 AM to 9:59 AM | 84 (4.3%) | 61 (4.1%) |
| 10:00 AM to 10:59 AM | 7 (0.4%) | 14 (0.9%) |
| 11:00 AM to 11:59 AM | 4 (0.2%) | 28 (1.9%) |
| 12:00 PM to 3:59 PM | 155 (7.9%) | 84 (5.6%) |
| 4:00 PM to 11:59 PM | 98 (5.0%) | 24 (1.6%) |
| Total | 1,952 (100.0%) | 1,499 (100.0%) |
Housing Occupancy in Monroe County
Occupancy by Ownership in Monroe County
Of the total 3,425 dwellings in Monroe County, owner-occupied units account for 2,598 (75.8%), while renter-occupied units make up 827 (24.1%).
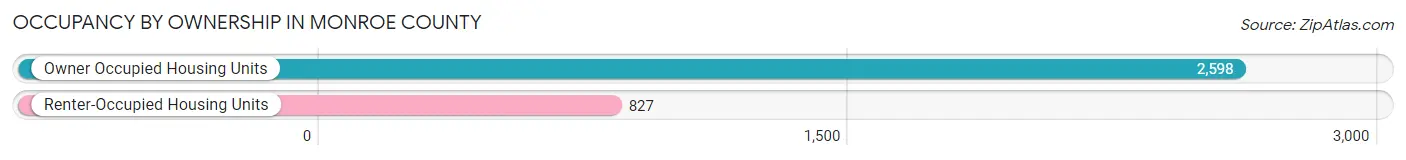
| Occupancy | # Housing Units | % Housing Units |
| Owner Occupied Housing Units | 2,598 | 75.8% |
| Renter-Occupied Housing Units | 827 | 24.1% |
| Total Occupied Housing Units | 3,425 | 100.0% |
Occupancy by Household Size in Monroe County
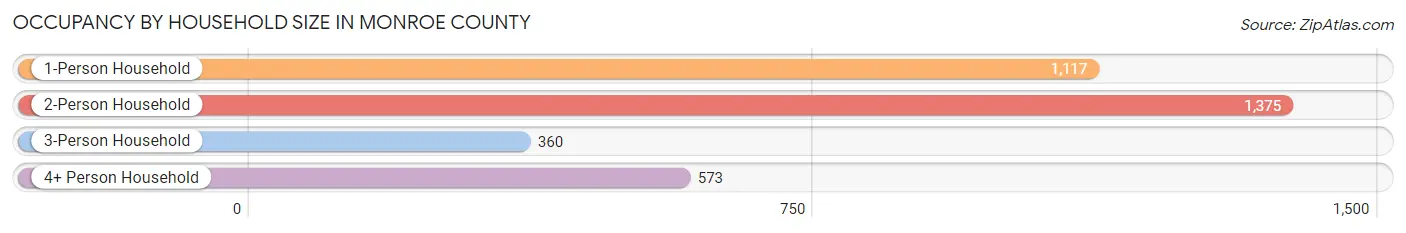
| Household Size | # Housing Units | % Housing Units |
| 1-Person Household | 1,117 | 32.6% |
| 2-Person Household | 1,375 | 40.2% |
| 3-Person Household | 360 | 10.5% |
| 4+ Person Household | 573 | 16.7% |
| Total Housing Units | 3,425 | 100.0% |
Occupancy by Ownership by Household Size in Monroe County
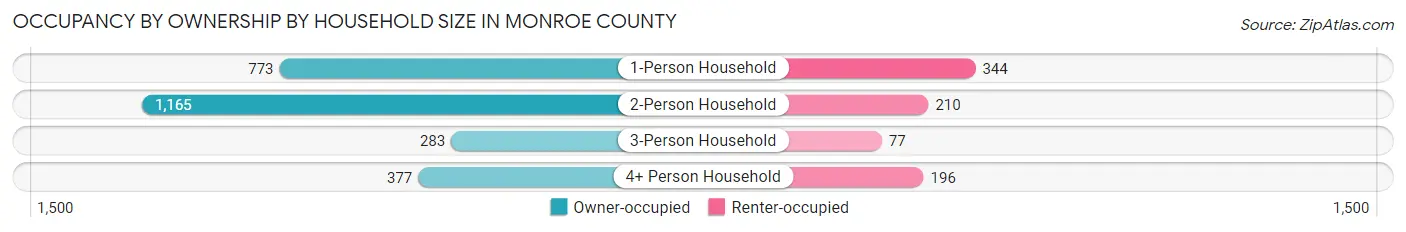
| Household Size | Owner-occupied | Renter-occupied |
| 1-Person Household | 773 (69.2%) | 344 (30.8%) |
| 2-Person Household | 1,165 (84.7%) | 210 (15.3%) |
| 3-Person Household | 283 (78.6%) | 77 (21.4%) |
| 4+ Person Household | 377 (65.8%) | 196 (34.2%) |
| Total Housing Units | 2,598 (75.8%) | 827 (24.1%) |
Occupancy by Educational Attainment in Monroe County
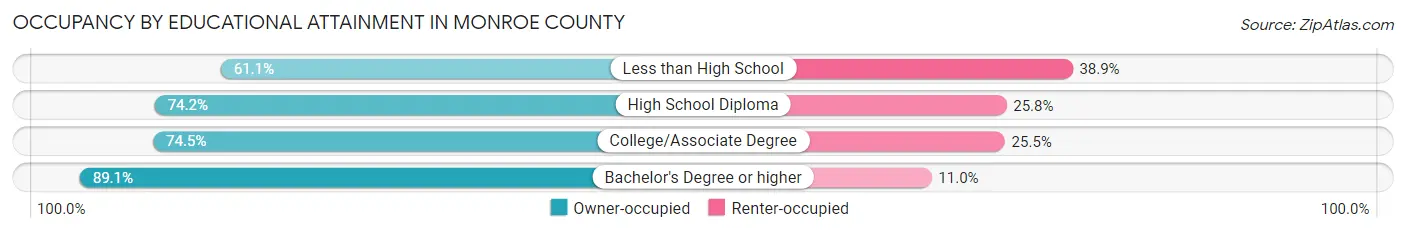
| Household Size | Owner-occupied | Renter-occupied |
| Less than High School | 190 (61.1%) | 121 (38.9%) |
| High School Diploma | 1,222 (74.2%) | 425 (25.8%) |
| College/Associate Degree | 617 (74.5%) | 211 (25.5%) |
| Bachelor's Degree or higher | 569 (89.0%) | 70 (11.0%) |
Occupancy by Age of Householder in Monroe County
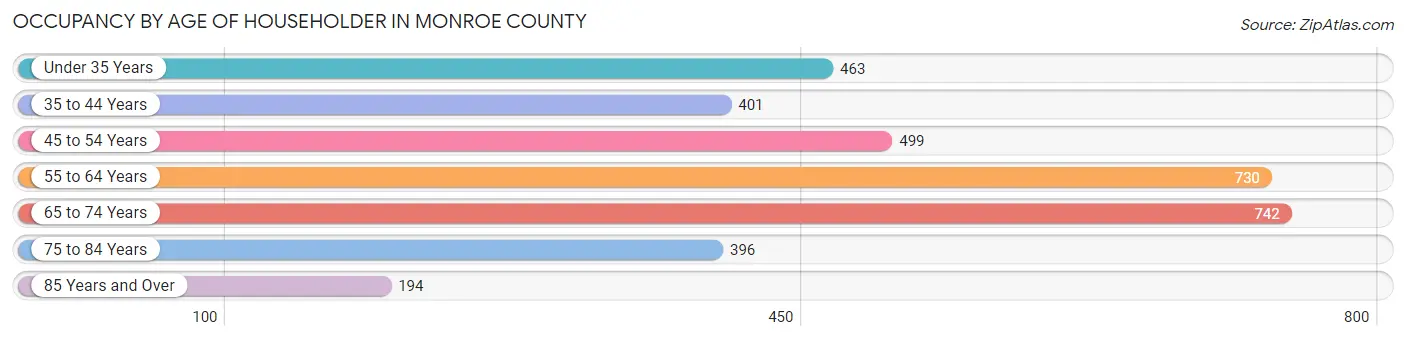
| Age Bracket | # Households | % Households |
| Under 35 Years | 463 | 13.5% |
| 35 to 44 Years | 401 | 11.7% |
| 45 to 54 Years | 499 | 14.6% |
| 55 to 64 Years | 730 | 21.3% |
| 65 to 74 Years | 742 | 21.7% |
| 75 to 84 Years | 396 | 11.6% |
| 85 Years and Over | 194 | 5.7% |
| Total | 3,425 | 100.0% |
Housing Finances in Monroe County
Median Income by Occupancy in Monroe County
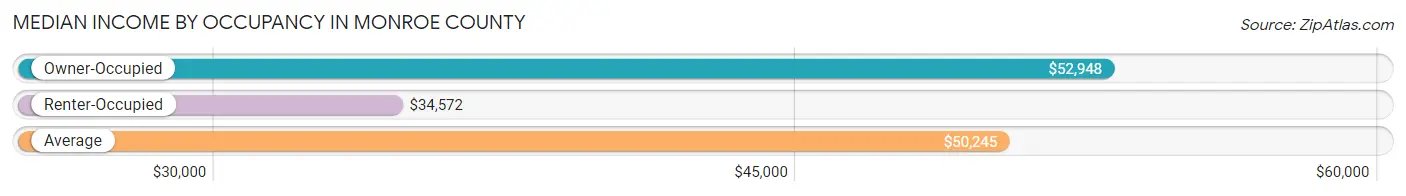
| Occupancy Type | # Households | Median Income |
| Owner-Occupied | 2,598 (75.8%) | $52,948 |
| Renter-Occupied | 827 (24.1%) | $34,572 |
| Average | 3,425 (100.0%) | $50,245 |
Occupancy by Householder Income Bracket in Monroe County
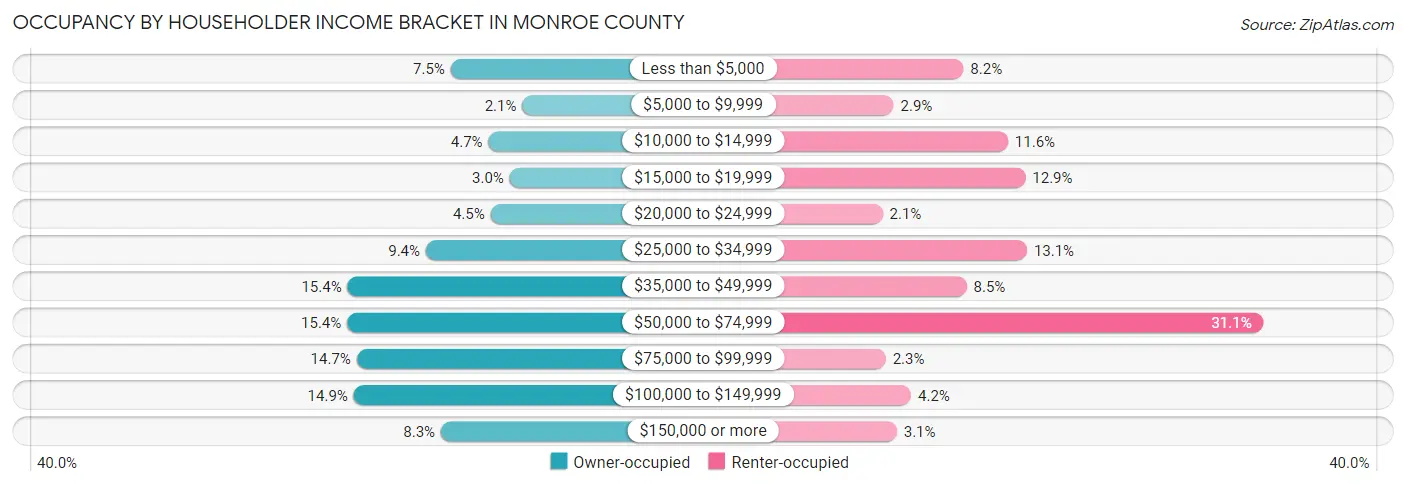
| Income Bracket | Owner-occupied | Renter-occupied |
| Less than $5,000 | 196 (7.5%) | 68 (8.2%) |
| $5,000 to $9,999 | 54 (2.1%) | 24 (2.9%) |
| $10,000 to $14,999 | 121 (4.7%) | 96 (11.6%) |
| $15,000 to $19,999 | 79 (3.0%) | 107 (12.9%) |
| $20,000 to $24,999 | 117 (4.5%) | 17 (2.1%) |
| $25,000 to $34,999 | 245 (9.4%) | 108 (13.1%) |
| $35,000 to $49,999 | 400 (15.4%) | 70 (8.5%) |
| $50,000 to $74,999 | 401 (15.4%) | 257 (31.1%) |
| $75,000 to $99,999 | 382 (14.7%) | 19 (2.3%) |
| $100,000 to $149,999 | 388 (14.9%) | 35 (4.2%) |
| $150,000 or more | 215 (8.3%) | 26 (3.1%) |
| Total | 2,598 (100.0%) | 827 (100.0%) |
Monthly Housing Cost Tiers in Monroe County
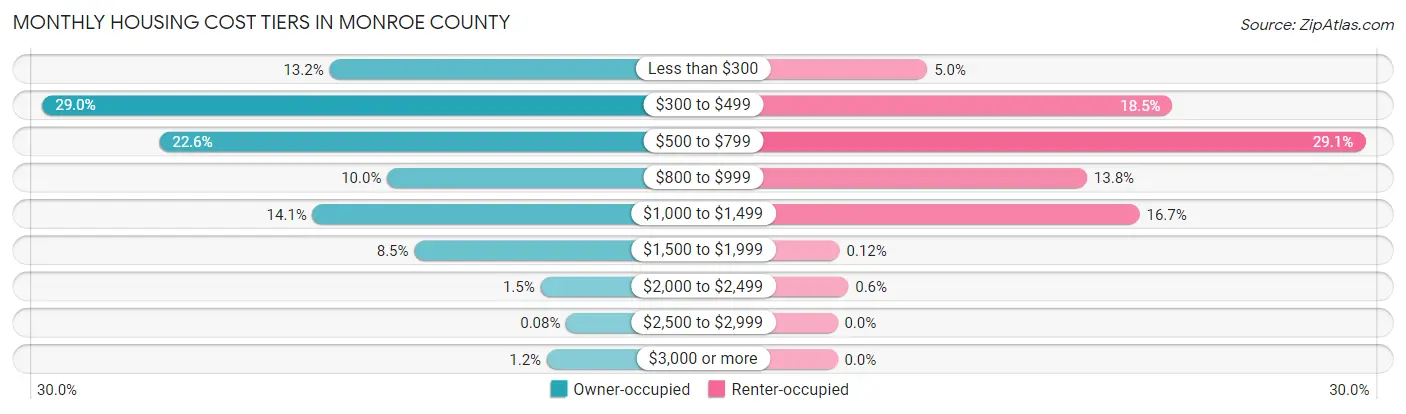
| Monthly Cost | Owner-occupied | Renter-occupied |
| Less than $300 | 342 (13.2%) | 41 (5.0%) |
| $300 to $499 | 754 (29.0%) | 153 (18.5%) |
| $500 to $799 | 586 (22.6%) | 241 (29.1%) |
| $800 to $999 | 259 (10.0%) | 114 (13.8%) |
| $1,000 to $1,499 | 366 (14.1%) | 138 (16.7%) |
| $1,500 to $1,999 | 220 (8.5%) | 1 (0.1%) |
| $2,000 to $2,499 | 39 (1.5%) | 5 (0.6%) |
| $2,500 to $2,999 | 2 (0.1%) | 0 (0.0%) |
| $3,000 or more | 30 (1.1%) | 0 (0.0%) |
| Total | 2,598 (100.0%) | 827 (100.0%) |
Physical Housing Characteristics in Monroe County
Housing Structures in Monroe County
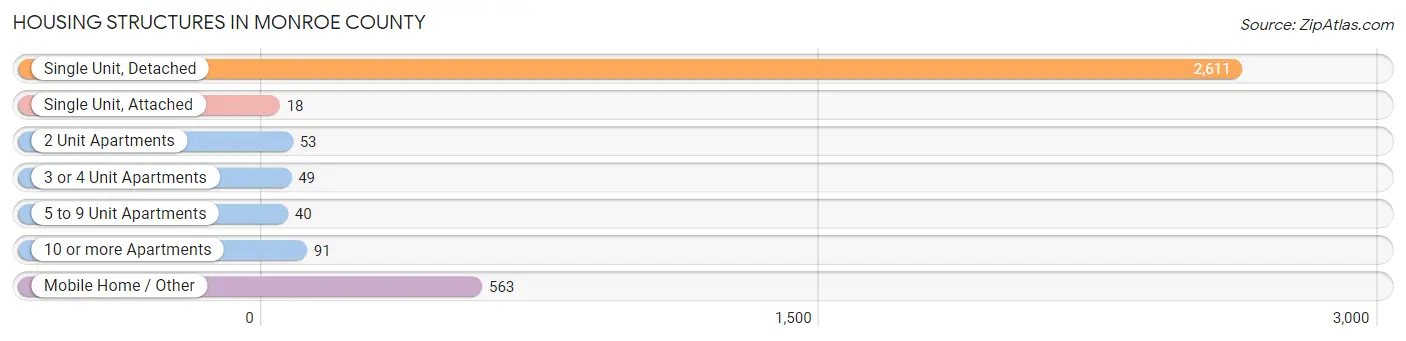
| Structure Type | # Housing Units | % Housing Units |
| Single Unit, Detached | 2,611 | 76.2% |
| Single Unit, Attached | 18 | 0.5% |
| 2 Unit Apartments | 53 | 1.5% |
| 3 or 4 Unit Apartments | 49 | 1.4% |
| 5 to 9 Unit Apartments | 40 | 1.2% |
| 10 or more Apartments | 91 | 2.7% |
| Mobile Home / Other | 563 | 16.4% |
| Total | 3,425 | 100.0% |
Housing Structures by Occupancy in Monroe County
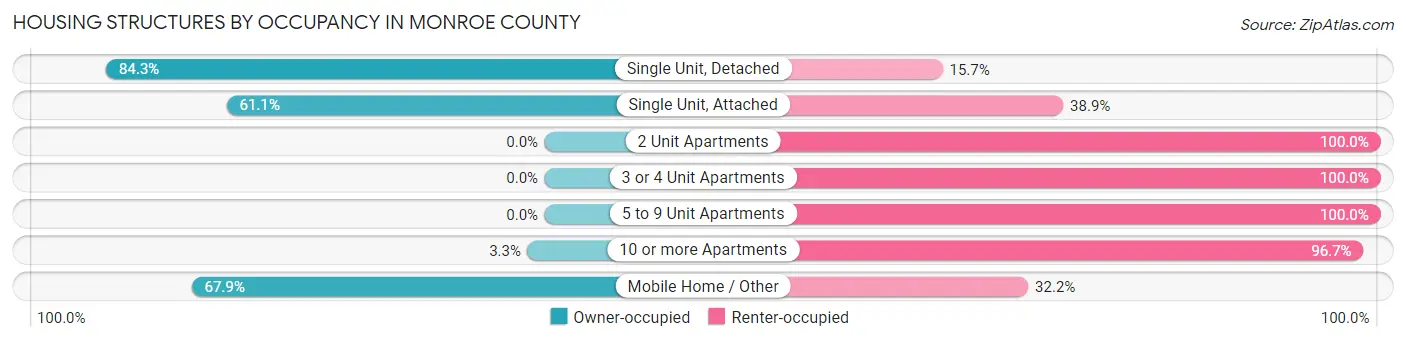
| Structure Type | Owner-occupied | Renter-occupied |
| Single Unit, Detached | 2,202 (84.3%) | 409 (15.7%) |
| Single Unit, Attached | 11 (61.1%) | 7 (38.9%) |
| 2 Unit Apartments | 0 (0.0%) | 53 (100.0%) |
| 3 or 4 Unit Apartments | 0 (0.0%) | 49 (100.0%) |
| 5 to 9 Unit Apartments | 0 (0.0%) | 40 (100.0%) |
| 10 or more Apartments | 3 (3.3%) | 88 (96.7%) |
| Mobile Home / Other | 382 (67.8%) | 181 (32.2%) |
| Total | 2,598 (75.8%) | 827 (24.1%) |
Housing Structures by Number of Rooms in Monroe County
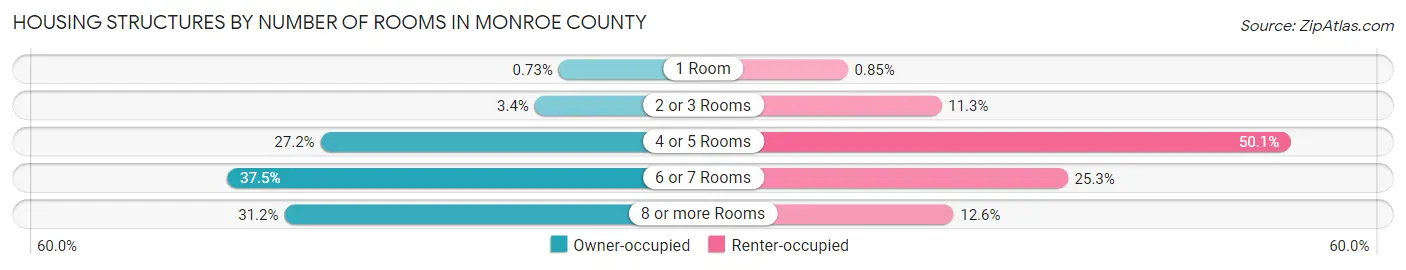
| Number of Rooms | Owner-occupied | Renter-occupied |
| 1 Room | 19 (0.7%) | 7 (0.9%) |
| 2 or 3 Rooms | 88 (3.4%) | 93 (11.3%) |
| 4 or 5 Rooms | 706 (27.2%) | 414 (50.1%) |
| 6 or 7 Rooms | 975 (37.5%) | 209 (25.3%) |
| 8 or more Rooms | 810 (31.2%) | 104 (12.6%) |
| Total | 2,598 (100.0%) | 827 (100.0%) |
Housing Structure by Heating Type in Monroe County
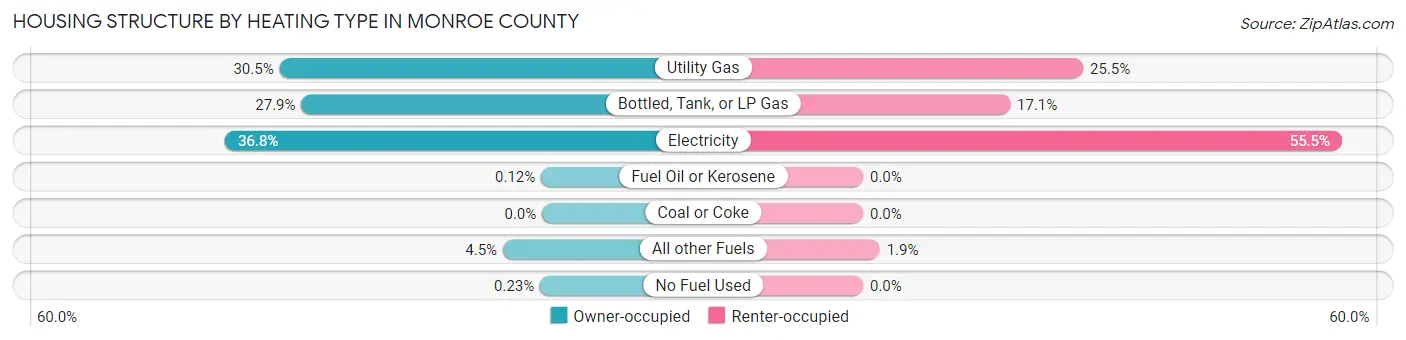
| Heating Type | Owner-occupied | Renter-occupied |
| Utility Gas | 791 (30.4%) | 211 (25.5%) |
| Bottled, Tank, or LP Gas | 725 (27.9%) | 141 (17.1%) |
| Electricity | 955 (36.8%) | 459 (55.5%) |
| Fuel Oil or Kerosene | 3 (0.1%) | 0 (0.0%) |
| Coal or Coke | 0 (0.0%) | 0 (0.0%) |
| All other Fuels | 118 (4.5%) | 16 (1.9%) |
| No Fuel Used | 6 (0.2%) | 0 (0.0%) |
| Total | 2,598 (100.0%) | 827 (100.0%) |
Household Vehicle Usage in Monroe County
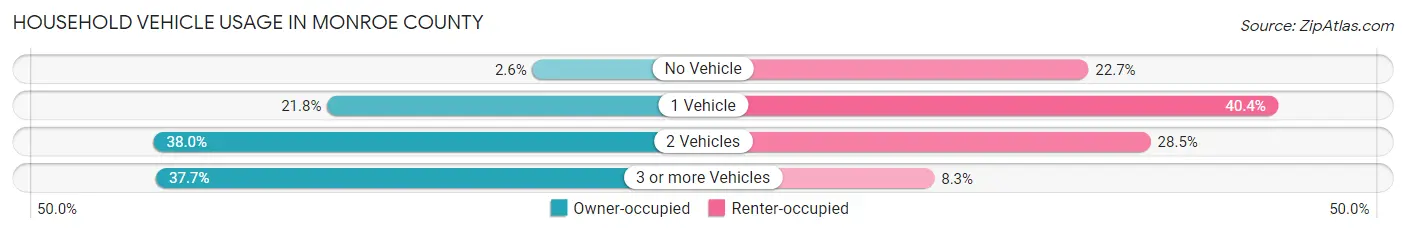
| Vehicles per Household | Owner-occupied | Renter-occupied |
| No Vehicle | 67 (2.6%) | 188 (22.7%) |
| 1 Vehicle | 565 (21.7%) | 334 (40.4%) |
| 2 Vehicles | 986 (38.0%) | 236 (28.5%) |
| 3 or more Vehicles | 980 (37.7%) | 69 (8.3%) |
| Total | 2,598 (100.0%) | 827 (100.0%) |
Real Estate & Mortgages in Monroe County
Real Estate and Mortgage Overview in Monroe County
| Characteristic | Without Mortgage | With Mortgage |
| Housing Units | 1,681 | 917 |
| Median Property Value | $114,400 | $151,600 |
| Median Household Income | $44,299 | $77 |
| Monthly Housing Costs | $431 | $0 |
| Real Estate Taxes | $919 | $9 |
Property Value by Mortgage Status in Monroe County
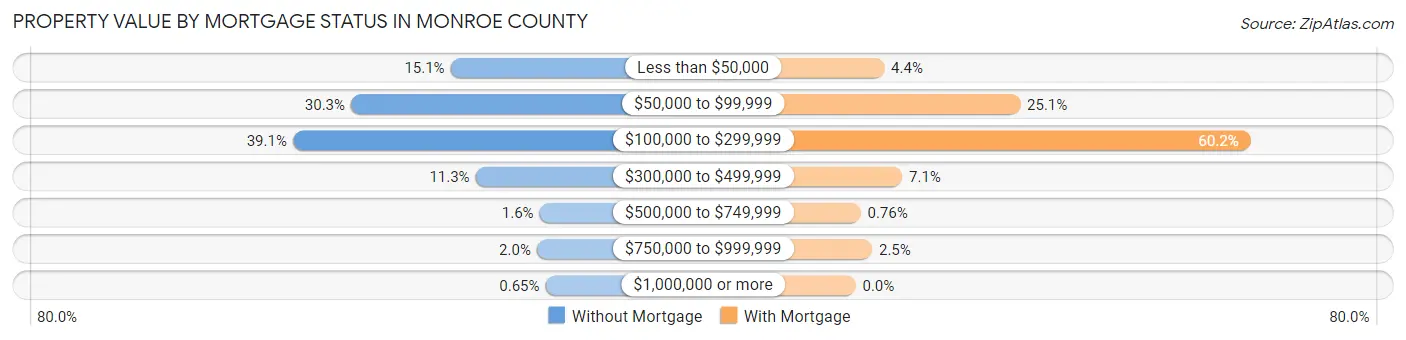
| Property Value | Without Mortgage | With Mortgage |
| Less than $50,000 | 254 (15.1%) | 40 (4.4%) |
| $50,000 to $99,999 | 509 (30.3%) | 230 (25.1%) |
| $100,000 to $299,999 | 658 (39.1%) | 552 (60.2%) |
| $300,000 to $499,999 | 190 (11.3%) | 65 (7.1%) |
| $500,000 to $749,999 | 26 (1.5%) | 7 (0.8%) |
| $750,000 to $999,999 | 33 (2.0%) | 23 (2.5%) |
| $1,000,000 or more | 11 (0.6%) | 0 (0.0%) |
| Total | 1,681 (100.0%) | 917 (100.0%) |
Household Income by Mortgage Status in Monroe County
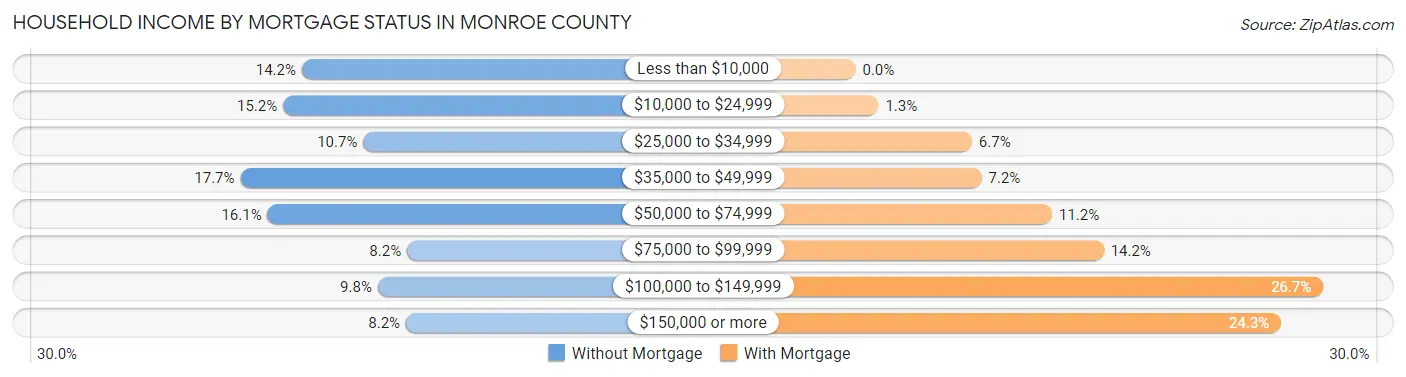
| Household Income | Without Mortgage | With Mortgage |
| Less than $10,000 | 238 (14.2%) | 0 (0.0%) |
| $10,000 to $24,999 | 256 (15.2%) | 12 (1.3%) |
| $25,000 to $34,999 | 179 (10.6%) | 61 (6.7%) |
| $35,000 to $49,999 | 297 (17.7%) | 66 (7.2%) |
| $50,000 to $74,999 | 271 (16.1%) | 103 (11.2%) |
| $75,000 to $99,999 | 137 (8.2%) | 130 (14.2%) |
| $100,000 to $149,999 | 165 (9.8%) | 245 (26.7%) |
| $150,000 or more | 138 (8.2%) | 223 (24.3%) |
| Total | 1,681 (100.0%) | 917 (100.0%) |
Property Value to Household Income Ratio in Monroe County
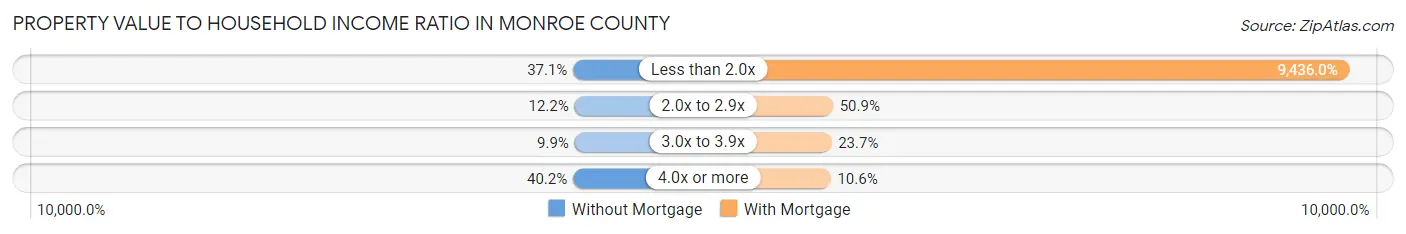
| Value-to-Income Ratio | Without Mortgage | With Mortgage |
| Less than 2.0x | 623 (37.1%) | 86,528 (9,436.0%) |
| 2.0x to 2.9x | 205 (12.2%) | 467 (50.9%) |
| 3.0x to 3.9x | 167 (9.9%) | 217 (23.7%) |
| 4.0x or more | 676 (40.2%) | 97 (10.6%) |
| Total | 1,681 (100.0%) | 917 (100.0%) |
Real Estate Taxes by Mortgage Status in Monroe County
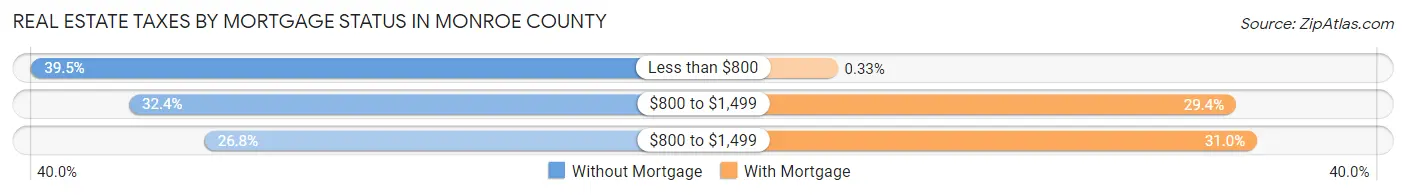
| Property Taxes | Without Mortgage | With Mortgage |
| Less than $800 | 664 (39.5%) | 3 (0.3%) |
| $800 to $1,499 | 544 (32.4%) | 270 (29.4%) |
| $800 to $1,499 | 451 (26.8%) | 284 (31.0%) |
| Total | 1,681 (100.0%) | 917 (100.0%) |
Health & Disability in Monroe County
Health Insurance Coverage by Age in Monroe County
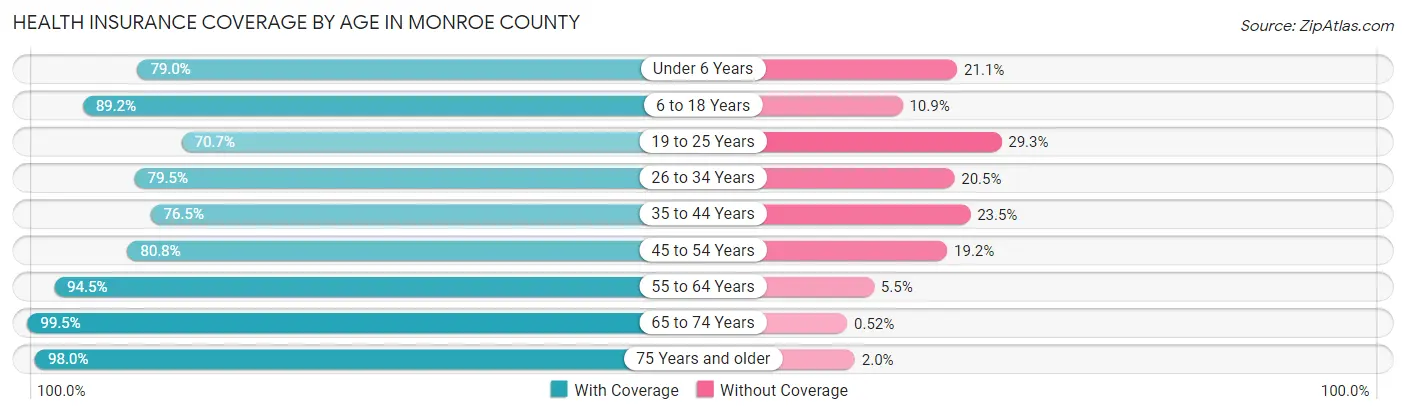
| Age Bracket | With Coverage | Without Coverage |
| Under 6 Years | 405 (78.9%) | 108 (21.0%) |
| 6 to 18 Years | 1,356 (89.1%) | 165 (10.8%) |
| 19 to 25 Years | 418 (70.7%) | 173 (29.3%) |
| 26 to 34 Years | 577 (79.5%) | 149 (20.5%) |
| 35 to 44 Years | 665 (76.5%) | 204 (23.5%) |
| 45 to 54 Years | 763 (80.8%) | 181 (19.2%) |
| 55 to 64 Years | 1,266 (94.5%) | 74 (5.5%) |
| 65 to 74 Years | 1,146 (99.5%) | 6 (0.5%) |
| 75 Years and older | 846 (98.0%) | 17 (2.0%) |
| Total | 7,442 (87.4%) | 1,077 (12.6%) |
Health Insurance Coverage by Citizenship Status in Monroe County
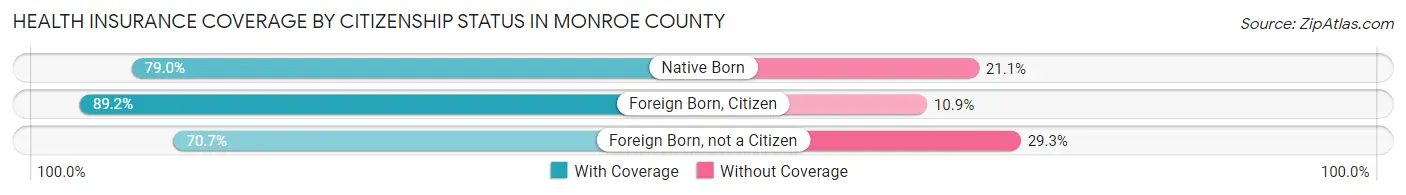
| Citizenship Status | With Coverage | Without Coverage |
| Native Born | 405 (78.9%) | 108 (21.0%) |
| Foreign Born, Citizen | 1,356 (89.1%) | 165 (10.8%) |
| Foreign Born, not a Citizen | 418 (70.7%) | 173 (29.3%) |
Health Insurance Coverage by Household Income in Monroe County
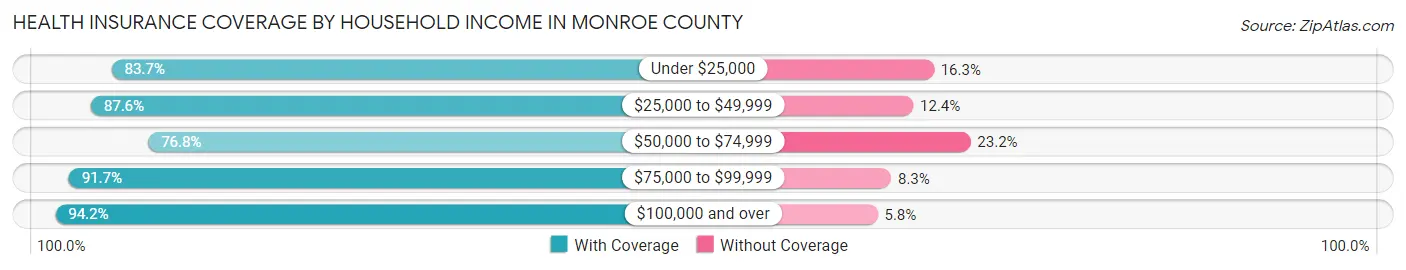
| Household Income | With Coverage | Without Coverage |
| Under $25,000 | 1,120 (83.7%) | 218 (16.3%) |
| $25,000 to $49,999 | 1,452 (87.6%) | 206 (12.4%) |
| $50,000 to $74,999 | 1,347 (76.8%) | 406 (23.2%) |
| $75,000 to $99,999 | 1,151 (91.7%) | 104 (8.3%) |
| $100,000 and over | 2,338 (94.2%) | 143 (5.8%) |
Public vs Private Health Insurance Coverage by Age in Monroe County
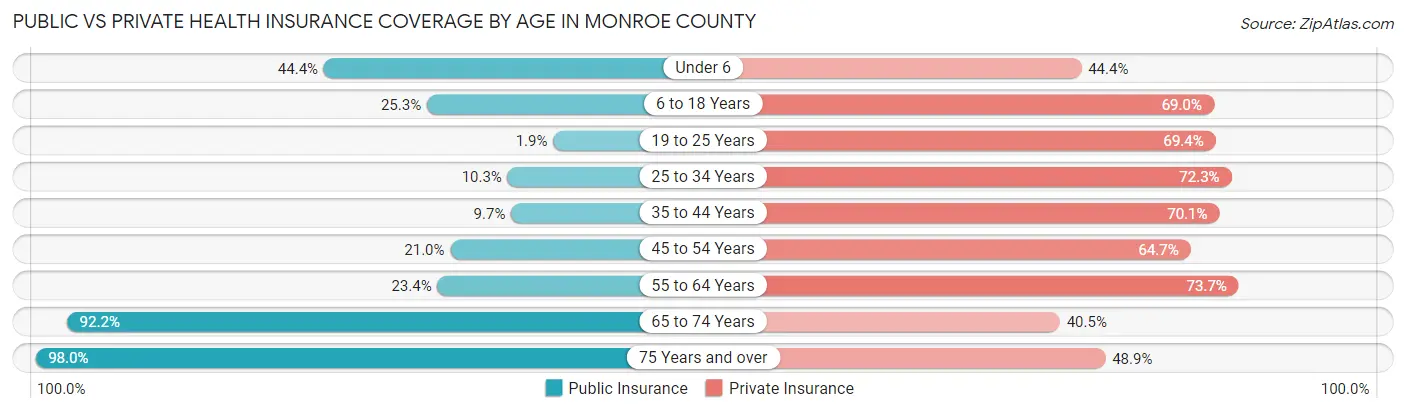
| Age Bracket | Public Insurance | Private Insurance |
| Under 6 | 228 (44.4%) | 228 (44.4%) |
| 6 to 18 Years | 385 (25.3%) | 1,050 (69.0%) |
| 19 to 25 Years | 11 (1.9%) | 410 (69.4%) |
| 25 to 34 Years | 75 (10.3%) | 525 (72.3%) |
| 35 to 44 Years | 84 (9.7%) | 609 (70.1%) |
| 45 to 54 Years | 198 (21.0%) | 611 (64.7%) |
| 55 to 64 Years | 313 (23.4%) | 987 (73.7%) |
| 65 to 74 Years | 1,062 (92.2%) | 466 (40.5%) |
| 75 Years and over | 846 (98.0%) | 422 (48.9%) |
| Total | 3,202 (37.6%) | 5,308 (62.3%) |
Disability Status by Sex by Age in Monroe County
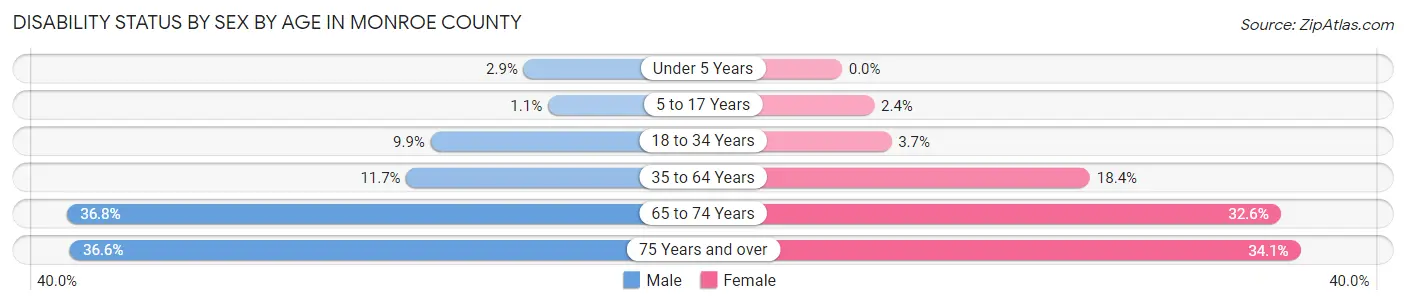
| Age Bracket | Male | Female |
| Under 5 Years | 7 (2.9%) | 0 (0.0%) |
| 5 to 17 Years | 9 (1.1%) | 16 (2.4%) |
| 18 to 34 Years | 72 (9.9%) | 26 (3.7%) |
| 35 to 64 Years | 189 (11.7%) | 282 (18.4%) |
| 65 to 74 Years | 214 (36.8%) | 186 (32.6%) |
| 75 Years and over | 145 (36.6%) | 159 (34.1%) |
Disability Class by Sex by Age in Monroe County
Disability Class: Hearing Difficulty
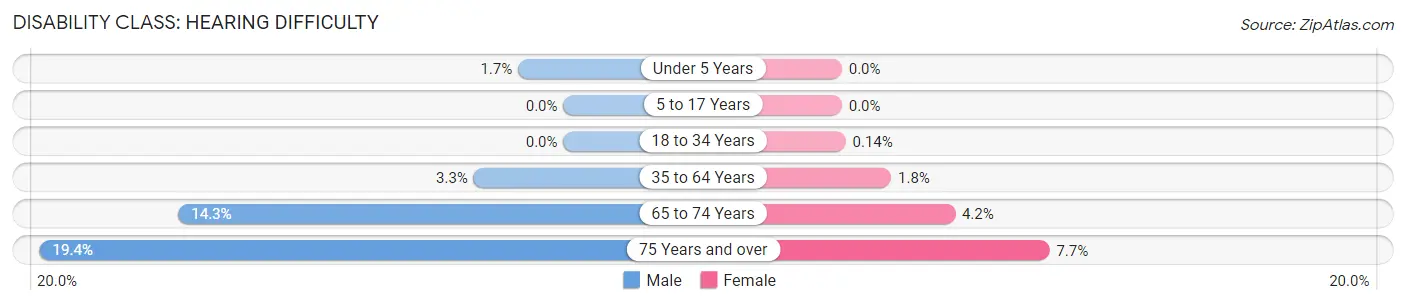
| Age Bracket | Male | Female |
| Under 5 Years | 4 (1.7%) | 0 (0.0%) |
| 5 to 17 Years | 0 (0.0%) | 0 (0.0%) |
| 18 to 34 Years | 0 (0.0%) | 1 (0.1%) |
| 35 to 64 Years | 54 (3.3%) | 28 (1.8%) |
| 65 to 74 Years | 83 (14.3%) | 24 (4.2%) |
| 75 Years and over | 77 (19.4%) | 36 (7.7%) |
Disability Class: Vision Difficulty
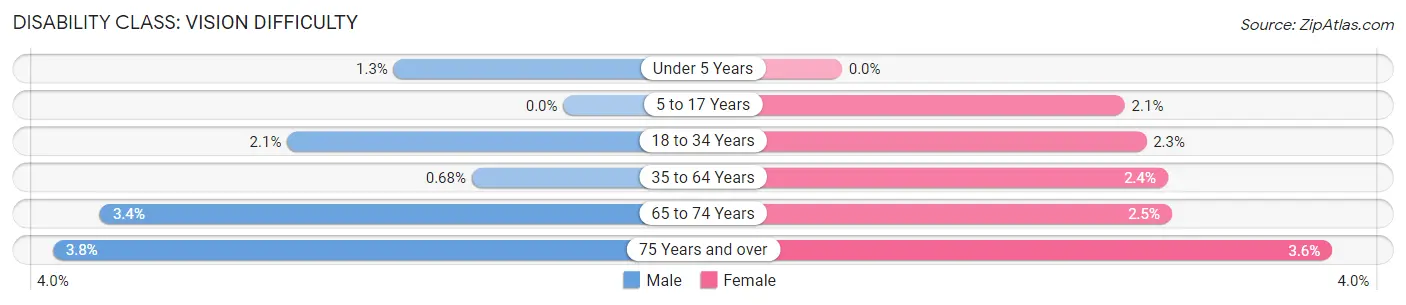
| Age Bracket | Male | Female |
| Under 5 Years | 3 (1.3%) | 0 (0.0%) |
| 5 to 17 Years | 0 (0.0%) | 14 (2.1%) |
| 18 to 34 Years | 15 (2.1%) | 16 (2.3%) |
| 35 to 64 Years | 11 (0.7%) | 37 (2.4%) |
| 65 to 74 Years | 20 (3.4%) | 14 (2.5%) |
| 75 Years and over | 15 (3.8%) | 17 (3.6%) |
Disability Class: Cognitive Difficulty
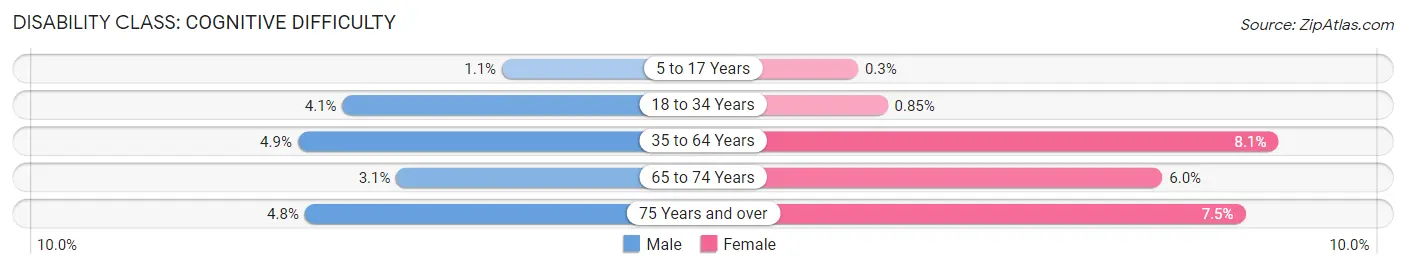
| Age Bracket | Male | Female |
| 5 to 17 Years | 9 (1.1%) | 2 (0.3%) |
| 18 to 34 Years | 30 (4.1%) | 6 (0.9%) |
| 35 to 64 Years | 80 (4.9%) | 124 (8.1%) |
| 65 to 74 Years | 18 (3.1%) | 34 (5.9%) |
| 75 Years and over | 19 (4.8%) | 35 (7.5%) |
Disability Class: Ambulatory Difficulty
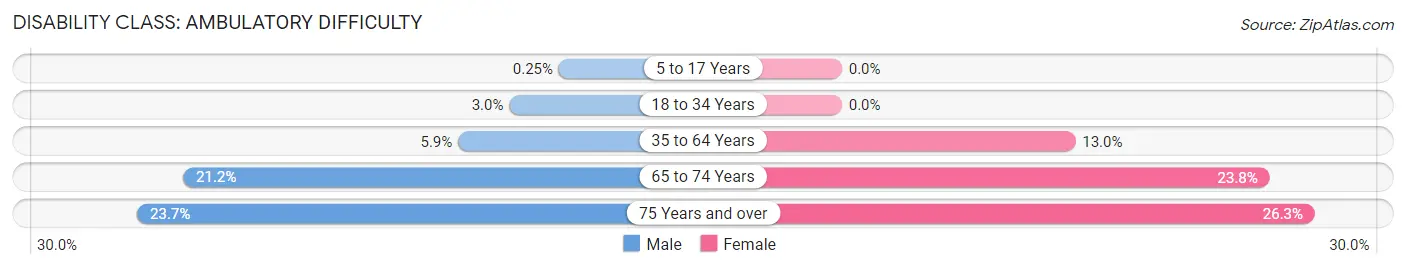
| Age Bracket | Male | Female |
| 5 to 17 Years | 2 (0.3%) | 0 (0.0%) |
| 18 to 34 Years | 22 (3.0%) | 0 (0.0%) |
| 35 to 64 Years | 95 (5.9%) | 199 (13.0%) |
| 65 to 74 Years | 123 (21.2%) | 136 (23.8%) |
| 75 Years and over | 94 (23.7%) | 123 (26.3%) |
Disability Class: Self-Care Difficulty
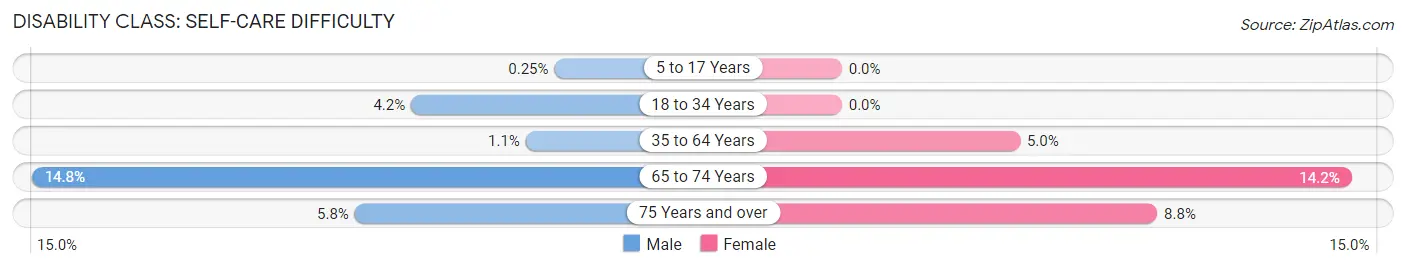
| Age Bracket | Male | Female |
| 5 to 17 Years | 2 (0.3%) | 0 (0.0%) |
| 18 to 34 Years | 31 (4.2%) | 0 (0.0%) |
| 35 to 64 Years | 17 (1.1%) | 76 (5.0%) |
| 65 to 74 Years | 86 (14.8%) | 81 (14.2%) |
| 75 Years and over | 23 (5.8%) | 41 (8.8%) |
Technology Access in Monroe County
Computing Device Access in Monroe County
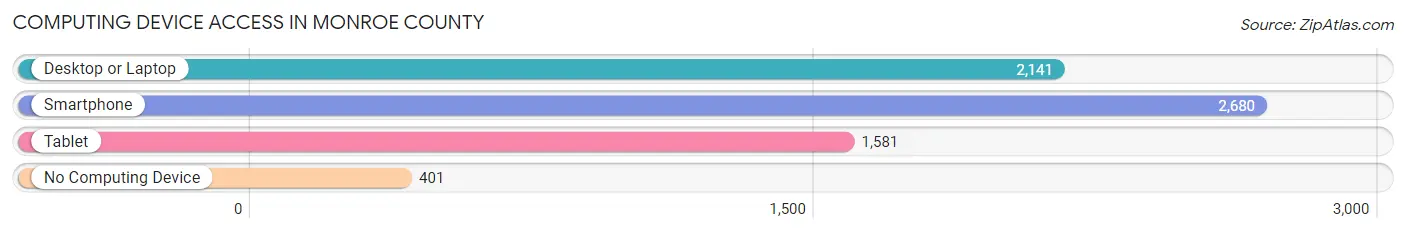
| Device Type | # Households | % Households |
| Desktop or Laptop | 2,141 | 62.5% |
| Smartphone | 2,680 | 78.2% |
| Tablet | 1,581 | 46.2% |
| No Computing Device | 401 | 11.7% |
| Total | 3,425 | 100.0% |
Internet Access in Monroe County
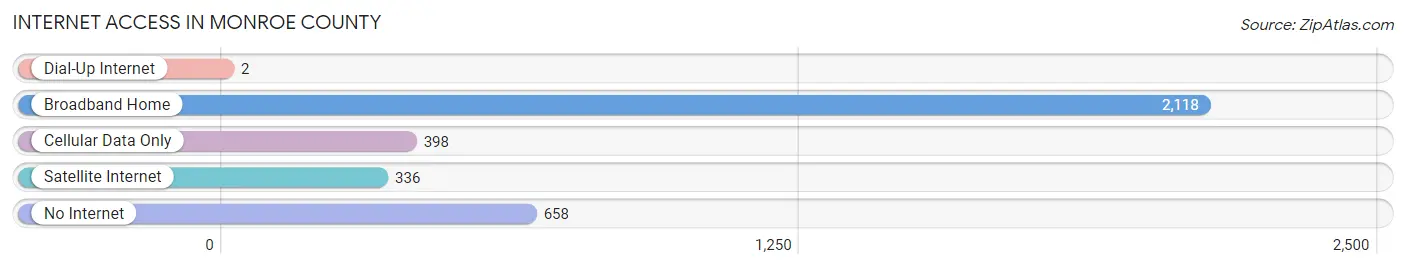
| Internet Type | # Households | % Households |
| Dial-Up Internet | 2 | 0.1% |
| Broadband Home | 2,118 | 61.8% |
| Cellular Data Only | 398 | 11.6% |
| Satellite Internet | 336 | 9.8% |
| No Internet | 658 | 19.2% |
| Total | 3,425 | 100.0% |
Monroe County Summary
Monroe County, Missouri is located in the northeastern corner of the state, and is bordered by Pike County to the north, Ralls County to the east, Audrain County to the south, and Shelby County to the west. The county seat is Paris, and the county was established in 1831. The county has a total area of 517 square miles, and a population of 8,845 as of the 2010 census.
Monroe County is part of the Hannibal, MO Micropolitan Statistical Area, and is home to Mark Twain Lake, a reservoir created by the U.S. Army Corps of Engineers in the late 1970s. The lake is a popular destination for fishing, boating, and other recreational activities.
The county's economy is largely based on agriculture, with corn, soybeans, and wheat being the primary crops. Other industries include manufacturing, retail, and tourism. The county is home to several small businesses, including a winery, a brewery, and a distillery.
The county's geography is mostly flat, with rolling hills in the northern and western parts of the county. The county is drained by the Salt River, which flows through the county from north to south. The county is also home to several small lakes, including Mark Twain Lake.
The county's population is largely white, with a small African American population. The median household income is $41,845, and the median home value is $90,000. The county has a low unemployment rate of 4.2%, and a poverty rate of 13.3%.
Monroe County has a rich history, dating back to the early 1800s. The county was named after James Monroe, the fifth president of the United States. The county was home to several Native American tribes, including the Osage, Kickapoo, and Shawnee. The county was also home to several early settlers, including the French explorer Pierre Laclede, who founded the city of St. Louis in 1764.
Monroe County has a long and varied history, and is an important part of the state of Missouri. The county is home to a variety of industries, and is a popular destination for outdoor recreation. The county's population is diverse, and the economy is strong. Monroe County is an important part of the state, and is sure to remain a vibrant and prosperous part of Missouri for many years to come.
Common Questions
What is Per Capita Income in Monroe County?
Per Capita income in Monroe County is $28,787.
What is the Median Family Income in Monroe County?
Median Family Income in Monroe County is $69,286.
What is the Median Household income in Monroe County?
Median Household Income in Monroe County is $50,245.
What is Income or Wage Gap in Monroe County?
Income or Wage Gap in Monroe County is 35.3%.
Women in Monroe County earn 64.7 cents for every dollar earned by a man.
What is Inequality or Gini Index in Monroe County?
Inequality or Gini Index in Monroe County is 0.48.
What is the Total Population of Monroe County?
Total Population of Monroe County is 8,668.
What is the Total Male Population of Monroe County?
Total Male Population of Monroe County is 4,445.
What is the Total Female Population of Monroe County?
Total Female Population of Monroe County is 4,223.
What is the Ratio of Males per 100 Females in Monroe County?
There are 105.26 Males per 100 Females in Monroe County.
What is the Ratio of Females per 100 Males in Monroe County?
There are 95.01 Females per 100 Males in Monroe County.
What is the Median Population Age in Monroe County?
Median Population Age in Monroe County is 45.8 Years.
What is the Average Family Size in Monroe County
Average Family Size in Monroe County is 3.2 People.
What is the Average Household Size in Monroe County
Average Household Size in Monroe County is 2.5 People.
How Large is the Labor Force in Monroe County?
There are 3,660 People in the Labor Forcein in Monroe County.
What is the Percentage of People in the Labor Force in Monroe County?
52.0% of People are in the Labor Force in Monroe County.
What is the Unemployment Rate in Monroe County?
Unemployment Rate in Monroe County is 1.2%.