Moniteau County, MO Map & Demographics
Moniteau County Map
Moniteau County Overview
$28,546
PER CAPITA INCOME
$83,901
AVG FAMILY INCOME
$66,792
AVG HOUSEHOLD INCOME
24.8%
WAGE / INCOME GAP [ % ]
75.2¢/ $1
WAGE / INCOME GAP [ $ ]
0.41
INEQUALITY / GINI INDEX
15,401
TOTAL POPULATION
7,982
MALE POPULATION
7,419
FEMALE POPULATION
107.59
MALES / 100 FEMALES
92.95
FEMALES / 100 MALES
37.6
MEDIAN AGE
3.1
AVG FAMILY SIZE
2.5
AVG HOUSEHOLD SIZE
6,936
LABOR FORCE [ PEOPLE ]
57.6%
PERCENT IN LABOR FORCE
3.0%
UNEMPLOYMENT RATE
Income in Moniteau County
Income Overview in Moniteau County
Per Capita Income in Moniteau County is $28,546, while median incomes of families and households are $83,901 and $66,792 respectively.
| Characteristic | Number | Measure |
| Per Capita Income | 15,401 | $28,546 |
| Median Family Income | 3,740 | $83,901 |
| Mean Family Income | 3,740 | $92,412 |
| Median Household Income | 5,691 | $66,792 |
| Mean Household Income | 5,691 | $78,611 |
| Income Deficit | 3,740 | $0 |
| Wage / Income Gap (%) | 15,401 | 24.83% |
| Wage / Income Gap ($) | 15,401 | 75.17¢ per $1 |
| Gini / Inequality Index | 15,401 | 0.41 |
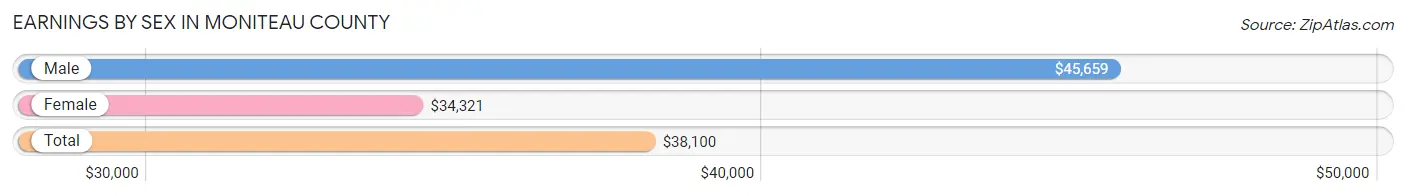
Earnings by Sex in Moniteau County
Average Earnings in Moniteau County are $38,100, $45,659 for men and $34,321 for women, a difference of 24.8%.
| Sex | Number | Average Earnings |
| Male | 3,663 (50.1%) | $45,659 |
| Female | 3,651 (49.9%) | $34,321 |
| Total | 7,314 (100.0%) | $38,100 |
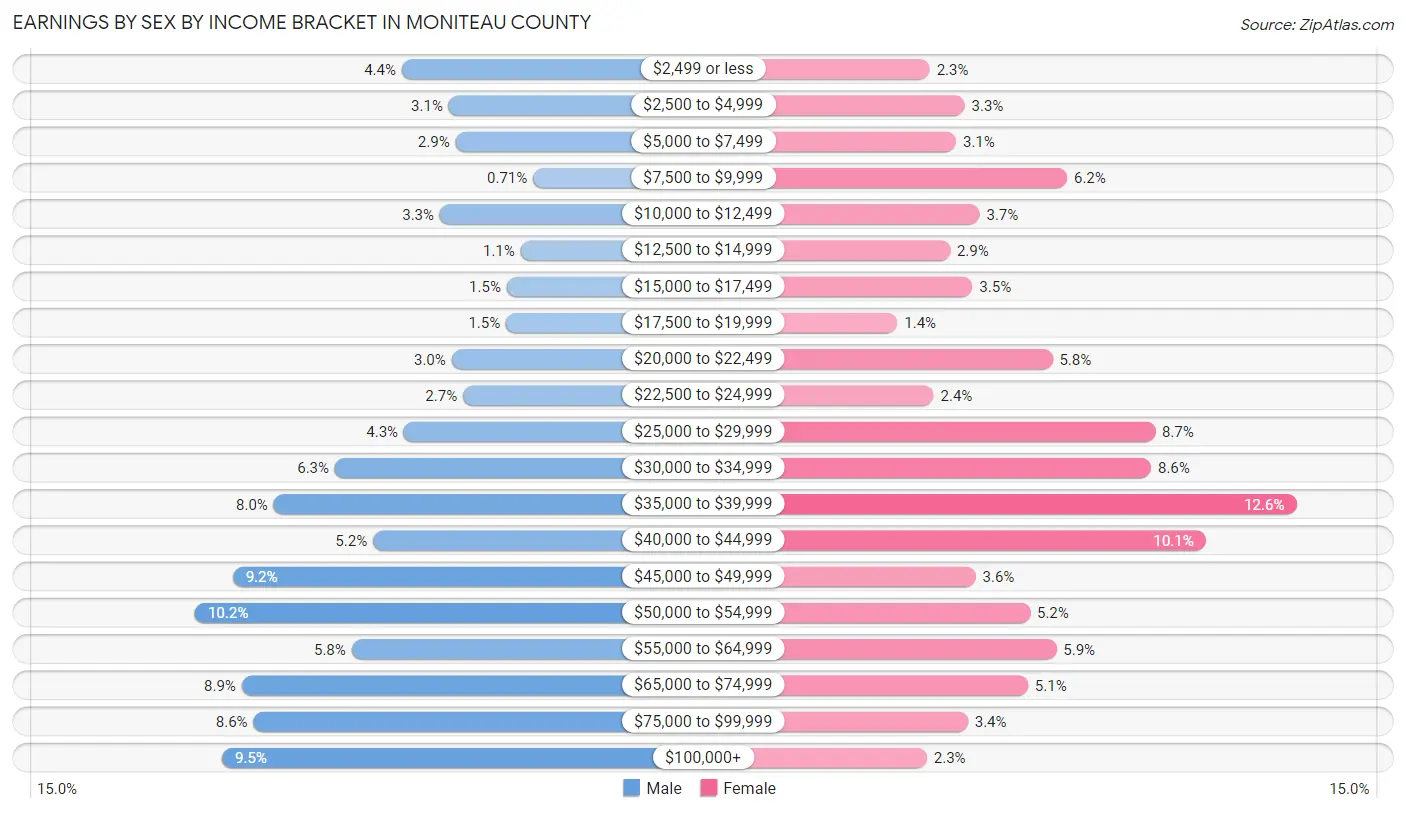
Earnings by Sex by Income Bracket in Moniteau County
The most common earnings brackets in Moniteau County are $50,000 to $54,999 for men (374 | 10.2%) and $35,000 to $39,999 for women (461 | 12.6%).
| Income | Male | Female |
| $2,499 or less | 161 (4.4%) | 85 (2.3%) |
| $2,500 to $4,999 | 113 (3.1%) | 121 (3.3%) |
| $5,000 to $7,499 | 106 (2.9%) | 112 (3.1%) |
| $7,500 to $9,999 | 26 (0.7%) | 226 (6.2%) |
| $10,000 to $12,499 | 122 (3.3%) | 136 (3.7%) |
| $12,500 to $14,999 | 39 (1.1%) | 106 (2.9%) |
| $15,000 to $17,499 | 53 (1.5%) | 129 (3.5%) |
| $17,500 to $19,999 | 54 (1.5%) | 52 (1.4%) |
| $20,000 to $22,499 | 110 (3.0%) | 211 (5.8%) |
| $22,500 to $24,999 | 98 (2.7%) | 89 (2.4%) |
| $25,000 to $29,999 | 159 (4.3%) | 316 (8.7%) |
| $30,000 to $34,999 | 230 (6.3%) | 312 (8.6%) |
| $35,000 to $39,999 | 293 (8.0%) | 461 (12.6%) |
| $40,000 to $44,999 | 191 (5.2%) | 368 (10.1%) |
| $45,000 to $49,999 | 335 (9.1%) | 132 (3.6%) |
| $50,000 to $54,999 | 374 (10.2%) | 188 (5.1%) |
| $55,000 to $64,999 | 213 (5.8%) | 215 (5.9%) |
| $65,000 to $74,999 | 326 (8.9%) | 186 (5.1%) |
| $75,000 to $99,999 | 314 (8.6%) | 124 (3.4%) |
| $100,000+ | 346 (9.5%) | 82 (2.2%) |
| Total | 3,663 (100.0%) | 3,651 (100.0%) |
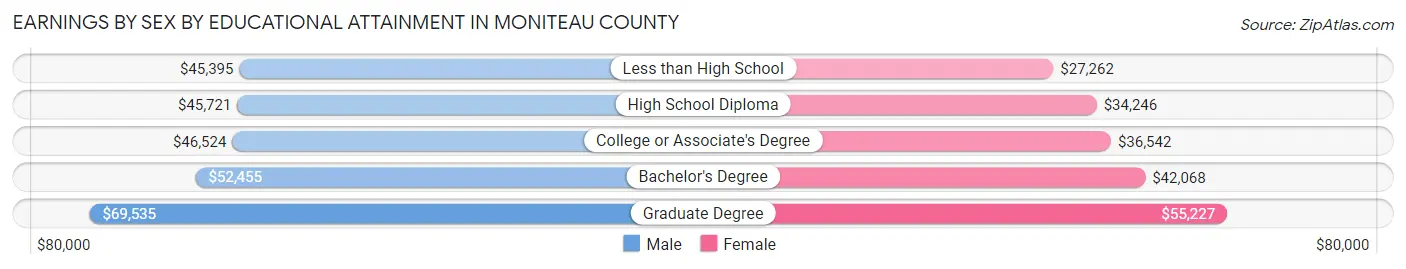
Earnings by Sex by Educational Attainment in Moniteau County
Average earnings in Moniteau County are $47,477 for men and $36,621 for women, a difference of 22.9%. Men with an educational attainment of graduate degree enjoy the highest average annual earnings of $69,535, while those with less than high school education earn the least with $45,395. Women with an educational attainment of graduate degree earn the most with the average annual earnings of $55,227, while those with less than high school education have the smallest earnings of $27,262.
| Educational Attainment | Male Income | Female Income |
| Less than High School | $45,395 | $27,262 |
| High School Diploma | $45,721 | $34,246 |
| College or Associate's Degree | $46,524 | $36,542 |
| Bachelor's Degree | $52,455 | $42,068 |
| Graduate Degree | $69,535 | $55,227 |
| Total | $47,477 | $36,621 |
Family Income in Moniteau County
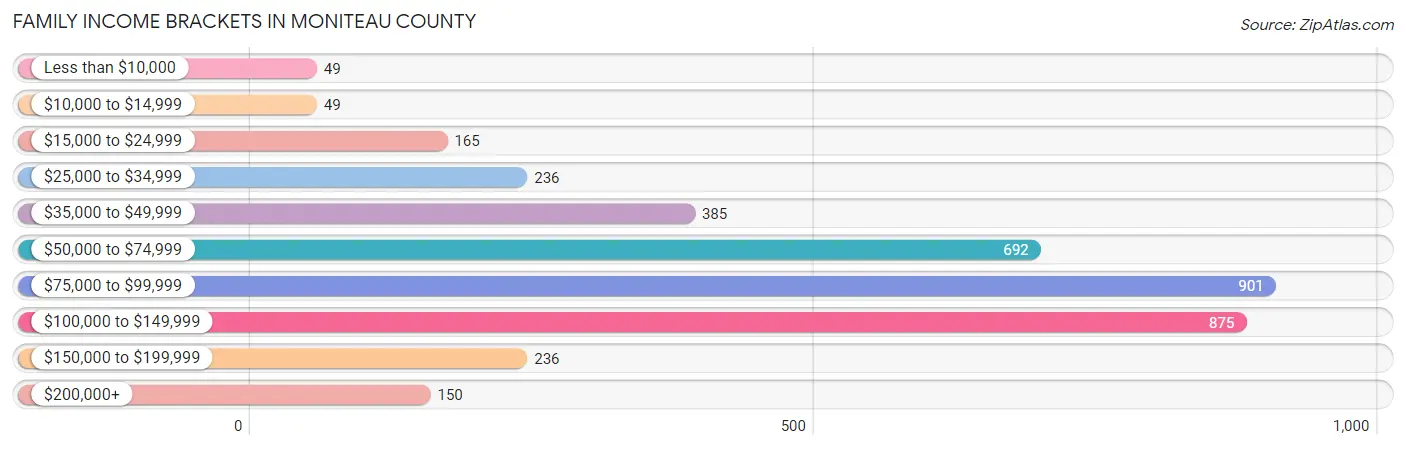
Family Income Brackets in Moniteau County
According to the Moniteau County family income data, there are 901 families falling into the $75,000 to $99,999 income range, which is the most common income bracket and makes up 24.1% of all families. Conversely, the less than $10,000 income bracket is the least frequent group with only 49 families (1.3%) belonging to this category.
| Income Bracket | # Families | % Families |
| Less than $10,000 | 49 | 1.3% |
| $10,000 to $14,999 | 49 | 1.3% |
| $15,000 to $24,999 | 165 | 4.4% |
| $25,000 to $34,999 | 236 | 6.3% |
| $35,000 to $49,999 | 385 | 10.3% |
| $50,000 to $74,999 | 692 | 18.5% |
| $75,000 to $99,999 | 901 | 24.1% |
| $100,000 to $149,999 | 875 | 23.4% |
| $150,000 to $199,999 | 236 | 6.3% |
| $200,000+ | 150 | 4.0% |
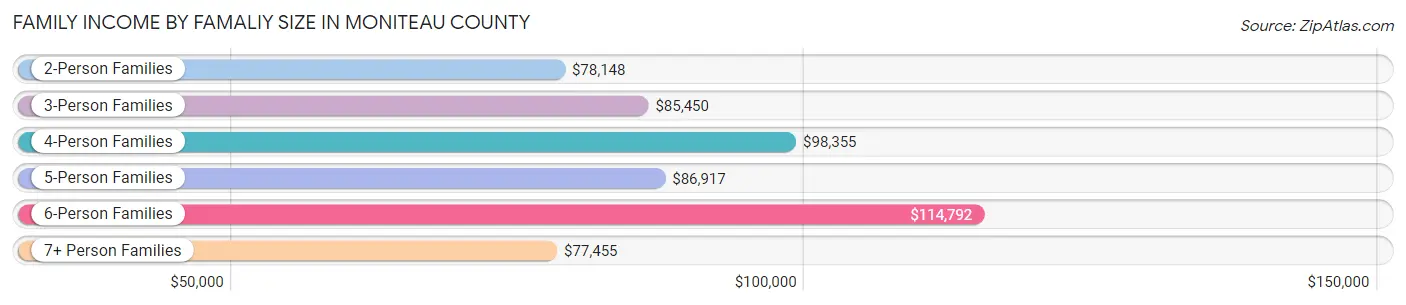
Family Income by Famaliy Size in Moniteau County
6-person families (167 | 4.5%) account for the highest median family income in Moniteau County with $114,792 per family, while 2-person families (1,720 | 46.0%) have the highest median income of $39,074 per family member.
| Income Bracket | # Families | Median Income |
| 2-Person Families | 1,720 (46.0%) | $78,148 |
| 3-Person Families | 887 (23.7%) | $85,450 |
| 4-Person Families | 614 (16.4%) | $98,355 |
| 5-Person Families | 245 (6.6%) | $86,917 |
| 6-Person Families | 167 (4.5%) | $114,792 |
| 7+ Person Families | 107 (2.9%) | $77,455 |
| Total | 3,740 (100.0%) | $83,901 |
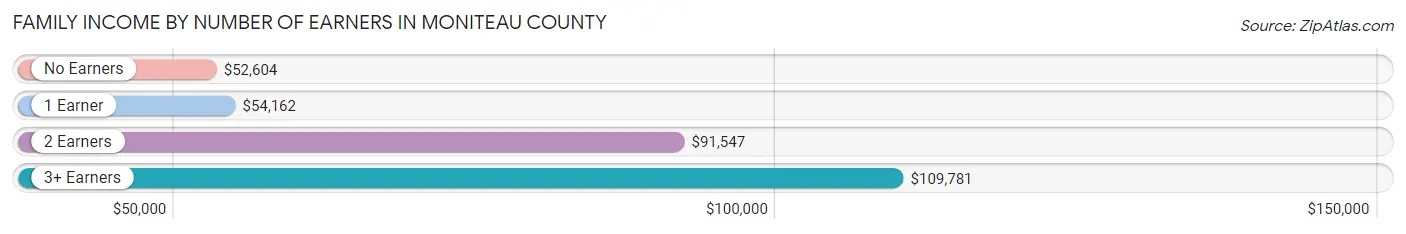
Family Income by Number of Earners in Moniteau County
The median family income in Moniteau County is $83,901, with families comprising 3+ earners (561) having the highest median family income of $109,781, while families with no earners (439) have the lowest median family income of $52,604, accounting for 15.0% and 11.7% of families, respectively.
| Number of Earners | # Families | Median Income |
| No Earners | 439 (11.7%) | $52,604 |
| 1 Earner | 1,229 (32.9%) | $54,162 |
| 2 Earners | 1,511 (40.4%) | $91,547 |
| 3+ Earners | 561 (15.0%) | $109,781 |
| Total | 3,740 (100.0%) | $83,901 |
Household Income in Moniteau County
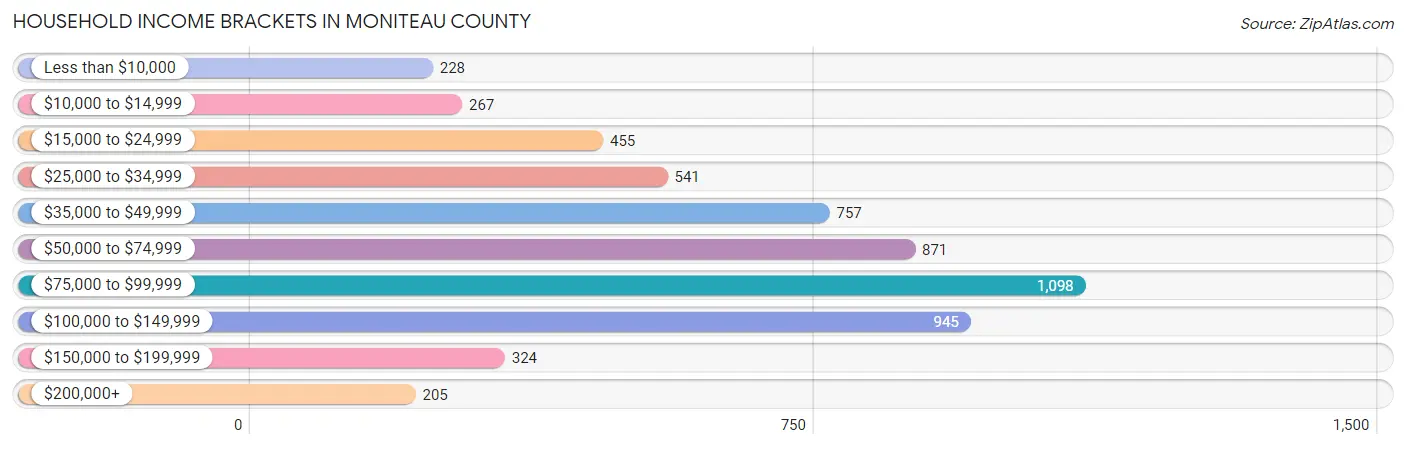
Household Income Brackets in Moniteau County
With 1,098 households falling in the category, the $75,000 to $99,999 income range is the most frequent in Moniteau County, accounting for 19.3% of all households. In contrast, only 205 households (3.6%) fall into the $200,000+ income bracket, making it the least populous group.
| Income Bracket | # Households | % Households |
| Less than $10,000 | 228 | 4.0% |
| $10,000 to $14,999 | 267 | 4.7% |
| $15,000 to $24,999 | 455 | 8.0% |
| $25,000 to $34,999 | 541 | 9.5% |
| $35,000 to $49,999 | 757 | 13.3% |
| $50,000 to $74,999 | 871 | 15.3% |
| $75,000 to $99,999 | 1,098 | 19.3% |
| $100,000 to $149,999 | 945 | 16.6% |
| $150,000 to $199,999 | 324 | 5.7% |
| $200,000+ | 205 | 3.6% |
Household Income by Householder Age in Moniteau County
The median household income in Moniteau County is $66,792, with the highest median household income of $86,469 found in the 25 to 44 years age bracket for the primary householder. A total of 1,819 households (32.0%) fall into this category. Meanwhile, the 65+ years age bracket for the primary householder has the lowest median household income of $40,329, with 1,756 households (30.9%) in this group.
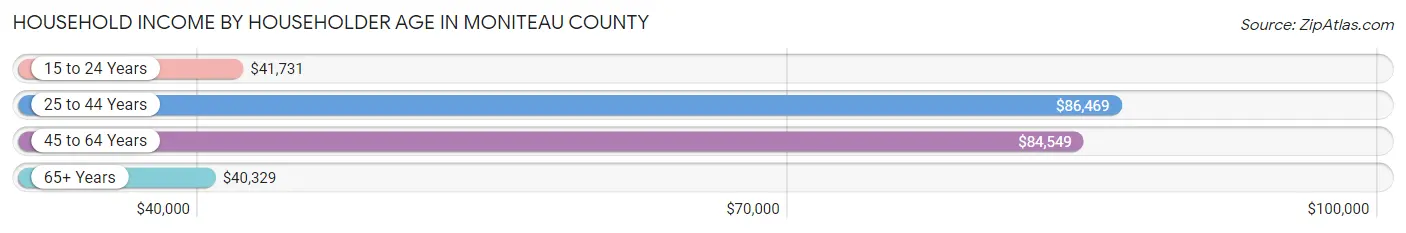
| Income Bracket | # Households | Median Income |
| 15 to 24 Years | 306 (5.4%) | $41,731 |
| 25 to 44 Years | 1,819 (32.0%) | $86,469 |
| 45 to 64 Years | 1,810 (31.8%) | $84,549 |
| 65+ Years | 1,756 (30.9%) | $40,329 |
| Total | 5,691 (100.0%) | $66,792 |
Poverty in Moniteau County
Income Below Poverty by Sex and Age in Moniteau County
With 9.6% poverty level for males and 12.0% for females among the residents of Moniteau County, 12 to 14 year old males and 75 year old and over females are the most vulnerable to poverty, with 94 males (21.4%) and 160 females (28.5%) in their respective age groups living below the poverty level.
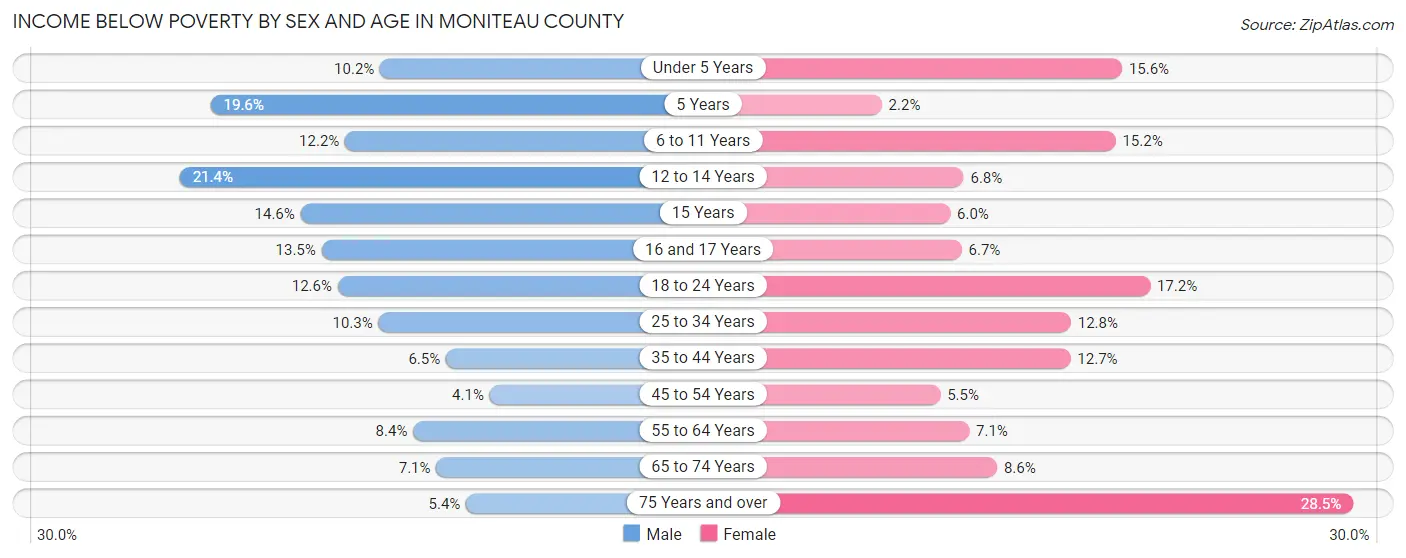
| Age Bracket | Male | Female |
| Under 5 Years | 52 (10.2%) | 71 (15.6%) |
| 5 Years | 11 (19.6%) | 2 (2.2%) |
| 6 to 11 Years | 74 (12.1%) | 105 (15.2%) |
| 12 to 14 Years | 94 (21.4%) | 20 (6.8%) |
| 15 Years | 6 (14.6%) | 7 (6.0%) |
| 16 and 17 Years | 35 (13.5%) | 15 (6.7%) |
| 18 to 24 Years | 78 (12.6%) | 98 (17.2%) |
| 25 to 34 Years | 89 (10.3%) | 107 (12.8%) |
| 35 to 44 Years | 53 (6.5%) | 120 (12.7%) |
| 45 to 54 Years | 34 (4.1%) | 47 (5.5%) |
| 55 to 64 Years | 56 (8.4%) | 67 (7.1%) |
| 65 to 74 Years | 44 (7.1%) | 63 (8.6%) |
| 75 Years and over | 22 (5.4%) | 160 (28.5%) |
| Total | 648 (9.6%) | 882 (12.0%) |
Income Above Poverty by Sex and Age in Moniteau County
According to the poverty statistics in Moniteau County, males aged 45 to 54 years and females aged 5 years are the age groups that are most secure financially, with 95.9% of males and 97.8% of females in these age groups living above the poverty line.
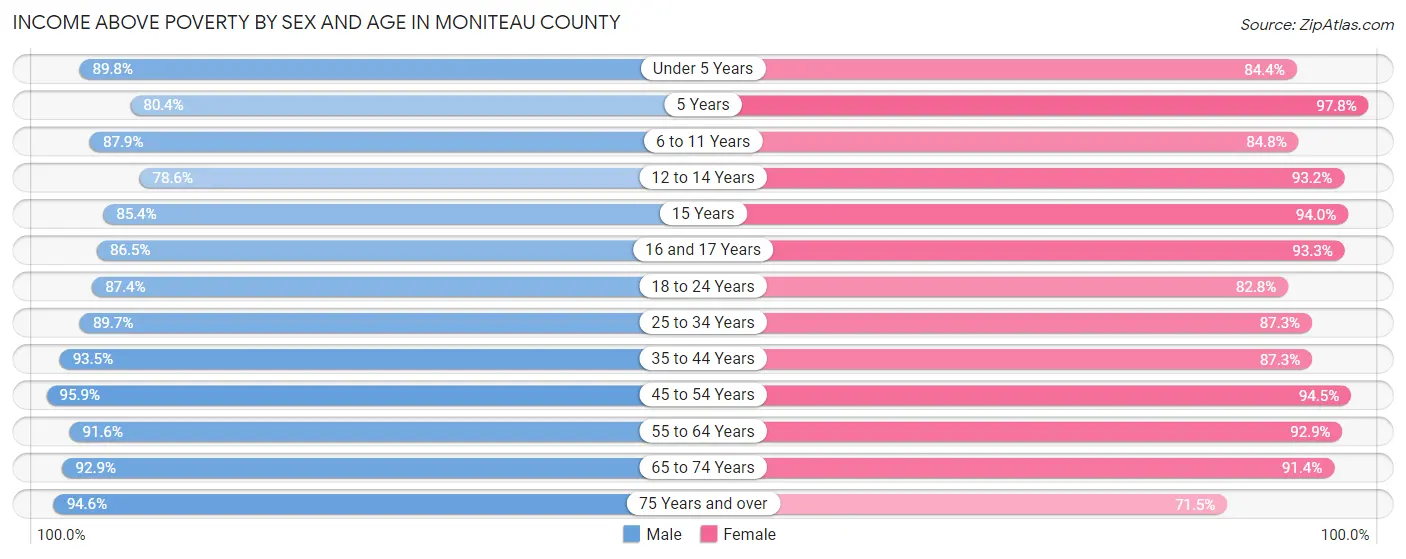
| Age Bracket | Male | Female |
| Under 5 Years | 458 (89.8%) | 384 (84.4%) |
| 5 Years | 45 (80.4%) | 88 (97.8%) |
| 6 to 11 Years | 535 (87.8%) | 584 (84.8%) |
| 12 to 14 Years | 346 (78.6%) | 275 (93.2%) |
| 15 Years | 35 (85.4%) | 109 (94.0%) |
| 16 and 17 Years | 225 (86.5%) | 210 (93.3%) |
| 18 to 24 Years | 543 (87.4%) | 473 (82.8%) |
| 25 to 34 Years | 776 (89.7%) | 732 (87.3%) |
| 35 to 44 Years | 759 (93.5%) | 823 (87.3%) |
| 45 to 54 Years | 796 (95.9%) | 811 (94.5%) |
| 55 to 64 Years | 614 (91.6%) | 878 (92.9%) |
| 65 to 74 Years | 578 (92.9%) | 666 (91.4%) |
| 75 Years and over | 385 (94.6%) | 402 (71.5%) |
| Total | 6,095 (90.4%) | 6,435 (87.9%) |
Income Below Poverty Among Married-Couple Families in Moniteau County
The poverty statistics for married-couple families in Moniteau County show that 4.5% or 139 of the total 3,058 families live below the poverty line. Families with 3 or 4 children have the highest poverty rate of 16.8%, comprising of 48 families. On the other hand, families with no children have the lowest poverty rate of 1.9%, which includes 35 families.
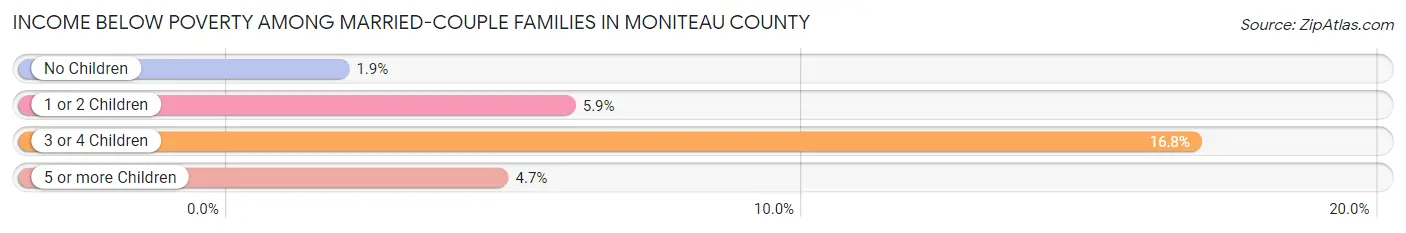
| Children | Above Poverty | Below Poverty |
| No Children | 1,767 (98.1%) | 35 (1.9%) |
| 1 or 2 Children | 833 (94.1%) | 52 (5.9%) |
| 3 or 4 Children | 238 (83.2%) | 48 (16.8%) |
| 5 or more Children | 81 (95.3%) | 4 (4.7%) |
| Total | 2,919 (95.5%) | 139 (4.5%) |
Income Below Poverty Among Single-Parent Households in Moniteau County
According to the poverty data in Moniteau County, 2.7% or 6 single-father households and 20.1% or 93 single-mother households are living below the poverty line. Among single-father households, those with 3 or 4 children have the highest poverty rate, with 6 households (18.8%) experiencing poverty. Likewise, among single-mother households, those with 5 or more children have the highest poverty rate, with 11 households (100.0%) falling below the poverty line.
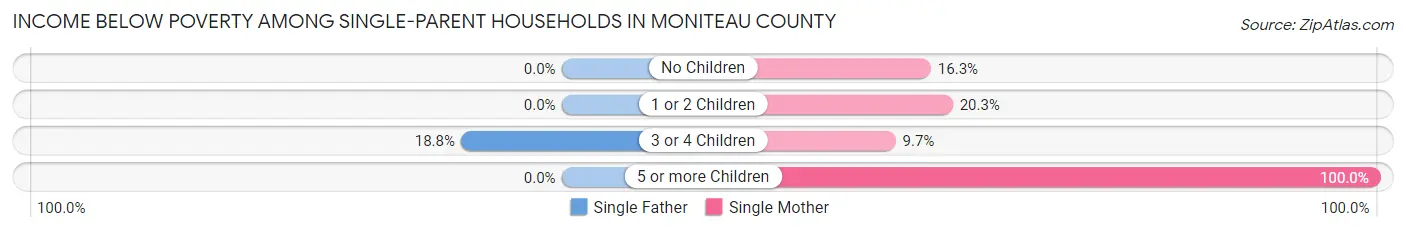
| Children | Single Father | Single Mother |
| No Children | 0 (0.0%) | 26 (16.3%) |
| 1 or 2 Children | 0 (0.0%) | 53 (20.3%) |
| 3 or 4 Children | 6 (18.8%) | 3 (9.7%) |
| 5 or more Children | 0 (0.0%) | 11 (100.0%) |
| Total | 6 (2.7%) | 93 (20.1%) |
Income Below Poverty Among Married-Couple vs Single-Parent Households in Moniteau County
The poverty data for Moniteau County shows that 139 of the married-couple family households (4.5%) and 99 of the single-parent households (14.5%) are living below the poverty level. Within the married-couple family households, those with 3 or 4 children have the highest poverty rate, with 48 households (16.8%) falling below the poverty line. Among the single-parent households, those with 5 or more children have the highest poverty rate, with 11 household (100.0%) living below poverty.
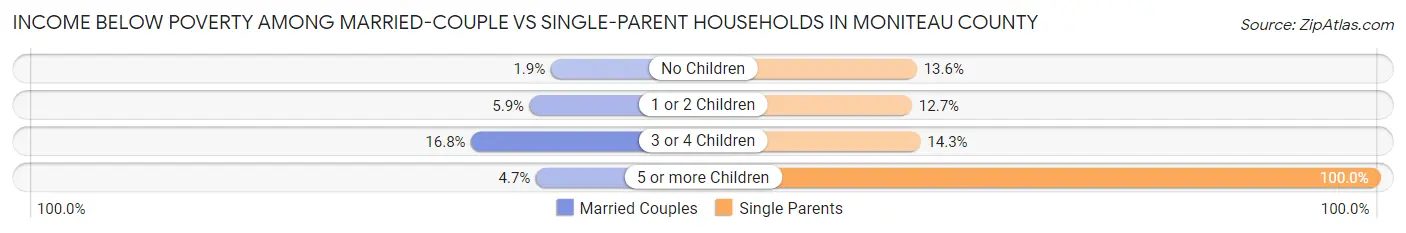
| Children | Married-Couple Families | Single-Parent Households |
| No Children | 35 (1.9%) | 26 (13.6%) |
| 1 or 2 Children | 52 (5.9%) | 53 (12.7%) |
| 3 or 4 Children | 48 (16.8%) | 9 (14.3%) |
| 5 or more Children | 4 (4.7%) | 11 (100.0%) |
| Total | 139 (4.5%) | 99 (14.5%) |
Race in Moniteau County
The most populous races in Moniteau County are White / Caucasian (14,288 | 92.8%), Hispanic or Latino (843 | 5.5%), and Black / African American (409 | 2.7%).
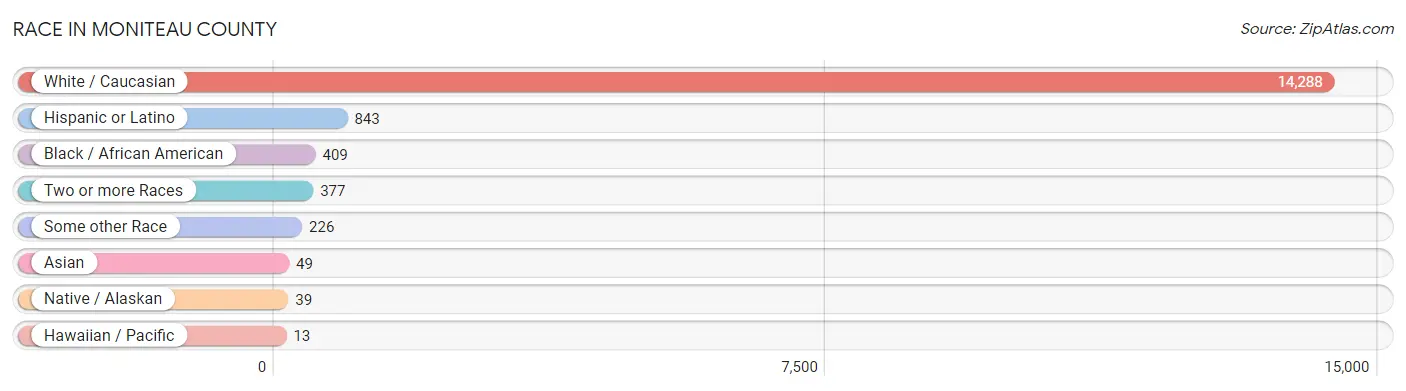
| Race | # Population | % Population |
| Asian | 49 | 0.3% |
| Black / African American | 409 | 2.7% |
| Hawaiian / Pacific | 13 | 0.1% |
| Hispanic or Latino | 843 | 5.5% |
| Native / Alaskan | 39 | 0.3% |
| White / Caucasian | 14,288 | 92.8% |
| Two or more Races | 377 | 2.5% |
| Some other Race | 226 | 1.5% |
| Total | 15,401 | 100.0% |
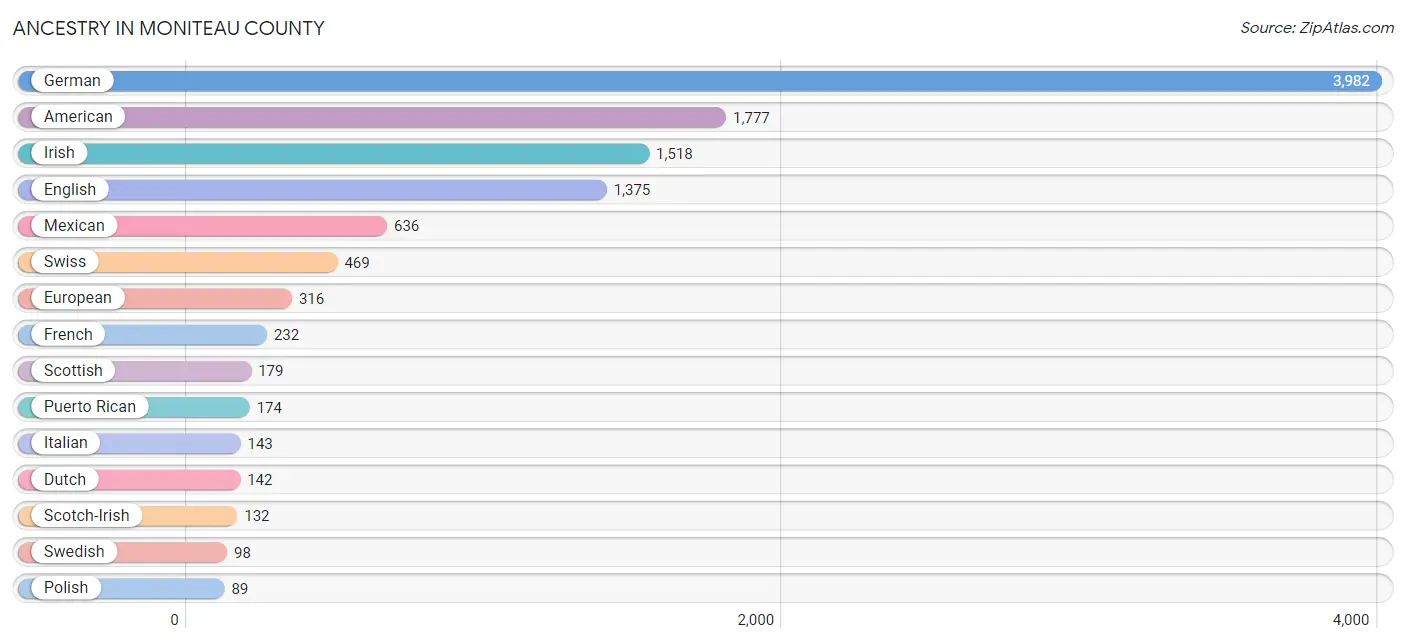
Ancestry in Moniteau County
The most populous ancestries reported in Moniteau County are German (3,982 | 25.9%), American (1,777 | 11.5%), Irish (1,518 | 9.9%), English (1,375 | 8.9%), and Mexican (636 | 4.1%), together accounting for 60.3% of all Moniteau County residents.
| Ancestry | # Population | % Population |
| African | 15 | 0.1% |
| American | 1,777 | 11.5% |
| Apache | 21 | 0.1% |
| Austrian | 6 | 0.0% |
| Belgian | 19 | 0.1% |
| Blackfeet | 3 | 0.0% |
| British | 51 | 0.3% |
| Burmese | 17 | 0.1% |
| Canadian | 3 | 0.0% |
| Celtic | 8 | 0.1% |
| Cherokee | 69 | 0.4% |
| Colombian | 4 | 0.0% |
| Cuban | 1 | 0.0% |
| Czech | 16 | 0.1% |
| Danish | 17 | 0.1% |
| Dutch | 142 | 0.9% |
| Eastern European | 15 | 0.1% |
| English | 1,375 | 8.9% |
| European | 316 | 2.1% |
| Finnish | 1 | 0.0% |
| French | 232 | 1.5% |
| French Canadian | 10 | 0.1% |
| German | 3,982 | 25.9% |
| Greek | 4 | 0.0% |
| Hungarian | 10 | 0.1% |
| Indian (Asian) | 12 | 0.1% |
| Irish | 1,518 | 9.9% |
| Italian | 143 | 0.9% |
| Jamaican | 1 | 0.0% |
| Korean | 47 | 0.3% |
| Mexican | 636 | 4.1% |
| Native Hawaiian | 13 | 0.1% |
| Northern European | 21 | 0.1% |
| Norwegian | 70 | 0.4% |
| Osage | 12 | 0.1% |
| Polish | 89 | 0.6% |
| Portuguese | 4 | 0.0% |
| Potawatomi | 17 | 0.1% |
| Puerto Rican | 174 | 1.1% |
| Russian | 24 | 0.2% |
| Scandinavian | 11 | 0.1% |
| Scotch-Irish | 132 | 0.9% |
| Scottish | 179 | 1.2% |
| Sioux | 1 | 0.0% |
| Slavic | 8 | 0.1% |
| South American | 4 | 0.0% |
| Spanish | 28 | 0.2% |
| Sri Lankan | 20 | 0.1% |
| Subsaharan African | 15 | 0.1% |
| Swedish | 98 | 0.6% |
| Swiss | 469 | 3.0% |
| Ukrainian | 3 | 0.0% |
| Welsh | 48 | 0.3% | View All 53 Rows |
Immigrants in Moniteau County
The most numerous immigrant groups reported in Moniteau County came from Central America (162 | 1.1%), Latin America (162 | 1.1%), Mexico (162 | 1.1%), Europe (64 | 0.4%), and Germany (64 | 0.4%), together accounting for 4.0% of all Moniteau County residents.
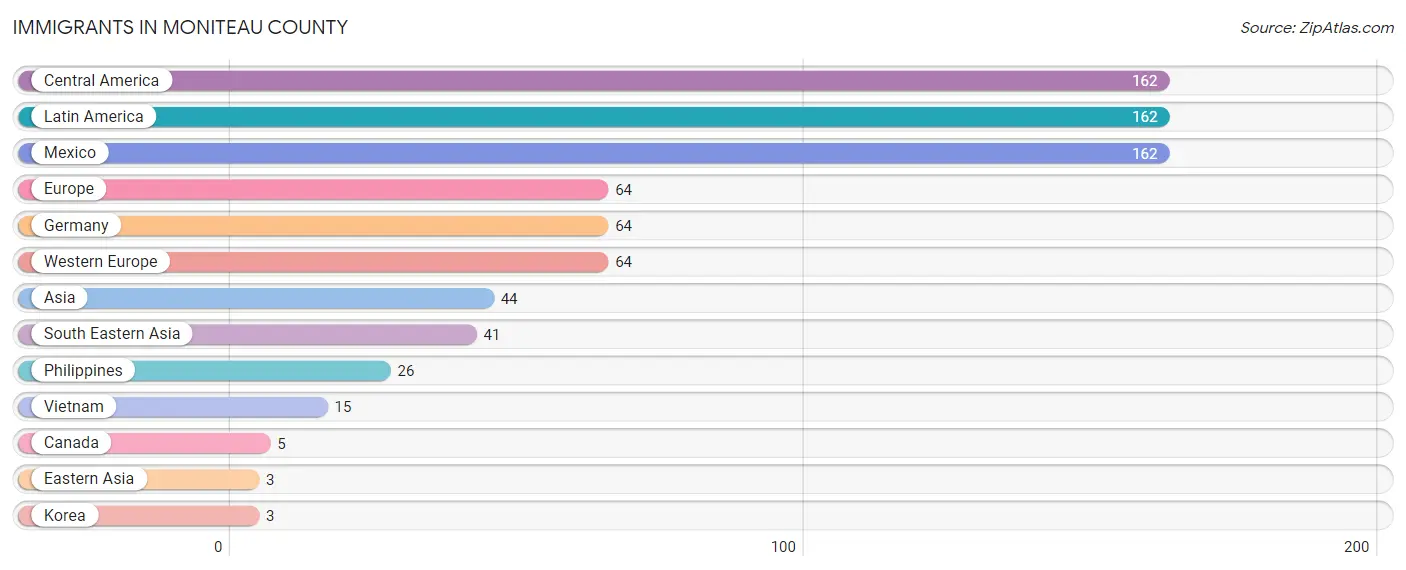
| Immigration Origin | # Population | % Population |
| Asia | 44 | 0.3% |
| Canada | 5 | 0.0% |
| Central America | 162 | 1.1% |
| Eastern Asia | 3 | 0.0% |
| Europe | 64 | 0.4% |
| Germany | 64 | 0.4% |
| Korea | 3 | 0.0% |
| Latin America | 162 | 1.1% |
| Mexico | 162 | 1.1% |
| Philippines | 26 | 0.2% |
| South Eastern Asia | 41 | 0.3% |
| Vietnam | 15 | 0.1% |
| Western Europe | 64 | 0.4% | View All 13 Rows |
Sex and Age in Moniteau County
Sex and Age in Moniteau County
The most populous age groups in Moniteau County are 35 to 39 Years (687 | 8.6%) for men and 10 to 14 Years (549 | 7.4%) for women.
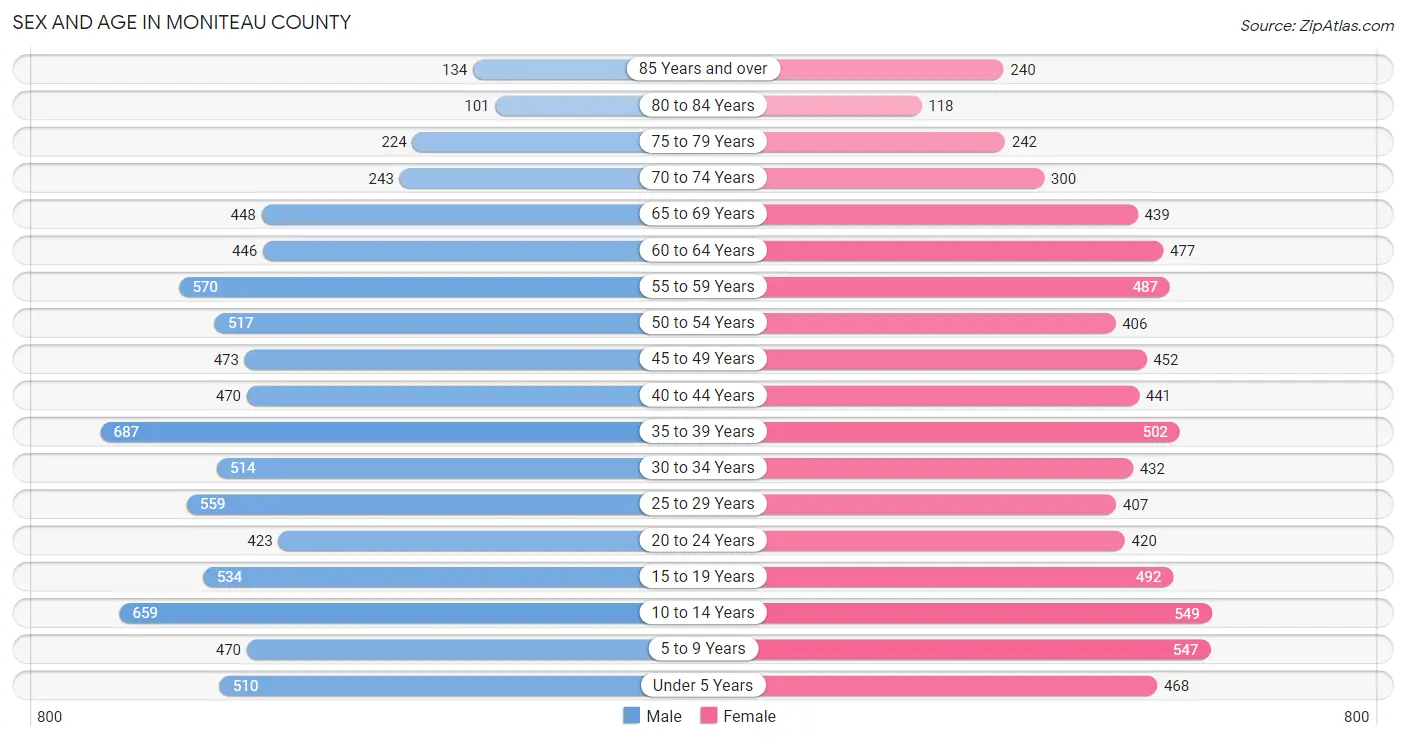
| Age Bracket | Male | Female |
| Under 5 Years | 510 (6.4%) | 468 (6.3%) |
| 5 to 9 Years | 470 (5.9%) | 547 (7.4%) |
| 10 to 14 Years | 659 (8.3%) | 549 (7.4%) |
| 15 to 19 Years | 534 (6.7%) | 492 (6.6%) |
| 20 to 24 Years | 423 (5.3%) | 420 (5.7%) |
| 25 to 29 Years | 559 (7.0%) | 407 (5.5%) |
| 30 to 34 Years | 514 (6.4%) | 432 (5.8%) |
| 35 to 39 Years | 687 (8.6%) | 502 (6.8%) |
| 40 to 44 Years | 470 (5.9%) | 441 (5.9%) |
| 45 to 49 Years | 473 (5.9%) | 452 (6.1%) |
| 50 to 54 Years | 517 (6.5%) | 406 (5.5%) |
| 55 to 59 Years | 570 (7.1%) | 487 (6.6%) |
| 60 to 64 Years | 446 (5.6%) | 477 (6.4%) |
| 65 to 69 Years | 448 (5.6%) | 439 (5.9%) |
| 70 to 74 Years | 243 (3.0%) | 300 (4.0%) |
| 75 to 79 Years | 224 (2.8%) | 242 (3.3%) |
| 80 to 84 Years | 101 (1.3%) | 118 (1.6%) |
| 85 Years and over | 134 (1.7%) | 240 (3.2%) |
| Total | 7,982 (100.0%) | 7,419 (100.0%) |
Families and Households in Moniteau County
Median Family Size in Moniteau County
The median family size in Moniteau County is 3.10 persons per family, with single male/father families (219 | 5.9%) accounting for the largest median family size of 3.3 persons per family. On the other hand, single female/mother families (463 | 12.4%) represent the smallest median family size with 2.60 persons per family.
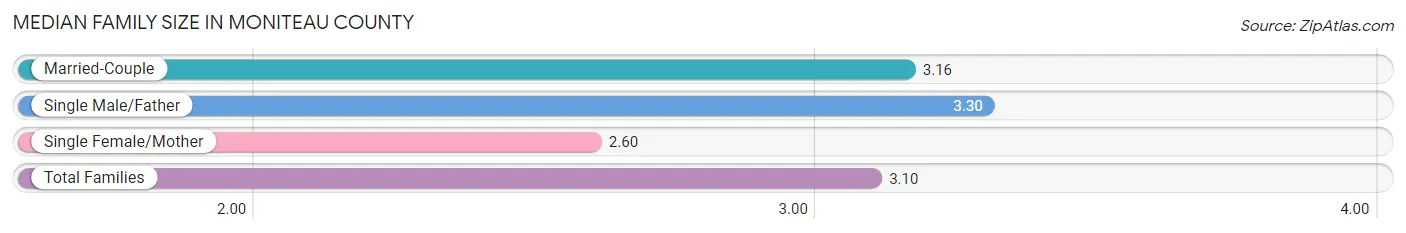
| Family Type | # Families | Family Size |
| Married-Couple | 3,058 (81.8%) | 3.16 |
| Single Male/Father | 219 (5.9%) | 3.30 |
| Single Female/Mother | 463 (12.4%) | 2.60 |
| Total Families | 3,740 (100.0%) | 3.10 |
Median Household Size in Moniteau County
The median household size in Moniteau County is 2.48 persons per household, with single male/father households (219 | 3.8%) accounting for the largest median household size of 3.59 persons per household. non-family households (1,951 | 34.3%) represent the smallest median household size with 1.17 persons per household.
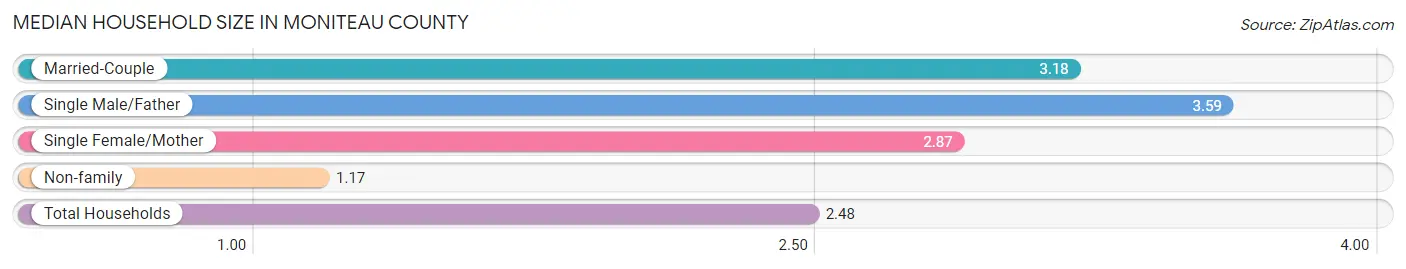
| Household Type | # Households | Household Size |
| Married-Couple | 3,058 (53.7%) | 3.18 |
| Single Male/Father | 219 (3.8%) | 3.59 |
| Single Female/Mother | 463 (8.1%) | 2.87 |
| Non-family | 1,951 (34.3%) | 1.17 |
| Total Households | 5,691 (100.0%) | 2.48 |
Household Size by Marriage Status in Moniteau County
Out of a total of 5,691 households in Moniteau County, 3,740 (65.7%) are family households, while 1,951 (34.3%) are nonfamily households. The most numerous type of family households are 2-person households, comprising 1,649, and the most common type of nonfamily households are 1-person households, comprising 1,652.
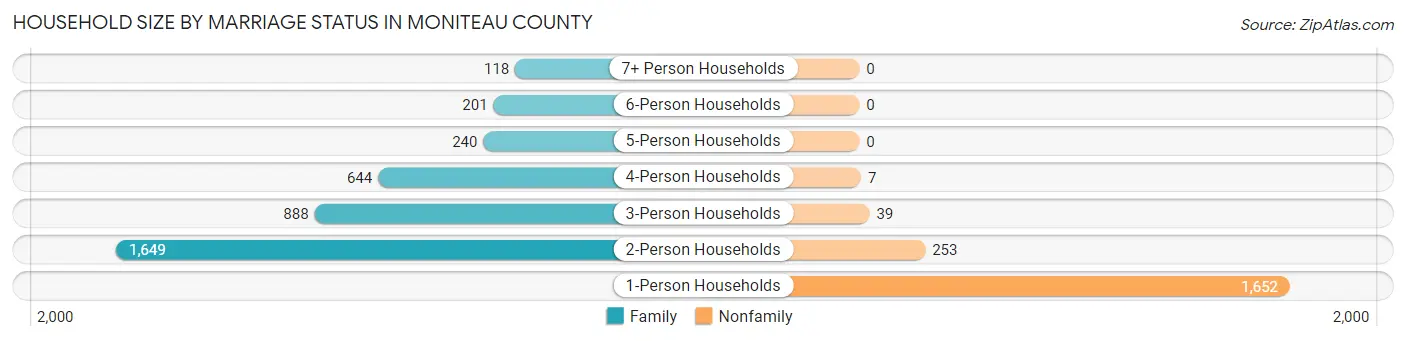
| Household Size | Family Households | Nonfamily Households |
| 1-Person Households | - | 1,652 (29.0%) |
| 2-Person Households | 1,649 (29.0%) | 253 (4.4%) |
| 3-Person Households | 888 (15.6%) | 39 (0.7%) |
| 4-Person Households | 644 (11.3%) | 7 (0.1%) |
| 5-Person Households | 240 (4.2%) | 0 (0.0%) |
| 6-Person Households | 201 (3.5%) | 0 (0.0%) |
| 7+ Person Households | 118 (2.1%) | 0 (0.0%) |
| Total | 3,740 (65.7%) | 1,951 (34.3%) |
Female Fertility in Moniteau County
Fertility by Age in Moniteau County
Average fertility rate in Moniteau County is 52.0 births per 1,000 women. Women in the age bracket of 20 to 34 years have the highest fertility rate with 110.0 births per 1,000 women. Women in the age bracket of 20 to 34 years acount for 83.1% of all women with births.
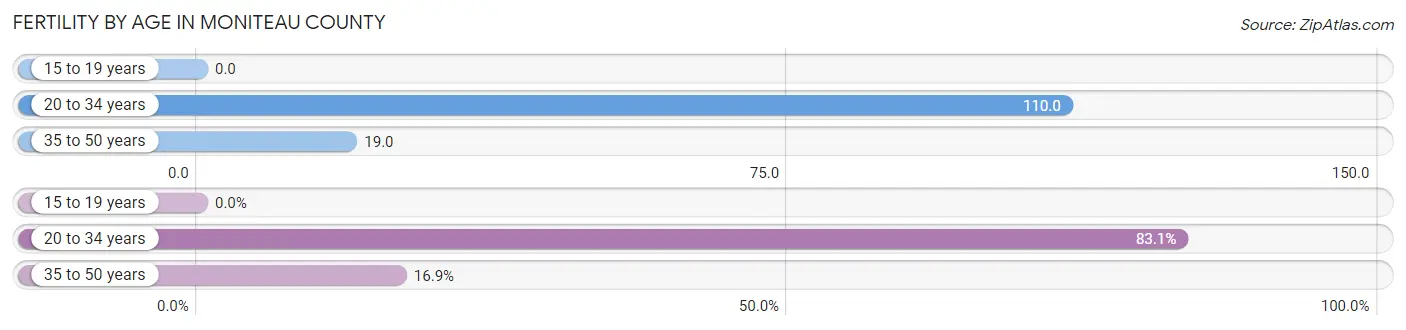
| Age Bracket | Women with Births | Births / 1,000 Women |
| 15 to 19 years | 0 (0.0%) | 0.0 |
| 20 to 34 years | 138 (83.1%) | 110.0 |
| 35 to 50 years | 28 (16.9%) | 19.0 |
| Total | 166 (100.0%) | 52.0 |
Fertility by Age by Marriage Status in Moniteau County
77.7% of women with births (166) in Moniteau County are married. The highest percentage of unmarried women with births falls into 20 to 34 years age bracket with 26.8% of them unmarried at the time of birth, while the lowest percentage of unmarried women with births belong to 35 to 50 years age bracket with 0.0% of them unmarried.
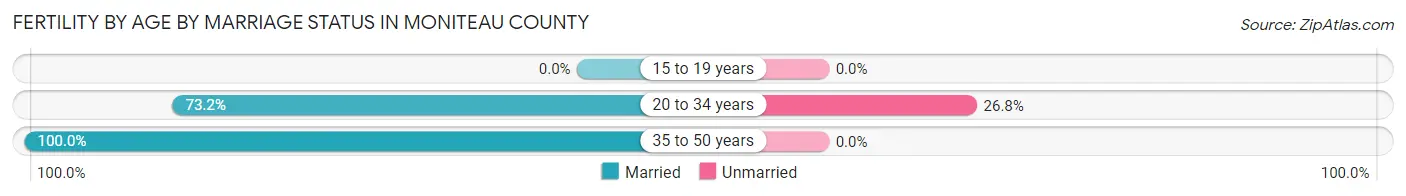
| Age Bracket | Married | Unmarried |
| 15 to 19 years | 0 (0.0%) | 0 (0.0%) |
| 20 to 34 years | 101 (73.2%) | 37 (26.8%) |
| 35 to 50 years | 28 (100.0%) | 0 (0.0%) |
| Total | 129 (77.7%) | 37 (22.3%) |
Fertility by Education in Moniteau County
Average fertility rate in Moniteau County is 52.0 births per 1,000 women. Women with the education attainment of less than high school have the highest fertility rate of 77.0 births per 1,000 women, while women with the education attainment of high school diploma have the lowest fertility at 26.0 births per 1,000 women. Women with the education attainment of less than high school represent 33.1% of all women with births.
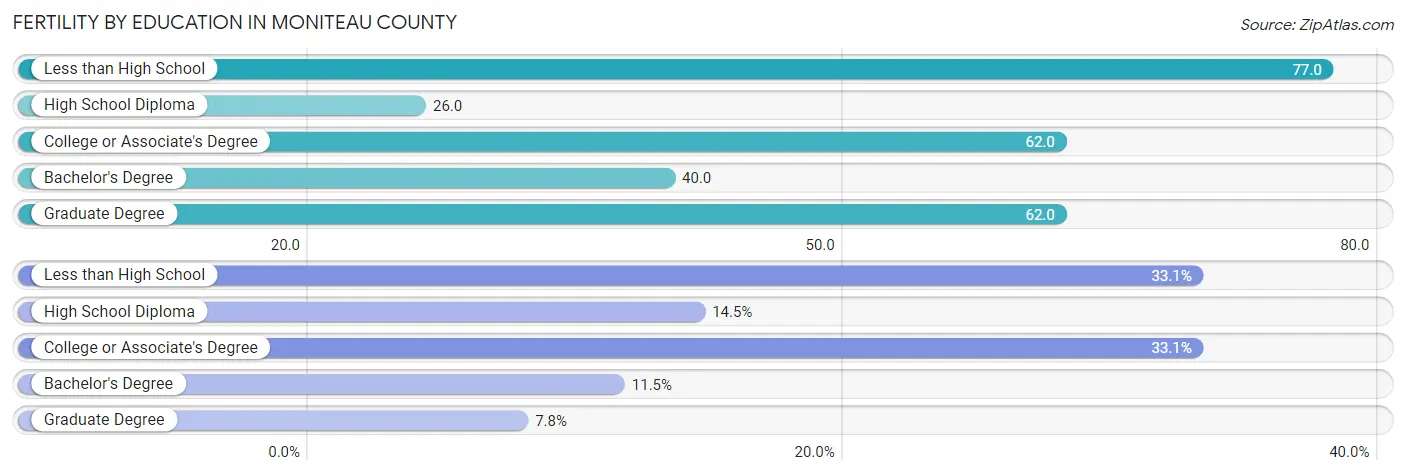
| Educational Attainment | Women with Births | Births / 1,000 Women |
| Less than High School | 55 (33.1%) | 77.0 |
| High School Diploma | 24 (14.5%) | 26.0 |
| College or Associate's Degree | 55 (33.1%) | 62.0 |
| Bachelor's Degree | 19 (11.5%) | 40.0 |
| Graduate Degree | 13 (7.8%) | 62.0 |
| Total | 166 (100.0%) | 52.0 |
Fertility by Education by Marriage Status in Moniteau County
22.3% of women with births in Moniteau County are unmarried. Women with the educational attainment of bachelor's degree are most likely to be married with 100.0% of them married at childbirth, while women with the educational attainment of high school diploma are least likely to be married with 45.8% of them unmarried at childbirth.
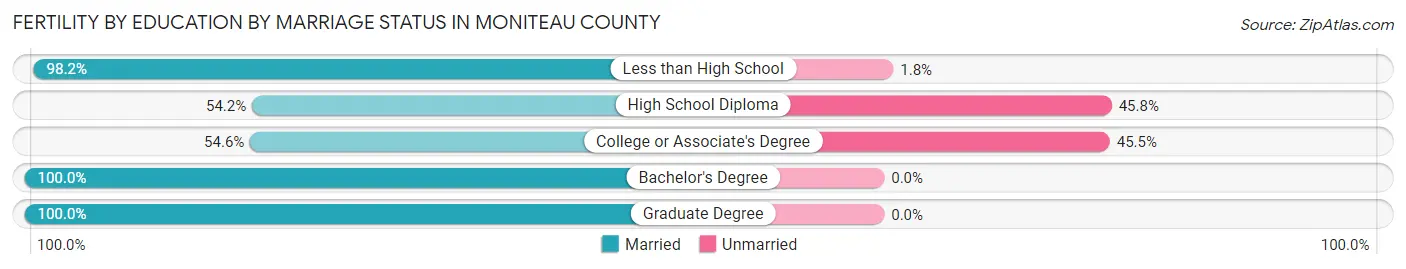
| Educational Attainment | Married | Unmarried |
| Less than High School | 54 (98.2%) | 1 (1.8%) |
| High School Diploma | 13 (54.2%) | 11 (45.8%) |
| College or Associate's Degree | 30 (54.5%) | 25 (45.5%) |
| Bachelor's Degree | 19 (100.0%) | 0 (0.0%) |
| Graduate Degree | 13 (100.0%) | 0 (0.0%) |
| Total | 129 (77.7%) | 37 (22.3%) |
Employment Characteristics in Moniteau County
Employment by Class of Employer in Moniteau County
Among the 6,708 employed individuals in Moniteau County, private company employees (4,118 | 61.4%), state government employees (730 | 10.9%), and self-employed (not incorporated) (615 | 9.2%) make up the most common classes of employment.
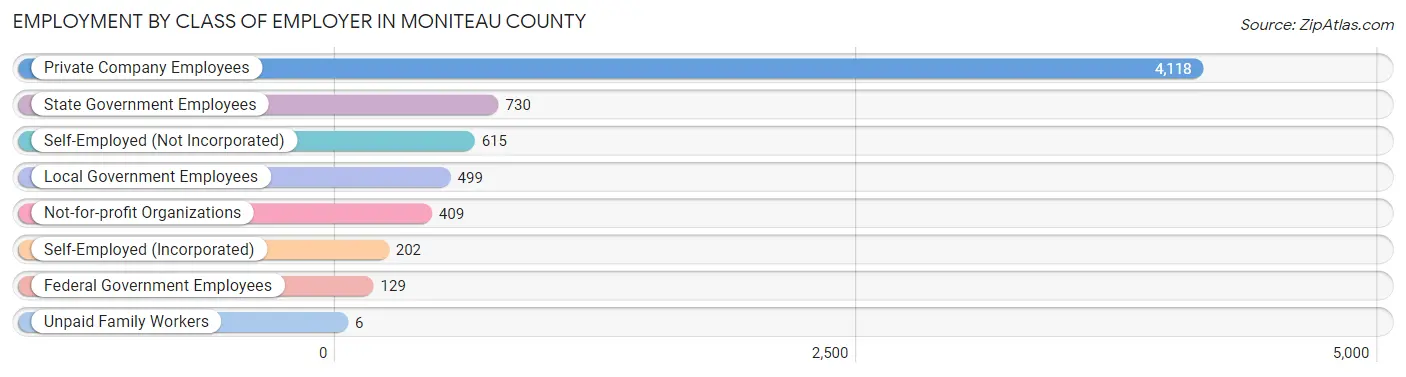
| Employer Class | # Employees | % Employees |
| Private Company Employees | 4,118 | 61.4% |
| Self-Employed (Incorporated) | 202 | 3.0% |
| Self-Employed (Not Incorporated) | 615 | 9.2% |
| Not-for-profit Organizations | 409 | 6.1% |
| Local Government Employees | 499 | 7.4% |
| State Government Employees | 730 | 10.9% |
| Federal Government Employees | 129 | 1.9% |
| Unpaid Family Workers | 6 | 0.1% |
| Total | 6,708 | 100.0% |
Employment Status by Age in Moniteau County
According to the labor force statistics for Moniteau County, out of the total population over 16 years of age (12,041), 57.6% or 6,936 individuals are in the labor force, with 3.0% or 208 of them unemployed. The age group with the highest labor force participation rate is 45 to 54 years, with 77.7% or 1,436 individuals in the labor force. Within the labor force, the 16 to 19 years age range has the highest percentage of unemployed individuals, with 11.2% or 58 of them being unemployed.
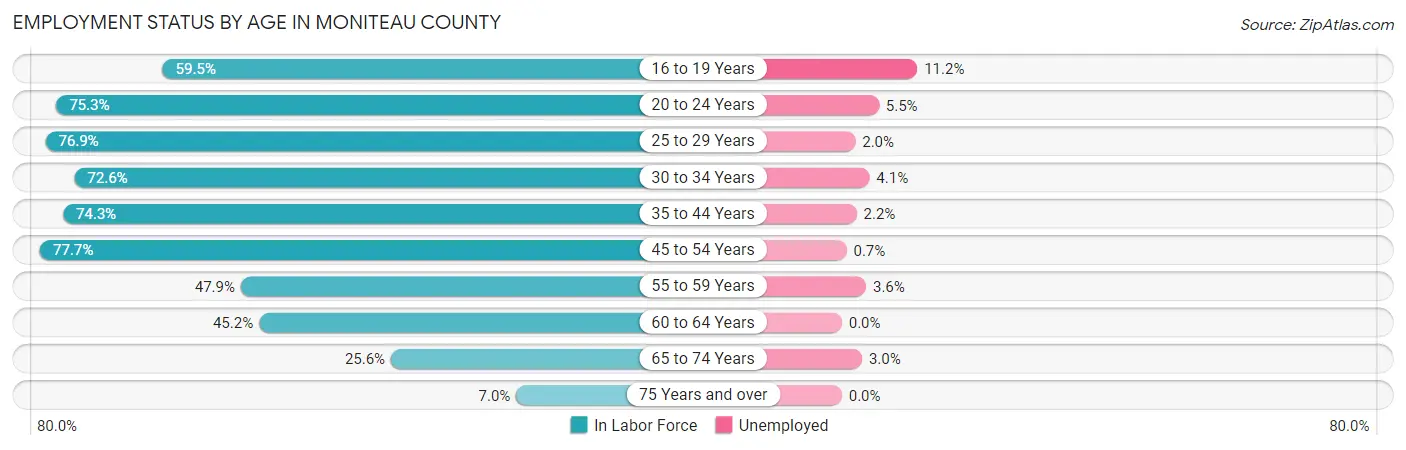
| Age Bracket | In Labor Force | Unemployed |
| 16 to 19 Years | 517 (59.5%) | 58 (11.2%) |
| 20 to 24 Years | 635 (75.3%) | 35 (5.5%) |
| 25 to 29 Years | 743 (76.9%) | 15 (2.0%) |
| 30 to 34 Years | 687 (72.6%) | 28 (4.1%) |
| 35 to 44 Years | 1,560 (74.3%) | 34 (2.2%) |
| 45 to 54 Years | 1,436 (77.7%) | 10 (0.7%) |
| 55 to 59 Years | 506 (47.9%) | 18 (3.6%) |
| 60 to 64 Years | 417 (45.2%) | 0 (0.0%) |
| 65 to 74 Years | 366 (25.6%) | 11 (3.0%) |
| 75 Years and over | 74 (7.0%) | 0 (0.0%) |
| Total | 6,936 (57.6%) | 208 (3.0%) |
Employment Status by Educational Attainment in Moniteau County
According to labor force statistics for Moniteau County, 68.2% of individuals (5,347) out of the total population between 25 and 64 years of age (7,840) are in the labor force, with 2.0% or 107 of them being unemployed. The group with the highest labor force participation rate are those with the educational attainment of bachelor's degree or higher, with 87.6% or 1,318 individuals in the labor force. Within the labor force, individuals with high school diploma education have the highest percentage of unemployment, with 3.7% or 74 of them being unemployed.
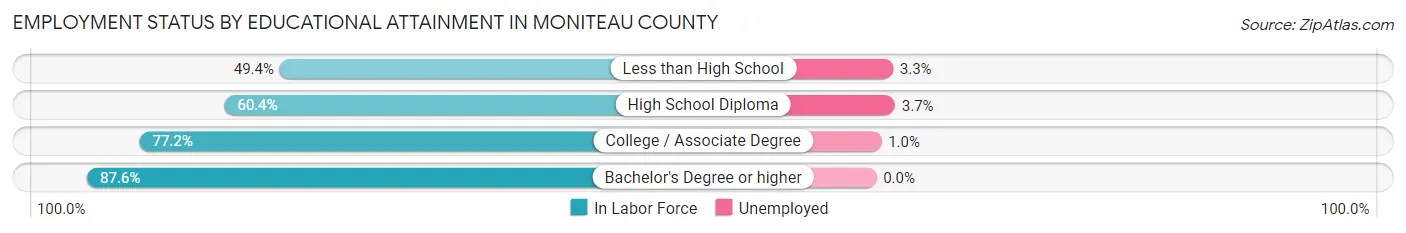
| Educational Attainment | In Labor Force | Unemployed |
| Less than High School | 547 (49.4%) | 37 (3.3%) |
| High School Diploma | 1,994 (60.4%) | 122 (3.7%) |
| College / Associate Degree | 1,488 (77.2%) | 19 (1.0%) |
| Bachelor's Degree or higher | 1,318 (87.6%) | 0 (0.0%) |
| Total | 5,347 (68.2%) | 157 (2.0%) |
Employment Occupations by Sex in Moniteau County
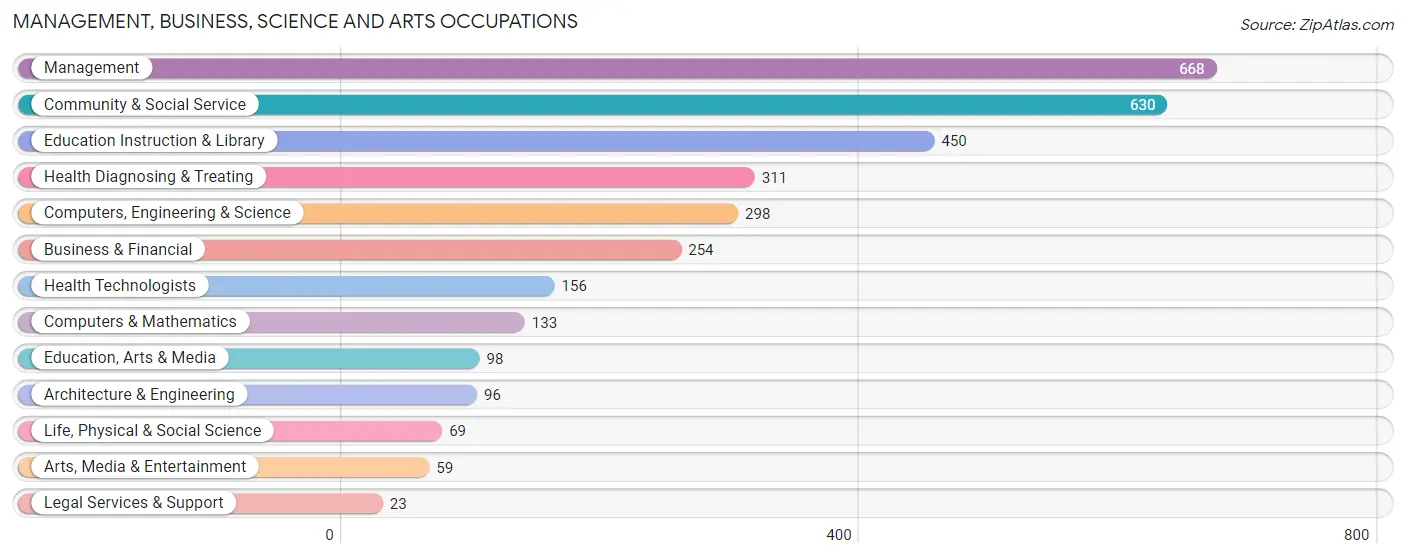
Management, Business, Science and Arts Occupations
The most common Management, Business, Science and Arts occupations in Moniteau County are Management (668 | 9.9%), Community & Social Service (630 | 9.4%), Education Instruction & Library (450 | 6.7%), Health Diagnosing & Treating (311 | 4.6%), and Computers, Engineering & Science (298 | 4.4%).
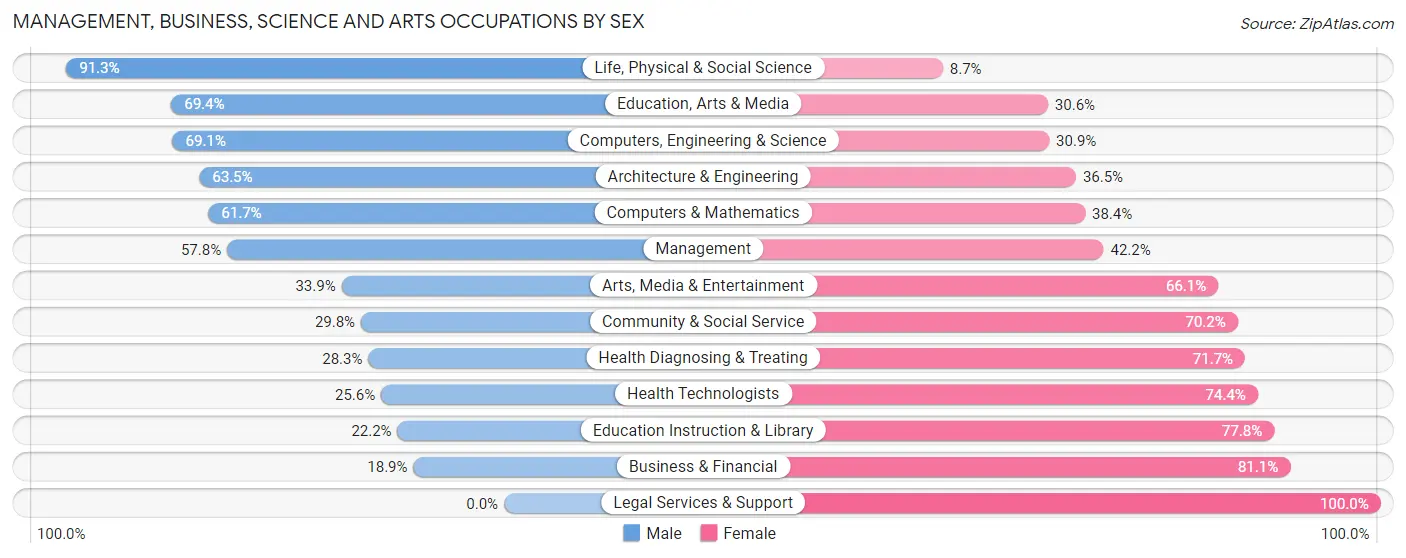
Management, Business, Science and Arts Occupations by Sex
Within the Management, Business, Science and Arts occupations in Moniteau County, the most male-oriented occupations are Life, Physical & Social Science (91.3%), Education, Arts & Media (69.4%), and Computers, Engineering & Science (69.1%), while the most female-oriented occupations are Legal Services & Support (100.0%), Business & Financial (81.1%), and Education Instruction & Library (77.8%).
| Occupation | Male | Female |
| Management | 386 (57.8%) | 282 (42.2%) |
| Business & Financial | 48 (18.9%) | 206 (81.1%) |
| Computers, Engineering & Science | 206 (69.1%) | 92 (30.9%) |
| Computers & Mathematics | 82 (61.7%) | 51 (38.4%) |
| Architecture & Engineering | 61 (63.5%) | 35 (36.5%) |
| Life, Physical & Social Science | 63 (91.3%) | 6 (8.7%) |
| Community & Social Service | 188 (29.8%) | 442 (70.2%) |
| Education, Arts & Media | 68 (69.4%) | 30 (30.6%) |
| Legal Services & Support | 0 (0.0%) | 23 (100.0%) |
| Education Instruction & Library | 100 (22.2%) | 350 (77.8%) |
| Arts, Media & Entertainment | 20 (33.9%) | 39 (66.1%) |
| Health Diagnosing & Treating | 88 (28.3%) | 223 (71.7%) |
| Health Technologists | 40 (25.6%) | 116 (74.4%) |
| Total (Category) | 916 (42.4%) | 1,245 (57.6%) |
| Total (Overall) | 3,317 (49.4%) | 3,402 (50.6%) |
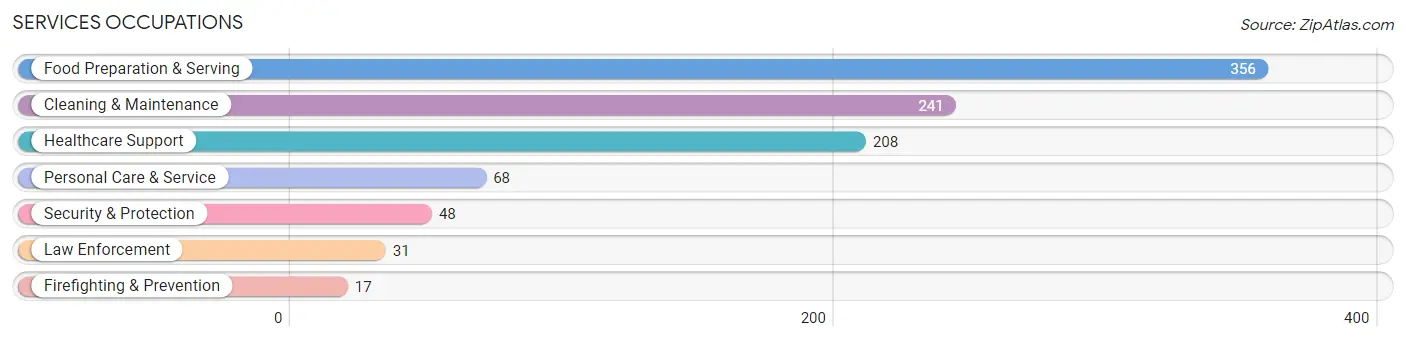
Services Occupations
The most common Services occupations in Moniteau County are Food Preparation & Serving (356 | 5.3%), Cleaning & Maintenance (241 | 3.6%), Healthcare Support (208 | 3.1%), Personal Care & Service (68 | 1.0%), and Security & Protection (48 | 0.7%).
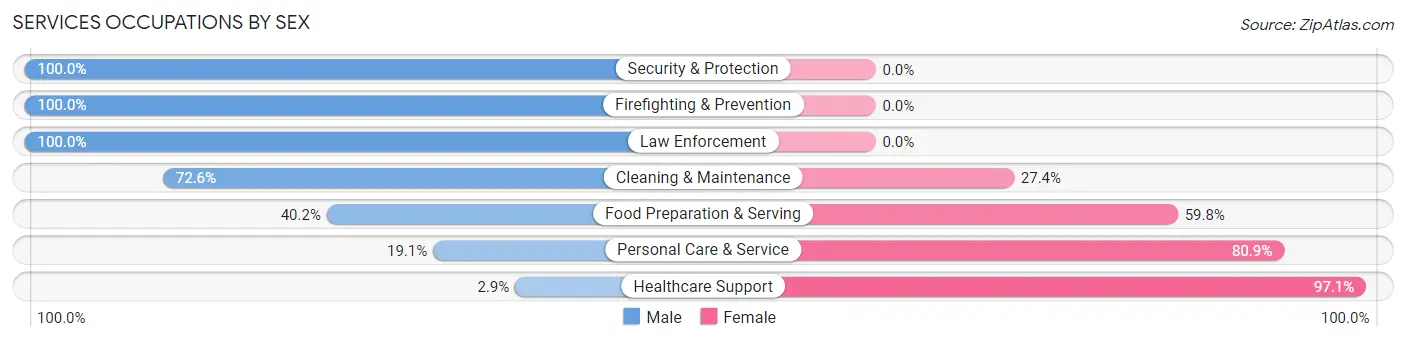
Services Occupations by Sex
Within the Services occupations in Moniteau County, the most male-oriented occupations are Security & Protection (100.0%), Firefighting & Prevention (100.0%), and Law Enforcement (100.0%), while the most female-oriented occupations are Healthcare Support (97.1%), Personal Care & Service (80.9%), and Food Preparation & Serving (59.8%).
| Occupation | Male | Female |
| Healthcare Support | 6 (2.9%) | 202 (97.1%) |
| Security & Protection | 48 (100.0%) | 0 (0.0%) |
| Firefighting & Prevention | 17 (100.0%) | 0 (0.0%) |
| Law Enforcement | 31 (100.0%) | 0 (0.0%) |
| Food Preparation & Serving | 143 (40.2%) | 213 (59.8%) |
| Cleaning & Maintenance | 175 (72.6%) | 66 (27.4%) |
| Personal Care & Service | 13 (19.1%) | 55 (80.9%) |
| Total (Category) | 385 (41.8%) | 536 (58.2%) |
| Total (Overall) | 3,317 (49.4%) | 3,402 (50.6%) |
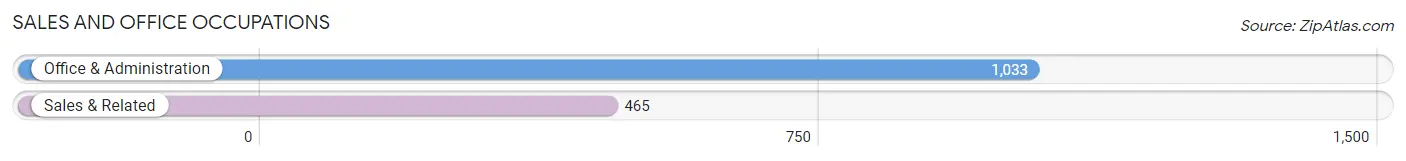
Sales and Office Occupations
The most common Sales and Office occupations in Moniteau County are Office & Administration (1,033 | 15.4%), and Sales & Related (465 | 6.9%).
Sales and Office Occupations by Sex
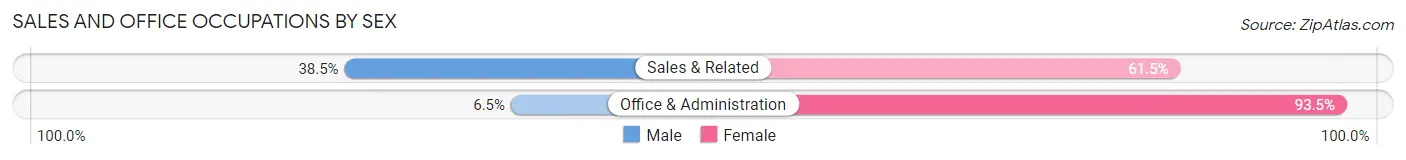
| Occupation | Male | Female |
| Sales & Related | 179 (38.5%) | 286 (61.5%) |
| Office & Administration | 67 (6.5%) | 966 (93.5%) |
| Total (Category) | 246 (16.4%) | 1,252 (83.6%) |
| Total (Overall) | 3,317 (49.4%) | 3,402 (50.6%) |
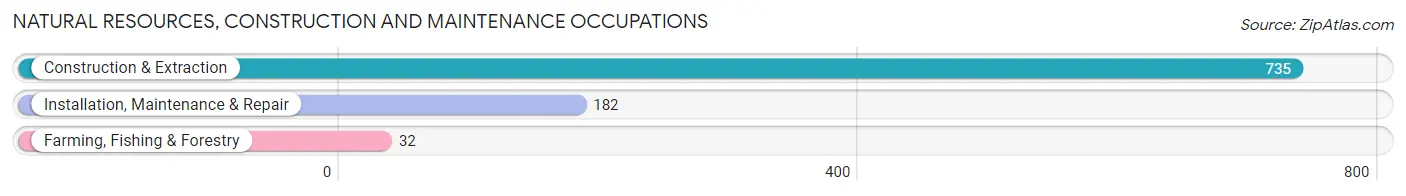
Natural Resources, Construction and Maintenance Occupations
The most common Natural Resources, Construction and Maintenance occupations in Moniteau County are Construction & Extraction (735 | 10.9%), Installation, Maintenance & Repair (182 | 2.7%), and Farming, Fishing & Forestry (32 | 0.5%).
Natural Resources, Construction and Maintenance Occupations by Sex

| Occupation | Male | Female |
| Farming, Fishing & Forestry | 29 (90.6%) | 3 (9.4%) |
| Construction & Extraction | 721 (98.1%) | 14 (1.9%) |
| Installation, Maintenance & Repair | 155 (85.2%) | 27 (14.8%) |
| Total (Category) | 905 (95.4%) | 44 (4.6%) |
| Total (Overall) | 3,317 (49.4%) | 3,402 (50.6%) |
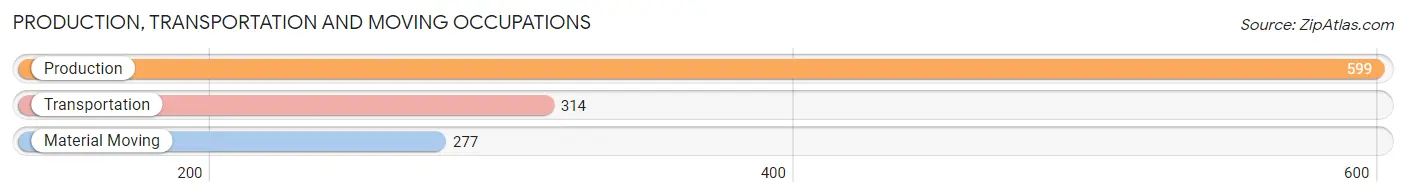
Production, Transportation and Moving Occupations
The most common Production, Transportation and Moving occupations in Moniteau County are Production (599 | 8.9%), Transportation (314 | 4.7%), and Material Moving (277 | 4.1%).
Production, Transportation and Moving Occupations by Sex
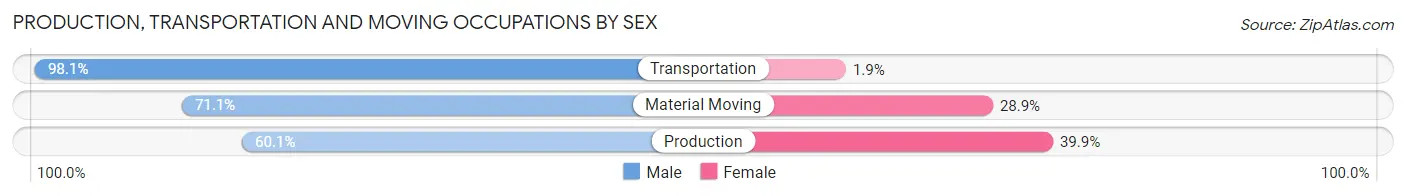
| Occupation | Male | Female |
| Production | 360 (60.1%) | 239 (39.9%) |
| Transportation | 308 (98.1%) | 6 (1.9%) |
| Material Moving | 197 (71.1%) | 80 (28.9%) |
| Total (Category) | 865 (72.7%) | 325 (27.3%) |
| Total (Overall) | 3,317 (49.4%) | 3,402 (50.6%) |
Employment Industries by Sex in Moniteau County
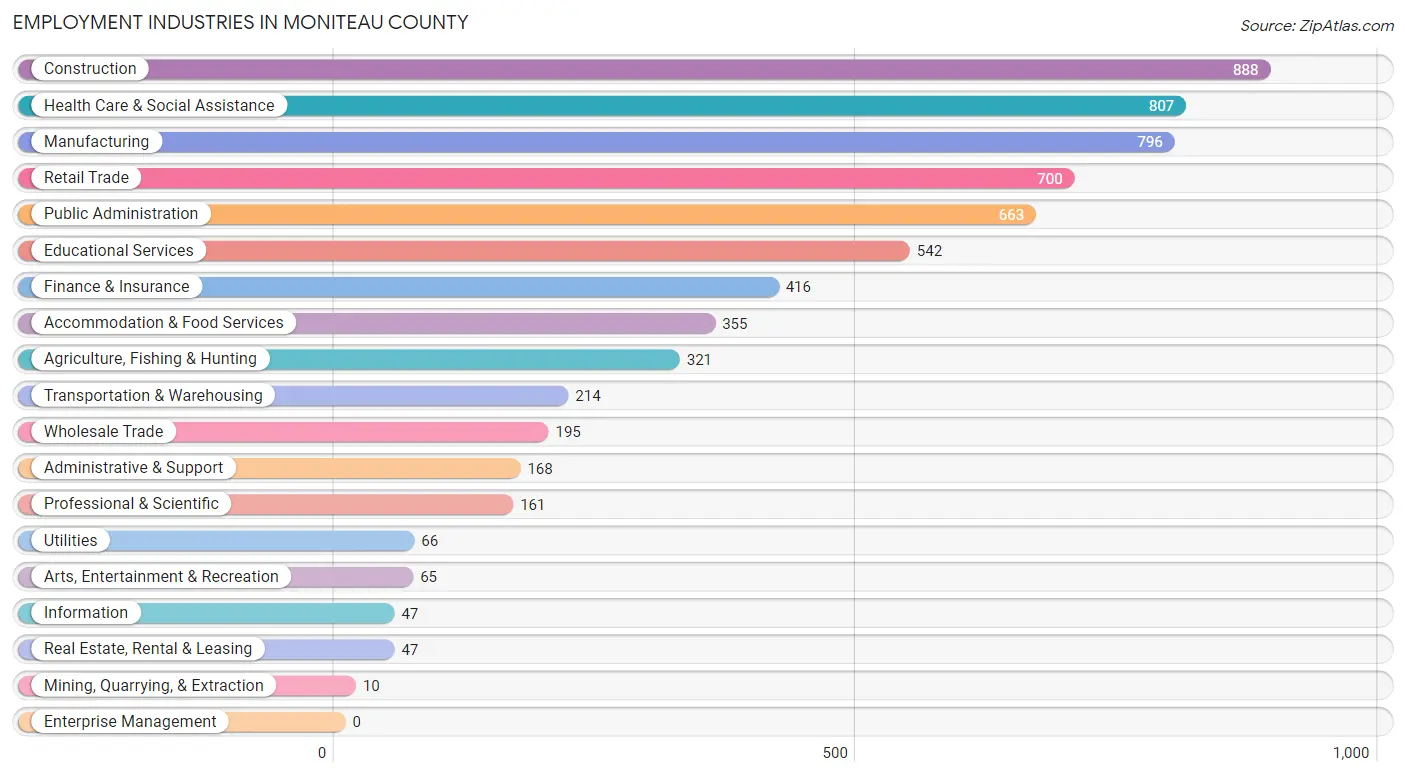
Employment Industries in Moniteau County
The major employment industries in Moniteau County include Construction (888 | 13.2%), Health Care & Social Assistance (807 | 12.0%), Manufacturing (796 | 11.8%), Retail Trade (700 | 10.4%), and Public Administration (663 | 9.9%).
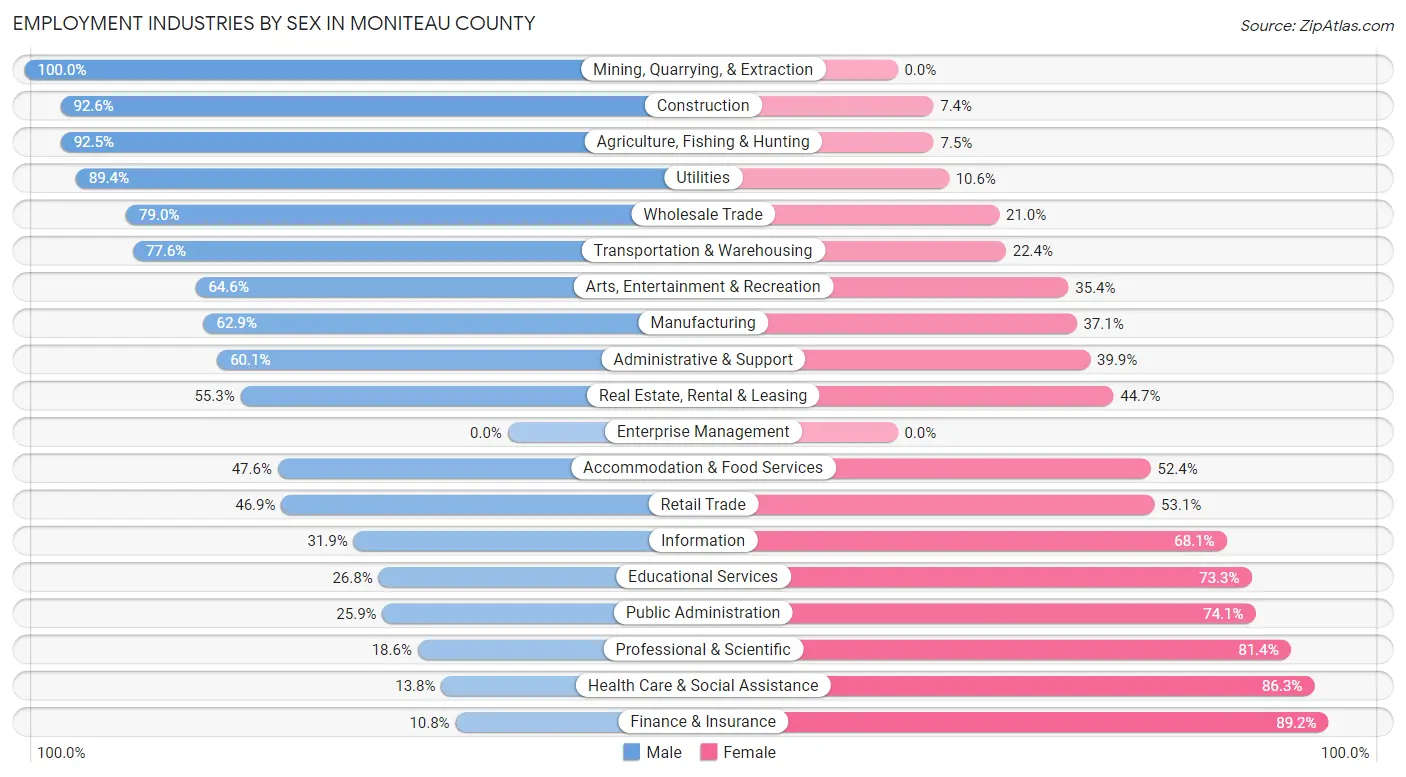
Employment Industries by Sex in Moniteau County
The Moniteau County industries that see more men than women are Mining, Quarrying, & Extraction (100.0%), Construction (92.6%), and Agriculture, Fishing & Hunting (92.5%), whereas the industries that tend to have a higher number of women are Finance & Insurance (89.2%), Health Care & Social Assistance (86.3%), and Professional & Scientific (81.4%).
| Industry | Male | Female |
| Agriculture, Fishing & Hunting | 297 (92.5%) | 24 (7.5%) |
| Mining, Quarrying, & Extraction | 10 (100.0%) | 0 (0.0%) |
| Construction | 822 (92.6%) | 66 (7.4%) |
| Manufacturing | 501 (62.9%) | 295 (37.1%) |
| Wholesale Trade | 154 (79.0%) | 41 (21.0%) |
| Retail Trade | 328 (46.9%) | 372 (53.1%) |
| Transportation & Warehousing | 166 (77.6%) | 48 (22.4%) |
| Utilities | 59 (89.4%) | 7 (10.6%) |
| Information | 15 (31.9%) | 32 (68.1%) |
| Finance & Insurance | 45 (10.8%) | 371 (89.2%) |
| Real Estate, Rental & Leasing | 26 (55.3%) | 21 (44.7%) |
| Professional & Scientific | 30 (18.6%) | 131 (81.4%) |
| Enterprise Management | 0 (0.0%) | 0 (0.0%) |
| Administrative & Support | 101 (60.1%) | 67 (39.9%) |
| Educational Services | 145 (26.8%) | 397 (73.3%) |
| Health Care & Social Assistance | 111 (13.8%) | 696 (86.3%) |
| Arts, Entertainment & Recreation | 42 (64.6%) | 23 (35.4%) |
| Accommodation & Food Services | 169 (47.6%) | 186 (52.4%) |
| Public Administration | 172 (25.9%) | 491 (74.1%) |
| Total | 3,317 (49.4%) | 3,402 (50.6%) |
Education in Moniteau County
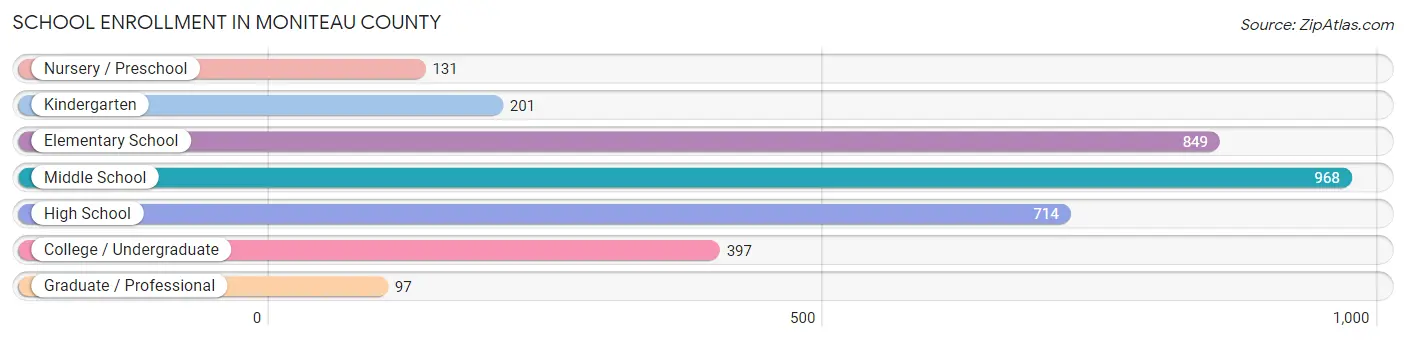
School Enrollment in Moniteau County
The most common levels of schooling among the 3,357 students in Moniteau County are middle school (968 | 28.8%), elementary school (849 | 25.3%), and high school (714 | 21.3%).
| School Level | # Students | % Students |
| Nursery / Preschool | 131 | 3.9% |
| Kindergarten | 201 | 6.0% |
| Elementary School | 849 | 25.3% |
| Middle School | 968 | 28.8% |
| High School | 714 | 21.3% |
| College / Undergraduate | 397 | 11.8% |
| Graduate / Professional | 97 | 2.9% |
| Total | 3,357 | 100.0% |
School Enrollment by Age by Funding Source in Moniteau County
Out of a total of 3,357 students who are enrolled in schools in Moniteau County, 534 (15.9%) attend a private institution, while the remaining 2,823 (84.1%) are enrolled in public schools. The age group of 35 years and over has the highest likelihood of being enrolled in private schools, with 88 (47.3% in the age bracket) enrolled. Conversely, the age group of 15 to 17 year olds has the lowest likelihood of being enrolled in a private school, with 518 (93.2% in the age bracket) attending a public institution.
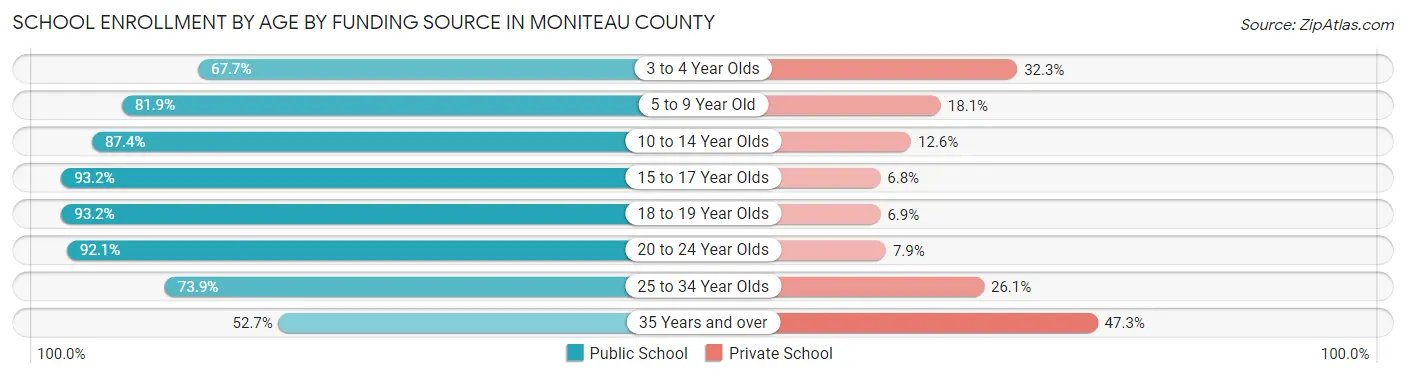
| Age Bracket | Public School | Private School |
| 3 to 4 Year Olds | 67 (67.7%) | 32 (32.3%) |
| 5 to 9 Year Old | 755 (81.9%) | 167 (18.1%) |
| 10 to 14 Year Olds | 968 (87.4%) | 139 (12.6%) |
| 15 to 17 Year Olds | 518 (93.2%) | 38 (6.8%) |
| 18 to 19 Year Olds | 136 (93.1%) | 10 (6.9%) |
| 20 to 24 Year Olds | 152 (92.1%) | 13 (7.9%) |
| 25 to 34 Year Olds | 130 (73.9%) | 46 (26.1%) |
| 35 Years and over | 98 (52.7%) | 88 (47.3%) |
| Total | 2,823 (84.1%) | 534 (15.9%) |
Educational Attainment by Field of Study in Moniteau County
Education (377 | 18.2%), business (361 | 17.4%), bio, nature & agricultural (358 | 17.3%), science & technology (200 | 9.7%), and arts & humanities (148 | 7.1%) are the most common fields of study among 2,069 individuals in Moniteau County who have obtained a bachelor's degree or higher.
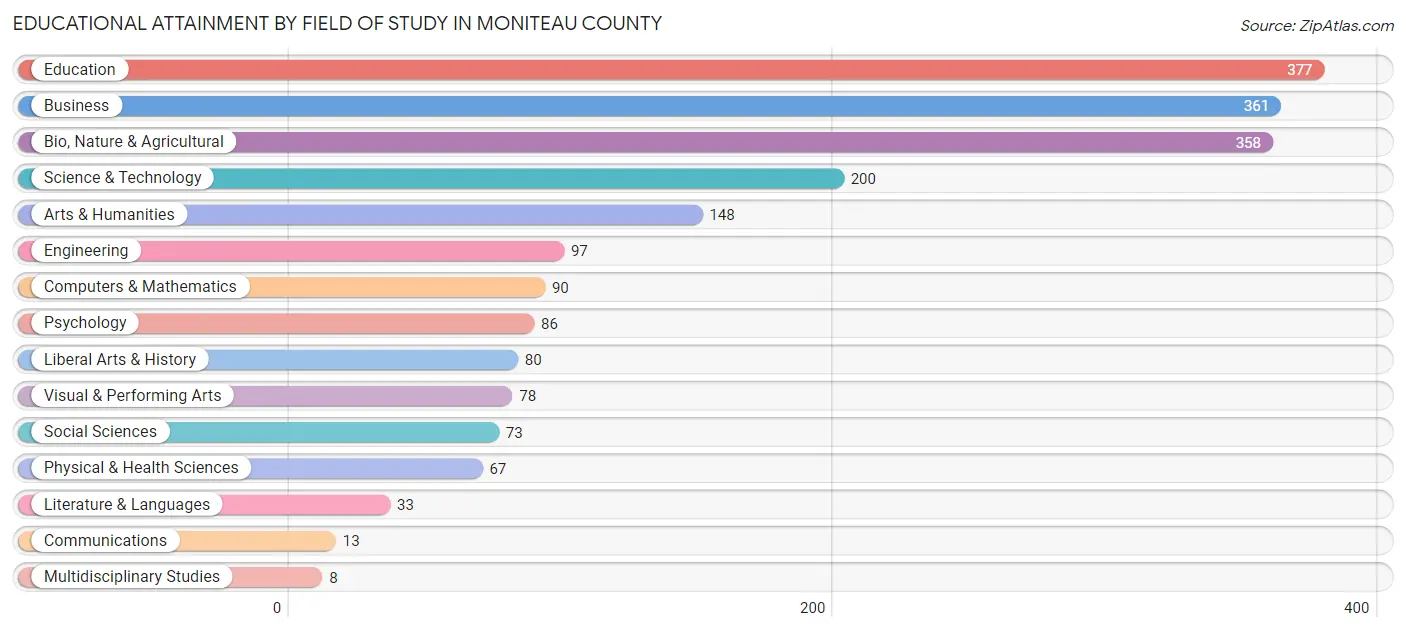
| Field of Study | # Graduates | % Graduates |
| Computers & Mathematics | 90 | 4.3% |
| Bio, Nature & Agricultural | 358 | 17.3% |
| Physical & Health Sciences | 67 | 3.2% |
| Psychology | 86 | 4.2% |
| Social Sciences | 73 | 3.5% |
| Engineering | 97 | 4.7% |
| Multidisciplinary Studies | 8 | 0.4% |
| Science & Technology | 200 | 9.7% |
| Business | 361 | 17.4% |
| Education | 377 | 18.2% |
| Literature & Languages | 33 | 1.6% |
| Liberal Arts & History | 80 | 3.9% |
| Visual & Performing Arts | 78 | 3.8% |
| Communications | 13 | 0.6% |
| Arts & Humanities | 148 | 7.1% |
| Total | 2,069 | 100.0% |
Transportation & Commute in Moniteau County
Vehicle Availability by Sex in Moniteau County
The most prevalent vehicle ownership categories in Moniteau County are males with 2 vehicles (1,028, accounting for 31.0%) and females with 2 vehicles (1,091, making up 30.4%).
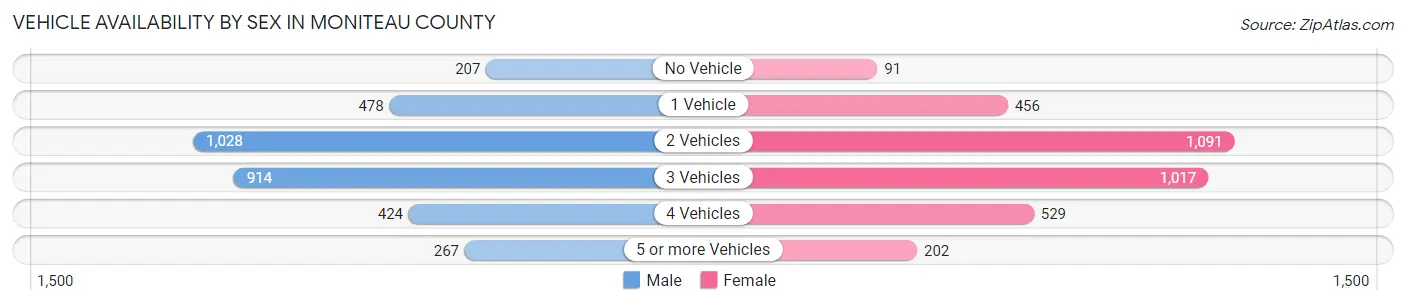
| Vehicles Available | Male | Female |
| No Vehicle | 207 (6.2%) | 91 (2.7%) |
| 1 Vehicle | 478 (14.4%) | 456 (13.5%) |
| 2 Vehicles | 1,028 (31.0%) | 1,091 (32.2%) |
| 3 Vehicles | 914 (27.6%) | 1,017 (30.0%) |
| 4 Vehicles | 424 (12.8%) | 529 (15.6%) |
| 5 or more Vehicles | 267 (8.1%) | 202 (6.0%) |
| Total | 3,318 (100.0%) | 3,386 (100.0%) |
Commute Time in Moniteau County
The most frequently occuring commute durations in Moniteau County are 30 to 34 minutes (1,037 commuters, 16.7%), 5 to 9 minutes (934 commuters, 15.0%), and 25 to 29 minutes (636 commuters, 10.2%).
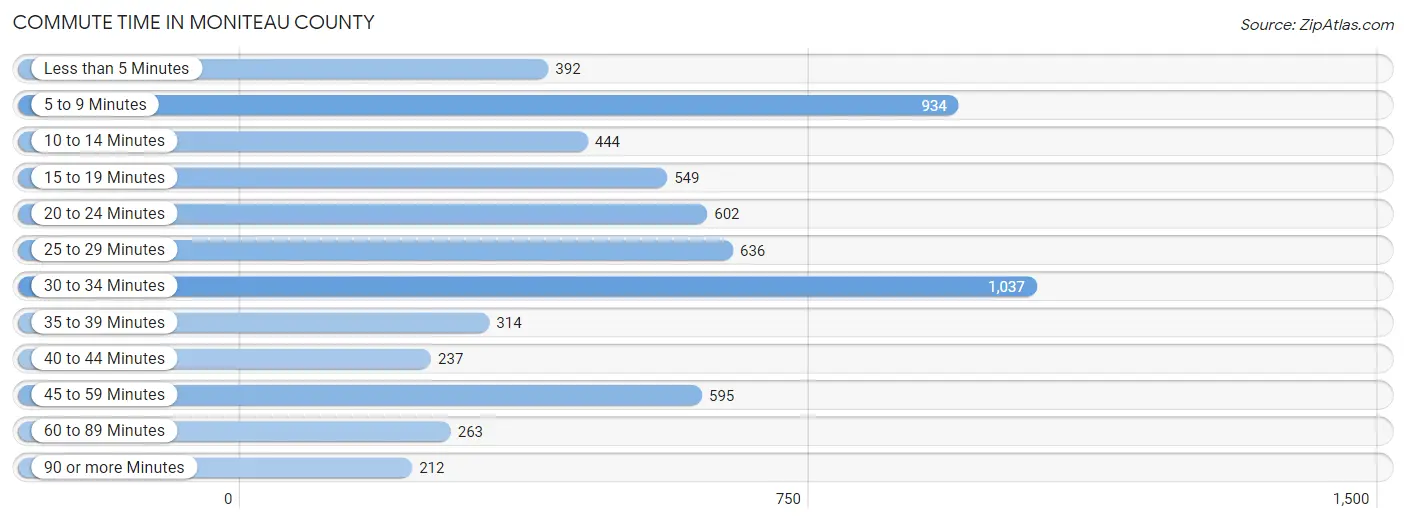
| Commute Time | # Commuters | % Commuters |
| Less than 5 Minutes | 392 | 6.3% |
| 5 to 9 Minutes | 934 | 15.0% |
| 10 to 14 Minutes | 444 | 7.1% |
| 15 to 19 Minutes | 549 | 8.8% |
| 20 to 24 Minutes | 602 | 9.7% |
| 25 to 29 Minutes | 636 | 10.2% |
| 30 to 34 Minutes | 1,037 | 16.7% |
| 35 to 39 Minutes | 314 | 5.1% |
| 40 to 44 Minutes | 237 | 3.8% |
| 45 to 59 Minutes | 595 | 9.6% |
| 60 to 89 Minutes | 263 | 4.2% |
| 90 or more Minutes | 212 | 3.4% |
Commute Time by Sex in Moniteau County
The most common commute times in Moniteau County are 5 to 9 minutes (508 commuters, 16.4%) for males and 30 to 34 minutes (553 commuters, 17.7%) for females.
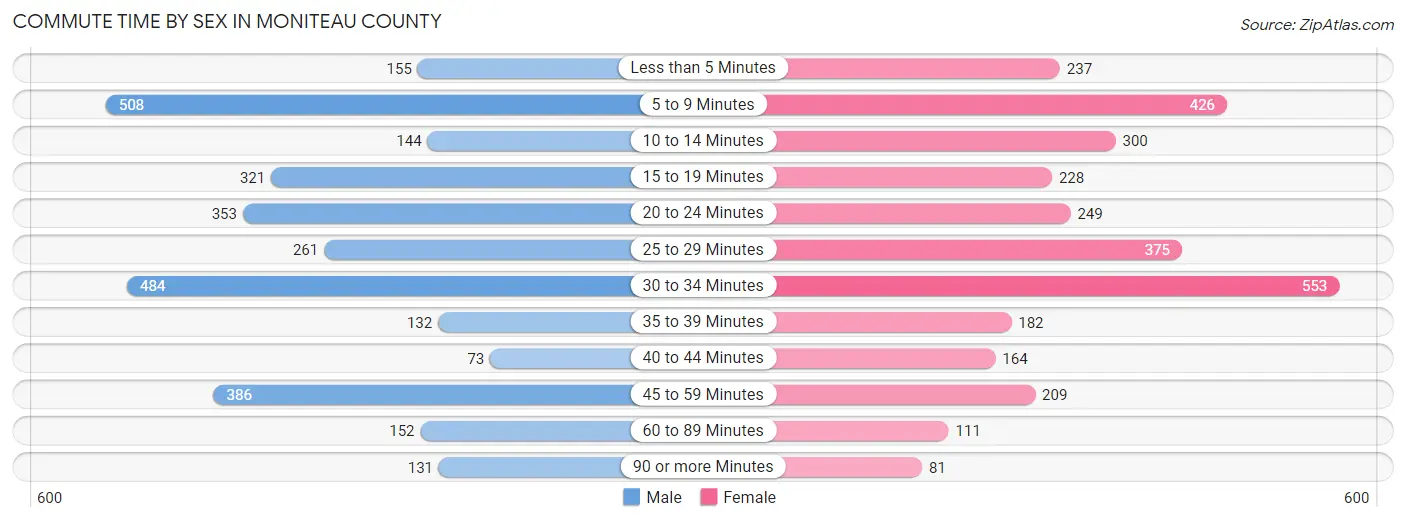
| Commute Time | Male | Female |
| Less than 5 Minutes | 155 (5.0%) | 237 (7.6%) |
| 5 to 9 Minutes | 508 (16.4%) | 426 (13.7%) |
| 10 to 14 Minutes | 144 (4.6%) | 300 (9.6%) |
| 15 to 19 Minutes | 321 (10.3%) | 228 (7.3%) |
| 20 to 24 Minutes | 353 (11.4%) | 249 (8.0%) |
| 25 to 29 Minutes | 261 (8.4%) | 375 (12.0%) |
| 30 to 34 Minutes | 484 (15.6%) | 553 (17.7%) |
| 35 to 39 Minutes | 132 (4.3%) | 182 (5.8%) |
| 40 to 44 Minutes | 73 (2.4%) | 164 (5.3%) |
| 45 to 59 Minutes | 386 (12.4%) | 209 (6.7%) |
| 60 to 89 Minutes | 152 (4.9%) | 111 (3.6%) |
| 90 or more Minutes | 131 (4.2%) | 81 (2.6%) |
Time of Departure to Work by Sex in Moniteau County
The most frequent times of departure to work in Moniteau County are 7:00 AM to 7:29 AM (609, 19.7%) for males and 7:00 AM to 7:29 AM (814, 26.1%) for females.
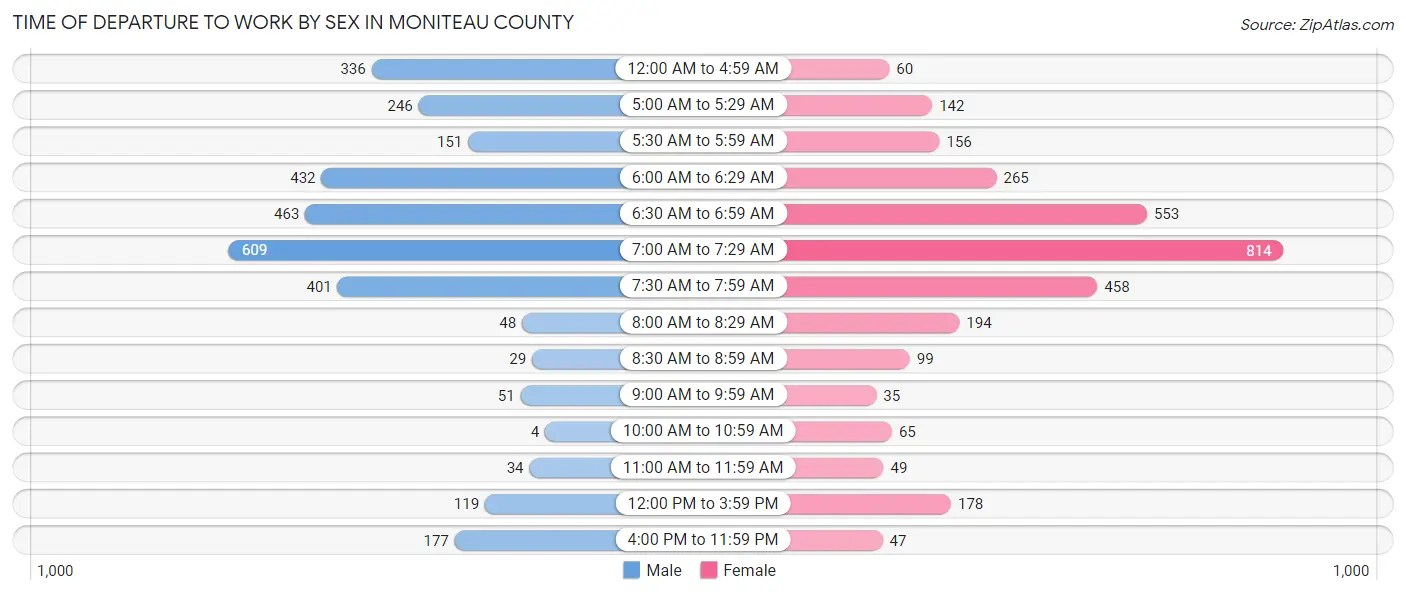
| Time of Departure | Male | Female |
| 12:00 AM to 4:59 AM | 336 (10.8%) | 60 (1.9%) |
| 5:00 AM to 5:29 AM | 246 (7.9%) | 142 (4.6%) |
| 5:30 AM to 5:59 AM | 151 (4.9%) | 156 (5.0%) |
| 6:00 AM to 6:29 AM | 432 (13.9%) | 265 (8.5%) |
| 6:30 AM to 6:59 AM | 463 (14.9%) | 553 (17.7%) |
| 7:00 AM to 7:29 AM | 609 (19.7%) | 814 (26.1%) |
| 7:30 AM to 7:59 AM | 401 (12.9%) | 458 (14.7%) |
| 8:00 AM to 8:29 AM | 48 (1.5%) | 194 (6.2%) |
| 8:30 AM to 8:59 AM | 29 (0.9%) | 99 (3.2%) |
| 9:00 AM to 9:59 AM | 51 (1.7%) | 35 (1.1%) |
| 10:00 AM to 10:59 AM | 4 (0.1%) | 65 (2.1%) |
| 11:00 AM to 11:59 AM | 34 (1.1%) | 49 (1.6%) |
| 12:00 PM to 3:59 PM | 119 (3.8%) | 178 (5.7%) |
| 4:00 PM to 11:59 PM | 177 (5.7%) | 47 (1.5%) |
| Total | 3,100 (100.0%) | 3,115 (100.0%) |
Housing Occupancy in Moniteau County
Occupancy by Ownership in Moniteau County
Of the total 5,691 dwellings in Moniteau County, owner-occupied units account for 4,369 (76.8%), while renter-occupied units make up 1,322 (23.2%).
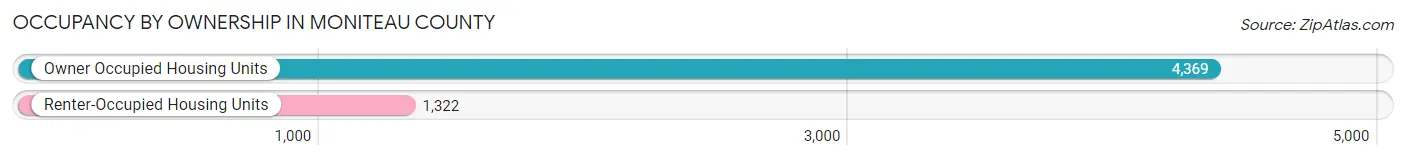
| Occupancy | # Housing Units | % Housing Units |
| Owner Occupied Housing Units | 4,369 | 76.8% |
| Renter-Occupied Housing Units | 1,322 | 23.2% |
| Total Occupied Housing Units | 5,691 | 100.0% |
Occupancy by Household Size in Moniteau County
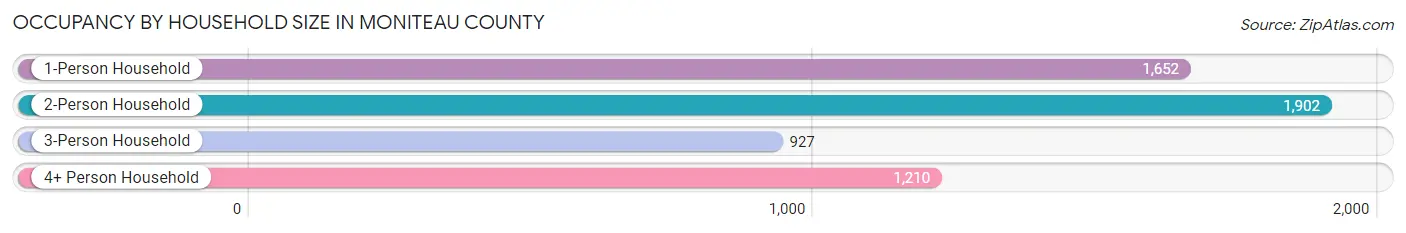
| Household Size | # Housing Units | % Housing Units |
| 1-Person Household | 1,652 | 29.0% |
| 2-Person Household | 1,902 | 33.4% |
| 3-Person Household | 927 | 16.3% |
| 4+ Person Household | 1,210 | 21.3% |
| Total Housing Units | 5,691 | 100.0% |
Occupancy by Ownership by Household Size in Moniteau County
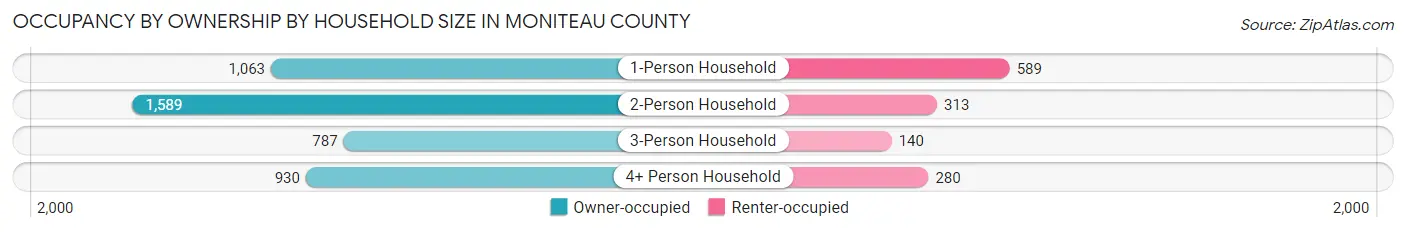
| Household Size | Owner-occupied | Renter-occupied |
| 1-Person Household | 1,063 (64.3%) | 589 (35.6%) |
| 2-Person Household | 1,589 (83.5%) | 313 (16.5%) |
| 3-Person Household | 787 (84.9%) | 140 (15.1%) |
| 4+ Person Household | 930 (76.9%) | 280 (23.1%) |
| Total Housing Units | 4,369 (76.8%) | 1,322 (23.2%) |
Occupancy by Educational Attainment in Moniteau County
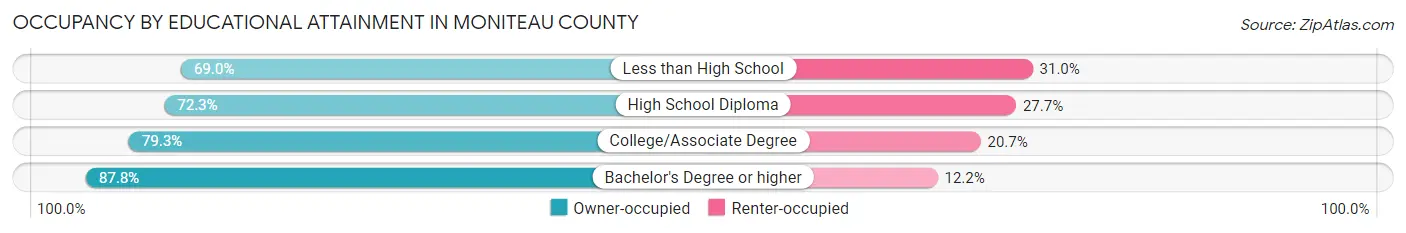
| Household Size | Owner-occupied | Renter-occupied |
| Less than High School | 485 (69.0%) | 218 (31.0%) |
| High School Diploma | 1,643 (72.3%) | 630 (27.7%) |
| College/Associate Degree | 1,338 (79.3%) | 349 (20.7%) |
| Bachelor's Degree or higher | 903 (87.8%) | 125 (12.2%) |
Occupancy by Age of Householder in Moniteau County
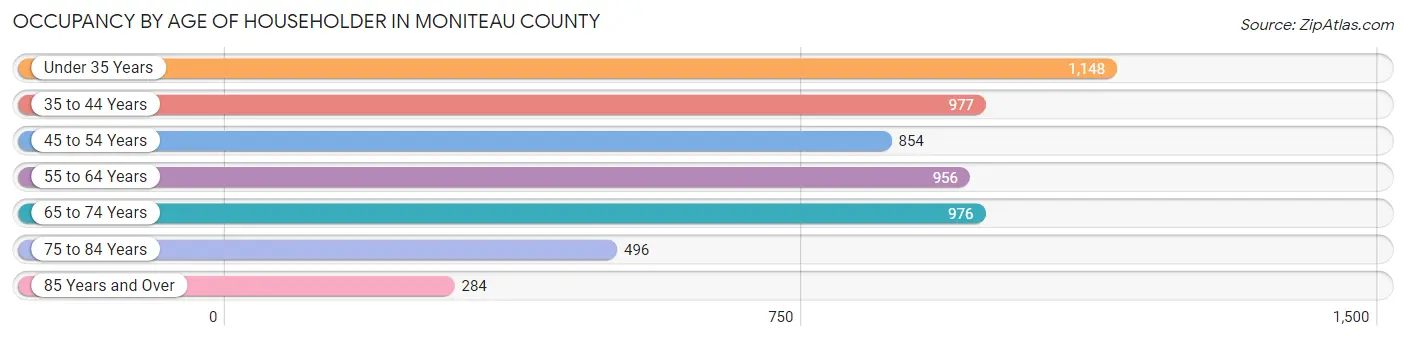
| Age Bracket | # Households | % Households |
| Under 35 Years | 1,148 | 20.2% |
| 35 to 44 Years | 977 | 17.2% |
| 45 to 54 Years | 854 | 15.0% |
| 55 to 64 Years | 956 | 16.8% |
| 65 to 74 Years | 976 | 17.2% |
| 75 to 84 Years | 496 | 8.7% |
| 85 Years and Over | 284 | 5.0% |
| Total | 5,691 | 100.0% |
Housing Finances in Moniteau County
Median Income by Occupancy in Moniteau County
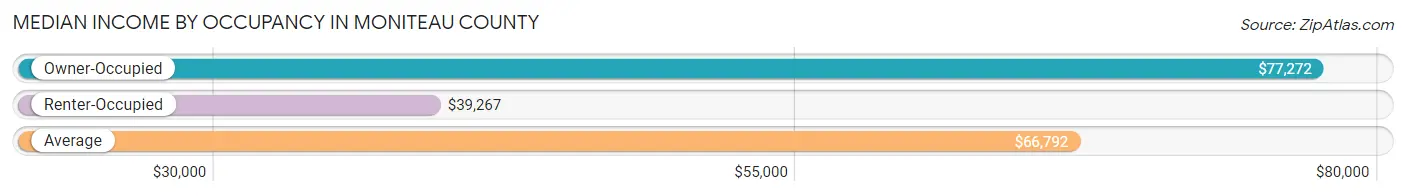
| Occupancy Type | # Households | Median Income |
| Owner-Occupied | 4,369 (76.8%) | $77,272 |
| Renter-Occupied | 1,322 (23.2%) | $39,267 |
| Average | 5,691 (100.0%) | $66,792 |
Occupancy by Householder Income Bracket in Moniteau County
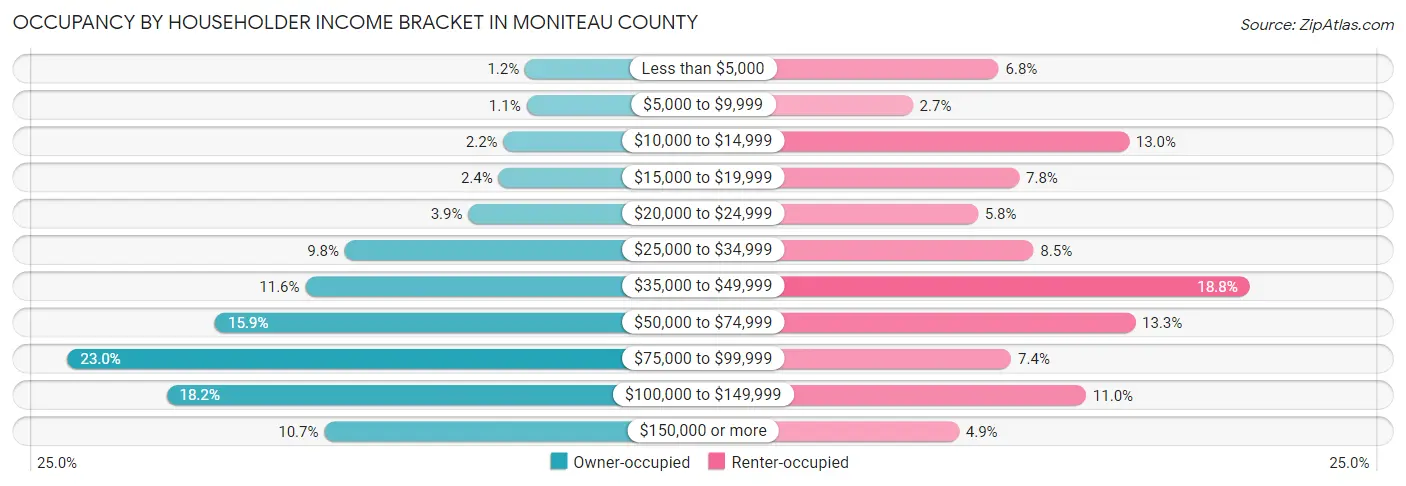
| Income Bracket | Owner-occupied | Renter-occupied |
| Less than $5,000 | 51 (1.2%) | 90 (6.8%) |
| $5,000 to $9,999 | 48 (1.1%) | 36 (2.7%) |
| $10,000 to $14,999 | 96 (2.2%) | 172 (13.0%) |
| $15,000 to $19,999 | 106 (2.4%) | 103 (7.8%) |
| $20,000 to $24,999 | 169 (3.9%) | 77 (5.8%) |
| $25,000 to $34,999 | 426 (9.8%) | 112 (8.5%) |
| $35,000 to $49,999 | 508 (11.6%) | 248 (18.8%) |
| $50,000 to $74,999 | 696 (15.9%) | 176 (13.3%) |
| $75,000 to $99,999 | 1,003 (23.0%) | 98 (7.4%) |
| $100,000 to $149,999 | 797 (18.2%) | 145 (11.0%) |
| $150,000 or more | 469 (10.7%) | 65 (4.9%) |
| Total | 4,369 (100.0%) | 1,322 (100.0%) |
Monthly Housing Cost Tiers in Moniteau County
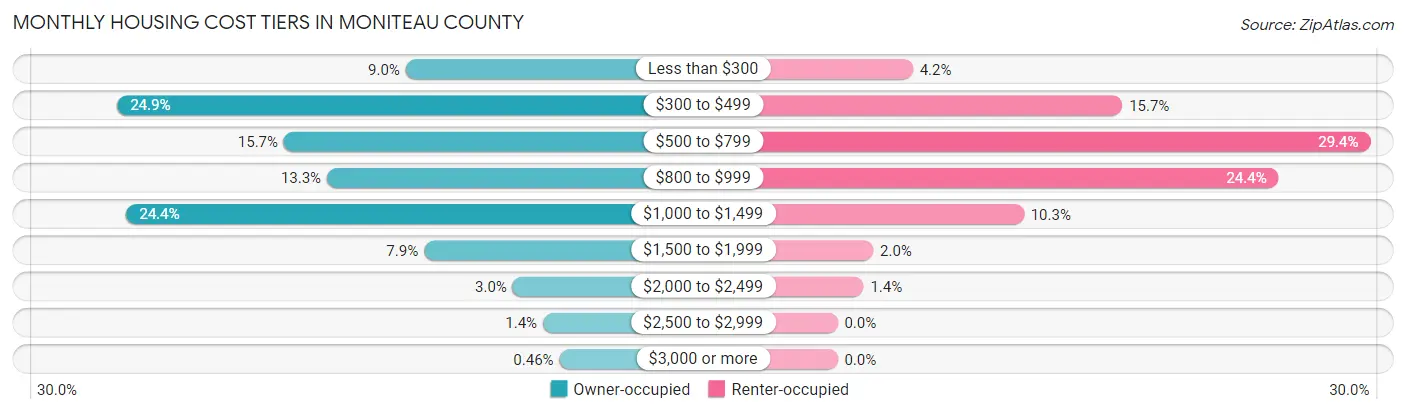
| Monthly Cost | Owner-occupied | Renter-occupied |
| Less than $300 | 391 (8.9%) | 55 (4.2%) |
| $300 to $499 | 1,087 (24.9%) | 208 (15.7%) |
| $500 to $799 | 685 (15.7%) | 389 (29.4%) |
| $800 to $999 | 581 (13.3%) | 322 (24.4%) |
| $1,000 to $1,499 | 1,065 (24.4%) | 136 (10.3%) |
| $1,500 to $1,999 | 347 (7.9%) | 26 (2.0%) |
| $2,000 to $2,499 | 133 (3.0%) | 19 (1.4%) |
| $2,500 to $2,999 | 60 (1.4%) | 0 (0.0%) |
| $3,000 or more | 20 (0.5%) | 0 (0.0%) |
| Total | 4,369 (100.0%) | 1,322 (100.0%) |
Physical Housing Characteristics in Moniteau County
Housing Structures in Moniteau County
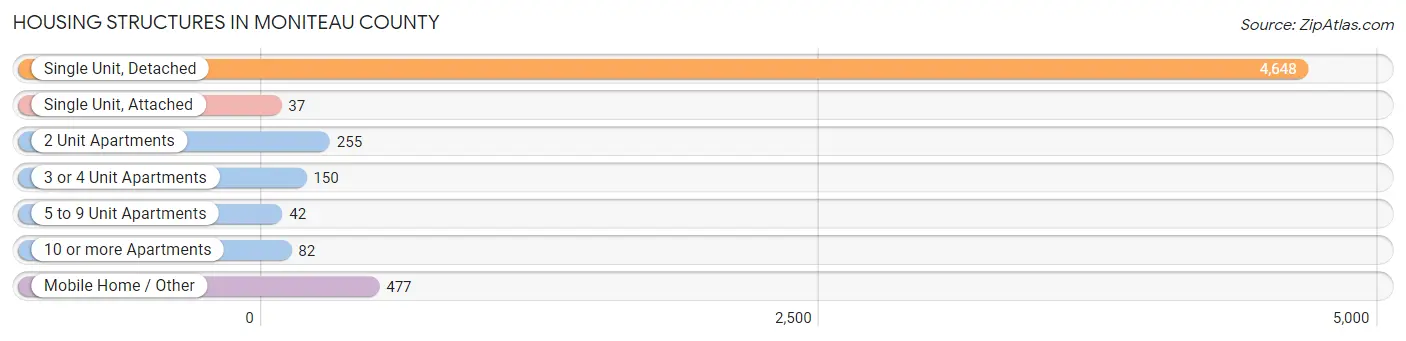
| Structure Type | # Housing Units | % Housing Units |
| Single Unit, Detached | 4,648 | 81.7% |
| Single Unit, Attached | 37 | 0.6% |
| 2 Unit Apartments | 255 | 4.5% |
| 3 or 4 Unit Apartments | 150 | 2.6% |
| 5 to 9 Unit Apartments | 42 | 0.7% |
| 10 or more Apartments | 82 | 1.4% |
| Mobile Home / Other | 477 | 8.4% |
| Total | 5,691 | 100.0% |
Housing Structures by Occupancy in Moniteau County
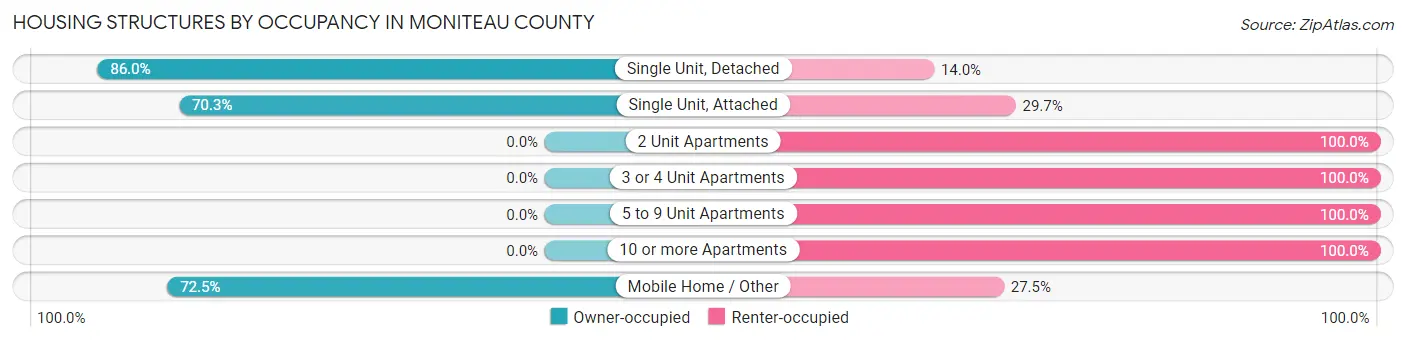
| Structure Type | Owner-occupied | Renter-occupied |
| Single Unit, Detached | 3,997 (86.0%) | 651 (14.0%) |
| Single Unit, Attached | 26 (70.3%) | 11 (29.7%) |
| 2 Unit Apartments | 0 (0.0%) | 255 (100.0%) |
| 3 or 4 Unit Apartments | 0 (0.0%) | 150 (100.0%) |
| 5 to 9 Unit Apartments | 0 (0.0%) | 42 (100.0%) |
| 10 or more Apartments | 0 (0.0%) | 82 (100.0%) |
| Mobile Home / Other | 346 (72.5%) | 131 (27.5%) |
| Total | 4,369 (76.8%) | 1,322 (23.2%) |
Housing Structures by Number of Rooms in Moniteau County
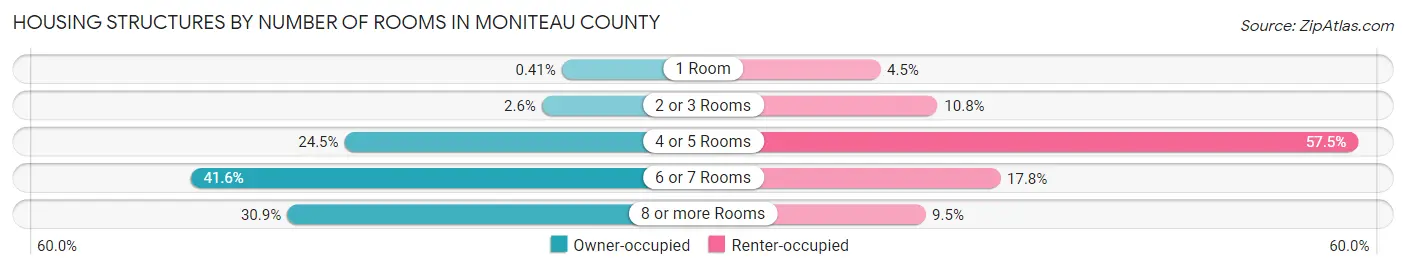
| Number of Rooms | Owner-occupied | Renter-occupied |
| 1 Room | 18 (0.4%) | 59 (4.5%) |
| 2 or 3 Rooms | 114 (2.6%) | 143 (10.8%) |
| 4 or 5 Rooms | 1,071 (24.5%) | 760 (57.5%) |
| 6 or 7 Rooms | 1,817 (41.6%) | 235 (17.8%) |
| 8 or more Rooms | 1,349 (30.9%) | 125 (9.5%) |
| Total | 4,369 (100.0%) | 1,322 (100.0%) |
Housing Structure by Heating Type in Moniteau County
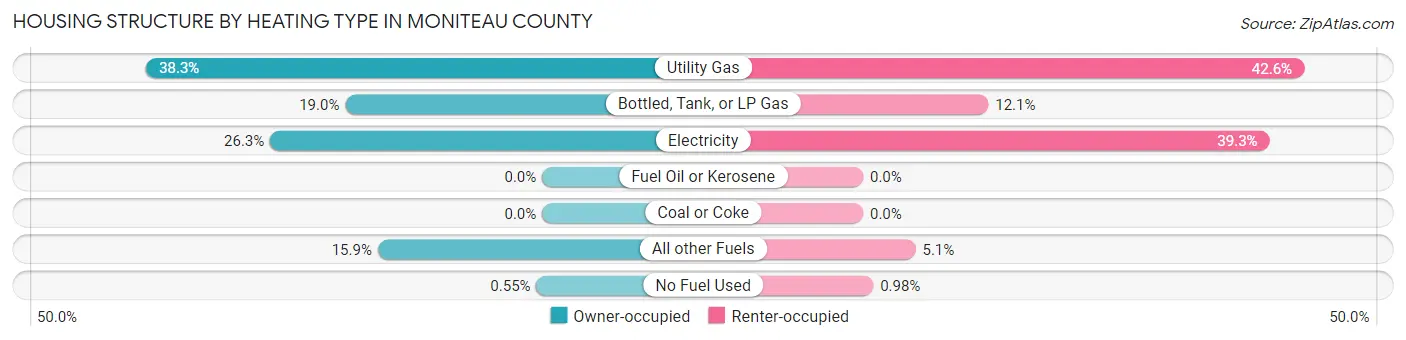
| Heating Type | Owner-occupied | Renter-occupied |
| Utility Gas | 1,672 (38.3%) | 563 (42.6%) |
| Bottled, Tank, or LP Gas | 831 (19.0%) | 160 (12.1%) |
| Electricity | 1,148 (26.3%) | 519 (39.3%) |
| Fuel Oil or Kerosene | 0 (0.0%) | 0 (0.0%) |
| Coal or Coke | 0 (0.0%) | 0 (0.0%) |
| All other Fuels | 694 (15.9%) | 67 (5.1%) |
| No Fuel Used | 24 (0.5%) | 13 (1.0%) |
| Total | 4,369 (100.0%) | 1,322 (100.0%) |
Household Vehicle Usage in Moniteau County
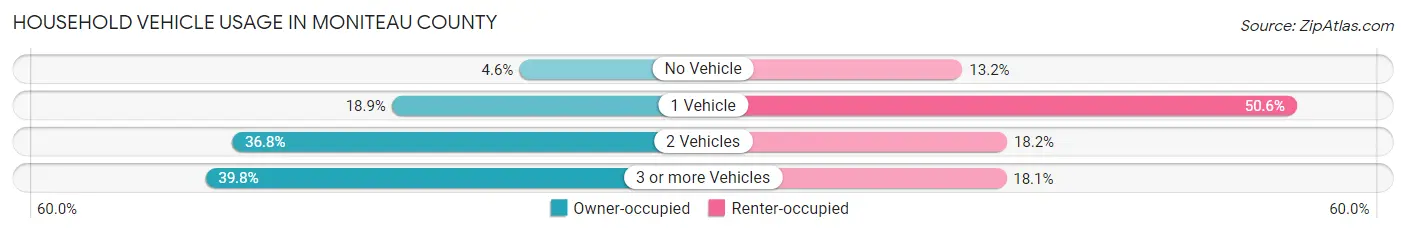
| Vehicles per Household | Owner-occupied | Renter-occupied |
| No Vehicle | 201 (4.6%) | 174 (13.2%) |
| 1 Vehicle | 825 (18.9%) | 669 (50.6%) |
| 2 Vehicles | 1,606 (36.8%) | 240 (18.1%) |
| 3 or more Vehicles | 1,737 (39.8%) | 239 (18.1%) |
| Total | 4,369 (100.0%) | 1,322 (100.0%) |
Real Estate & Mortgages in Moniteau County
Real Estate and Mortgage Overview in Moniteau County
| Characteristic | Without Mortgage | With Mortgage |
| Housing Units | 1,944 | 2,425 |
| Median Property Value | $145,500 | $172,800 |
| Median Household Income | $58,889 | $331 |
| Monthly Housing Costs | $422 | $20 |
| Real Estate Taxes | $1,158 | $41 |
Property Value by Mortgage Status in Moniteau County
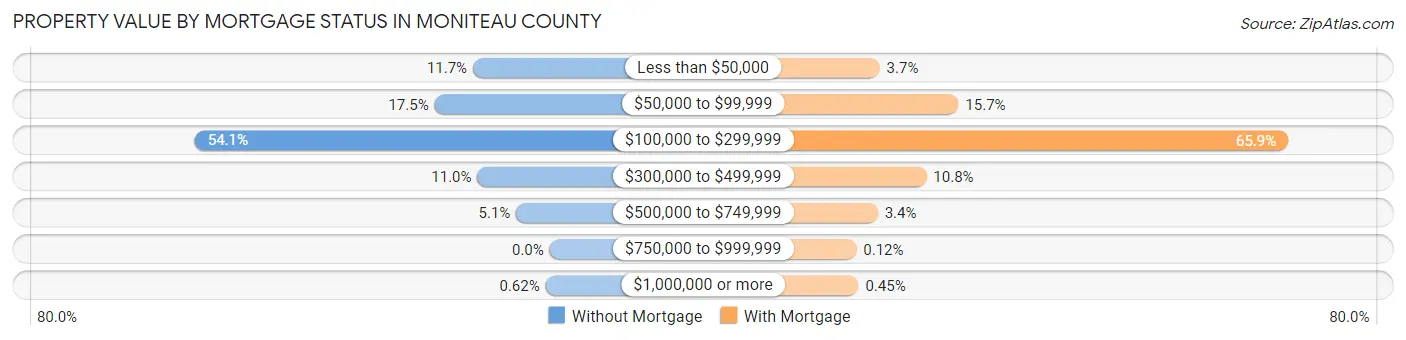
| Property Value | Without Mortgage | With Mortgage |
| Less than $50,000 | 227 (11.7%) | 89 (3.7%) |
| $50,000 to $99,999 | 341 (17.5%) | 380 (15.7%) |
| $100,000 to $299,999 | 1,051 (54.1%) | 1,598 (65.9%) |
| $300,000 to $499,999 | 214 (11.0%) | 262 (10.8%) |
| $500,000 to $749,999 | 99 (5.1%) | 82 (3.4%) |
| $750,000 to $999,999 | 0 (0.0%) | 3 (0.1%) |
| $1,000,000 or more | 12 (0.6%) | 11 (0.4%) |
| Total | 1,944 (100.0%) | 2,425 (100.0%) |
Household Income by Mortgage Status in Moniteau County
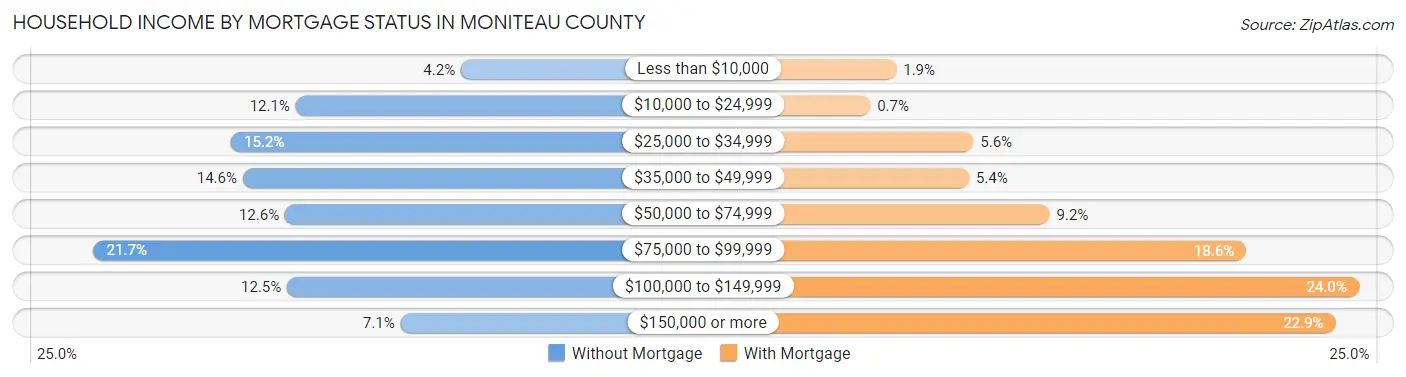
| Household Income | Without Mortgage | With Mortgage |
| Less than $10,000 | 82 (4.2%) | 47 (1.9%) |
| $10,000 to $24,999 | 235 (12.1%) | 17 (0.7%) |
| $25,000 to $34,999 | 295 (15.2%) | 136 (5.6%) |
| $35,000 to $49,999 | 284 (14.6%) | 131 (5.4%) |
| $50,000 to $74,999 | 245 (12.6%) | 224 (9.2%) |
| $75,000 to $99,999 | 422 (21.7%) | 451 (18.6%) |
| $100,000 to $149,999 | 243 (12.5%) | 581 (24.0%) |
| $150,000 or more | 138 (7.1%) | 554 (22.9%) |
| Total | 1,944 (100.0%) | 2,425 (100.0%) |
Property Value to Household Income Ratio in Moniteau County
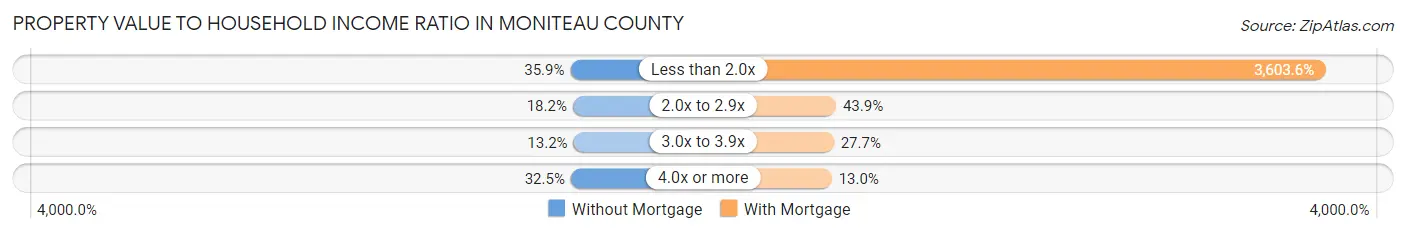
| Value-to-Income Ratio | Without Mortgage | With Mortgage |
| Less than 2.0x | 698 (35.9%) | 87,388 (3,603.6%) |
| 2.0x to 2.9x | 354 (18.2%) | 1,064 (43.9%) |
| 3.0x to 3.9x | 257 (13.2%) | 671 (27.7%) |
| 4.0x or more | 632 (32.5%) | 315 (13.0%) |
| Total | 1,944 (100.0%) | 2,425 (100.0%) |
Real Estate Taxes by Mortgage Status in Moniteau County
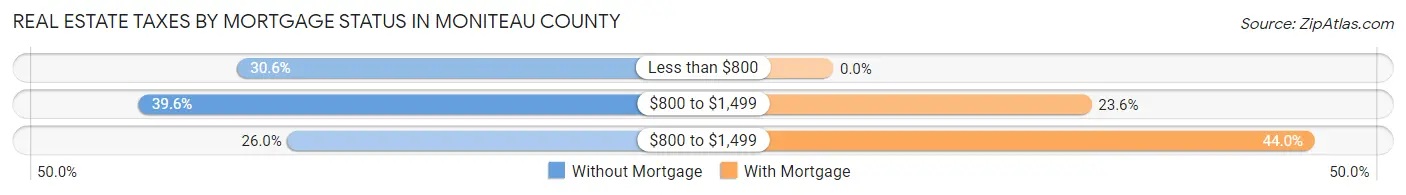
| Property Taxes | Without Mortgage | With Mortgage |
| Less than $800 | 594 (30.6%) | 0 (0.0%) |
| $800 to $1,499 | 769 (39.6%) | 572 (23.6%) |
| $800 to $1,499 | 505 (26.0%) | 1,067 (44.0%) |
| Total | 1,944 (100.0%) | 2,425 (100.0%) |
Health & Disability in Moniteau County
Health Insurance Coverage by Age in Moniteau County
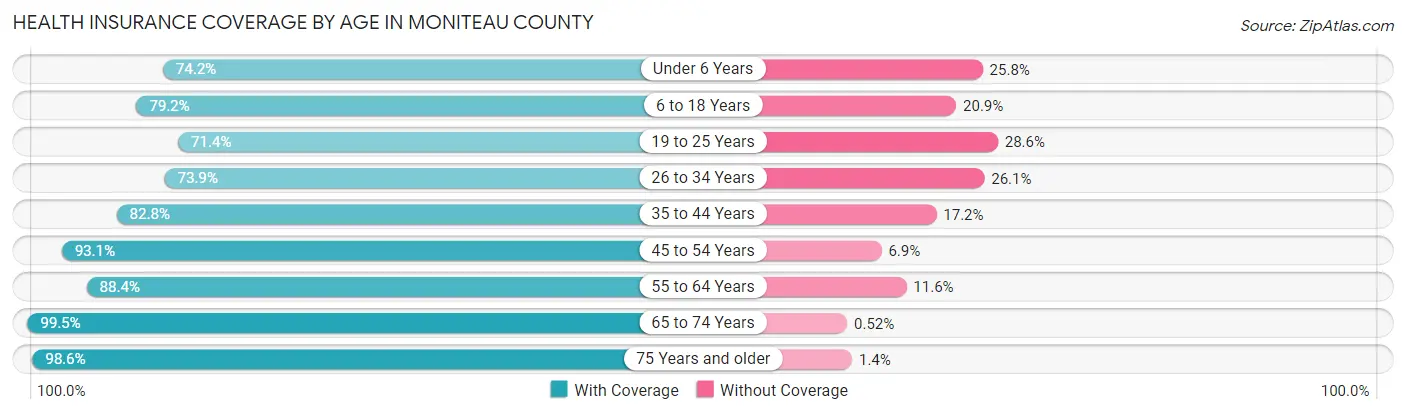
| Age Bracket | With Coverage | Without Coverage |
| Under 6 Years | 834 (74.2%) | 290 (25.8%) |
| 6 to 18 Years | 2,304 (79.1%) | 607 (20.8%) |
| 19 to 25 Years | 828 (71.4%) | 332 (28.6%) |
| 26 to 34 Years | 1,141 (73.9%) | 403 (26.1%) |
| 35 to 44 Years | 1,452 (82.8%) | 301 (17.2%) |
| 45 to 54 Years | 1,571 (93.1%) | 117 (6.9%) |
| 55 to 64 Years | 1,420 (88.4%) | 186 (11.6%) |
| 65 to 74 Years | 1,344 (99.5%) | 7 (0.5%) |
| 75 Years and older | 955 (98.6%) | 14 (1.4%) |
| Total | 11,849 (84.0%) | 2,257 (16.0%) |
Health Insurance Coverage by Citizenship Status in Moniteau County
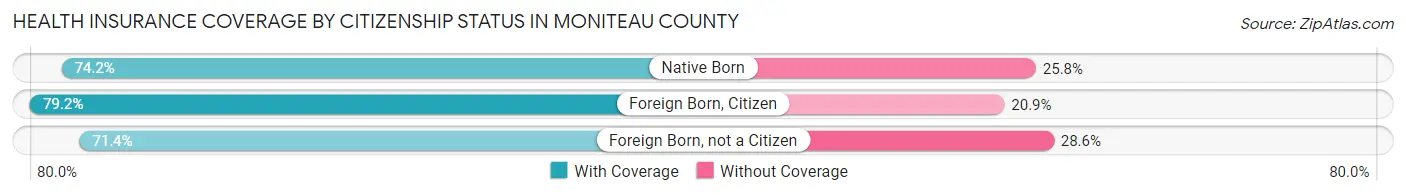
| Citizenship Status | With Coverage | Without Coverage |
| Native Born | 834 (74.2%) | 290 (25.8%) |
| Foreign Born, Citizen | 2,304 (79.1%) | 607 (20.8%) |
| Foreign Born, not a Citizen | 828 (71.4%) | 332 (28.6%) |
Health Insurance Coverage by Household Income in Moniteau County
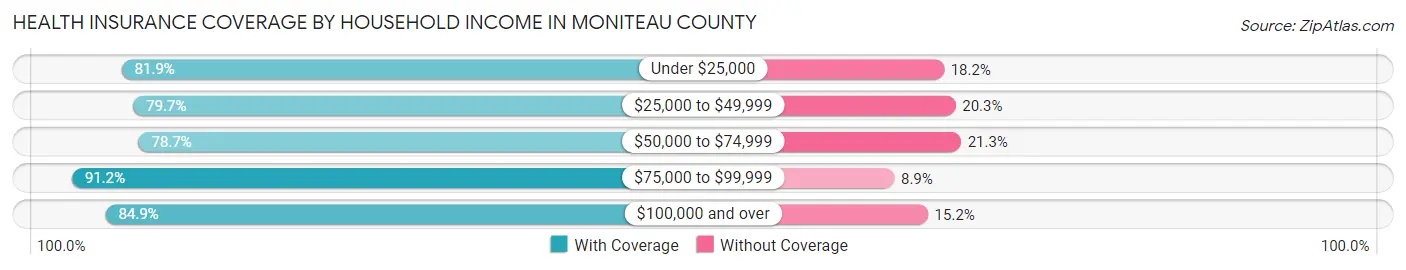
| Household Income | With Coverage | Without Coverage |
| Under $25,000 | 1,249 (81.9%) | 277 (18.1%) |
| $25,000 to $49,999 | 1,956 (79.7%) | 499 (20.3%) |
| $50,000 to $74,999 | 1,769 (78.7%) | 480 (21.3%) |
| $75,000 to $99,999 | 2,770 (91.1%) | 269 (8.8%) |
| $100,000 and over | 4,100 (84.9%) | 732 (15.1%) |
Public vs Private Health Insurance Coverage by Age in Moniteau County
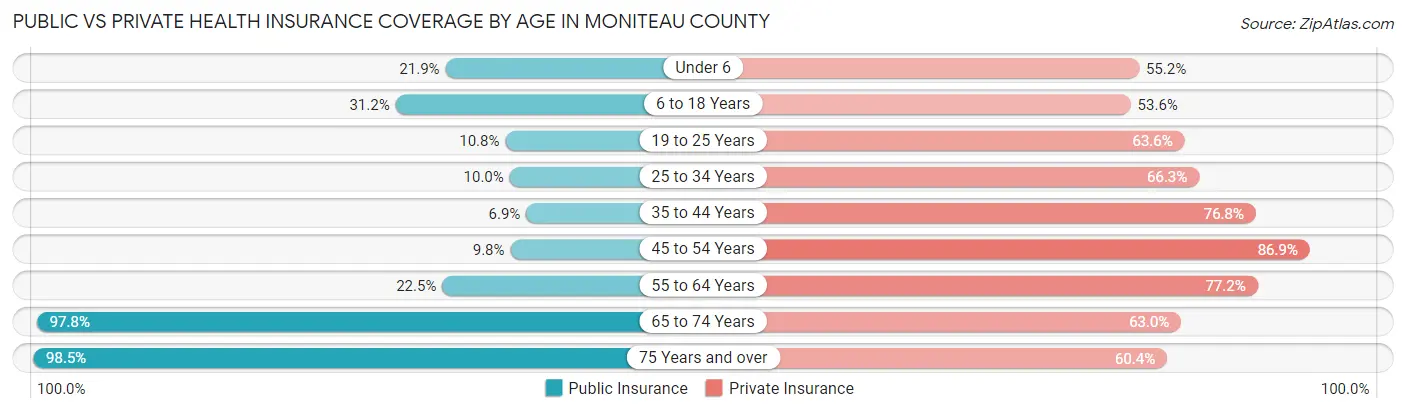
| Age Bracket | Public Insurance | Private Insurance |
| Under 6 | 246 (21.9%) | 620 (55.2%) |
| 6 to 18 Years | 907 (31.2%) | 1,561 (53.6%) |
| 19 to 25 Years | 125 (10.8%) | 738 (63.6%) |
| 25 to 34 Years | 154 (10.0%) | 1,024 (66.3%) |
| 35 to 44 Years | 121 (6.9%) | 1,347 (76.8%) |
| 45 to 54 Years | 166 (9.8%) | 1,466 (86.9%) |
| 55 to 64 Years | 361 (22.5%) | 1,239 (77.1%) |
| 65 to 74 Years | 1,321 (97.8%) | 851 (63.0%) |
| 75 Years and over | 954 (98.5%) | 585 (60.4%) |
| Total | 4,355 (30.9%) | 9,431 (66.9%) |
Disability Status by Sex by Age in Moniteau County
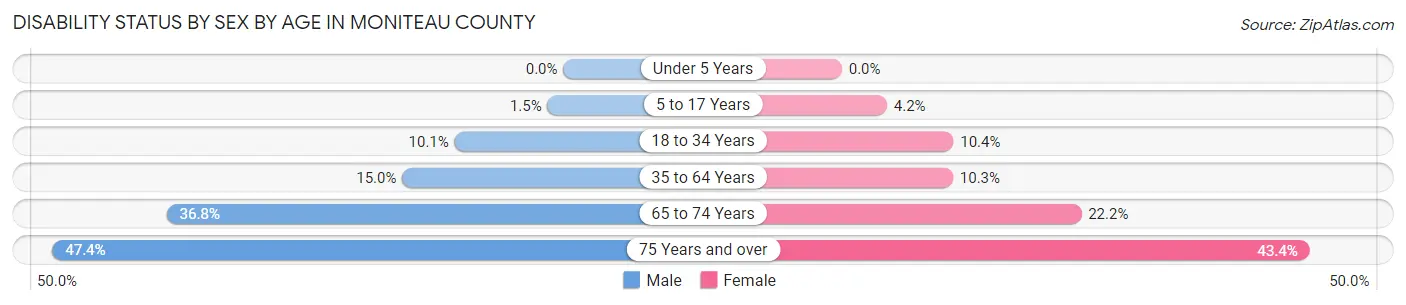
| Age Bracket | Male | Female |
| Under 5 Years | 0 (0.0%) | 0 (0.0%) |
| 5 to 17 Years | 21 (1.5%) | 60 (4.2%) |
| 18 to 34 Years | 150 (10.1%) | 146 (10.3%) |
| 35 to 64 Years | 344 (14.9%) | 283 (10.3%) |
| 65 to 74 Years | 229 (36.8%) | 162 (22.2%) |
| 75 Years and over | 193 (47.4%) | 244 (43.4%) |
Disability Class by Sex by Age in Moniteau County
Disability Class: Hearing Difficulty
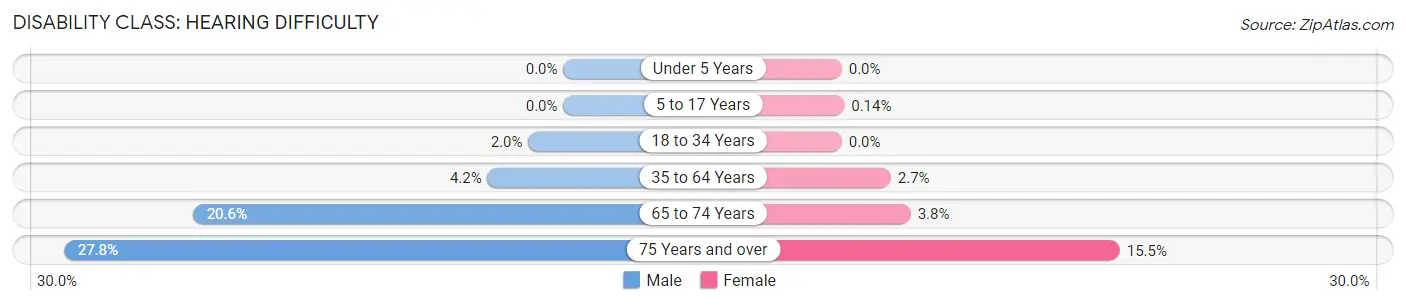
| Age Bracket | Male | Female |
| Under 5 Years | 0 (0.0%) | 0 (0.0%) |
| 5 to 17 Years | 0 (0.0%) | 2 (0.1%) |
| 18 to 34 Years | 29 (1.9%) | 0 (0.0%) |
| 35 to 64 Years | 97 (4.2%) | 75 (2.7%) |
| 65 to 74 Years | 128 (20.6%) | 28 (3.8%) |
| 75 Years and over | 113 (27.8%) | 87 (15.5%) |
Disability Class: Vision Difficulty
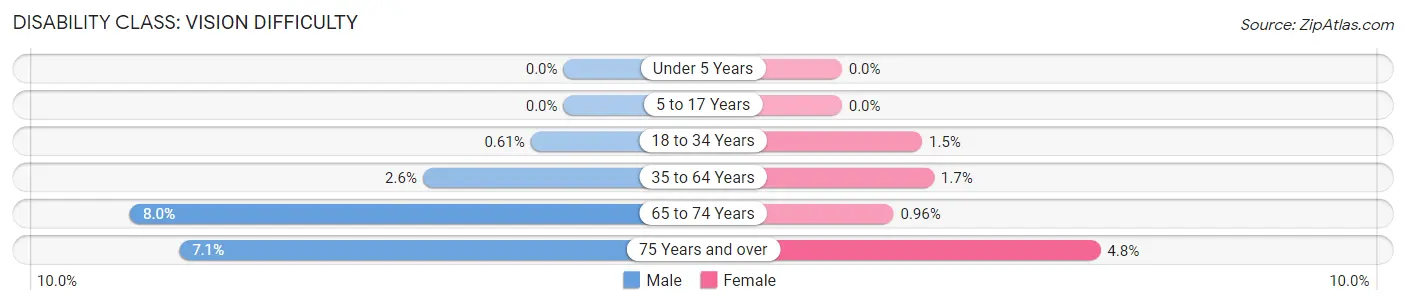
| Age Bracket | Male | Female |
| Under 5 Years | 0 (0.0%) | 0 (0.0%) |
| 5 to 17 Years | 0 (0.0%) | 0 (0.0%) |
| 18 to 34 Years | 9 (0.6%) | 21 (1.5%) |
| 35 to 64 Years | 60 (2.6%) | 47 (1.7%) |
| 65 to 74 Years | 50 (8.0%) | 7 (1.0%) |
| 75 Years and over | 29 (7.1%) | 27 (4.8%) |
Disability Class: Cognitive Difficulty
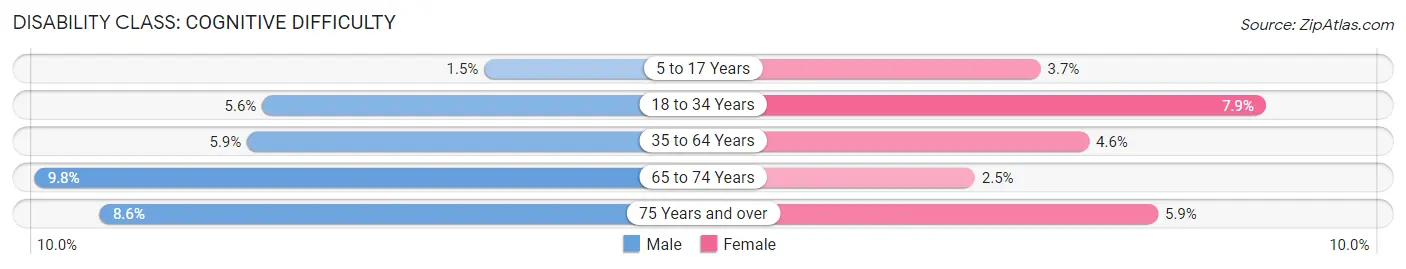
| Age Bracket | Male | Female |
| 5 to 17 Years | 21 (1.5%) | 53 (3.7%) |
| 18 to 34 Years | 83 (5.6%) | 111 (7.9%) |
| 35 to 64 Years | 135 (5.9%) | 126 (4.6%) |
| 65 to 74 Years | 61 (9.8%) | 18 (2.5%) |
| 75 Years and over | 35 (8.6%) | 33 (5.9%) |
Disability Class: Ambulatory Difficulty
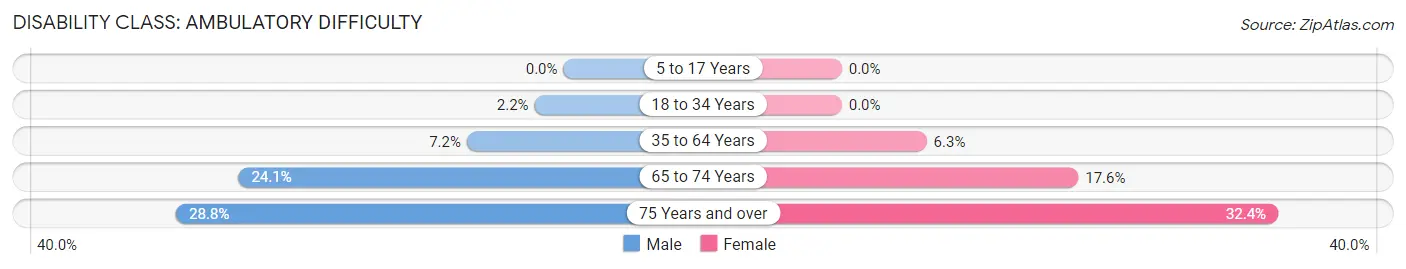
| Age Bracket | Male | Female |
| 5 to 17 Years | 0 (0.0%) | 0 (0.0%) |
| 18 to 34 Years | 32 (2.1%) | 0 (0.0%) |
| 35 to 64 Years | 165 (7.2%) | 173 (6.3%) |
| 65 to 74 Years | 150 (24.1%) | 128 (17.6%) |
| 75 Years and over | 117 (28.7%) | 182 (32.4%) |
Disability Class: Self-Care Difficulty
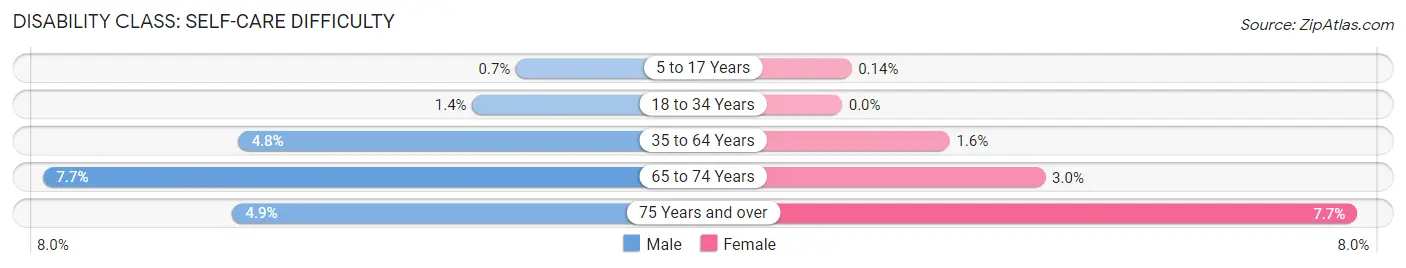
| Age Bracket | Male | Female |
| 5 to 17 Years | 10 (0.7%) | 2 (0.1%) |
| 18 to 34 Years | 20 (1.3%) | 0 (0.0%) |
| 35 to 64 Years | 111 (4.8%) | 44 (1.6%) |
| 65 to 74 Years | 48 (7.7%) | 22 (3.0%) |
| 75 Years and over | 20 (4.9%) | 43 (7.6%) |
Technology Access in Moniteau County
Computing Device Access in Moniteau County
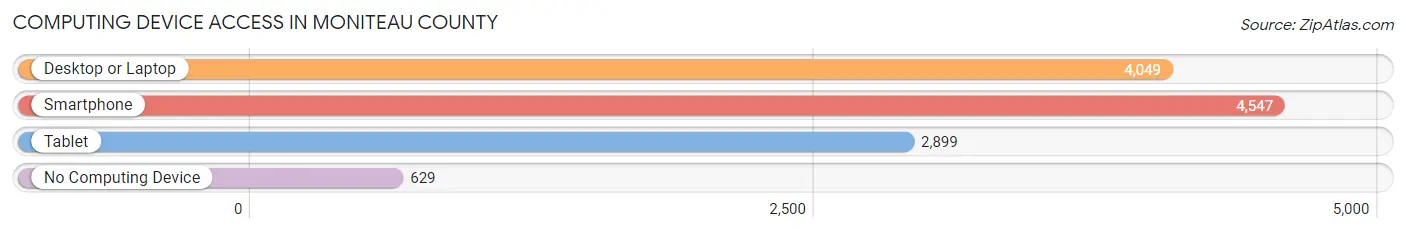
| Device Type | # Households | % Households |
| Desktop or Laptop | 4,049 | 71.2% |
| Smartphone | 4,547 | 79.9% |
| Tablet | 2,899 | 50.9% |
| No Computing Device | 629 | 11.1% |
| Total | 5,691 | 100.0% |
Internet Access in Moniteau County
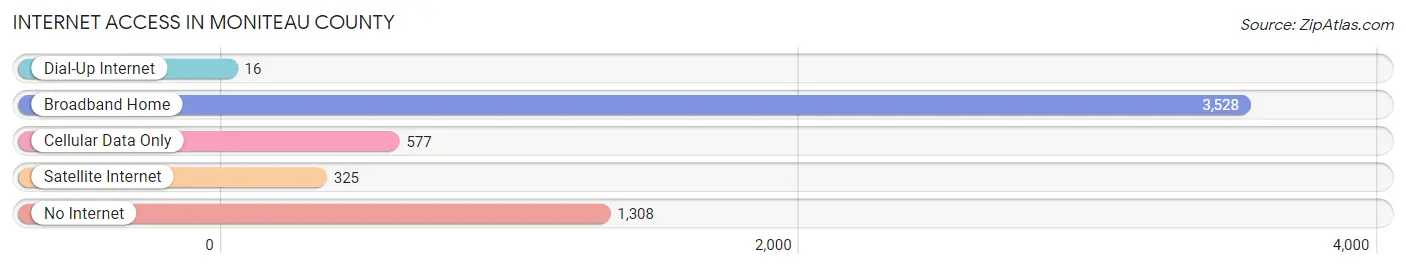
| Internet Type | # Households | % Households |
| Dial-Up Internet | 16 | 0.3% |
| Broadband Home | 3,528 | 62.0% |
| Cellular Data Only | 577 | 10.1% |
| Satellite Internet | 325 | 5.7% |
| No Internet | 1,308 | 23.0% |
| Total | 5,691 | 100.0% |
Moniteau County Summary
Moniteau County is located in the central part of the state of Missouri, in the United States. It is bordered by Cole, Miller, Morgan, and Cooper counties to the north, Boone and Callaway counties to the east, Osage and Gasconade counties to the south, and Morgan and Miller counties to the west. The county seat is California, and the largest city is Tipton.
History
Moniteau County was established in 1845 and named after the Moniteau Creek, which flows through the county. The county was originally part of Cooper County, but was split off in 1845. The county was largely rural until the late 19th century, when the railroad arrived and brought with it an influx of settlers. The county was also home to a large number of German immigrants, who settled in the area in the late 19th and early 20th centuries.
Geography
Moniteau County covers an area of 576 square miles, making it the 33rd largest county in Missouri. The county is located in the central part of the state, and is bordered by Cole, Miller, Morgan, and Cooper counties to the north, Boone and Callaway counties to the east, Osage and Gasconade counties to the south, and Morgan and Miller counties to the west. The county is mostly flat, with some rolling hills in the northern and western parts. The highest point in the county is located in the northwest corner, at an elevation of 1,068 feet.
The county is home to several bodies of water, including the Moniteau Creek, which flows through the county from north to south. Other bodies of water include the Osage River, which forms the county's eastern border, and the Gasconade River, which forms the county's southern border.
Economy
Moniteau County has a largely agricultural economy, with the majority of the population employed in farming and related industries. The county is home to several large farms, and is a major producer of corn, soybeans, wheat, and hay. Other industries in the county include manufacturing, retail, and tourism.
Demographics
As of the 2010 census, Moniteau County had a population of 15,607. The racial makeup of the county was 95.3% White, 1.3% African American, 0.4% Native American, 0.3% Asian, 0.1% Pacific Islander, 1.2% from other races, and 1.4% from two or more races. Hispanic or Latino of any race were 3.2% of the population.
The median household income in the county was $41,945, and the median family income was $50,945. The per capita income was $20,945. About 11.2% of the population was below the poverty line.
Moniteau County is served by the Moniteau County R-1 School District, which includes four elementary schools, one middle school, and one high school. The county is also home to several private schools, including St. Joseph Catholic School and Tipton Christian Academy.
Common Questions
What is Per Capita Income in Moniteau County?
Per Capita income in Moniteau County is $28,546.
What is the Median Family Income in Moniteau County?
Median Family Income in Moniteau County is $83,901.
What is the Median Household income in Moniteau County?
Median Household Income in Moniteau County is $66,792.
What is Income or Wage Gap in Moniteau County?
Income or Wage Gap in Moniteau County is 24.8%.
Women in Moniteau County earn 75.2 cents for every dollar earned by a man.
What is Inequality or Gini Index in Moniteau County?
Inequality or Gini Index in Moniteau County is 0.41.
What is the Total Population of Moniteau County?
Total Population of Moniteau County is 15,401.
What is the Total Male Population of Moniteau County?
Total Male Population of Moniteau County is 7,982.
What is the Total Female Population of Moniteau County?
Total Female Population of Moniteau County is 7,419.
What is the Ratio of Males per 100 Females in Moniteau County?
There are 107.59 Males per 100 Females in Moniteau County.
What is the Ratio of Females per 100 Males in Moniteau County?
There are 92.95 Females per 100 Males in Moniteau County.
What is the Median Population Age in Moniteau County?
Median Population Age in Moniteau County is 37.6 Years.
What is the Average Family Size in Moniteau County
Average Family Size in Moniteau County is 3.1 People.
What is the Average Household Size in Moniteau County
Average Household Size in Moniteau County is 2.5 People.
How Large is the Labor Force in Moniteau County?
There are 6,936 People in the Labor Forcein in Moniteau County.
What is the Percentage of People in the Labor Force in Moniteau County?
57.6% of People are in the Labor Force in Moniteau County.
What is the Unemployment Rate in Moniteau County?
Unemployment Rate in Moniteau County is 3.0%.