Mississippi County, MO Map & Demographics
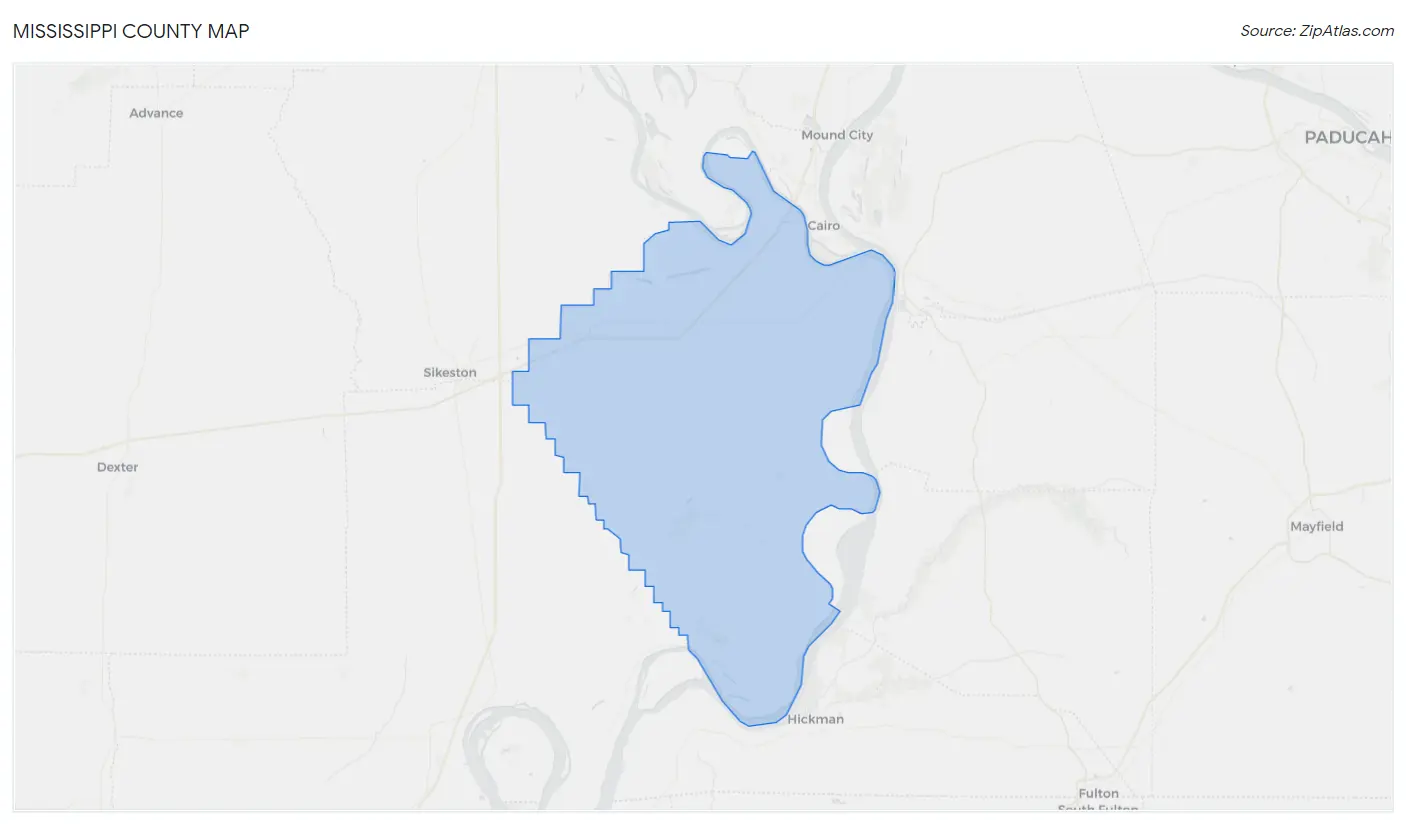
Mississippi County Map
Mississippi County Overview
$21,070
PER CAPITA INCOME
$47,912
AVG FAMILY INCOME
$40,833
AVG HOUSEHOLD INCOME
21.5%
WAGE / INCOME GAP [ % ]
78.5¢/ $1
WAGE / INCOME GAP [ $ ]
$8,800
FAMILY INCOME DEFICIT
0.46
INEQUALITY / GINI INDEX
12,305
TOTAL POPULATION
6,527
MALE POPULATION
5,778
FEMALE POPULATION
112.96
MALES / 100 FEMALES
88.52
FEMALES / 100 MALES
42.1
MEDIAN AGE
2.9
AVG FAMILY SIZE
2.3
AVG HOUSEHOLD SIZE
4,568
LABOR FORCE [ PEOPLE ]
45.6%
PERCENT IN LABOR FORCE
5.1%
UNEMPLOYMENT RATE
Mississippi County Area Codes
Income in Mississippi County
Income Overview in Mississippi County
Per Capita Income in Mississippi County is $21,070, while median incomes of families and households are $47,912 and $40,833 respectively.
| Characteristic | Number | Measure |
| Per Capita Income | 12,305 | $21,070 |
| Median Family Income | 3,025 | $47,912 |
| Mean Family Income | 3,025 | $63,698 |
| Median Household Income | 4,612 | $40,833 |
| Mean Household Income | 4,612 | $54,639 |
| Income Deficit | 3,025 | $8,800 |
| Wage / Income Gap (%) | 12,305 | 21.47% |
| Wage / Income Gap ($) | 12,305 | 78.53¢ per $1 |
| Gini / Inequality Index | 12,305 | 0.46 |
Earnings by Sex in Mississippi County
Average Earnings in Mississippi County are $31,200, $35,131 for men and $27,590 for women, a difference of 21.5%.
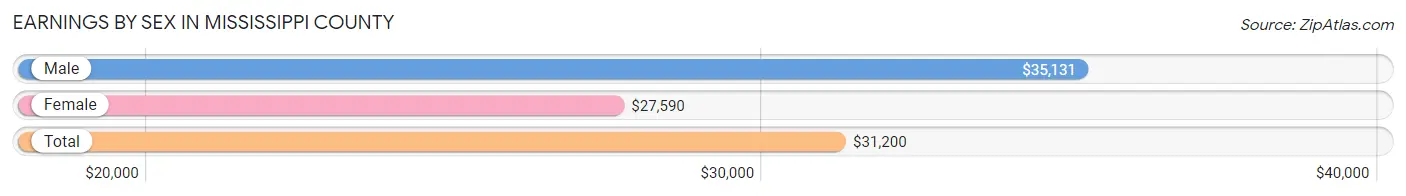
| Sex | Number | Average Earnings |
| Male | 2,762 (55.0%) | $35,131 |
| Female | 2,263 (45.0%) | $27,590 |
| Total | 5,025 (100.0%) | $31,200 |
Earnings by Sex by Income Bracket in Mississippi County
The most common earnings brackets in Mississippi County are $2,499 or less for men (373 | 13.5%) and $30,000 to $34,999 for women (294 | 13.0%).
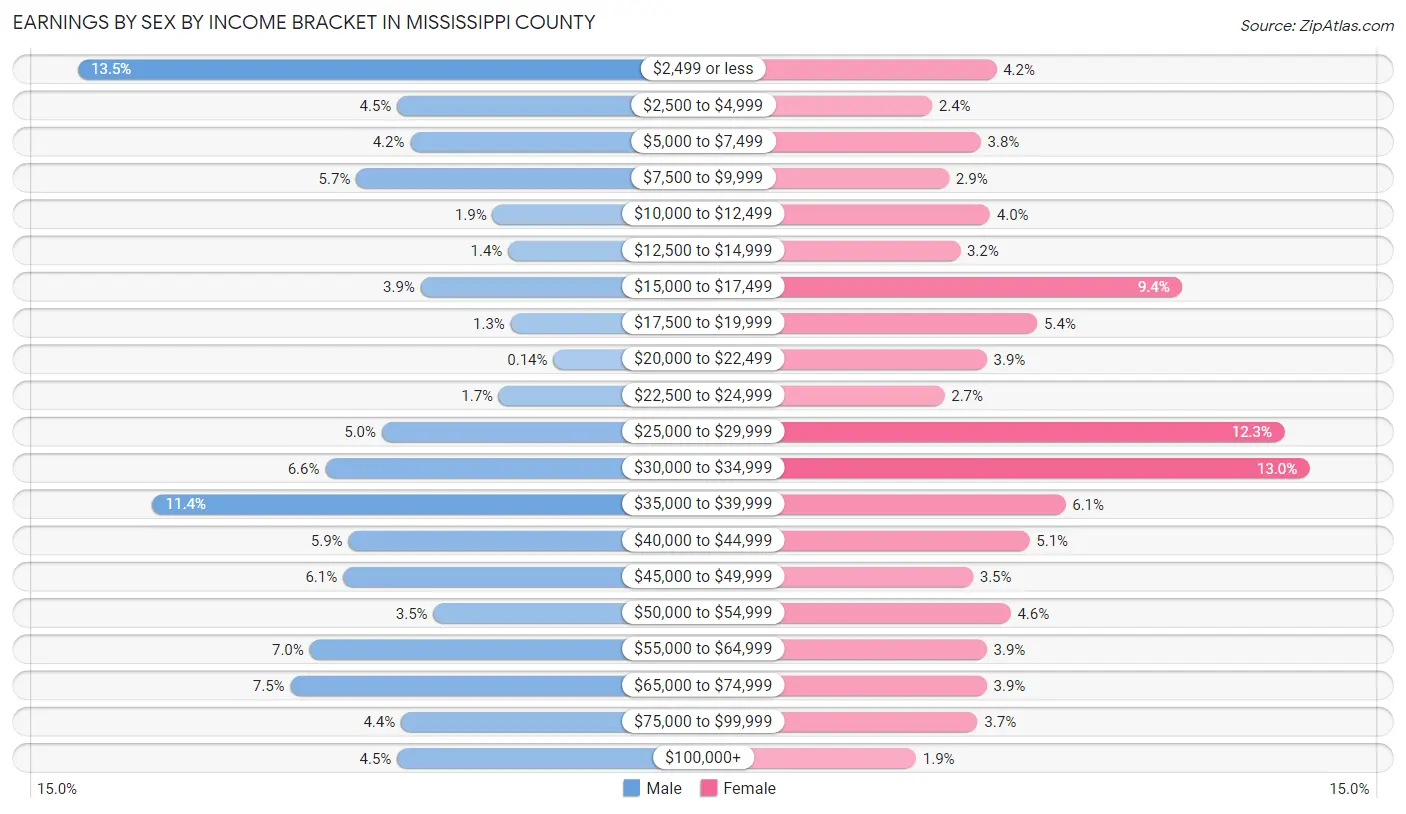
| Income | Male | Female |
| $2,499 or less | 373 (13.5%) | 95 (4.2%) |
| $2,500 to $4,999 | 125 (4.5%) | 54 (2.4%) |
| $5,000 to $7,499 | 115 (4.2%) | 85 (3.8%) |
| $7,500 to $9,999 | 157 (5.7%) | 65 (2.9%) |
| $10,000 to $12,499 | 51 (1.8%) | 91 (4.0%) |
| $12,500 to $14,999 | 39 (1.4%) | 72 (3.2%) |
| $15,000 to $17,499 | 107 (3.9%) | 213 (9.4%) |
| $17,500 to $19,999 | 37 (1.3%) | 121 (5.3%) |
| $20,000 to $22,499 | 4 (0.1%) | 89 (3.9%) |
| $22,500 to $24,999 | 46 (1.7%) | 62 (2.7%) |
| $25,000 to $29,999 | 137 (5.0%) | 278 (12.3%) |
| $30,000 to $34,999 | 181 (6.6%) | 294 (13.0%) |
| $35,000 to $39,999 | 315 (11.4%) | 139 (6.1%) |
| $40,000 to $44,999 | 163 (5.9%) | 116 (5.1%) |
| $45,000 to $49,999 | 167 (6.0%) | 80 (3.5%) |
| $50,000 to $54,999 | 97 (3.5%) | 104 (4.6%) |
| $55,000 to $64,999 | 193 (7.0%) | 89 (3.9%) |
| $65,000 to $74,999 | 208 (7.5%) | 89 (3.9%) |
| $75,000 to $99,999 | 122 (4.4%) | 83 (3.7%) |
| $100,000+ | 125 (4.5%) | 44 (1.9%) |
| Total | 2,762 (100.0%) | 2,263 (100.0%) |
Earnings by Sex by Educational Attainment in Mississippi County
Average earnings in Mississippi County are $38,218 for men and $30,603 for women, a difference of 19.9%. Men with an educational attainment of college or associate's degree enjoy the highest average annual earnings of $56,838, while those with less than high school education earn the least with $26,689. Women with an educational attainment of graduate degree earn the most with the average annual earnings of $49,375, while those with high school diploma education have the smallest earnings of $25,759.
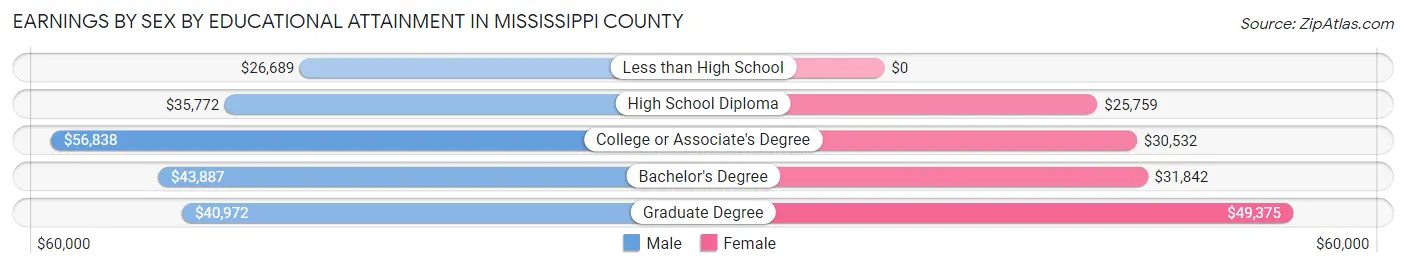
| Educational Attainment | Male Income | Female Income |
| Less than High School | $26,689 | $0 |
| High School Diploma | $35,772 | $25,759 |
| College or Associate's Degree | $56,838 | $30,532 |
| Bachelor's Degree | $43,887 | $31,842 |
| Graduate Degree | $40,972 | $49,375 |
| Total | $38,218 | $30,603 |
Family Income in Mississippi County
Family Income Brackets in Mississippi County
According to the Mississippi County family income data, there are 544 families falling into the $35,000 to $49,999 income range, which is the most common income bracket and makes up 18.0% of all families. Conversely, the $200,000+ income bracket is the least frequent group with only 45 families (1.5%) belonging to this category.
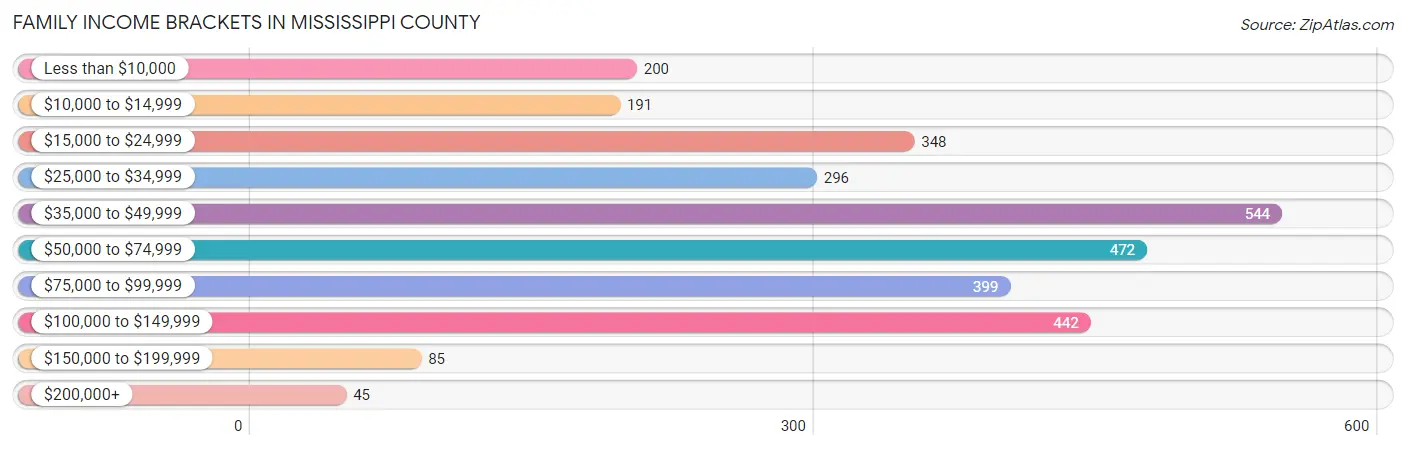
| Income Bracket | # Families | % Families |
| Less than $10,000 | 200 | 6.6% |
| $10,000 to $14,999 | 191 | 6.3% |
| $15,000 to $24,999 | 348 | 11.5% |
| $25,000 to $34,999 | 296 | 9.8% |
| $35,000 to $49,999 | 544 | 18.0% |
| $50,000 to $74,999 | 472 | 15.6% |
| $75,000 to $99,999 | 399 | 13.2% |
| $100,000 to $149,999 | 442 | 14.6% |
| $150,000 to $199,999 | 85 | 2.8% |
| $200,000+ | 45 | 1.5% |
Family Income by Famaliy Size in Mississippi County
7+ person families (19 | 0.6%) account for the highest median family income in Mississippi County with $96,875 per family, while 2-person families (1,673 | 55.3%) have the highest median income of $22,104 per family member.
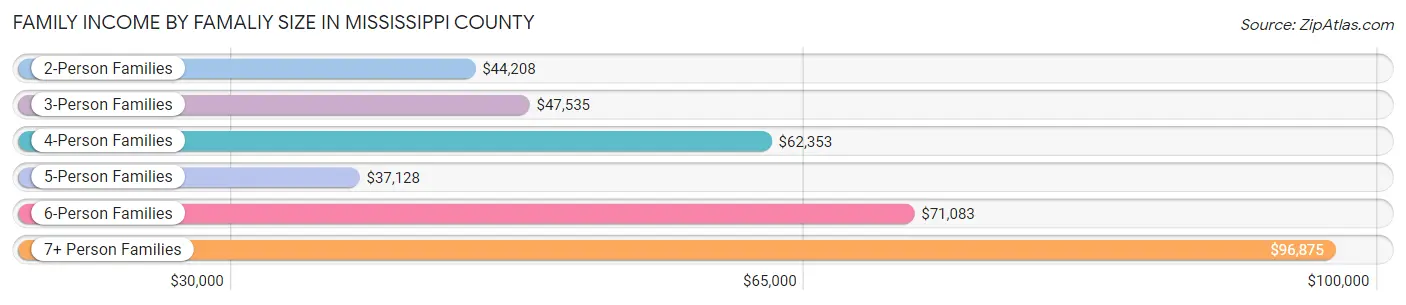
| Income Bracket | # Families | Median Income |
| 2-Person Families | 1,673 (55.3%) | $44,208 |
| 3-Person Families | 609 (20.1%) | $47,535 |
| 4-Person Families | 534 (17.6%) | $62,353 |
| 5-Person Families | 143 (4.7%) | $37,128 |
| 6-Person Families | 47 (1.5%) | $71,083 |
| 7+ Person Families | 19 (0.6%) | $96,875 |
| Total | 3,025 (100.0%) | $47,912 |
Family Income by Number of Earners in Mississippi County
The median family income in Mississippi County is $47,912, with families comprising 3+ earners (136) having the highest median family income of $103,125, while families with no earners (718) have the lowest median family income of $18,923, accounting for 4.5% and 23.7% of families, respectively.
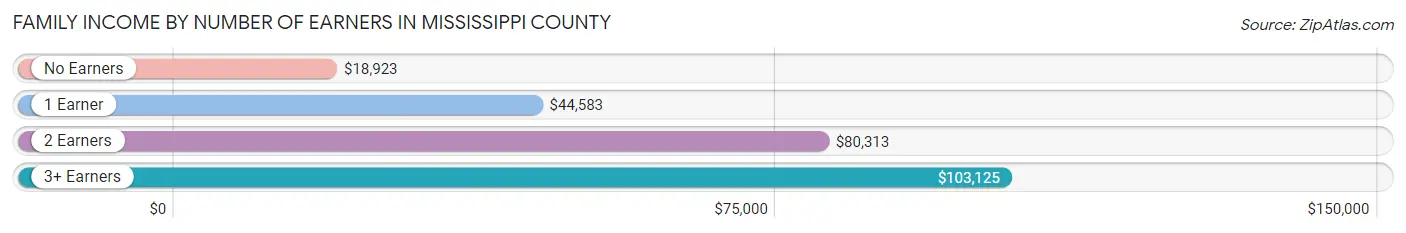
| Number of Earners | # Families | Median Income |
| No Earners | 718 (23.7%) | $18,923 |
| 1 Earner | 1,139 (37.7%) | $44,583 |
| 2 Earners | 1,032 (34.1%) | $80,313 |
| 3+ Earners | 136 (4.5%) | $103,125 |
| Total | 3,025 (100.0%) | $47,912 |
Household Income in Mississippi County
Household Income Brackets in Mississippi County
With 775 households falling in the category, the $15,000 to $24,999 income range is the most frequent in Mississippi County, accounting for 16.8% of all households. In contrast, only 55 households (1.2%) fall into the $200,000+ income bracket, making it the least populous group.
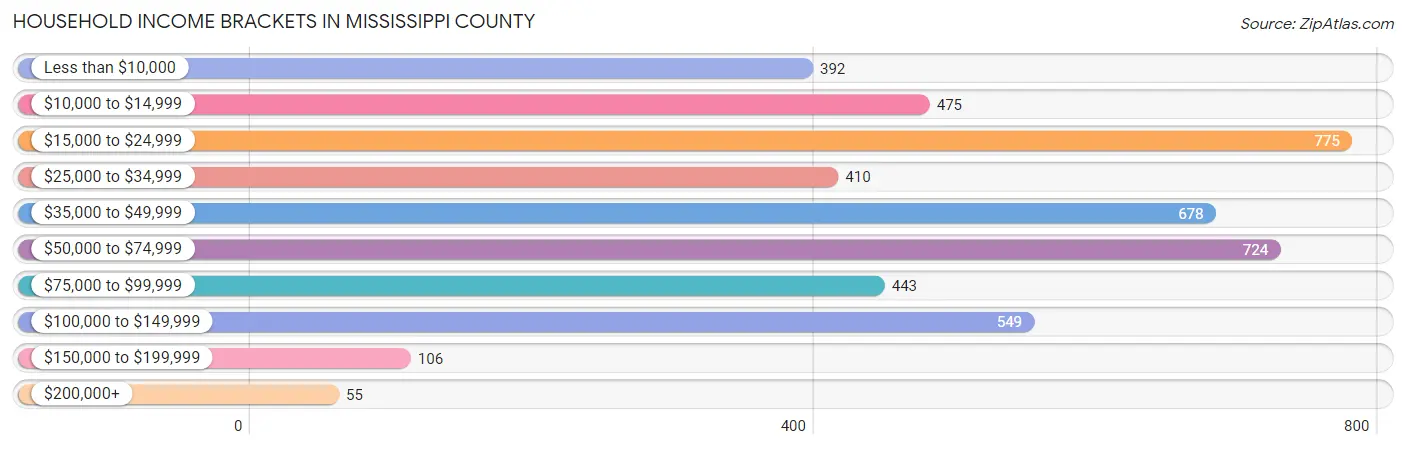
| Income Bracket | # Households | % Households |
| Less than $10,000 | 392 | 8.5% |
| $10,000 to $14,999 | 475 | 10.3% |
| $15,000 to $24,999 | 775 | 16.8% |
| $25,000 to $34,999 | 410 | 8.9% |
| $35,000 to $49,999 | 678 | 14.7% |
| $50,000 to $74,999 | 724 | 15.7% |
| $75,000 to $99,999 | 443 | 9.6% |
| $100,000 to $149,999 | 549 | 11.9% |
| $150,000 to $199,999 | 106 | 2.3% |
| $200,000+ | 55 | 1.2% |
Household Income by Householder Age in Mississippi County
The median household income in Mississippi County is $40,833, with the highest median household income of $46,386 found in the 45 to 64 years age bracket for the primary householder. A total of 1,623 households (35.2%) fall into this category. Meanwhile, the 65+ years age bracket for the primary householder has the lowest median household income of $32,039, with 1,498 households (32.5%) in this group.
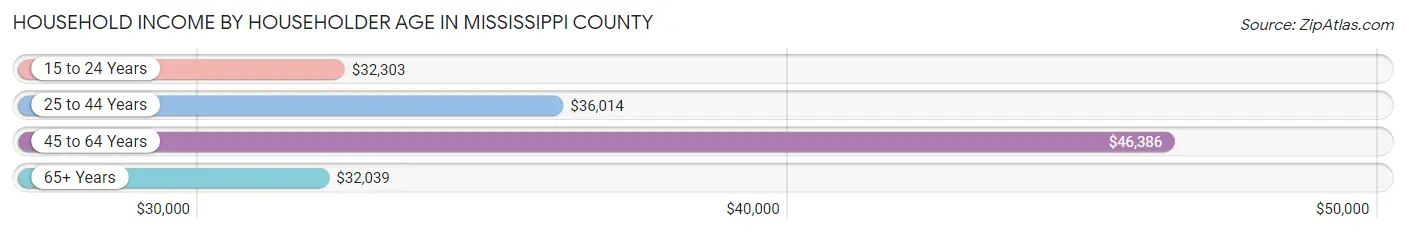
| Income Bracket | # Households | Median Income |
| 15 to 24 Years | 79 (1.7%) | $32,303 |
| 25 to 44 Years | 1,412 (30.6%) | $36,014 |
| 45 to 64 Years | 1,623 (35.2%) | $46,386 |
| 65+ Years | 1,498 (32.5%) | $32,039 |
| Total | 4,612 (100.0%) | $40,833 |
Poverty in Mississippi County
Income Below Poverty by Sex and Age in Mississippi County
With 22.8% poverty level for males and 24.5% for females among the residents of Mississippi County, 18 to 24 year old males and under 5 year old females are the most vulnerable to poverty, with 189 males (43.9%) and 151 females (57.9%) in their respective age groups living below the poverty level.
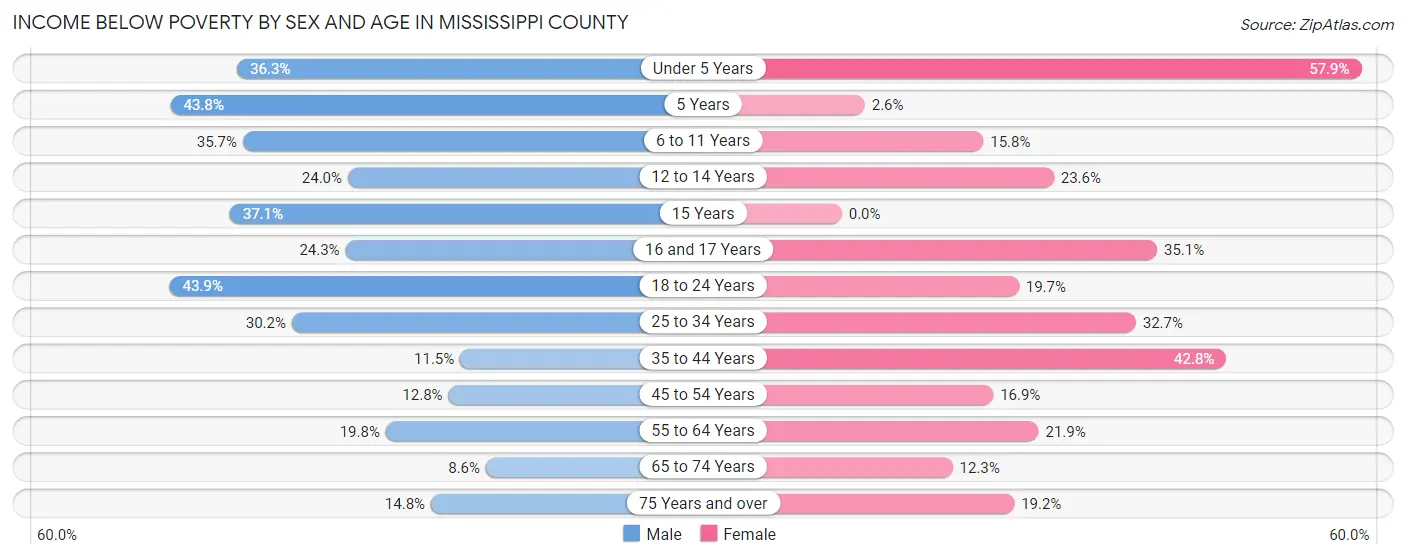
| Age Bracket | Male | Female |
| Under 5 Years | 121 (36.3%) | 151 (57.9%) |
| 5 Years | 7 (43.8%) | 2 (2.6%) |
| 6 to 11 Years | 166 (35.7%) | 64 (15.8%) |
| 12 to 14 Years | 90 (24.0%) | 51 (23.6%) |
| 15 Years | 13 (37.1%) | 0 (0.0%) |
| 16 and 17 Years | 58 (24.3%) | 66 (35.1%) |
| 18 to 24 Years | 189 (43.9%) | 83 (19.7%) |
| 25 to 34 Years | 163 (30.2%) | 203 (32.7%) |
| 35 to 44 Years | 69 (11.5%) | 300 (42.8%) |
| 45 to 54 Years | 84 (12.8%) | 115 (16.9%) |
| 55 to 64 Years | 107 (19.8%) | 174 (21.9%) |
| 65 to 74 Years | 46 (8.6%) | 93 (12.3%) |
| 75 Years and over | 54 (14.7%) | 91 (19.2%) |
| Total | 1,167 (22.8%) | 1,393 (24.5%) |
Income Above Poverty by Sex and Age in Mississippi County
According to the poverty statistics in Mississippi County, males aged 65 to 74 years and females aged 15 years are the age groups that are most secure financially, with 91.4% of males and 100.0% of females in these age groups living above the poverty line.
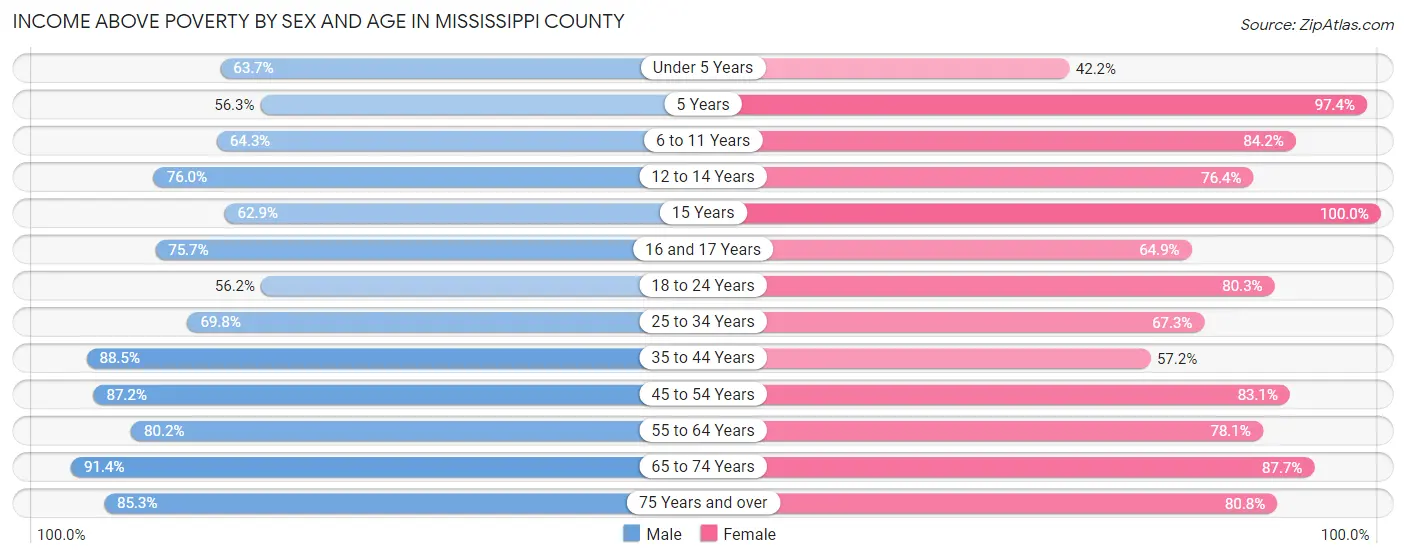
| Age Bracket | Male | Female |
| Under 5 Years | 212 (63.7%) | 110 (42.1%) |
| 5 Years | 9 (56.2%) | 76 (97.4%) |
| 6 to 11 Years | 299 (64.3%) | 342 (84.2%) |
| 12 to 14 Years | 285 (76.0%) | 165 (76.4%) |
| 15 Years | 22 (62.9%) | 99 (100.0%) |
| 16 and 17 Years | 181 (75.7%) | 122 (64.9%) |
| 18 to 24 Years | 242 (56.1%) | 338 (80.3%) |
| 25 to 34 Years | 376 (69.8%) | 417 (67.3%) |
| 35 to 44 Years | 531 (88.5%) | 401 (57.2%) |
| 45 to 54 Years | 572 (87.2%) | 567 (83.1%) |
| 55 to 64 Years | 434 (80.2%) | 620 (78.1%) |
| 65 to 74 Years | 487 (91.4%) | 661 (87.7%) |
| 75 Years and over | 312 (85.3%) | 383 (80.8%) |
| Total | 3,962 (77.2%) | 4,301 (75.5%) |
Income Below Poverty Among Married-Couple Families in Mississippi County
The poverty statistics for married-couple families in Mississippi County show that 5.4% or 107 of the total 1,994 families live below the poverty line. Families with 5 or more children have the highest poverty rate of 100.0%, comprising of 2 families. On the other hand, families with 1 or 2 children have the lowest poverty rate of 3.7%, which includes 22 families.
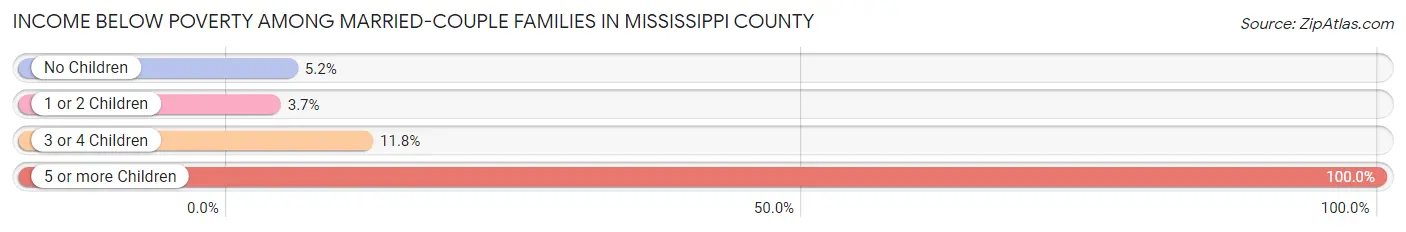
| Children | Above Poverty | Below Poverty |
| No Children | 1,182 (94.8%) | 65 (5.2%) |
| 1 or 2 Children | 570 (96.3%) | 22 (3.7%) |
| 3 or 4 Children | 135 (88.2%) | 18 (11.8%) |
| 5 or more Children | 0 (0.0%) | 2 (100.0%) |
| Total | 1,887 (94.6%) | 107 (5.4%) |
Income Below Poverty Among Single-Parent Households in Mississippi County
According to the poverty data in Mississippi County, 59.4% or 152 single-father households and 49.3% or 382 single-mother households are living below the poverty line. Among single-father households, those with no children have the highest poverty rate, with 69 households (65.1%) experiencing poverty. Likewise, among single-mother households, those with 1 or 2 children have the highest poverty rate, with 244 households (58.5%) falling below the poverty line.
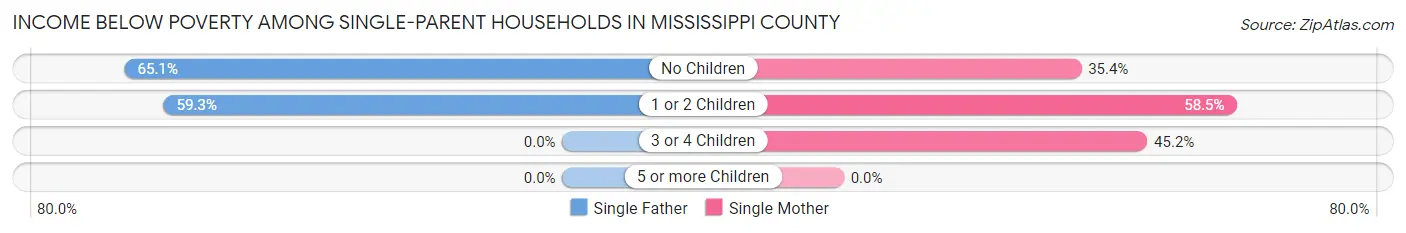
| Children | Single Father | Single Mother |
| No Children | 69 (65.1%) | 86 (35.4%) |
| 1 or 2 Children | 83 (59.3%) | 244 (58.5%) |
| 3 or 4 Children | 0 (0.0%) | 52 (45.2%) |
| 5 or more Children | 0 (0.0%) | 0 (0.0%) |
| Total | 152 (59.4%) | 382 (49.3%) |
Income Below Poverty Among Married-Couple vs Single-Parent Households in Mississippi County
The poverty data for Mississippi County shows that 107 of the married-couple family households (5.4%) and 534 of the single-parent households (51.8%) are living below the poverty level. Within the married-couple family households, those with 5 or more children have the highest poverty rate, with 2 households (100.0%) falling below the poverty line. Among the single-parent households, those with 1 or 2 children have the highest poverty rate, with 327 household (58.7%) living below poverty.
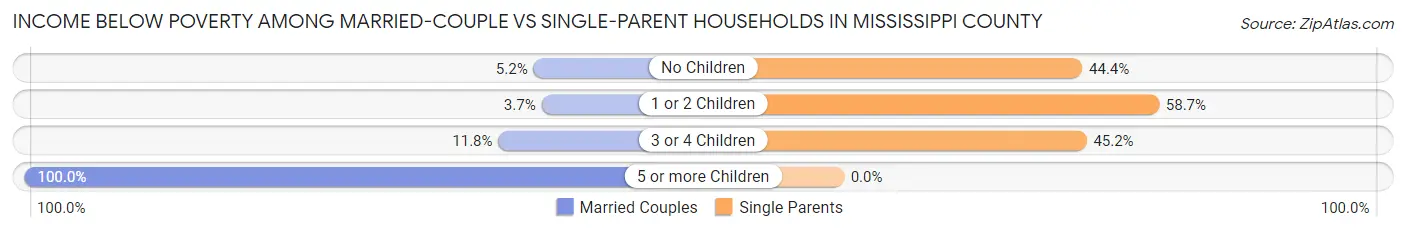
| Children | Married-Couple Families | Single-Parent Households |
| No Children | 65 (5.2%) | 155 (44.4%) |
| 1 or 2 Children | 22 (3.7%) | 327 (58.7%) |
| 3 or 4 Children | 18 (11.8%) | 52 (45.2%) |
| 5 or more Children | 2 (100.0%) | 0 (0.0%) |
| Total | 107 (5.4%) | 534 (51.8%) |
Race in Mississippi County
The most populous races in Mississippi County are White / Caucasian (8,800 | 71.5%), Black / African American (2,970 | 24.1%), and Two or more Races (525 | 4.3%).
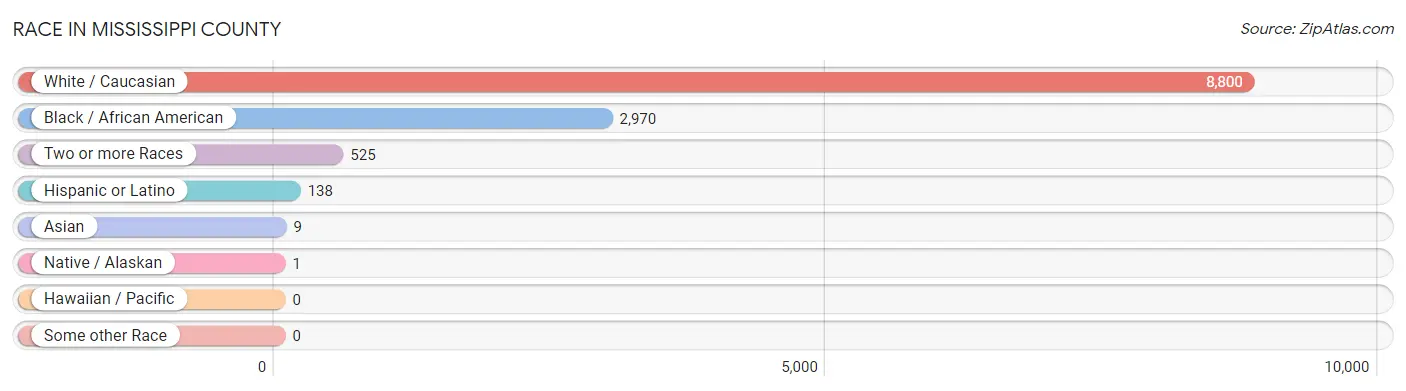
| Race | # Population | % Population |
| Asian | 9 | 0.1% |
| Black / African American | 2,970 | 24.1% |
| Hawaiian / Pacific | 0 | 0.0% |
| Hispanic or Latino | 138 | 1.1% |
| Native / Alaskan | 1 | 0.0% |
| White / Caucasian | 8,800 | 71.5% |
| Two or more Races | 525 | 4.3% |
| Some other Race | 0 | 0.0% |
| Total | 12,305 | 100.0% |
Ancestry in Mississippi County
The most populous ancestries reported in Mississippi County are American (1,373 | 11.2%), English (1,132 | 9.2%), German (925 | 7.5%), Irish (886 | 7.2%), and Scottish (368 | 3.0%), together accounting for 38.1% of all Mississippi County residents.
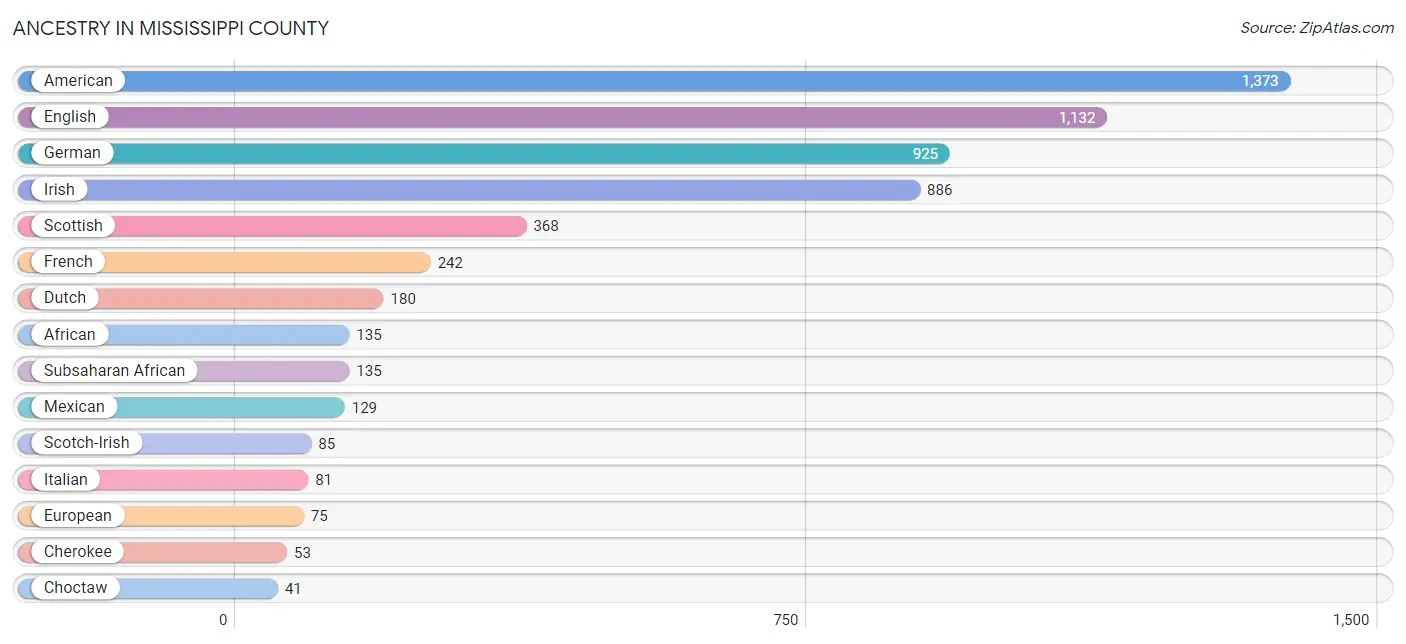
| Ancestry | # Population | % Population |
| African | 135 | 1.1% |
| American | 1,373 | 11.2% |
| Apache | 12 | 0.1% |
| Arab | 12 | 0.1% |
| Blackfeet | 30 | 0.2% |
| British | 26 | 0.2% |
| Bulgarian | 4 | 0.0% |
| Canadian | 4 | 0.0% |
| Cherokee | 53 | 0.4% |
| Choctaw | 41 | 0.3% |
| Creek | 1 | 0.0% |
| Czech | 7 | 0.1% |
| Danish | 6 | 0.1% |
| Dutch | 180 | 1.5% |
| Eastern European | 3 | 0.0% |
| English | 1,132 | 9.2% |
| European | 75 | 0.6% |
| French | 242 | 2.0% |
| German | 925 | 7.5% |
| Greek | 29 | 0.2% |
| Iranian | 7 | 0.1% |
| Irish | 886 | 7.2% |
| Italian | 81 | 0.7% |
| Mexican | 129 | 1.1% |
| Moroccan | 12 | 0.1% |
| Norwegian | 11 | 0.1% |
| Pakistani | 9 | 0.1% |
| Polish | 21 | 0.2% |
| Puerto Rican | 9 | 0.1% |
| Russian | 2 | 0.0% |
| Scandinavian | 6 | 0.1% |
| Scotch-Irish | 85 | 0.7% |
| Scottish | 368 | 3.0% |
| Sioux | 15 | 0.1% |
| Subsaharan African | 135 | 1.1% |
| Swiss | 8 | 0.1% |
| Welsh | 11 | 0.1% | View All 37 Rows |
Immigrants in Mississippi County
The most numerous immigrant groups reported in Mississippi County came from Central America (64 | 0.5%), Latin America (64 | 0.5%), Mexico (64 | 0.5%), Asia (9 | 0.1%), and South Eastern Asia (9 | 0.1%), together accounting for 1.7% of all Mississippi County residents.
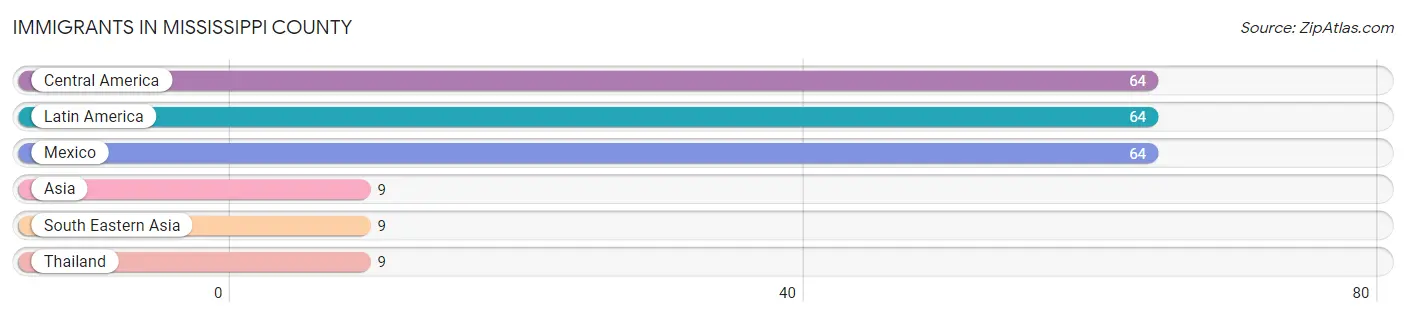
| Immigration Origin | # Population | % Population |
| Asia | 9 | 0.1% |
| Central America | 64 | 0.5% |
| Latin America | 64 | 0.5% |
| Mexico | 64 | 0.5% |
| South Eastern Asia | 9 | 0.1% |
| Thailand | 9 | 0.1% | View All 6 Rows |
Sex and Age in Mississippi County
Sex and Age in Mississippi County
The most populous age groups in Mississippi County are 10 to 14 Years (653 | 10.0%) for men and 65 to 69 Years (445 | 7.7%) for women.
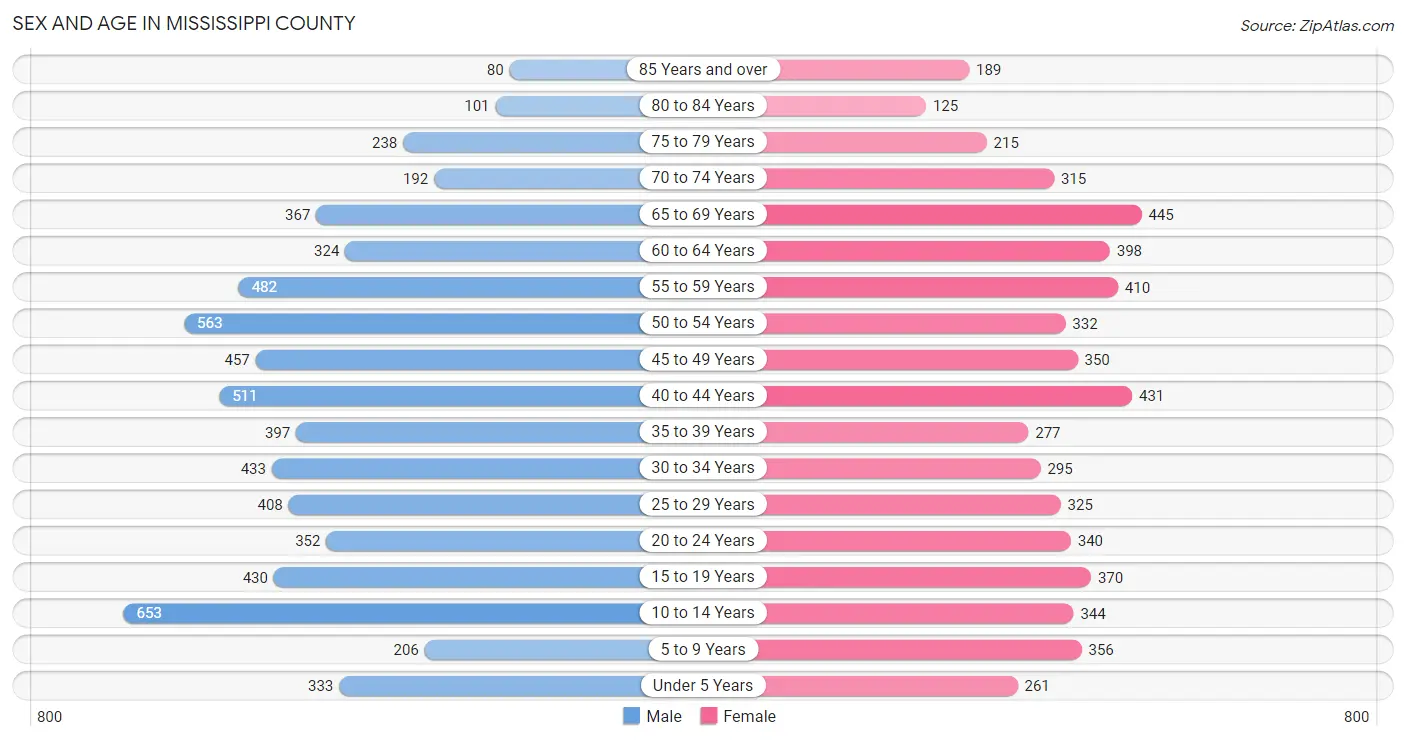
| Age Bracket | Male | Female |
| Under 5 Years | 333 (5.1%) | 261 (4.5%) |
| 5 to 9 Years | 206 (3.2%) | 356 (6.2%) |
| 10 to 14 Years | 653 (10.0%) | 344 (5.9%) |
| 15 to 19 Years | 430 (6.6%) | 370 (6.4%) |
| 20 to 24 Years | 352 (5.4%) | 340 (5.9%) |
| 25 to 29 Years | 408 (6.2%) | 325 (5.6%) |
| 30 to 34 Years | 433 (6.6%) | 295 (5.1%) |
| 35 to 39 Years | 397 (6.1%) | 277 (4.8%) |
| 40 to 44 Years | 511 (7.8%) | 431 (7.5%) |
| 45 to 49 Years | 457 (7.0%) | 350 (6.1%) |
| 50 to 54 Years | 563 (8.6%) | 332 (5.8%) |
| 55 to 59 Years | 482 (7.4%) | 410 (7.1%) |
| 60 to 64 Years | 324 (5.0%) | 398 (6.9%) |
| 65 to 69 Years | 367 (5.6%) | 445 (7.7%) |
| 70 to 74 Years | 192 (2.9%) | 315 (5.4%) |
| 75 to 79 Years | 238 (3.6%) | 215 (3.7%) |
| 80 to 84 Years | 101 (1.5%) | 125 (2.2%) |
| 85 Years and over | 80 (1.2%) | 189 (3.3%) |
| Total | 6,527 (100.0%) | 5,778 (100.0%) |
Families and Households in Mississippi County
Median Family Size in Mississippi County
The median family size in Mississippi County is 2.90 persons per family, with single female/mother families (775 | 25.6%) accounting for the largest median family size of 2.97 persons per family. On the other hand, single male/father families (256 | 8.5%) represent the smallest median family size with 2.30 persons per family.
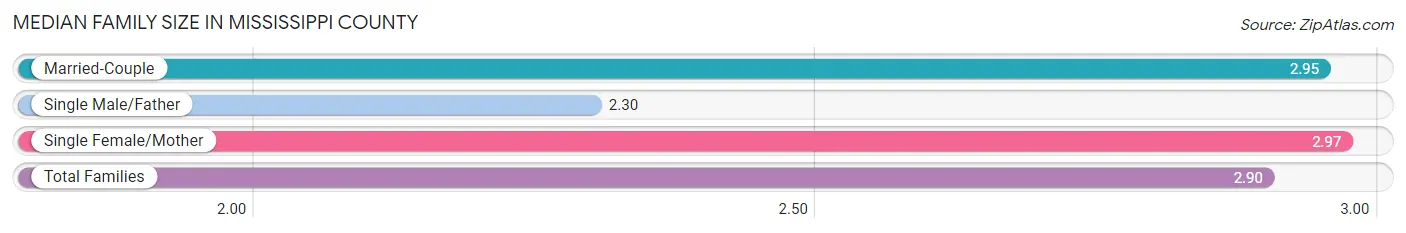
| Family Type | # Families | Family Size |
| Married-Couple | 1,994 (65.9%) | 2.95 |
| Single Male/Father | 256 (8.5%) | 2.30 |
| Single Female/Mother | 775 (25.6%) | 2.97 |
| Total Families | 3,025 (100.0%) | 2.90 |
Median Household Size in Mississippi County
The median household size in Mississippi County is 2.34 persons per household, with single female/mother households (775 | 16.8%) accounting for the largest median household size of 3.14 persons per household. non-family households (1,587 | 34.4%) represent the smallest median household size with 1.11 persons per household.
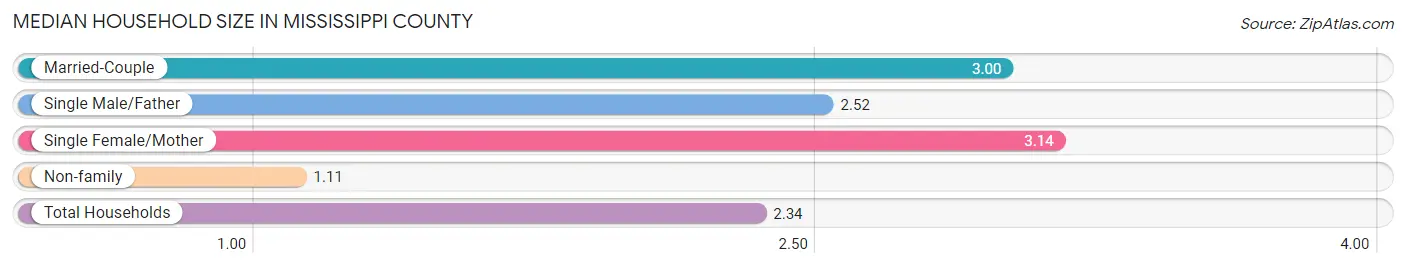
| Household Type | # Households | Household Size |
| Married-Couple | 1,994 (43.2%) | 3.00 |
| Single Male/Father | 256 (5.6%) | 2.52 |
| Single Female/Mother | 775 (16.8%) | 3.14 |
| Non-family | 1,587 (34.4%) | 1.11 |
| Total Households | 4,612 (100.0%) | 2.34 |
Household Size by Marriage Status in Mississippi County
Out of a total of 4,612 households in Mississippi County, 3,025 (65.6%) are family households, while 1,587 (34.4%) are nonfamily households. The most numerous type of family households are 2-person households, comprising 1,594, and the most common type of nonfamily households are 1-person households, comprising 1,424.
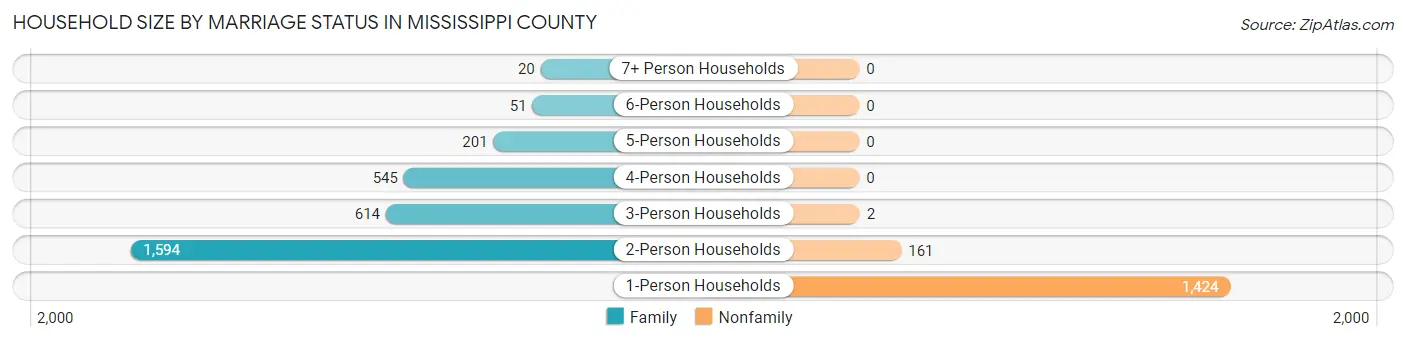
| Household Size | Family Households | Nonfamily Households |
| 1-Person Households | - | 1,424 (30.9%) |
| 2-Person Households | 1,594 (34.6%) | 161 (3.5%) |
| 3-Person Households | 614 (13.3%) | 2 (0.0%) |
| 4-Person Households | 545 (11.8%) | 0 (0.0%) |
| 5-Person Households | 201 (4.4%) | 0 (0.0%) |
| 6-Person Households | 51 (1.1%) | 0 (0.0%) |
| 7+ Person Households | 20 (0.4%) | 0 (0.0%) |
| Total | 3,025 (65.6%) | 1,587 (34.4%) |
Female Fertility in Mississippi County
Fertility by Age in Mississippi County
Average fertility rate in Mississippi County is 60.0 births per 1,000 women. Women in the age bracket of 20 to 34 years have the highest fertility rate with 153.0 births per 1,000 women. Women in the age bracket of 20 to 34 years acount for 98.0% of all women with births.
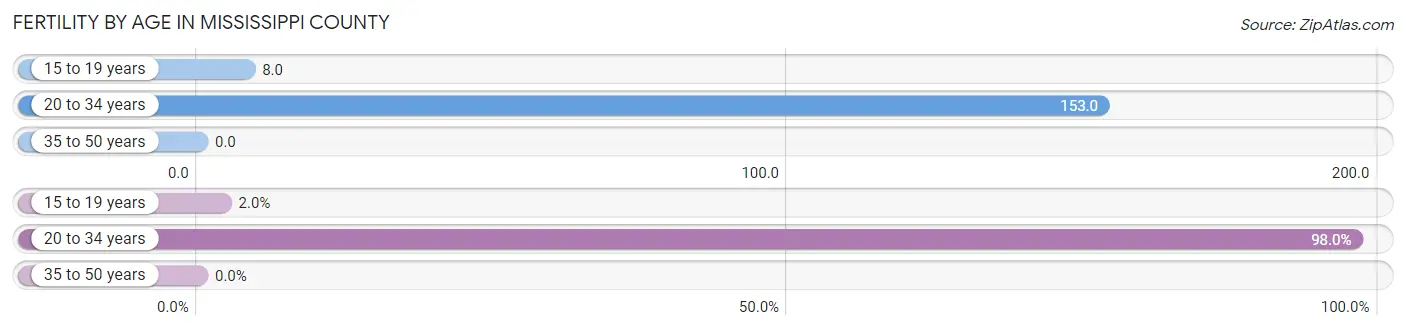
| Age Bracket | Women with Births | Births / 1,000 Women |
| 15 to 19 years | 3 (2.0%) | 8.0 |
| 20 to 34 years | 147 (98.0%) | 153.0 |
| 35 to 50 years | 0 (0.0%) | 0.0 |
| Total | 150 (100.0%) | 60.0 |
Fertility by Age by Marriage Status in Mississippi County
47.3% of women with births (150) in Mississippi County are married. The highest percentage of unmarried women with births falls into 15 to 19 years age bracket with 100.0% of them unmarried at the time of birth, while the lowest percentage of unmarried women with births belong to 20 to 34 years age bracket with 51.7% of them unmarried.
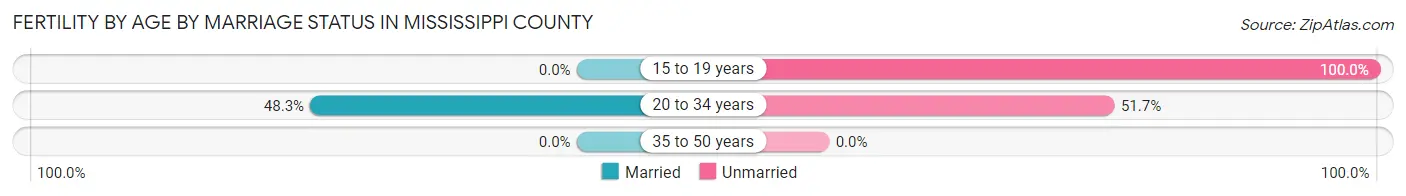
| Age Bracket | Married | Unmarried |
| 15 to 19 years | 0 (0.0%) | 3 (100.0%) |
| 20 to 34 years | 71 (48.3%) | 76 (51.7%) |
| 35 to 50 years | 0 (0.0%) | 0 (0.0%) |
| Total | 71 (47.3%) | 79 (52.7%) |
Fertility by Education in Mississippi County
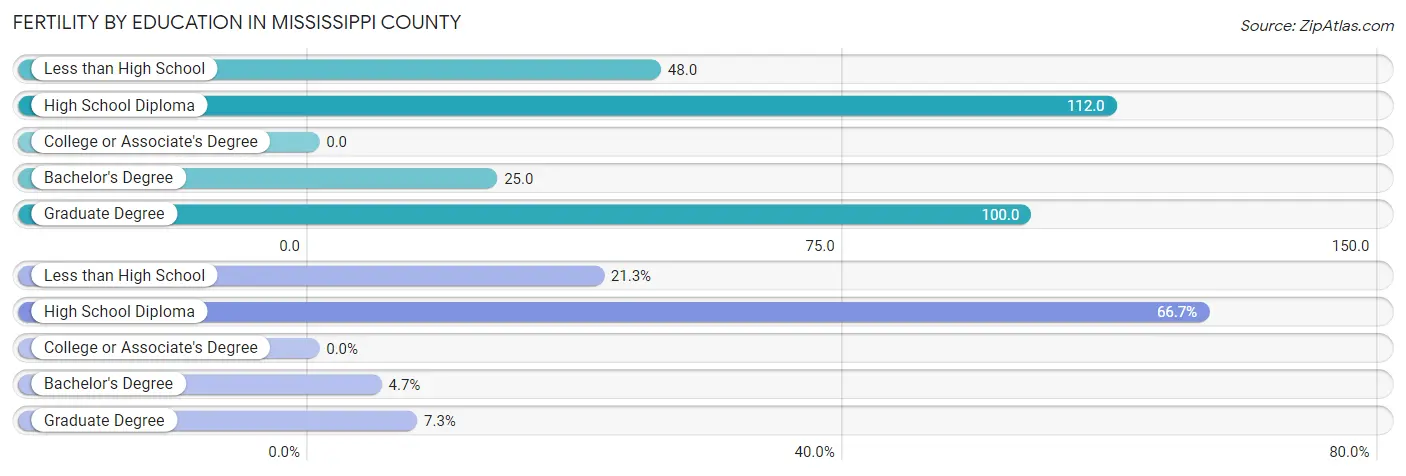
| Educational Attainment | Women with Births | Births / 1,000 Women |
| Less than High School | 32 (21.3%) | 48.0 |
| High School Diploma | 100 (66.7%) | 112.0 |
| College or Associate's Degree | 0 (0.0%) | 0.0 |
| Bachelor's Degree | 7 (4.7%) | 25.0 |
| Graduate Degree | 11 (7.3%) | 100.0 |
| Total | 150 (100.0%) | 60.0 |
Fertility by Education by Marriage Status in Mississippi County
52.7% of women with births in Mississippi County are unmarried. Women with the educational attainment of bachelor's degree are most likely to be married with 100.0% of them married at childbirth, while women with the educational attainment of high school diploma are least likely to be married with 65.0% of them unmarried at childbirth.
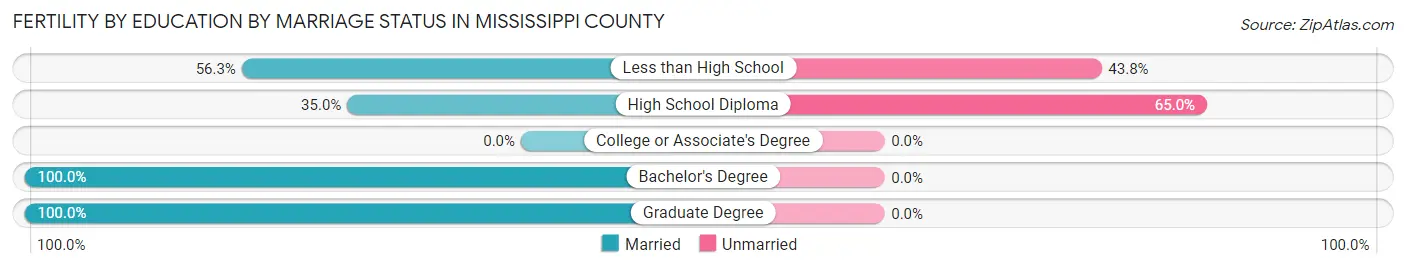
| Educational Attainment | Married | Unmarried |
| Less than High School | 18 (56.2%) | 14 (43.8%) |
| High School Diploma | 35 (35.0%) | 65 (65.0%) |
| College or Associate's Degree | 0 (0.0%) | 0 (0.0%) |
| Bachelor's Degree | 7 (100.0%) | 0 (0.0%) |
| Graduate Degree | 11 (100.0%) | 0 (0.0%) |
| Total | 71 (47.3%) | 79 (52.7%) |
Employment Characteristics in Mississippi County
Employment by Class of Employer in Mississippi County
Among the 4,271 employed individuals in Mississippi County, private company employees (2,958 | 69.3%), state government employees (389 | 9.1%), and local government employees (311 | 7.3%) make up the most common classes of employment.
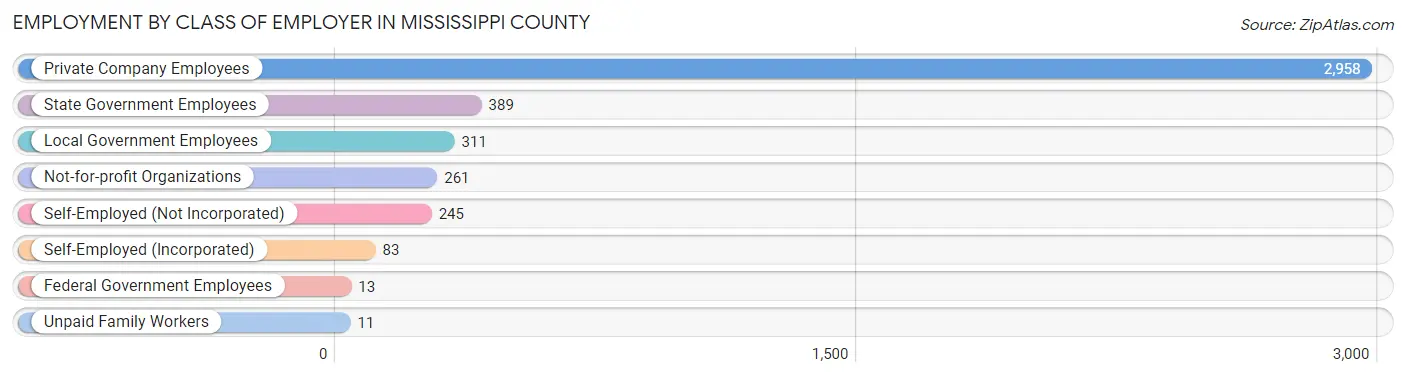
| Employer Class | # Employees | % Employees |
| Private Company Employees | 2,958 | 69.3% |
| Self-Employed (Incorporated) | 83 | 1.9% |
| Self-Employed (Not Incorporated) | 245 | 5.7% |
| Not-for-profit Organizations | 261 | 6.1% |
| Local Government Employees | 311 | 7.3% |
| State Government Employees | 389 | 9.1% |
| Federal Government Employees | 13 | 0.3% |
| Unpaid Family Workers | 11 | 0.3% |
| Total | 4,271 | 100.0% |
Employment Status by Age in Mississippi County
According to the labor force statistics for Mississippi County, out of the total population over 16 years of age (10,017), 45.6% or 4,568 individuals are in the labor force, with 5.1% or 233 of them unemployed. The age group with the highest labor force participation rate is 20 to 24 years, with 71.0% or 491 individuals in the labor force. Within the labor force, the 25 to 29 years age range has the highest percentage of unemployed individuals, with 17.0% or 62 of them being unemployed.
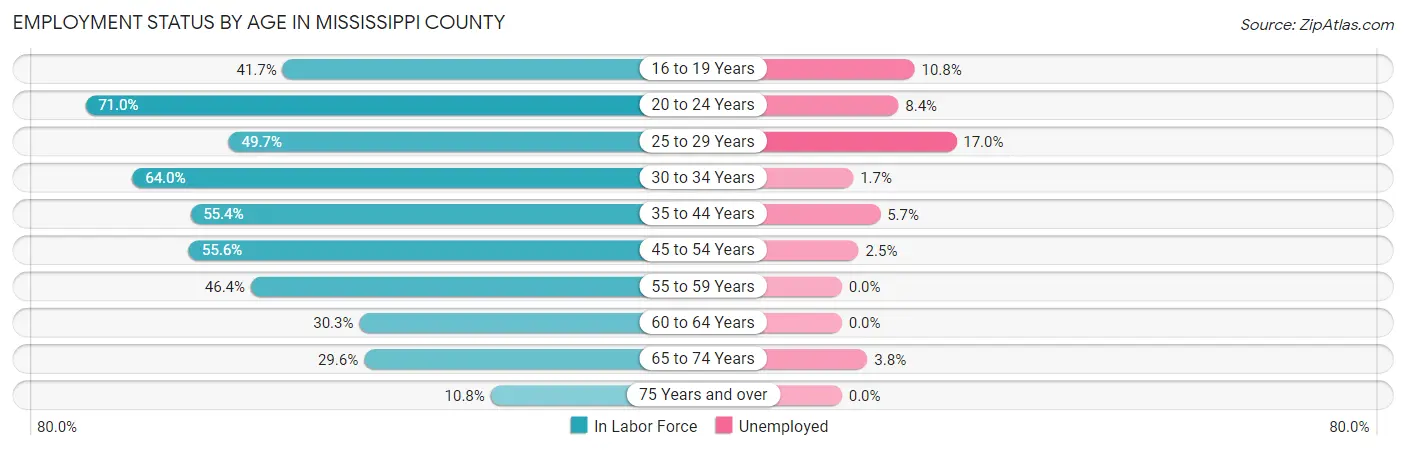
| Age Bracket | In Labor Force | Unemployed |
| 16 to 19 Years | 277 (41.7%) | 30 (10.8%) |
| 20 to 24 Years | 491 (71.0%) | 41 (8.4%) |
| 25 to 29 Years | 364 (49.7%) | 62 (17.0%) |
| 30 to 34 Years | 466 (64.0%) | 8 (1.7%) |
| 35 to 44 Years | 895 (55.4%) | 51 (5.7%) |
| 45 to 54 Years | 946 (55.6%) | 24 (2.5%) |
| 55 to 59 Years | 414 (46.4%) | 0 (0.0%) |
| 60 to 64 Years | 219 (30.3%) | 0 (0.0%) |
| 65 to 74 Years | 390 (29.6%) | 15 (3.8%) |
| 75 Years and over | 102 (10.8%) | 0 (0.0%) |
| Total | 4,568 (45.6%) | 233 (5.1%) |
Employment Status by Educational Attainment in Mississippi County
According to labor force statistics for Mississippi County, 51.7% of individuals (3,305) out of the total population between 25 and 64 years of age (6,393) are in the labor force, with 4.4% or 145 of them being unemployed. The group with the highest labor force participation rate are those with the educational attainment of bachelor's degree or higher, with 84.3% or 684 individuals in the labor force. Within the labor force, individuals with less than high school education have the highest percentage of unemployment, with 12.6% or 44 of them being unemployed.
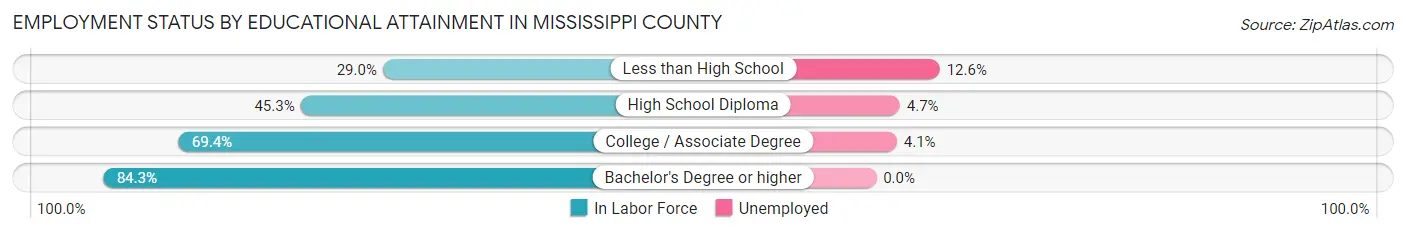
| Educational Attainment | In Labor Force | Unemployed |
| Less than High School | 350 (29.0%) | 152 (12.6%) |
| High School Diploma | 1,439 (45.3%) | 149 (4.7%) |
| College / Associate Degree | 831 (69.4%) | 49 (4.1%) |
| Bachelor's Degree or higher | 684 (84.3%) | 0 (0.0%) |
| Total | 3,305 (51.7%) | 281 (4.4%) |
Employment Occupations by Sex in Mississippi County
Management, Business, Science and Arts Occupations
The most common Management, Business, Science and Arts occupations in Mississippi County are Community & Social Service (387 | 8.9%), Management (335 | 7.7%), Education Instruction & Library (318 | 7.3%), Health Diagnosing & Treating (185 | 4.3%), and Business & Financial (145 | 3.3%).
Management, Business, Science and Arts Occupations by Sex
Within the Management, Business, Science and Arts occupations in Mississippi County, the most male-oriented occupations are Life, Physical & Social Science (100.0%), Management (73.1%), and Education, Arts & Media (51.6%), while the most female-oriented occupations are Computers & Mathematics (100.0%), Legal Services & Support (100.0%), and Arts, Media & Entertainment (100.0%).
| Occupation | Male | Female |
| Management | 245 (73.1%) | 90 (26.9%) |
| Business & Financial | 18 (12.4%) | 127 (87.6%) |
| Computers, Engineering & Science | 8 (40.0%) | 12 (60.0%) |
| Computers & Mathematics | 0 (0.0%) | 12 (100.0%) |
| Architecture & Engineering | 0 (0.0%) | 0 (0.0%) |
| Life, Physical & Social Science | 8 (100.0%) | 0 (0.0%) |
| Community & Social Service | 73 (18.9%) | 314 (81.1%) |
| Education, Arts & Media | 16 (51.6%) | 15 (48.4%) |
| Legal Services & Support | 0 (0.0%) | 23 (100.0%) |
| Education Instruction & Library | 57 (17.9%) | 261 (82.1%) |
| Arts, Media & Entertainment | 0 (0.0%) | 15 (100.0%) |
| Health Diagnosing & Treating | 17 (9.2%) | 168 (90.8%) |
| Health Technologists | 0 (0.0%) | 114 (100.0%) |
| Total (Category) | 361 (33.7%) | 711 (66.3%) |
| Total (Overall) | 2,253 (52.0%) | 2,082 (48.0%) |
Services Occupations
The most common Services occupations in Mississippi County are Healthcare Support (337 | 7.8%), Food Preparation & Serving (231 | 5.3%), Cleaning & Maintenance (173 | 4.0%), Security & Protection (96 | 2.2%), and Firefighting & Prevention (55 | 1.3%).
Services Occupations by Sex
Within the Services occupations in Mississippi County, the most male-oriented occupations are Security & Protection (100.0%), Firefighting & Prevention (100.0%), and Law Enforcement (100.0%), while the most female-oriented occupations are Personal Care & Service (85.4%), Healthcare Support (80.4%), and Food Preparation & Serving (62.8%).
| Occupation | Male | Female |
| Healthcare Support | 66 (19.6%) | 271 (80.4%) |
| Security & Protection | 96 (100.0%) | 0 (0.0%) |
| Firefighting & Prevention | 55 (100.0%) | 0 (0.0%) |
| Law Enforcement | 41 (100.0%) | 0 (0.0%) |
| Food Preparation & Serving | 86 (37.2%) | 145 (62.8%) |
| Cleaning & Maintenance | 76 (43.9%) | 97 (56.1%) |
| Personal Care & Service | 7 (14.6%) | 41 (85.4%) |
| Total (Category) | 331 (37.4%) | 554 (62.6%) |
| Total (Overall) | 2,253 (52.0%) | 2,082 (48.0%) |
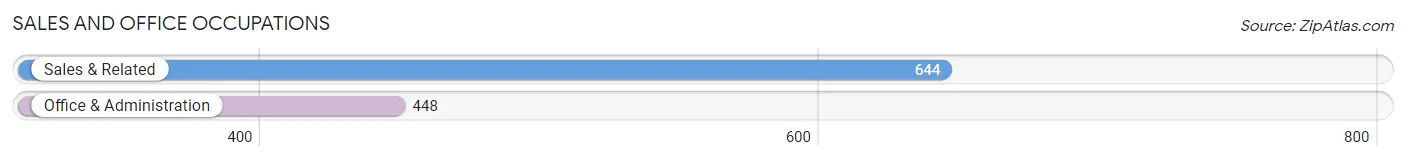
Sales and Office Occupations
The most common Sales and Office occupations in Mississippi County are Sales & Related (644 | 14.9%), and Office & Administration (448 | 10.3%).
Sales and Office Occupations by Sex
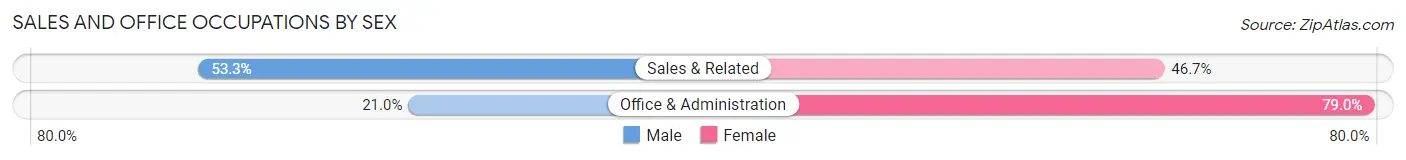
| Occupation | Male | Female |
| Sales & Related | 343 (53.3%) | 301 (46.7%) |
| Office & Administration | 94 (21.0%) | 354 (79.0%) |
| Total (Category) | 437 (40.0%) | 655 (60.0%) |
| Total (Overall) | 2,253 (52.0%) | 2,082 (48.0%) |
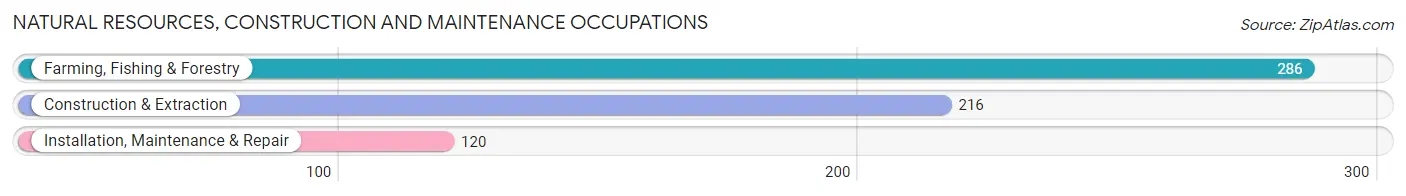
Natural Resources, Construction and Maintenance Occupations
The most common Natural Resources, Construction and Maintenance occupations in Mississippi County are Farming, Fishing & Forestry (286 | 6.6%), Construction & Extraction (216 | 5.0%), and Installation, Maintenance & Repair (120 | 2.8%).
Natural Resources, Construction and Maintenance Occupations by Sex
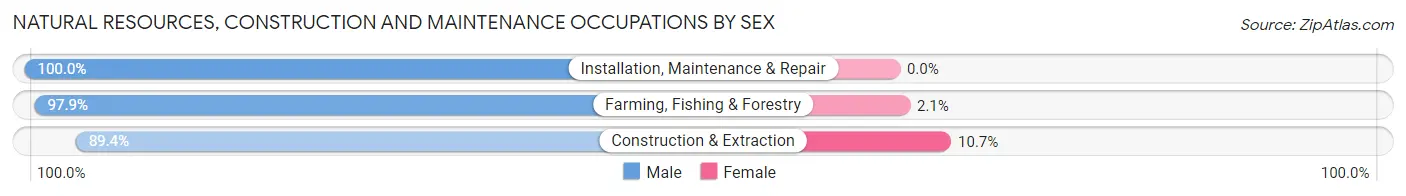
| Occupation | Male | Female |
| Farming, Fishing & Forestry | 280 (97.9%) | 6 (2.1%) |
| Construction & Extraction | 193 (89.3%) | 23 (10.6%) |
| Installation, Maintenance & Repair | 120 (100.0%) | 0 (0.0%) |
| Total (Category) | 593 (95.3%) | 29 (4.7%) |
| Total (Overall) | 2,253 (52.0%) | 2,082 (48.0%) |
Production, Transportation and Moving Occupations
The most common Production, Transportation and Moving occupations in Mississippi County are Transportation (238 | 5.5%), Material Moving (235 | 5.4%), and Production (191 | 4.4%).
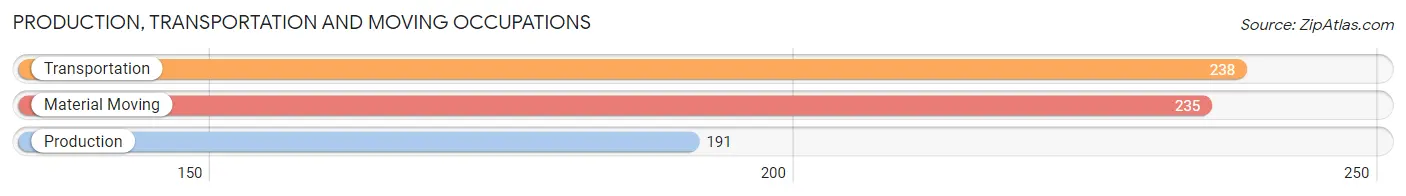
Production, Transportation and Moving Occupations by Sex
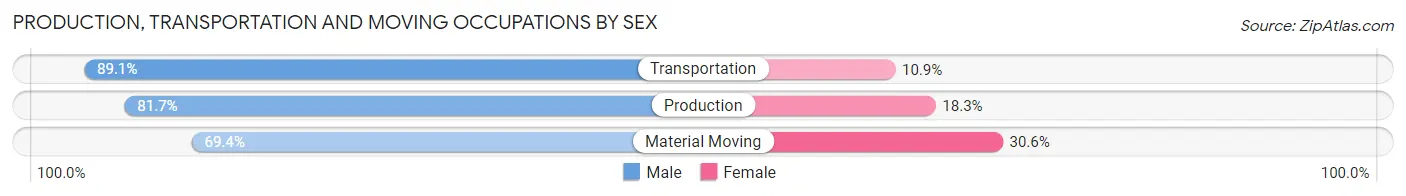
| Occupation | Male | Female |
| Production | 156 (81.7%) | 35 (18.3%) |
| Transportation | 212 (89.1%) | 26 (10.9%) |
| Material Moving | 163 (69.4%) | 72 (30.6%) |
| Total (Category) | 531 (80.0%) | 133 (20.0%) |
| Total (Overall) | 2,253 (52.0%) | 2,082 (48.0%) |
Employment Industries by Sex in Mississippi County
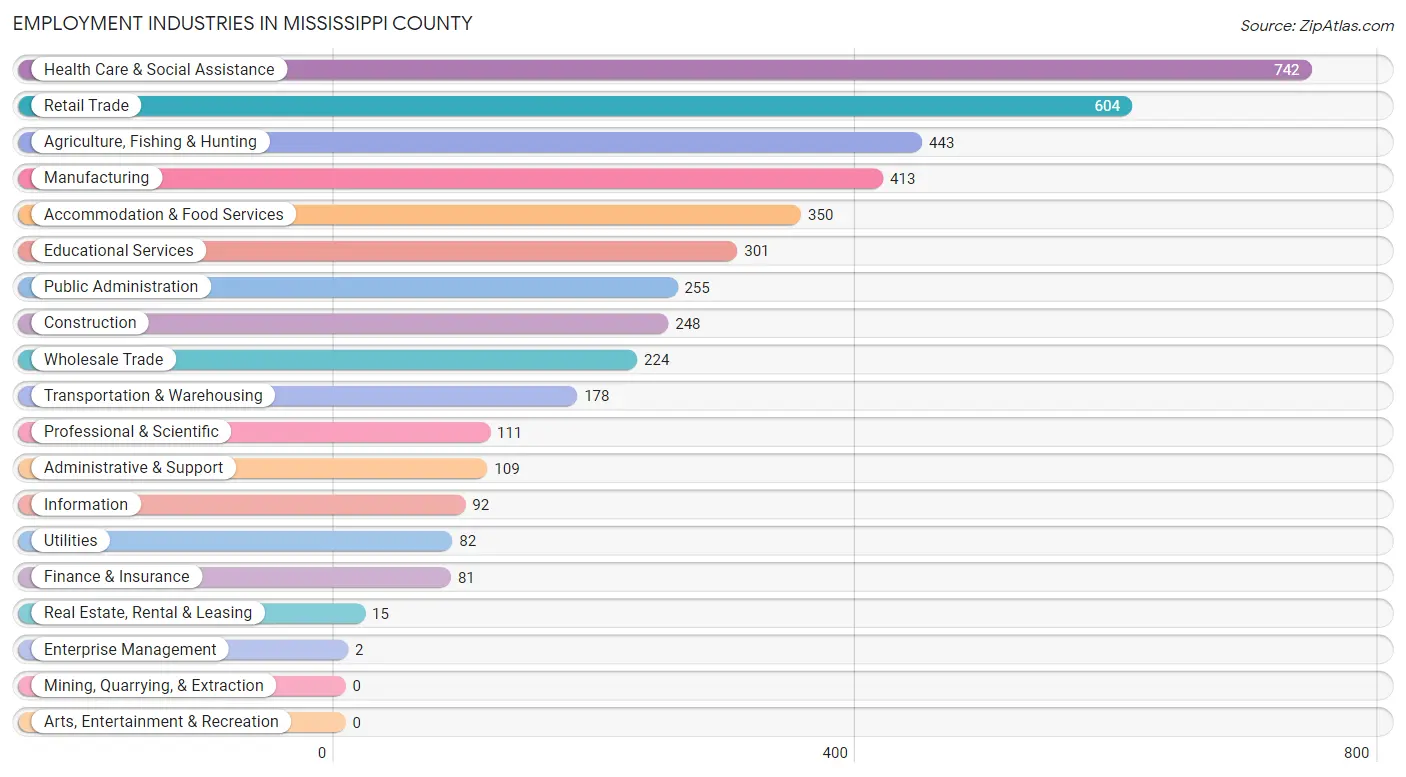
Employment Industries in Mississippi County
The major employment industries in Mississippi County include Health Care & Social Assistance (742 | 17.1%), Retail Trade (604 | 13.9%), Agriculture, Fishing & Hunting (443 | 10.2%), Manufacturing (413 | 9.5%), and Accommodation & Food Services (350 | 8.1%).
Employment Industries by Sex in Mississippi County
The Mississippi County industries that see more men than women are Utilities (100.0%), Agriculture, Fishing & Hunting (93.9%), and Wholesale Trade (92.4%), whereas the industries that tend to have a higher number of women are Enterprise Management (100.0%), Health Care & Social Assistance (82.9%), and Educational Services (77.7%).
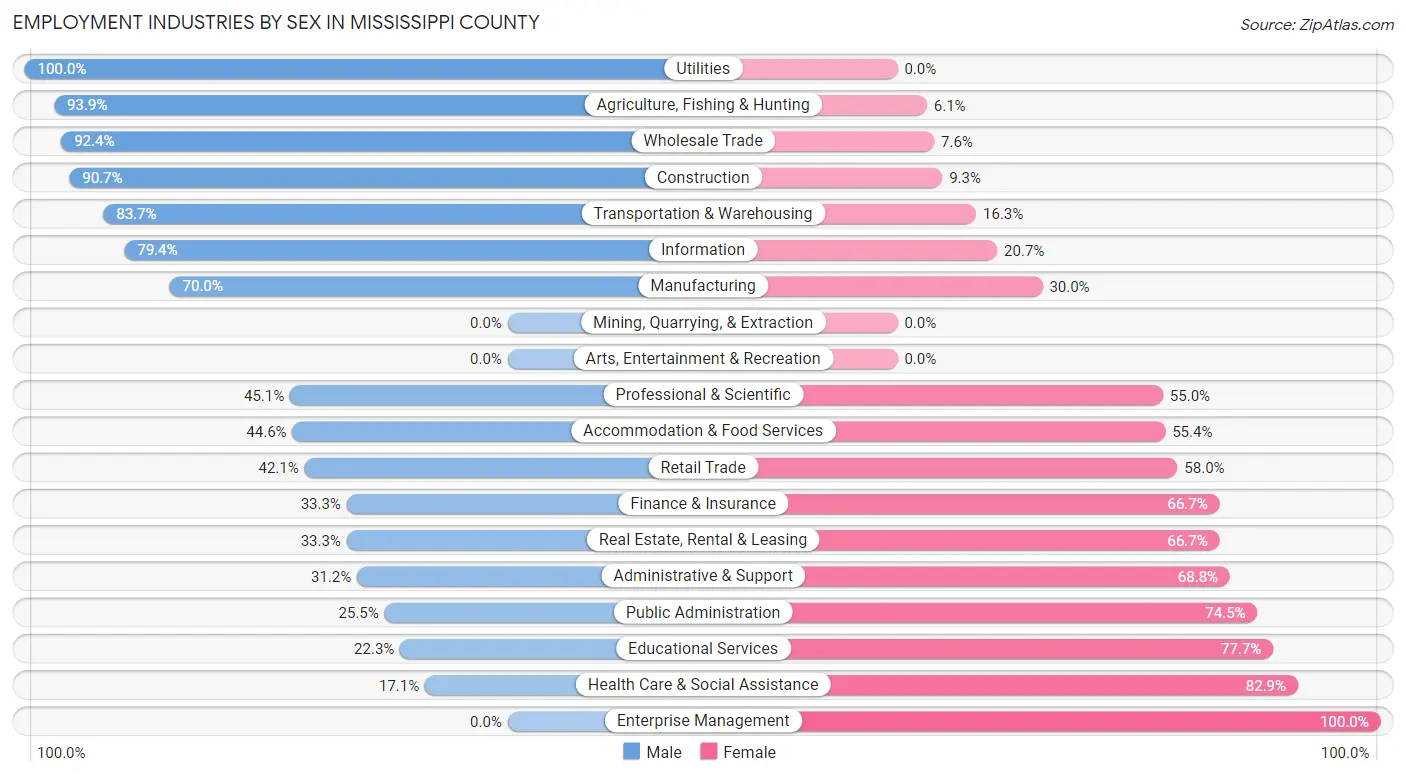
| Industry | Male | Female |
| Agriculture, Fishing & Hunting | 416 (93.9%) | 27 (6.1%) |
| Mining, Quarrying, & Extraction | 0 (0.0%) | 0 (0.0%) |
| Construction | 225 (90.7%) | 23 (9.3%) |
| Manufacturing | 289 (70.0%) | 124 (30.0%) |
| Wholesale Trade | 207 (92.4%) | 17 (7.6%) |
| Retail Trade | 254 (42.0%) | 350 (58.0%) |
| Transportation & Warehousing | 149 (83.7%) | 29 (16.3%) |
| Utilities | 82 (100.0%) | 0 (0.0%) |
| Information | 73 (79.3%) | 19 (20.6%) |
| Finance & Insurance | 27 (33.3%) | 54 (66.7%) |
| Real Estate, Rental & Leasing | 5 (33.3%) | 10 (66.7%) |
| Professional & Scientific | 50 (45.1%) | 61 (54.9%) |
| Enterprise Management | 0 (0.0%) | 2 (100.0%) |
| Administrative & Support | 34 (31.2%) | 75 (68.8%) |
| Educational Services | 67 (22.3%) | 234 (77.7%) |
| Health Care & Social Assistance | 127 (17.1%) | 615 (82.9%) |
| Arts, Entertainment & Recreation | 0 (0.0%) | 0 (0.0%) |
| Accommodation & Food Services | 156 (44.6%) | 194 (55.4%) |
| Public Administration | 65 (25.5%) | 190 (74.5%) |
| Total | 2,253 (52.0%) | 2,082 (48.0%) |
Education in Mississippi County
School Enrollment in Mississippi County
The most common levels of schooling among the 2,587 students in Mississippi County are middle school (826 | 31.9%), high school (731 | 28.3%), and elementary school (471 | 18.2%).
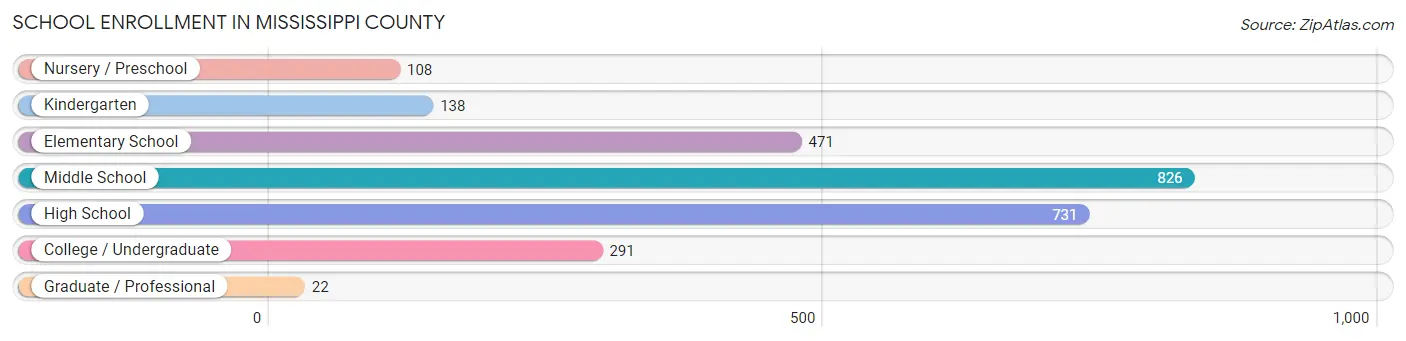
| School Level | # Students | % Students |
| Nursery / Preschool | 108 | 4.2% |
| Kindergarten | 138 | 5.3% |
| Elementary School | 471 | 18.2% |
| Middle School | 826 | 31.9% |
| High School | 731 | 28.3% |
| College / Undergraduate | 291 | 11.3% |
| Graduate / Professional | 22 | 0.9% |
| Total | 2,587 | 100.0% |
School Enrollment by Age by Funding Source in Mississippi County
Out of a total of 2,587 students who are enrolled in schools in Mississippi County, 114 (4.4%) attend a private institution, while the remaining 2,473 (95.6%) are enrolled in public schools. The age group of 35 years and over has the highest likelihood of being enrolled in private schools, with 30 (21.4% in the age bracket) enrolled. Conversely, the age group of 3 to 4 year olds has the lowest likelihood of being enrolled in a private school, with 99 (100.0% in the age bracket) attending a public institution.
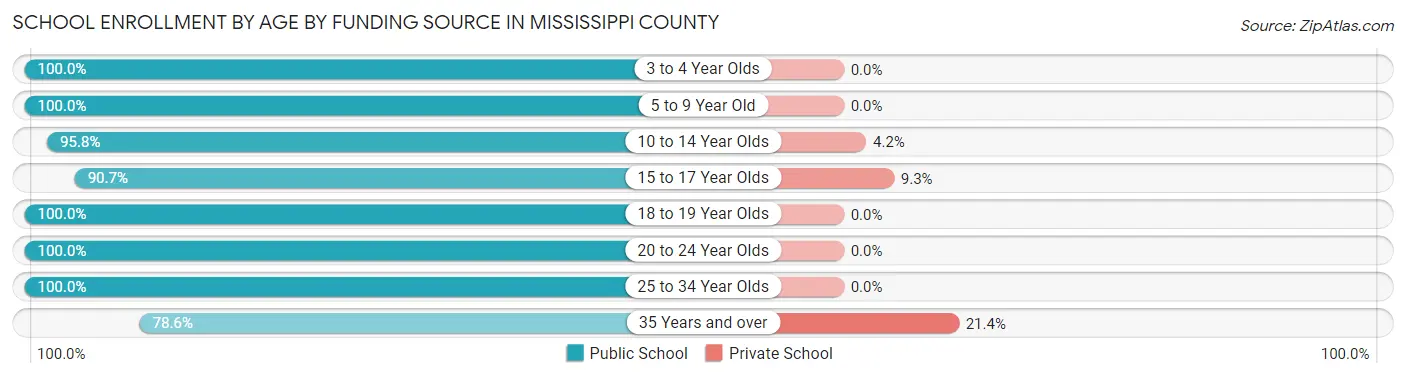
| Age Bracket | Public School | Private School |
| 3 to 4 Year Olds | 99 (100.0%) | 0 (0.0%) |
| 5 to 9 Year Old | 523 (100.0%) | 0 (0.0%) |
| 10 to 14 Year Olds | 939 (95.8%) | 41 (4.2%) |
| 15 to 17 Year Olds | 427 (90.7%) | 44 (9.3%) |
| 18 to 19 Year Olds | 160 (100.0%) | 0 (0.0%) |
| 20 to 24 Year Olds | 114 (100.0%) | 0 (0.0%) |
| 25 to 34 Year Olds | 100 (100.0%) | 0 (0.0%) |
| 35 Years and over | 110 (78.6%) | 30 (21.4%) |
| Total | 2,473 (95.6%) | 114 (4.4%) |
Educational Attainment by Field of Study in Mississippi County
Education (347 | 27.5%), arts & humanities (197 | 15.6%), science & technology (129 | 10.2%), business (118 | 9.3%), and bio, nature & agricultural (90 | 7.1%) are the most common fields of study among 1,263 individuals in Mississippi County who have obtained a bachelor's degree or higher.
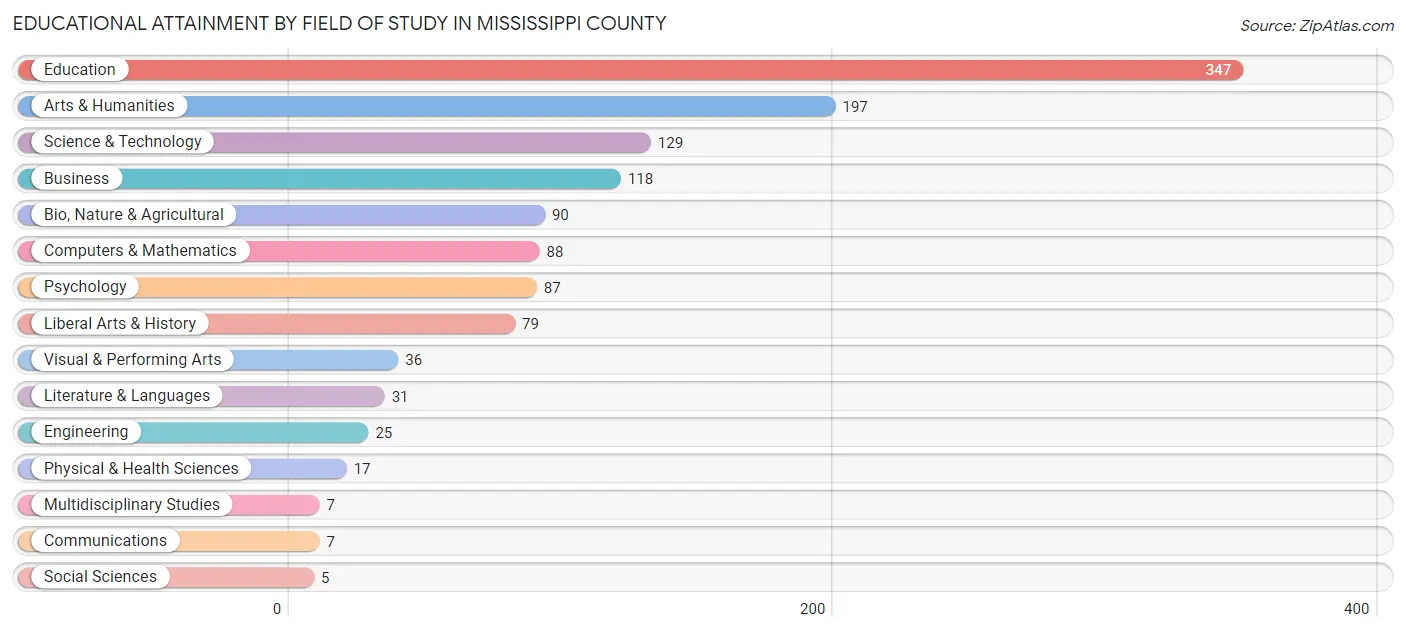
| Field of Study | # Graduates | % Graduates |
| Computers & Mathematics | 88 | 7.0% |
| Bio, Nature & Agricultural | 90 | 7.1% |
| Physical & Health Sciences | 17 | 1.3% |
| Psychology | 87 | 6.9% |
| Social Sciences | 5 | 0.4% |
| Engineering | 25 | 2.0% |
| Multidisciplinary Studies | 7 | 0.5% |
| Science & Technology | 129 | 10.2% |
| Business | 118 | 9.3% |
| Education | 347 | 27.5% |
| Literature & Languages | 31 | 2.5% |
| Liberal Arts & History | 79 | 6.2% |
| Visual & Performing Arts | 36 | 2.9% |
| Communications | 7 | 0.5% |
| Arts & Humanities | 197 | 15.6% |
| Total | 1,263 | 100.0% |
Transportation & Commute in Mississippi County
Vehicle Availability by Sex in Mississippi County
The most prevalent vehicle ownership categories in Mississippi County are males with 2 vehicles (703, accounting for 32.1%) and females with 2 vehicles (703, making up 33.9%).
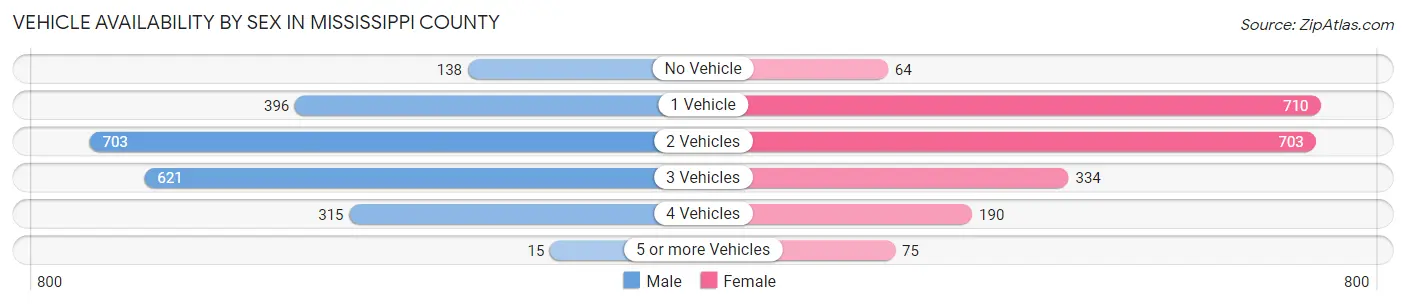
| Vehicles Available | Male | Female |
| No Vehicle | 138 (6.3%) | 64 (3.1%) |
| 1 Vehicle | 396 (18.1%) | 710 (34.2%) |
| 2 Vehicles | 703 (32.1%) | 703 (33.9%) |
| 3 Vehicles | 621 (28.4%) | 334 (16.1%) |
| 4 Vehicles | 315 (14.4%) | 190 (9.1%) |
| 5 or more Vehicles | 15 (0.7%) | 75 (3.6%) |
| Total | 2,188 (100.0%) | 2,076 (100.0%) |
Commute Time in Mississippi County
The most frequently occuring commute durations in Mississippi County are 15 to 19 minutes (968 commuters, 23.6%), 5 to 9 minutes (647 commuters, 15.8%), and 30 to 34 minutes (596 commuters, 14.6%).
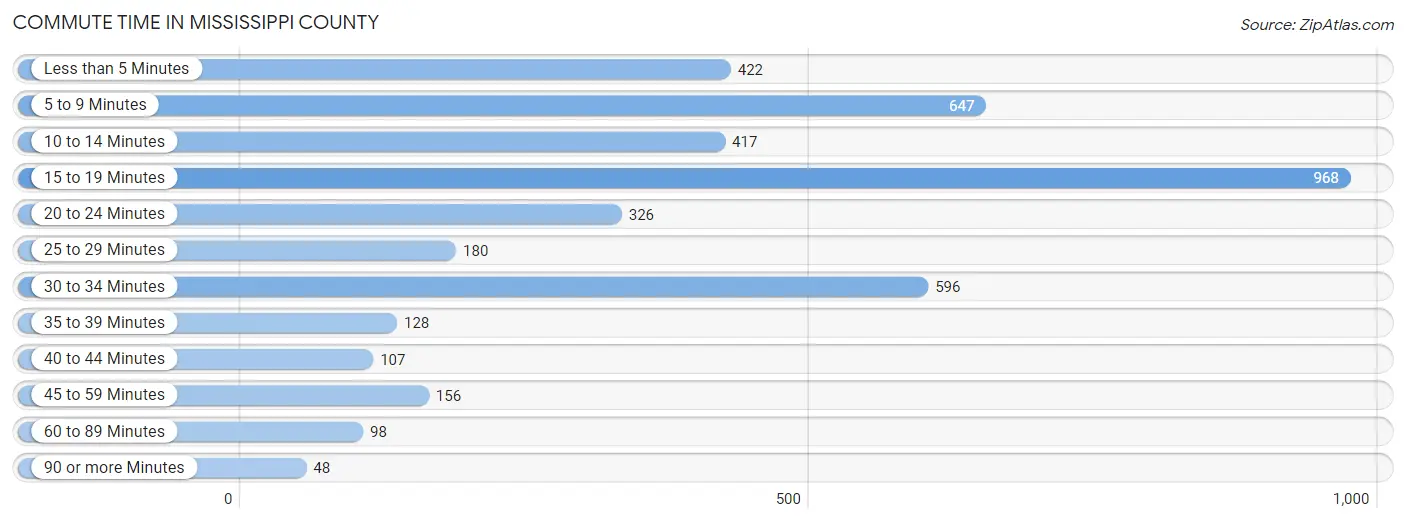
| Commute Time | # Commuters | % Commuters |
| Less than 5 Minutes | 422 | 10.3% |
| 5 to 9 Minutes | 647 | 15.8% |
| 10 to 14 Minutes | 417 | 10.2% |
| 15 to 19 Minutes | 968 | 23.6% |
| 20 to 24 Minutes | 326 | 8.0% |
| 25 to 29 Minutes | 180 | 4.4% |
| 30 to 34 Minutes | 596 | 14.6% |
| 35 to 39 Minutes | 128 | 3.1% |
| 40 to 44 Minutes | 107 | 2.6% |
| 45 to 59 Minutes | 156 | 3.8% |
| 60 to 89 Minutes | 98 | 2.4% |
| 90 or more Minutes | 48 | 1.2% |
Commute Time by Sex in Mississippi County
The most common commute times in Mississippi County are 15 to 19 minutes (454 commuters, 20.9%) for males and 15 to 19 minutes (514 commuters, 26.7%) for females.
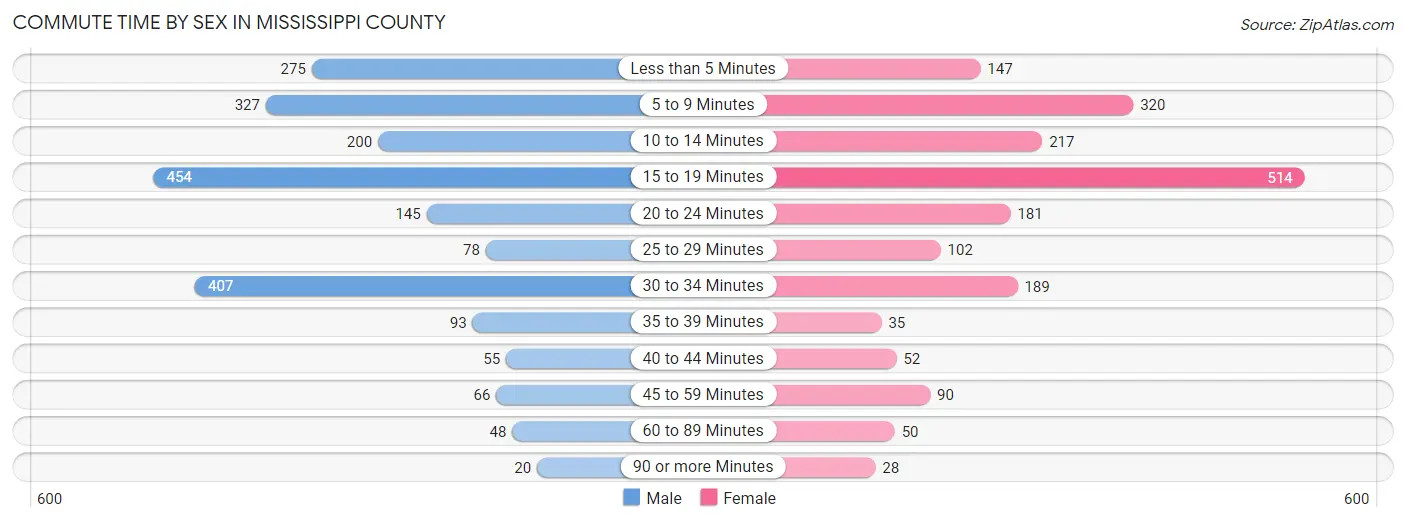
| Commute Time | Male | Female |
| Less than 5 Minutes | 275 (12.7%) | 147 (7.6%) |
| 5 to 9 Minutes | 327 (15.1%) | 320 (16.6%) |
| 10 to 14 Minutes | 200 (9.2%) | 217 (11.3%) |
| 15 to 19 Minutes | 454 (20.9%) | 514 (26.7%) |
| 20 to 24 Minutes | 145 (6.7%) | 181 (9.4%) |
| 25 to 29 Minutes | 78 (3.6%) | 102 (5.3%) |
| 30 to 34 Minutes | 407 (18.8%) | 189 (9.8%) |
| 35 to 39 Minutes | 93 (4.3%) | 35 (1.8%) |
| 40 to 44 Minutes | 55 (2.5%) | 52 (2.7%) |
| 45 to 59 Minutes | 66 (3.0%) | 90 (4.7%) |
| 60 to 89 Minutes | 48 (2.2%) | 50 (2.6%) |
| 90 or more Minutes | 20 (0.9%) | 28 (1.5%) |
Time of Departure to Work by Sex in Mississippi County
The most frequent times of departure to work in Mississippi County are 7:00 AM to 7:29 AM (500, 23.1%) for males and 7:30 AM to 7:59 AM (476, 24.7%) for females.
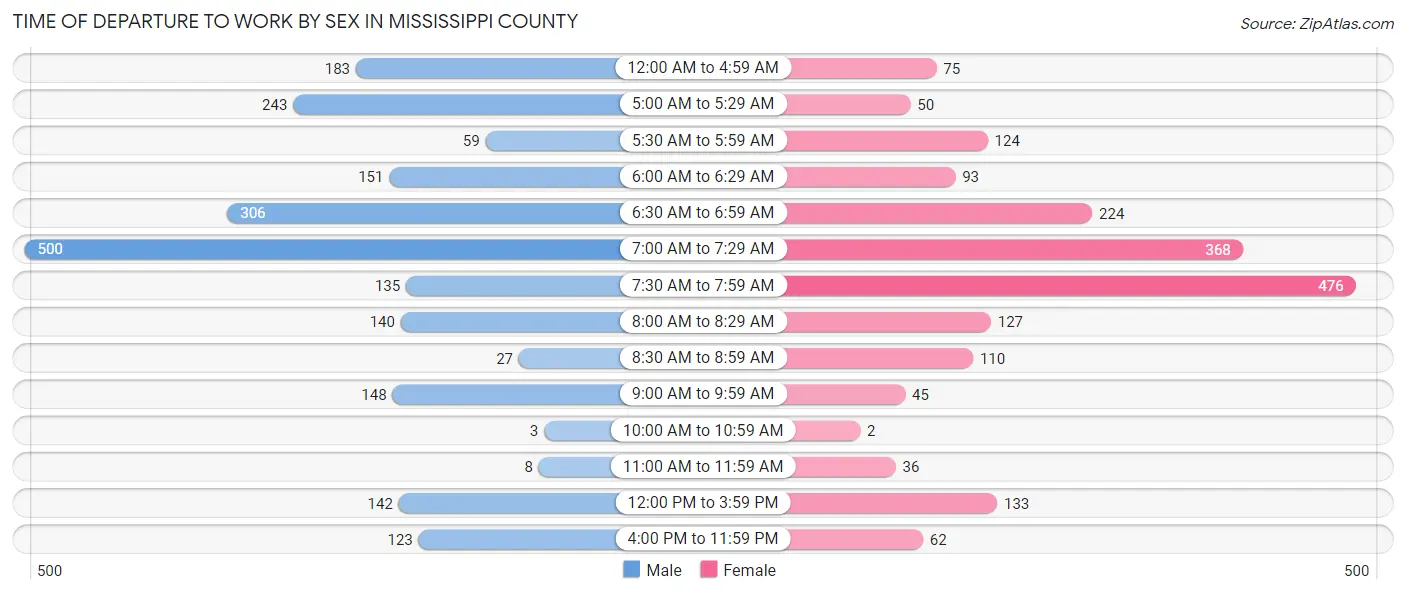
| Time of Departure | Male | Female |
| 12:00 AM to 4:59 AM | 183 (8.4%) | 75 (3.9%) |
| 5:00 AM to 5:29 AM | 243 (11.2%) | 50 (2.6%) |
| 5:30 AM to 5:59 AM | 59 (2.7%) | 124 (6.4%) |
| 6:00 AM to 6:29 AM | 151 (7.0%) | 93 (4.8%) |
| 6:30 AM to 6:59 AM | 306 (14.1%) | 224 (11.6%) |
| 7:00 AM to 7:29 AM | 500 (23.1%) | 368 (19.1%) |
| 7:30 AM to 7:59 AM | 135 (6.2%) | 476 (24.7%) |
| 8:00 AM to 8:29 AM | 140 (6.5%) | 127 (6.6%) |
| 8:30 AM to 8:59 AM | 27 (1.3%) | 110 (5.7%) |
| 9:00 AM to 9:59 AM | 148 (6.8%) | 45 (2.3%) |
| 10:00 AM to 10:59 AM | 3 (0.1%) | 2 (0.1%) |
| 11:00 AM to 11:59 AM | 8 (0.4%) | 36 (1.9%) |
| 12:00 PM to 3:59 PM | 142 (6.6%) | 133 (6.9%) |
| 4:00 PM to 11:59 PM | 123 (5.7%) | 62 (3.2%) |
| Total | 2,168 (100.0%) | 1,925 (100.0%) |
Housing Occupancy in Mississippi County
Occupancy by Ownership in Mississippi County
Of the total 4,612 dwellings in Mississippi County, owner-occupied units account for 2,763 (59.9%), while renter-occupied units make up 1,849 (40.1%).
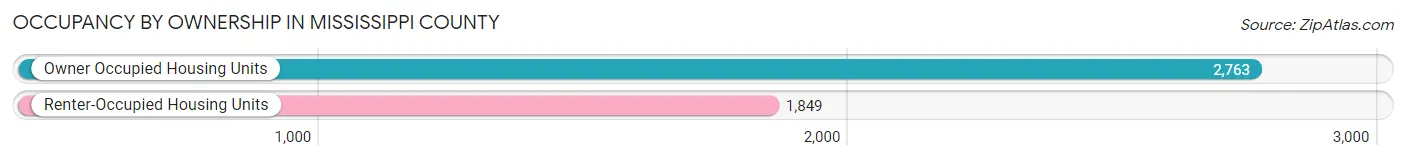
| Occupancy | # Housing Units | % Housing Units |
| Owner Occupied Housing Units | 2,763 | 59.9% |
| Renter-Occupied Housing Units | 1,849 | 40.1% |
| Total Occupied Housing Units | 4,612 | 100.0% |
Occupancy by Household Size in Mississippi County
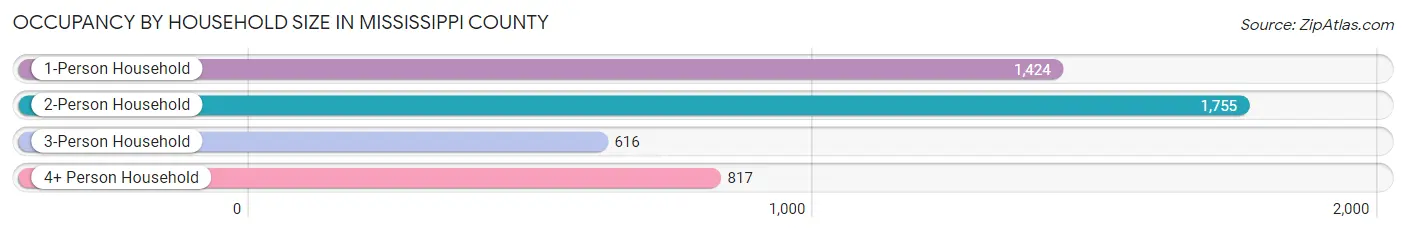
| Household Size | # Housing Units | % Housing Units |
| 1-Person Household | 1,424 | 30.9% |
| 2-Person Household | 1,755 | 38.1% |
| 3-Person Household | 616 | 13.4% |
| 4+ Person Household | 817 | 17.7% |
| Total Housing Units | 4,612 | 100.0% |
Occupancy by Ownership by Household Size in Mississippi County
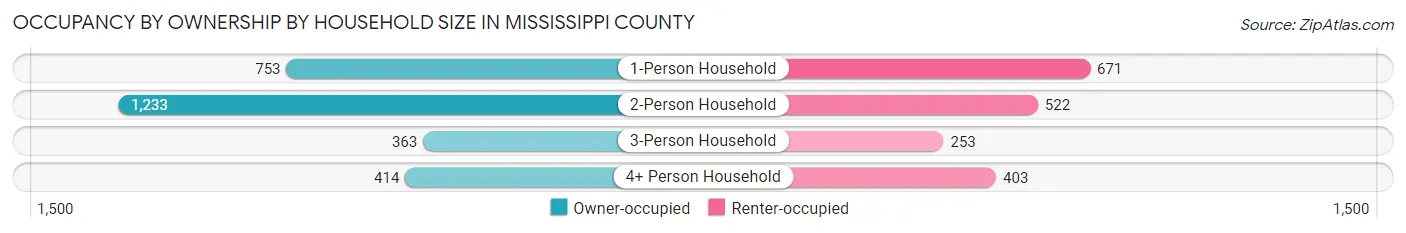
| Household Size | Owner-occupied | Renter-occupied |
| 1-Person Household | 753 (52.9%) | 671 (47.1%) |
| 2-Person Household | 1,233 (70.3%) | 522 (29.7%) |
| 3-Person Household | 363 (58.9%) | 253 (41.1%) |
| 4+ Person Household | 414 (50.7%) | 403 (49.3%) |
| Total Housing Units | 2,763 (59.9%) | 1,849 (40.1%) |
Occupancy by Educational Attainment in Mississippi County
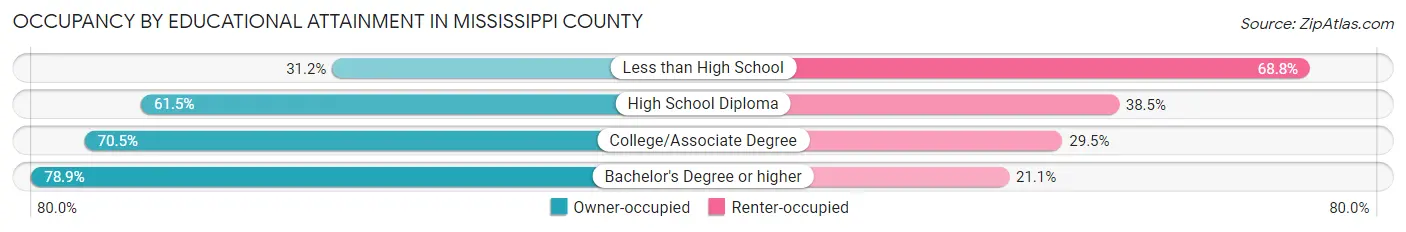
| Household Size | Owner-occupied | Renter-occupied |
| Less than High School | 294 (31.2%) | 648 (68.8%) |
| High School Diploma | 1,231 (61.5%) | 770 (38.5%) |
| College/Associate Degree | 661 (70.5%) | 277 (29.5%) |
| Bachelor's Degree or higher | 577 (78.9%) | 154 (21.1%) |
Occupancy by Age of Householder in Mississippi County
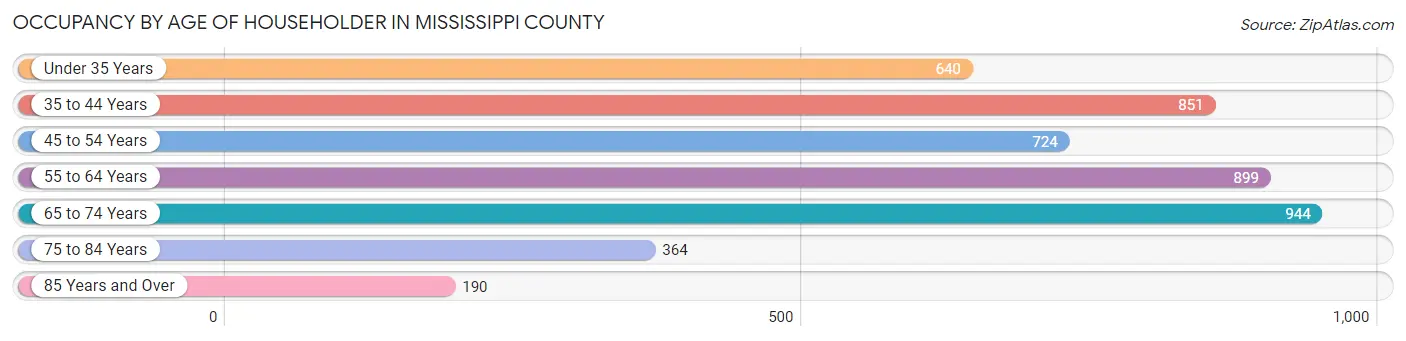
| Age Bracket | # Households | % Households |
| Under 35 Years | 640 | 13.9% |
| 35 to 44 Years | 851 | 18.4% |
| 45 to 54 Years | 724 | 15.7% |
| 55 to 64 Years | 899 | 19.5% |
| 65 to 74 Years | 944 | 20.5% |
| 75 to 84 Years | 364 | 7.9% |
| 85 Years and Over | 190 | 4.1% |
| Total | 4,612 | 100.0% |
Housing Finances in Mississippi County
Median Income by Occupancy in Mississippi County
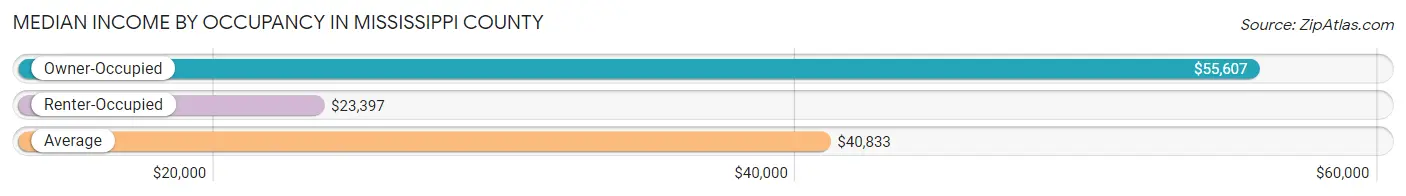
| Occupancy Type | # Households | Median Income |
| Owner-Occupied | 2,763 (59.9%) | $55,607 |
| Renter-Occupied | 1,849 (40.1%) | $23,397 |
| Average | 4,612 (100.0%) | $40,833 |
Occupancy by Householder Income Bracket in Mississippi County
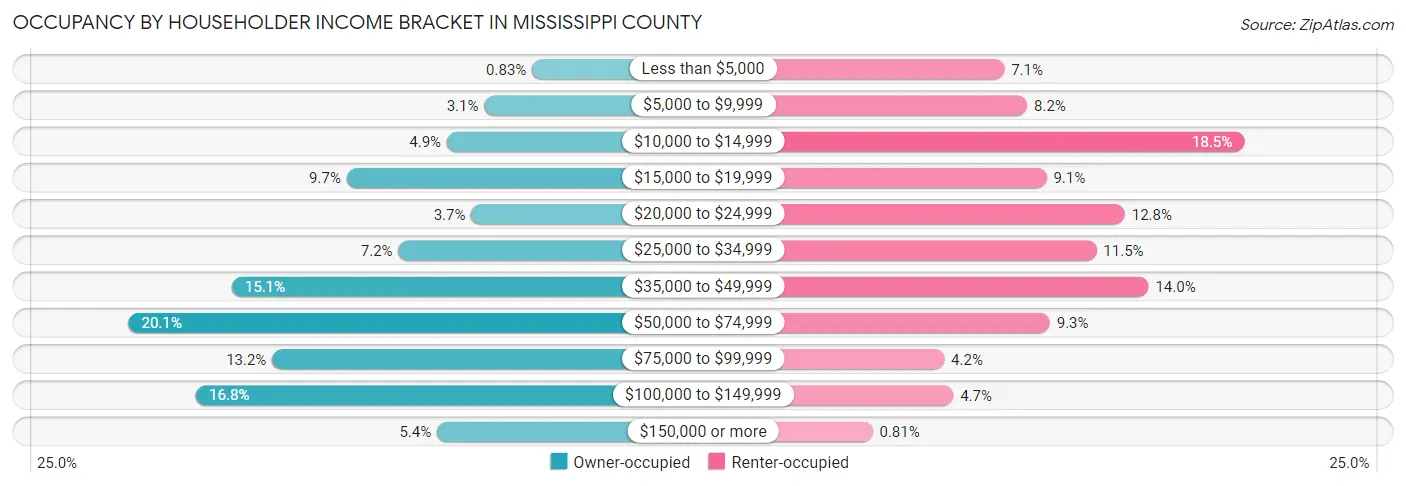
| Income Bracket | Owner-occupied | Renter-occupied |
| Less than $5,000 | 23 (0.8%) | 131 (7.1%) |
| $5,000 to $9,999 | 86 (3.1%) | 151 (8.2%) |
| $10,000 to $14,999 | 135 (4.9%) | 342 (18.5%) |
| $15,000 to $19,999 | 267 (9.7%) | 168 (9.1%) |
| $20,000 to $24,999 | 103 (3.7%) | 237 (12.8%) |
| $25,000 to $34,999 | 199 (7.2%) | 212 (11.5%) |
| $35,000 to $49,999 | 418 (15.1%) | 258 (14.0%) |
| $50,000 to $74,999 | 554 (20.1%) | 171 (9.2%) |
| $75,000 to $99,999 | 365 (13.2%) | 78 (4.2%) |
| $100,000 to $149,999 | 465 (16.8%) | 86 (4.6%) |
| $150,000 or more | 148 (5.4%) | 15 (0.8%) |
| Total | 2,763 (100.0%) | 1,849 (100.0%) |
Monthly Housing Cost Tiers in Mississippi County
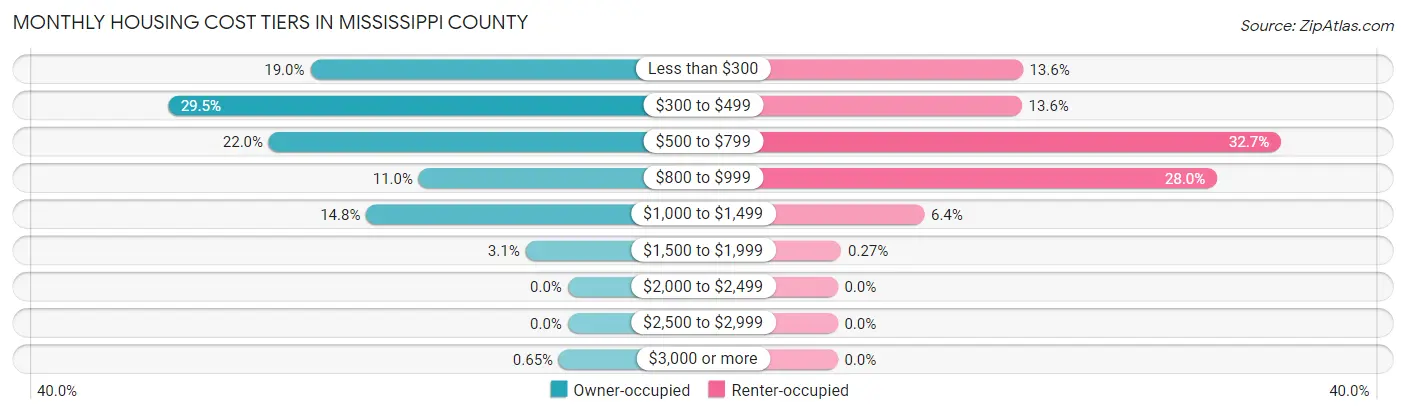
| Monthly Cost | Owner-occupied | Renter-occupied |
| Less than $300 | 524 (19.0%) | 252 (13.6%) |
| $300 to $499 | 814 (29.5%) | 251 (13.6%) |
| $500 to $799 | 608 (22.0%) | 604 (32.7%) |
| $800 to $999 | 303 (11.0%) | 517 (28.0%) |
| $1,000 to $1,499 | 410 (14.8%) | 118 (6.4%) |
| $1,500 to $1,999 | 86 (3.1%) | 5 (0.3%) |
| $2,000 to $2,499 | 0 (0.0%) | 0 (0.0%) |
| $2,500 to $2,999 | 0 (0.0%) | 0 (0.0%) |
| $3,000 or more | 18 (0.6%) | 0 (0.0%) |
| Total | 2,763 (100.0%) | 1,849 (100.0%) |
Physical Housing Characteristics in Mississippi County
Housing Structures in Mississippi County
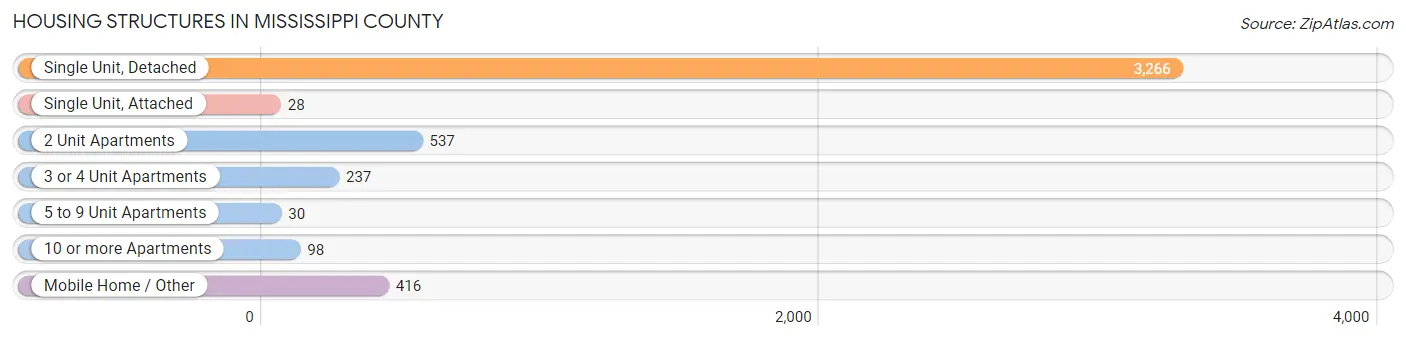
| Structure Type | # Housing Units | % Housing Units |
| Single Unit, Detached | 3,266 | 70.8% |
| Single Unit, Attached | 28 | 0.6% |
| 2 Unit Apartments | 537 | 11.6% |
| 3 or 4 Unit Apartments | 237 | 5.1% |
| 5 to 9 Unit Apartments | 30 | 0.6% |
| 10 or more Apartments | 98 | 2.1% |
| Mobile Home / Other | 416 | 9.0% |
| Total | 4,612 | 100.0% |
Housing Structures by Occupancy in Mississippi County
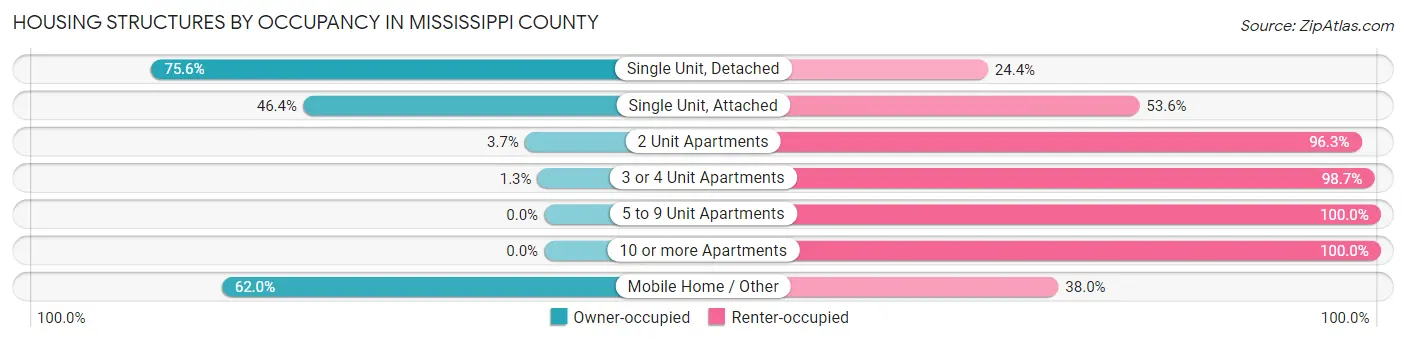
| Structure Type | Owner-occupied | Renter-occupied |
| Single Unit, Detached | 2,469 (75.6%) | 797 (24.4%) |
| Single Unit, Attached | 13 (46.4%) | 15 (53.6%) |
| 2 Unit Apartments | 20 (3.7%) | 517 (96.3%) |
| 3 or 4 Unit Apartments | 3 (1.3%) | 234 (98.7%) |
| 5 to 9 Unit Apartments | 0 (0.0%) | 30 (100.0%) |
| 10 or more Apartments | 0 (0.0%) | 98 (100.0%) |
| Mobile Home / Other | 258 (62.0%) | 158 (38.0%) |
| Total | 2,763 (59.9%) | 1,849 (40.1%) |
Housing Structures by Number of Rooms in Mississippi County
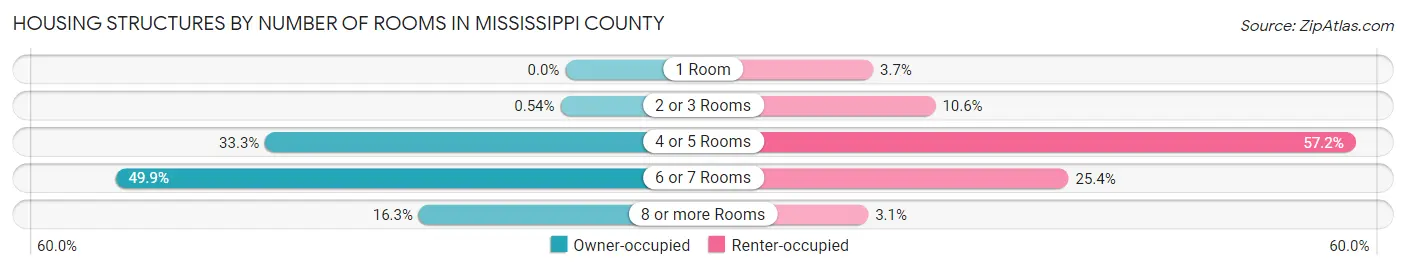
| Number of Rooms | Owner-occupied | Renter-occupied |
| 1 Room | 0 (0.0%) | 68 (3.7%) |
| 2 or 3 Rooms | 15 (0.5%) | 196 (10.6%) |
| 4 or 5 Rooms | 920 (33.3%) | 1,058 (57.2%) |
| 6 or 7 Rooms | 1,379 (49.9%) | 469 (25.4%) |
| 8 or more Rooms | 449 (16.3%) | 58 (3.1%) |
| Total | 2,763 (100.0%) | 1,849 (100.0%) |
Housing Structure by Heating Type in Mississippi County
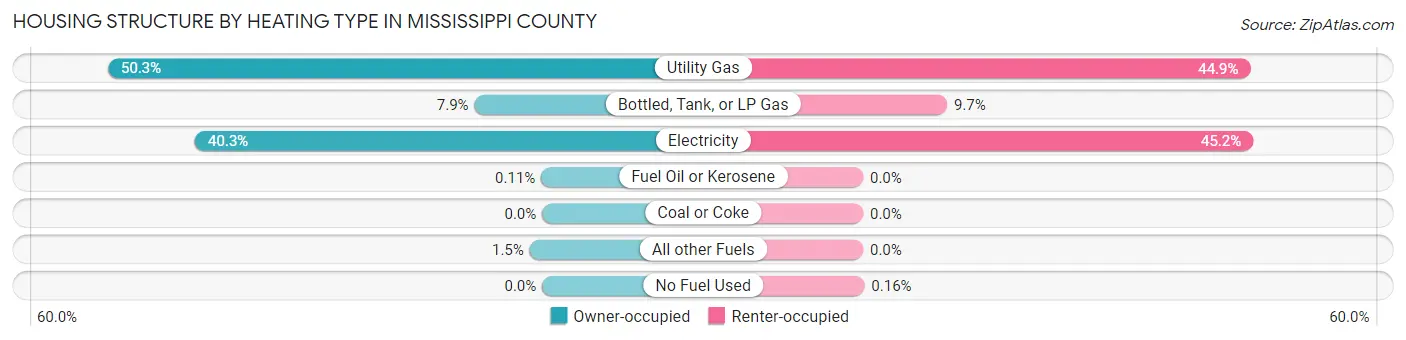
| Heating Type | Owner-occupied | Renter-occupied |
| Utility Gas | 1,391 (50.3%) | 830 (44.9%) |
| Bottled, Tank, or LP Gas | 217 (7.9%) | 180 (9.7%) |
| Electricity | 1,112 (40.3%) | 836 (45.2%) |
| Fuel Oil or Kerosene | 3 (0.1%) | 0 (0.0%) |
| Coal or Coke | 0 (0.0%) | 0 (0.0%) |
| All other Fuels | 40 (1.5%) | 0 (0.0%) |
| No Fuel Used | 0 (0.0%) | 3 (0.2%) |
| Total | 2,763 (100.0%) | 1,849 (100.0%) |
Household Vehicle Usage in Mississippi County
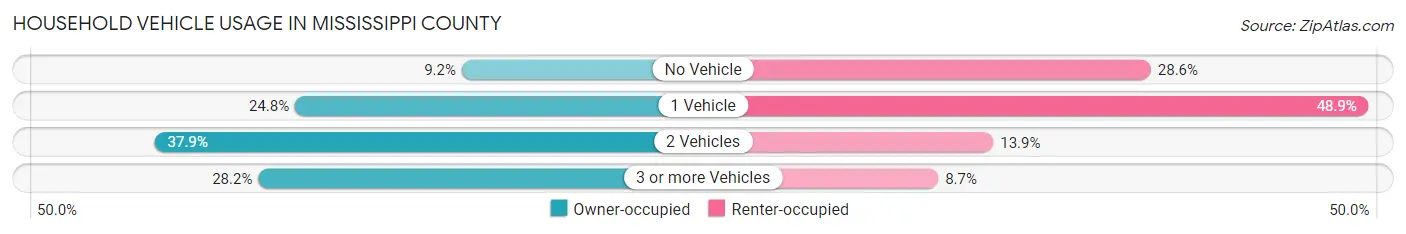
| Vehicles per Household | Owner-occupied | Renter-occupied |
| No Vehicle | 254 (9.2%) | 528 (28.6%) |
| 1 Vehicle | 684 (24.8%) | 904 (48.9%) |
| 2 Vehicles | 1,046 (37.9%) | 256 (13.9%) |
| 3 or more Vehicles | 779 (28.2%) | 161 (8.7%) |
| Total | 2,763 (100.0%) | 1,849 (100.0%) |
Real Estate & Mortgages in Mississippi County
Real Estate and Mortgage Overview in Mississippi County
| Characteristic | Without Mortgage | With Mortgage |
| Housing Units | 1,602 | 1,161 |
| Median Property Value | $83,000 | $106,200 |
| Median Household Income | $46,705 | $64 |
| Monthly Housing Costs | $386 | $16 |
| Real Estate Taxes | $595 | $31 |
Property Value by Mortgage Status in Mississippi County
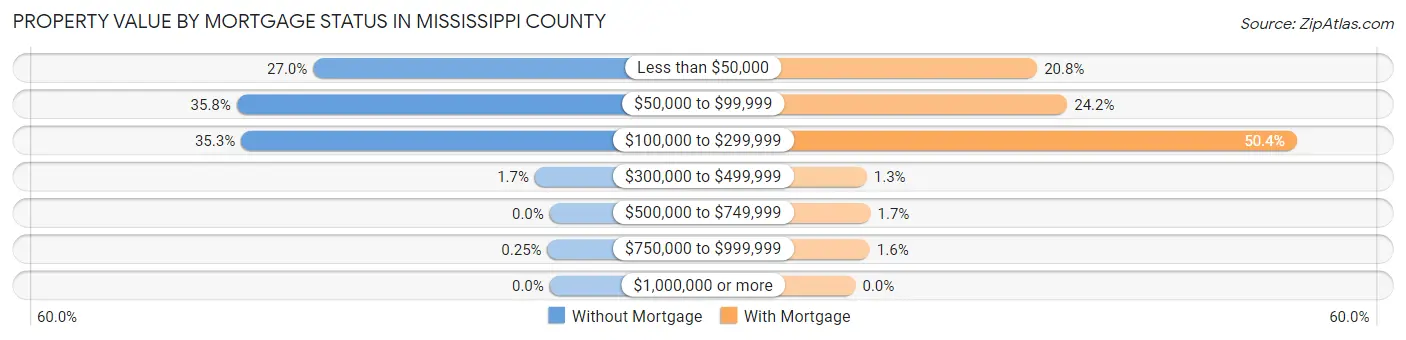
| Property Value | Without Mortgage | With Mortgage |
| Less than $50,000 | 433 (27.0%) | 241 (20.8%) |
| $50,000 to $99,999 | 573 (35.8%) | 281 (24.2%) |
| $100,000 to $299,999 | 565 (35.3%) | 585 (50.4%) |
| $300,000 to $499,999 | 27 (1.7%) | 15 (1.3%) |
| $500,000 to $749,999 | 0 (0.0%) | 20 (1.7%) |
| $750,000 to $999,999 | 4 (0.3%) | 19 (1.6%) |
| $1,000,000 or more | 0 (0.0%) | 0 (0.0%) |
| Total | 1,602 (100.0%) | 1,161 (100.0%) |
Household Income by Mortgage Status in Mississippi County
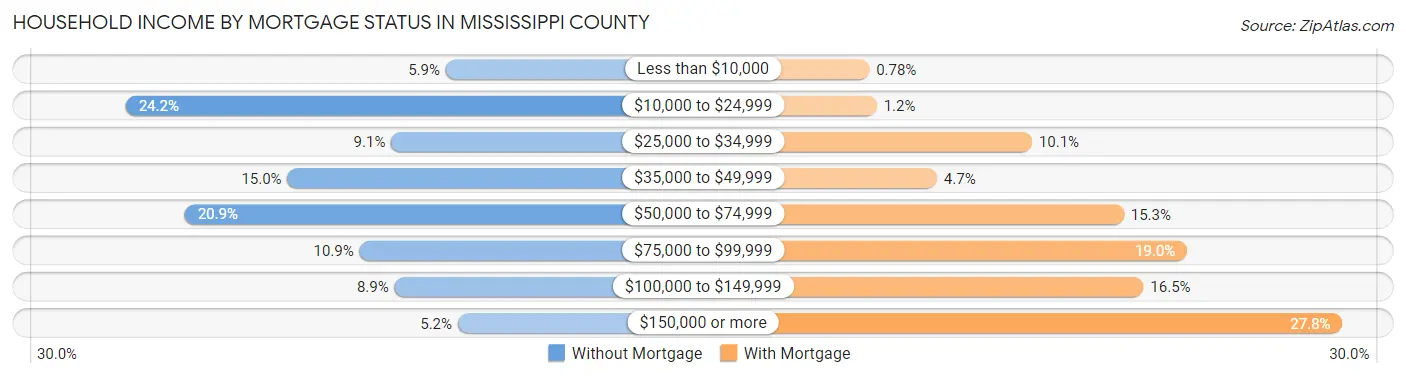
| Household Income | Without Mortgage | With Mortgage |
| Less than $10,000 | 95 (5.9%) | 9 (0.8%) |
| $10,000 to $24,999 | 388 (24.2%) | 14 (1.2%) |
| $25,000 to $34,999 | 145 (9.0%) | 117 (10.1%) |
| $35,000 to $49,999 | 240 (15.0%) | 54 (4.6%) |
| $50,000 to $74,999 | 334 (20.8%) | 178 (15.3%) |
| $75,000 to $99,999 | 174 (10.9%) | 220 (19.0%) |
| $100,000 to $149,999 | 142 (8.9%) | 191 (16.5%) |
| $150,000 or more | 84 (5.2%) | 323 (27.8%) |
| Total | 1,602 (100.0%) | 1,161 (100.0%) |
Property Value to Household Income Ratio in Mississippi County
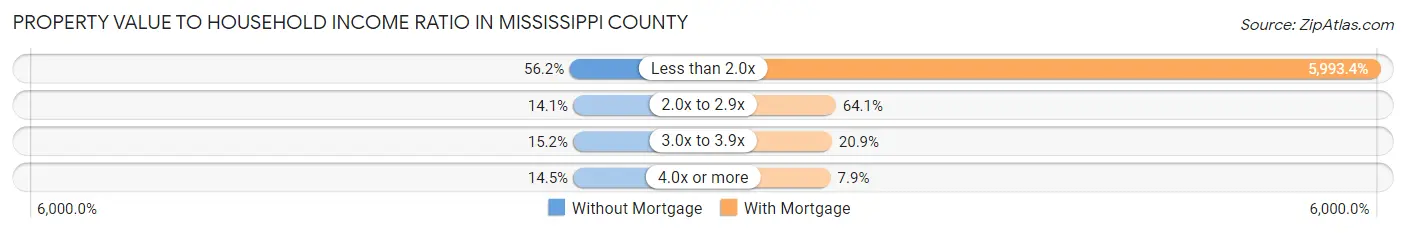
| Value-to-Income Ratio | Without Mortgage | With Mortgage |
| Less than 2.0x | 900 (56.2%) | 69,583 (5,993.4%) |
| 2.0x to 2.9x | 226 (14.1%) | 744 (64.1%) |
| 3.0x to 3.9x | 244 (15.2%) | 243 (20.9%) |
| 4.0x or more | 232 (14.5%) | 92 (7.9%) |
| Total | 1,602 (100.0%) | 1,161 (100.0%) |
Real Estate Taxes by Mortgage Status in Mississippi County
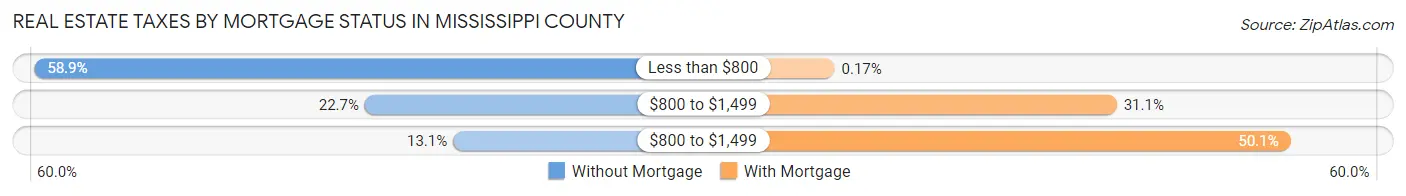
| Property Taxes | Without Mortgage | With Mortgage |
| Less than $800 | 944 (58.9%) | 2 (0.2%) |
| $800 to $1,499 | 364 (22.7%) | 361 (31.1%) |
| $800 to $1,499 | 209 (13.1%) | 582 (50.1%) |
| Total | 1,602 (100.0%) | 1,161 (100.0%) |
Health & Disability in Mississippi County
Health Insurance Coverage by Age in Mississippi County
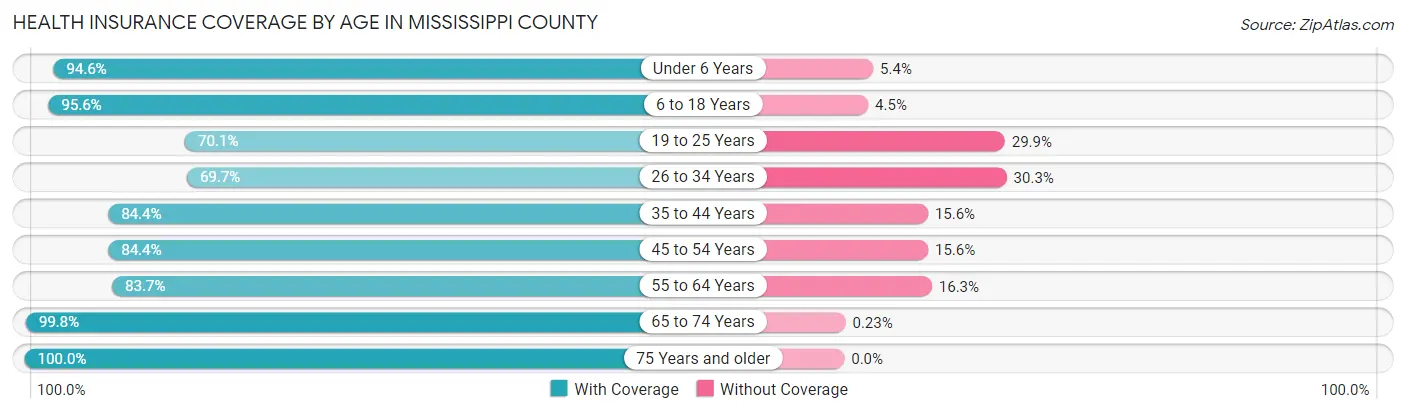
| Age Bracket | With Coverage | Without Coverage |
| Under 6 Years | 651 (94.6%) | 37 (5.4%) |
| 6 to 18 Years | 2,042 (95.6%) | 95 (4.4%) |
| 19 to 25 Years | 611 (70.1%) | 261 (29.9%) |
| 26 to 34 Years | 716 (69.7%) | 311 (30.3%) |
| 35 to 44 Years | 1,098 (84.4%) | 203 (15.6%) |
| 45 to 54 Years | 1,129 (84.4%) | 209 (15.6%) |
| 55 to 64 Years | 1,117 (83.7%) | 218 (16.3%) |
| 65 to 74 Years | 1,284 (99.8%) | 3 (0.2%) |
| 75 Years and older | 840 (100.0%) | 0 (0.0%) |
| Total | 9,488 (87.6%) | 1,337 (12.3%) |
Health Insurance Coverage by Citizenship Status in Mississippi County
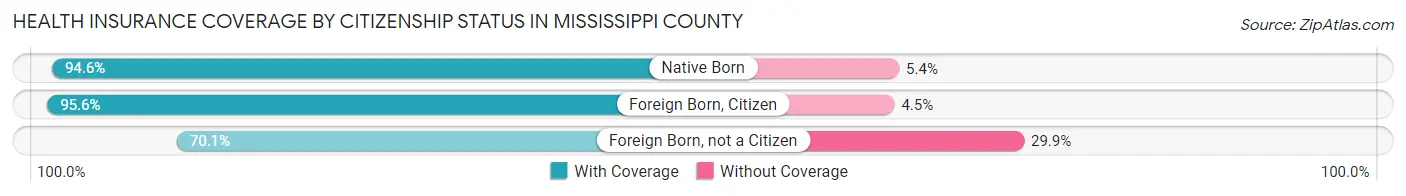
| Citizenship Status | With Coverage | Without Coverage |
| Native Born | 651 (94.6%) | 37 (5.4%) |
| Foreign Born, Citizen | 2,042 (95.6%) | 95 (4.4%) |
| Foreign Born, not a Citizen | 611 (70.1%) | 261 (29.9%) |
Health Insurance Coverage by Household Income in Mississippi County
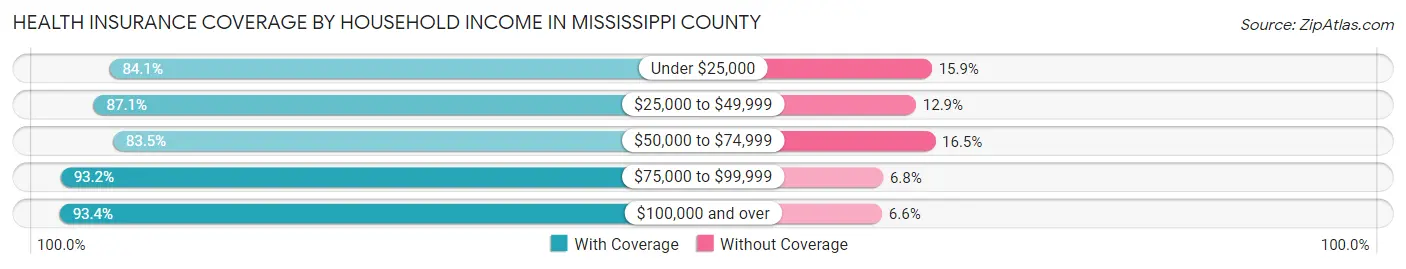
| Household Income | With Coverage | Without Coverage |
| Under $25,000 | 2,415 (84.1%) | 457 (15.9%) |
| $25,000 to $49,999 | 2,348 (87.1%) | 349 (12.9%) |
| $50,000 to $74,999 | 1,539 (83.5%) | 305 (16.5%) |
| $75,000 to $99,999 | 1,142 (93.2%) | 83 (6.8%) |
| $100,000 and over | 2,031 (93.4%) | 143 (6.6%) |
Public vs Private Health Insurance Coverage by Age in Mississippi County
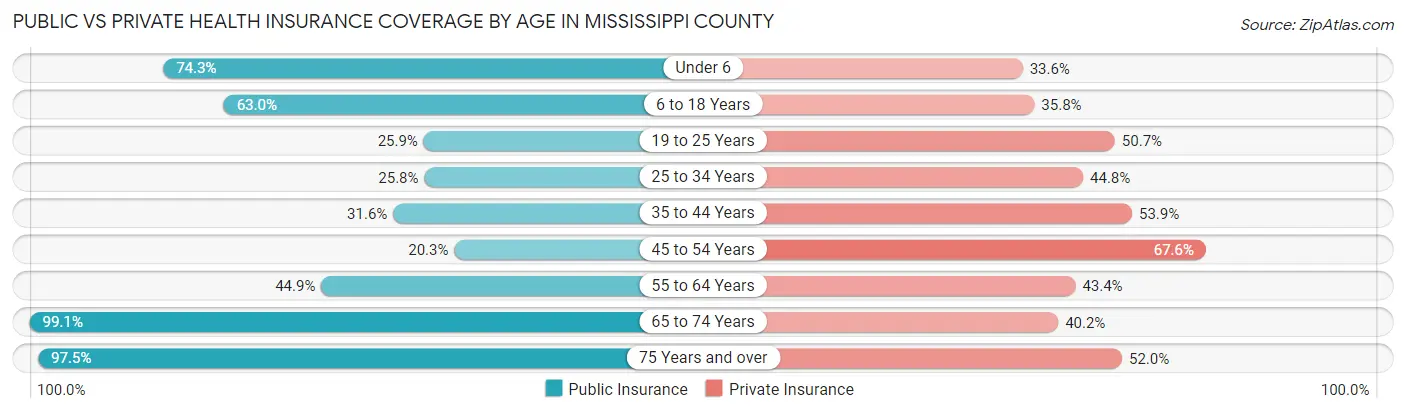
| Age Bracket | Public Insurance | Private Insurance |
| Under 6 | 511 (74.3%) | 231 (33.6%) |
| 6 to 18 Years | 1,347 (63.0%) | 764 (35.7%) |
| 19 to 25 Years | 226 (25.9%) | 442 (50.7%) |
| 25 to 34 Years | 265 (25.8%) | 460 (44.8%) |
| 35 to 44 Years | 411 (31.6%) | 701 (53.9%) |
| 45 to 54 Years | 271 (20.3%) | 904 (67.6%) |
| 55 to 64 Years | 600 (44.9%) | 579 (43.4%) |
| 65 to 74 Years | 1,275 (99.1%) | 517 (40.2%) |
| 75 Years and over | 819 (97.5%) | 437 (52.0%) |
| Total | 5,725 (52.9%) | 5,035 (46.5%) |
Disability Status by Sex by Age in Mississippi County
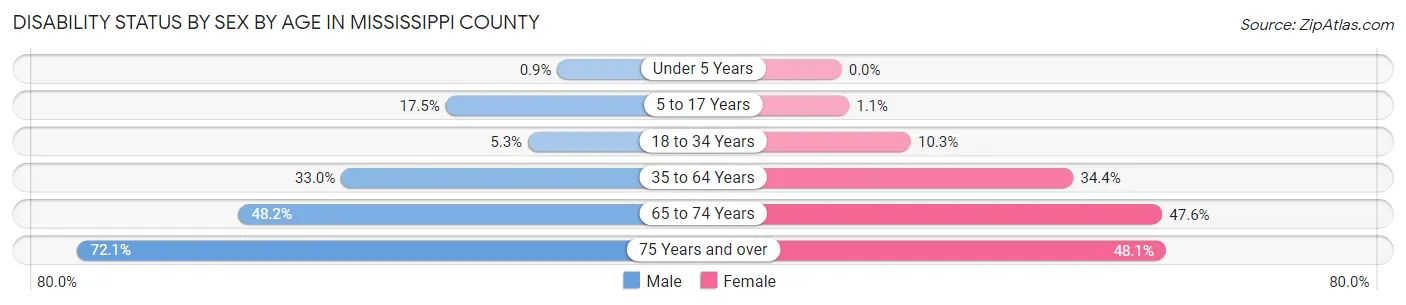
| Age Bracket | Male | Female |
| Under 5 Years | 3 (0.9%) | 0 (0.0%) |
| 5 to 17 Years | 198 (17.5%) | 11 (1.1%) |
| 18 to 34 Years | 51 (5.3%) | 107 (10.3%) |
| 35 to 64 Years | 593 (33.0%) | 749 (34.4%) |
| 65 to 74 Years | 257 (48.2%) | 359 (47.6%) |
| 75 Years and over | 264 (72.1%) | 228 (48.1%) |
Disability Class by Sex by Age in Mississippi County
Disability Class: Hearing Difficulty
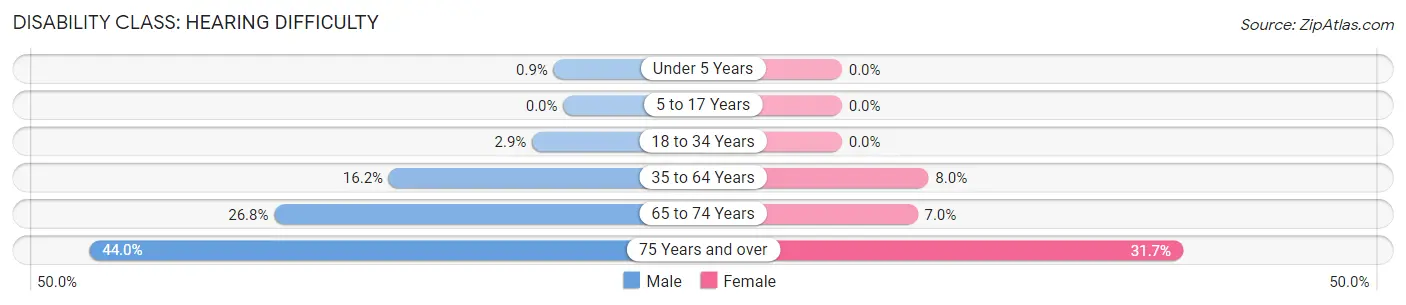
| Age Bracket | Male | Female |
| Under 5 Years | 3 (0.9%) | 0 (0.0%) |
| 5 to 17 Years | 0 (0.0%) | 0 (0.0%) |
| 18 to 34 Years | 28 (2.9%) | 0 (0.0%) |
| 35 to 64 Years | 291 (16.2%) | 175 (8.0%) |
| 65 to 74 Years | 143 (26.8%) | 53 (7.0%) |
| 75 Years and over | 161 (44.0%) | 150 (31.7%) |
Disability Class: Vision Difficulty
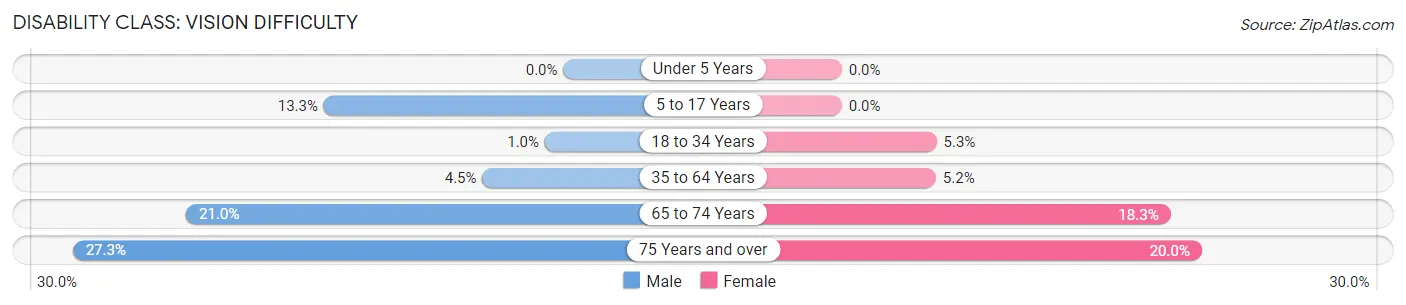
| Age Bracket | Male | Female |
| Under 5 Years | 0 (0.0%) | 0 (0.0%) |
| 5 to 17 Years | 151 (13.3%) | 0 (0.0%) |
| 18 to 34 Years | 10 (1.0%) | 55 (5.3%) |
| 35 to 64 Years | 81 (4.5%) | 114 (5.2%) |
| 65 to 74 Years | 112 (21.0%) | 138 (18.3%) |
| 75 Years and over | 100 (27.3%) | 95 (20.0%) |
Disability Class: Cognitive Difficulty
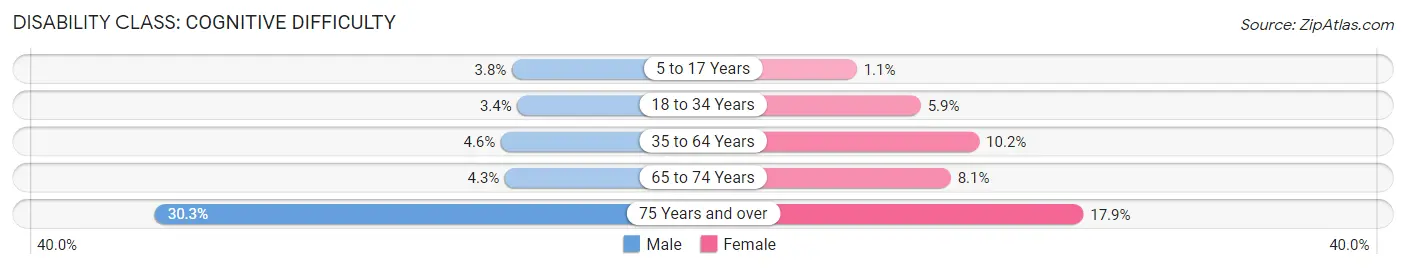
| Age Bracket | Male | Female |
| 5 to 17 Years | 43 (3.8%) | 11 (1.1%) |
| 18 to 34 Years | 33 (3.4%) | 61 (5.9%) |
| 35 to 64 Years | 83 (4.6%) | 222 (10.2%) |
| 65 to 74 Years | 23 (4.3%) | 61 (8.1%) |
| 75 Years and over | 111 (30.3%) | 85 (17.9%) |
Disability Class: Ambulatory Difficulty
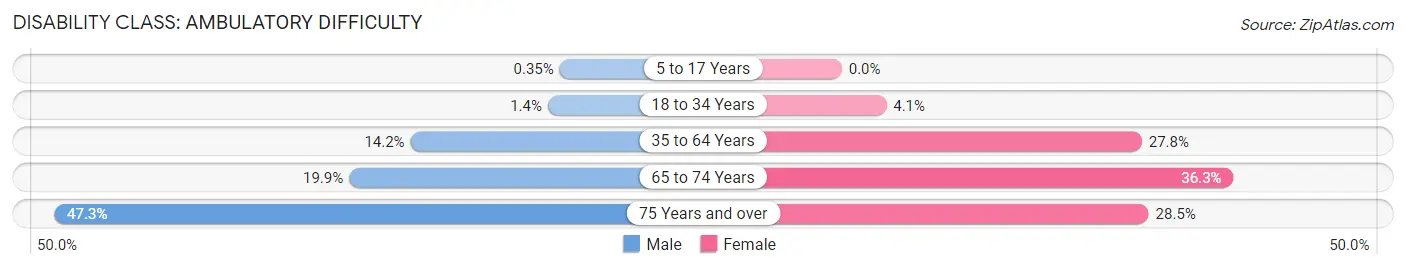
| Age Bracket | Male | Female |
| 5 to 17 Years | 4 (0.4%) | 0 (0.0%) |
| 18 to 34 Years | 14 (1.4%) | 43 (4.1%) |
| 35 to 64 Years | 255 (14.2%) | 606 (27.8%) |
| 65 to 74 Years | 106 (19.9%) | 274 (36.3%) |
| 75 Years and over | 173 (47.3%) | 135 (28.5%) |
Disability Class: Self-Care Difficulty
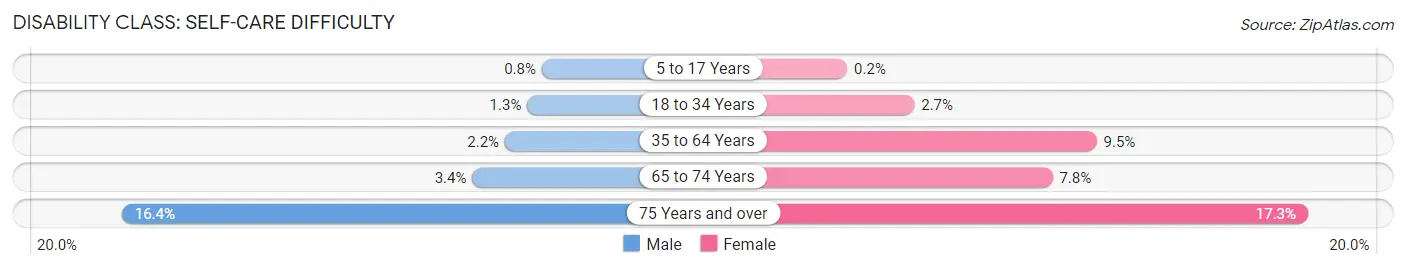
| Age Bracket | Male | Female |
| 5 to 17 Years | 9 (0.8%) | 2 (0.2%) |
| 18 to 34 Years | 13 (1.3%) | 28 (2.7%) |
| 35 to 64 Years | 39 (2.2%) | 206 (9.5%) |
| 65 to 74 Years | 18 (3.4%) | 59 (7.8%) |
| 75 Years and over | 60 (16.4%) | 82 (17.3%) |
Technology Access in Mississippi County
Computing Device Access in Mississippi County
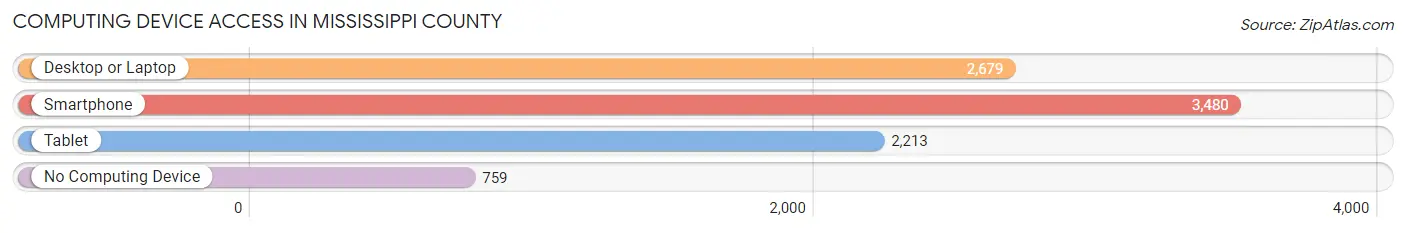
| Device Type | # Households | % Households |
| Desktop or Laptop | 2,679 | 58.1% |
| Smartphone | 3,480 | 75.5% |
| Tablet | 2,213 | 48.0% |
| No Computing Device | 759 | 16.5% |
| Total | 4,612 | 100.0% |
Internet Access in Mississippi County
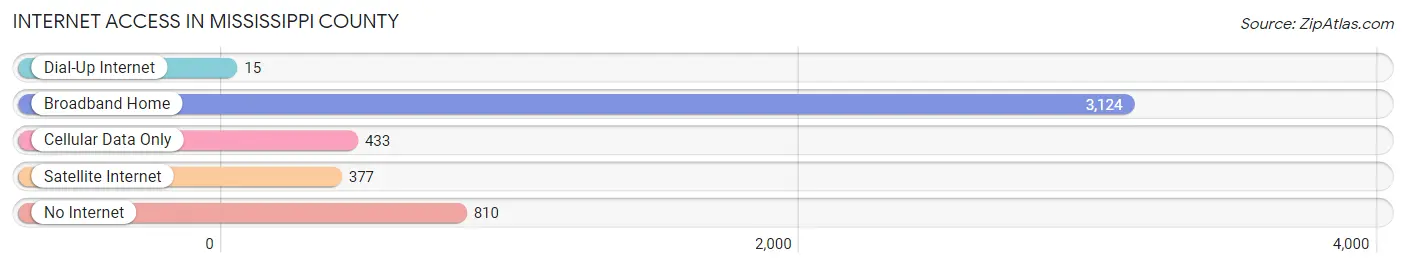
| Internet Type | # Households | % Households |
| Dial-Up Internet | 15 | 0.3% |
| Broadband Home | 3,124 | 67.7% |
| Cellular Data Only | 433 | 9.4% |
| Satellite Internet | 377 | 8.2% |
| No Internet | 810 | 17.6% |
| Total | 4,612 | 100.0% |
Mississippi County Summary
Mississippi County is located in the southeastern corner of Missouri, and is bordered by the states of Arkansas and Tennessee. It is part of the Bootheel region of the state, and is the second largest county in the state by area. The county seat is Charleston, and the largest city is East Prairie.
History
Mississippi County was formed in 1845 from parts of New Madrid, Scott, and Stoddard counties. It was named for the Mississippi River, which forms its western border. The county was largely rural and agricultural until the early 20th century, when the discovery of oil and natural gas in the area led to an economic boom. The county was also home to several large lumber mills, which provided jobs for many of the county’s residents.
Geography
Mississippi County is located in the southeastern corner of Missouri, and is bordered by the states of Arkansas and Tennessee. It is part of the Bootheel region of the state, and is the second largest county in the state by area. The county is mostly flat, with some rolling hills in the northern and eastern parts. The Mississippi River forms the western border of the county, and the St. Francis River forms the eastern border. The county is home to several large lakes, including Clearwater Lake, Lake Wappapello, and Lake Bessie.
Economy
Mississippi County’s economy is largely based on agriculture and manufacturing. The county is home to several large farms, which produce corn, soybeans, cotton, and other crops. The county is also home to several large manufacturing plants, which produce a variety of products, including automotive parts, furniture, and clothing. The county is also home to several oil and natural gas fields, which provide jobs for many of the county’s residents.
Demographics
As of the 2010 census, Mississippi County had a population of 14,358. The population was spread out, with 48.3% male and 51.7% female. The median age was 40.2 years. The racial makeup of the county was 87.2% White, 10.2% African American, 0.3% Native American, 0.3% Asian, 0.1% Pacific Islander, 0.7% from other races, and 1.2% from two or more races. Hispanic or Latino of any race were 2.2% of the population.
The median income for a household in the county was $35,945, and the median income for a family was $41,945. The per capita income for the county was $17,845. About 17.2% of families and 21.2% of the population were below the poverty line, including 28.2% of those under age 18 and 16.2% of those age 65 or over.
Common Questions
What is Per Capita Income in Mississippi County?
Per Capita income in Mississippi County is $21,070.
What is the Median Family Income in Mississippi County?
Median Family Income in Mississippi County is $47,912.
What is the Median Household income in Mississippi County?
Median Household Income in Mississippi County is $40,833.
What is Income or Wage Gap in Mississippi County?
Income or Wage Gap in Mississippi County is 21.5%.
Women in Mississippi County earn 78.5 cents for every dollar earned by a man.
What is Family Income Deficit in Mississippi County?
Family Income Deficit in Mississippi County is $8,800.
Families that are below poverty line in Mississippi County earn $8,800 less on average than the poverty threshold level.
What is Inequality or Gini Index in Mississippi County?
Inequality or Gini Index in Mississippi County is 0.46.
What is the Total Population of Mississippi County?
Total Population of Mississippi County is 12,305.
What is the Total Male Population of Mississippi County?
Total Male Population of Mississippi County is 6,527.
What is the Total Female Population of Mississippi County?
Total Female Population of Mississippi County is 5,778.
What is the Ratio of Males per 100 Females in Mississippi County?
There are 112.96 Males per 100 Females in Mississippi County.
What is the Ratio of Females per 100 Males in Mississippi County?
There are 88.52 Females per 100 Males in Mississippi County.
What is the Median Population Age in Mississippi County?
Median Population Age in Mississippi County is 42.1 Years.
What is the Average Family Size in Mississippi County
Average Family Size in Mississippi County is 2.9 People.
What is the Average Household Size in Mississippi County
Average Household Size in Mississippi County is 2.3 People.
How Large is the Labor Force in Mississippi County?
There are 4,568 People in the Labor Forcein in Mississippi County.
What is the Percentage of People in the Labor Force in Mississippi County?
45.6% of People are in the Labor Force in Mississippi County.
What is the Unemployment Rate in Mississippi County?
Unemployment Rate in Mississippi County is 5.1%.