Miller County, MO Map & Demographics
Miller County Map
Miller County Overview
$29,347
PER CAPITA INCOME
$72,606
AVG FAMILY INCOME
$53,490
AVG HOUSEHOLD INCOME
15.3%
WAGE / INCOME GAP [ % ]
84.7¢/ $1
WAGE / INCOME GAP [ $ ]
$9,827
FAMILY INCOME DEFICIT
0.45
INEQUALITY / GINI INDEX
24,855
TOTAL POPULATION
12,458
MALE POPULATION
12,397
FEMALE POPULATION
100.49
MALES / 100 FEMALES
99.51
FEMALES / 100 MALES
41.1
MEDIAN AGE
3.0
AVG FAMILY SIZE
2.4
AVG HOUSEHOLD SIZE
11,941
LABOR FORCE [ PEOPLE ]
60.5%
PERCENT IN LABOR FORCE
4.6%
UNEMPLOYMENT RATE
Income in Miller County
Income Overview in Miller County
Per Capita Income in Miller County is $29,347, while median incomes of families and households are $72,606 and $53,490 respectively.
| Characteristic | Number | Measure |
| Per Capita Income | 24,855 | $29,347 |
| Median Family Income | 6,443 | $72,606 |
| Mean Family Income | 6,443 | $89,101 |
| Median Household Income | 10,116 | $53,490 |
| Mean Household Income | 10,116 | $71,776 |
| Income Deficit | 6,443 | $9,827 |
| Wage / Income Gap (%) | 24,855 | 15.35% |
| Wage / Income Gap ($) | 24,855 | 84.65¢ per $1 |
| Gini / Inequality Index | 24,855 | 0.45 |
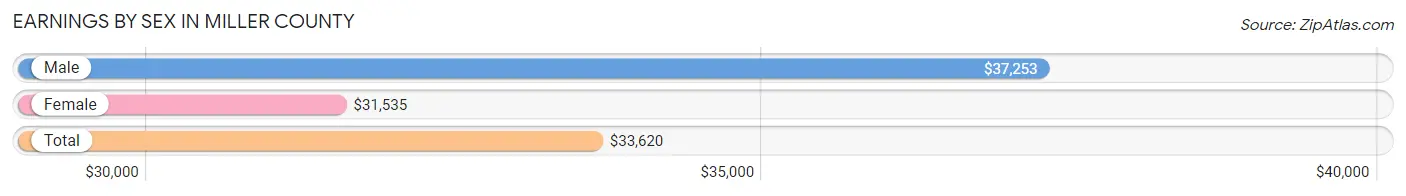
Earnings by Sex in Miller County
Average Earnings in Miller County are $33,620, $37,253 for men and $31,535 for women, a difference of 15.3%.
| Sex | Number | Average Earnings |
| Male | 6,281 (50.2%) | $37,253 |
| Female | 6,219 (49.7%) | $31,535 |
| Total | 12,500 (100.0%) | $33,620 |
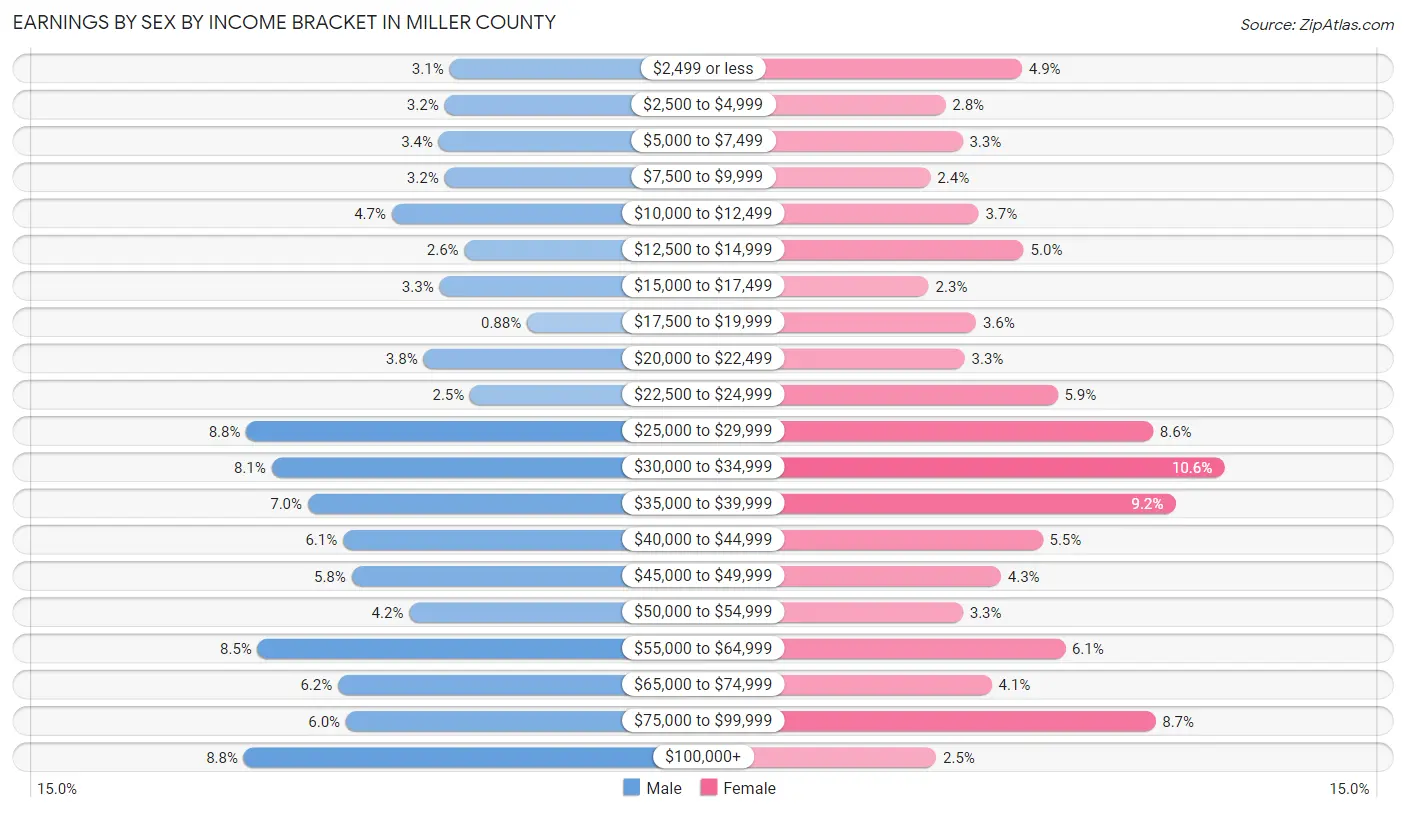
Earnings by Sex by Income Bracket in Miller County
The most common earnings brackets in Miller County are $100,000+ for men (555 | 8.8%) and $30,000 to $34,999 for women (659 | 10.6%).
| Income | Male | Female |
| $2,499 or less | 192 (3.1%) | 306 (4.9%) |
| $2,500 to $4,999 | 201 (3.2%) | 172 (2.8%) |
| $5,000 to $7,499 | 211 (3.4%) | 202 (3.3%) |
| $7,500 to $9,999 | 201 (3.2%) | 146 (2.4%) |
| $10,000 to $12,499 | 294 (4.7%) | 230 (3.7%) |
| $12,500 to $14,999 | 166 (2.6%) | 309 (5.0%) |
| $15,000 to $17,499 | 210 (3.3%) | 143 (2.3%) |
| $17,500 to $19,999 | 55 (0.9%) | 226 (3.6%) |
| $20,000 to $22,499 | 238 (3.8%) | 206 (3.3%) |
| $22,500 to $24,999 | 156 (2.5%) | 368 (5.9%) |
| $25,000 to $29,999 | 551 (8.8%) | 535 (8.6%) |
| $30,000 to $34,999 | 506 (8.1%) | 659 (10.6%) |
| $35,000 to $39,999 | 442 (7.0%) | 574 (9.2%) |
| $40,000 to $44,999 | 380 (6.0%) | 342 (5.5%) |
| $45,000 to $49,999 | 365 (5.8%) | 269 (4.3%) |
| $50,000 to $54,999 | 263 (4.2%) | 203 (3.3%) |
| $55,000 to $64,999 | 531 (8.5%) | 381 (6.1%) |
| $65,000 to $74,999 | 389 (6.2%) | 253 (4.1%) |
| $75,000 to $99,999 | 375 (6.0%) | 539 (8.7%) |
| $100,000+ | 555 (8.8%) | 156 (2.5%) |
| Total | 6,281 (100.0%) | 6,219 (100.0%) |
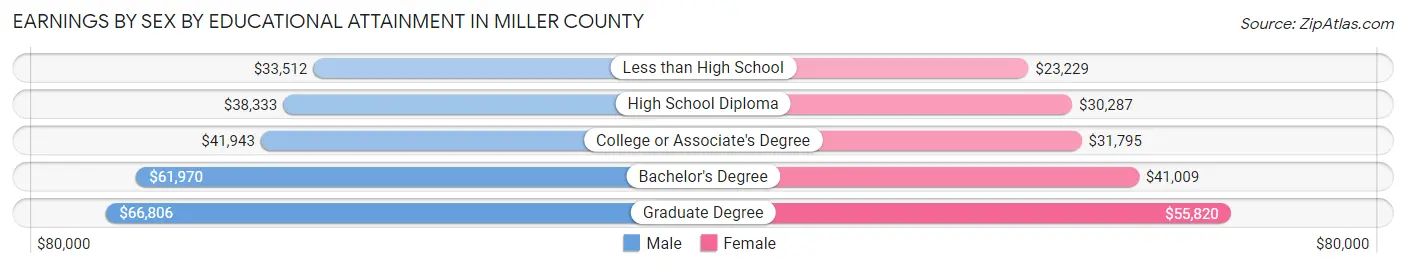
Earnings by Sex by Educational Attainment in Miller County
Average earnings in Miller County are $41,702 for men and $34,316 for women, a difference of 17.7%. Men with an educational attainment of graduate degree enjoy the highest average annual earnings of $66,806, while those with less than high school education earn the least with $33,512. Women with an educational attainment of graduate degree earn the most with the average annual earnings of $55,820, while those with less than high school education have the smallest earnings of $23,229.
| Educational Attainment | Male Income | Female Income |
| Less than High School | $33,512 | $23,229 |
| High School Diploma | $38,333 | $30,287 |
| College or Associate's Degree | $41,943 | $31,795 |
| Bachelor's Degree | $61,970 | $41,009 |
| Graduate Degree | $66,806 | $55,820 |
| Total | $41,702 | $34,316 |
Family Income in Miller County
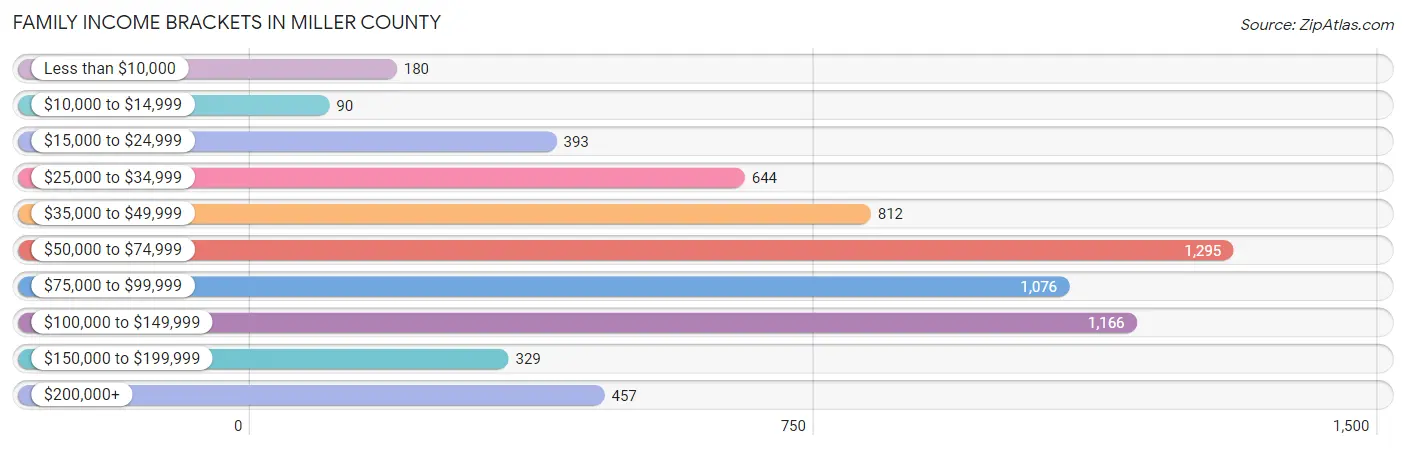
Family Income Brackets in Miller County
According to the Miller County family income data, there are 1,295 families falling into the $50,000 to $74,999 income range, which is the most common income bracket and makes up 20.1% of all families. Conversely, the $10,000 to $14,999 income bracket is the least frequent group with only 90 families (1.4%) belonging to this category.
| Income Bracket | # Families | % Families |
| Less than $10,000 | 180 | 2.8% |
| $10,000 to $14,999 | 90 | 1.4% |
| $15,000 to $24,999 | 393 | 6.1% |
| $25,000 to $34,999 | 644 | 10.0% |
| $35,000 to $49,999 | 812 | 12.6% |
| $50,000 to $74,999 | 1,295 | 20.1% |
| $75,000 to $99,999 | 1,076 | 16.7% |
| $100,000 to $149,999 | 1,166 | 18.1% |
| $150,000 to $199,999 | 329 | 5.1% |
| $200,000+ | 457 | 7.1% |
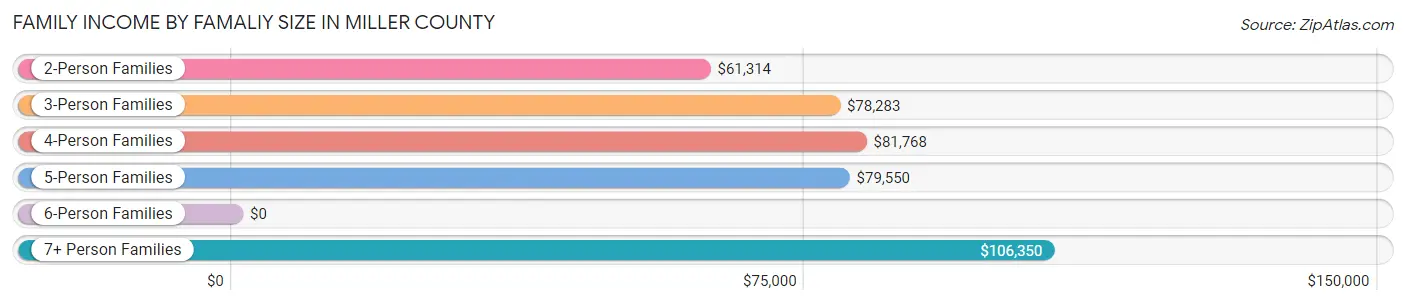
Family Income by Famaliy Size in Miller County
7+ person families (155 | 2.4%) account for the highest median family income in Miller County with $106,350 per family, while 2-person families (3,369 | 52.3%) have the highest median income of $30,657 per family member.
| Income Bracket | # Families | Median Income |
| 2-Person Families | 3,369 (52.3%) | $61,314 |
| 3-Person Families | 1,323 (20.5%) | $78,283 |
| 4-Person Families | 966 (15.0%) | $81,768 |
| 5-Person Families | 499 (7.7%) | $79,550 |
| 6-Person Families | 131 (2.0%) | $0 |
| 7+ Person Families | 155 (2.4%) | $106,350 |
| Total | 6,443 (100.0%) | $72,606 |
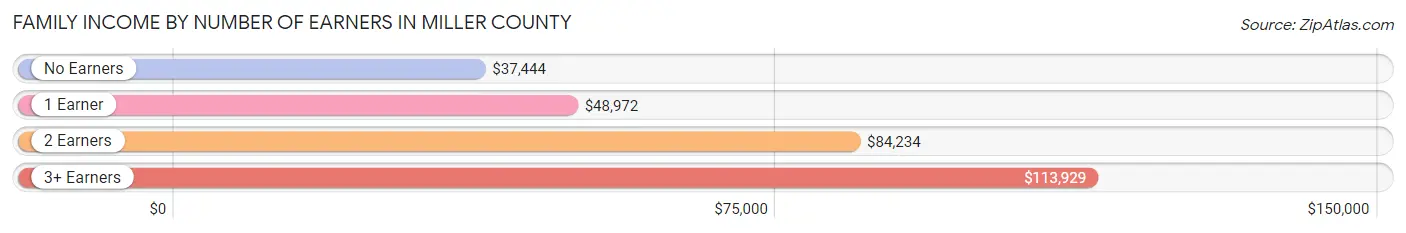
Family Income by Number of Earners in Miller County
The median family income in Miller County is $72,606, with families comprising 3+ earners (776) having the highest median family income of $113,929, while families with no earners (1,177) have the lowest median family income of $37,444, accounting for 12.0% and 18.3% of families, respectively.
| Number of Earners | # Families | Median Income |
| No Earners | 1,177 (18.3%) | $37,444 |
| 1 Earner | 1,701 (26.4%) | $48,972 |
| 2 Earners | 2,789 (43.3%) | $84,234 |
| 3+ Earners | 776 (12.0%) | $113,929 |
| Total | 6,443 (100.0%) | $72,606 |
Household Income in Miller County
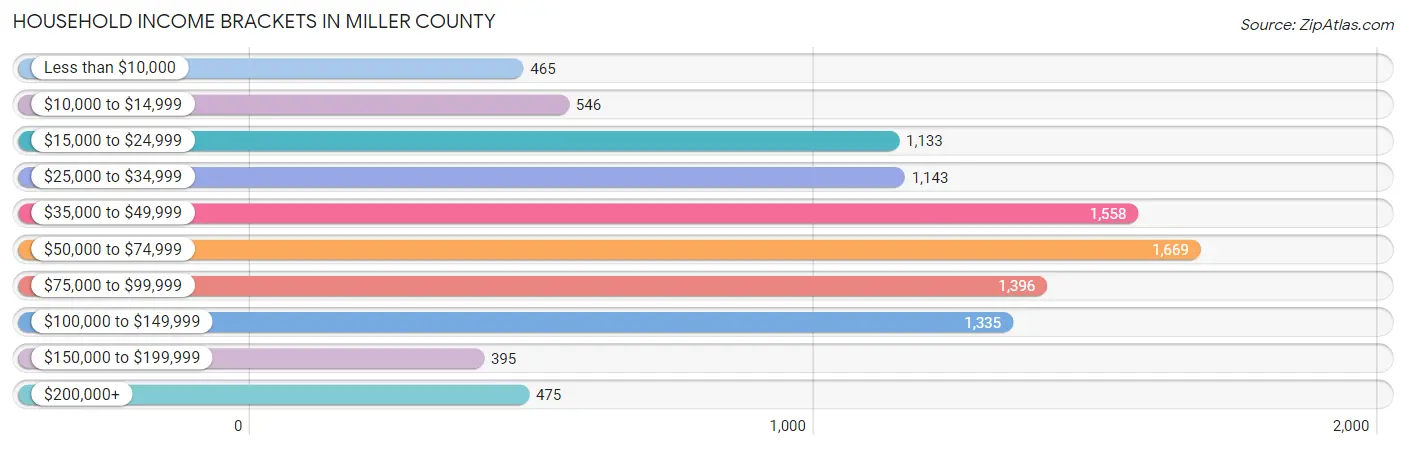
Household Income Brackets in Miller County
With 1,669 households falling in the category, the $50,000 to $74,999 income range is the most frequent in Miller County, accounting for 16.5% of all households. In contrast, only 395 households (3.9%) fall into the $150,000 to $199,999 income bracket, making it the least populous group.
| Income Bracket | # Households | % Households |
| Less than $10,000 | 465 | 4.6% |
| $10,000 to $14,999 | 546 | 5.4% |
| $15,000 to $24,999 | 1,133 | 11.2% |
| $25,000 to $34,999 | 1,143 | 11.3% |
| $35,000 to $49,999 | 1,558 | 15.4% |
| $50,000 to $74,999 | 1,669 | 16.5% |
| $75,000 to $99,999 | 1,396 | 13.8% |
| $100,000 to $149,999 | 1,335 | 13.2% |
| $150,000 to $199,999 | 395 | 3.9% |
| $200,000+ | 475 | 4.7% |
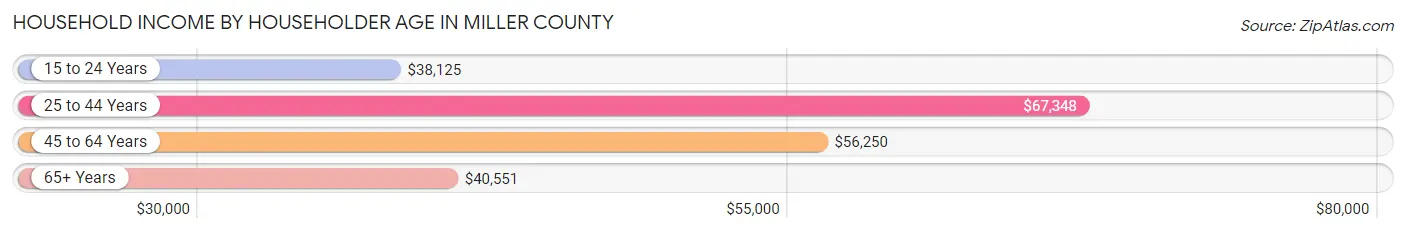
Household Income by Householder Age in Miller County
The median household income in Miller County is $53,490, with the highest median household income of $67,348 found in the 25 to 44 years age bracket for the primary householder. A total of 2,698 households (26.7%) fall into this category. Meanwhile, the 15 to 24 years age bracket for the primary householder has the lowest median household income of $38,125, with 340 households (3.4%) in this group.
| Income Bracket | # Households | Median Income |
| 15 to 24 Years | 340 (3.4%) | $38,125 |
| 25 to 44 Years | 2,698 (26.7%) | $67,348 |
| 45 to 64 Years | 4,013 (39.7%) | $56,250 |
| 65+ Years | 3,065 (30.3%) | $40,551 |
| Total | 10,116 (100.0%) | $53,490 |
Poverty in Miller County
Income Below Poverty by Sex and Age in Miller County
With 16.2% poverty level for males and 15.7% for females among the residents of Miller County, 16 and 17 year old males and 16 and 17 year old females are the most vulnerable to poverty, with 126 males (37.2%) and 137 females (39.8%) in their respective age groups living below the poverty level.
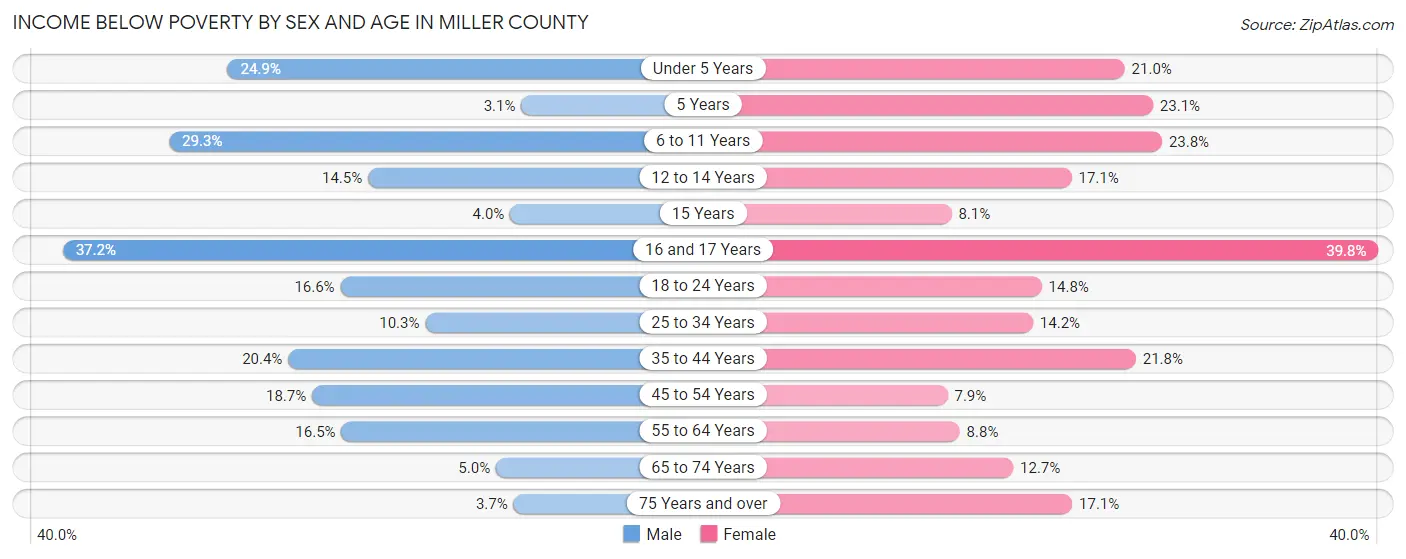
| Age Bracket | Male | Female |
| Under 5 Years | 179 (24.9%) | 151 (21.0%) |
| 5 Years | 2 (3.1%) | 73 (23.1%) |
| 6 to 11 Years | 305 (29.3%) | 212 (23.8%) |
| 12 to 14 Years | 76 (14.5%) | 73 (17.1%) |
| 15 Years | 7 (4.0%) | 14 (8.1%) |
| 16 and 17 Years | 126 (37.2%) | 137 (39.8%) |
| 18 to 24 Years | 167 (16.6%) | 122 (14.8%) |
| 25 to 34 Years | 142 (10.2%) | 208 (14.2%) |
| 35 to 44 Years | 303 (20.4%) | 317 (21.8%) |
| 45 to 54 Years | 285 (18.7%) | 110 (7.9%) |
| 55 to 64 Years | 296 (16.5%) | 161 (8.7%) |
| 65 to 74 Years | 68 (5.0%) | 175 (12.7%) |
| 75 Years and over | 31 (3.7%) | 166 (17.1%) |
| Total | 1,987 (16.2%) | 1,919 (15.7%) |
Income Above Poverty by Sex and Age in Miller County
According to the poverty statistics in Miller County, males aged 5 years and females aged 45 to 54 years are the age groups that are most secure financially, with 96.9% of males and 92.1% of females in these age groups living above the poverty line.
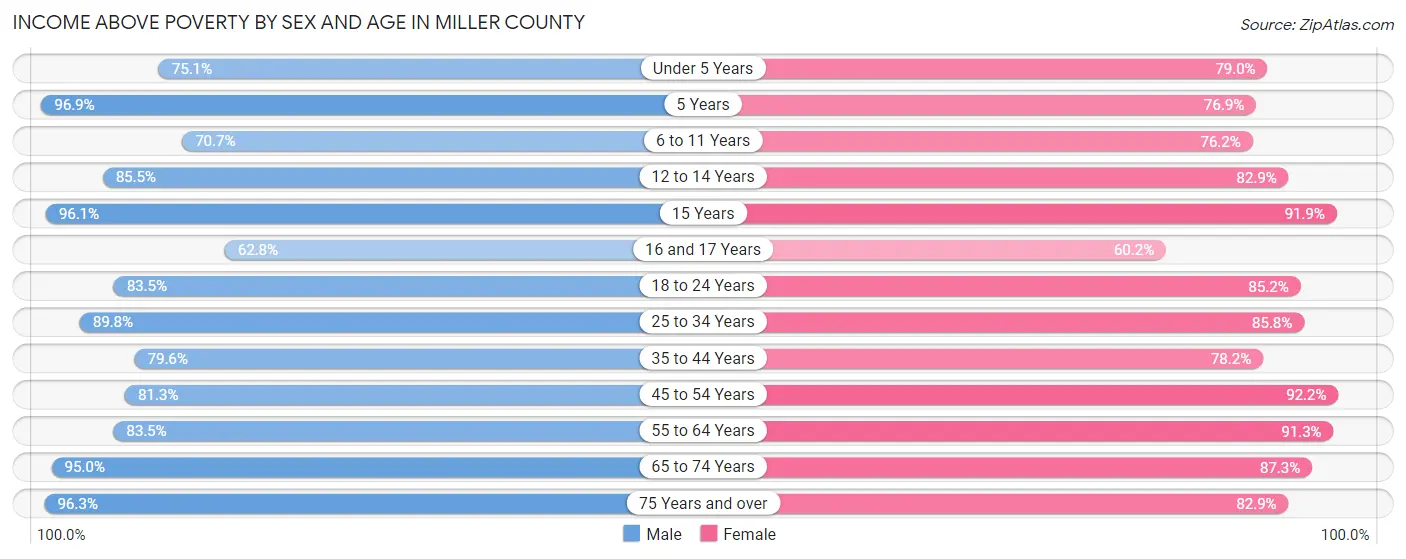
| Age Bracket | Male | Female |
| Under 5 Years | 539 (75.1%) | 568 (79.0%) |
| 5 Years | 62 (96.9%) | 243 (76.9%) |
| 6 to 11 Years | 737 (70.7%) | 680 (76.2%) |
| 12 to 14 Years | 448 (85.5%) | 355 (82.9%) |
| 15 Years | 170 (96.1%) | 158 (91.9%) |
| 16 and 17 Years | 213 (62.8%) | 207 (60.2%) |
| 18 to 24 Years | 842 (83.5%) | 700 (85.2%) |
| 25 to 34 Years | 1,243 (89.7%) | 1,258 (85.8%) |
| 35 to 44 Years | 1,180 (79.6%) | 1,135 (78.2%) |
| 45 to 54 Years | 1,242 (81.3%) | 1,292 (92.1%) |
| 55 to 64 Years | 1,500 (83.5%) | 1,679 (91.2%) |
| 65 to 74 Years | 1,293 (95.0%) | 1,201 (87.3%) |
| 75 Years and over | 806 (96.3%) | 805 (82.9%) |
| Total | 10,275 (83.8%) | 10,281 (84.3%) |
Income Below Poverty Among Married-Couple Families in Miller County
The poverty statistics for married-couple families in Miller County show that 5.4% or 281 of the total 5,174 families live below the poverty line. Families with 3 or 4 children have the highest poverty rate of 34.9%, comprising of 173 families. On the other hand, families with 5 or more children have the lowest poverty rate of 0.0%, which includes 0 families.
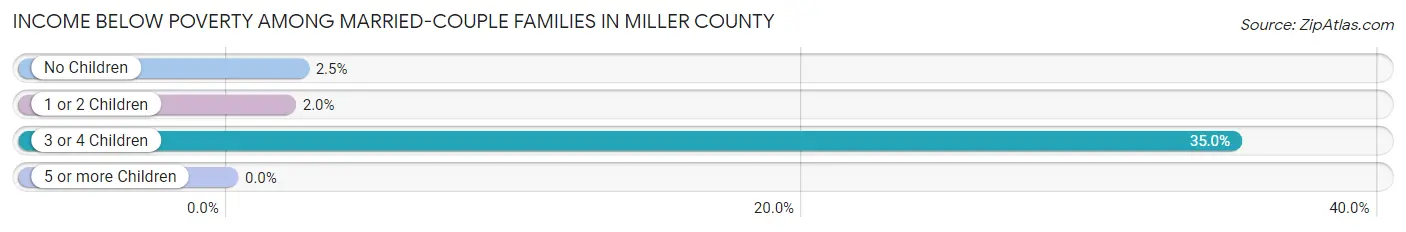
| Children | Above Poverty | Below Poverty |
| No Children | 3,245 (97.5%) | 82 (2.5%) |
| 1 or 2 Children | 1,266 (98.0%) | 26 (2.0%) |
| 3 or 4 Children | 322 (65.0%) | 173 (34.9%) |
| 5 or more Children | 60 (100.0%) | 0 (0.0%) |
| Total | 4,893 (94.6%) | 281 (5.4%) |
Income Below Poverty Among Single-Parent Households in Miller County
According to the poverty data in Miller County, 36.3% or 152 single-father households and 28.7% or 244 single-mother households are living below the poverty line. Among single-father households, those with 3 or 4 children have the highest poverty rate, with 15 households (51.7%) experiencing poverty. Likewise, among single-mother households, those with 3 or 4 children have the highest poverty rate, with 71 households (75.5%) falling below the poverty line.
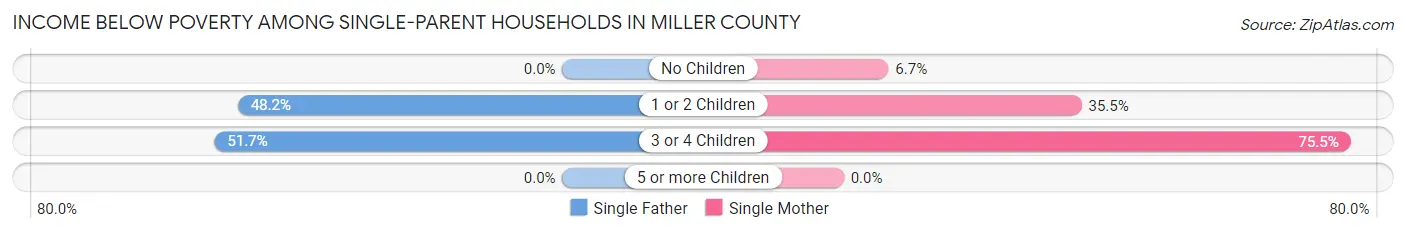
| Children | Single Father | Single Mother |
| No Children | 0 (0.0%) | 22 (6.7%) |
| 1 or 2 Children | 137 (48.2%) | 151 (35.4%) |
| 3 or 4 Children | 15 (51.7%) | 71 (75.5%) |
| 5 or more Children | 0 (0.0%) | 0 (0.0%) |
| Total | 152 (36.3%) | 244 (28.7%) |
Income Below Poverty Among Married-Couple vs Single-Parent Households in Miller County
The poverty data for Miller County shows that 281 of the married-couple family households (5.4%) and 396 of the single-parent households (31.2%) are living below the poverty level. Within the married-couple family households, those with 3 or 4 children have the highest poverty rate, with 173 households (34.9%) falling below the poverty line. Among the single-parent households, those with 3 or 4 children have the highest poverty rate, with 86 household (69.9%) living below poverty.
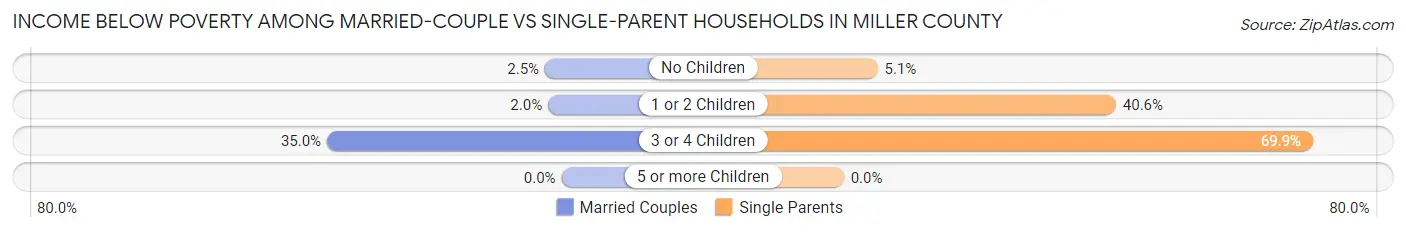
| Children | Married-Couple Families | Single-Parent Households |
| No Children | 82 (2.5%) | 22 (5.1%) |
| 1 or 2 Children | 26 (2.0%) | 288 (40.6%) |
| 3 or 4 Children | 173 (34.9%) | 86 (69.9%) |
| 5 or more Children | 0 (0.0%) | 0 (0.0%) |
| Total | 281 (5.4%) | 396 (31.2%) |
Race in Miller County
The most populous races in Miller County are White / Caucasian (23,797 | 95.7%), Hispanic or Latino (530 | 2.1%), and Two or more Races (518 | 2.1%).
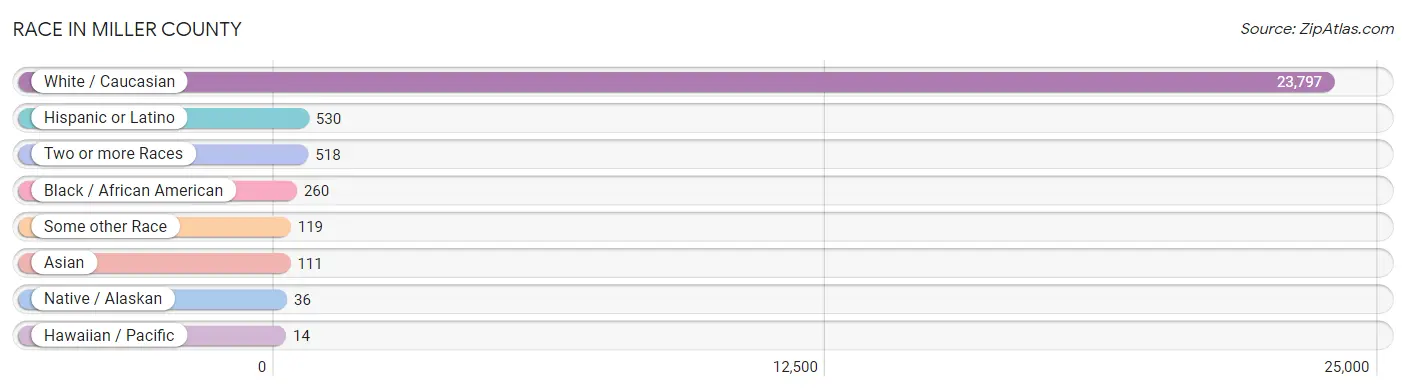
| Race | # Population | % Population |
| Asian | 111 | 0.4% |
| Black / African American | 260 | 1.1% |
| Hawaiian / Pacific | 14 | 0.1% |
| Hispanic or Latino | 530 | 2.1% |
| Native / Alaskan | 36 | 0.1% |
| White / Caucasian | 23,797 | 95.7% |
| Two or more Races | 518 | 2.1% |
| Some other Race | 119 | 0.5% |
| Total | 24,855 | 100.0% |
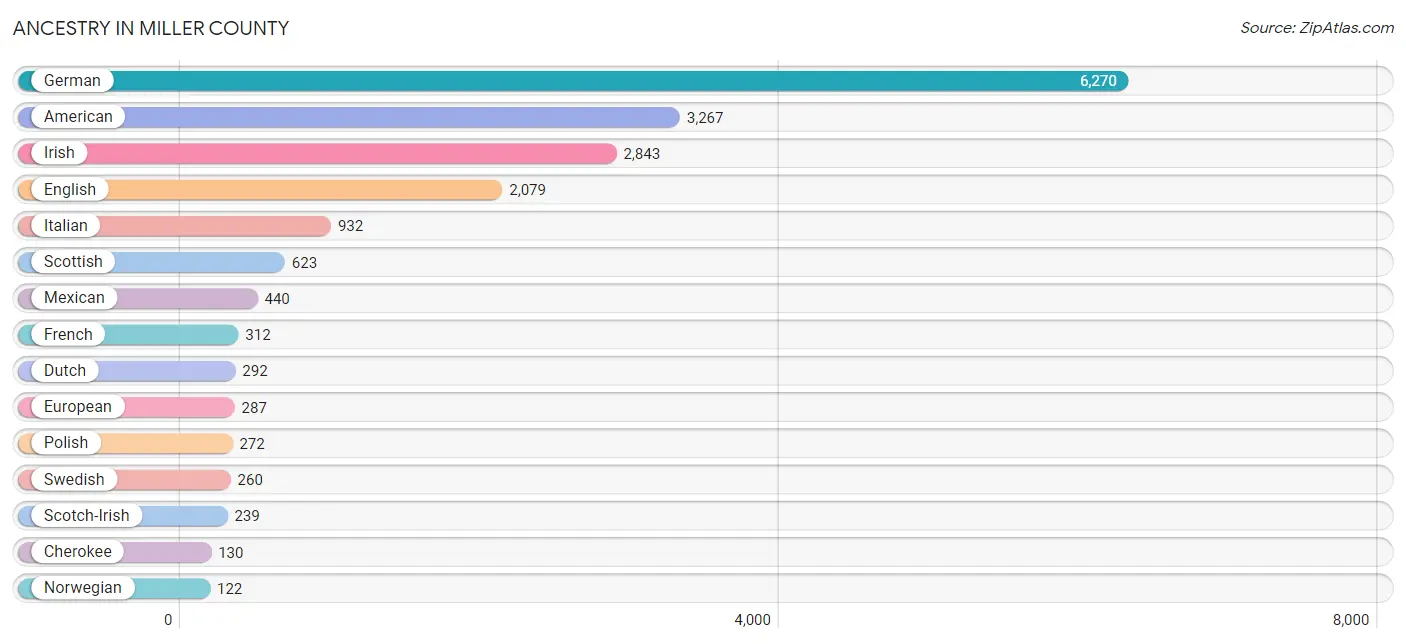
Ancestry in Miller County
The most populous ancestries reported in Miller County are German (6,270 | 25.2%), American (3,267 | 13.1%), Irish (2,843 | 11.4%), English (2,079 | 8.4%), and Italian (932 | 3.7%), together accounting for 61.9% of all Miller County residents.
| Ancestry | # Population | % Population |
| American | 3,267 | 13.1% |
| Apache | 3 | 0.0% |
| Arab | 4 | 0.0% |
| Austrian | 25 | 0.1% |
| Belgian | 7 | 0.0% |
| Bhutanese | 32 | 0.1% |
| Blackfeet | 20 | 0.1% |
| British | 37 | 0.2% |
| Burmese | 79 | 0.3% |
| Canadian | 28 | 0.1% |
| Central American | 13 | 0.1% |
| Cherokee | 130 | 0.5% |
| Chippewa | 3 | 0.0% |
| Choctaw | 32 | 0.1% |
| Colombian | 3 | 0.0% |
| Creek | 17 | 0.1% |
| Croatian | 18 | 0.1% |
| Crow | 3 | 0.0% |
| Czech | 91 | 0.4% |
| Czechoslovakian | 7 | 0.0% |
| Danish | 68 | 0.3% |
| Dutch | 292 | 1.2% |
| Eastern European | 17 | 0.1% |
| English | 2,079 | 8.4% |
| European | 287 | 1.1% |
| Finnish | 2 | 0.0% |
| French | 312 | 1.3% |
| French Canadian | 25 | 0.1% |
| German | 6,270 | 25.2% |
| Greek | 6 | 0.0% |
| Hungarian | 92 | 0.4% |
| Icelander | 20 | 0.1% |
| Indian (Asian) | 71 | 0.3% |
| Irish | 2,843 | 11.4% |
| Italian | 932 | 3.7% |
| Korean | 27 | 0.1% |
| Lithuanian | 6 | 0.0% |
| Luxembourger | 14 | 0.1% |
| Menominee | 2 | 0.0% |
| Mexican | 440 | 1.8% |
| Native Hawaiian | 32 | 0.1% |
| Northern European | 3 | 0.0% |
| Norwegian | 122 | 0.5% |
| Pakistani | 13 | 0.1% |
| Polish | 272 | 1.1% |
| Russian | 13 | 0.1% |
| Salvadoran | 13 | 0.1% |
| Samoan | 14 | 0.1% |
| Scandinavian | 97 | 0.4% |
| Scotch-Irish | 239 | 1.0% |
| Scottish | 623 | 2.5% |
| Slavic | 1 | 0.0% |
| Slovak | 1 | 0.0% |
| South American | 3 | 0.0% |
| Spaniard | 37 | 0.2% |
| Spanish | 3 | 0.0% |
| Swedish | 260 | 1.1% |
| Swiss | 57 | 0.2% |
| Syrian | 4 | 0.0% |
| Thai | 2 | 0.0% |
| Welsh | 67 | 0.3% | View All 61 Rows |
Immigrants in Miller County
The most numerous immigrant groups reported in Miller County came from Latin America (171 | 0.7%), Central America (168 | 0.7%), Mexico (155 | 0.6%), Asia (72 | 0.3%), and Europe (58 | 0.2%), together accounting for 2.5% of all Miller County residents.
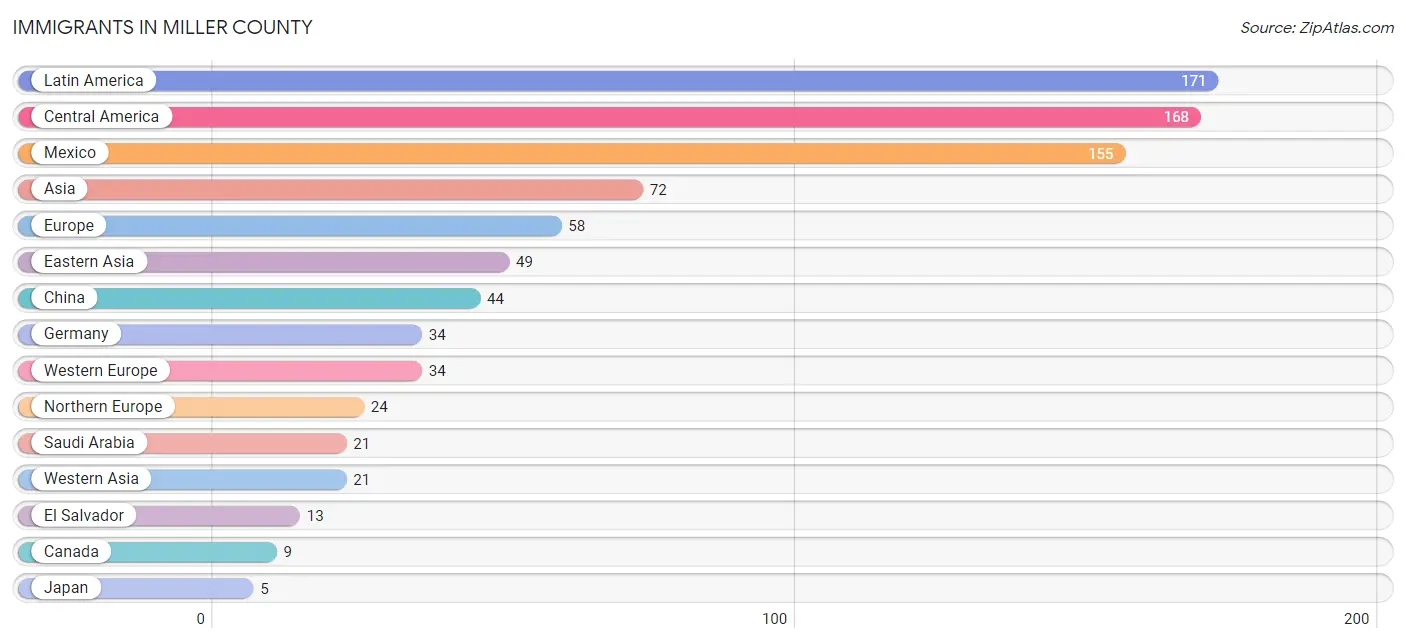
| Immigration Origin | # Population | % Population |
| Asia | 72 | 0.3% |
| Canada | 9 | 0.0% |
| Central America | 168 | 0.7% |
| China | 44 | 0.2% |
| Colombia | 3 | 0.0% |
| Eastern Asia | 49 | 0.2% |
| El Salvador | 13 | 0.1% |
| Europe | 58 | 0.2% |
| Germany | 34 | 0.1% |
| Japan | 5 | 0.0% |
| Latin America | 171 | 0.7% |
| Mexico | 155 | 0.6% |
| Northern Europe | 24 | 0.1% |
| Philippines | 2 | 0.0% |
| Saudi Arabia | 21 | 0.1% |
| South America | 3 | 0.0% |
| South Eastern Asia | 2 | 0.0% |
| Western Asia | 21 | 0.1% |
| Western Europe | 34 | 0.1% | View All 19 Rows |
Sex and Age in Miller County
Sex and Age in Miller County
The most populous age groups in Miller County are 60 to 64 Years (1,056 | 8.5%) for men and 60 to 64 Years (998 | 8.1%) for women.
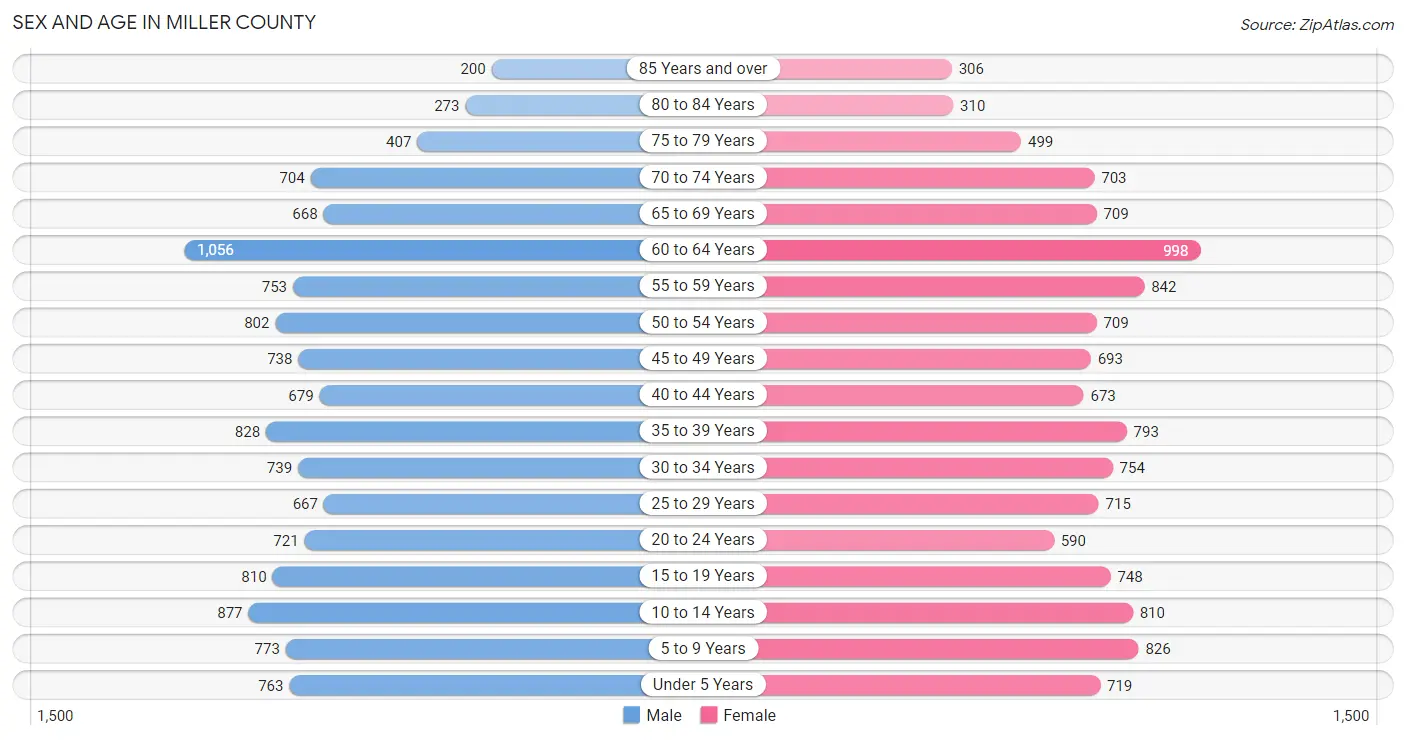
| Age Bracket | Male | Female |
| Under 5 Years | 763 (6.1%) | 719 (5.8%) |
| 5 to 9 Years | 773 (6.2%) | 826 (6.7%) |
| 10 to 14 Years | 877 (7.0%) | 810 (6.5%) |
| 15 to 19 Years | 810 (6.5%) | 748 (6.0%) |
| 20 to 24 Years | 721 (5.8%) | 590 (4.8%) |
| 25 to 29 Years | 667 (5.3%) | 715 (5.8%) |
| 30 to 34 Years | 739 (5.9%) | 754 (6.1%) |
| 35 to 39 Years | 828 (6.7%) | 793 (6.4%) |
| 40 to 44 Years | 679 (5.4%) | 673 (5.4%) |
| 45 to 49 Years | 738 (5.9%) | 693 (5.6%) |
| 50 to 54 Years | 802 (6.4%) | 709 (5.7%) |
| 55 to 59 Years | 753 (6.0%) | 842 (6.8%) |
| 60 to 64 Years | 1,056 (8.5%) | 998 (8.1%) |
| 65 to 69 Years | 668 (5.4%) | 709 (5.7%) |
| 70 to 74 Years | 704 (5.7%) | 703 (5.7%) |
| 75 to 79 Years | 407 (3.3%) | 499 (4.0%) |
| 80 to 84 Years | 273 (2.2%) | 310 (2.5%) |
| 85 Years and over | 200 (1.6%) | 306 (2.5%) |
| Total | 12,458 (100.0%) | 12,397 (100.0%) |
Families and Households in Miller County
Median Family Size in Miller County
The median family size in Miller County is 3.05 persons per family, with married-couple families (5,174 | 80.3%) accounting for the largest median family size of 3.08 persons per family. On the other hand, single male/father families (419 | 6.5%) represent the smallest median family size with 2.85 persons per family.
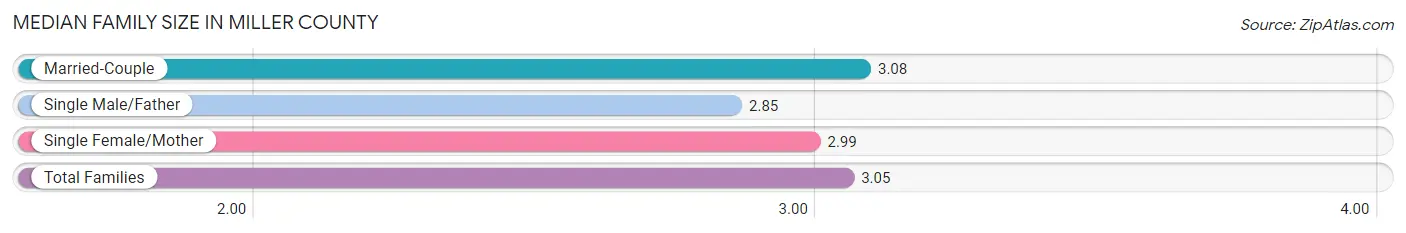
| Family Type | # Families | Family Size |
| Married-Couple | 5,174 (80.3%) | 3.08 |
| Single Male/Father | 419 (6.5%) | 2.85 |
| Single Female/Mother | 850 (13.2%) | 2.99 |
| Total Families | 6,443 (100.0%) | 3.05 |
Median Household Size in Miller County
The median household size in Miller County is 2.42 persons per household, with single male/father households (419 | 4.1%) accounting for the largest median household size of 3.31 persons per household. non-family households (3,673 | 36.3%) represent the smallest median household size with 1.17 persons per household.
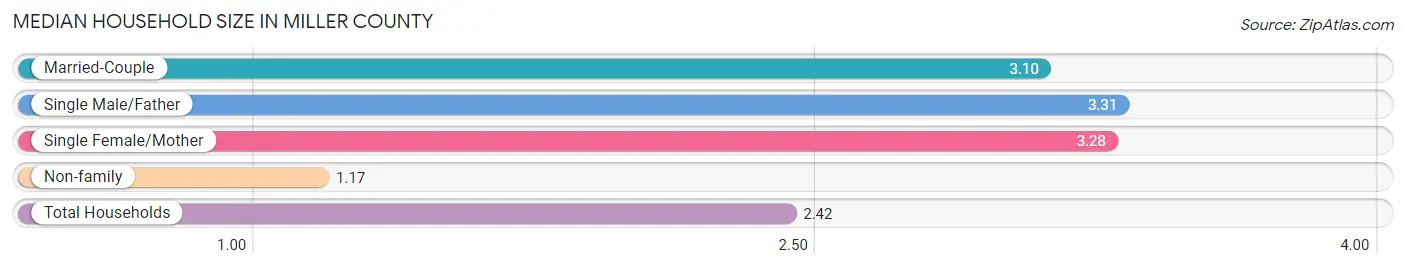
| Household Type | # Households | Household Size |
| Married-Couple | 5,174 (51.1%) | 3.10 |
| Single Male/Father | 419 (4.1%) | 3.31 |
| Single Female/Mother | 850 (8.4%) | 3.28 |
| Non-family | 3,673 (36.3%) | 1.17 |
| Total Households | 10,116 (100.0%) | 2.42 |
Household Size by Marriage Status in Miller County
Out of a total of 10,116 households in Miller County, 6,443 (63.7%) are family households, while 3,673 (36.3%) are nonfamily households. The most numerous type of family households are 2-person households, comprising 3,117, and the most common type of nonfamily households are 1-person households, comprising 3,102.
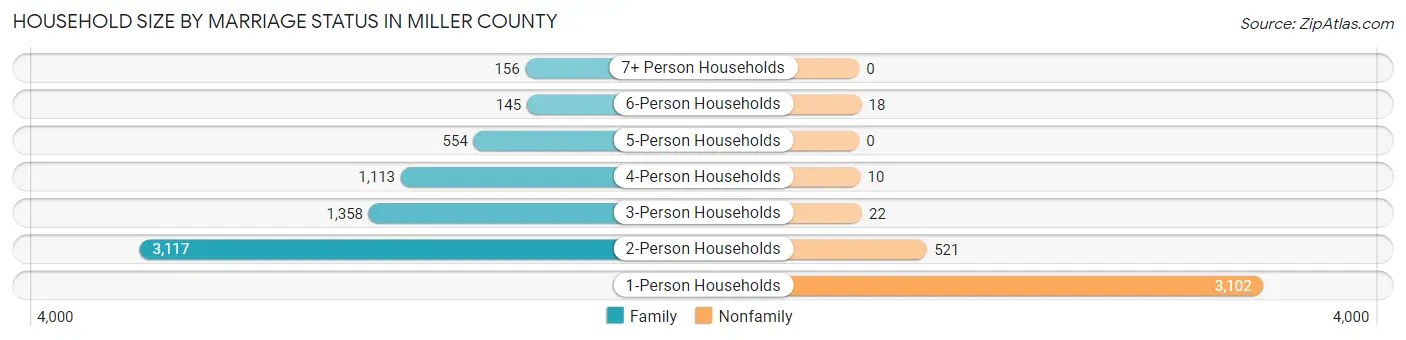
| Household Size | Family Households | Nonfamily Households |
| 1-Person Households | - | 3,102 (30.7%) |
| 2-Person Households | 3,117 (30.8%) | 521 (5.1%) |
| 3-Person Households | 1,358 (13.4%) | 22 (0.2%) |
| 4-Person Households | 1,113 (11.0%) | 10 (0.1%) |
| 5-Person Households | 554 (5.5%) | 0 (0.0%) |
| 6-Person Households | 145 (1.4%) | 18 (0.2%) |
| 7+ Person Households | 156 (1.5%) | 0 (0.0%) |
| Total | 6,443 (63.7%) | 3,673 (36.3%) |
Female Fertility in Miller County
Fertility by Age in Miller County
Average fertility rate in Miller County is 43.0 births per 1,000 women. Women in the age bracket of 20 to 34 years have the highest fertility rate with 65.0 births per 1,000 women. Women in the age bracket of 20 to 34 years acount for 61.2% of all women with births.
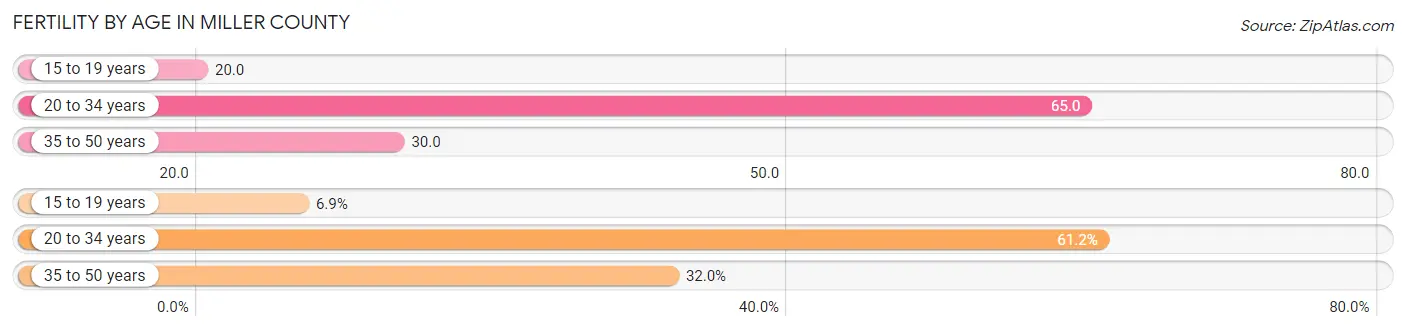
| Age Bracket | Women with Births | Births / 1,000 Women |
| 15 to 19 years | 15 (6.9%) | 20.0 |
| 20 to 34 years | 134 (61.2%) | 65.0 |
| 35 to 50 years | 70 (32.0%) | 30.0 |
| Total | 219 (100.0%) | 43.0 |
Fertility by Age by Marriage Status in Miller County
68.5% of women with births (219) in Miller County are married. The highest percentage of unmarried women with births falls into 15 to 19 years age bracket with 100.0% of them unmarried at the time of birth, while the lowest percentage of unmarried women with births belong to 20 to 34 years age bracket with 6.7% of them unmarried.
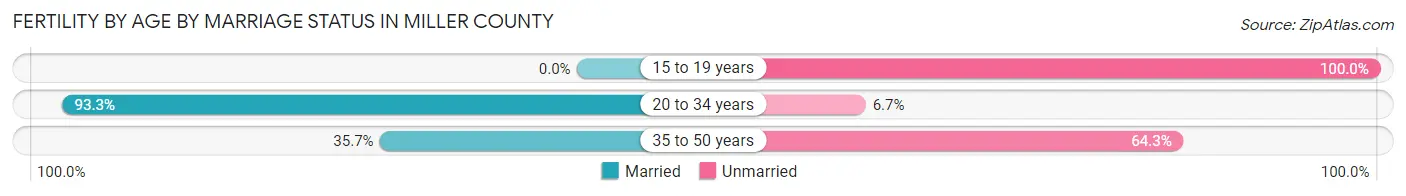
| Age Bracket | Married | Unmarried |
| 15 to 19 years | 0 (0.0%) | 15 (100.0%) |
| 20 to 34 years | 125 (93.3%) | 9 (6.7%) |
| 35 to 50 years | 25 (35.7%) | 45 (64.3%) |
| Total | 150 (68.5%) | 69 (31.5%) |
Fertility by Education in Miller County
Average fertility rate in Miller County is 43.0 births per 1,000 women. Women with the education attainment of college or associate's degree have the highest fertility rate of 66.0 births per 1,000 women, while women with the education attainment of less than high school have the lowest fertility at 15.0 births per 1,000 women. Women with the education attainment of college or associate's degree represent 52.5% of all women with births.
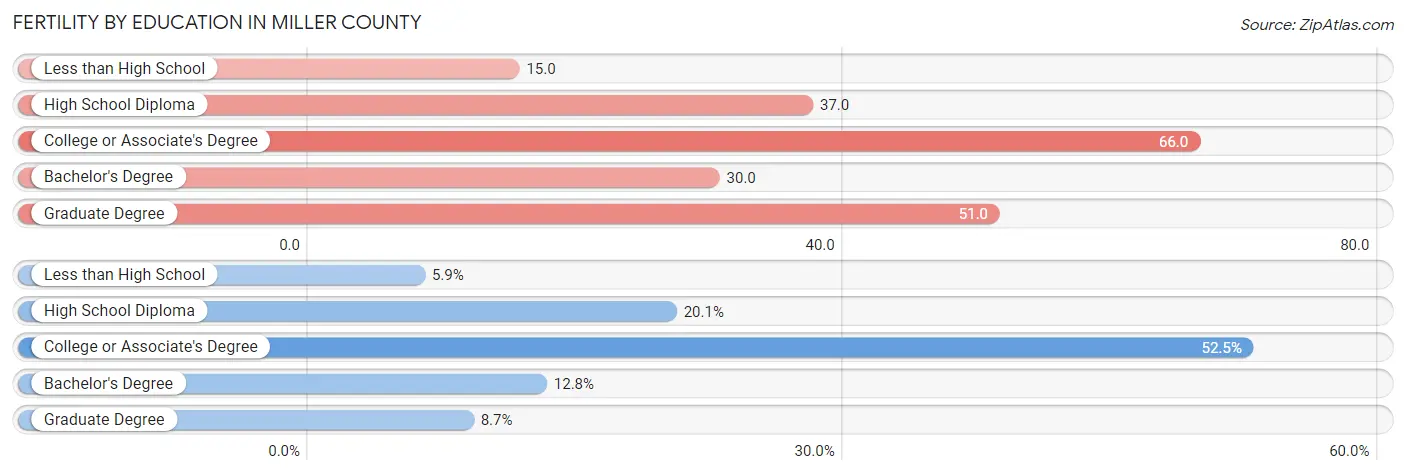
| Educational Attainment | Women with Births | Births / 1,000 Women |
| Less than High School | 13 (5.9%) | 15.0 |
| High School Diploma | 44 (20.1%) | 37.0 |
| College or Associate's Degree | 115 (52.5%) | 66.0 |
| Bachelor's Degree | 28 (12.8%) | 30.0 |
| Graduate Degree | 19 (8.7%) | 51.0 |
| Total | 219 (100.0%) | 43.0 |
Fertility by Education by Marriage Status in Miller County
31.5% of women with births in Miller County are unmarried. Women with the educational attainment of bachelor's degree are most likely to be married with 100.0% of them married at childbirth, while women with the educational attainment of high school diploma are least likely to be married with 65.9% of them unmarried at childbirth.
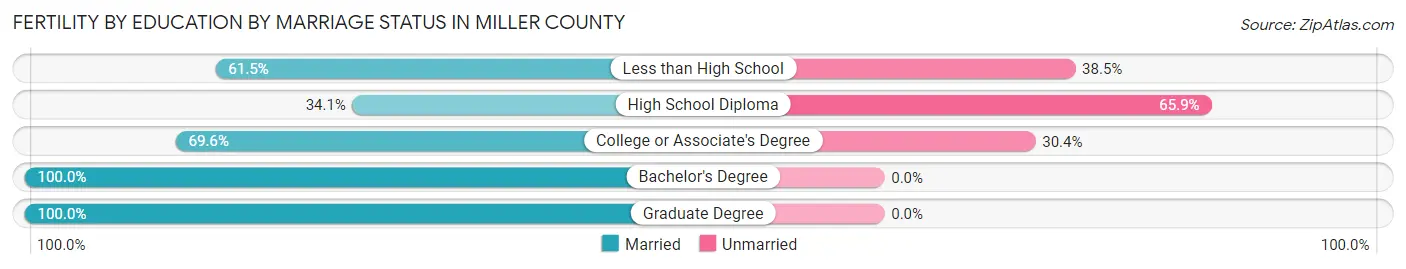
| Educational Attainment | Married | Unmarried |
| Less than High School | 8 (61.5%) | 5 (38.5%) |
| High School Diploma | 15 (34.1%) | 29 (65.9%) |
| College or Associate's Degree | 80 (69.6%) | 35 (30.4%) |
| Bachelor's Degree | 28 (100.0%) | 0 (0.0%) |
| Graduate Degree | 19 (100.0%) | 0 (0.0%) |
| Total | 150 (68.5%) | 69 (31.5%) |
Employment Characteristics in Miller County
Employment by Class of Employer in Miller County
Among the 11,107 employed individuals in Miller County, private company employees (7,396 | 66.6%), state government employees (920 | 8.3%), and local government employees (810 | 7.3%) make up the most common classes of employment.
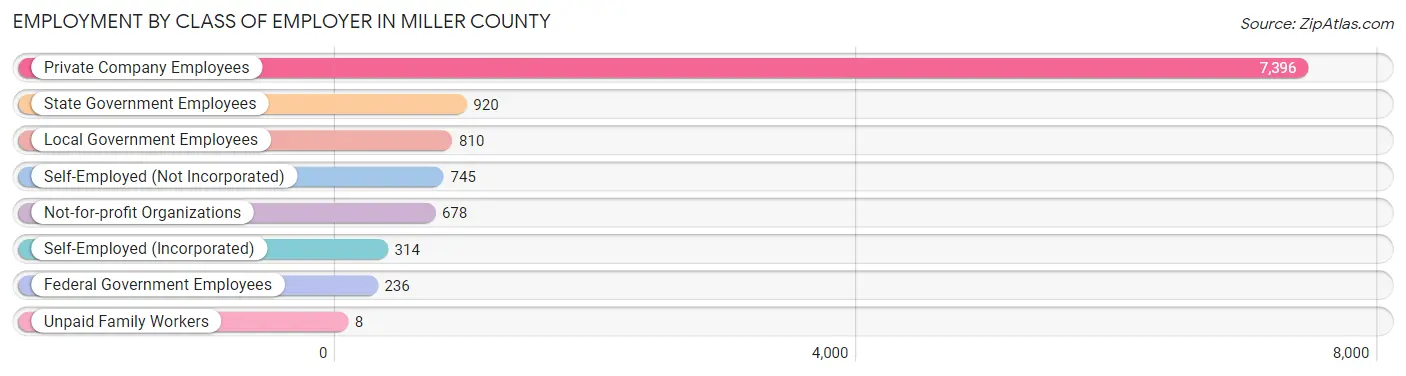
| Employer Class | # Employees | % Employees |
| Private Company Employees | 7,396 | 66.6% |
| Self-Employed (Incorporated) | 314 | 2.8% |
| Self-Employed (Not Incorporated) | 745 | 6.7% |
| Not-for-profit Organizations | 678 | 6.1% |
| Local Government Employees | 810 | 7.3% |
| State Government Employees | 920 | 8.3% |
| Federal Government Employees | 236 | 2.1% |
| Unpaid Family Workers | 8 | 0.1% |
| Total | 11,107 | 100.0% |
Employment Status by Age in Miller County
According to the labor force statistics for Miller County, out of the total population over 16 years of age (19,738), 60.5% or 11,941 individuals are in the labor force, with 4.6% or 549 of them unemployed. The age group with the highest labor force participation rate is 30 to 34 years, with 85.7% or 1,280 individuals in the labor force. Within the labor force, the 25 to 29 years age range has the highest percentage of unemployed individuals, with 10.3% or 119 of them being unemployed.
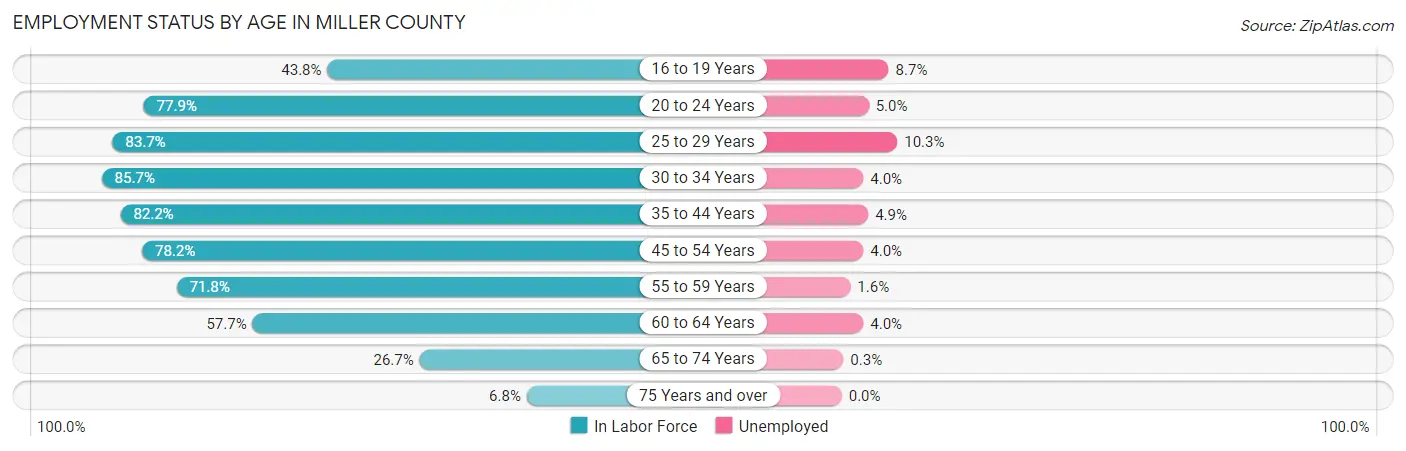
| Age Bracket | In Labor Force | Unemployed |
| 16 to 19 Years | 530 (43.8%) | 46 (8.7%) |
| 20 to 24 Years | 1,021 (77.9%) | 51 (5.0%) |
| 25 to 29 Years | 1,157 (83.7%) | 119 (10.3%) |
| 30 to 34 Years | 1,280 (85.7%) | 51 (4.0%) |
| 35 to 44 Years | 2,444 (82.2%) | 120 (4.9%) |
| 45 to 54 Years | 2,301 (78.2%) | 92 (4.0%) |
| 55 to 59 Years | 1,145 (71.8%) | 18 (1.6%) |
| 60 to 64 Years | 1,185 (57.7%) | 47 (4.0%) |
| 65 to 74 Years | 743 (26.7%) | 2 (0.3%) |
| 75 Years and over | 136 (6.8%) | 0 (0.0%) |
| Total | 11,941 (60.5%) | 549 (4.6%) |
Employment Status by Educational Attainment in Miller County
According to labor force statistics for Miller County, 76.5% of individuals (9,516) out of the total population between 25 and 64 years of age (12,439) are in the labor force, with 4.7% or 447 of them being unemployed. The group with the highest labor force participation rate are those with the educational attainment of bachelor's degree or higher, with 88.3% or 2,384 individuals in the labor force. Within the labor force, individuals with less than high school education have the highest percentage of unemployment, with 12.4% or 88 of them being unemployed.
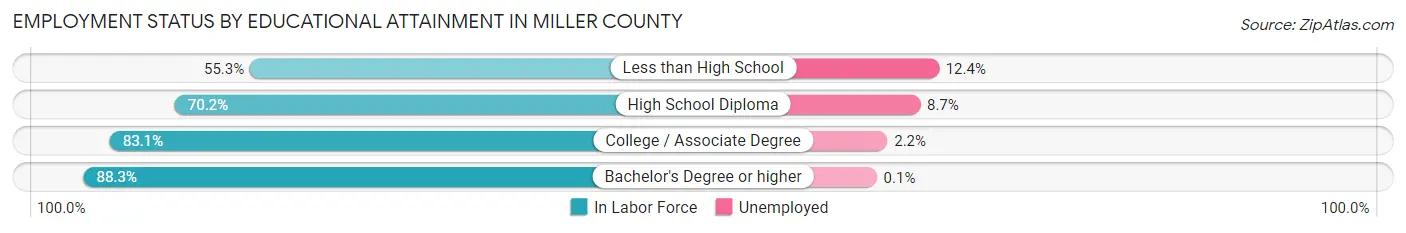
| Educational Attainment | In Labor Force | Unemployed |
| Less than High School | 709 (55.3%) | 159 (12.4%) |
| High School Diploma | 3,306 (70.2%) | 410 (8.7%) |
| College / Associate Degree | 3,114 (83.1%) | 82 (2.2%) |
| Bachelor's Degree or higher | 2,384 (88.3%) | 3 (0.1%) |
| Total | 9,516 (76.5%) | 585 (4.7%) |
Employment Occupations by Sex in Miller County
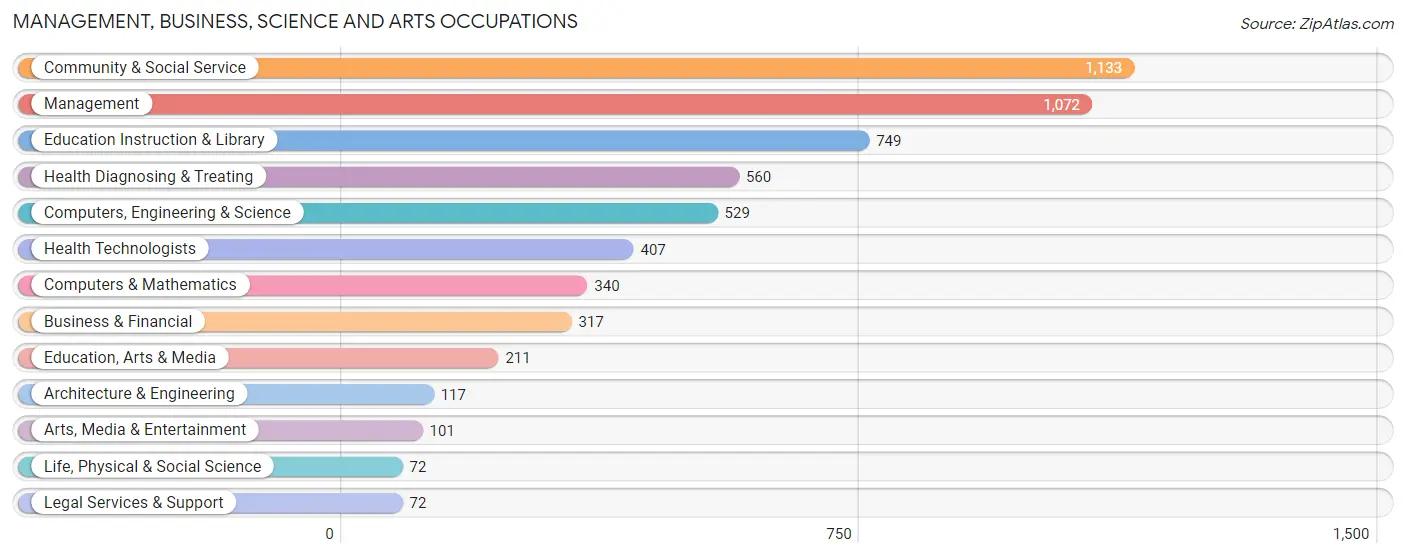
Management, Business, Science and Arts Occupations
The most common Management, Business, Science and Arts occupations in Miller County are Community & Social Service (1,133 | 10.0%), Management (1,072 | 9.4%), Education Instruction & Library (749 | 6.6%), Health Diagnosing & Treating (560 | 4.9%), and Computers, Engineering & Science (529 | 4.6%).
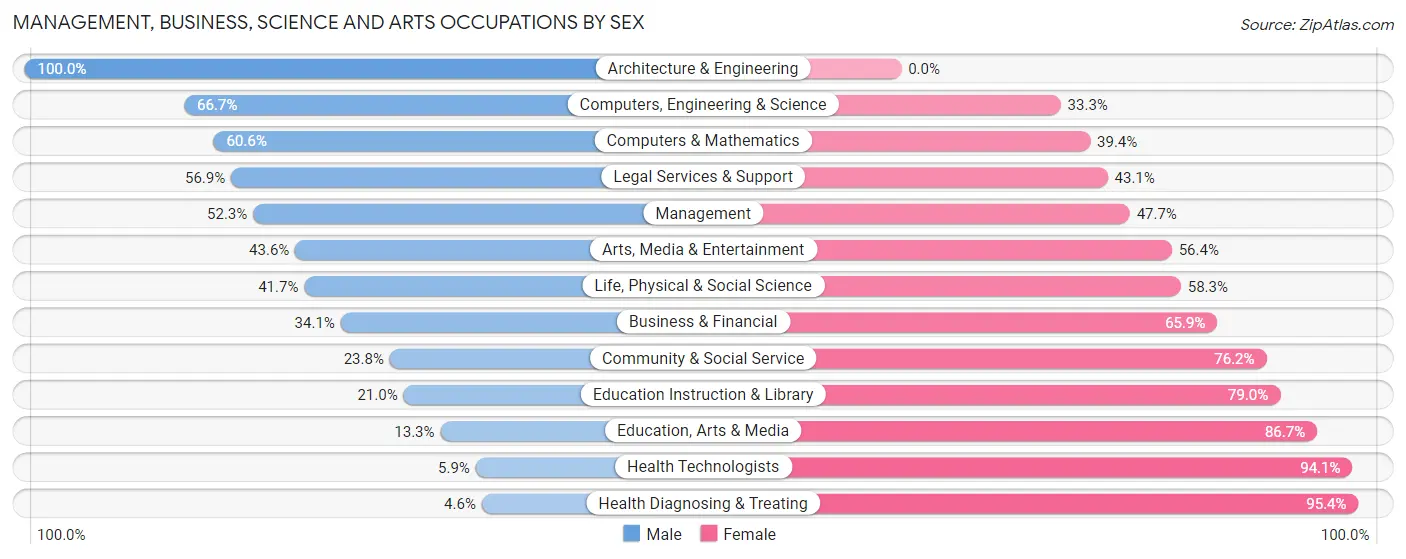
Management, Business, Science and Arts Occupations by Sex
Within the Management, Business, Science and Arts occupations in Miller County, the most male-oriented occupations are Architecture & Engineering (100.0%), Computers, Engineering & Science (66.7%), and Computers & Mathematics (60.6%), while the most female-oriented occupations are Health Diagnosing & Treating (95.4%), Health Technologists (94.1%), and Education, Arts & Media (86.7%).
| Occupation | Male | Female |
| Management | 561 (52.3%) | 511 (47.7%) |
| Business & Financial | 108 (34.1%) | 209 (65.9%) |
| Computers, Engineering & Science | 353 (66.7%) | 176 (33.3%) |
| Computers & Mathematics | 206 (60.6%) | 134 (39.4%) |
| Architecture & Engineering | 117 (100.0%) | 0 (0.0%) |
| Life, Physical & Social Science | 30 (41.7%) | 42 (58.3%) |
| Community & Social Service | 270 (23.8%) | 863 (76.2%) |
| Education, Arts & Media | 28 (13.3%) | 183 (86.7%) |
| Legal Services & Support | 41 (56.9%) | 31 (43.1%) |
| Education Instruction & Library | 157 (21.0%) | 592 (79.0%) |
| Arts, Media & Entertainment | 44 (43.6%) | 57 (56.4%) |
| Health Diagnosing & Treating | 26 (4.6%) | 534 (95.4%) |
| Health Technologists | 24 (5.9%) | 383 (94.1%) |
| Total (Category) | 1,318 (36.5%) | 2,293 (63.5%) |
| Total (Overall) | 5,642 (49.6%) | 5,739 (50.4%) |
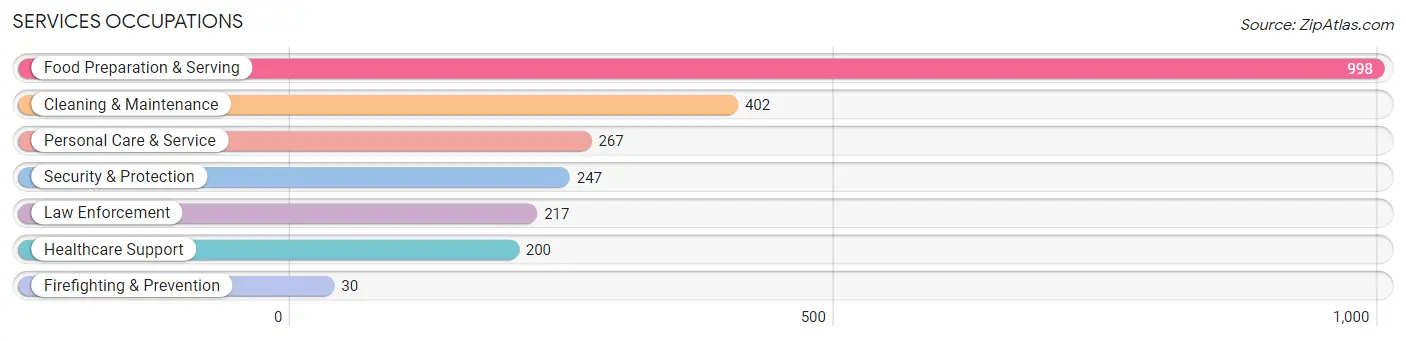
Services Occupations
The most common Services occupations in Miller County are Food Preparation & Serving (998 | 8.8%), Cleaning & Maintenance (402 | 3.5%), Personal Care & Service (267 | 2.4%), Security & Protection (247 | 2.2%), and Law Enforcement (217 | 1.9%).
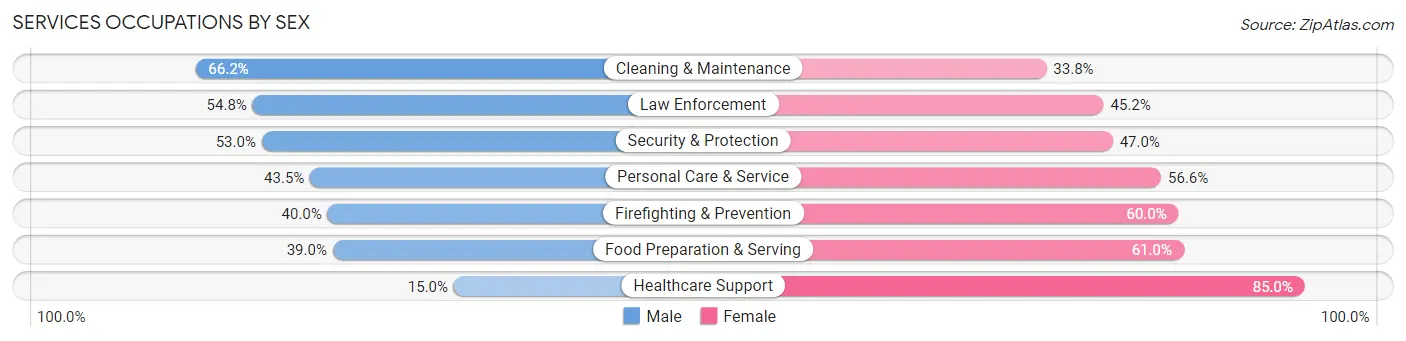
Services Occupations by Sex
Within the Services occupations in Miller County, the most male-oriented occupations are Cleaning & Maintenance (66.2%), Law Enforcement (54.8%), and Security & Protection (53.0%), while the most female-oriented occupations are Healthcare Support (85.0%), Food Preparation & Serving (61.0%), and Firefighting & Prevention (60.0%).
| Occupation | Male | Female |
| Healthcare Support | 30 (15.0%) | 170 (85.0%) |
| Security & Protection | 131 (53.0%) | 116 (47.0%) |
| Firefighting & Prevention | 12 (40.0%) | 18 (60.0%) |
| Law Enforcement | 119 (54.8%) | 98 (45.2%) |
| Food Preparation & Serving | 389 (39.0%) | 609 (61.0%) |
| Cleaning & Maintenance | 266 (66.2%) | 136 (33.8%) |
| Personal Care & Service | 116 (43.4%) | 151 (56.6%) |
| Total (Category) | 932 (44.1%) | 1,182 (55.9%) |
| Total (Overall) | 5,642 (49.6%) | 5,739 (50.4%) |
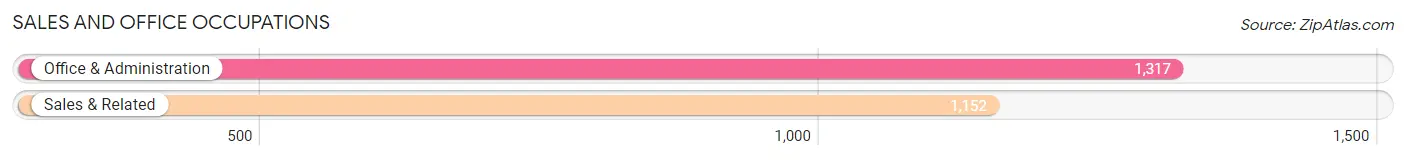
Sales and Office Occupations
The most common Sales and Office occupations in Miller County are Office & Administration (1,317 | 11.6%), and Sales & Related (1,152 | 10.1%).
Sales and Office Occupations by Sex
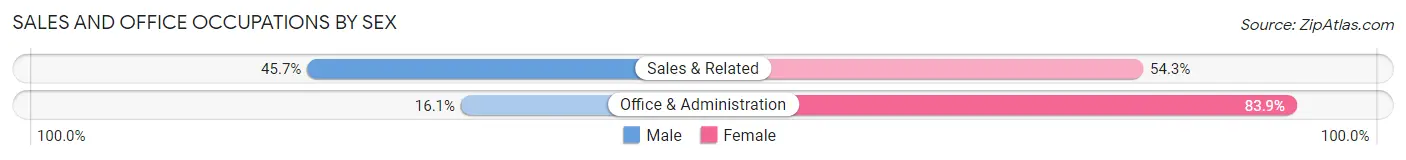
| Occupation | Male | Female |
| Sales & Related | 526 (45.7%) | 626 (54.3%) |
| Office & Administration | 212 (16.1%) | 1,105 (83.9%) |
| Total (Category) | 738 (29.9%) | 1,731 (70.1%) |
| Total (Overall) | 5,642 (49.6%) | 5,739 (50.4%) |
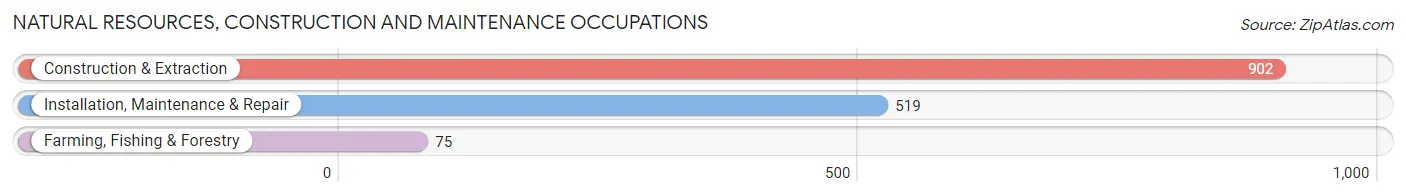
Natural Resources, Construction and Maintenance Occupations
The most common Natural Resources, Construction and Maintenance occupations in Miller County are Construction & Extraction (902 | 7.9%), Installation, Maintenance & Repair (519 | 4.6%), and Farming, Fishing & Forestry (75 | 0.7%).
Natural Resources, Construction and Maintenance Occupations by Sex
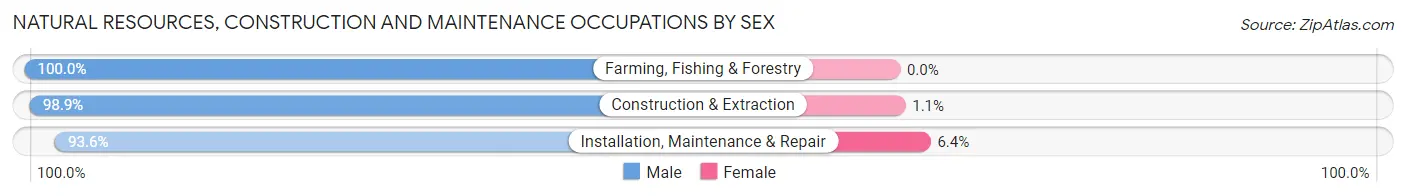
| Occupation | Male | Female |
| Farming, Fishing & Forestry | 75 (100.0%) | 0 (0.0%) |
| Construction & Extraction | 892 (98.9%) | 10 (1.1%) |
| Installation, Maintenance & Repair | 486 (93.6%) | 33 (6.4%) |
| Total (Category) | 1,453 (97.1%) | 43 (2.9%) |
| Total (Overall) | 5,642 (49.6%) | 5,739 (50.4%) |
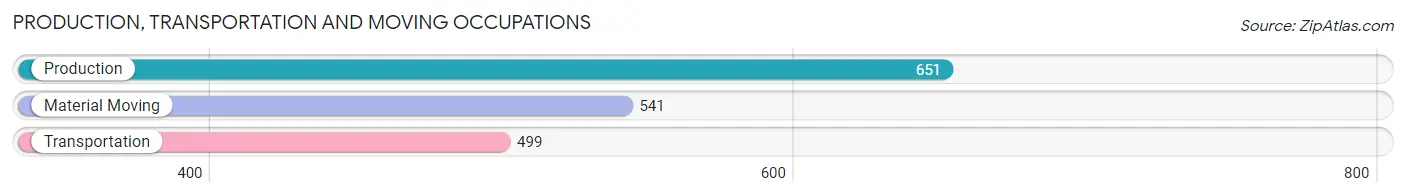
Production, Transportation and Moving Occupations
The most common Production, Transportation and Moving occupations in Miller County are Production (651 | 5.7%), Material Moving (541 | 4.8%), and Transportation (499 | 4.4%).
Production, Transportation and Moving Occupations by Sex
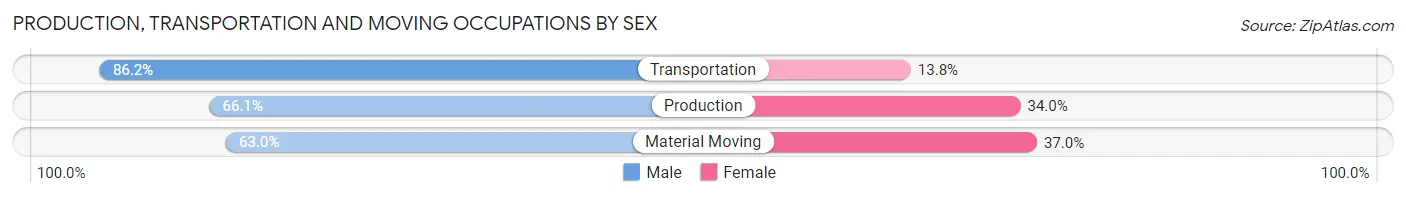
| Occupation | Male | Female |
| Production | 430 (66.0%) | 221 (34.0%) |
| Transportation | 430 (86.2%) | 69 (13.8%) |
| Material Moving | 341 (63.0%) | 200 (37.0%) |
| Total (Category) | 1,201 (71.0%) | 490 (29.0%) |
| Total (Overall) | 5,642 (49.6%) | 5,739 (50.4%) |
Employment Industries by Sex in Miller County
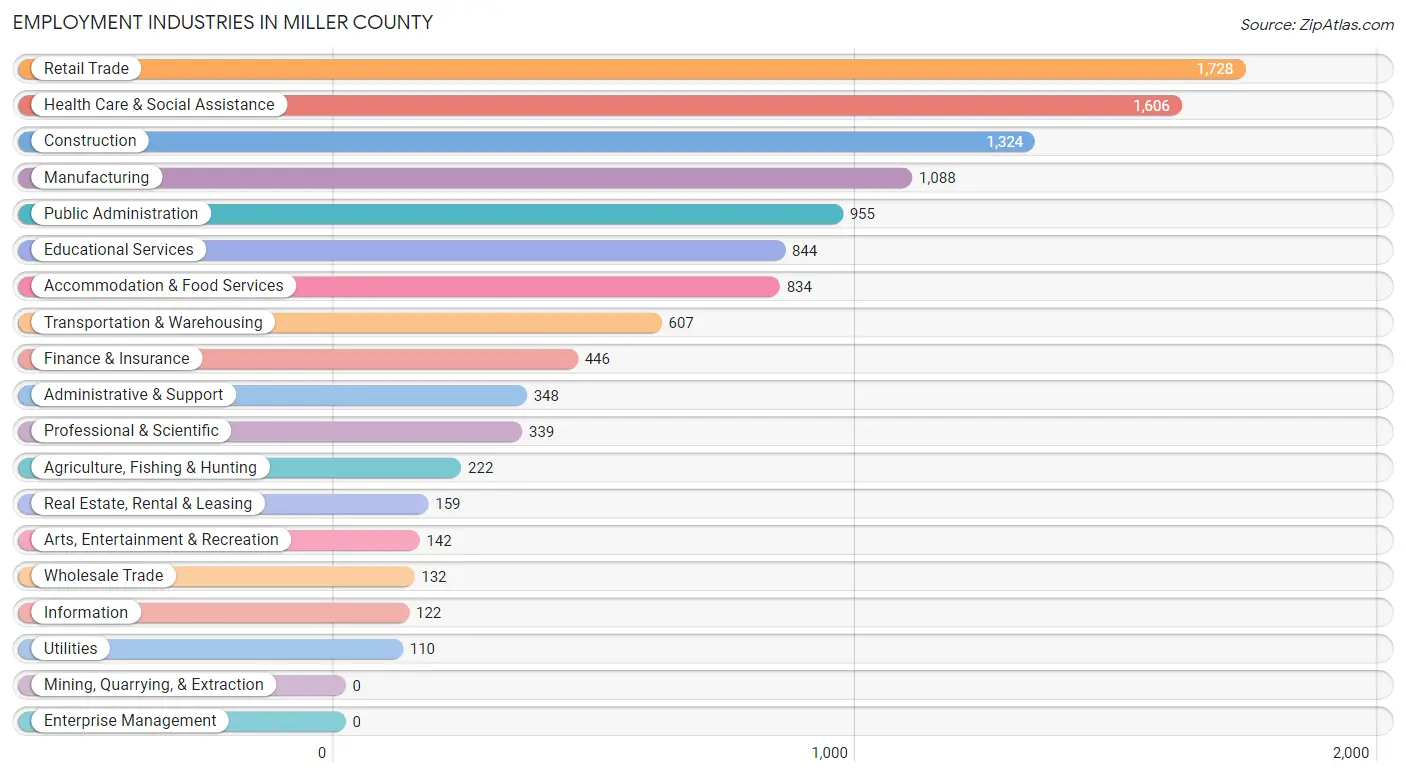
Employment Industries in Miller County
The major employment industries in Miller County include Retail Trade (1,728 | 15.2%), Health Care & Social Assistance (1,606 | 14.1%), Construction (1,324 | 11.6%), Manufacturing (1,088 | 9.6%), and Public Administration (955 | 8.4%).
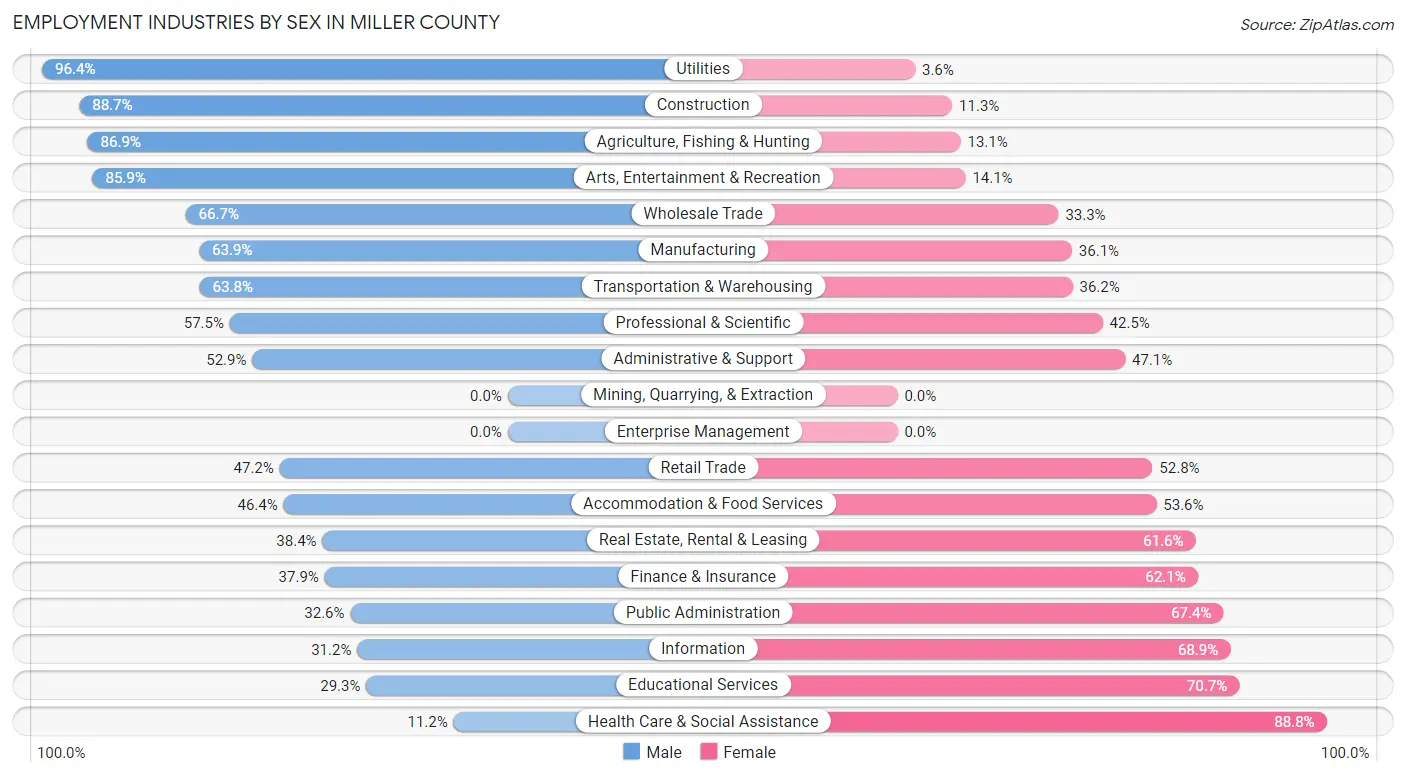
Employment Industries by Sex in Miller County
The Miller County industries that see more men than women are Utilities (96.4%), Construction (88.7%), and Agriculture, Fishing & Hunting (86.9%), whereas the industries that tend to have a higher number of women are Health Care & Social Assistance (88.8%), Educational Services (70.7%), and Information (68.9%).
| Industry | Male | Female |
| Agriculture, Fishing & Hunting | 193 (86.9%) | 29 (13.1%) |
| Mining, Quarrying, & Extraction | 0 (0.0%) | 0 (0.0%) |
| Construction | 1,174 (88.7%) | 150 (11.3%) |
| Manufacturing | 695 (63.9%) | 393 (36.1%) |
| Wholesale Trade | 88 (66.7%) | 44 (33.3%) |
| Retail Trade | 816 (47.2%) | 912 (52.8%) |
| Transportation & Warehousing | 387 (63.8%) | 220 (36.2%) |
| Utilities | 106 (96.4%) | 4 (3.6%) |
| Information | 38 (31.1%) | 84 (68.9%) |
| Finance & Insurance | 169 (37.9%) | 277 (62.1%) |
| Real Estate, Rental & Leasing | 61 (38.4%) | 98 (61.6%) |
| Professional & Scientific | 195 (57.5%) | 144 (42.5%) |
| Enterprise Management | 0 (0.0%) | 0 (0.0%) |
| Administrative & Support | 184 (52.9%) | 164 (47.1%) |
| Educational Services | 247 (29.3%) | 597 (70.7%) |
| Health Care & Social Assistance | 180 (11.2%) | 1,426 (88.8%) |
| Arts, Entertainment & Recreation | 122 (85.9%) | 20 (14.1%) |
| Accommodation & Food Services | 387 (46.4%) | 447 (53.6%) |
| Public Administration | 311 (32.6%) | 644 (67.4%) |
| Total | 5,642 (49.6%) | 5,739 (50.4%) |
Education in Miller County
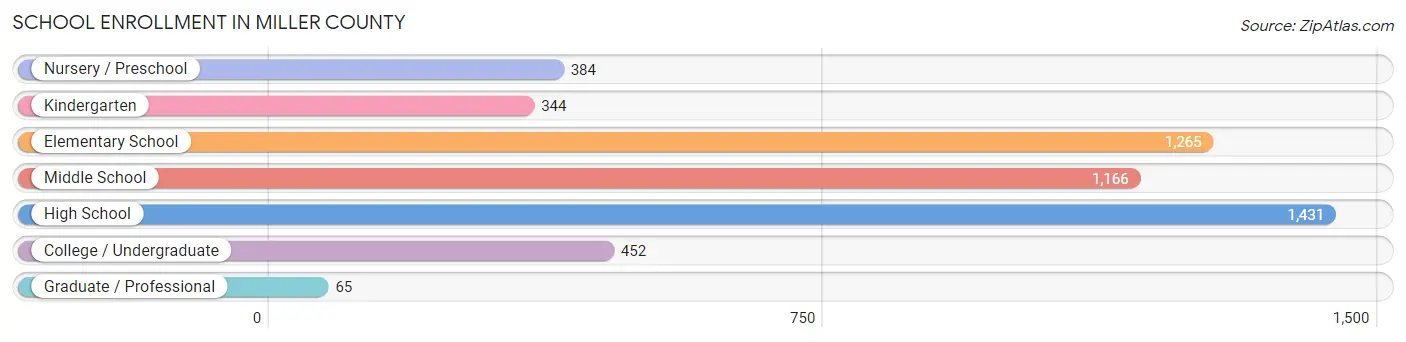
School Enrollment in Miller County
The most common levels of schooling among the 5,107 students in Miller County are high school (1,431 | 28.0%), elementary school (1,265 | 24.8%), and middle school (1,166 | 22.8%).
| School Level | # Students | % Students |
| Nursery / Preschool | 384 | 7.5% |
| Kindergarten | 344 | 6.7% |
| Elementary School | 1,265 | 24.8% |
| Middle School | 1,166 | 22.8% |
| High School | 1,431 | 28.0% |
| College / Undergraduate | 452 | 8.8% |
| Graduate / Professional | 65 | 1.3% |
| Total | 5,107 | 100.0% |
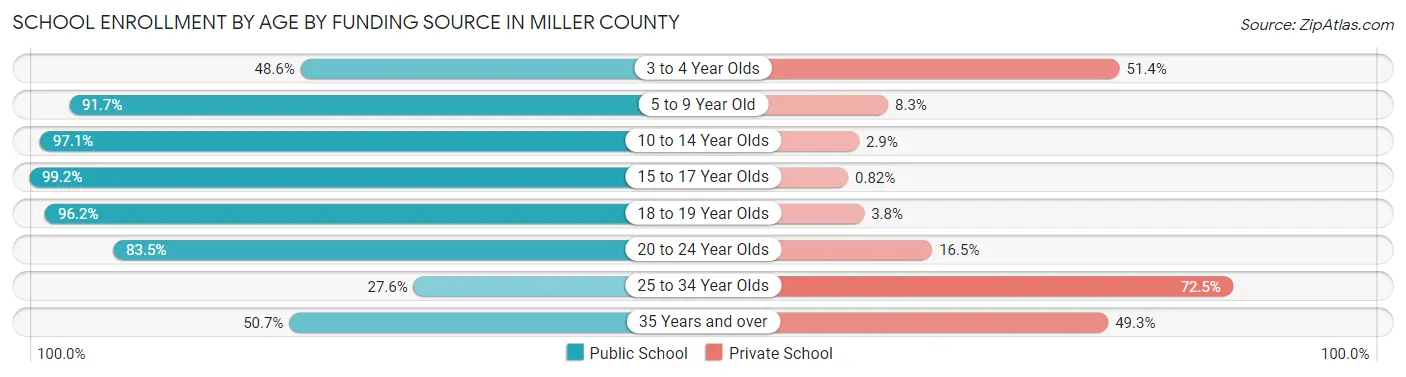
School Enrollment by Age by Funding Source in Miller County
Out of a total of 5,107 students who are enrolled in schools in Miller County, 475 (9.3%) attend a private institution, while the remaining 4,632 (90.7%) are enrolled in public schools. The age group of 25 to 34 year olds has the highest likelihood of being enrolled in private schools, with 71 (72.5% in the age bracket) enrolled. Conversely, the age group of 15 to 17 year olds has the lowest likelihood of being enrolled in a private school, with 968 (99.2% in the age bracket) attending a public institution.
| Age Bracket | Public School | Private School |
| 3 to 4 Year Olds | 139 (48.6%) | 147 (51.4%) |
| 5 to 9 Year Old | 1,340 (91.7%) | 121 (8.3%) |
| 10 to 14 Year Olds | 1,629 (97.1%) | 48 (2.9%) |
| 15 to 17 Year Olds | 968 (99.2%) | 8 (0.8%) |
| 18 to 19 Year Olds | 327 (96.2%) | 13 (3.8%) |
| 20 to 24 Year Olds | 167 (83.5%) | 33 (16.5%) |
| 25 to 34 Year Olds | 27 (27.6%) | 71 (72.5%) |
| 35 Years and over | 35 (50.7%) | 34 (49.3%) |
| Total | 4,632 (90.7%) | 475 (9.3%) |
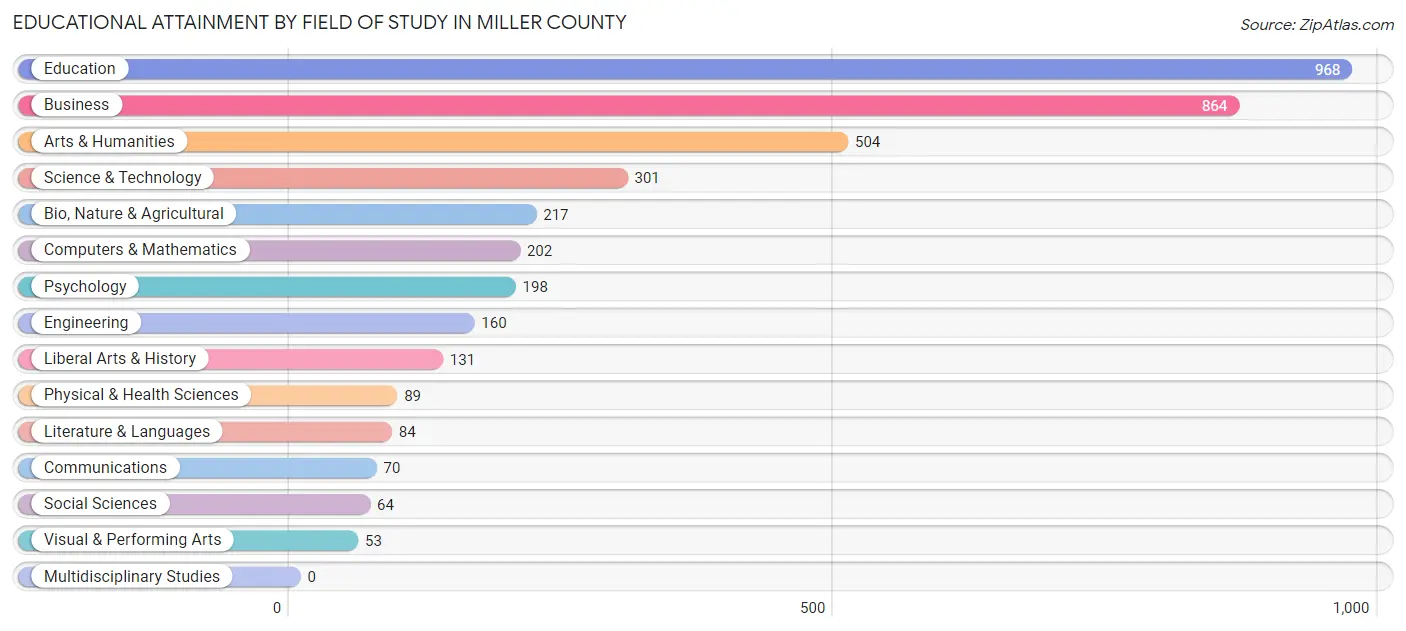
Educational Attainment by Field of Study in Miller County
Education (968 | 24.8%), business (864 | 22.1%), arts & humanities (504 | 12.9%), science & technology (301 | 7.7%), and bio, nature & agricultural (217 | 5.6%) are the most common fields of study among 3,905 individuals in Miller County who have obtained a bachelor's degree or higher.
| Field of Study | # Graduates | % Graduates |
| Computers & Mathematics | 202 | 5.2% |
| Bio, Nature & Agricultural | 217 | 5.6% |
| Physical & Health Sciences | 89 | 2.3% |
| Psychology | 198 | 5.1% |
| Social Sciences | 64 | 1.6% |
| Engineering | 160 | 4.1% |
| Multidisciplinary Studies | 0 | 0.0% |
| Science & Technology | 301 | 7.7% |
| Business | 864 | 22.1% |
| Education | 968 | 24.8% |
| Literature & Languages | 84 | 2.1% |
| Liberal Arts & History | 131 | 3.4% |
| Visual & Performing Arts | 53 | 1.4% |
| Communications | 70 | 1.8% |
| Arts & Humanities | 504 | 12.9% |
| Total | 3,905 | 100.0% |
Transportation & Commute in Miller County
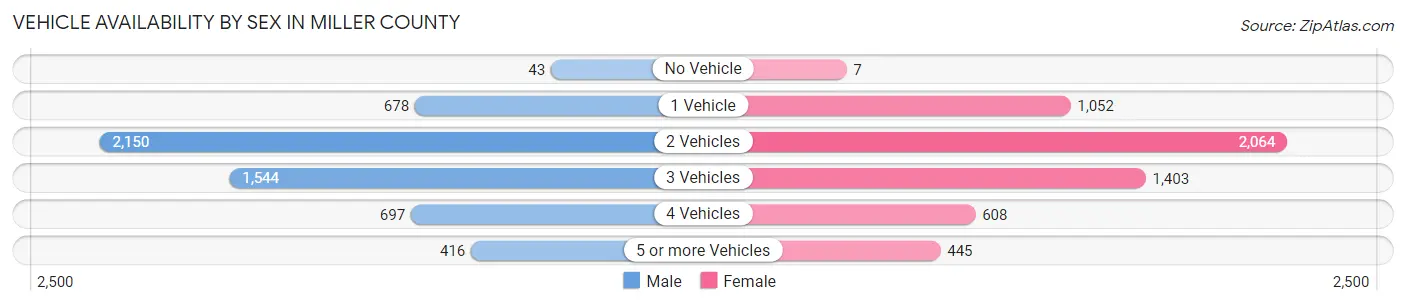
Vehicle Availability by Sex in Miller County
The most prevalent vehicle ownership categories in Miller County are males with 2 vehicles (2,150, accounting for 38.9%) and females with 2 vehicles (2,064, making up 38.5%).
| Vehicles Available | Male | Female |
| No Vehicle | 43 (0.8%) | 7 (0.1%) |
| 1 Vehicle | 678 (12.3%) | 1,052 (18.9%) |
| 2 Vehicles | 2,150 (38.9%) | 2,064 (37.0%) |
| 3 Vehicles | 1,544 (27.9%) | 1,403 (25.2%) |
| 4 Vehicles | 697 (12.6%) | 608 (10.9%) |
| 5 or more Vehicles | 416 (7.5%) | 445 (8.0%) |
| Total | 5,528 (100.0%) | 5,579 (100.0%) |
Commute Time in Miller County
The most frequently occuring commute durations in Miller County are 30 to 34 minutes (1,788 commuters, 17.1%), 10 to 14 minutes (1,268 commuters, 12.2%), and 15 to 19 minutes (1,124 commuters, 10.8%).
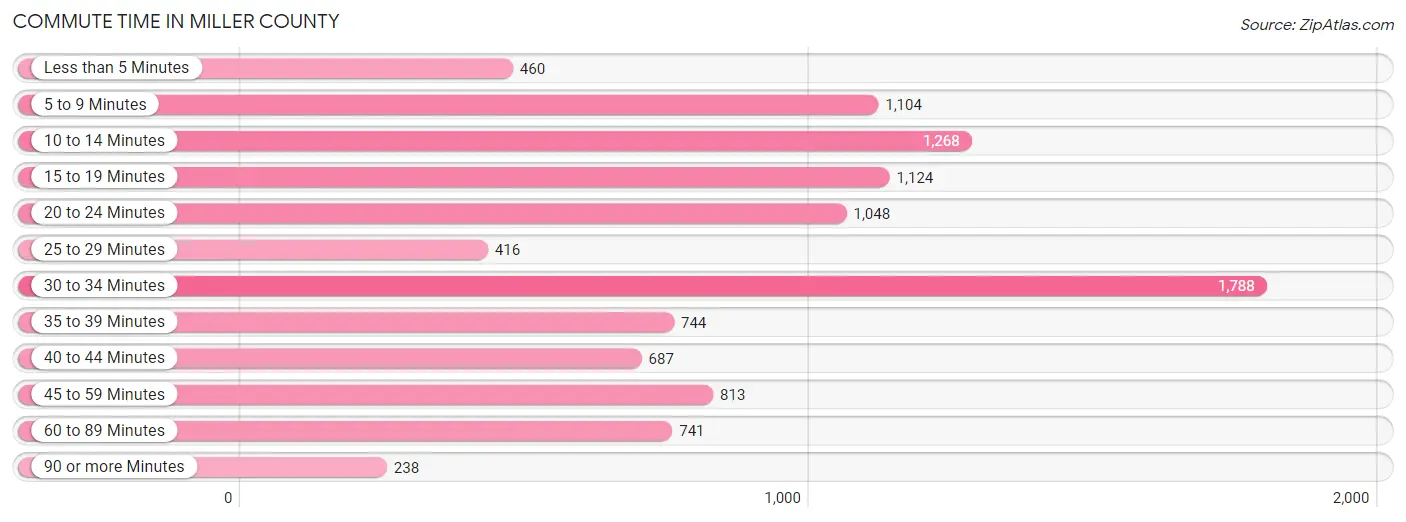
| Commute Time | # Commuters | % Commuters |
| Less than 5 Minutes | 460 | 4.4% |
| 5 to 9 Minutes | 1,104 | 10.6% |
| 10 to 14 Minutes | 1,268 | 12.2% |
| 15 to 19 Minutes | 1,124 | 10.8% |
| 20 to 24 Minutes | 1,048 | 10.1% |
| 25 to 29 Minutes | 416 | 4.0% |
| 30 to 34 Minutes | 1,788 | 17.1% |
| 35 to 39 Minutes | 744 | 7.1% |
| 40 to 44 Minutes | 687 | 6.6% |
| 45 to 59 Minutes | 813 | 7.8% |
| 60 to 89 Minutes | 741 | 7.1% |
| 90 or more Minutes | 238 | 2.3% |
Commute Time by Sex in Miller County
The most common commute times in Miller County are 30 to 34 minutes (979 commuters, 18.5%) for males and 30 to 34 minutes (809 commuters, 15.7%) for females.
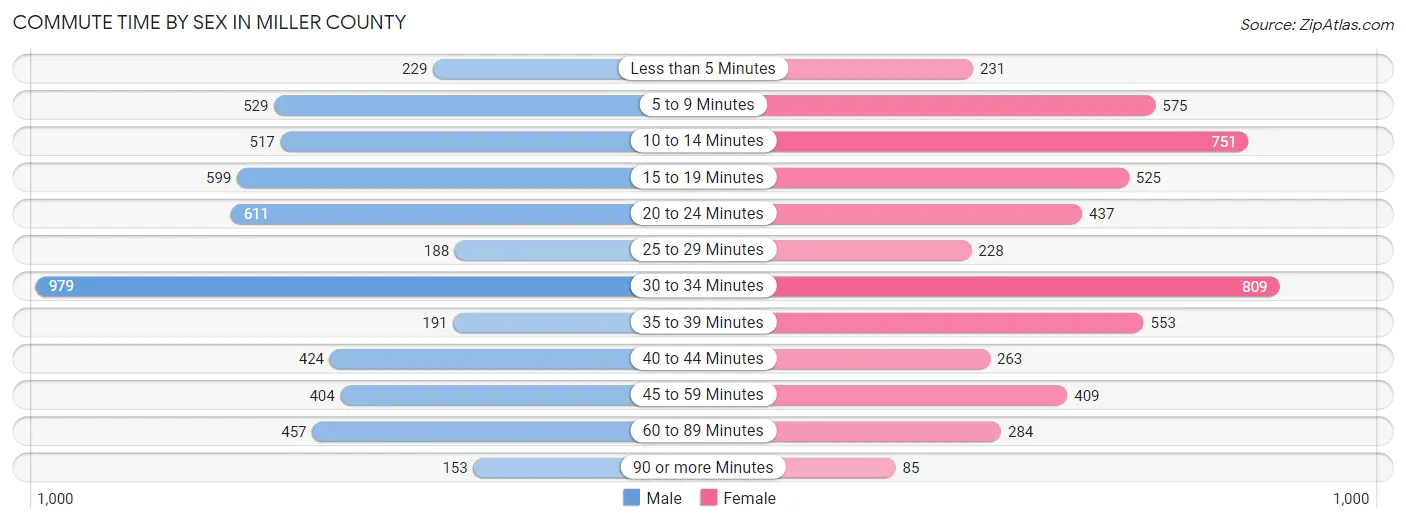
| Commute Time | Male | Female |
| Less than 5 Minutes | 229 (4.3%) | 231 (4.5%) |
| 5 to 9 Minutes | 529 (10.0%) | 575 (11.2%) |
| 10 to 14 Minutes | 517 (9.8%) | 751 (14.6%) |
| 15 to 19 Minutes | 599 (11.3%) | 525 (10.2%) |
| 20 to 24 Minutes | 611 (11.6%) | 437 (8.5%) |
| 25 to 29 Minutes | 188 (3.6%) | 228 (4.4%) |
| 30 to 34 Minutes | 979 (18.5%) | 809 (15.7%) |
| 35 to 39 Minutes | 191 (3.6%) | 553 (10.7%) |
| 40 to 44 Minutes | 424 (8.0%) | 263 (5.1%) |
| 45 to 59 Minutes | 404 (7.6%) | 409 (7.9%) |
| 60 to 89 Minutes | 457 (8.6%) | 284 (5.5%) |
| 90 or more Minutes | 153 (2.9%) | 85 (1.7%) |
Time of Departure to Work by Sex in Miller County
The most frequent times of departure to work in Miller County are 7:00 AM to 7:29 AM (1,011, 19.1%) for males and 7:00 AM to 7:29 AM (1,005, 19.5%) for females.
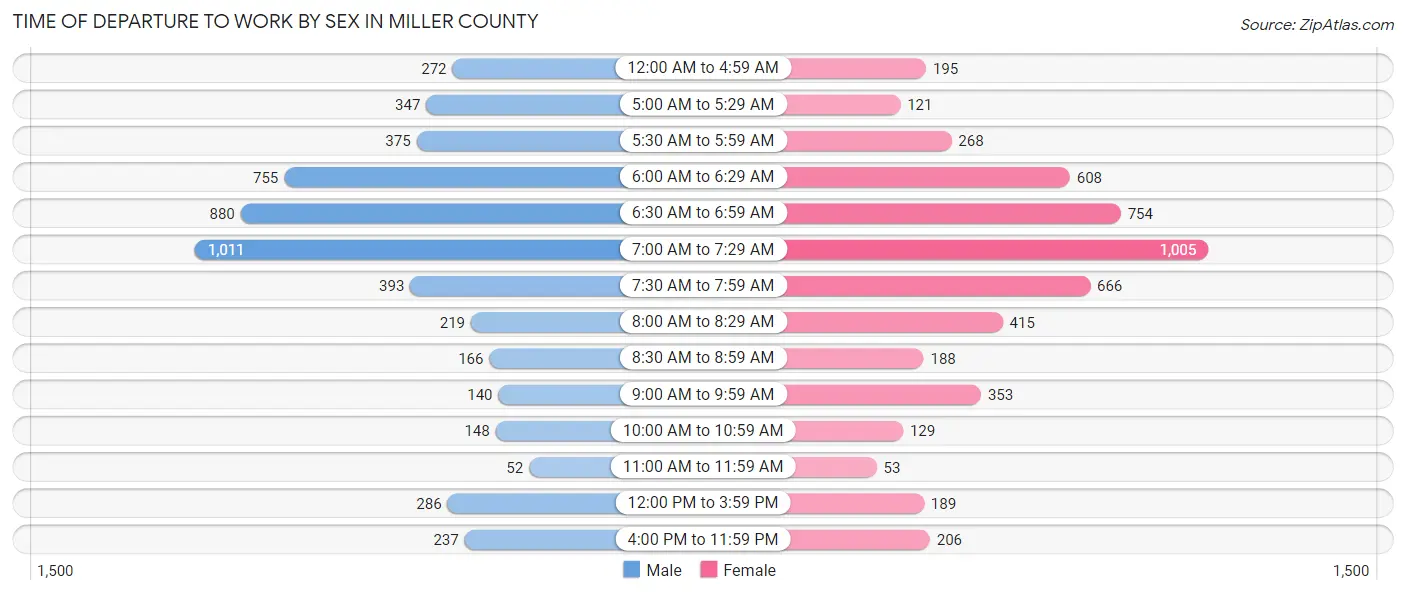
| Time of Departure | Male | Female |
| 12:00 AM to 4:59 AM | 272 (5.1%) | 195 (3.8%) |
| 5:00 AM to 5:29 AM | 347 (6.6%) | 121 (2.4%) |
| 5:30 AM to 5:59 AM | 375 (7.1%) | 268 (5.2%) |
| 6:00 AM to 6:29 AM | 755 (14.3%) | 608 (11.8%) |
| 6:30 AM to 6:59 AM | 880 (16.7%) | 754 (14.6%) |
| 7:00 AM to 7:29 AM | 1,011 (19.1%) | 1,005 (19.5%) |
| 7:30 AM to 7:59 AM | 393 (7.4%) | 666 (12.9%) |
| 8:00 AM to 8:29 AM | 219 (4.2%) | 415 (8.1%) |
| 8:30 AM to 8:59 AM | 166 (3.1%) | 188 (3.6%) |
| 9:00 AM to 9:59 AM | 140 (2.6%) | 353 (6.9%) |
| 10:00 AM to 10:59 AM | 148 (2.8%) | 129 (2.5%) |
| 11:00 AM to 11:59 AM | 52 (1.0%) | 53 (1.0%) |
| 12:00 PM to 3:59 PM | 286 (5.4%) | 189 (3.7%) |
| 4:00 PM to 11:59 PM | 237 (4.5%) | 206 (4.0%) |
| Total | 5,281 (100.0%) | 5,150 (100.0%) |
Housing Occupancy in Miller County
Occupancy by Ownership in Miller County
Of the total 10,116 dwellings in Miller County, owner-occupied units account for 7,619 (75.3%), while renter-occupied units make up 2,497 (24.7%).
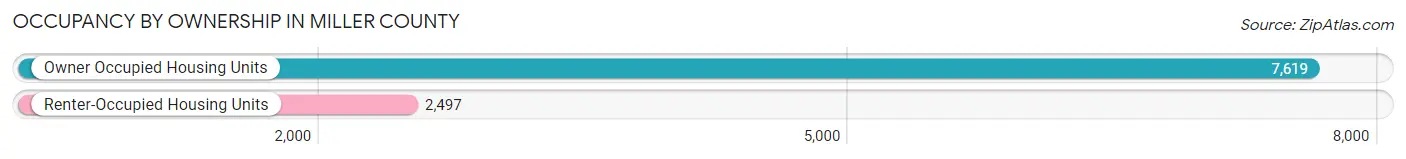
| Occupancy | # Housing Units | % Housing Units |
| Owner Occupied Housing Units | 7,619 | 75.3% |
| Renter-Occupied Housing Units | 2,497 | 24.7% |
| Total Occupied Housing Units | 10,116 | 100.0% |
Occupancy by Household Size in Miller County
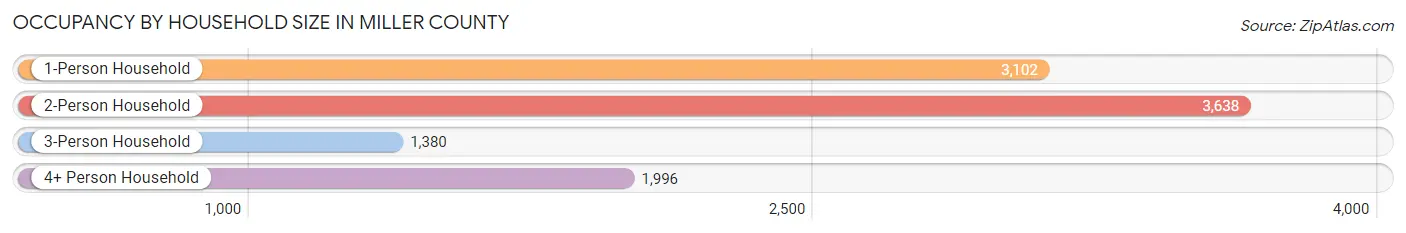
| Household Size | # Housing Units | % Housing Units |
| 1-Person Household | 3,102 | 30.7% |
| 2-Person Household | 3,638 | 36.0% |
| 3-Person Household | 1,380 | 13.6% |
| 4+ Person Household | 1,996 | 19.7% |
| Total Housing Units | 10,116 | 100.0% |
Occupancy by Ownership by Household Size in Miller County
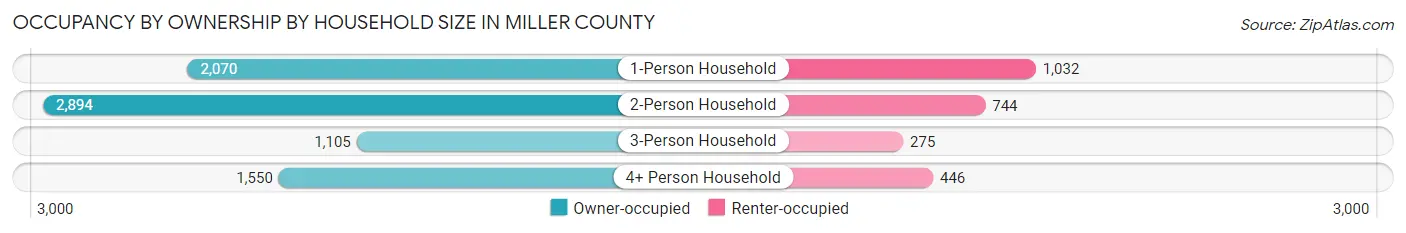
| Household Size | Owner-occupied | Renter-occupied |
| 1-Person Household | 2,070 (66.7%) | 1,032 (33.3%) |
| 2-Person Household | 2,894 (79.5%) | 744 (20.4%) |
| 3-Person Household | 1,105 (80.1%) | 275 (19.9%) |
| 4+ Person Household | 1,550 (77.7%) | 446 (22.3%) |
| Total Housing Units | 7,619 (75.3%) | 2,497 (24.7%) |
Occupancy by Educational Attainment in Miller County
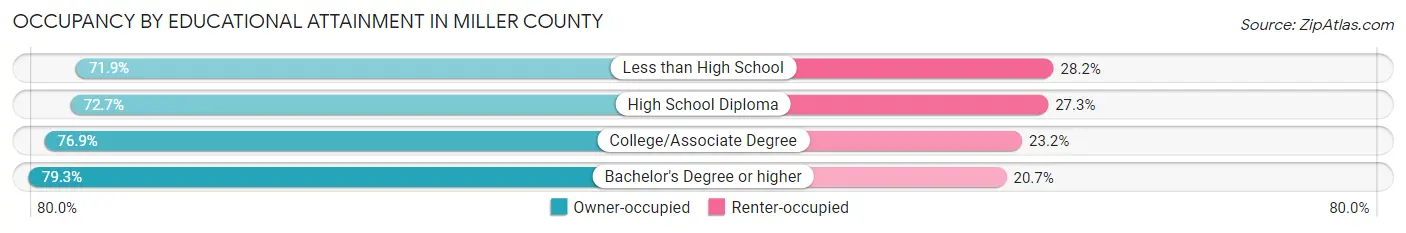
| Household Size | Owner-occupied | Renter-occupied |
| Less than High School | 656 (71.9%) | 257 (28.1%) |
| High School Diploma | 2,845 (72.7%) | 1,068 (27.3%) |
| College/Associate Degree | 2,430 (76.8%) | 732 (23.2%) |
| Bachelor's Degree or higher | 1,688 (79.3%) | 440 (20.7%) |
Occupancy by Age of Householder in Miller County
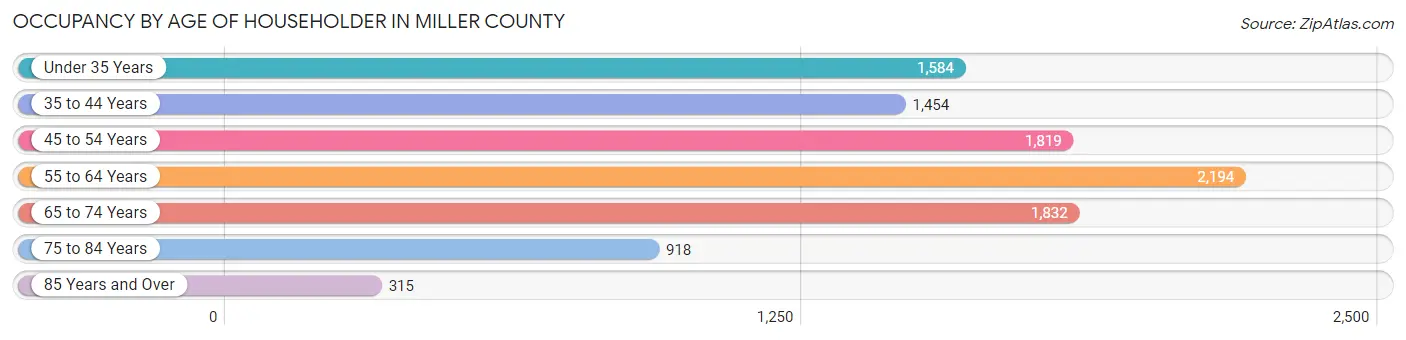
| Age Bracket | # Households | % Households |
| Under 35 Years | 1,584 | 15.7% |
| 35 to 44 Years | 1,454 | 14.4% |
| 45 to 54 Years | 1,819 | 18.0% |
| 55 to 64 Years | 2,194 | 21.7% |
| 65 to 74 Years | 1,832 | 18.1% |
| 75 to 84 Years | 918 | 9.1% |
| 85 Years and Over | 315 | 3.1% |
| Total | 10,116 | 100.0% |
Housing Finances in Miller County
Median Income by Occupancy in Miller County
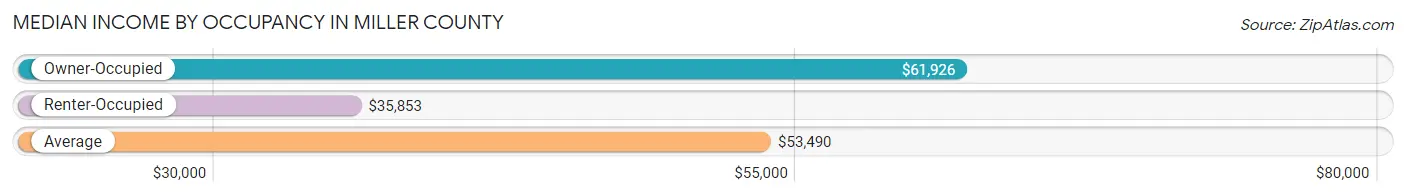
| Occupancy Type | # Households | Median Income |
| Owner-Occupied | 7,619 (75.3%) | $61,926 |
| Renter-Occupied | 2,497 (24.7%) | $35,853 |
| Average | 10,116 (100.0%) | $53,490 |
Occupancy by Householder Income Bracket in Miller County
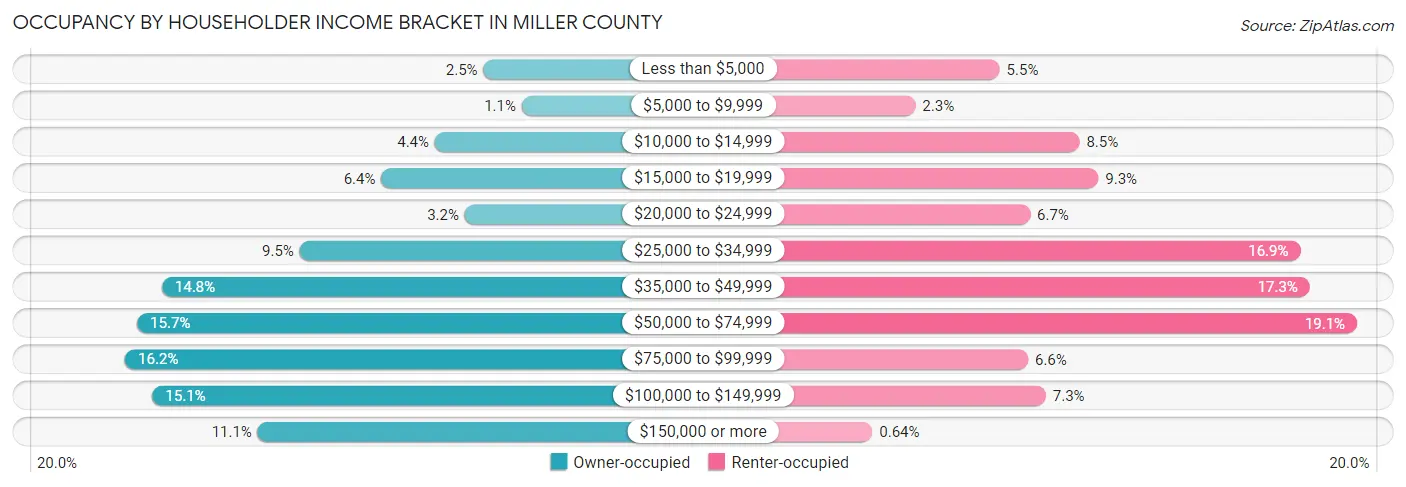
| Income Bracket | Owner-occupied | Renter-occupied |
| Less than $5,000 | 192 (2.5%) | 137 (5.5%) |
| $5,000 to $9,999 | 81 (1.1%) | 57 (2.3%) |
| $10,000 to $14,999 | 333 (4.4%) | 213 (8.5%) |
| $15,000 to $19,999 | 488 (6.4%) | 231 (9.2%) |
| $20,000 to $24,999 | 246 (3.2%) | 166 (6.7%) |
| $25,000 to $34,999 | 725 (9.5%) | 423 (16.9%) |
| $35,000 to $49,999 | 1,125 (14.8%) | 432 (17.3%) |
| $50,000 to $74,999 | 1,197 (15.7%) | 477 (19.1%) |
| $75,000 to $99,999 | 1,232 (16.2%) | 164 (6.6%) |
| $100,000 to $149,999 | 1,153 (15.1%) | 181 (7.2%) |
| $150,000 or more | 847 (11.1%) | 16 (0.6%) |
| Total | 7,619 (100.0%) | 2,497 (100.0%) |
Monthly Housing Cost Tiers in Miller County
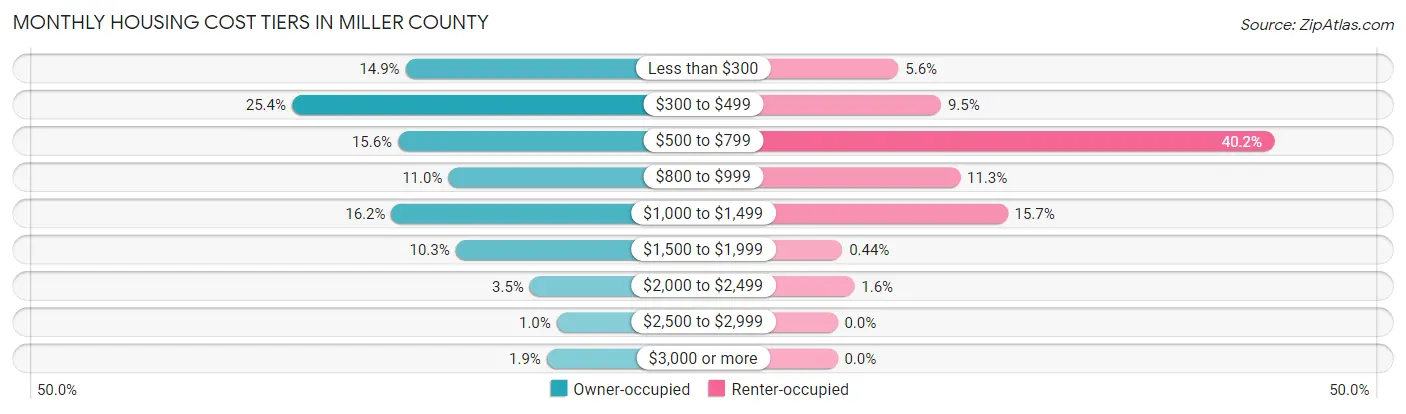
| Monthly Cost | Owner-occupied | Renter-occupied |
| Less than $300 | 1,138 (14.9%) | 140 (5.6%) |
| $300 to $499 | 1,935 (25.4%) | 238 (9.5%) |
| $500 to $799 | 1,191 (15.6%) | 1,003 (40.2%) |
| $800 to $999 | 838 (11.0%) | 282 (11.3%) |
| $1,000 to $1,499 | 1,237 (16.2%) | 391 (15.7%) |
| $1,500 to $1,999 | 787 (10.3%) | 11 (0.4%) |
| $2,000 to $2,499 | 267 (3.5%) | 39 (1.6%) |
| $2,500 to $2,999 | 78 (1.0%) | 0 (0.0%) |
| $3,000 or more | 148 (1.9%) | 0 (0.0%) |
| Total | 7,619 (100.0%) | 2,497 (100.0%) |
Physical Housing Characteristics in Miller County
Housing Structures in Miller County
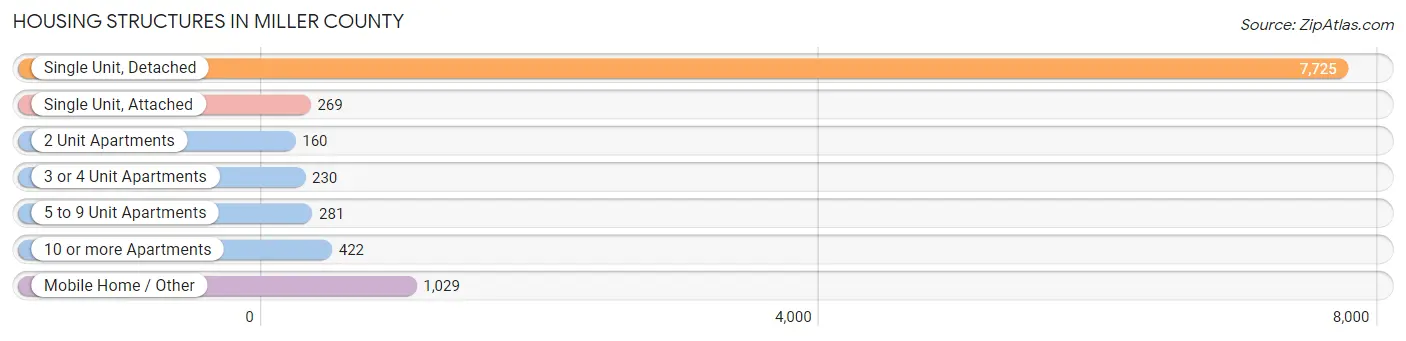
| Structure Type | # Housing Units | % Housing Units |
| Single Unit, Detached | 7,725 | 76.4% |
| Single Unit, Attached | 269 | 2.7% |
| 2 Unit Apartments | 160 | 1.6% |
| 3 or 4 Unit Apartments | 230 | 2.3% |
| 5 to 9 Unit Apartments | 281 | 2.8% |
| 10 or more Apartments | 422 | 4.2% |
| Mobile Home / Other | 1,029 | 10.2% |
| Total | 10,116 | 100.0% |
Housing Structures by Occupancy in Miller County
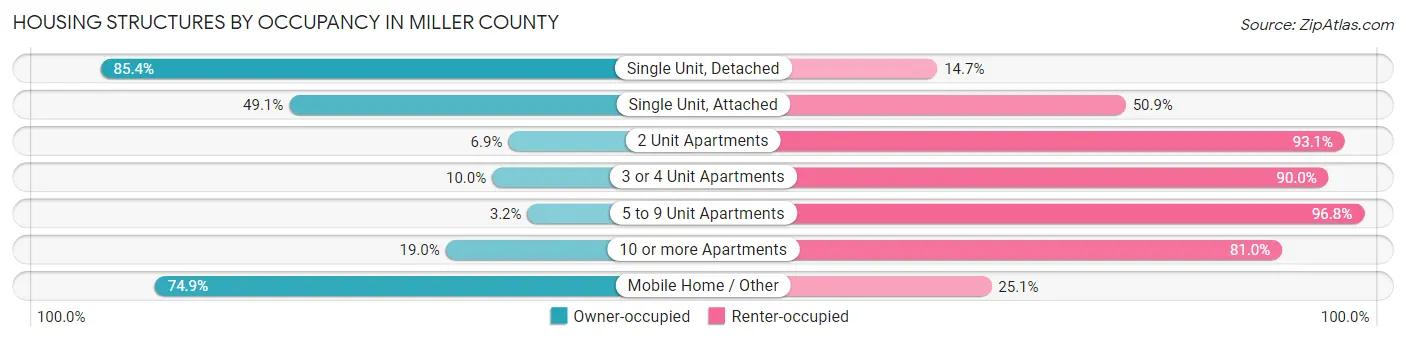
| Structure Type | Owner-occupied | Renter-occupied |
| Single Unit, Detached | 6,593 (85.4%) | 1,132 (14.6%) |
| Single Unit, Attached | 132 (49.1%) | 137 (50.9%) |
| 2 Unit Apartments | 11 (6.9%) | 149 (93.1%) |
| 3 or 4 Unit Apartments | 23 (10.0%) | 207 (90.0%) |
| 5 to 9 Unit Apartments | 9 (3.2%) | 272 (96.8%) |
| 10 or more Apartments | 80 (19.0%) | 342 (81.0%) |
| Mobile Home / Other | 771 (74.9%) | 258 (25.1%) |
| Total | 7,619 (75.3%) | 2,497 (24.7%) |
Housing Structures by Number of Rooms in Miller County
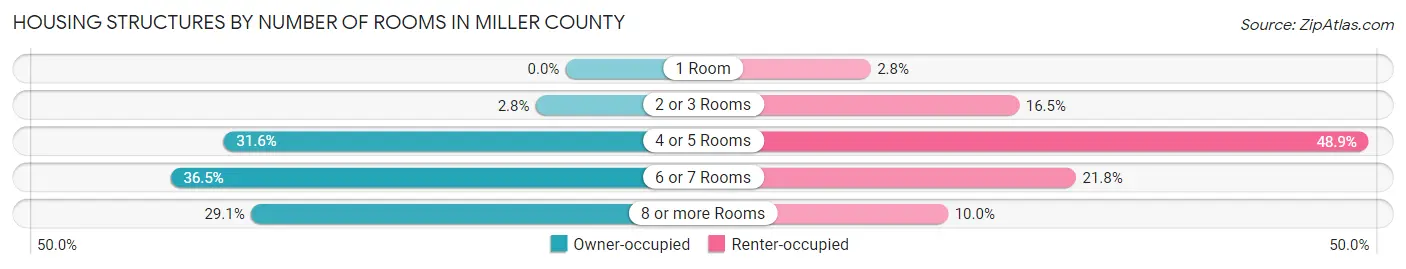
| Number of Rooms | Owner-occupied | Renter-occupied |
| 1 Room | 0 (0.0%) | 70 (2.8%) |
| 2 or 3 Rooms | 211 (2.8%) | 413 (16.5%) |
| 4 or 5 Rooms | 2,408 (31.6%) | 1,221 (48.9%) |
| 6 or 7 Rooms | 2,782 (36.5%) | 544 (21.8%) |
| 8 or more Rooms | 2,218 (29.1%) | 249 (10.0%) |
| Total | 7,619 (100.0%) | 2,497 (100.0%) |
Housing Structure by Heating Type in Miller County
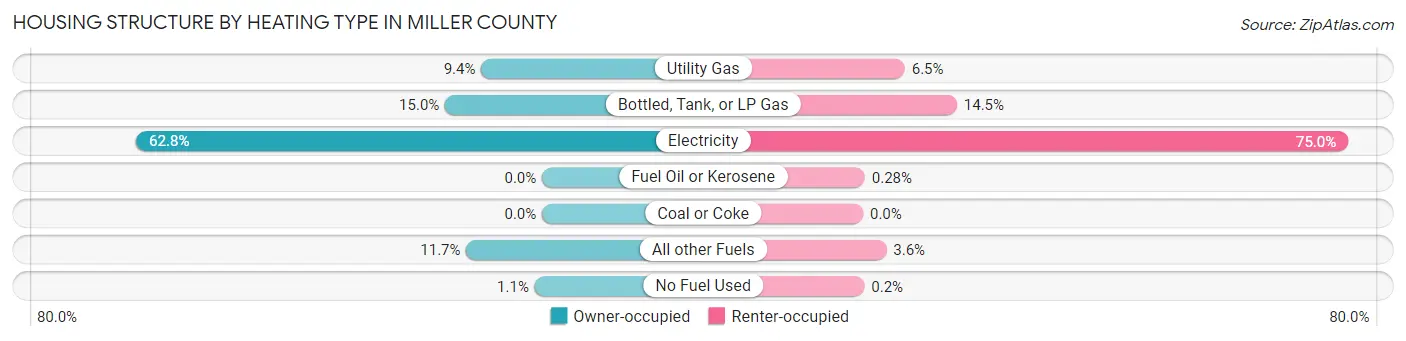
| Heating Type | Owner-occupied | Renter-occupied |
| Utility Gas | 716 (9.4%) | 161 (6.5%) |
| Bottled, Tank, or LP Gas | 1,142 (15.0%) | 362 (14.5%) |
| Electricity | 4,782 (62.8%) | 1,872 (75.0%) |
| Fuel Oil or Kerosene | 0 (0.0%) | 7 (0.3%) |
| Coal or Coke | 0 (0.0%) | 0 (0.0%) |
| All other Fuels | 892 (11.7%) | 90 (3.6%) |
| No Fuel Used | 87 (1.1%) | 5 (0.2%) |
| Total | 7,619 (100.0%) | 2,497 (100.0%) |
Household Vehicle Usage in Miller County
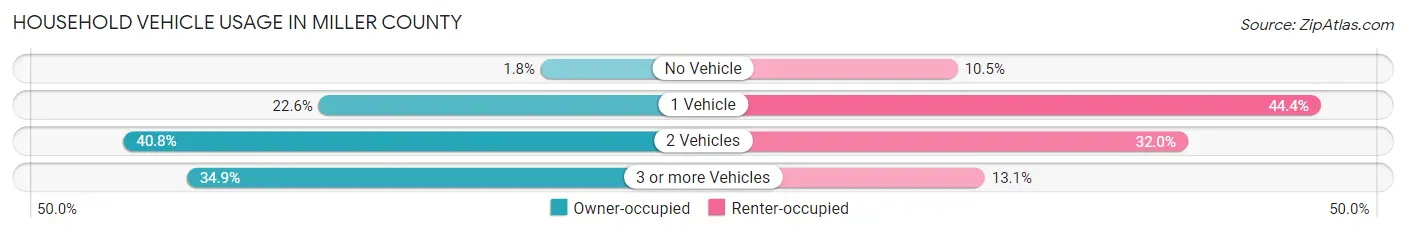
| Vehicles per Household | Owner-occupied | Renter-occupied |
| No Vehicle | 138 (1.8%) | 263 (10.5%) |
| 1 Vehicle | 1,718 (22.6%) | 1,109 (44.4%) |
| 2 Vehicles | 3,107 (40.8%) | 799 (32.0%) |
| 3 or more Vehicles | 2,656 (34.9%) | 326 (13.1%) |
| Total | 7,619 (100.0%) | 2,497 (100.0%) |
Real Estate & Mortgages in Miller County
Real Estate and Mortgage Overview in Miller County
| Characteristic | Without Mortgage | With Mortgage |
| Housing Units | 3,559 | 4,060 |
| Median Property Value | $124,800 | $183,800 |
| Median Household Income | $46,651 | $585 |
| Monthly Housing Costs | $377 | $138 |
| Real Estate Taxes | $900 | $232 |
Property Value by Mortgage Status in Miller County
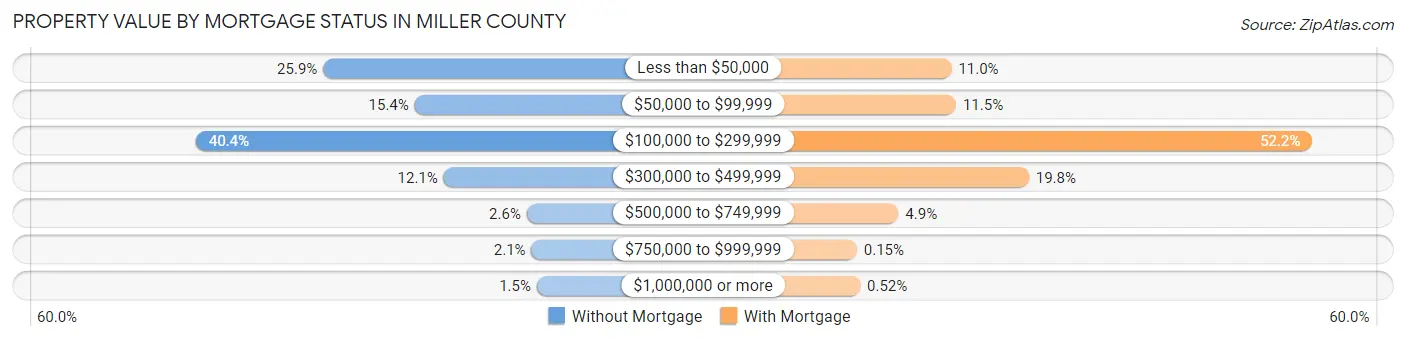
| Property Value | Without Mortgage | With Mortgage |
| Less than $50,000 | 921 (25.9%) | 445 (11.0%) |
| $50,000 to $99,999 | 549 (15.4%) | 466 (11.5%) |
| $100,000 to $299,999 | 1,439 (40.4%) | 2,119 (52.2%) |
| $300,000 to $499,999 | 431 (12.1%) | 804 (19.8%) |
| $500,000 to $749,999 | 93 (2.6%) | 199 (4.9%) |
| $750,000 to $999,999 | 74 (2.1%) | 6 (0.2%) |
| $1,000,000 or more | 52 (1.5%) | 21 (0.5%) |
| Total | 3,559 (100.0%) | 4,060 (100.0%) |
Household Income by Mortgage Status in Miller County
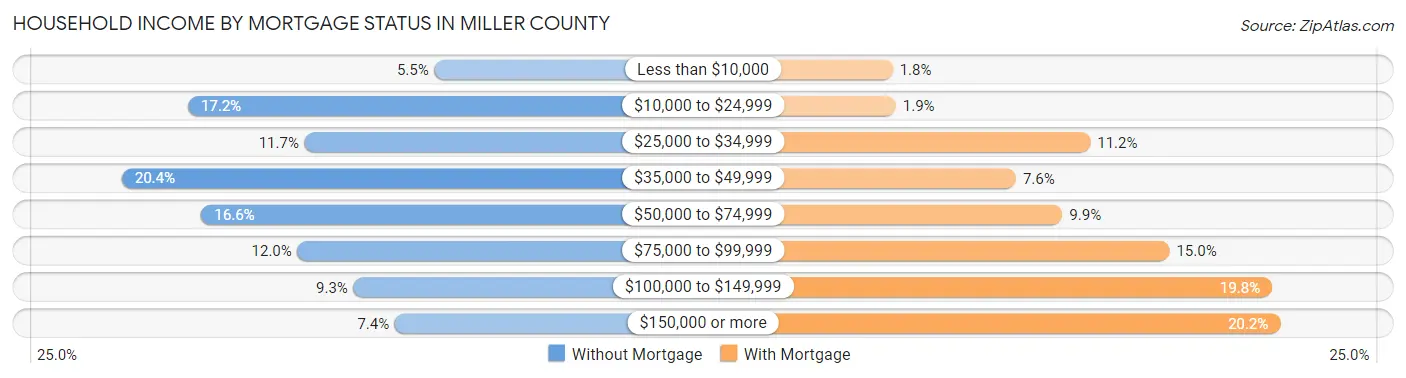
| Household Income | Without Mortgage | With Mortgage |
| Less than $10,000 | 195 (5.5%) | 72 (1.8%) |
| $10,000 to $24,999 | 613 (17.2%) | 78 (1.9%) |
| $25,000 to $34,999 | 415 (11.7%) | 454 (11.2%) |
| $35,000 to $49,999 | 725 (20.4%) | 310 (7.6%) |
| $50,000 to $74,999 | 590 (16.6%) | 400 (9.9%) |
| $75,000 to $99,999 | 427 (12.0%) | 607 (14.9%) |
| $100,000 to $149,999 | 332 (9.3%) | 805 (19.8%) |
| $150,000 or more | 262 (7.4%) | 821 (20.2%) |
| Total | 3,559 (100.0%) | 4,060 (100.0%) |
Property Value to Household Income Ratio in Miller County
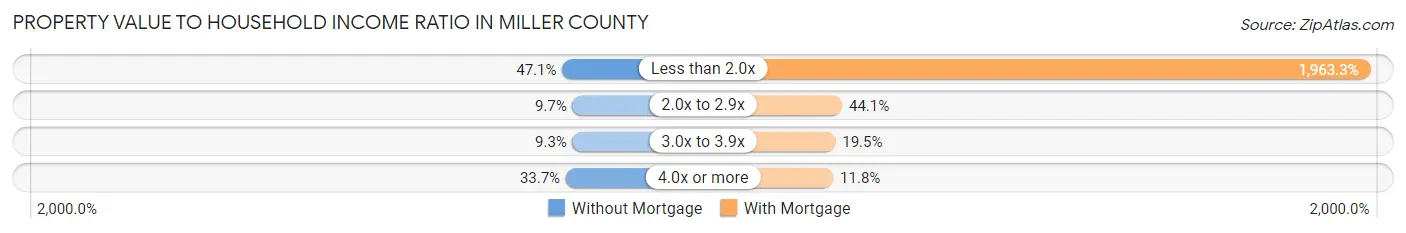
| Value-to-Income Ratio | Without Mortgage | With Mortgage |
| Less than 2.0x | 1,675 (47.1%) | 79,711 (1,963.3%) |
| 2.0x to 2.9x | 344 (9.7%) | 1,791 (44.1%) |
| 3.0x to 3.9x | 331 (9.3%) | 792 (19.5%) |
| 4.0x or more | 1,198 (33.7%) | 478 (11.8%) |
| Total | 3,559 (100.0%) | 4,060 (100.0%) |
Real Estate Taxes by Mortgage Status in Miller County
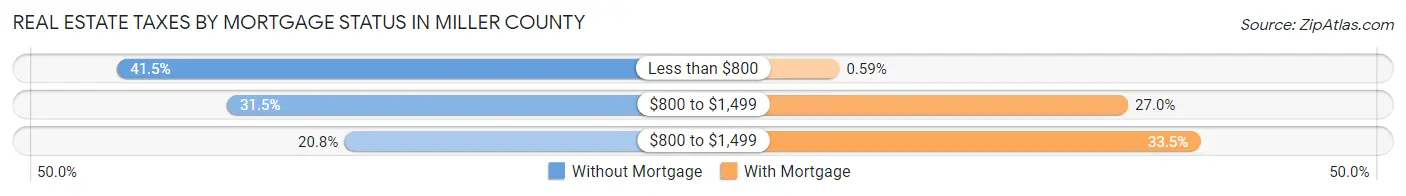
| Property Taxes | Without Mortgage | With Mortgage |
| Less than $800 | 1,478 (41.5%) | 24 (0.6%) |
| $800 to $1,499 | 1,121 (31.5%) | 1,094 (27.0%) |
| $800 to $1,499 | 741 (20.8%) | 1,361 (33.5%) |
| Total | 3,559 (100.0%) | 4,060 (100.0%) |
Health & Disability in Miller County
Health Insurance Coverage by Age in Miller County
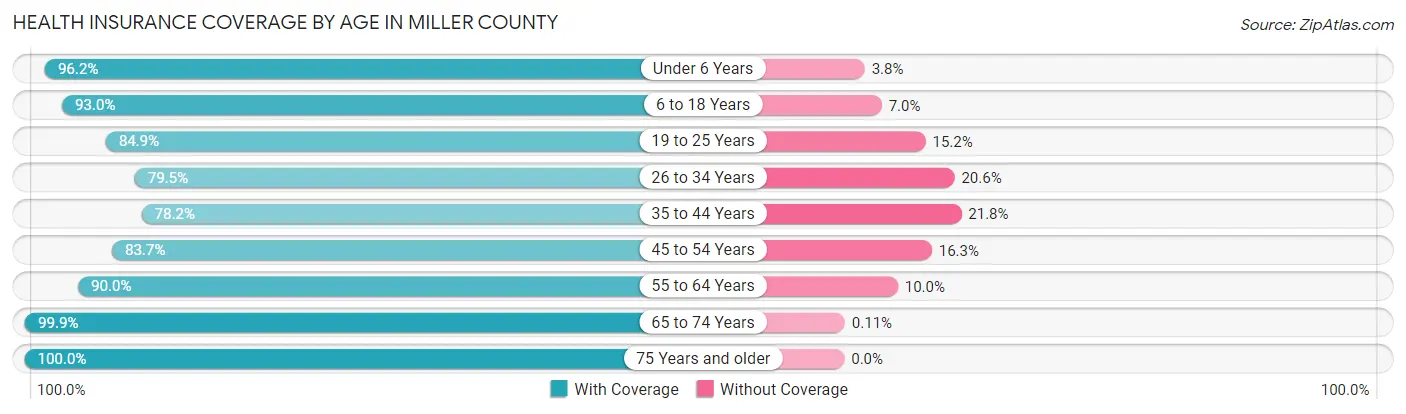
| Age Bracket | With Coverage | Without Coverage |
| Under 6 Years | 1,791 (96.2%) | 71 (3.8%) |
| 6 to 18 Years | 3,916 (93.0%) | 294 (7.0%) |
| 19 to 25 Years | 1,562 (84.9%) | 279 (15.1%) |
| 26 to 34 Years | 2,041 (79.4%) | 528 (20.5%) |
| 35 to 44 Years | 2,284 (78.2%) | 638 (21.8%) |
| 45 to 54 Years | 2,451 (83.7%) | 478 (16.3%) |
| 55 to 64 Years | 3,273 (90.0%) | 363 (10.0%) |
| 65 to 74 Years | 2,734 (99.9%) | 3 (0.1%) |
| 75 Years and older | 1,808 (100.0%) | 0 (0.0%) |
| Total | 21,860 (89.2%) | 2,654 (10.8%) |
Health Insurance Coverage by Citizenship Status in Miller County
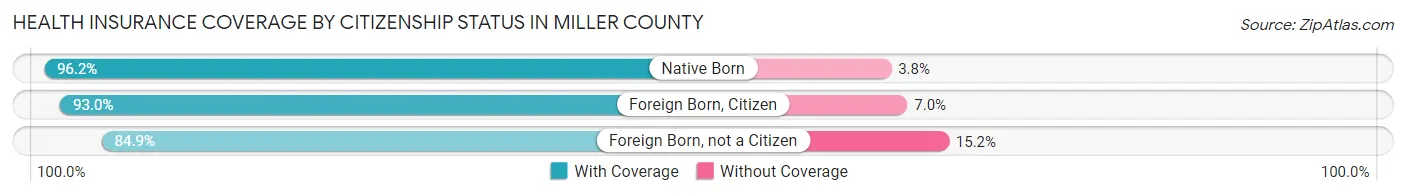
| Citizenship Status | With Coverage | Without Coverage |
| Native Born | 1,791 (96.2%) | 71 (3.8%) |
| Foreign Born, Citizen | 3,916 (93.0%) | 294 (7.0%) |
| Foreign Born, not a Citizen | 1,562 (84.9%) | 279 (15.1%) |
Health Insurance Coverage by Household Income in Miller County
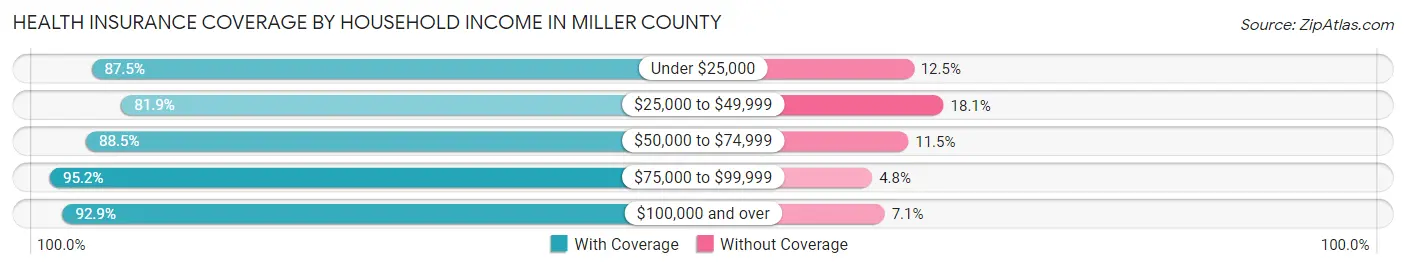
| Household Income | With Coverage | Without Coverage |
| Under $25,000 | 2,915 (87.5%) | 418 (12.5%) |
| $25,000 to $49,999 | 4,617 (81.9%) | 1,023 (18.1%) |
| $50,000 to $74,999 | 3,861 (88.5%) | 503 (11.5%) |
| $75,000 to $99,999 | 3,530 (95.2%) | 177 (4.8%) |
| $100,000 and over | 6,934 (92.9%) | 531 (7.1%) |
Public vs Private Health Insurance Coverage by Age in Miller County
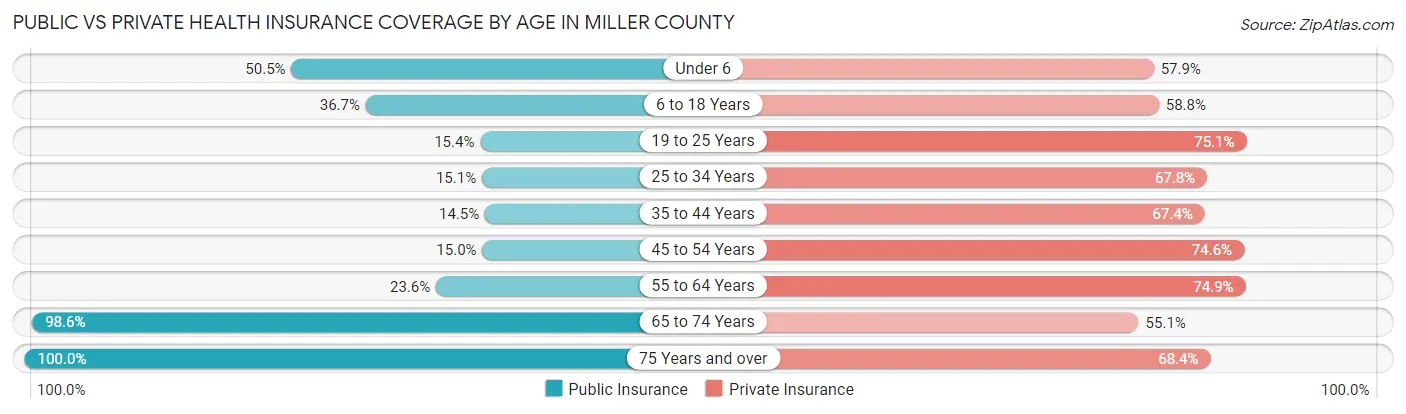
| Age Bracket | Public Insurance | Private Insurance |
| Under 6 | 940 (50.5%) | 1,078 (57.9%) |
| 6 to 18 Years | 1,544 (36.7%) | 2,477 (58.8%) |
| 19 to 25 Years | 284 (15.4%) | 1,382 (75.1%) |
| 25 to 34 Years | 388 (15.1%) | 1,741 (67.8%) |
| 35 to 44 Years | 425 (14.5%) | 1,968 (67.3%) |
| 45 to 54 Years | 440 (15.0%) | 2,186 (74.6%) |
| 55 to 64 Years | 859 (23.6%) | 2,724 (74.9%) |
| 65 to 74 Years | 2,698 (98.6%) | 1,508 (55.1%) |
| 75 Years and over | 1,808 (100.0%) | 1,237 (68.4%) |
| Total | 9,386 (38.3%) | 16,301 (66.5%) |
Disability Status by Sex by Age in Miller County
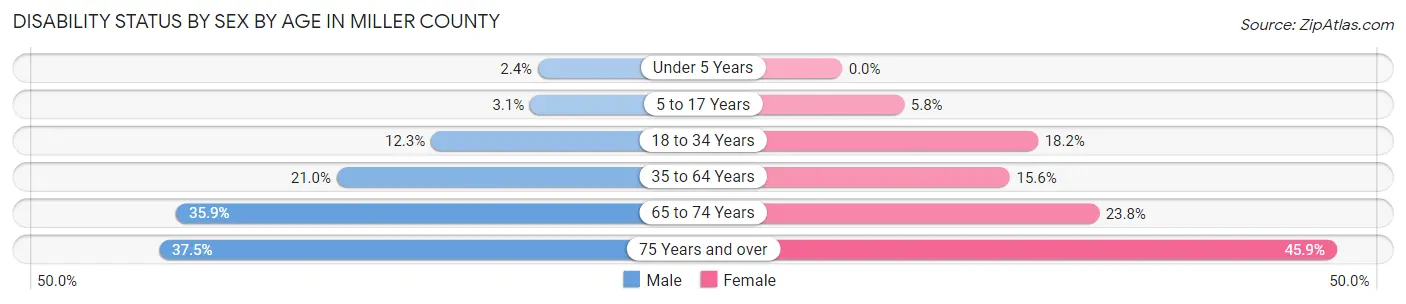
| Age Bracket | Male | Female |
| Under 5 Years | 18 (2.4%) | 0 (0.0%) |
| 5 to 17 Years | 67 (3.1%) | 124 (5.8%) |
| 18 to 34 Years | 294 (12.3%) | 416 (18.2%) |
| 35 to 64 Years | 1,008 (21.0%) | 731 (15.6%) |
| 65 to 74 Years | 489 (35.9%) | 328 (23.8%) |
| 75 Years and over | 314 (37.5%) | 446 (45.9%) |
Disability Class by Sex by Age in Miller County
Disability Class: Hearing Difficulty
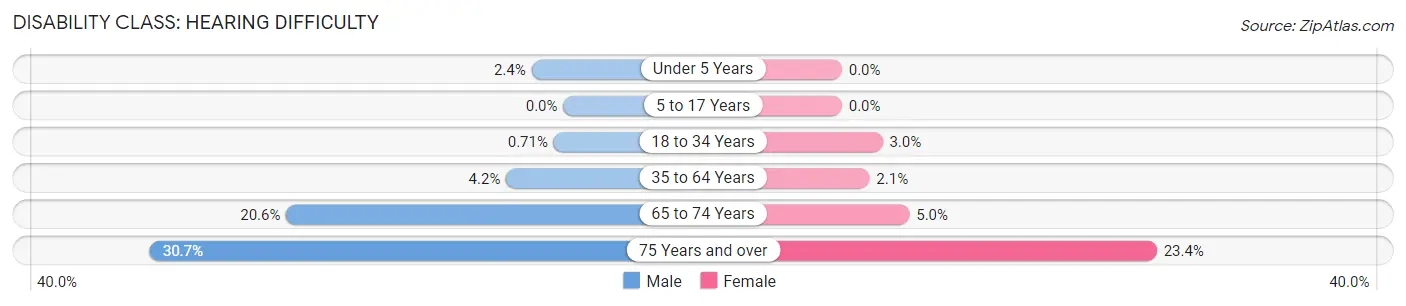
| Age Bracket | Male | Female |
| Under 5 Years | 18 (2.4%) | 0 (0.0%) |
| 5 to 17 Years | 0 (0.0%) | 0 (0.0%) |
| 18 to 34 Years | 17 (0.7%) | 69 (3.0%) |
| 35 to 64 Years | 203 (4.2%) | 96 (2.1%) |
| 65 to 74 Years | 280 (20.6%) | 69 (5.0%) |
| 75 Years and over | 257 (30.7%) | 227 (23.4%) |
Disability Class: Vision Difficulty
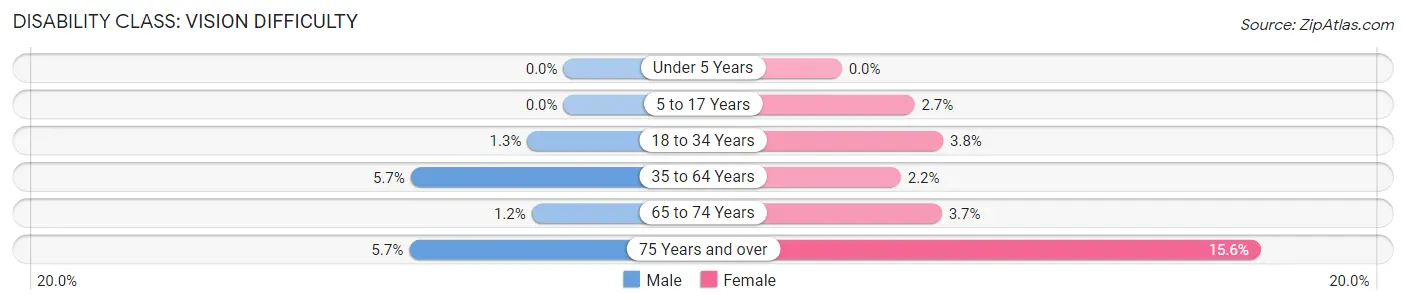
| Age Bracket | Male | Female |
| Under 5 Years | 0 (0.0%) | 0 (0.0%) |
| 5 to 17 Years | 0 (0.0%) | 58 (2.7%) |
| 18 to 34 Years | 32 (1.3%) | 86 (3.8%) |
| 35 to 64 Years | 272 (5.7%) | 103 (2.2%) |
| 65 to 74 Years | 16 (1.2%) | 51 (3.7%) |
| 75 Years and over | 48 (5.7%) | 151 (15.5%) |
Disability Class: Cognitive Difficulty
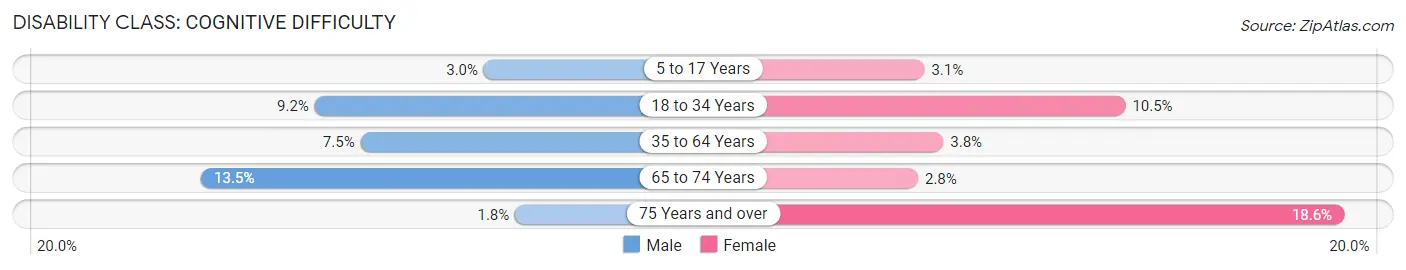
| Age Bracket | Male | Female |
| 5 to 17 Years | 64 (2.9%) | 66 (3.1%) |
| 18 to 34 Years | 221 (9.2%) | 241 (10.5%) |
| 35 to 64 Years | 361 (7.5%) | 177 (3.8%) |
| 65 to 74 Years | 183 (13.5%) | 39 (2.8%) |
| 75 Years and over | 15 (1.8%) | 181 (18.6%) |
Disability Class: Ambulatory Difficulty
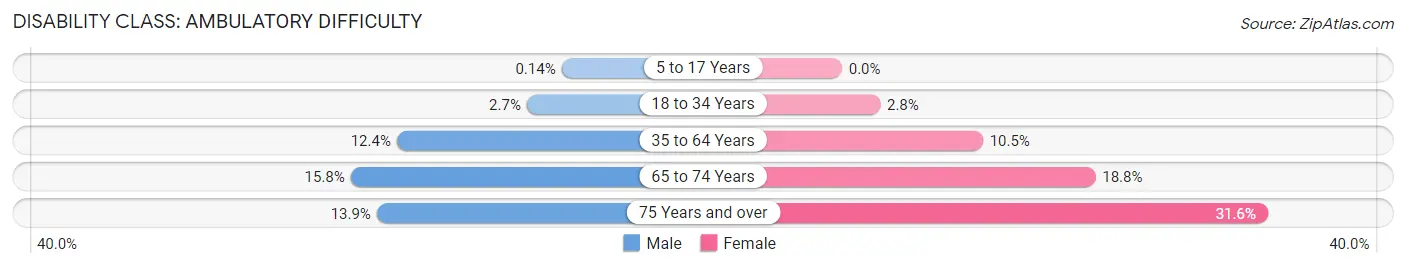
| Age Bracket | Male | Female |
| 5 to 17 Years | 3 (0.1%) | 0 (0.0%) |
| 18 to 34 Years | 65 (2.7%) | 65 (2.8%) |
| 35 to 64 Years | 593 (12.4%) | 491 (10.5%) |
| 65 to 74 Years | 215 (15.8%) | 259 (18.8%) |
| 75 Years and over | 116 (13.9%) | 307 (31.6%) |
Disability Class: Self-Care Difficulty
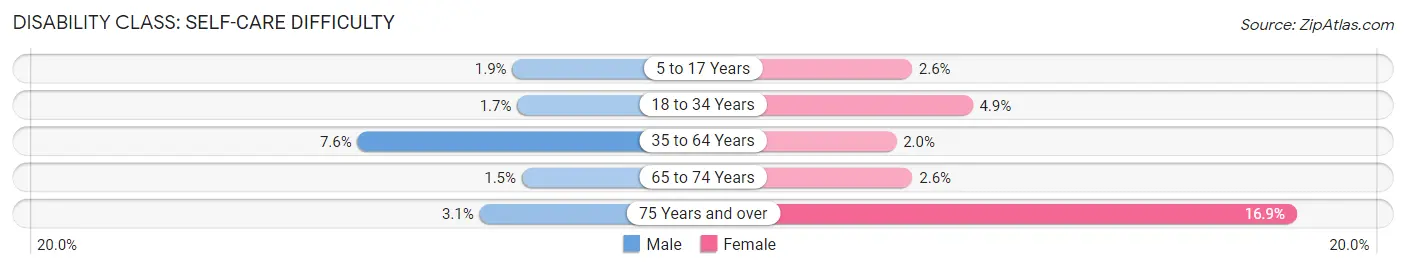
| Age Bracket | Male | Female |
| 5 to 17 Years | 41 (1.9%) | 56 (2.6%) |
| 18 to 34 Years | 41 (1.7%) | 111 (4.9%) |
| 35 to 64 Years | 366 (7.6%) | 95 (2.0%) |
| 65 to 74 Years | 21 (1.5%) | 36 (2.6%) |
| 75 Years and over | 26 (3.1%) | 164 (16.9%) |
Technology Access in Miller County
Computing Device Access in Miller County
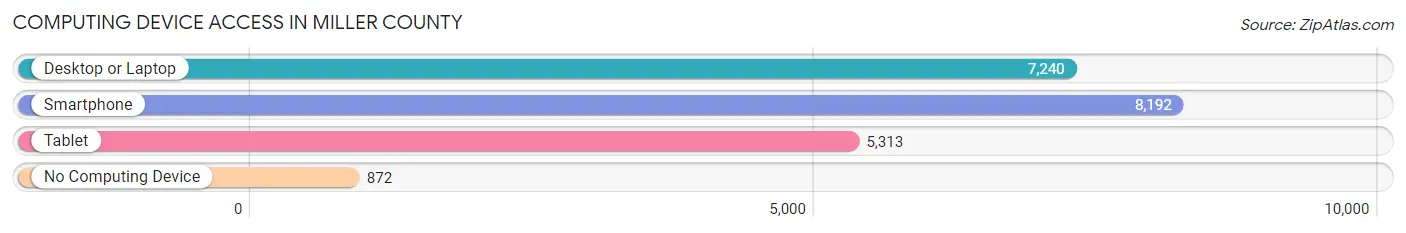
| Device Type | # Households | % Households |
| Desktop or Laptop | 7,240 | 71.6% |
| Smartphone | 8,192 | 81.0% |
| Tablet | 5,313 | 52.5% |
| No Computing Device | 872 | 8.6% |
| Total | 10,116 | 100.0% |
Internet Access in Miller County
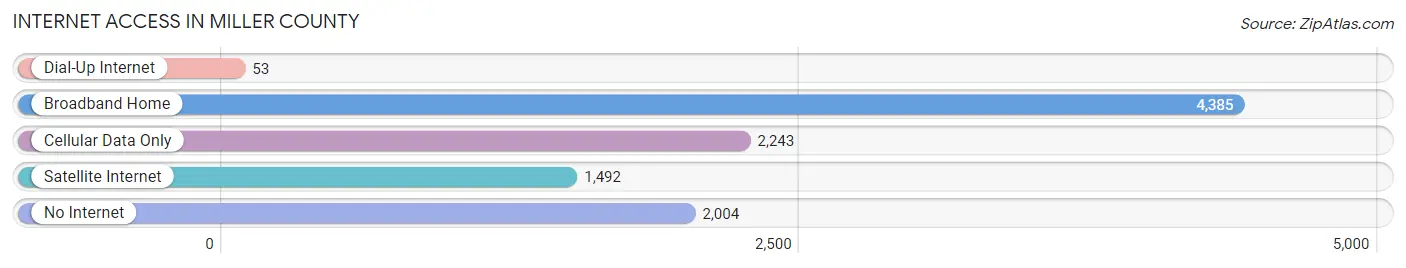
| Internet Type | # Households | % Households |
| Dial-Up Internet | 53 | 0.5% |
| Broadband Home | 4,385 | 43.3% |
| Cellular Data Only | 2,243 | 22.2% |
| Satellite Internet | 1,492 | 14.7% |
| No Internet | 2,004 | 19.8% |
| Total | 10,116 | 100.0% |
Miller County Summary
Miller County is located in the central part of the state of Missouri, in the United States. It is bordered by Camden County to the north, Morgan County to the east, Pulaski County to the south, and Laclede County to the west. The county seat is Tuscumbia. The county was established in 1837 and named after John Miller, the Governor of Missouri from 1826 to 1832.
Geography
Miller County covers an area of 576 square miles and is located in the Ozark Plateau region of Missouri. The county is mostly hilly and is drained by the Osage River. The highest point in the county is located at the intersection of Miller and Pulaski counties, at an elevation of 1,072 feet. The county is mostly forested, with oak, hickory, and pine trees being the most common.
The climate of Miller County is humid subtropical, with hot, humid summers and mild winters. The average annual temperature is around 57°F, with an average high of around 79°F in the summer and an average low of around 35°F in the winter. The average annual precipitation is around 44 inches.
Demographics
As of the 2010 United States Census, there were 24,744 people, 9,845 households, and 6,945 families living in Miller County. The population density was 43.2 people per square mile. The racial makeup of the county was 97.2% White, 0.7% African American, 0.3% Native American, 0.2% Asian, 0.1% Pacific Islander, 0.3% from other races, and 1.2% from two or more races. Hispanic or Latino of any race were 1.2% of the population.
The median income for a household in Miller County was $35,945, and the median income for a family was $43,945. The per capita income for the county was $17,945. About 14.2% of families and 17.7% of the population were below the poverty line, including 24.2% of those under age 18 and 11.2% of those age 65 or over.
Economy
The economy of Miller County is largely based on agriculture and tourism. The county is home to several large farms, which produce corn, soybeans, wheat, hay, and other crops. The county is also home to several wineries, which produce a variety of wines.
Tourism is also an important part of the economy. The county is home to several state parks, including the Ozark National Scenic Riverways, which offers canoeing, kayaking, and fishing. The county is also home to several historic sites, including the Miller County Courthouse, which was built in 1837.
Miller County is also home to several manufacturing companies, including a furniture factory, a plastics factory, and a metal fabrication plant. The county is also home to several retail stores, restaurants, and other businesses.
Conclusion
Miller County is a rural county located in the central part of Missouri. It is mostly hilly and is drained by the Osage River. The county has a humid subtropical climate, with hot, humid summers and mild winters. The population of Miller County was 24,744 as of the 2010 United States Census. The economy of the county is largely based on agriculture and tourism. The county is home to several large farms, wineries, state parks, and historic sites. It is also home to several manufacturing companies, retail stores, restaurants, and other businesses.
Common Questions
What is Per Capita Income in Miller County?
Per Capita income in Miller County is $29,347.
What is the Median Family Income in Miller County?
Median Family Income in Miller County is $72,606.
What is the Median Household income in Miller County?
Median Household Income in Miller County is $53,490.
What is Income or Wage Gap in Miller County?
Income or Wage Gap in Miller County is 15.3%.
Women in Miller County earn 84.7 cents for every dollar earned by a man.
What is Family Income Deficit in Miller County?
Family Income Deficit in Miller County is $9,827.
Families that are below poverty line in Miller County earn $9,827 less on average than the poverty threshold level.
What is Inequality or Gini Index in Miller County?
Inequality or Gini Index in Miller County is 0.45.
What is the Total Population of Miller County?
Total Population of Miller County is 24,855.
What is the Total Male Population of Miller County?
Total Male Population of Miller County is 12,458.
What is the Total Female Population of Miller County?
Total Female Population of Miller County is 12,397.
What is the Ratio of Males per 100 Females in Miller County?
There are 100.49 Males per 100 Females in Miller County.
What is the Ratio of Females per 100 Males in Miller County?
There are 99.51 Females per 100 Males in Miller County.
What is the Median Population Age in Miller County?
Median Population Age in Miller County is 41.1 Years.
What is the Average Family Size in Miller County
Average Family Size in Miller County is 3.0 People.
What is the Average Household Size in Miller County
Average Household Size in Miller County is 2.4 People.
How Large is the Labor Force in Miller County?
There are 11,941 People in the Labor Forcein in Miller County.
What is the Percentage of People in the Labor Force in Miller County?
60.5% of People are in the Labor Force in Miller County.
What is the Unemployment Rate in Miller County?
Unemployment Rate in Miller County is 4.6%.