Maries County, MO Map & Demographics
Maries County Map
Maries County Overview
$30,095
PER CAPITA INCOME
$74,645
AVG FAMILY INCOME
$56,491
AVG HOUSEHOLD INCOME
0.7%
WAGE / INCOME GAP [ % ]
99.3¢/ $1
WAGE / INCOME GAP [ $ ]
$11,511
FAMILY INCOME DEFICIT
0.45
INEQUALITY / GINI INDEX
8,454
TOTAL POPULATION
4,274
MALE POPULATION
4,180
FEMALE POPULATION
102.25
MALES / 100 FEMALES
97.80
FEMALES / 100 MALES
45.2
MEDIAN AGE
3.0
AVG FAMILY SIZE
2.3
AVG HOUSEHOLD SIZE
3,793
LABOR FORCE [ PEOPLE ]
54.7%
PERCENT IN LABOR FORCE
5.6%
UNEMPLOYMENT RATE
Maries County Area Codes
Income in Maries County
Income Overview in Maries County
Per Capita Income in Maries County is $30,095, while median incomes of families and households are $74,645 and $56,491 respectively.
| Characteristic | Number | Measure |
| Per Capita Income | 8,454 | $30,095 |
| Median Family Income | 2,231 | $74,645 |
| Mean Family Income | 2,231 | $90,120 |
| Median Household Income | 3,602 | $56,491 |
| Mean Household Income | 3,602 | $71,009 |
| Income Deficit | 2,231 | $11,511 |
| Wage / Income Gap (%) | 8,454 | 0.72% |
| Wage / Income Gap ($) | 8,454 | 99.28¢ per $1 |
| Gini / Inequality Index | 8,454 | 0.45 |
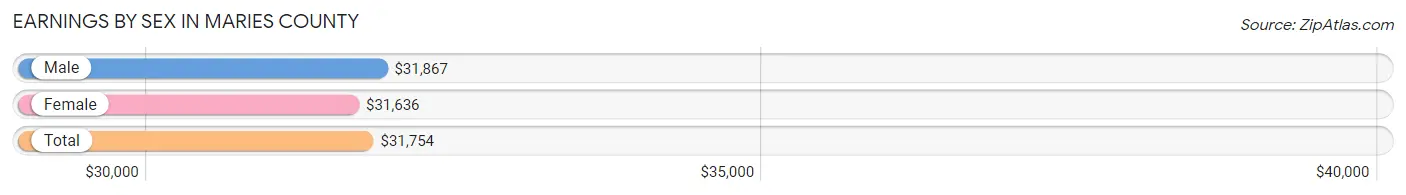
Earnings by Sex in Maries County
Average Earnings in Maries County are $31,754, $31,867 for men and $31,636 for women, a difference of 0.7%.
| Sex | Number | Average Earnings |
| Male | 2,147 (53.8%) | $31,867 |
| Female | 1,843 (46.2%) | $31,636 |
| Total | 3,990 (100.0%) | $31,754 |
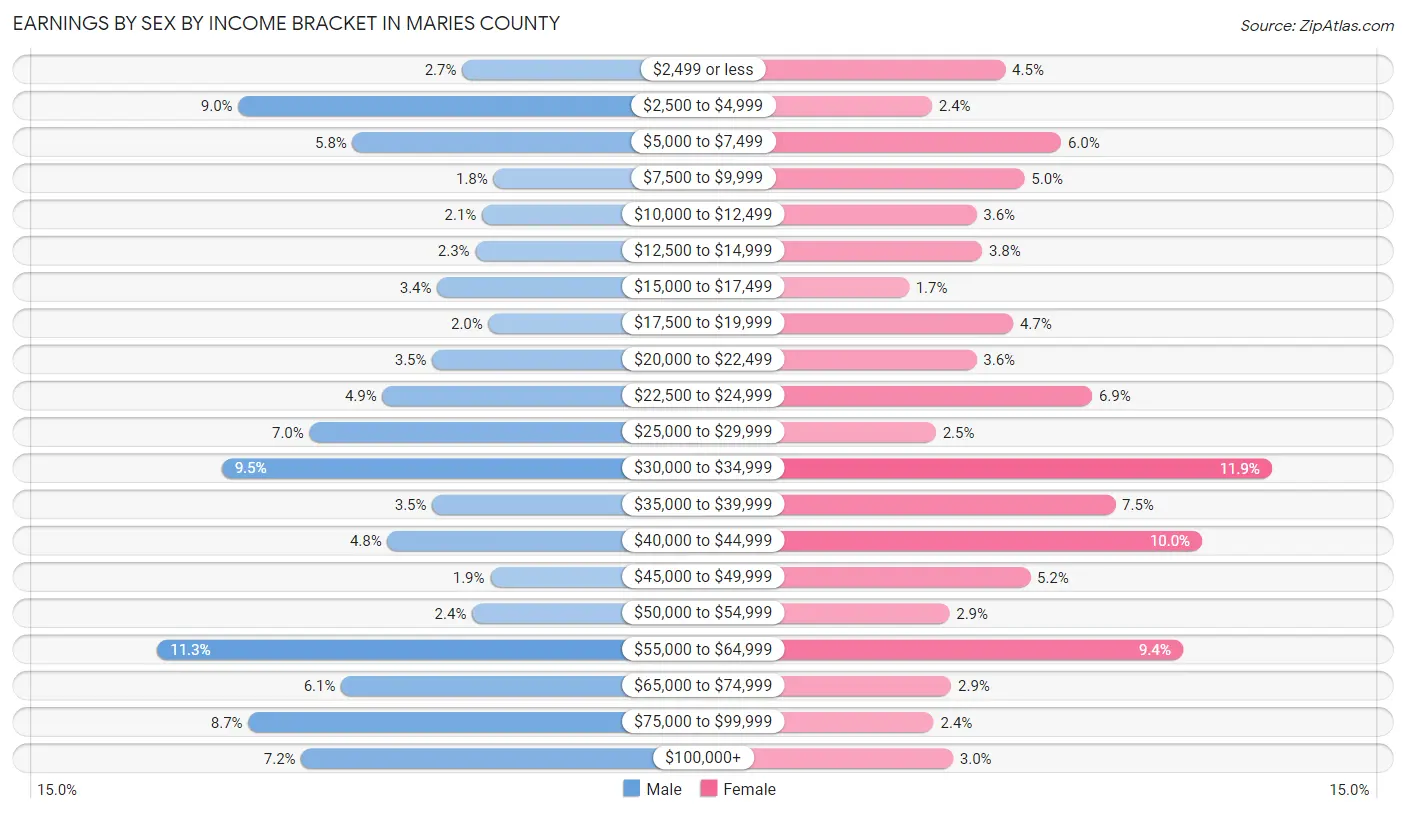
Earnings by Sex by Income Bracket in Maries County
The most common earnings brackets in Maries County are $55,000 to $64,999 for men (242 | 11.3%) and $30,000 to $34,999 for women (220 | 11.9%).
| Income | Male | Female |
| $2,499 or less | 58 (2.7%) | 82 (4.4%) |
| $2,500 to $4,999 | 193 (9.0%) | 44 (2.4%) |
| $5,000 to $7,499 | 124 (5.8%) | 111 (6.0%) |
| $7,500 to $9,999 | 39 (1.8%) | 92 (5.0%) |
| $10,000 to $12,499 | 46 (2.1%) | 67 (3.6%) |
| $12,500 to $14,999 | 50 (2.3%) | 70 (3.8%) |
| $15,000 to $17,499 | 73 (3.4%) | 32 (1.7%) |
| $17,500 to $19,999 | 42 (2.0%) | 86 (4.7%) |
| $20,000 to $22,499 | 76 (3.5%) | 67 (3.6%) |
| $22,500 to $24,999 | 106 (4.9%) | 127 (6.9%) |
| $25,000 to $29,999 | 150 (7.0%) | 46 (2.5%) |
| $30,000 to $34,999 | 203 (9.5%) | 220 (11.9%) |
| $35,000 to $39,999 | 76 (3.5%) | 139 (7.5%) |
| $40,000 to $44,999 | 103 (4.8%) | 184 (10.0%) |
| $45,000 to $49,999 | 41 (1.9%) | 95 (5.1%) |
| $50,000 to $54,999 | 52 (2.4%) | 53 (2.9%) |
| $55,000 to $64,999 | 242 (11.3%) | 174 (9.4%) |
| $65,000 to $74,999 | 131 (6.1%) | 54 (2.9%) |
| $75,000 to $99,999 | 187 (8.7%) | 45 (2.4%) |
| $100,000+ | 155 (7.2%) | 55 (3.0%) |
| Total | 2,147 (100.0%) | 1,843 (100.0%) |
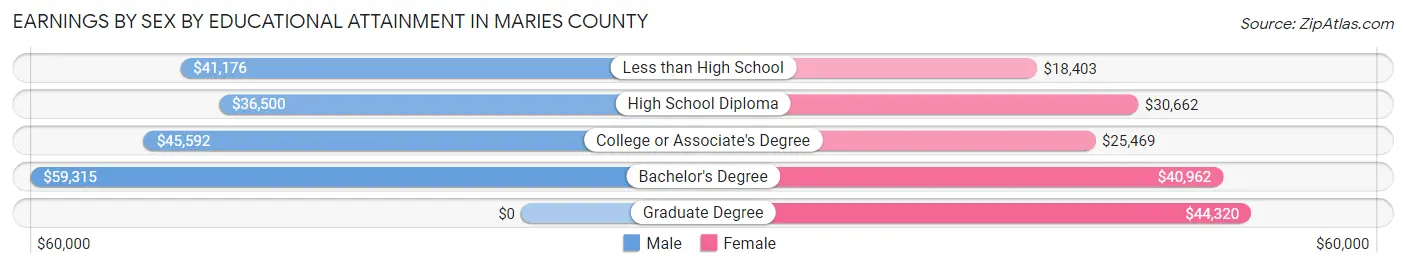
Earnings by Sex by Educational Attainment in Maries County
Average earnings in Maries County are $41,792 for men and $32,746 for women, a difference of 21.6%. Men with an educational attainment of bachelor's degree enjoy the highest average annual earnings of $59,315, while those with high school diploma education earn the least with $36,500. Women with an educational attainment of graduate degree earn the most with the average annual earnings of $44,320, while those with less than high school education have the smallest earnings of $18,403.
| Educational Attainment | Male Income | Female Income |
| Less than High School | $41,176 | $18,403 |
| High School Diploma | $36,500 | $30,662 |
| College or Associate's Degree | $45,592 | $25,469 |
| Bachelor's Degree | $59,315 | $40,962 |
| Graduate Degree | - | - |
| Total | $41,792 | $32,746 |
Family Income in Maries County
Family Income Brackets in Maries County
According to the Maries County family income data, there are 504 families falling into the $50,000 to $74,999 income range, which is the most common income bracket and makes up 22.6% of all families. Conversely, the less than $10,000 income bracket is the least frequent group with only 56 families (2.5%) belonging to this category.
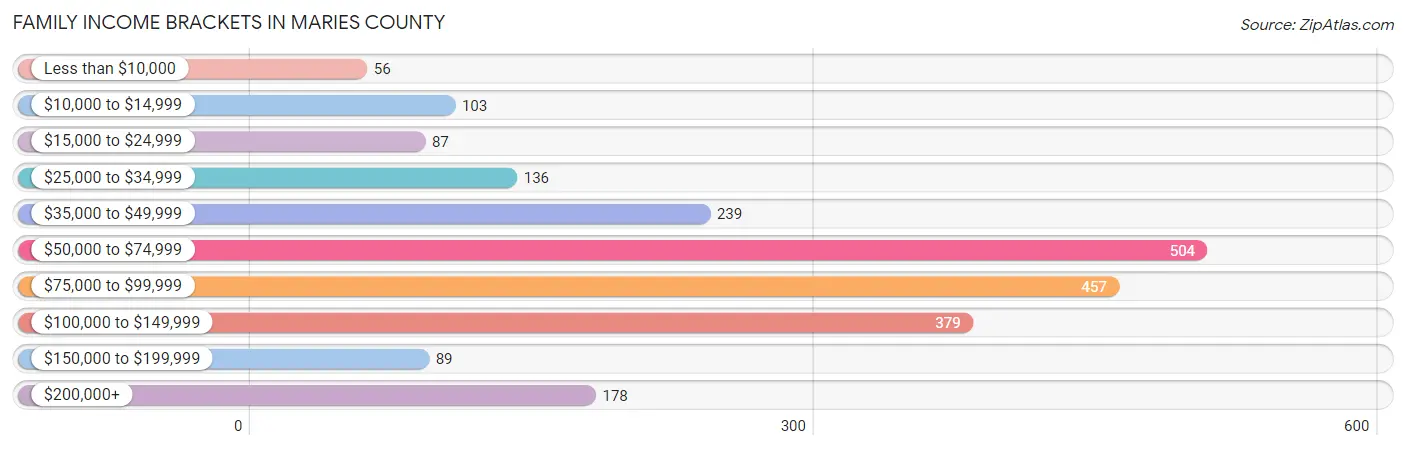
| Income Bracket | # Families | % Families |
| Less than $10,000 | 56 | 2.5% |
| $10,000 to $14,999 | 103 | 4.6% |
| $15,000 to $24,999 | 87 | 3.9% |
| $25,000 to $34,999 | 136 | 6.1% |
| $35,000 to $49,999 | 239 | 10.7% |
| $50,000 to $74,999 | 504 | 22.6% |
| $75,000 to $99,999 | 457 | 20.5% |
| $100,000 to $149,999 | 379 | 17.0% |
| $150,000 to $199,999 | 89 | 4.0% |
| $200,000+ | 178 | 8.0% |
Family Income by Famaliy Size in Maries County
5-person families (247 | 11.1%) account for the highest median family income in Maries County with $98,494 per family, while 2-person families (1,169 | 52.4%) have the highest median income of $34,688 per family member.
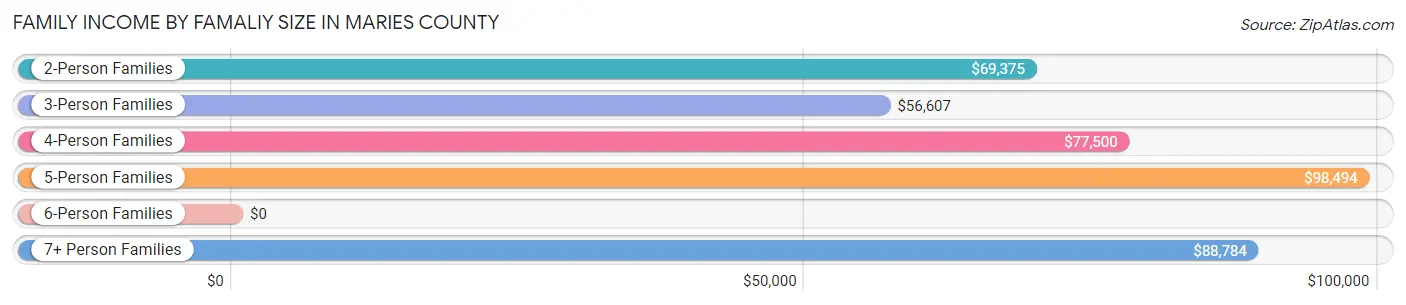
| Income Bracket | # Families | Median Income |
| 2-Person Families | 1,169 (52.4%) | $69,375 |
| 3-Person Families | 386 (17.3%) | $56,607 |
| 4-Person Families | 328 (14.7%) | $77,500 |
| 5-Person Families | 247 (11.1%) | $98,494 |
| 6-Person Families | 4 (0.2%) | $0 |
| 7+ Person Families | 97 (4.3%) | $88,784 |
| Total | 2,231 (100.0%) | $74,645 |
Family Income by Number of Earners in Maries County
The median family income in Maries County is $74,645, with families comprising 3+ earners (169) having the highest median family income of $113,832, while families with no earners (406) have the lowest median family income of $41,912, accounting for 7.6% and 18.2% of families, respectively.
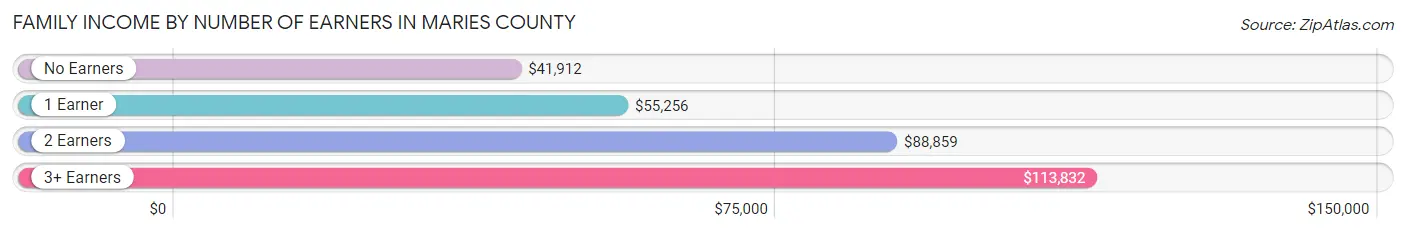
| Number of Earners | # Families | Median Income |
| No Earners | 406 (18.2%) | $41,912 |
| 1 Earner | 762 (34.2%) | $55,256 |
| 2 Earners | 894 (40.1%) | $88,859 |
| 3+ Earners | 169 (7.6%) | $113,832 |
| Total | 2,231 (100.0%) | $74,645 |
Household Income in Maries County
Household Income Brackets in Maries County
With 724 households falling in the category, the $50,000 to $74,999 income range is the most frequent in Maries County, accounting for 20.1% of all households. In contrast, only 94 households (2.6%) fall into the $150,000 to $199,999 income bracket, making it the least populous group.
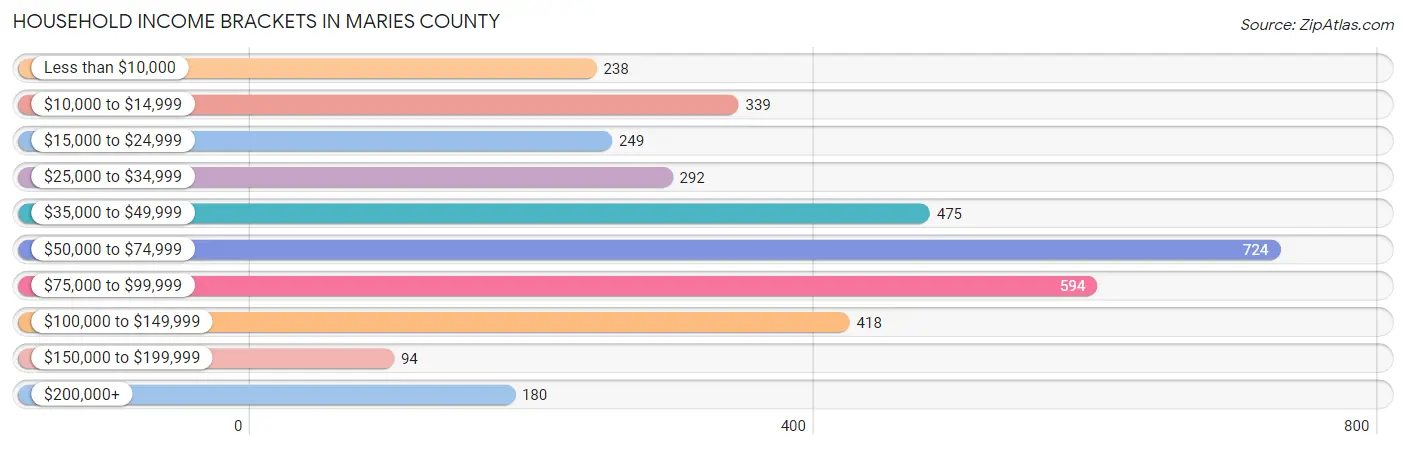
| Income Bracket | # Households | % Households |
| Less than $10,000 | 238 | 6.6% |
| $10,000 to $14,999 | 339 | 9.4% |
| $15,000 to $24,999 | 249 | 6.9% |
| $25,000 to $34,999 | 292 | 8.1% |
| $35,000 to $49,999 | 475 | 13.2% |
| $50,000 to $74,999 | 724 | 20.1% |
| $75,000 to $99,999 | 594 | 16.5% |
| $100,000 to $149,999 | 418 | 11.6% |
| $150,000 to $199,999 | 94 | 2.6% |
| $200,000+ | 180 | 5.0% |
Household Income by Householder Age in Maries County
The median household income in Maries County is $56,491, with the highest median household income of $87,321 found in the 25 to 44 years age bracket for the primary householder. A total of 794 households (22.0%) fall into this category. Meanwhile, the 15 to 24 years age bracket for the primary householder has the lowest median household income of $37,159, with 138 households (3.8%) in this group.
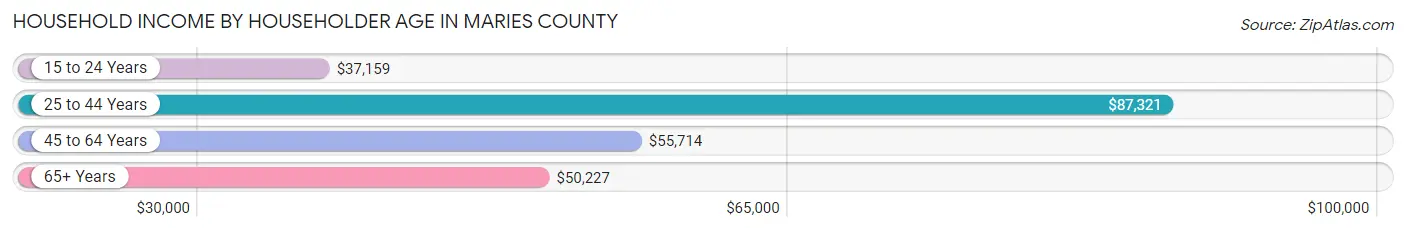
| Income Bracket | # Households | Median Income |
| 15 to 24 Years | 138 (3.8%) | $37,159 |
| 25 to 44 Years | 794 (22.0%) | $87,321 |
| 45 to 64 Years | 1,396 (38.8%) | $55,714 |
| 65+ Years | 1,274 (35.4%) | $50,227 |
| Total | 3,602 (100.0%) | $56,491 |
Poverty in Maries County
Income Below Poverty by Sex and Age in Maries County
With 14.1% poverty level for males and 20.8% for females among the residents of Maries County, 12 to 14 year old males and 6 to 11 year old females are the most vulnerable to poverty, with 31 males (27.0%) and 69 females (32.6%) in their respective age groups living below the poverty level.
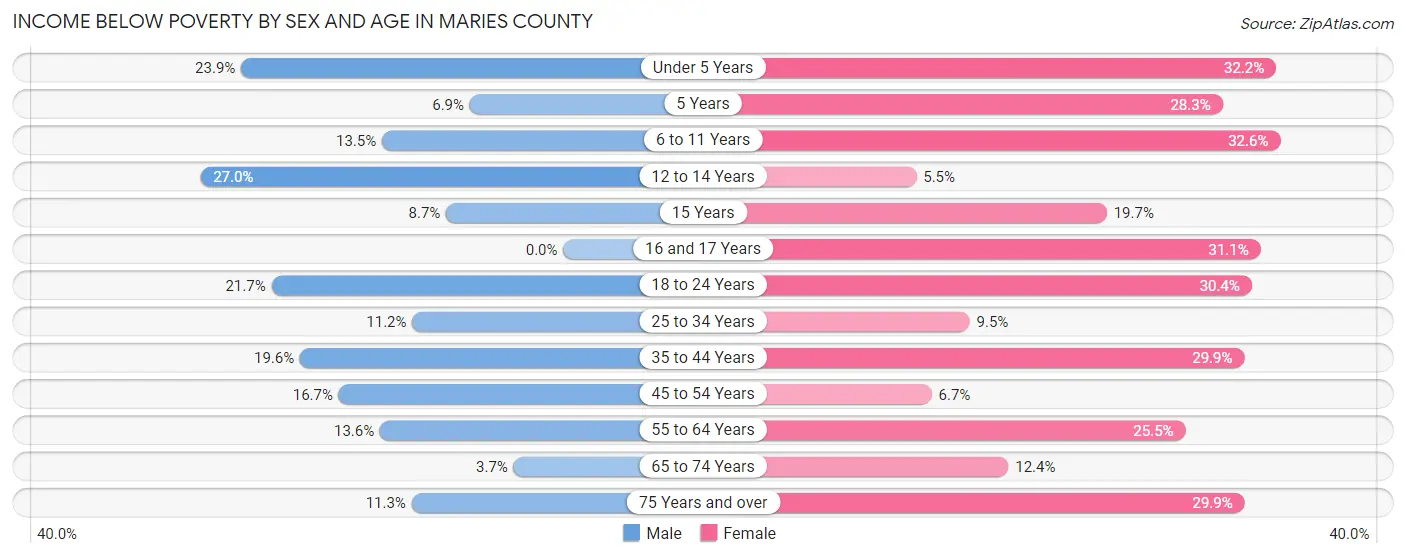
| Age Bracket | Male | Female |
| Under 5 Years | 50 (23.9%) | 59 (32.2%) |
| 5 Years | 5 (6.9%) | 13 (28.3%) |
| 6 to 11 Years | 42 (13.5%) | 69 (32.6%) |
| 12 to 14 Years | 31 (27.0%) | 12 (5.5%) |
| 15 Years | 8 (8.7%) | 12 (19.7%) |
| 16 and 17 Years | 0 (0.0%) | 37 (31.1%) |
| 18 to 24 Years | 83 (21.7%) | 84 (30.4%) |
| 25 to 34 Years | 48 (11.2%) | 39 (9.5%) |
| 35 to 44 Years | 96 (19.6%) | 147 (29.9%) |
| 45 to 54 Years | 87 (16.7%) | 35 (6.7%) |
| 55 to 64 Years | 92 (13.6%) | 163 (25.5%) |
| 65 to 74 Years | 18 (3.7%) | 66 (12.4%) |
| 75 Years and over | 42 (11.3%) | 125 (29.9%) |
| Total | 602 (14.1%) | 861 (20.8%) |
Income Above Poverty by Sex and Age in Maries County
According to the poverty statistics in Maries County, males aged 16 and 17 years and females aged 12 to 14 years are the age groups that are most secure financially, with 100.0% of males and 94.5% of females in these age groups living above the poverty line.
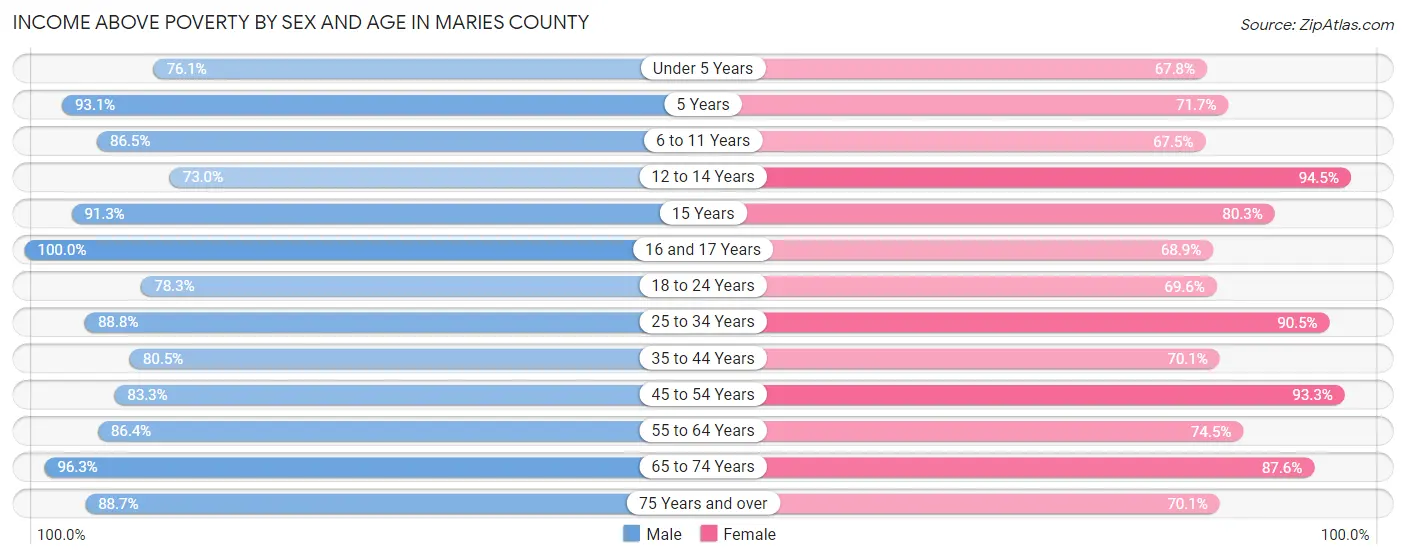
| Age Bracket | Male | Female |
| Under 5 Years | 159 (76.1%) | 124 (67.8%) |
| 5 Years | 67 (93.1%) | 33 (71.7%) |
| 6 to 11 Years | 270 (86.5%) | 143 (67.4%) |
| 12 to 14 Years | 84 (73.0%) | 205 (94.5%) |
| 15 Years | 84 (91.3%) | 49 (80.3%) |
| 16 and 17 Years | 94 (100.0%) | 82 (68.9%) |
| 18 to 24 Years | 300 (78.3%) | 192 (69.6%) |
| 25 to 34 Years | 380 (88.8%) | 372 (90.5%) |
| 35 to 44 Years | 395 (80.4%) | 345 (70.1%) |
| 45 to 54 Years | 435 (83.3%) | 490 (93.3%) |
| 55 to 64 Years | 584 (86.4%) | 476 (74.5%) |
| 65 to 74 Years | 470 (96.3%) | 468 (87.6%) |
| 75 Years and over | 331 (88.7%) | 293 (70.1%) |
| Total | 3,653 (85.9%) | 3,272 (79.2%) |
Income Below Poverty Among Married-Couple Families in Maries County
The poverty statistics for married-couple families in Maries County show that 8.0% or 148 of the total 1,859 families live below the poverty line. Families with 3 or 4 children have the highest poverty rate of 18.4%, comprising of 32 families. On the other hand, families with no children have the lowest poverty rate of 4.8%, which includes 59 families.
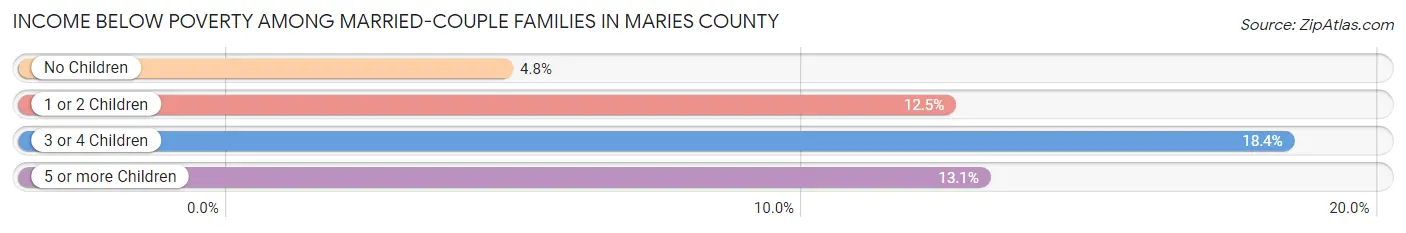
| Children | Above Poverty | Below Poverty |
| No Children | 1,174 (95.2%) | 59 (4.8%) |
| 1 or 2 Children | 322 (87.5%) | 46 (12.5%) |
| 3 or 4 Children | 142 (81.6%) | 32 (18.4%) |
| 5 or more Children | 73 (86.9%) | 11 (13.1%) |
| Total | 1,711 (92.0%) | 148 (8.0%) |
Income Below Poverty Among Single-Parent Households in Maries County
According to the poverty data in Maries County, 19.3% or 37 single-father households and 33.9% or 61 single-mother households are living below the poverty line. Among single-father households, those with 3 or 4 children have the highest poverty rate, with 17 households (80.9%) experiencing poverty. Likewise, among single-mother households, those with 1 or 2 children have the highest poverty rate, with 47 households (53.4%) falling below the poverty line.
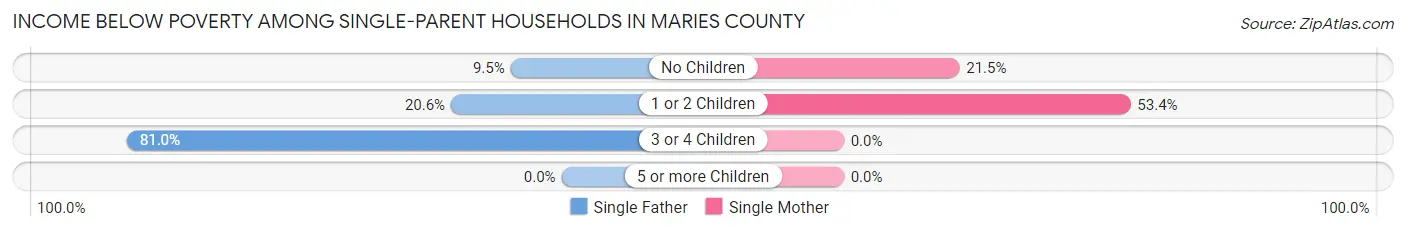
| Children | Single Father | Single Mother |
| No Children | 13 (9.5%) | 14 (21.5%) |
| 1 or 2 Children | 7 (20.6%) | 47 (53.4%) |
| 3 or 4 Children | 17 (80.9%) | 0 (0.0%) |
| 5 or more Children | 0 (0.0%) | 0 (0.0%) |
| Total | 37 (19.3%) | 61 (33.9%) |
Income Below Poverty Among Married-Couple vs Single-Parent Households in Maries County
The poverty data for Maries County shows that 148 of the married-couple family households (8.0%) and 98 of the single-parent households (26.3%) are living below the poverty level. Within the married-couple family households, those with 3 or 4 children have the highest poverty rate, with 32 households (18.4%) falling below the poverty line. Among the single-parent households, those with 1 or 2 children have the highest poverty rate, with 54 household (44.3%) living below poverty.
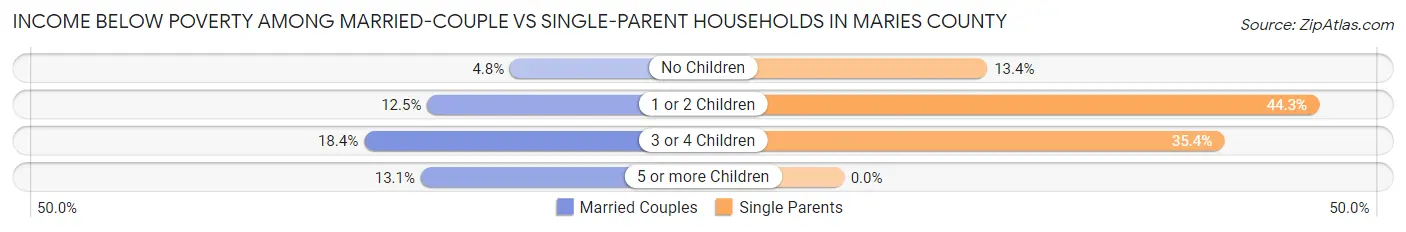
| Children | Married-Couple Families | Single-Parent Households |
| No Children | 59 (4.8%) | 27 (13.4%) |
| 1 or 2 Children | 46 (12.5%) | 54 (44.3%) |
| 3 or 4 Children | 32 (18.4%) | 17 (35.4%) |
| 5 or more Children | 11 (13.1%) | 0 (0.0%) |
| Total | 148 (8.0%) | 98 (26.3%) |
Race in Maries County
The most populous races in Maries County are White / Caucasian (8,029 | 95.0%), Two or more Races (265 | 3.1%), and Hispanic or Latino (155 | 1.8%).
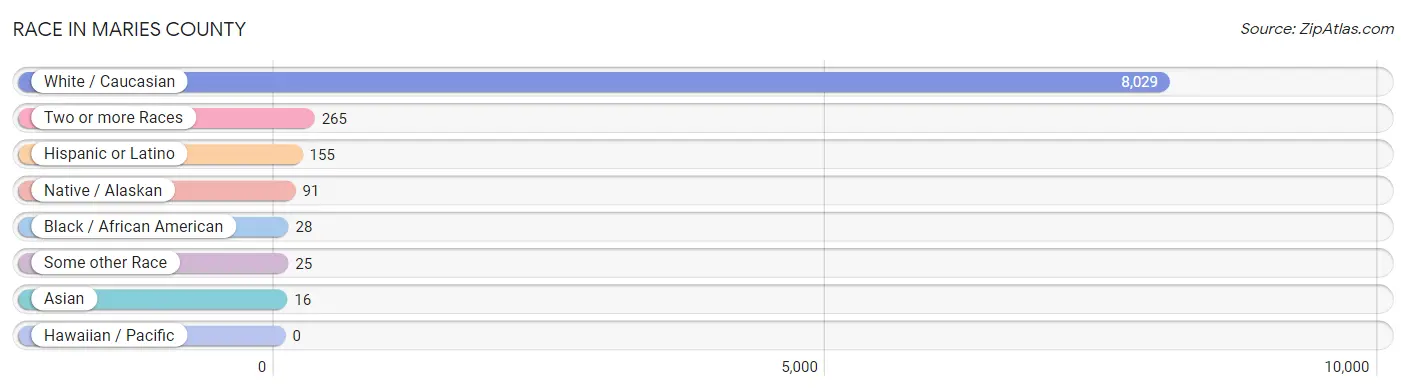
| Race | # Population | % Population |
| Asian | 16 | 0.2% |
| Black / African American | 28 | 0.3% |
| Hawaiian / Pacific | 0 | 0.0% |
| Hispanic or Latino | 155 | 1.8% |
| Native / Alaskan | 91 | 1.1% |
| White / Caucasian | 8,029 | 95.0% |
| Two or more Races | 265 | 3.1% |
| Some other Race | 25 | 0.3% |
| Total | 8,454 | 100.0% |
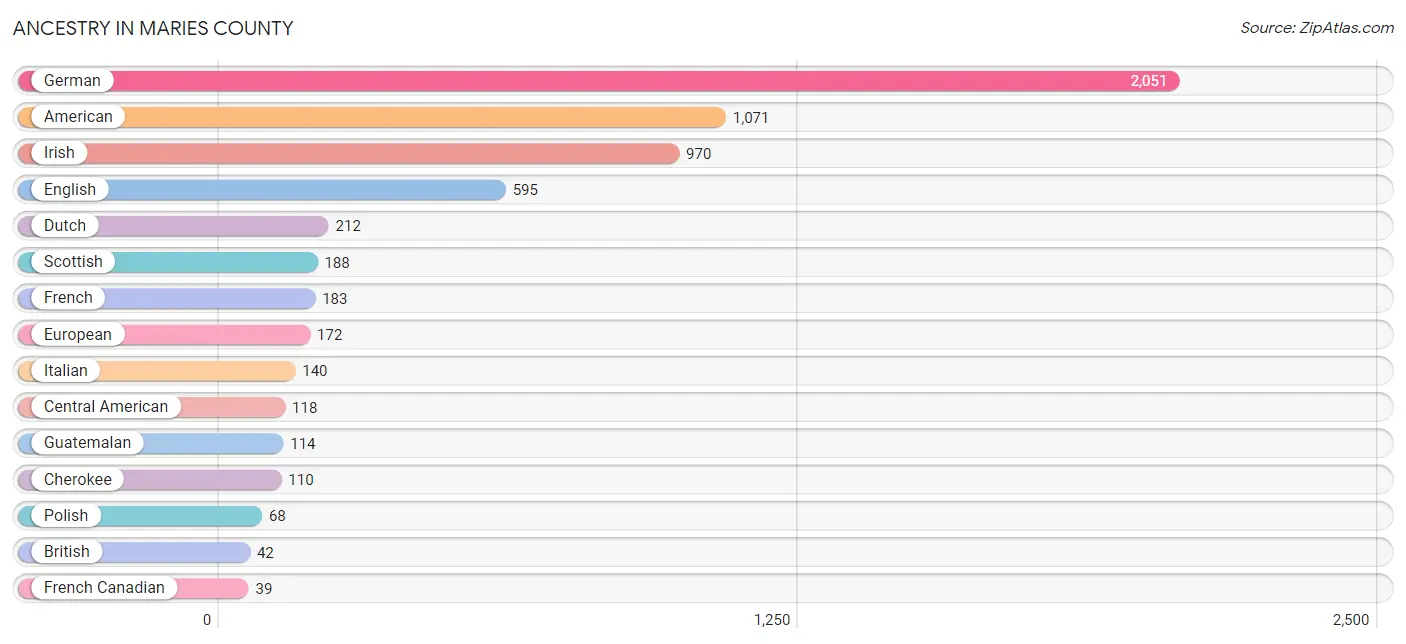
Ancestry in Maries County
The most populous ancestries reported in Maries County are German (2,051 | 24.3%), American (1,071 | 12.7%), Irish (970 | 11.5%), English (595 | 7.0%), and Dutch (212 | 2.5%), together accounting for 58.0% of all Maries County residents.
| Ancestry | # Population | % Population |
| African | 1 | 0.0% |
| American | 1,071 | 12.7% |
| Arab | 5 | 0.1% |
| Bhutanese | 16 | 0.2% |
| Blackfeet | 5 | 0.1% |
| British | 42 | 0.5% |
| Burmese | 33 | 0.4% |
| Cajun | 35 | 0.4% |
| Central American | 118 | 1.4% |
| Cherokee | 110 | 1.3% |
| Croatian | 16 | 0.2% |
| Danish | 30 | 0.4% |
| Dutch | 212 | 2.5% |
| Eastern European | 5 | 0.1% |
| English | 595 | 7.0% |
| European | 172 | 2.0% |
| French | 183 | 2.2% |
| French Canadian | 39 | 0.5% |
| German | 2,051 | 24.3% |
| Guatemalan | 114 | 1.3% |
| Irish | 970 | 11.5% |
| Iroquois | 11 | 0.1% |
| Italian | 140 | 1.7% |
| Lebanese | 5 | 0.1% |
| Mexican | 5 | 0.1% |
| Norwegian | 37 | 0.4% |
| Panamanian | 4 | 0.1% |
| Polish | 68 | 0.8% |
| Portuguese | 9 | 0.1% |
| Puerto Rican | 24 | 0.3% |
| Russian | 33 | 0.4% |
| Scandinavian | 20 | 0.2% |
| Scotch-Irish | 25 | 0.3% |
| Scottish | 188 | 2.2% |
| Seminole | 11 | 0.1% |
| Subsaharan African | 1 | 0.0% |
| Swedish | 21 | 0.3% |
| Swiss | 18 | 0.2% |
| Welsh | 7 | 0.1% |
| Yup'ik | 25 | 0.3% | View All 40 Rows |
Immigrants in Maries County
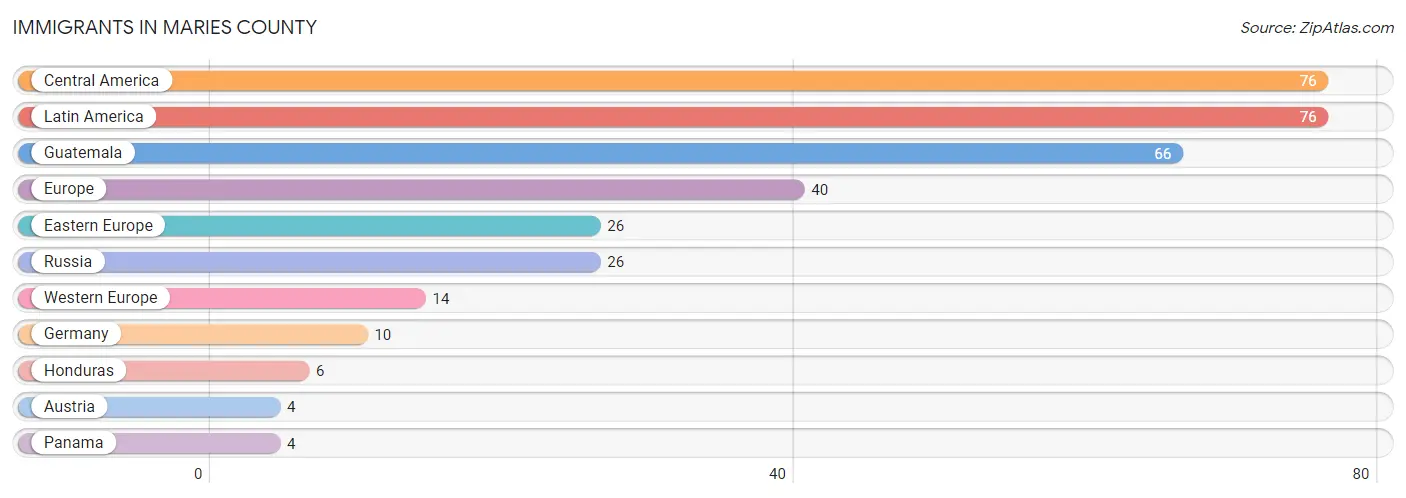
The most numerous immigrant groups reported in Maries County came from Central America (76 | 0.9%), Latin America (76 | 0.9%), Guatemala (66 | 0.8%), Europe (40 | 0.5%), and Eastern Europe (26 | 0.3%), together accounting for 3.4% of all Maries County residents.
| Immigration Origin | # Population | % Population |
| Austria | 4 | 0.1% |
| Central America | 76 | 0.9% |
| Eastern Europe | 26 | 0.3% |
| Europe | 40 | 0.5% |
| Germany | 10 | 0.1% |
| Guatemala | 66 | 0.8% |
| Honduras | 6 | 0.1% |
| Latin America | 76 | 0.9% |
| Panama | 4 | 0.1% |
| Russia | 26 | 0.3% |
| Western Europe | 14 | 0.2% | View All 11 Rows |
Sex and Age in Maries County
Sex and Age in Maries County
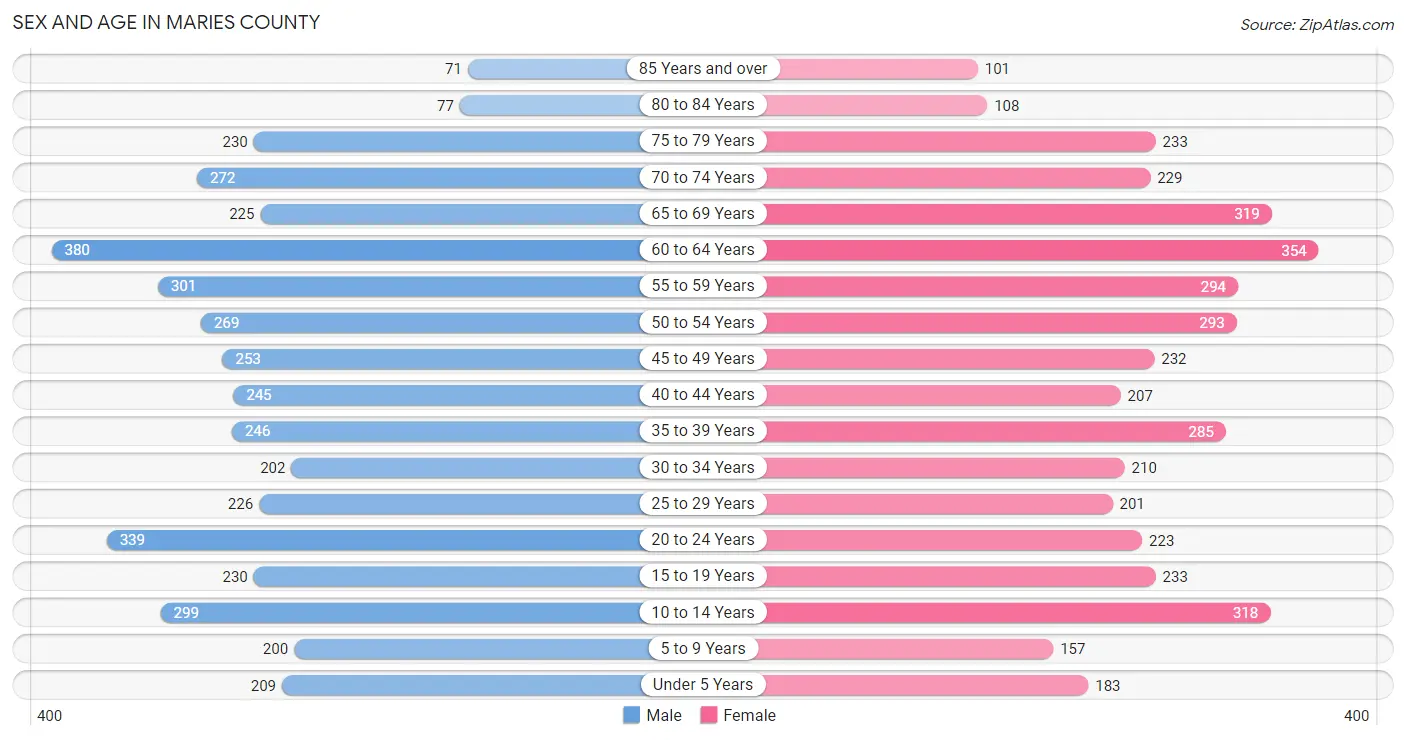
The most populous age groups in Maries County are 60 to 64 Years (380 | 8.9%) for men and 60 to 64 Years (354 | 8.5%) for women.
| Age Bracket | Male | Female |
| Under 5 Years | 209 (4.9%) | 183 (4.4%) |
| 5 to 9 Years | 200 (4.7%) | 157 (3.8%) |
| 10 to 14 Years | 299 (7.0%) | 318 (7.6%) |
| 15 to 19 Years | 230 (5.4%) | 233 (5.6%) |
| 20 to 24 Years | 339 (7.9%) | 223 (5.3%) |
| 25 to 29 Years | 226 (5.3%) | 201 (4.8%) |
| 30 to 34 Years | 202 (4.7%) | 210 (5.0%) |
| 35 to 39 Years | 246 (5.8%) | 285 (6.8%) |
| 40 to 44 Years | 245 (5.7%) | 207 (5.0%) |
| 45 to 49 Years | 253 (5.9%) | 232 (5.6%) |
| 50 to 54 Years | 269 (6.3%) | 293 (7.0%) |
| 55 to 59 Years | 301 (7.0%) | 294 (7.0%) |
| 60 to 64 Years | 380 (8.9%) | 354 (8.5%) |
| 65 to 69 Years | 225 (5.3%) | 319 (7.6%) |
| 70 to 74 Years | 272 (6.4%) | 229 (5.5%) |
| 75 to 79 Years | 230 (5.4%) | 233 (5.6%) |
| 80 to 84 Years | 77 (1.8%) | 108 (2.6%) |
| 85 Years and over | 71 (1.7%) | 101 (2.4%) |
| Total | 4,274 (100.0%) | 4,180 (100.0%) |
Families and Households in Maries County
Median Family Size in Maries County
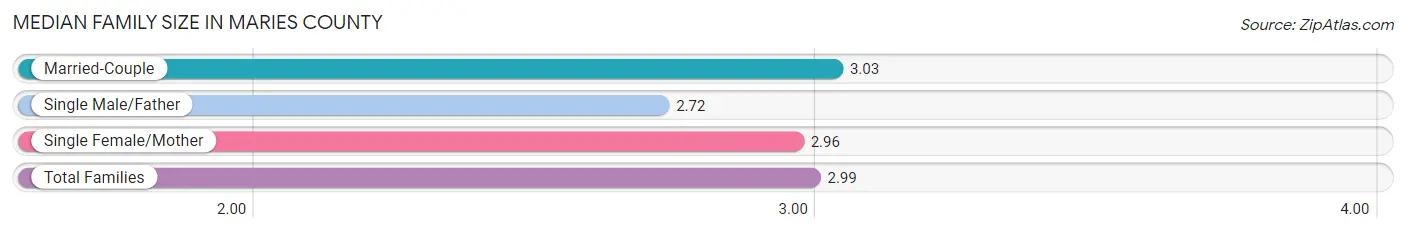
The median family size in Maries County is 2.99 persons per family, with married-couple families (1,859 | 83.3%) accounting for the largest median family size of 3.03 persons per family. On the other hand, single male/father families (192 | 8.6%) represent the smallest median family size with 2.72 persons per family.
| Family Type | # Families | Family Size |
| Married-Couple | 1,859 (83.3%) | 3.03 |
| Single Male/Father | 192 (8.6%) | 2.72 |
| Single Female/Mother | 180 (8.1%) | 2.96 |
| Total Families | 2,231 (100.0%) | 2.99 |
Median Household Size in Maries County
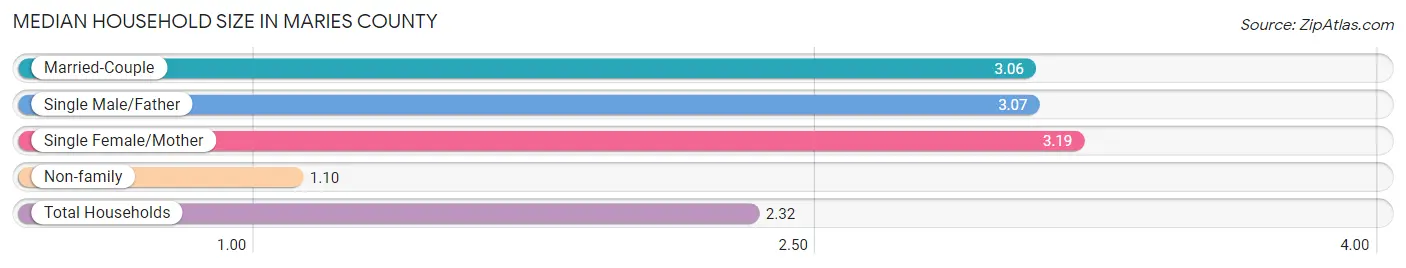
The median household size in Maries County is 2.32 persons per household, with single female/mother households (180 | 5.0%) accounting for the largest median household size of 3.19 persons per household. non-family households (1,371 | 38.1%) represent the smallest median household size with 1.10 persons per household.
| Household Type | # Households | Household Size |
| Married-Couple | 1,859 (51.6%) | 3.06 |
| Single Male/Father | 192 (5.3%) | 3.07 |
| Single Female/Mother | 180 (5.0%) | 3.19 |
| Non-family | 1,371 (38.1%) | 1.10 |
| Total Households | 3,602 (100.0%) | 2.32 |
Household Size by Marriage Status in Maries County
Out of a total of 3,602 households in Maries County, 2,231 (61.9%) are family households, while 1,371 (38.1%) are nonfamily households. The most numerous type of family households are 2-person households, comprising 1,125, and the most common type of nonfamily households are 1-person households, comprising 1,227.
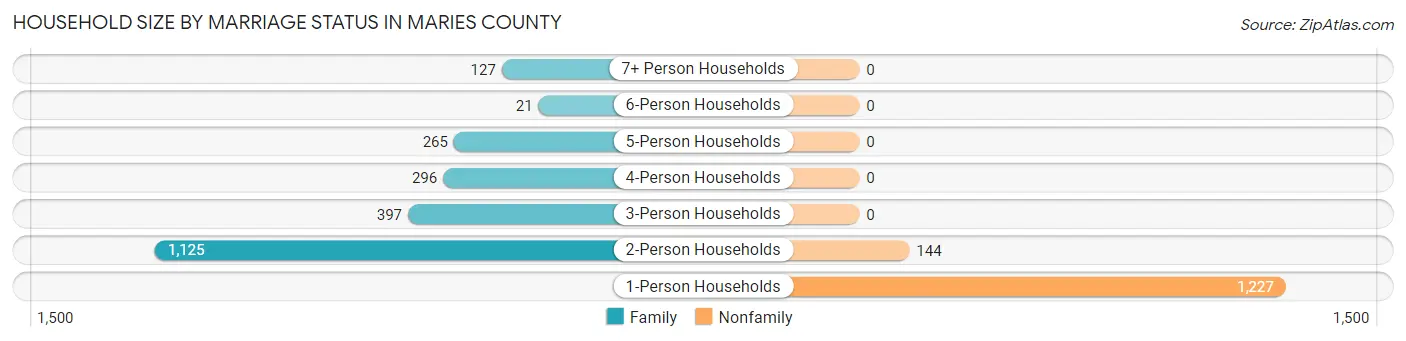
| Household Size | Family Households | Nonfamily Households |
| 1-Person Households | - | 1,227 (34.1%) |
| 2-Person Households | 1,125 (31.2%) | 144 (4.0%) |
| 3-Person Households | 397 (11.0%) | 0 (0.0%) |
| 4-Person Households | 296 (8.2%) | 0 (0.0%) |
| 5-Person Households | 265 (7.4%) | 0 (0.0%) |
| 6-Person Households | 21 (0.6%) | 0 (0.0%) |
| 7+ Person Households | 127 (3.5%) | 0 (0.0%) |
| Total | 2,231 (61.9%) | 1,371 (38.1%) |
Female Fertility in Maries County
Fertility by Age in Maries County
Average fertility rate in Maries County is 67.0 births per 1,000 women. Women in the age bracket of 20 to 34 years have the highest fertility rate with 115.0 births per 1,000 women. Women in the age bracket of 20 to 34 years acount for 66.4% of all women with births.
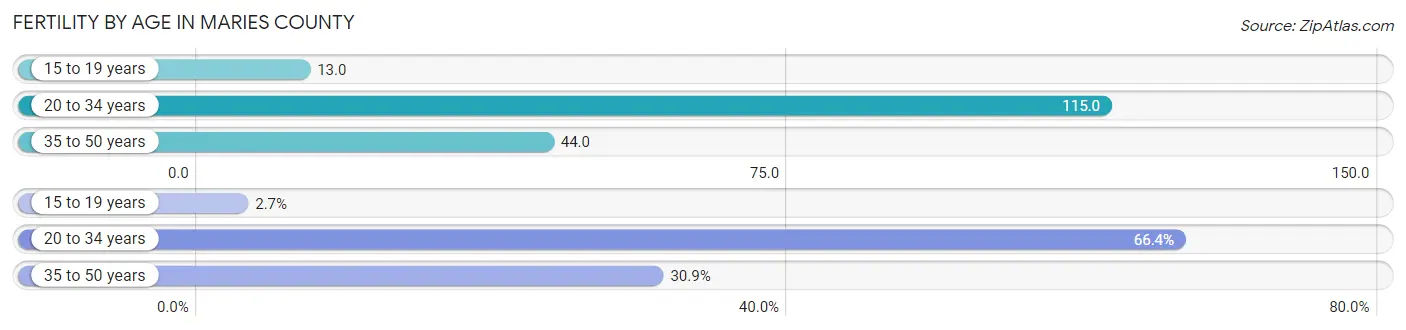
| Age Bracket | Women with Births | Births / 1,000 Women |
| 15 to 19 years | 3 (2.7%) | 13.0 |
| 20 to 34 years | 73 (66.4%) | 115.0 |
| 35 to 50 years | 34 (30.9%) | 44.0 |
| Total | 110 (100.0%) | 67.0 |
Fertility by Age by Marriage Status in Maries County
87.3% of women with births (110) in Maries County are married. The highest percentage of unmarried women with births falls into 35 to 50 years age bracket with 41.2% of them unmarried at the time of birth, while the lowest percentage of unmarried women with births belong to 15 to 19 years age bracket with 0.0% of them unmarried.
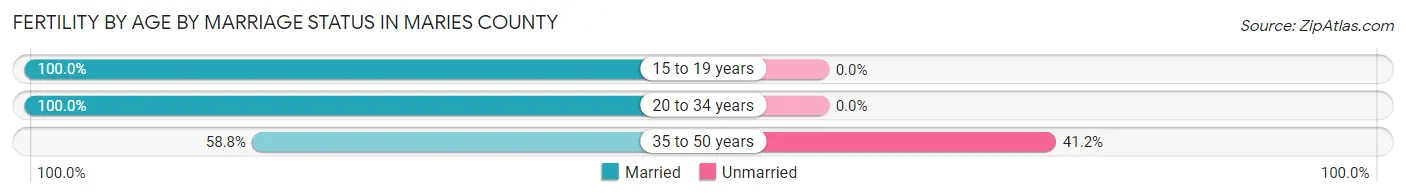
| Age Bracket | Married | Unmarried |
| 15 to 19 years | 3 (100.0%) | 0 (0.0%) |
| 20 to 34 years | 73 (100.0%) | 0 (0.0%) |
| 35 to 50 years | 20 (58.8%) | 14 (41.2%) |
| Total | 96 (87.3%) | 14 (12.7%) |
Fertility by Education in Maries County
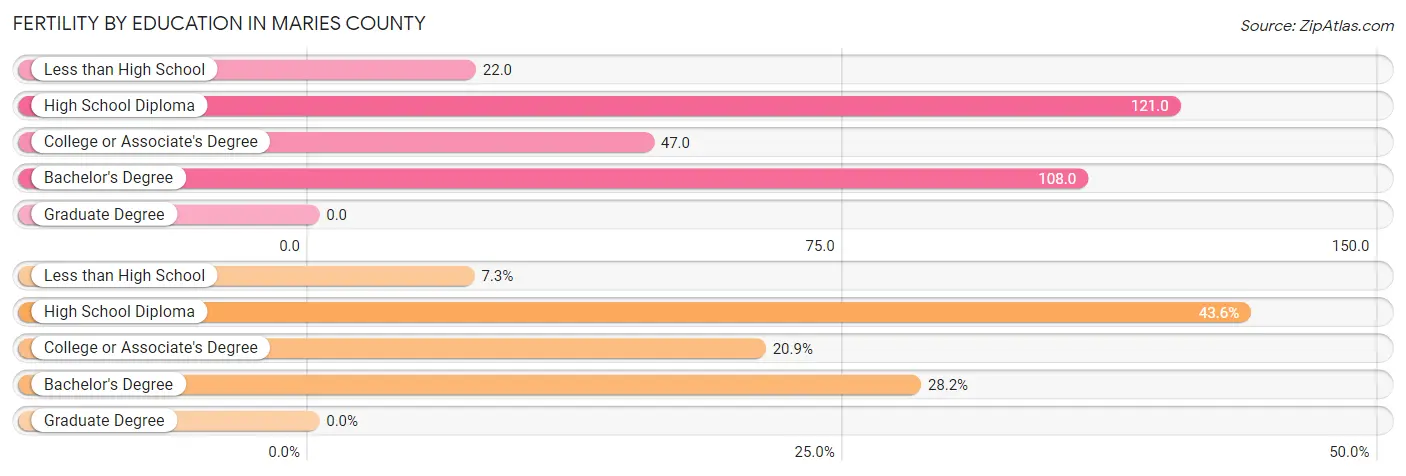
| Educational Attainment | Women with Births | Births / 1,000 Women |
| Less than High School | 8 (7.3%) | 22.0 |
| High School Diploma | 48 (43.6%) | 121.0 |
| College or Associate's Degree | 23 (20.9%) | 47.0 |
| Bachelor's Degree | 31 (28.2%) | 108.0 |
| Graduate Degree | 0 (0.0%) | 0.0 |
| Total | 110 (100.0%) | 67.0 |
Fertility by Education by Marriage Status in Maries County
12.7% of women with births in Maries County are unmarried. Women with the educational attainment of less than high school are most likely to be married with 100.0% of them married at childbirth, while women with the educational attainment of high school diploma are least likely to be married with 29.2% of them unmarried at childbirth.
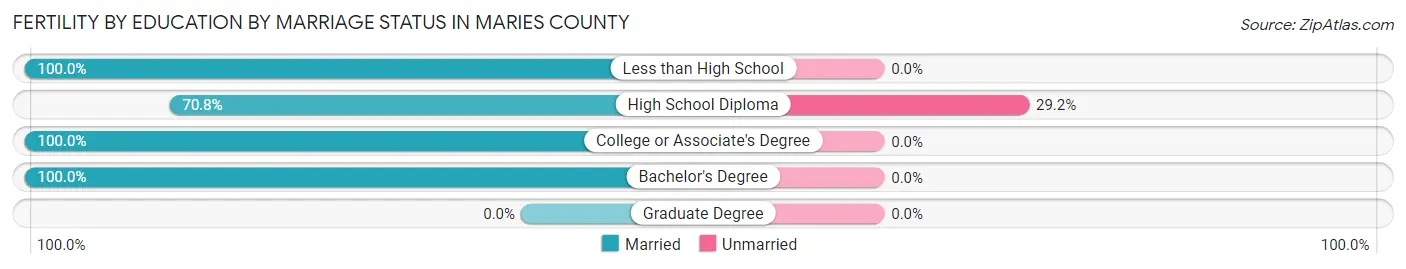
| Educational Attainment | Married | Unmarried |
| Less than High School | 8 (100.0%) | 0 (0.0%) |
| High School Diploma | 34 (70.8%) | 14 (29.2%) |
| College or Associate's Degree | 23 (100.0%) | 0 (0.0%) |
| Bachelor's Degree | 31 (100.0%) | 0 (0.0%) |
| Graduate Degree | 0 (0.0%) | 0 (0.0%) |
| Total | 96 (87.3%) | 14 (12.7%) |
Employment Characteristics in Maries County
Employment by Class of Employer in Maries County
Among the 3,441 employed individuals in Maries County, private company employees (2,117 | 61.5%), state government employees (326 | 9.5%), and local government employees (319 | 9.3%) make up the most common classes of employment.
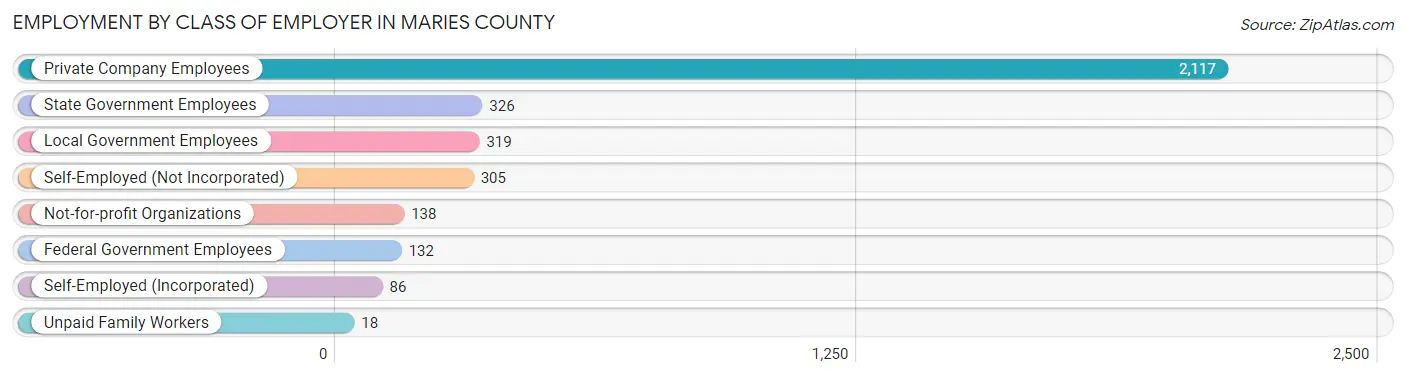
| Employer Class | # Employees | % Employees |
| Private Company Employees | 2,117 | 61.5% |
| Self-Employed (Incorporated) | 86 | 2.5% |
| Self-Employed (Not Incorporated) | 305 | 8.9% |
| Not-for-profit Organizations | 138 | 4.0% |
| Local Government Employees | 319 | 9.3% |
| State Government Employees | 326 | 9.5% |
| Federal Government Employees | 132 | 3.8% |
| Unpaid Family Workers | 18 | 0.5% |
| Total | 3,441 | 100.0% |
Employment Status by Age in Maries County
According to the labor force statistics for Maries County, out of the total population over 16 years of age (6,935), 54.7% or 3,793 individuals are in the labor force, with 5.6% or 212 of them unemployed. The age group with the highest labor force participation rate is 25 to 29 years, with 92.7% or 396 individuals in the labor force. Within the labor force, the 75 years and over age range has the highest percentage of unemployed individuals, with 18.6% or 13 of them being unemployed.
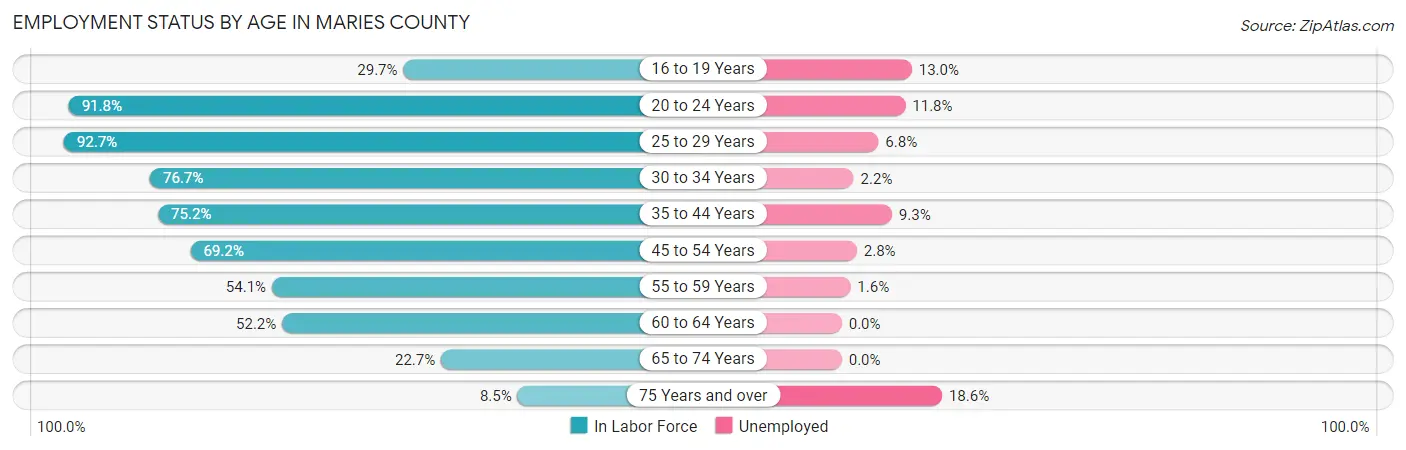
| Age Bracket | In Labor Force | Unemployed |
| 16 to 19 Years | 92 (29.7%) | 12 (13.0%) |
| 20 to 24 Years | 516 (91.8%) | 61 (11.8%) |
| 25 to 29 Years | 396 (92.7%) | 27 (6.8%) |
| 30 to 34 Years | 316 (76.7%) | 7 (2.2%) |
| 35 to 44 Years | 739 (75.2%) | 69 (9.3%) |
| 45 to 54 Years | 725 (69.2%) | 20 (2.8%) |
| 55 to 59 Years | 322 (54.1%) | 5 (1.6%) |
| 60 to 64 Years | 383 (52.2%) | 0 (0.0%) |
| 65 to 74 Years | 237 (22.7%) | 0 (0.0%) |
| 75 Years and over | 70 (8.5%) | 13 (18.6%) |
| Total | 3,793 (54.7%) | 212 (5.6%) |
Employment Status by Educational Attainment in Maries County
According to labor force statistics for Maries County, 68.6% of individuals (2,880) out of the total population between 25 and 64 years of age (4,198) are in the labor force, with 4.4% or 127 of them being unemployed. The group with the highest labor force participation rate are those with the educational attainment of bachelor's degree or higher, with 82.3% or 689 individuals in the labor force. Within the labor force, individuals with college / associate degree education have the highest percentage of unemployment, with 9.1% or 79 of them being unemployed.
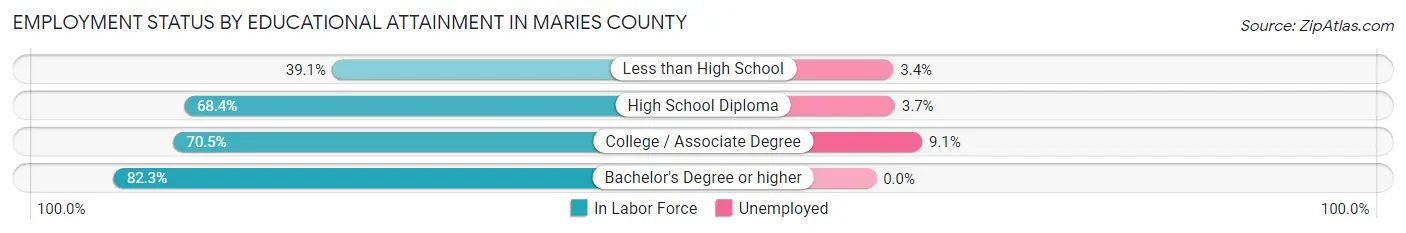
| Educational Attainment | In Labor Force | Unemployed |
| Less than High School | 176 (39.1%) | 15 (3.4%) |
| High School Diploma | 1,150 (68.4%) | 62 (3.7%) |
| College / Associate Degree | 867 (70.5%) | 112 (9.1%) |
| Bachelor's Degree or higher | 689 (82.3%) | 0 (0.0%) |
| Total | 2,880 (68.6%) | 185 (4.4%) |
Employment Occupations by Sex in Maries County
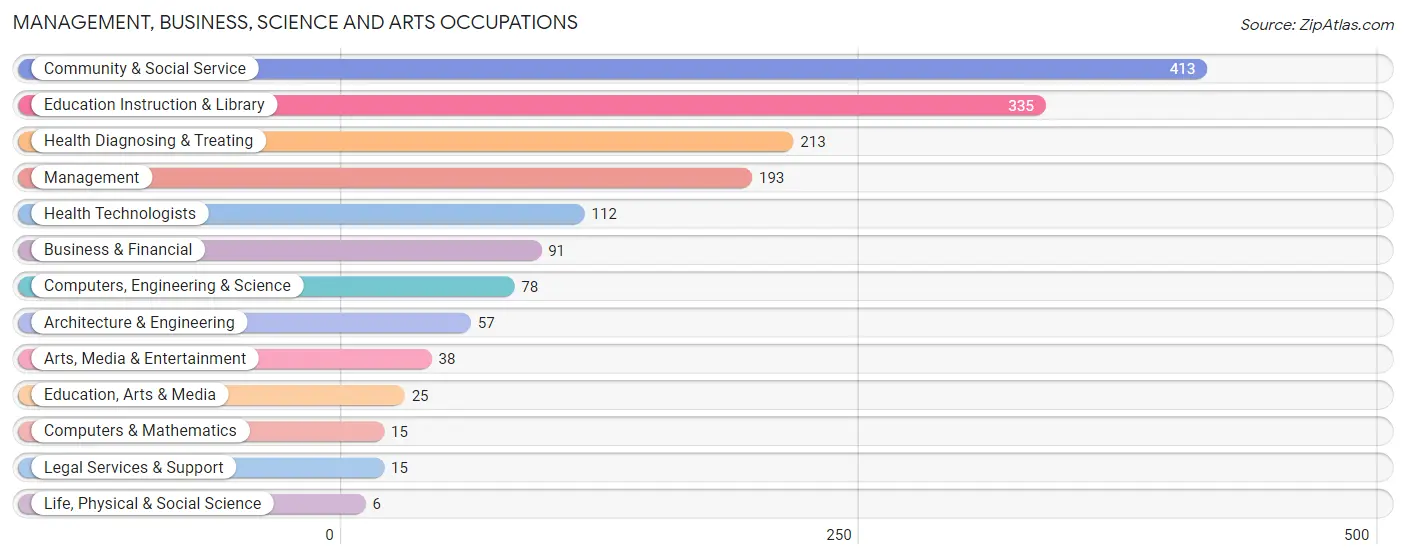
Management, Business, Science and Arts Occupations
The most common Management, Business, Science and Arts occupations in Maries County are Community & Social Service (413 | 11.5%), Education Instruction & Library (335 | 9.3%), Health Diagnosing & Treating (213 | 5.9%), Management (193 | 5.4%), and Health Technologists (112 | 3.1%).
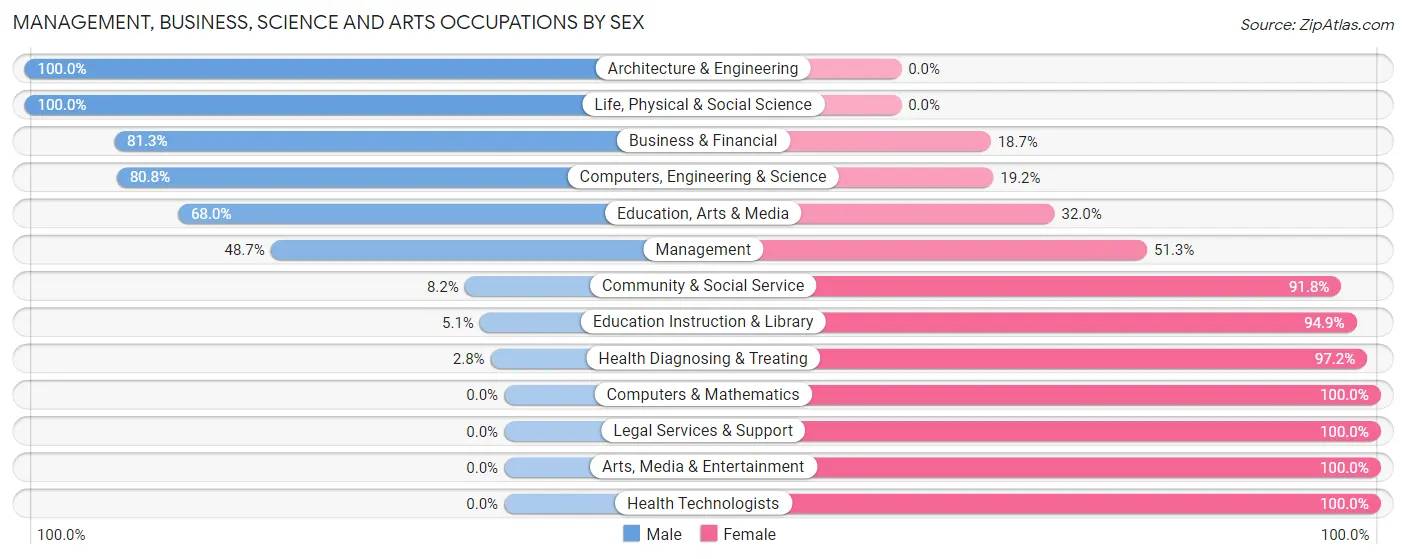
Management, Business, Science and Arts Occupations by Sex
Within the Management, Business, Science and Arts occupations in Maries County, the most male-oriented occupations are Architecture & Engineering (100.0%), Life, Physical & Social Science (100.0%), and Business & Financial (81.3%), while the most female-oriented occupations are Computers & Mathematics (100.0%), Legal Services & Support (100.0%), and Arts, Media & Entertainment (100.0%).
| Occupation | Male | Female |
| Management | 94 (48.7%) | 99 (51.3%) |
| Business & Financial | 74 (81.3%) | 17 (18.7%) |
| Computers, Engineering & Science | 63 (80.8%) | 15 (19.2%) |
| Computers & Mathematics | 0 (0.0%) | 15 (100.0%) |
| Architecture & Engineering | 57 (100.0%) | 0 (0.0%) |
| Life, Physical & Social Science | 6 (100.0%) | 0 (0.0%) |
| Community & Social Service | 34 (8.2%) | 379 (91.8%) |
| Education, Arts & Media | 17 (68.0%) | 8 (32.0%) |
| Legal Services & Support | 0 (0.0%) | 15 (100.0%) |
| Education Instruction & Library | 17 (5.1%) | 318 (94.9%) |
| Arts, Media & Entertainment | 0 (0.0%) | 38 (100.0%) |
| Health Diagnosing & Treating | 6 (2.8%) | 207 (97.2%) |
| Health Technologists | 0 (0.0%) | 112 (100.0%) |
| Total (Category) | 271 (27.4%) | 717 (72.6%) |
| Total (Overall) | 1,908 (53.3%) | 1,674 (46.7%) |
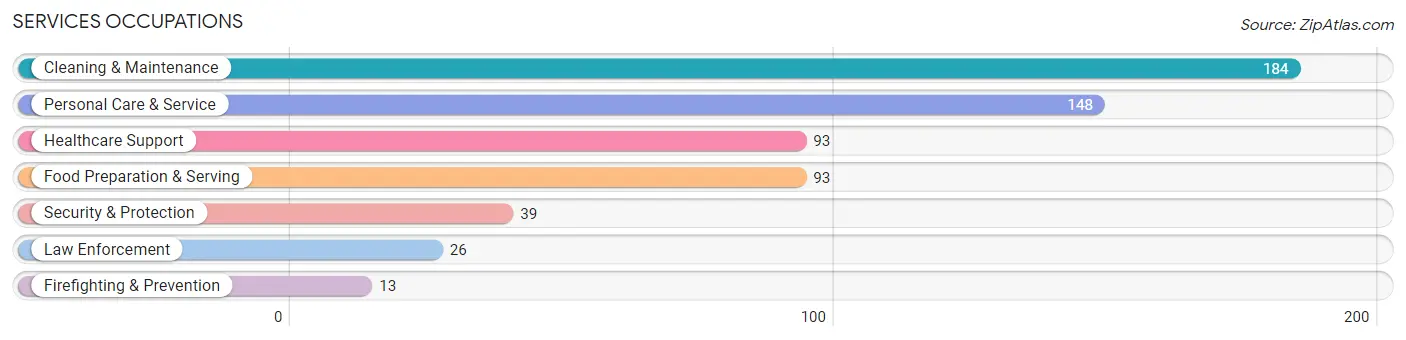
Services Occupations
The most common Services occupations in Maries County are Cleaning & Maintenance (184 | 5.1%), Personal Care & Service (148 | 4.1%), Healthcare Support (93 | 2.6%), Food Preparation & Serving (93 | 2.6%), and Security & Protection (39 | 1.1%).
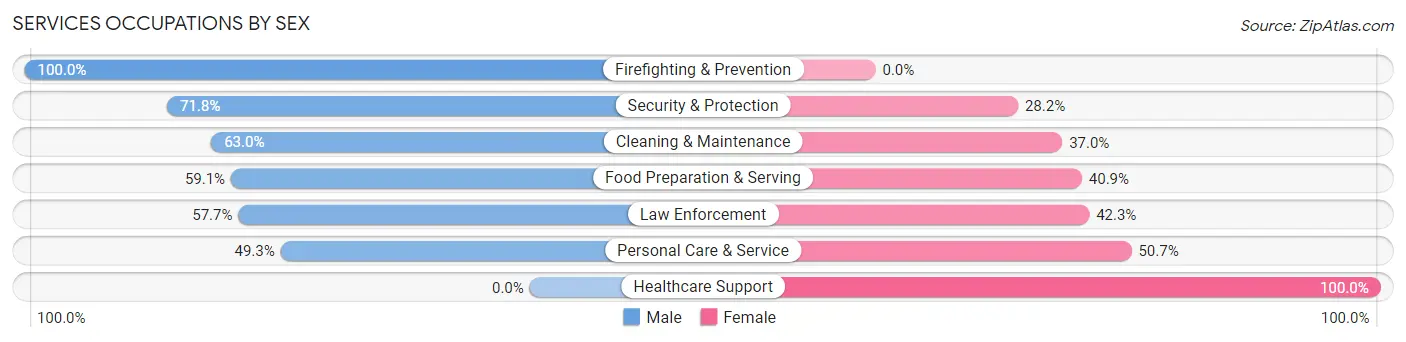
Services Occupations by Sex
Within the Services occupations in Maries County, the most male-oriented occupations are Firefighting & Prevention (100.0%), Security & Protection (71.8%), and Cleaning & Maintenance (63.0%), while the most female-oriented occupations are Healthcare Support (100.0%), Personal Care & Service (50.7%), and Law Enforcement (42.3%).
| Occupation | Male | Female |
| Healthcare Support | 0 (0.0%) | 93 (100.0%) |
| Security & Protection | 28 (71.8%) | 11 (28.2%) |
| Firefighting & Prevention | 13 (100.0%) | 0 (0.0%) |
| Law Enforcement | 15 (57.7%) | 11 (42.3%) |
| Food Preparation & Serving | 55 (59.1%) | 38 (40.9%) |
| Cleaning & Maintenance | 116 (63.0%) | 68 (37.0%) |
| Personal Care & Service | 73 (49.3%) | 75 (50.7%) |
| Total (Category) | 272 (48.8%) | 285 (51.2%) |
| Total (Overall) | 1,908 (53.3%) | 1,674 (46.7%) |
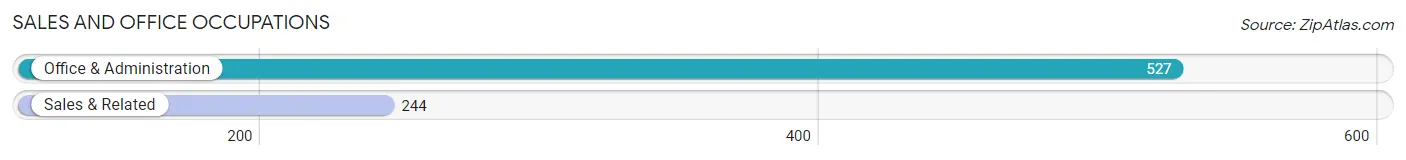
Sales and Office Occupations
The most common Sales and Office occupations in Maries County are Office & Administration (527 | 14.7%), and Sales & Related (244 | 6.8%).
Sales and Office Occupations by Sex
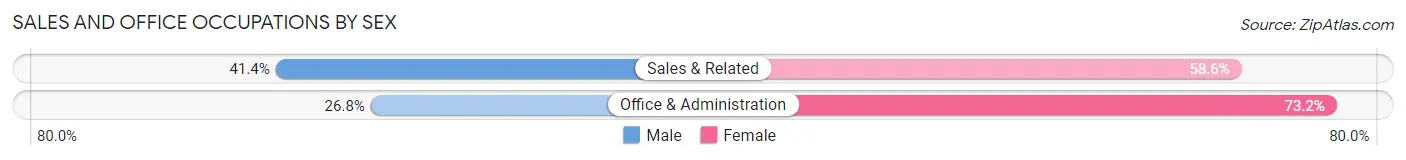
| Occupation | Male | Female |
| Sales & Related | 101 (41.4%) | 143 (58.6%) |
| Office & Administration | 141 (26.8%) | 386 (73.2%) |
| Total (Category) | 242 (31.4%) | 529 (68.6%) |
| Total (Overall) | 1,908 (53.3%) | 1,674 (46.7%) |
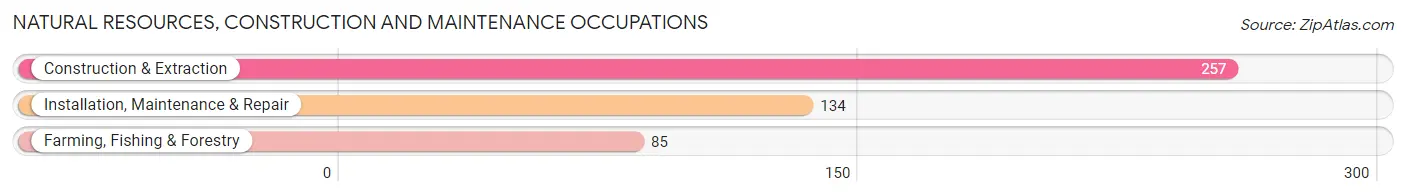
Natural Resources, Construction and Maintenance Occupations
The most common Natural Resources, Construction and Maintenance occupations in Maries County are Construction & Extraction (257 | 7.2%), Installation, Maintenance & Repair (134 | 3.7%), and Farming, Fishing & Forestry (85 | 2.4%).
Natural Resources, Construction and Maintenance Occupations by Sex
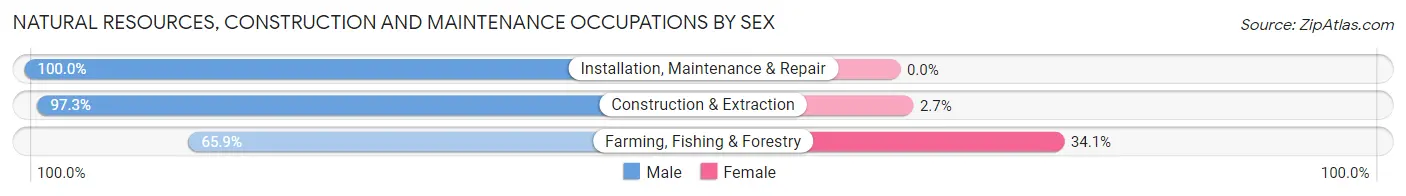
| Occupation | Male | Female |
| Farming, Fishing & Forestry | 56 (65.9%) | 29 (34.1%) |
| Construction & Extraction | 250 (97.3%) | 7 (2.7%) |
| Installation, Maintenance & Repair | 134 (100.0%) | 0 (0.0%) |
| Total (Category) | 440 (92.4%) | 36 (7.6%) |
| Total (Overall) | 1,908 (53.3%) | 1,674 (46.7%) |
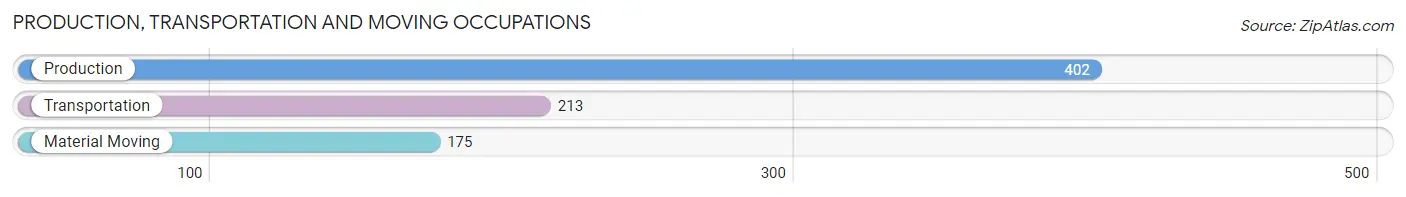
Production, Transportation and Moving Occupations
The most common Production, Transportation and Moving occupations in Maries County are Production (402 | 11.2%), Transportation (213 | 5.9%), and Material Moving (175 | 4.9%).
Production, Transportation and Moving Occupations by Sex
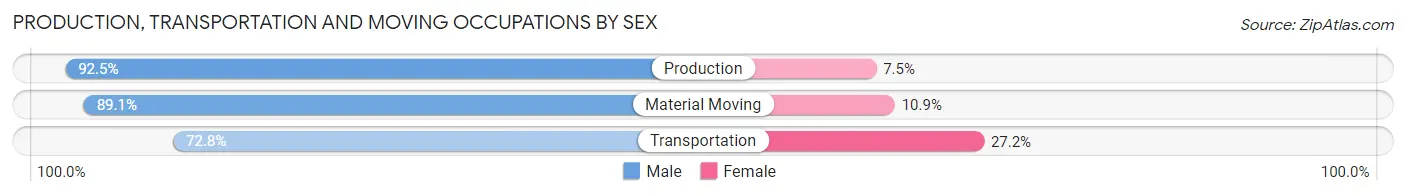
| Occupation | Male | Female |
| Production | 372 (92.5%) | 30 (7.5%) |
| Transportation | 155 (72.8%) | 58 (27.2%) |
| Material Moving | 156 (89.1%) | 19 (10.9%) |
| Total (Category) | 683 (86.5%) | 107 (13.5%) |
| Total (Overall) | 1,908 (53.3%) | 1,674 (46.7%) |
Employment Industries by Sex in Maries County
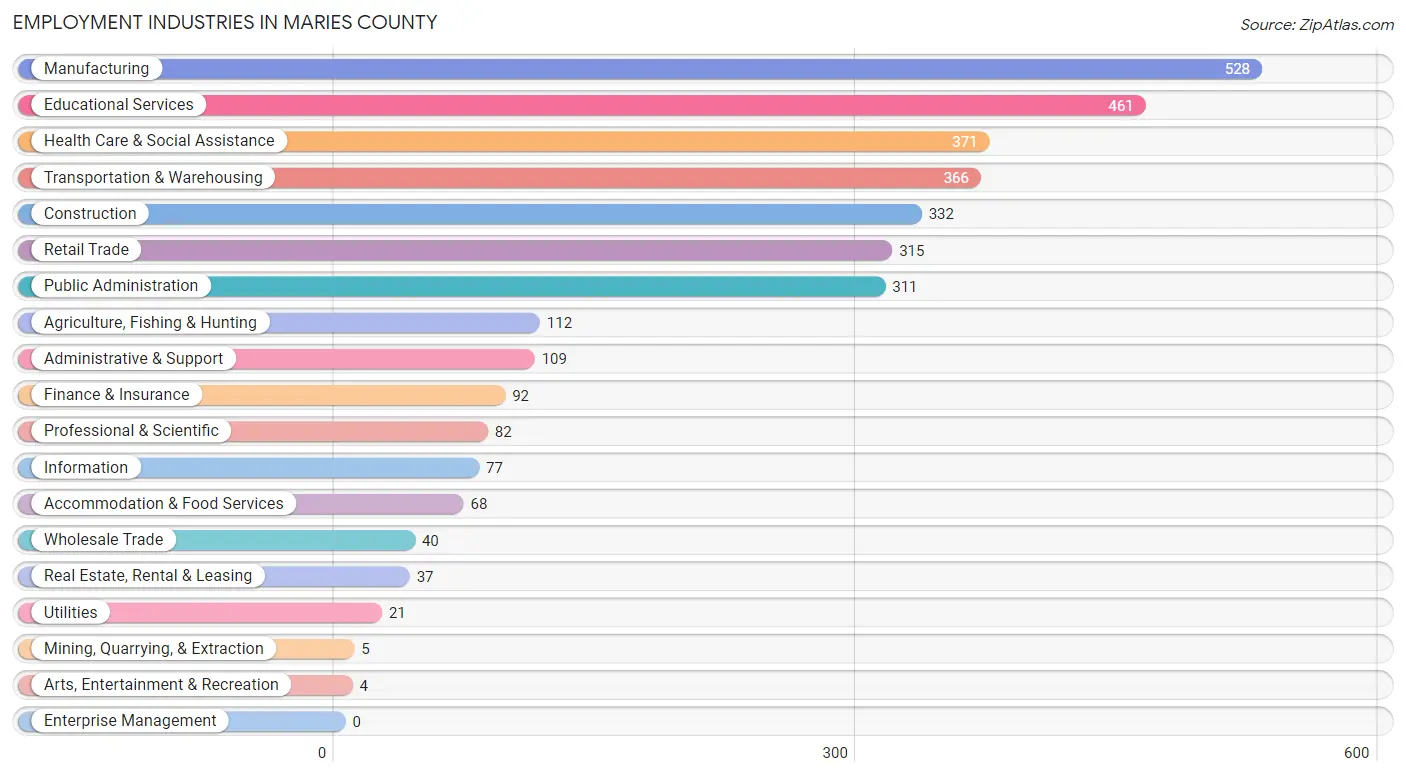
Employment Industries in Maries County
The major employment industries in Maries County include Manufacturing (528 | 14.7%), Educational Services (461 | 12.9%), Health Care & Social Assistance (371 | 10.4%), Transportation & Warehousing (366 | 10.2%), and Construction (332 | 9.3%).
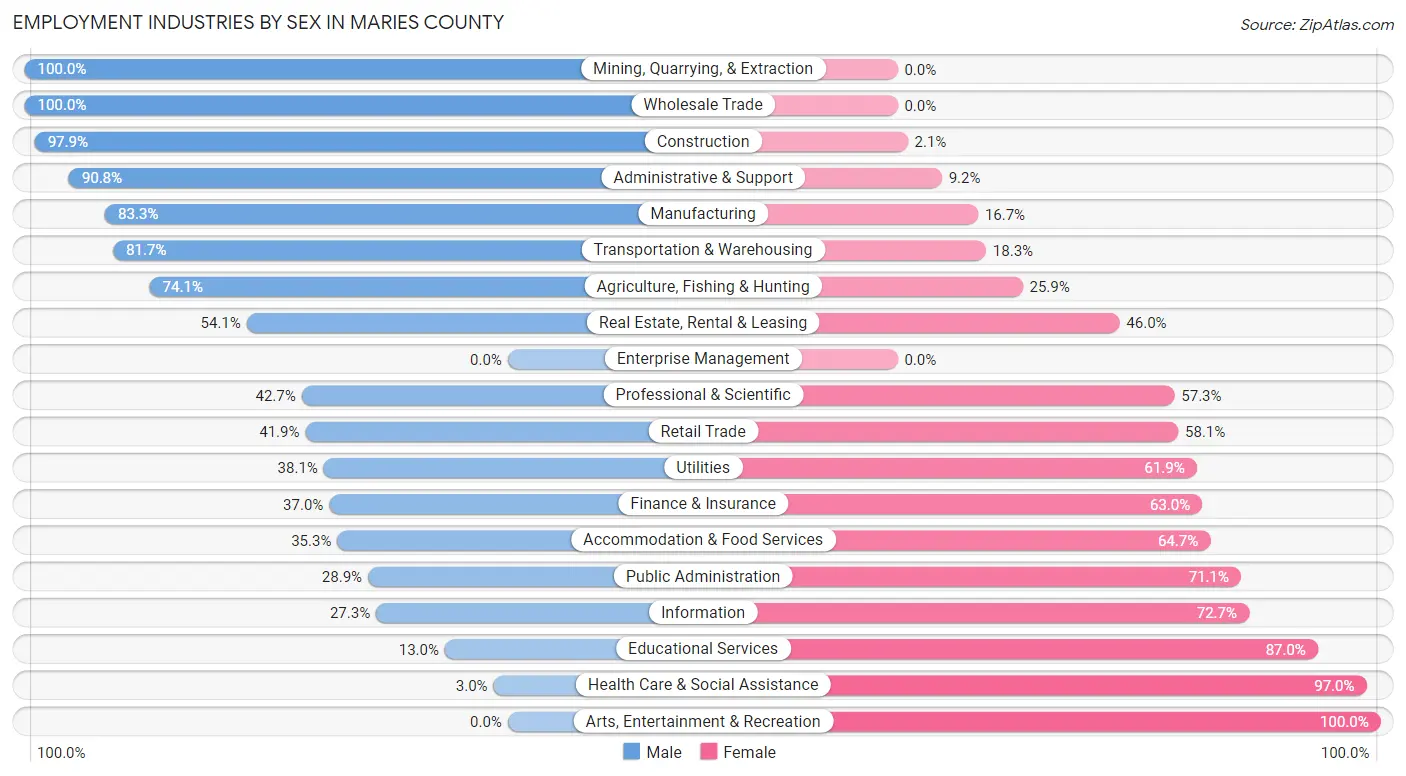
Employment Industries by Sex in Maries County
The Maries County industries that see more men than women are Mining, Quarrying, & Extraction (100.0%), Wholesale Trade (100.0%), and Construction (97.9%), whereas the industries that tend to have a higher number of women are Arts, Entertainment & Recreation (100.0%), Health Care & Social Assistance (97.0%), and Educational Services (87.0%).
| Industry | Male | Female |
| Agriculture, Fishing & Hunting | 83 (74.1%) | 29 (25.9%) |
| Mining, Quarrying, & Extraction | 5 (100.0%) | 0 (0.0%) |
| Construction | 325 (97.9%) | 7 (2.1%) |
| Manufacturing | 440 (83.3%) | 88 (16.7%) |
| Wholesale Trade | 40 (100.0%) | 0 (0.0%) |
| Retail Trade | 132 (41.9%) | 183 (58.1%) |
| Transportation & Warehousing | 299 (81.7%) | 67 (18.3%) |
| Utilities | 8 (38.1%) | 13 (61.9%) |
| Information | 21 (27.3%) | 56 (72.7%) |
| Finance & Insurance | 34 (37.0%) | 58 (63.0%) |
| Real Estate, Rental & Leasing | 20 (54.0%) | 17 (46.0%) |
| Professional & Scientific | 35 (42.7%) | 47 (57.3%) |
| Enterprise Management | 0 (0.0%) | 0 (0.0%) |
| Administrative & Support | 99 (90.8%) | 10 (9.2%) |
| Educational Services | 60 (13.0%) | 401 (87.0%) |
| Health Care & Social Assistance | 11 (3.0%) | 360 (97.0%) |
| Arts, Entertainment & Recreation | 0 (0.0%) | 4 (100.0%) |
| Accommodation & Food Services | 24 (35.3%) | 44 (64.7%) |
| Public Administration | 90 (28.9%) | 221 (71.1%) |
| Total | 1,908 (53.3%) | 1,674 (46.7%) |
Education in Maries County
School Enrollment in Maries County
The most common levels of schooling among the 1,746 students in Maries County are middle school (531 | 30.4%), high school (439 | 25.1%), and elementary school (306 | 17.5%).
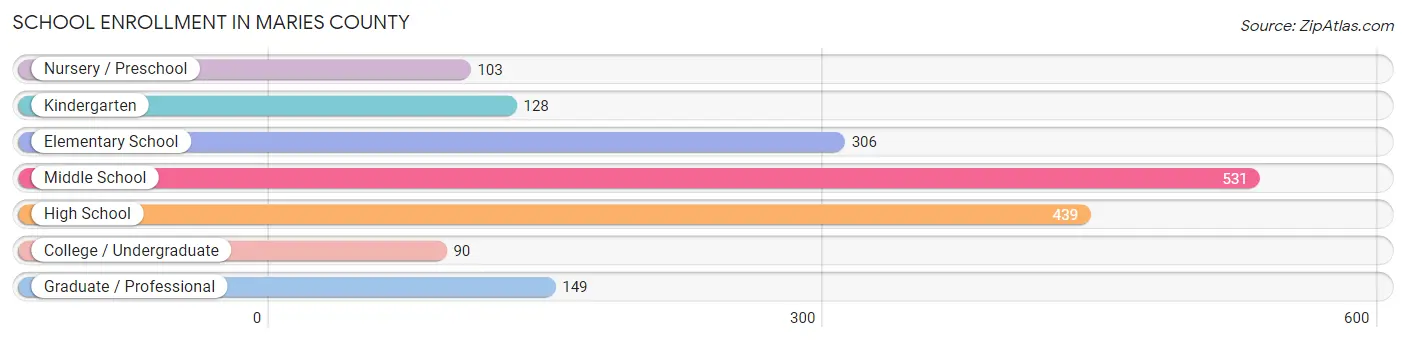
| School Level | # Students | % Students |
| Nursery / Preschool | 103 | 5.9% |
| Kindergarten | 128 | 7.3% |
| Elementary School | 306 | 17.5% |
| Middle School | 531 | 30.4% |
| High School | 439 | 25.1% |
| College / Undergraduate | 90 | 5.1% |
| Graduate / Professional | 149 | 8.5% |
| Total | 1,746 | 100.0% |
School Enrollment by Age by Funding Source in Maries County
Out of a total of 1,746 students who are enrolled in schools in Maries County, 208 (11.9%) attend a private institution, while the remaining 1,538 (88.1%) are enrolled in public schools. The age group of 15 to 17 year olds has the highest likelihood of being enrolled in private schools, with 105 (28.7% in the age bracket) enrolled. Conversely, the age group of 3 to 4 year olds has the lowest likelihood of being enrolled in a private school, with 100 (100.0% in the age bracket) attending a public institution.
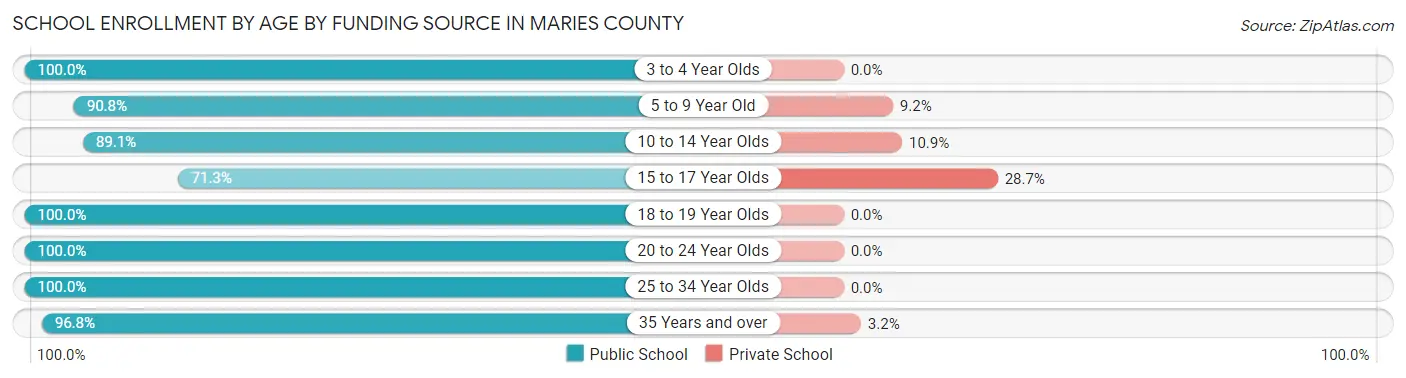
| Age Bracket | Public School | Private School |
| 3 to 4 Year Olds | 100 (100.0%) | 0 (0.0%) |
| 5 to 9 Year Old | 297 (90.8%) | 30 (9.2%) |
| 10 to 14 Year Olds | 541 (89.1%) | 66 (10.9%) |
| 15 to 17 Year Olds | 261 (71.3%) | 105 (28.7%) |
| 18 to 19 Year Olds | 56 (100.0%) | 0 (0.0%) |
| 20 to 24 Year Olds | 99 (100.0%) | 0 (0.0%) |
| 25 to 34 Year Olds | 4 (100.0%) | 0 (0.0%) |
| 35 Years and over | 181 (96.8%) | 6 (3.2%) |
| Total | 1,538 (88.1%) | 208 (11.9%) |
Educational Attainment by Field of Study in Maries County
Education (273 | 23.5%), business (256 | 22.0%), science & technology (171 | 14.7%), bio, nature & agricultural (116 | 10.0%), and engineering (90 | 7.7%) are the most common fields of study among 1,163 individuals in Maries County who have obtained a bachelor's degree or higher.
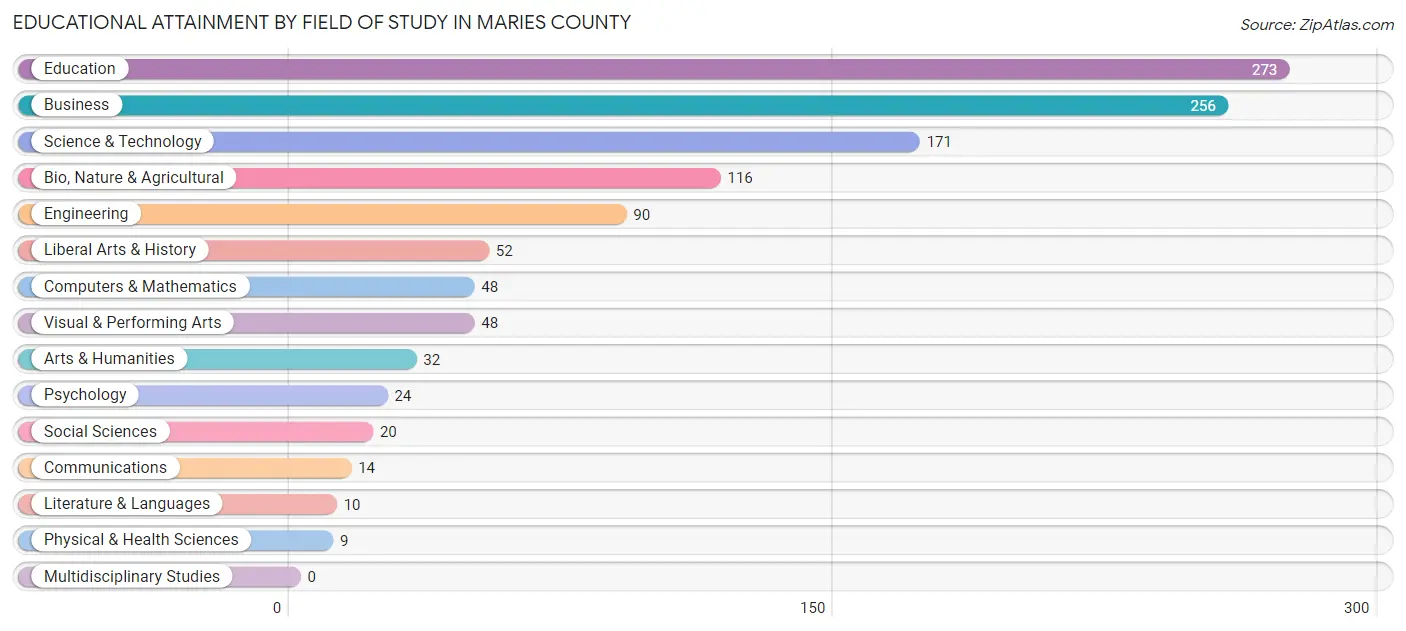
| Field of Study | # Graduates | % Graduates |
| Computers & Mathematics | 48 | 4.1% |
| Bio, Nature & Agricultural | 116 | 10.0% |
| Physical & Health Sciences | 9 | 0.8% |
| Psychology | 24 | 2.1% |
| Social Sciences | 20 | 1.7% |
| Engineering | 90 | 7.7% |
| Multidisciplinary Studies | 0 | 0.0% |
| Science & Technology | 171 | 14.7% |
| Business | 256 | 22.0% |
| Education | 273 | 23.5% |
| Literature & Languages | 10 | 0.9% |
| Liberal Arts & History | 52 | 4.5% |
| Visual & Performing Arts | 48 | 4.1% |
| Communications | 14 | 1.2% |
| Arts & Humanities | 32 | 2.8% |
| Total | 1,163 | 100.0% |
Transportation & Commute in Maries County
Vehicle Availability by Sex in Maries County
The most prevalent vehicle ownership categories in Maries County are males with 3 vehicles (710, accounting for 38.8%) and females with 3 vehicles (614, making up 44.2%).
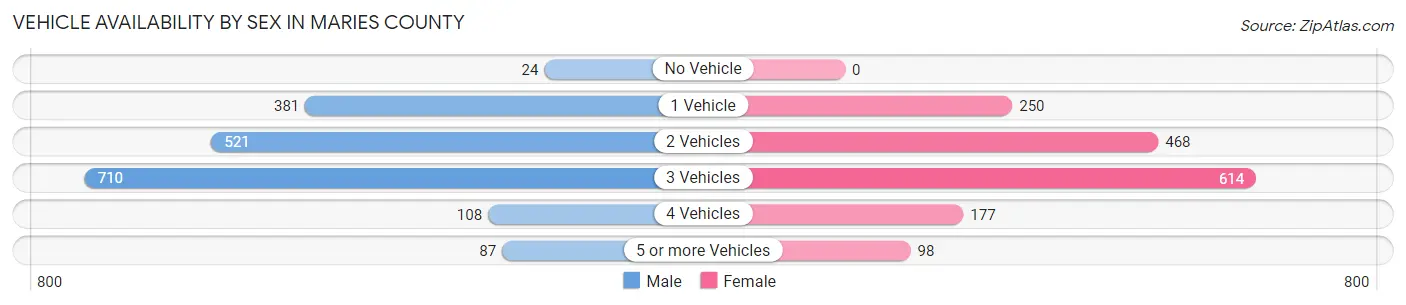
| Vehicles Available | Male | Female |
| No Vehicle | 24 (1.3%) | 0 (0.0%) |
| 1 Vehicle | 381 (20.8%) | 250 (15.6%) |
| 2 Vehicles | 521 (28.4%) | 468 (29.1%) |
| 3 Vehicles | 710 (38.8%) | 614 (38.2%) |
| 4 Vehicles | 108 (5.9%) | 177 (11.0%) |
| 5 or more Vehicles | 87 (4.8%) | 98 (6.1%) |
| Total | 1,831 (100.0%) | 1,607 (100.0%) |
Commute Time in Maries County
The most frequently occuring commute durations in Maries County are 45 to 59 minutes (558 commuters, 17.1%), 5 to 9 minutes (436 commuters, 13.4%), and 60 to 89 minutes (425 commuters, 13.0%).
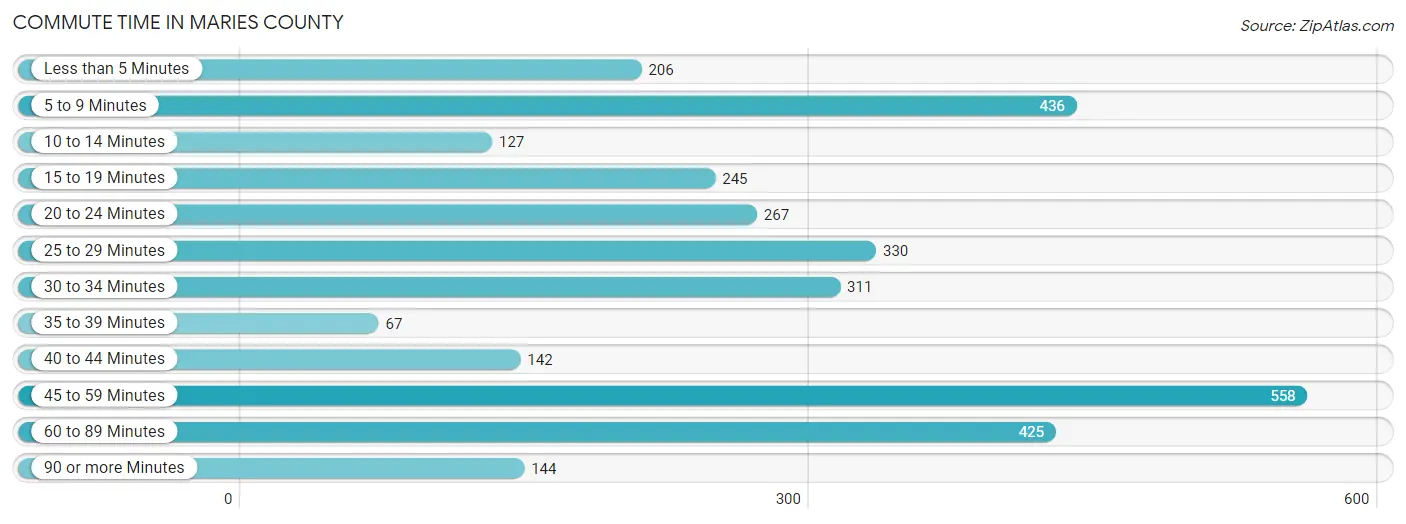
| Commute Time | # Commuters | % Commuters |
| Less than 5 Minutes | 206 | 6.3% |
| 5 to 9 Minutes | 436 | 13.4% |
| 10 to 14 Minutes | 127 | 3.9% |
| 15 to 19 Minutes | 245 | 7.5% |
| 20 to 24 Minutes | 267 | 8.2% |
| 25 to 29 Minutes | 330 | 10.1% |
| 30 to 34 Minutes | 311 | 9.6% |
| 35 to 39 Minutes | 67 | 2.1% |
| 40 to 44 Minutes | 142 | 4.4% |
| 45 to 59 Minutes | 558 | 17.1% |
| 60 to 89 Minutes | 425 | 13.0% |
| 90 or more Minutes | 144 | 4.4% |
Commute Time by Sex in Maries County
The most common commute times in Maries County are 45 to 59 minutes (273 commuters, 15.8%) for males and 45 to 59 minutes (285 commuters, 18.7%) for females.
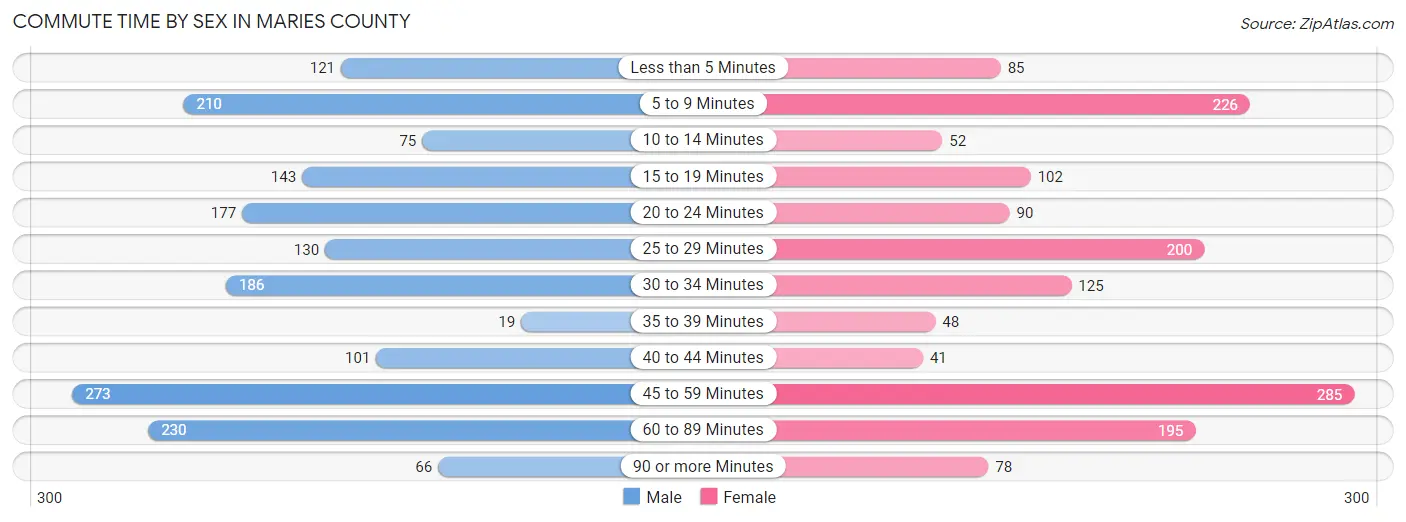
| Commute Time | Male | Female |
| Less than 5 Minutes | 121 (7.0%) | 85 (5.6%) |
| 5 to 9 Minutes | 210 (12.1%) | 226 (14.8%) |
| 10 to 14 Minutes | 75 (4.3%) | 52 (3.4%) |
| 15 to 19 Minutes | 143 (8.3%) | 102 (6.7%) |
| 20 to 24 Minutes | 177 (10.2%) | 90 (5.9%) |
| 25 to 29 Minutes | 130 (7.5%) | 200 (13.1%) |
| 30 to 34 Minutes | 186 (10.7%) | 125 (8.2%) |
| 35 to 39 Minutes | 19 (1.1%) | 48 (3.1%) |
| 40 to 44 Minutes | 101 (5.8%) | 41 (2.7%) |
| 45 to 59 Minutes | 273 (15.8%) | 285 (18.7%) |
| 60 to 89 Minutes | 230 (13.3%) | 195 (12.8%) |
| 90 or more Minutes | 66 (3.8%) | 78 (5.1%) |
Time of Departure to Work by Sex in Maries County
The most frequent times of departure to work in Maries County are 7:30 AM to 7:59 AM (303, 17.5%) for males and 7:00 AM to 7:29 AM (324, 21.2%) for females.
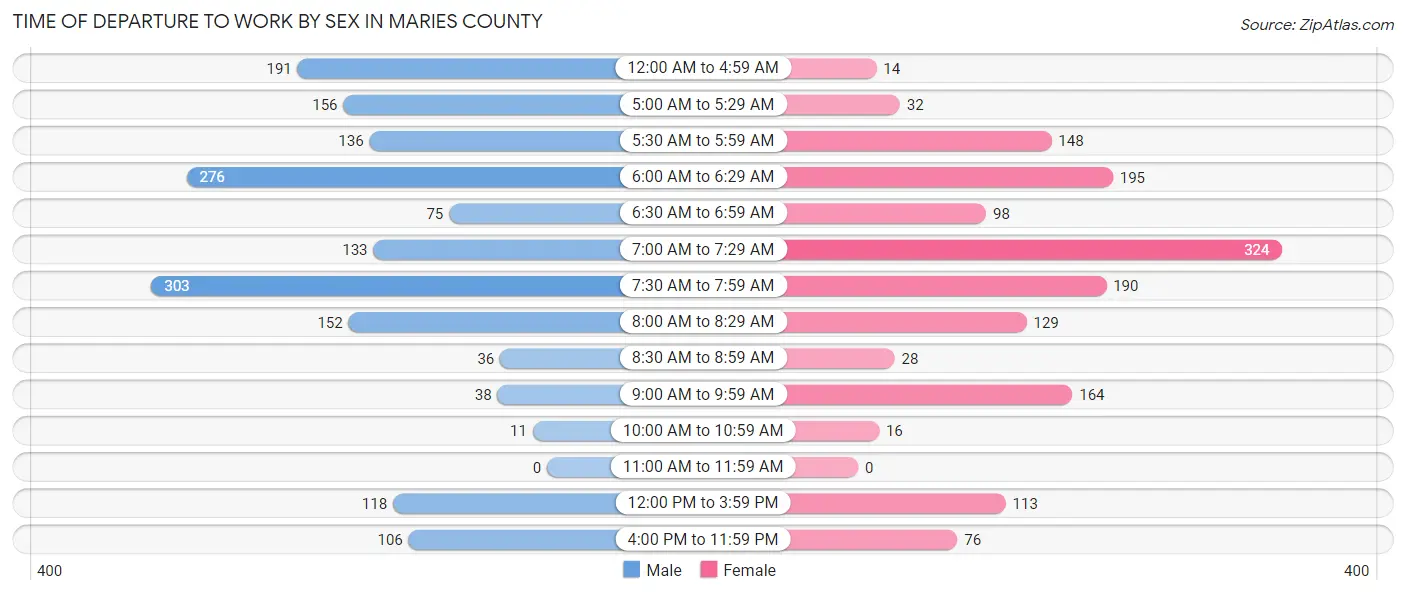
| Time of Departure | Male | Female |
| 12:00 AM to 4:59 AM | 191 (11.0%) | 14 (0.9%) |
| 5:00 AM to 5:29 AM | 156 (9.0%) | 32 (2.1%) |
| 5:30 AM to 5:59 AM | 136 (7.9%) | 148 (9.7%) |
| 6:00 AM to 6:29 AM | 276 (15.9%) | 195 (12.8%) |
| 6:30 AM to 6:59 AM | 75 (4.3%) | 98 (6.4%) |
| 7:00 AM to 7:29 AM | 133 (7.7%) | 324 (21.2%) |
| 7:30 AM to 7:59 AM | 303 (17.5%) | 190 (12.4%) |
| 8:00 AM to 8:29 AM | 152 (8.8%) | 129 (8.5%) |
| 8:30 AM to 8:59 AM | 36 (2.1%) | 28 (1.8%) |
| 9:00 AM to 9:59 AM | 38 (2.2%) | 164 (10.7%) |
| 10:00 AM to 10:59 AM | 11 (0.6%) | 16 (1.1%) |
| 11:00 AM to 11:59 AM | 0 (0.0%) | 0 (0.0%) |
| 12:00 PM to 3:59 PM | 118 (6.8%) | 113 (7.4%) |
| 4:00 PM to 11:59 PM | 106 (6.1%) | 76 (5.0%) |
| Total | 1,731 (100.0%) | 1,527 (100.0%) |
Housing Occupancy in Maries County
Occupancy by Ownership in Maries County
Of the total 3,602 dwellings in Maries County, owner-occupied units account for 2,689 (74.7%), while renter-occupied units make up 913 (25.4%).
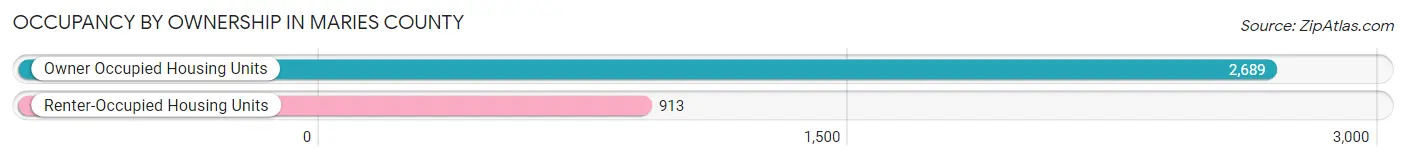
| Occupancy | # Housing Units | % Housing Units |
| Owner Occupied Housing Units | 2,689 | 74.7% |
| Renter-Occupied Housing Units | 913 | 25.4% |
| Total Occupied Housing Units | 3,602 | 100.0% |
Occupancy by Household Size in Maries County
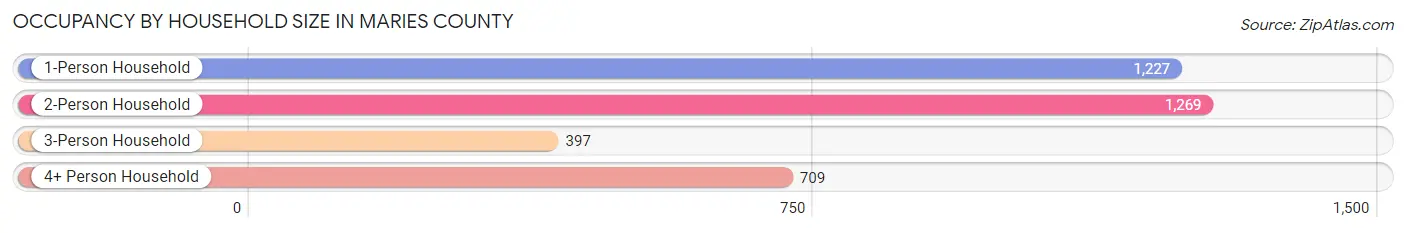
| Household Size | # Housing Units | % Housing Units |
| 1-Person Household | 1,227 | 34.1% |
| 2-Person Household | 1,269 | 35.2% |
| 3-Person Household | 397 | 11.0% |
| 4+ Person Household | 709 | 19.7% |
| Total Housing Units | 3,602 | 100.0% |
Occupancy by Ownership by Household Size in Maries County
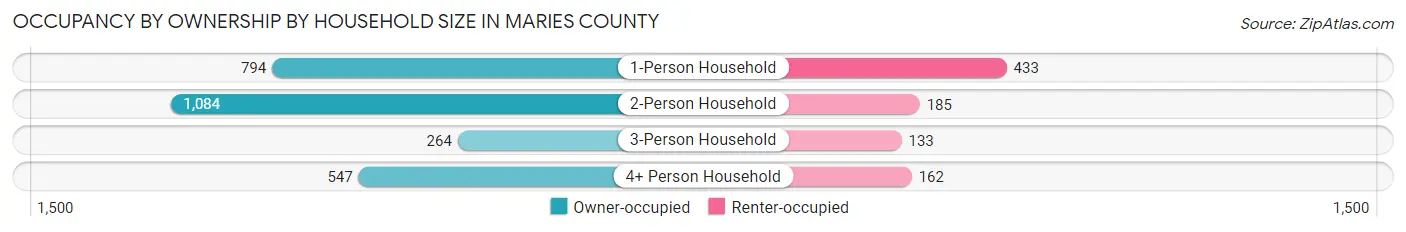
| Household Size | Owner-occupied | Renter-occupied |
| 1-Person Household | 794 (64.7%) | 433 (35.3%) |
| 2-Person Household | 1,084 (85.4%) | 185 (14.6%) |
| 3-Person Household | 264 (66.5%) | 133 (33.5%) |
| 4+ Person Household | 547 (77.1%) | 162 (22.9%) |
| Total Housing Units | 2,689 (74.7%) | 913 (25.4%) |
Occupancy by Educational Attainment in Maries County
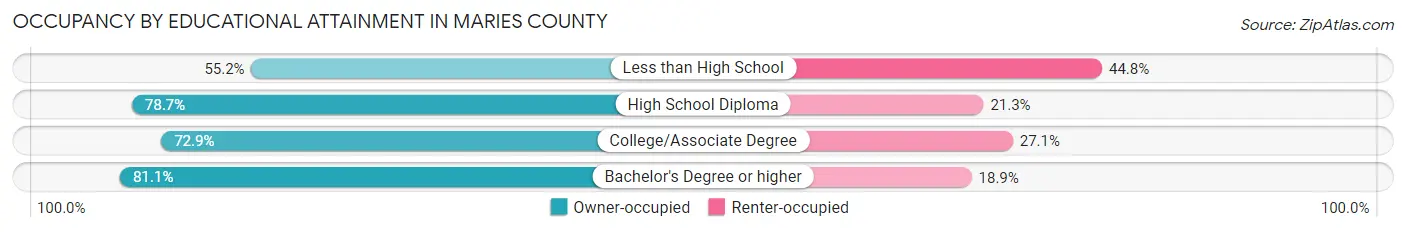
| Household Size | Owner-occupied | Renter-occupied |
| Less than High School | 254 (55.2%) | 206 (44.8%) |
| High School Diploma | 1,155 (78.7%) | 312 (21.3%) |
| College/Associate Degree | 697 (72.9%) | 259 (27.1%) |
| Bachelor's Degree or higher | 583 (81.1%) | 136 (18.9%) |
Occupancy by Age of Householder in Maries County
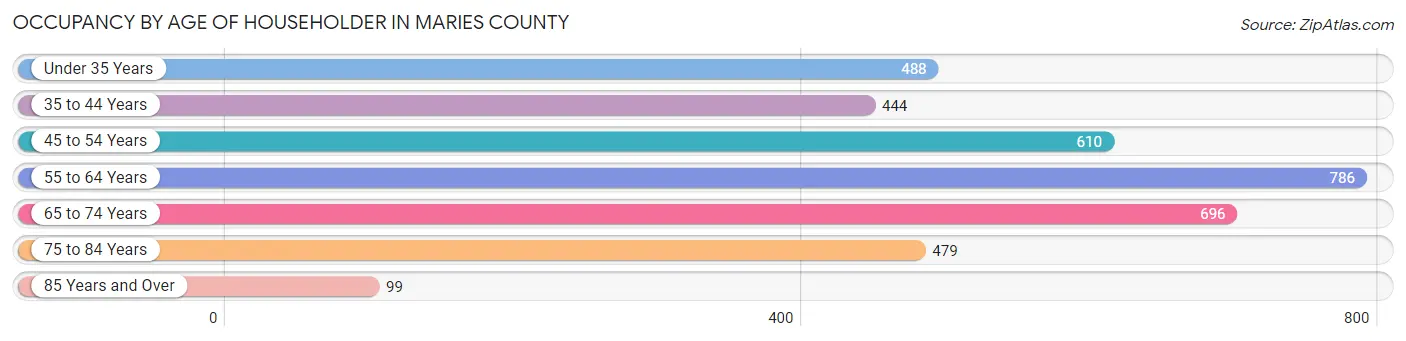
| Age Bracket | # Households | % Households |
| Under 35 Years | 488 | 13.6% |
| 35 to 44 Years | 444 | 12.3% |
| 45 to 54 Years | 610 | 16.9% |
| 55 to 64 Years | 786 | 21.8% |
| 65 to 74 Years | 696 | 19.3% |
| 75 to 84 Years | 479 | 13.3% |
| 85 Years and Over | 99 | 2.8% |
| Total | 3,602 | 100.0% |
Housing Finances in Maries County
Median Income by Occupancy in Maries County
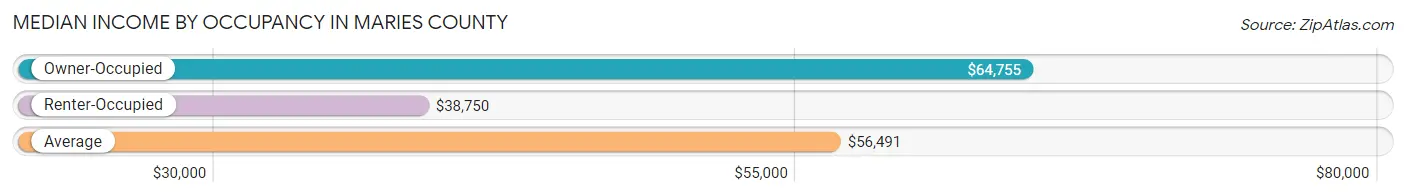
| Occupancy Type | # Households | Median Income |
| Owner-Occupied | 2,689 (74.7%) | $64,755 |
| Renter-Occupied | 913 (25.4%) | $38,750 |
| Average | 3,602 (100.0%) | $56,491 |
Occupancy by Householder Income Bracket in Maries County
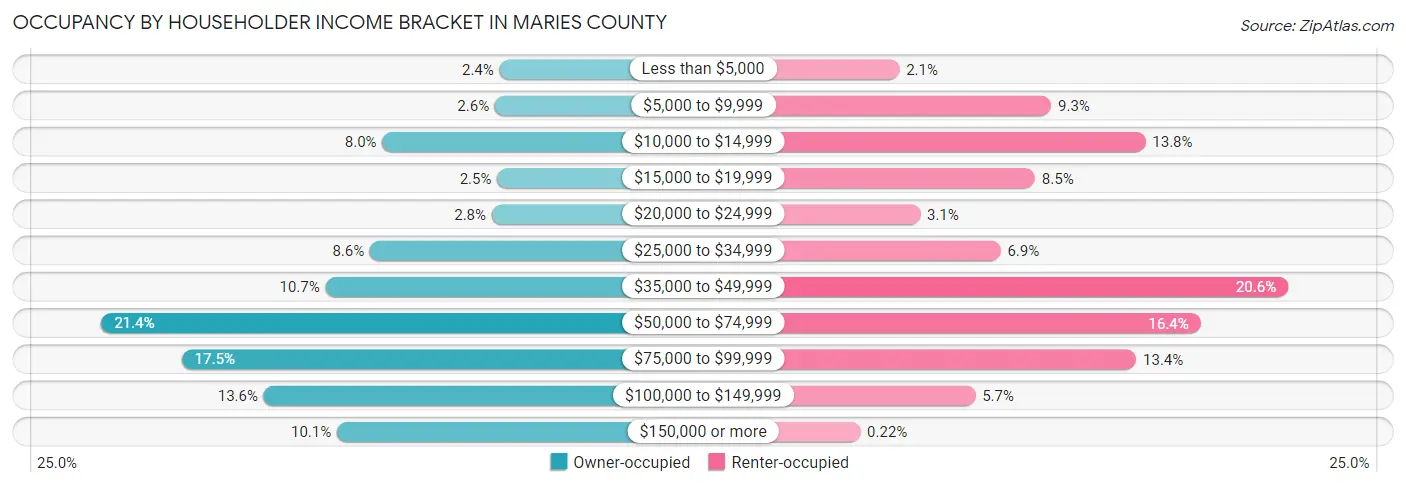
| Income Bracket | Owner-occupied | Renter-occupied |
| Less than $5,000 | 64 (2.4%) | 19 (2.1%) |
| $5,000 to $9,999 | 70 (2.6%) | 85 (9.3%) |
| $10,000 to $14,999 | 214 (8.0%) | 126 (13.8%) |
| $15,000 to $19,999 | 67 (2.5%) | 78 (8.5%) |
| $20,000 to $24,999 | 74 (2.8%) | 28 (3.1%) |
| $25,000 to $34,999 | 230 (8.6%) | 63 (6.9%) |
| $35,000 to $49,999 | 287 (10.7%) | 188 (20.6%) |
| $50,000 to $74,999 | 574 (21.3%) | 150 (16.4%) |
| $75,000 to $99,999 | 471 (17.5%) | 122 (13.4%) |
| $100,000 to $149,999 | 366 (13.6%) | 52 (5.7%) |
| $150,000 or more | 272 (10.1%) | 2 (0.2%) |
| Total | 2,689 (100.0%) | 913 (100.0%) |
Monthly Housing Cost Tiers in Maries County
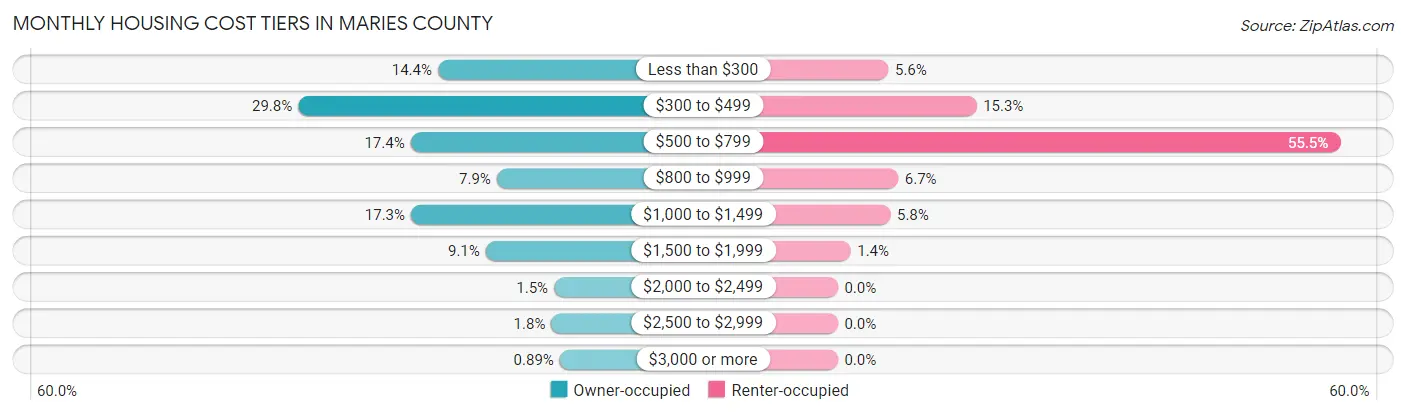
| Monthly Cost | Owner-occupied | Renter-occupied |
| Less than $300 | 386 (14.3%) | 51 (5.6%) |
| $300 to $499 | 801 (29.8%) | 140 (15.3%) |
| $500 to $799 | 467 (17.4%) | 507 (55.5%) |
| $800 to $999 | 211 (7.9%) | 61 (6.7%) |
| $1,000 to $1,499 | 466 (17.3%) | 53 (5.8%) |
| $1,500 to $1,999 | 244 (9.1%) | 13 (1.4%) |
| $2,000 to $2,499 | 41 (1.5%) | 0 (0.0%) |
| $2,500 to $2,999 | 49 (1.8%) | 0 (0.0%) |
| $3,000 or more | 24 (0.9%) | 0 (0.0%) |
| Total | 2,689 (100.0%) | 913 (100.0%) |
Physical Housing Characteristics in Maries County
Housing Structures in Maries County
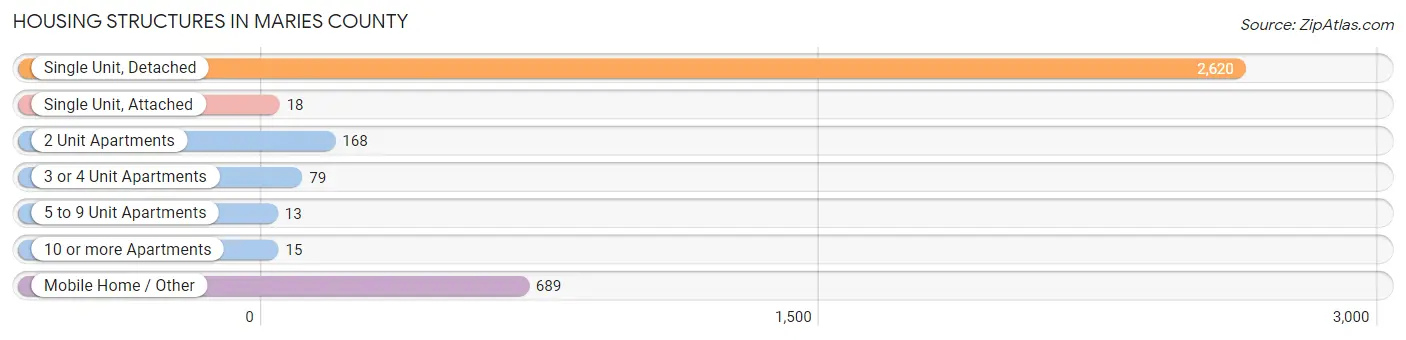
| Structure Type | # Housing Units | % Housing Units |
| Single Unit, Detached | 2,620 | 72.7% |
| Single Unit, Attached | 18 | 0.5% |
| 2 Unit Apartments | 168 | 4.7% |
| 3 or 4 Unit Apartments | 79 | 2.2% |
| 5 to 9 Unit Apartments | 13 | 0.4% |
| 10 or more Apartments | 15 | 0.4% |
| Mobile Home / Other | 689 | 19.1% |
| Total | 3,602 | 100.0% |
Housing Structures by Occupancy in Maries County
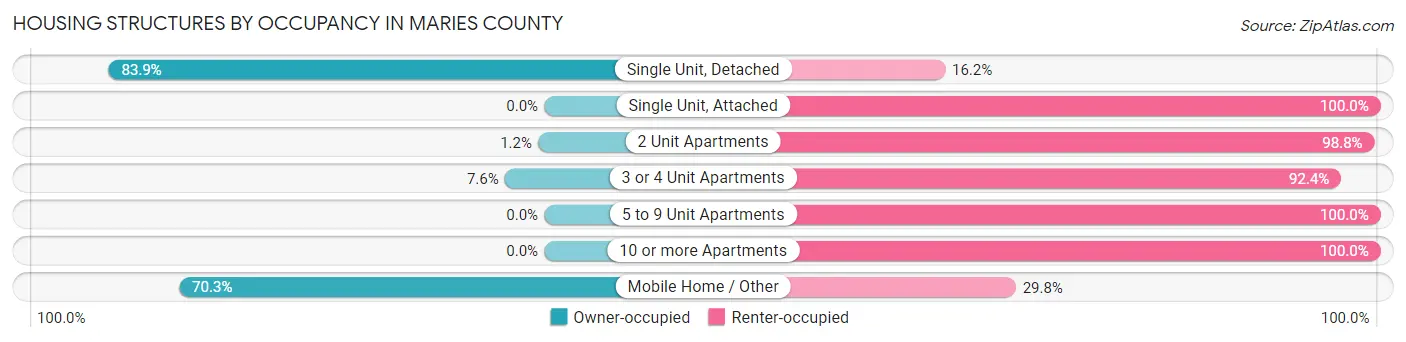
| Structure Type | Owner-occupied | Renter-occupied |
| Single Unit, Detached | 2,197 (83.9%) | 423 (16.2%) |
| Single Unit, Attached | 0 (0.0%) | 18 (100.0%) |
| 2 Unit Apartments | 2 (1.2%) | 166 (98.8%) |
| 3 or 4 Unit Apartments | 6 (7.6%) | 73 (92.4%) |
| 5 to 9 Unit Apartments | 0 (0.0%) | 13 (100.0%) |
| 10 or more Apartments | 0 (0.0%) | 15 (100.0%) |
| Mobile Home / Other | 484 (70.3%) | 205 (29.7%) |
| Total | 2,689 (74.7%) | 913 (25.4%) |
Housing Structures by Number of Rooms in Maries County
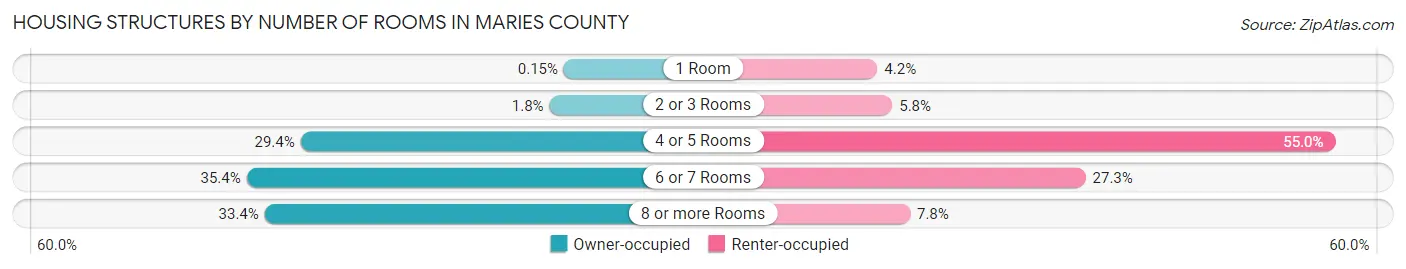
| Number of Rooms | Owner-occupied | Renter-occupied |
| 1 Room | 4 (0.2%) | 38 (4.2%) |
| 2 or 3 Rooms | 47 (1.8%) | 53 (5.8%) |
| 4 or 5 Rooms | 790 (29.4%) | 502 (55.0%) |
| 6 or 7 Rooms | 951 (35.4%) | 249 (27.3%) |
| 8 or more Rooms | 897 (33.4%) | 71 (7.8%) |
| Total | 2,689 (100.0%) | 913 (100.0%) |
Housing Structure by Heating Type in Maries County
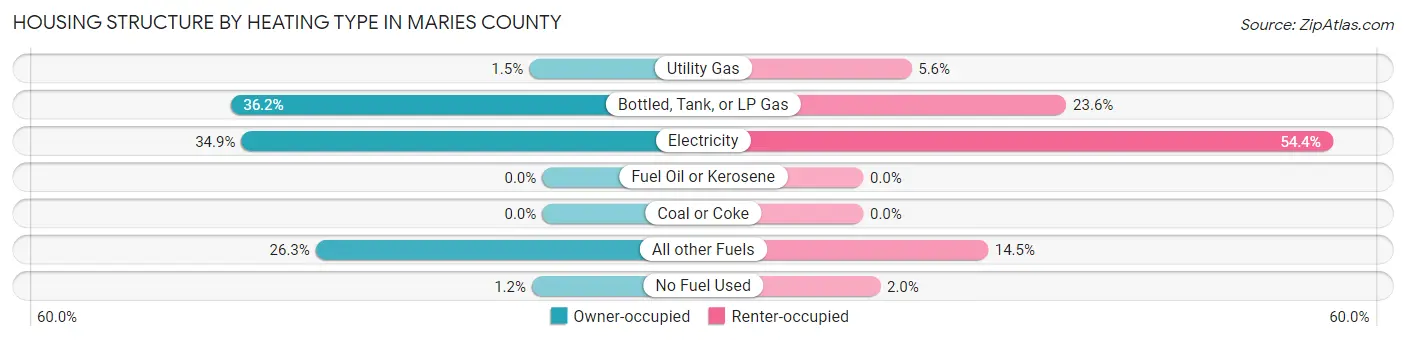
| Heating Type | Owner-occupied | Renter-occupied |
| Utility Gas | 41 (1.5%) | 51 (5.6%) |
| Bottled, Tank, or LP Gas | 972 (36.1%) | 215 (23.5%) |
| Electricity | 938 (34.9%) | 497 (54.4%) |
| Fuel Oil or Kerosene | 0 (0.0%) | 0 (0.0%) |
| Coal or Coke | 0 (0.0%) | 0 (0.0%) |
| All other Fuels | 706 (26.3%) | 132 (14.5%) |
| No Fuel Used | 32 (1.2%) | 18 (2.0%) |
| Total | 2,689 (100.0%) | 913 (100.0%) |
Household Vehicle Usage in Maries County
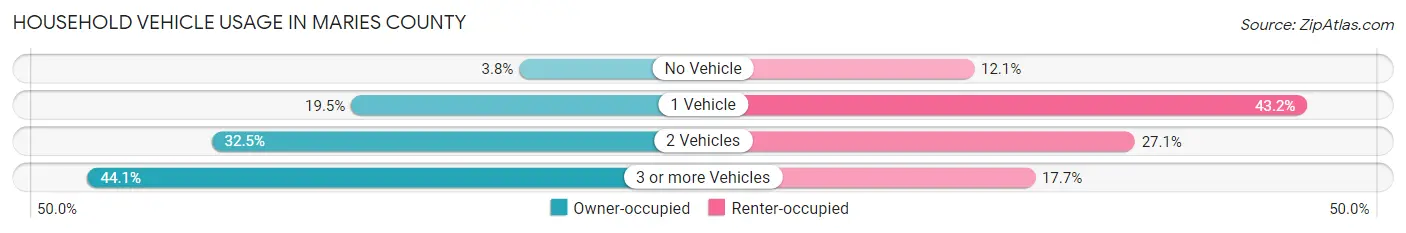
| Vehicles per Household | Owner-occupied | Renter-occupied |
| No Vehicle | 103 (3.8%) | 110 (12.0%) |
| 1 Vehicle | 525 (19.5%) | 394 (43.1%) |
| 2 Vehicles | 875 (32.5%) | 247 (27.1%) |
| 3 or more Vehicles | 1,186 (44.1%) | 162 (17.7%) |
| Total | 2,689 (100.0%) | 913 (100.0%) |
Real Estate & Mortgages in Maries County
Real Estate and Mortgage Overview in Maries County
| Characteristic | Without Mortgage | With Mortgage |
| Housing Units | 1,561 | 1,128 |
| Median Property Value | $171,000 | $216,500 |
| Median Household Income | $54,046 | $174 |
| Monthly Housing Costs | $394 | $24 |
| Real Estate Taxes | $1,089 | $20 |
Property Value by Mortgage Status in Maries County
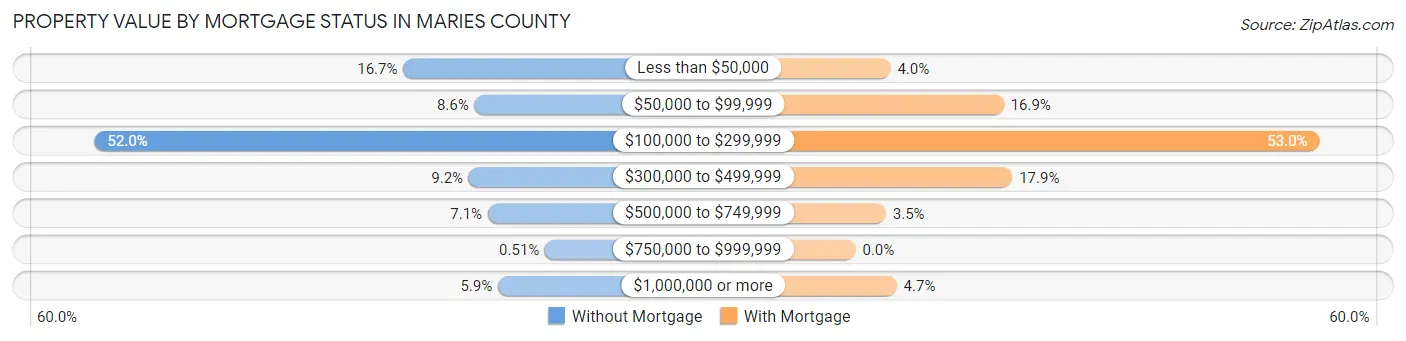
| Property Value | Without Mortgage | With Mortgage |
| Less than $50,000 | 261 (16.7%) | 45 (4.0%) |
| $50,000 to $99,999 | 134 (8.6%) | 191 (16.9%) |
| $100,000 to $299,999 | 812 (52.0%) | 598 (53.0%) |
| $300,000 to $499,999 | 144 (9.2%) | 202 (17.9%) |
| $500,000 to $749,999 | 110 (7.0%) | 39 (3.5%) |
| $750,000 to $999,999 | 8 (0.5%) | 0 (0.0%) |
| $1,000,000 or more | 92 (5.9%) | 53 (4.7%) |
| Total | 1,561 (100.0%) | 1,128 (100.0%) |
Household Income by Mortgage Status in Maries County
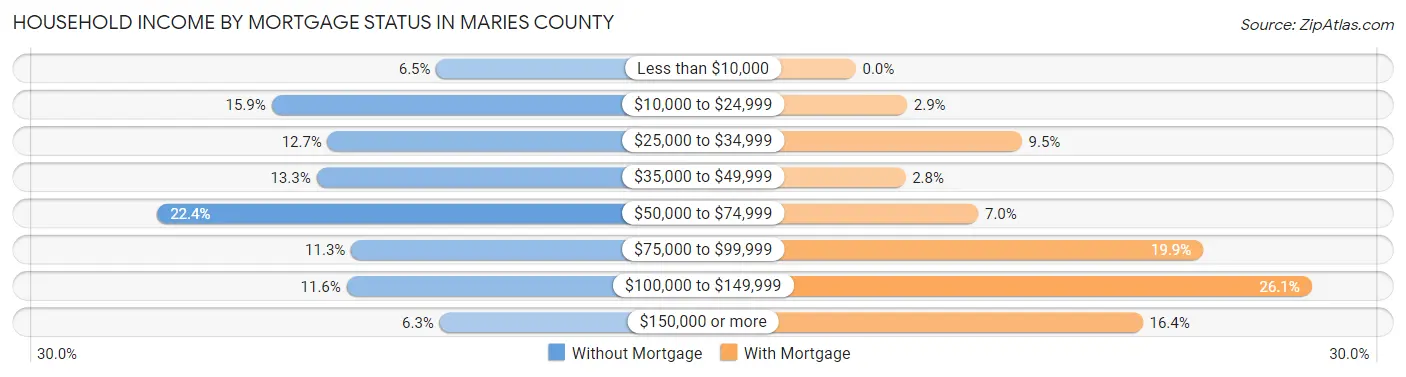
| Household Income | Without Mortgage | With Mortgage |
| Less than $10,000 | 101 (6.5%) | 0 (0.0%) |
| $10,000 to $24,999 | 248 (15.9%) | 33 (2.9%) |
| $25,000 to $34,999 | 198 (12.7%) | 107 (9.5%) |
| $35,000 to $49,999 | 208 (13.3%) | 32 (2.8%) |
| $50,000 to $74,999 | 350 (22.4%) | 79 (7.0%) |
| $75,000 to $99,999 | 177 (11.3%) | 224 (19.9%) |
| $100,000 to $149,999 | 181 (11.6%) | 294 (26.1%) |
| $150,000 or more | 98 (6.3%) | 185 (16.4%) |
| Total | 1,561 (100.0%) | 1,128 (100.0%) |
Property Value to Household Income Ratio in Maries County
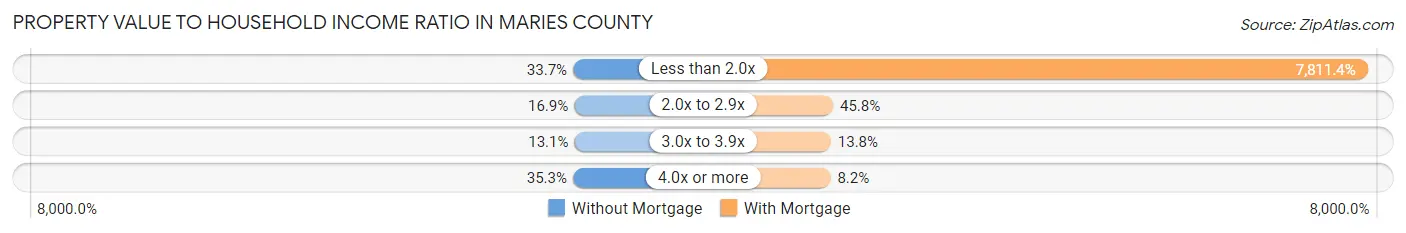
| Value-to-Income Ratio | Without Mortgage | With Mortgage |
| Less than 2.0x | 526 (33.7%) | 88,112 (7,811.4%) |
| 2.0x to 2.9x | 263 (16.9%) | 517 (45.8%) |
| 3.0x to 3.9x | 205 (13.1%) | 156 (13.8%) |
| 4.0x or more | 551 (35.3%) | 93 (8.2%) |
| Total | 1,561 (100.0%) | 1,128 (100.0%) |
Real Estate Taxes by Mortgage Status in Maries County
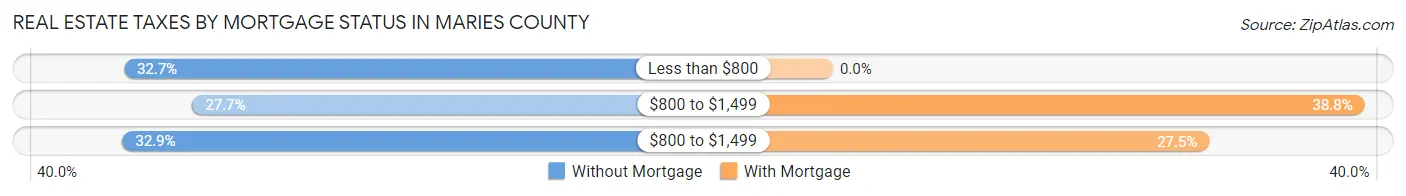
| Property Taxes | Without Mortgage | With Mortgage |
| Less than $800 | 511 (32.7%) | 0 (0.0%) |
| $800 to $1,499 | 433 (27.7%) | 438 (38.8%) |
| $800 to $1,499 | 513 (32.9%) | 310 (27.5%) |
| Total | 1,561 (100.0%) | 1,128 (100.0%) |
Health & Disability in Maries County
Health Insurance Coverage by Age in Maries County
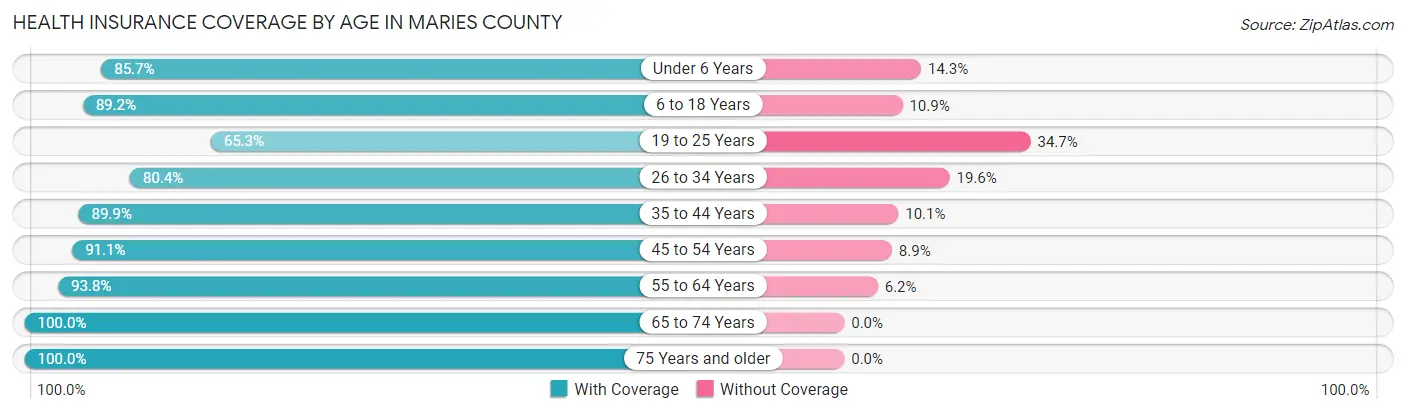
| Age Bracket | With Coverage | Without Coverage |
| Under 6 Years | 437 (85.7%) | 73 (14.3%) |
| 6 to 18 Years | 1,150 (89.1%) | 140 (10.8%) |
| 19 to 25 Years | 468 (65.3%) | 249 (34.7%) |
| 26 to 34 Years | 573 (80.4%) | 140 (19.6%) |
| 35 to 44 Years | 884 (89.9%) | 99 (10.1%) |
| 45 to 54 Years | 954 (91.1%) | 93 (8.9%) |
| 55 to 64 Years | 1,233 (93.8%) | 82 (6.2%) |
| 65 to 74 Years | 1,022 (100.0%) | 0 (0.0%) |
| 75 Years and older | 791 (100.0%) | 0 (0.0%) |
| Total | 7,512 (89.6%) | 876 (10.4%) |
Health Insurance Coverage by Citizenship Status in Maries County
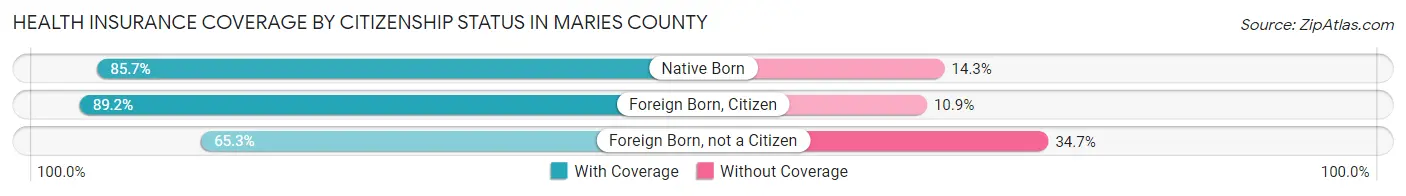
| Citizenship Status | With Coverage | Without Coverage |
| Native Born | 437 (85.7%) | 73 (14.3%) |
| Foreign Born, Citizen | 1,150 (89.1%) | 140 (10.8%) |
| Foreign Born, not a Citizen | 468 (65.3%) | 249 (34.7%) |
Health Insurance Coverage by Household Income in Maries County
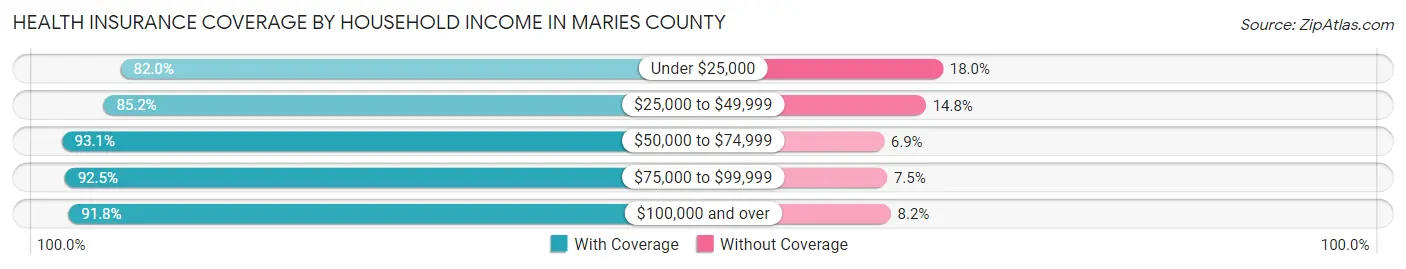
| Household Income | With Coverage | Without Coverage |
| Under $25,000 | 1,035 (82.0%) | 227 (18.0%) |
| $25,000 to $49,999 | 1,274 (85.2%) | 221 (14.8%) |
| $50,000 to $74,999 | 1,543 (93.1%) | 115 (6.9%) |
| $75,000 to $99,999 | 1,649 (92.5%) | 134 (7.5%) |
| $100,000 and over | 1,989 (91.8%) | 178 (8.2%) |
Public vs Private Health Insurance Coverage by Age in Maries County
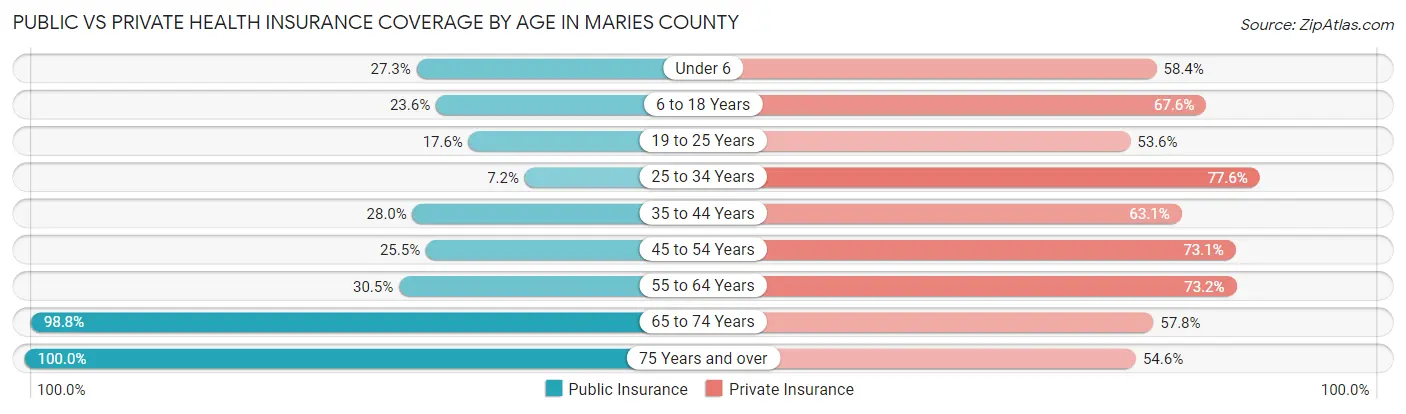
| Age Bracket | Public Insurance | Private Insurance |
| Under 6 | 139 (27.3%) | 298 (58.4%) |
| 6 to 18 Years | 305 (23.6%) | 872 (67.6%) |
| 19 to 25 Years | 126 (17.6%) | 384 (53.6%) |
| 25 to 34 Years | 51 (7.1%) | 553 (77.6%) |
| 35 to 44 Years | 275 (28.0%) | 620 (63.1%) |
| 45 to 54 Years | 267 (25.5%) | 765 (73.1%) |
| 55 to 64 Years | 401 (30.5%) | 963 (73.2%) |
| 65 to 74 Years | 1,010 (98.8%) | 591 (57.8%) |
| 75 Years and over | 791 (100.0%) | 432 (54.6%) |
| Total | 3,365 (40.1%) | 5,478 (65.3%) |
Disability Status by Sex by Age in Maries County
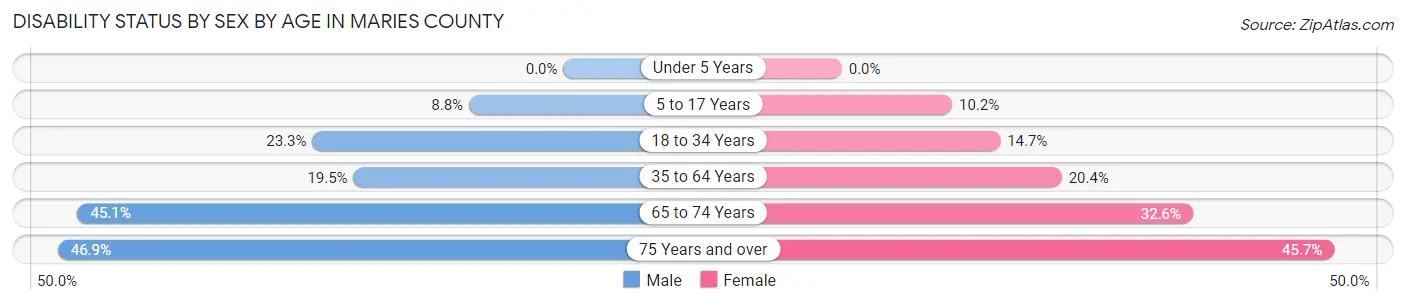
| Age Bracket | Male | Female |
| Under 5 Years | 0 (0.0%) | 0 (0.0%) |
| 5 to 17 Years | 60 (8.8%) | 67 (10.2%) |
| 18 to 34 Years | 189 (23.3%) | 101 (14.7%) |
| 35 to 64 Years | 329 (19.5%) | 338 (20.4%) |
| 65 to 74 Years | 220 (45.1%) | 174 (32.6%) |
| 75 Years and over | 175 (46.9%) | 191 (45.7%) |
Disability Class by Sex by Age in Maries County
Disability Class: Hearing Difficulty
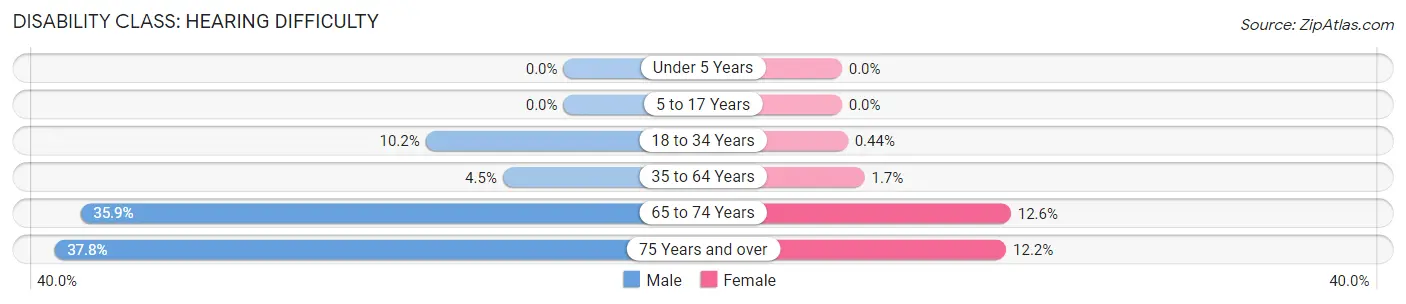
| Age Bracket | Male | Female |
| Under 5 Years | 0 (0.0%) | 0 (0.0%) |
| 5 to 17 Years | 0 (0.0%) | 0 (0.0%) |
| 18 to 34 Years | 83 (10.2%) | 3 (0.4%) |
| 35 to 64 Years | 76 (4.5%) | 28 (1.7%) |
| 65 to 74 Years | 175 (35.9%) | 67 (12.6%) |
| 75 Years and over | 141 (37.8%) | 51 (12.2%) |
Disability Class: Vision Difficulty
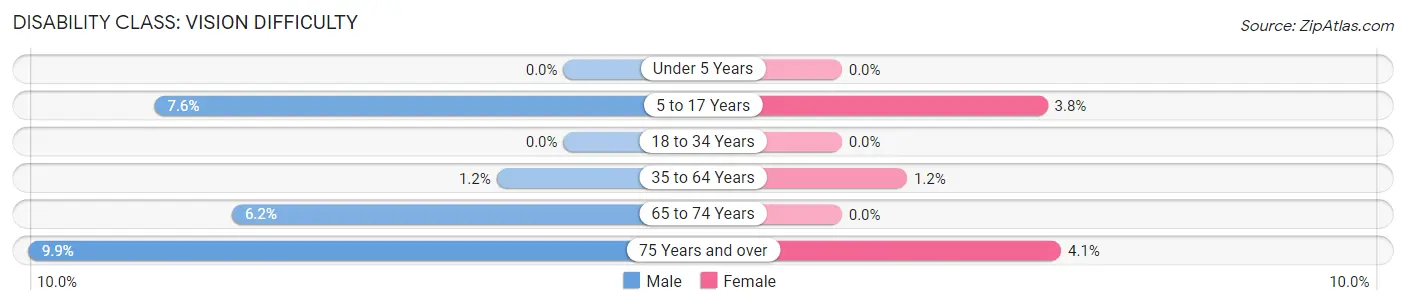
| Age Bracket | Male | Female |
| Under 5 Years | 0 (0.0%) | 0 (0.0%) |
| 5 to 17 Years | 52 (7.6%) | 25 (3.8%) |
| 18 to 34 Years | 0 (0.0%) | 0 (0.0%) |
| 35 to 64 Years | 21 (1.2%) | 20 (1.2%) |
| 65 to 74 Years | 30 (6.1%) | 0 (0.0%) |
| 75 Years and over | 37 (9.9%) | 17 (4.1%) |
Disability Class: Cognitive Difficulty
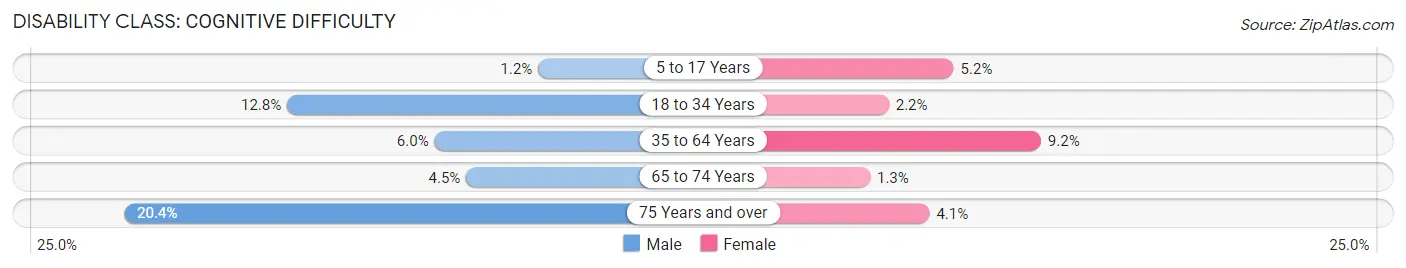
| Age Bracket | Male | Female |
| 5 to 17 Years | 8 (1.2%) | 34 (5.2%) |
| 18 to 34 Years | 104 (12.8%) | 15 (2.2%) |
| 35 to 64 Years | 101 (6.0%) | 153 (9.2%) |
| 65 to 74 Years | 22 (4.5%) | 7 (1.3%) |
| 75 Years and over | 76 (20.4%) | 17 (4.1%) |
Disability Class: Ambulatory Difficulty
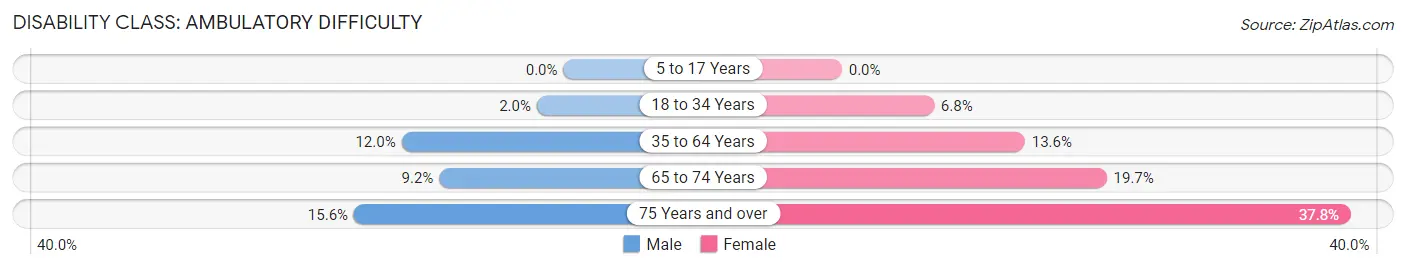
| Age Bracket | Male | Female |
| 5 to 17 Years | 0 (0.0%) | 0 (0.0%) |
| 18 to 34 Years | 16 (2.0%) | 47 (6.8%) |
| 35 to 64 Years | 203 (12.0%) | 225 (13.6%) |
| 65 to 74 Years | 45 (9.2%) | 105 (19.7%) |
| 75 Years and over | 58 (15.5%) | 158 (37.8%) |
Disability Class: Self-Care Difficulty
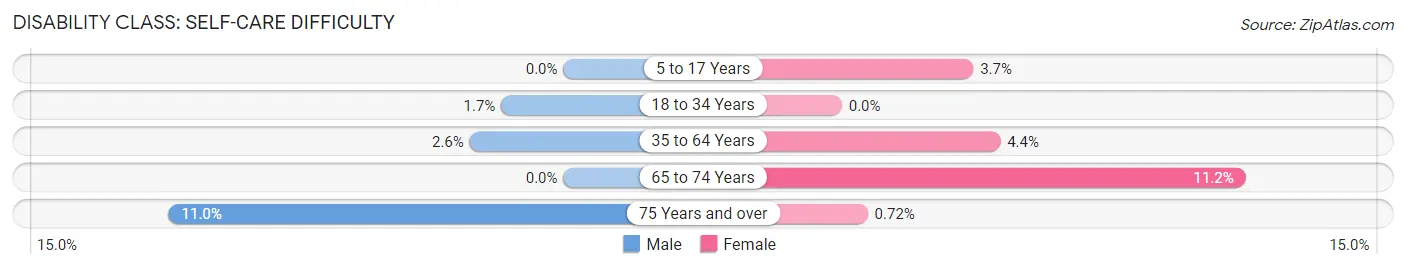
| Age Bracket | Male | Female |
| 5 to 17 Years | 0 (0.0%) | 24 (3.7%) |
| 18 to 34 Years | 14 (1.7%) | 0 (0.0%) |
| 35 to 64 Years | 44 (2.6%) | 73 (4.4%) |
| 65 to 74 Years | 0 (0.0%) | 60 (11.2%) |
| 75 Years and over | 41 (11.0%) | 3 (0.7%) |
Technology Access in Maries County
Computing Device Access in Maries County
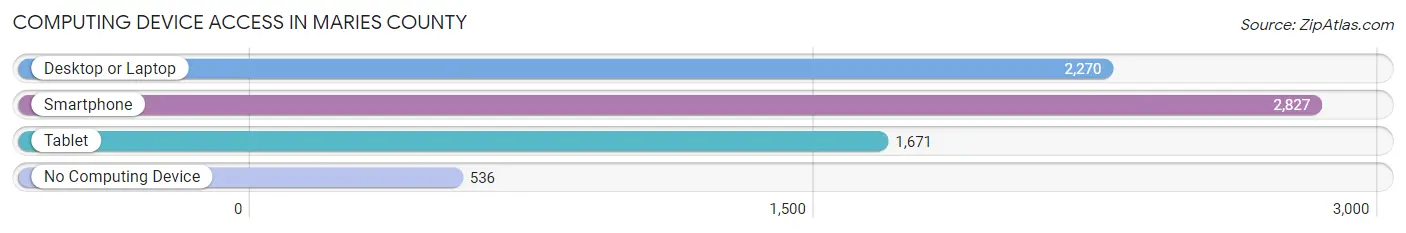
| Device Type | # Households | % Households |
| Desktop or Laptop | 2,270 | 63.0% |
| Smartphone | 2,827 | 78.5% |
| Tablet | 1,671 | 46.4% |
| No Computing Device | 536 | 14.9% |
| Total | 3,602 | 100.0% |
Internet Access in Maries County
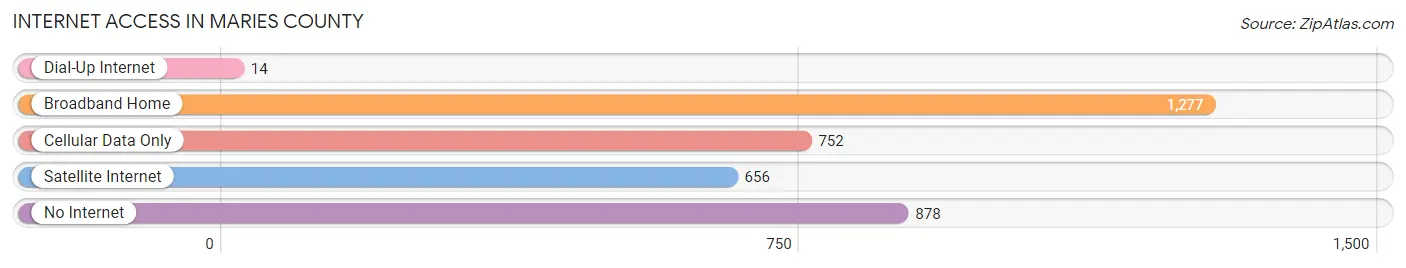
| Internet Type | # Households | % Households |
| Dial-Up Internet | 14 | 0.4% |
| Broadband Home | 1,277 | 35.4% |
| Cellular Data Only | 752 | 20.9% |
| Satellite Internet | 656 | 18.2% |
| No Internet | 878 | 24.4% |
| Total | 3,602 | 100.0% |
Maries County Summary
Maries County is located in the central part of Missouri, in the Ozark region. It is bordered by Osage County to the north, Gasconade County to the east, Phelps County to the south, and Miller County to the west. The county seat is Vienna, and the largest city is Belle. Maries County has a total area of 576 square miles, of which 575 square miles is land and 1 square mile is water.
History
Maries County was established in 1855 and named after the Maries River, which was named after the Maries Indians, a tribe of Native Americans who lived in the area. The first settlers in the county were French-Canadian fur traders who arrived in the early 1800s. The county was largely agricultural until the late 19th century, when coal mining began to take off. The county was also home to several small towns, including Vienna, Belle, and Vichy.
Geography
Maries County is located in the Ozark region of Missouri, and is characterized by rolling hills and valleys. The Maries River runs through the county, and there are several small lakes and ponds scattered throughout the area. The highest point in the county is located in the northern part of the county, near the town of Vienna, and is 1,068 feet above sea level. The climate in Maries County is generally mild, with hot summers and cold winters.
Economy
Maries County has a largely agricultural economy, with corn, soybeans, and hay being the main crops. Livestock production is also important, with cattle, hogs, and poultry being the main animals raised. The county is also home to several small businesses, including manufacturing, retail, and tourism.
Demographics
As of the 2010 census, Maries County had a population of 9,176. The population was spread out, with 48.3% male and 51.7% female. The median age was 41.7 years. The racial makeup of the county was 97.2% White, 0.7% African American, 0.3% Native American, 0.2% Asian, 0.1% Pacific Islander, 0.3% from other races, and 1.2% from two or more races. Hispanic or Latino of any race were 1.2% of the population.
The median income for a household in Maries County was $37,917, and the median income for a family was $45,938. The per capita income for the county was $18,945. About 11.2% of families and 14.2% of the population were below the poverty line, including 19.2% of those under age 18 and 10.2% of those age 65 or over.
Common Questions
What is Per Capita Income in Maries County?
Per Capita income in Maries County is $30,095.
What is the Median Family Income in Maries County?
Median Family Income in Maries County is $74,645.
What is the Median Household income in Maries County?
Median Household Income in Maries County is $56,491.
What is Income or Wage Gap in Maries County?
Income or Wage Gap in Maries County is 0.7%.
Women in Maries County earn 99.3 cents for every dollar earned by a man.
What is Family Income Deficit in Maries County?
Family Income Deficit in Maries County is $11,511.
Families that are below poverty line in Maries County earn $11,511 less on average than the poverty threshold level.
What is Inequality or Gini Index in Maries County?
Inequality or Gini Index in Maries County is 0.45.
What is the Total Population of Maries County?
Total Population of Maries County is 8,454.
What is the Total Male Population of Maries County?
Total Male Population of Maries County is 4,274.
What is the Total Female Population of Maries County?
Total Female Population of Maries County is 4,180.
What is the Ratio of Males per 100 Females in Maries County?
There are 102.25 Males per 100 Females in Maries County.
What is the Ratio of Females per 100 Males in Maries County?
There are 97.80 Females per 100 Males in Maries County.
What is the Median Population Age in Maries County?
Median Population Age in Maries County is 45.2 Years.
What is the Average Family Size in Maries County
Average Family Size in Maries County is 3.0 People.
What is the Average Household Size in Maries County
Average Household Size in Maries County is 2.3 People.
How Large is the Labor Force in Maries County?
There are 3,793 People in the Labor Forcein in Maries County.
What is the Percentage of People in the Labor Force in Maries County?
54.7% of People are in the Labor Force in Maries County.
What is the Unemployment Rate in Maries County?
Unemployment Rate in Maries County is 5.6%.